Article

Territorial Rebalancing from an Axiological Perspective: A Reaction Capacity Index of Sicily’s Inner Areas

Department of Civil Engineering and Architecture, University of Catania, 95124 Catania, Italy
*
Author to whom correspondence should be addressed.
Land 2025, 14(9), 1916; https://doi.org/10.3390/land14091916
Submission received: 4 August 2025 / Revised: 7 September 2025 / Accepted: 12 September 2025 / Published: 19 September 2025

Abstract

The marginalisation of the inner areas due to increased social, material, economic and infrastructural vulnerability is a growing phenomenon affecting many countries today. Although, specific policies, measures, and funding have recently been proposed to address this issue, they have been slow to produce the expected results. Those responsible for decision-makers regarding the prospect of territorial rebalancing need support in identifying the residual value of these marginal areas. This will help them recognise where and how this value can be emphasised in an integrated, long-term redevelopment process. Based on an axiological perspective of territorial capital forms, the research project has developed a “Geo-referenced Value-based Knowledge Model” using Multi-attribute Value Theory (MAVT). It plays a key role in estimating the Reaction Capability Index (IRCI) of Sicily’s “inner areas”. The results demonstrate the reaction capability of the municipalities in these areas. As a measure of the overall endowment of territorial capital, the IRCI index can help decision-makers National Strategy Inner Areas (NSIA), promote the efficient use of resources, and encourage the effective implementation of policies aimed at rebalancing the territory.

1. Introduction

In many countries, unpredictable global dynamics and short-sighted national sectoral policies have, have led to significant territorial imbalances in recent years.
On the one hand, these imbalances have led to the concentration of populations, functions, services, infrastructure, technologies and knowledge in urbanised and/or coastal areas [1,2,3,4,5,6]. On the other hand, they have led to the shrinking and marginalisation of urban peripheries, small towns, villages and rural and inland areas, exacerbating the conditions in places characterised by geographical remoteness [7,8,9,10,11,12,13,14].
The complexity and overlap of the phenomena that triggered processes of territorial degeneration encompasses the entire spectrum of territorial and urban values [15].
The 2018 UN World Urbanisation Prospects report revealed that rural depopulation had worsened significantly.
It is estimated that, by 2050, around two-thirds of the global population will live in large cities, primarily in nations like India, China, and Nigeria. People’s choice of location is influenced by greater access to services, education and employment opportunities.
Around 50% of the world’s population lives in cities with fewer than 500,000 inhabitants. Meanwhile, one in eight people live in one of the 33 cities with a population over 10 million.
In Europe, the phenomenon of shrinking regions can be categorised into four types. The first type comprises industrial areas in economic decline, primarily located in Western Europe.
The second type comprises depopulated peripheral areas, which are common in Northern Europe.
The third type comprises areas that have undergone or are currently undergoing political transformations, such as Eastern Europe.
The fourth type comprises structurally weak rural areas in Southern Europe, that are characterised by a sharp decline in fertility rates [16].
In Europe, demographic decline is associated with internal migration. Since the 1960s, the population has become increasingly concentrated in major urban cities, while rural and inner areas have experienced population loss [17,18,19].
Another phenomenon affecting many European cities is “shrinking cities”. These are cities that have experienced, or are currently experiencing, a reduction in population size [20,21].
Given demographic population decline, the old-age index and the birth rate, as well as cancellations from the civil registry, it is evident that the abandonment phenomenon in Europe is serious, and observable at both the territorial and urban levels [20,21].

1.1. Towards a Taxonomy of Territorial Imbalances

The issues of territorial inequalities and the contrast between centres and peripheries are examined in terms of dependency relationships and the conditions of exclusion, as well as the economic, social, spatial and political implications [8,22,23,24].
This relationship of dependency, which is based on an imbalance of economic, political and social power, was originally explained using Friedman’s centre-periphery model [25].
This model identifies the central area as the most urbanised area, characterised by the highest population density and concentration of economic activity.
As opposed, the periphery is characterised by a diverse population and underdeveloped economy.
From this perspective, metropolitan cities are characterised by innovation, infrastructure, services and decision-making functions, a young, active population.
Overall, they have high socio-economic and political-administrative values, which making them highly competitive and attractive. As opposed, areas in decline are characterised by a lack of innovation and infrastructure, low service levels, a lack of decision-making functions, an ageing and shrinking population, abandoned and dilapidated buildings, and a lack of job opportunities.
Overall, the values in these areas are low or negative, which reduces or eliminates their ability to compete.
The latter are unattractive areas because they offer services and opportunities that do not align with the communities’ preferences [26,27,28,29,30,31,32]. In such cases, citizens dissatisfied with a local jurisdiction’s policies can demonstrate their disagreement by moving elsewhere. This decision is made according to Tiebout’s “foot voting” rule [26].
The Spatial Cycle Model (SCM) was proposed by Hall in 1971 [33], subsequently by Klaassen and Paelinck in 1979 [34], Klaassen and Scimemi in 1981 [35], Klaassen et al. in 1981 [36], van den Berg et al. in 1988 [37], Cheshire et al. in 1989 [38], Aydalot in 1985 [39] and van den Berg et al. in 1987 [40], as well as by Kawashima in 1987 [41]. It represents a generalisation of demographic changes in urban and regional systems.
From the perspective of the SCM, demographic change refers to two main sections of the analysed area: the core and the ring.
The core represents the area characterised by a concentration of economic and social functions. The ring represents the territory surrounding the core in all directions. These two sections of the area are closely related to each other in terms of interactions such as trade, commuting, migration and capital movements.
The Spatial Cycle Model (SCM) plays a key role in describing long-term spatial demographic change. The demographic changes occurring in the core and ring define a series of spatial change phases. It is believed that these phases exist in an orderly sequence, forming a cycle.
According to the Spatial Cycle Model (SCM) proposed by Klaassen and Paelinck (1979) [34], four main phases can be identified: I. centralisation and growth; II. decentralisation and growth; III. decentralisation and decline; and IV. centralisation and decline. Each of these phases is divided into two sub-phases, each of which is considered a stage in the cycle. While it is generally accepted that the cycle begins with Phase I, some authors have suggested that it may start with other phases.
In 2015, Kunh [42] emphasised the importance of combining the original meaning of the term “periphery”, which is linked to the economic and social disadvantages experienced by areas located far from Europe’s main centres of economic activity (spatial peripherality), with the concept of socio-economic “marginality” (non-spatial marginality).
In 2017, Copus et al. [43] identified three main types of periphery.
The first type is characterised by low economic potential, and it is located between areas with higher economic potential.
The second type is characterised by poor access to general interest services, which can be attributed to geographical distance, changes in service delivery technologies, austerity-related funding cuts, or other changes in supply, primarily resulting from privatisation.
The third type is characterised by poor socio-economic performance due to the absence any kind of “organised proximity”.
These areas are characterised by a lack of socio-economic and political connections (“connectivity”), which are not necessarily location-specific and are therefore non-spatial.
They also tend to have inadequate governance structures in terms of political influence, which puts them at a disadvantage when competition for public spending resources.
Theoretical approaches to interpreting phenomena of marginalisation are increasingly considering socio-economic performance and political dynamics rather than just location and spatial dimensions, such as distance and access to key services and opportunities [44].
According to these approaches, places that are not geographically remote can still be considered peripheral due to a lack of connectivity and weak interactions [21,43,45], as well as limited influence in governance [46]. This highlights the complexity of territorial disadvantage.
From this perspective, the concept of peripherality is dynamic and characterised by socio-economic factors. This suggests that the phenomenon of marginality may be considered transitory [21,43].
New information and communication technologies are gradually changing the environment in which people, businesses and organisations interact.
Traditionally, “Geographical”, or “Euclidean”, space defined the context for the flow of goods and services that required direct contact.
In this new context, proximity (i.e., physical distance), travel times and travel costs, which characterise the geographical or “Euclidean” spaces in which flows of goods and services requiring direct contact are identified, are no longer the key constraints on interaction.
Information flowing through non-spatial networks can give rise to other forms of organised proximity (social, legal and institutional). These forms of proximity are now more important for identifying new forms of interaction [47].

1.2. Territorial Rebalancing Policies and Funding

Since the 1980s, growing inequalities and disparities between and within regions have led to the implementation of cohesion policies aimed at achieving more equitable and balanced development [48].
The concept of cohesion in European policies addresses the issues of reducing territorial inequalities and promoting more balanced development.
The concept of cohesion was first defined in the Single European Act (1987) [49], in relation to economic and social factors. It was subsequently defined in Article 174 of the Treaty of Lisbon (2007) [50], this time in relation to territorial factors.
The 1989 reform of the EU Structural Funds was a significant step towards strengthening European Cohesion Policy.
It aims was to promote economic and social development in less EU regions by increasing funding and introducing new allocation principles.
This reform shifted the focus of the funds from simply transferring money to addressing structural issues in member states’ regions [51].
The Green Paper on Territorial Cohesion: Turning Territorial Diversity into Strength’ emphasises the need to increase cooperation and partnerships across regional and national borders in order to address governance issues [52,53].
The Treaty on the Functioning of the European Union (2012) emphasises the importance of the Union taking action to strengthen its economic, social and territorial cohesion issues [54].
The year 1988 marked the beginning of the Cohesion Policy. This policy has gained considerable momentum as a result the impetus of Agenda 2030 [55].
Cohesion policy is aimed at the regions and cities of the European Union (EU) and seeks to promote business competitiveness, job creation, economic growth, sustainable development, and an improved quality of life for citizens.
Cohesion policy covers every region in the EU. However, most of the funding is targeted at regions with a GDP per capita of less than 75% of the EU average.
Today, almost a third of the EU’s total budget is allocated to this policy. However, it is a relatively recent policy, having been established in the second half of the 1980s. Since then, its objectives and resources have periodically changed [56,57].
Increasing resources have been allocated to support the objectives of cohesion policies in the various programming cycles. Various funding sources have been identified to support these objectives, and these sources have been integrated and modified throughout the programming cycles.
During the 2014–2020 programming cycle, for instance, grants were provided by the European Regional Development Fund (ERDF), the Cohesion Fund (CF), the European Social Fund (ESF) and the Youth Employment Initiative (YEI).
During the 2021–2027 programming cycle, some funds have been extended and others integrated. This includes the “Investment for Jobs and Growth Goal” (IJG), the “European Regional Development Fund” (ERDF), the “European Social Fund Plus” (ESF+), the “Cohesion Fund” (CF), the “Just Transition Fund” (JTF) and “Interreg: the European Territorial Cooperation Goal”. Almost a third of the total EU budget has been set aside for cohesion policy in the latest programming period (2021–2027) to achieve objectives such as job creation, improving business competitiveness and economic growth, promoting sustainable development, and enhancing citizens’ quality of life, with a view to addressing disparities between regions.
Reducing the gross domestic product (GDP) gap is one of the cornerstones of cohesion policy. The EU’s policy agenda addresses territorial inequality by promoting partnerships between national, regional and local authorities, businesses, and civil society organisations.
In Italy, cohesion policies are implemented and supported by Decree-Law No. 77 of 31 May 2021 [58], Law No. 101 of 1 July 2021 [59], the Decree of 6 August 2021 [60], and Decree-Law No. 13 of 24 February 2023 [61]. Of these, Mission 5—Component 3 of the National Recovery and Resilience Plan (NPRR) is particularly relevant, as it focuses on special measures for territorial cohesion.
The European Commission has proposed various initiatives to revitalise marginal areas, including the “Europe 2020” package—the European Union’s growth and employment strategy [62]—which promotes “smart, sustainable and inclusive growth”. Another initiative is the “Rural Vision” [63], which aims to creates new momentum for rural areas—home to 30% of the EU population —by building on the EU’s green and digital transitions, and the lessons learned from the pandemic.
The European Agricultural Fund for Rural Development (EAFRD) is also involved to a certain extent.
Other funds have been identified in Italy to support marginalised areas, including the Italian Marginal Common Fund [64], the Countering Deindustrialisation Fund [65], the Marginal Municipalities Fund [66] and the Inner Areas Municipalities [67].
In Italy, the National Strategy for Internal Areas (NSIA) has been promoted by the Agency for Territorial Cohesion since 2013.
It provides support for fragile territories affected by structural processes of depopulation and abandonment. These territories encompass 1077 Italian municipalities and a population of just over 2 million inhabitants [68].
The Italian National Recovery and Resilience Plan (NPRR), funded by the European Union’s Next Generation EU initiative, provides of €100–400 million in funding from the Development and Cohesion Fund (FSC) for the implementation of Mission No. 5, “Inclusion and Cohesion”. This funding is intended not only for “special measures for territorial cohesion”, as mentioned above, as well as for the “National Strategy for Internal Areas” and the “Enhancement of Community Social Services and Infrastructure” [69].
Some studies, such as those by Dall’Erba and Le Gallo (2008) [70] and Becker et al. (2012) [71], have highlighted inconsistencies in the positive association between funding provided by cohesion policies and economic prosperity, or the promotion of the revitalisation of disadvantaged areas.
In 2016, Fratesi (2016) [72] identified both empirical and conceptual issues when interpreting the relationship between funding and development. Whether or not policy objectives have been achieved remains an open question in the literature.
In 2020, Fratesi and Perucca emphasised that the implementation and effectiveness of EU policies can vary significantly depending on the specific territorial resources available to EU regions [73].
From this perspective, the territory—and more specifically the regional capital—is not neutral in the mechanism through which implementation of policies generates development. In fact, specific characteristics of the regions mediate the impact of cohesion policy, so these characteristics must be considered when evaluating the policy.
In 2020, Fratesi and Perucca [73] identified three key issues relating to territorial capital: the allocation of cohesion policy funds; the effectiveness of cohesion policy; and regional development.
Firstly, they emphasised the importance of studying the relationship between regional characteristics and allocation funding to different policy needs. This enables us to understand and improve allocation mechanisms.
Secondly, they show that the impact of EU regional policy on regional development depends on the amount of territorial capital available in a specific region.
Thirdly, in addition to considering the direct link between territorial capital and cohesion policy, it is important to understand the role of territory in regional development—that is to say, the broader contexts in which policies are implemented.

1.3. Cognitive Model of Marginal Territories. NSIA Classification

European and Italian cohesion policies form the basis for actions aimed at territorial rebalancing in inner areas.
The implementation of these policies and their outcomes are closely linked to the definition of the action domain. This domain is represented by the territory and, more specifically, its components.
When developing and implementing these policies, it is important to consider the cognitive model of the territory, particularly with regard to the endogenous factors referred to in the literature.
In Italy, the knowledge model that supports the development of policies aimed at territorial rebalancing is the National Strategy for Internal Areas (NSIA) classification, as proposed by the Interministerial Committee for Economic Planning and Sustainable Development (ICEPSD).
The National Strategy for Internal Areas categorises classifies Italian municipalities based on according to their level of remoteness with regard to in terms access to essential services such as health, education, and transport mobility [68].
It classifies municipalities based on their distance from the “pole” municipality, using a primarily a spatial concept of remoteness and, to a certain extent, a non-spatial socio-economic one. Further information can be found in the “Materials” section (Section 3).
The knowledge model used for classifying inner areas according to the NSIA is based on an information structure designed to categorise municipalities according to their spatial remoteness.
The knowledge base informs the identification of municipalities that should be grouped together to form NSIA areas, the definition of territorial rebalancing strategies for these areas, and how funding is allocated to them.
Implementing cohesion policies aimed at territorial rebalancing can be considered a decision-making problem involving the classification, aggregation and financing of municipalities.
In order to implement cohesion policies effectively and efficiently, the decision-making problem must be developed correctly within the context of the action to be undertaken.

1.4. Axiological Domains: Towards a New Cognitive Model of Marginal Territories

The knowledge model underlying the NSIA classification has become the official tool for tackling the marginalisation and abandonment of territories. Italy was the first European country to conduct a survey on the state of territorial marginalisation based on a unified knowledge framework.
The cognitive model proposed by the NSIA Classification is limited in its basis, relying on the criterion of peripherality in terms of access to essential services such as health, education and mobility. The model’s representation of the territory is therefore partial and does not fully address the issues highlighted in the above subparagraph on the taxonomy of territorial imbalances.
It does not provide a comprehensive representation of exogenous factors, which are key to the development and implementation of policies aimed at rebalancing and revitalising territories.
The partial integration of the representation of exogenous factors, and particularly the absence of a metric to measure their level, weakens this cognitive model. As highlighted by Trovato and Nasca (2022) [74], the cognitive model proposed by the NSIA Classification is not capable of fully capturing the values and value potential of these areas.
Furthermore, it fails to highlight the issue of socio-economic marginalisation.
The latter is mainly due to weak or absent “organised proximity”, i.e., weak socio-economic and political connections that are not necessarily linked to geographical location, but rather to governance structures that lack political influence.
To promote the effective and efficient implementation of policies aimed at rebalancing and revitalising the territory, it is necessary to identify a new cognitive model that can integrate exogenous factors and measure their level. This model must also provide a broader understanding of marginality than the spatial type.
In this regard, the study puts forward a cognitive model based on the concept of territorial capital [75]. The concept of territorial capital is used as a reference point for characterising exogenous factors.
The cognitive model is developed from an axiological perspective of territorial capital [76].
This is important for defining a metric that measures the level of exogenous factors.
This model supports the development of a metric that aims to measure the level or value of the endowment of the various territorial capital forms, as well as the overall endowment, based on the estimation of indices [77,78].
The proposed model, the “Geo-referenced Value-based Knowledge Model”, is a hierarchical structure of indices.
This structure has two levels: the first measures the endowment of different forms of territorial capital and the second provides an overall measure of this endowment using the Reaction Capability Index ( I R C I ).
The aim is to determine the total amount of territorial capital available to municipalities in each region or area.
The Reaction Capability Index ( I R C I ) can be used to explore the relationship between territorial capital in weak areas and the effects of cohesion policies [79,80].
The cognitive model and the set of index-based metrics together define the domain of cohesion policies.
The indices are developed based on the Multi-Attribute Theory of Value (MAVT) [81,82].
In the field of literature, MAVT is employed to support the development of policies, as well as the planning and management of related actions [83,84,85,86,87,88,89,90].
In literature, MAVT is also used to support the development of aggregate indicators [91,92,93,94,95]
The I R C I can be used to classify municipalities in inner areas based on their territorial capital endowment [75].
It can also be used to identify groups of municipalities that will constitute the NSIA areas and to measure the effectiveness of cohesion policies aimed at promoting territorial rebalancing.
The study proposes the estimation of territorial capital forms indices, including I R C I , for municipalities in the Sicilian region.
The objective is to establish the total amount of territorial capital within the region’s inner areas.
The I R C I index map, developed using QGIS, can help decision-makers identify the most suitable strategies for rebalancing and revitalising the territories [96,97].
The index is developed from an axiological perspective of the territory, i.e., it is based on the values and/or disadvantages of these areas [76,98].
This approach promotes a reinterpretation of the value [74,76,99,100] of the areas’ territorial capital, based on cohesion policies and related funding, and encourages its enhancement in line with the areas’ specific characteristics.

1.5. Structure of the Paper

The paper is organised into the following sections:
  • Section 2 introduces the concept of territorial capital;
  • Section 3 introduces the NSIA classification and Sicilian NSIA;
  • Section 4 illustrates the methodological approach;
  • Section 5 reports and discusses the results;
  • Section 6 offers reflections on the cognitive model and the application of the IRCI as an operational tool for supporting territorial rebalancing policies. It also identifies the limitations of the research and its potential future developments.
  • Section 7 summarises the key findings of the study.

2. The Concept of Territorial Capital

In 2013, Camagni and Capello emphasised the emergence of a “selective model of regional growth”, whereby the growth of individual regions is differentiated, resulting in a varied mosaic of development stories [101].
In this context, in order to develop growth strategies for regions, territories and cities, it is necessary to understand the various regional resources,—or “territorial capital”—and ensure they are exploited efficiently. The concept of territorial capital was first introduced by the OECD in the context of regional policy [102].
This concept defines “territorial capital” as the stock of resources on which the endogenous development of each city or region is based [75,102].
For the first time, a more holistic and comprehensive analysis of a given location is proposed that take into account its wide range of material and immaterial resources.
Although many researchers have investigated the impact of individual components territorial capital on performance [103,104,105], few have explored how these resources contribute collectively to endogenous development.
In 2008, Camagni [75] provided the first taxonomy of territorial capital, categorising its components according to their level of rivalry and materiality (Figure 1).
The rivalry dimension was categorised as either public goods or private goods, or as an intermediate class of either club and impure public goods.
Meanwhile, the materiality dimension was categorised as tangible goods, intangible goods, or as an intermediate class of mixed goods (hard-soft).
Two criteria are used to classify these components: their degree of materiality (ranging from tangible to intangible) and their degree of rivalry (ranging from private to public).
The four extreme categories, characterised by either high or low levels of rivalry and either material or immaterial assets, represent the traditional sources of territorial capital.
The five intermediate classes highlight the most interesting and innovative elements, which Camagni has defined as the “innovative cross” upon which to focus attention. Along the materiality axis, these categories identify encompass mixed goods characterised by a combination of hard and soft elements, as well as material goods and services.
This provides evidence that the capacity to transform virtual and immaterial elements into effective actions, public/private partnerships and service provision.
It also demonstrates the capacity to transform geographical and cognitive proximity into effective links between economic agents.
In this regard, a more in-depth analysis of the concept of territorial capital is fundamental to understanding how contexts can trigger and guide endogenous sustainable economic development [106].
However, since that not all regions have the necessary prerequisites for this type of approach, and given that favourable conditions are constantly being challenged by globalisation, market changes and technologies [107,108], it is necessary to stimulate endogenous factors exogenously.
This study will analyse the external factors that could contribute to the redevelopment of inner areas. More specifically, these factors will be identified in relation to the categories of elements that traditionally define territorial capital [75], i.e., the components highlighted at the vertices of the rivalry-materiality model square.

3. Materials

The National Strategy for Internal Areas classifies Italian municipalities according to their spatial proximity to a “pole municipality”, which is characterised by the better provision of essential services such as health, education and transport [68].
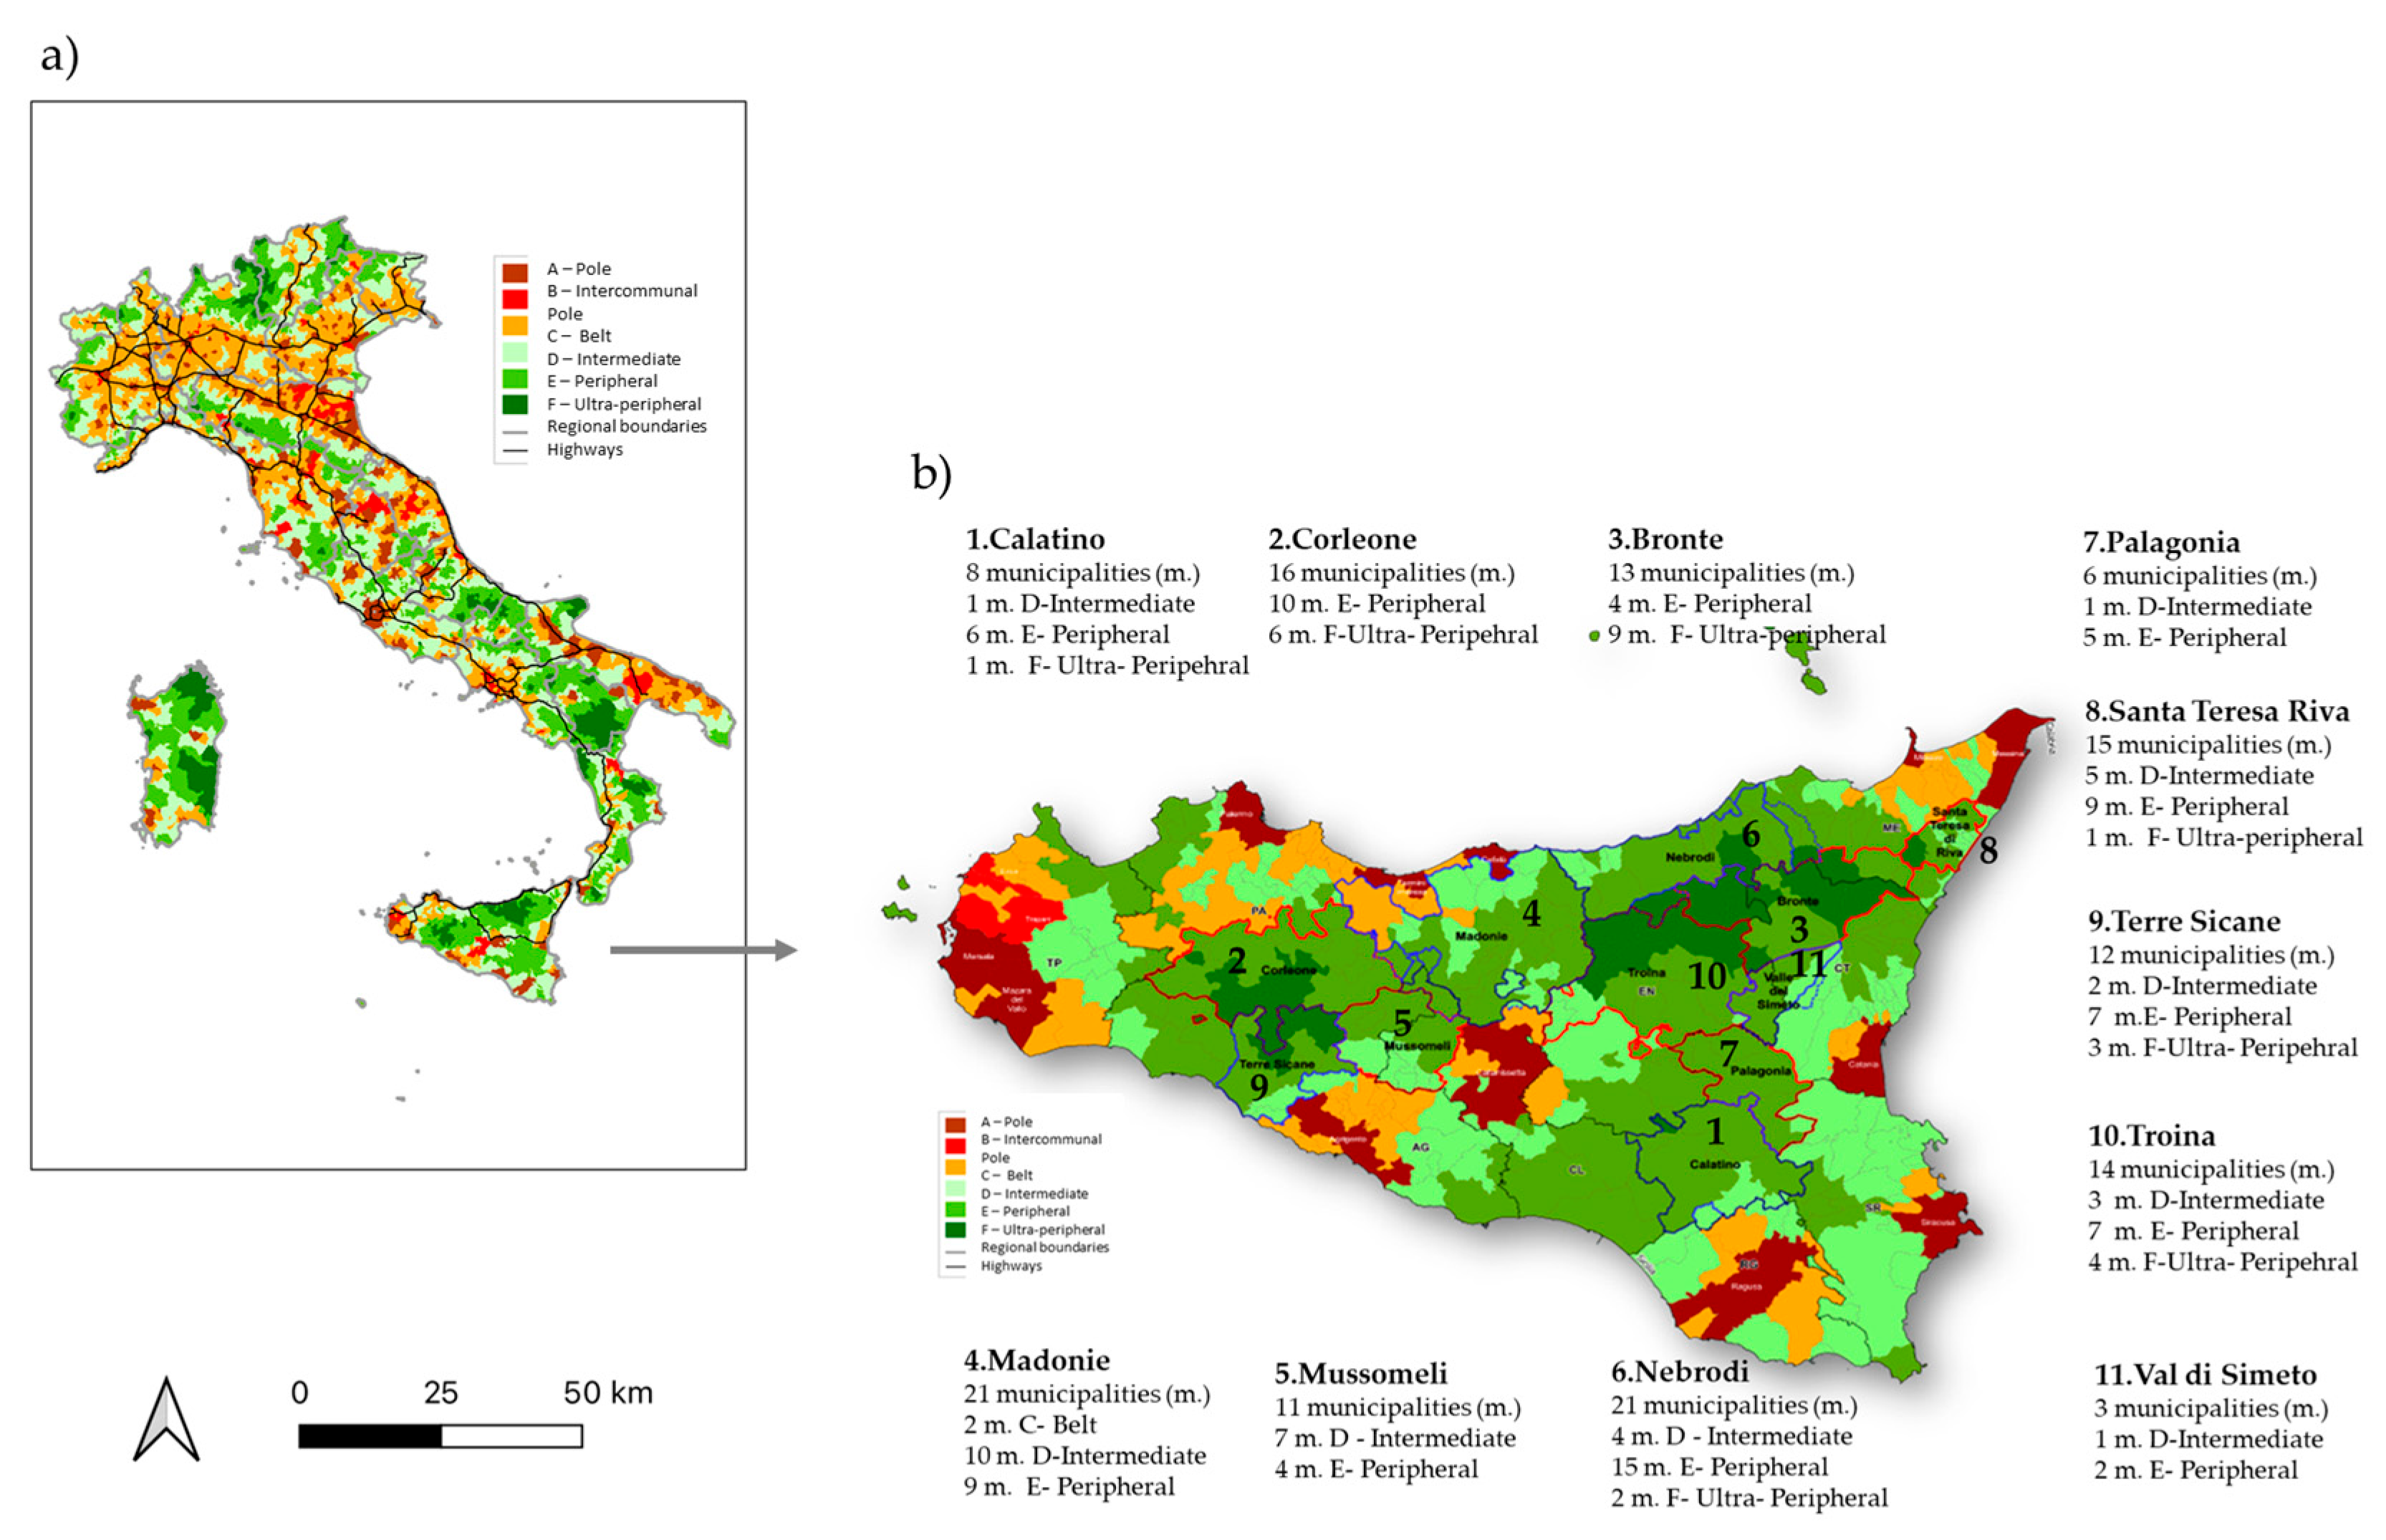
Municipalities are classified as “belt”, “intermediate”, “peripheral” or “ultra-peripheral” based on their distance from the “pole” municipality (Figure 2).
A municipality’s degree of peripherality is determined by its distance from the “pole” municipality.
Table 1 shows the 72 NSIA areas that have been identified in Italy in relation to the 2014–2020 NSIA programming cycle. These areas cover 1060 municipalities.
Some areas have been modified and others added to the 2021–2027 NSIA programming cycle. The latest programming cycle involves 1904 municipalities (Table 1).
In the 2021–2027 programming cycle, NSIA areas were selected based on six main criteria [109]:
  • Consistency of the new area to be nominated with the Map of Internal Areas proposed for the 2021–2027 programming cycle.
  • The existence of a defined and recognisable identity and geomorphological system.
  • The area is experiencing demographic difficulties.
  • Essential services need to be reorganized.
  • The willingness and ability of local authorities to collaborate in order to achieve a shared objective.
  • Size of the area.
In Sicily, eleven NSIA areas have been identified, namely (Figure 3): the Calatino area, includes eight municipalities; the Corleone area, includes sixteen municipalities; the Bronte area, which includes thirteen municipalities; the Madonie area, which includes twenty-one municipalities; the Mussomeli area includes eleven municipalities; the Nebrodi area, which includes twenty-one municipalities; the Palagonia area, which includes six municipalities; the Santa Teresa Riva area includes fifteen municipalities; the Terre Sicane area includes twelve municipalities; the Troina area includes fourteenth municipalities; and the Val di Simeto area includes twenty-one municipalities.
Table A1 in Appendix A shows the characteristics of the eleven Sicilian NSIA areas based on the programming cycle, municipalities, total surface area and total population.

4. Methods

According to cohesion policies aimed at territorial rebalancing [110] to be identified and implemented effectively and efficiently, it is crucial to define their scope in relation to endogenous factors, as discussed in literature. These endogenous factors can be identified using the concept of territorial capital and the rivalry-excludability model proposed by Camagni in 2008 [75].
Adopting a cognitive model of exogenous factors and developing a metric from an axiological perspective could improve the implementation of cohesion policies.
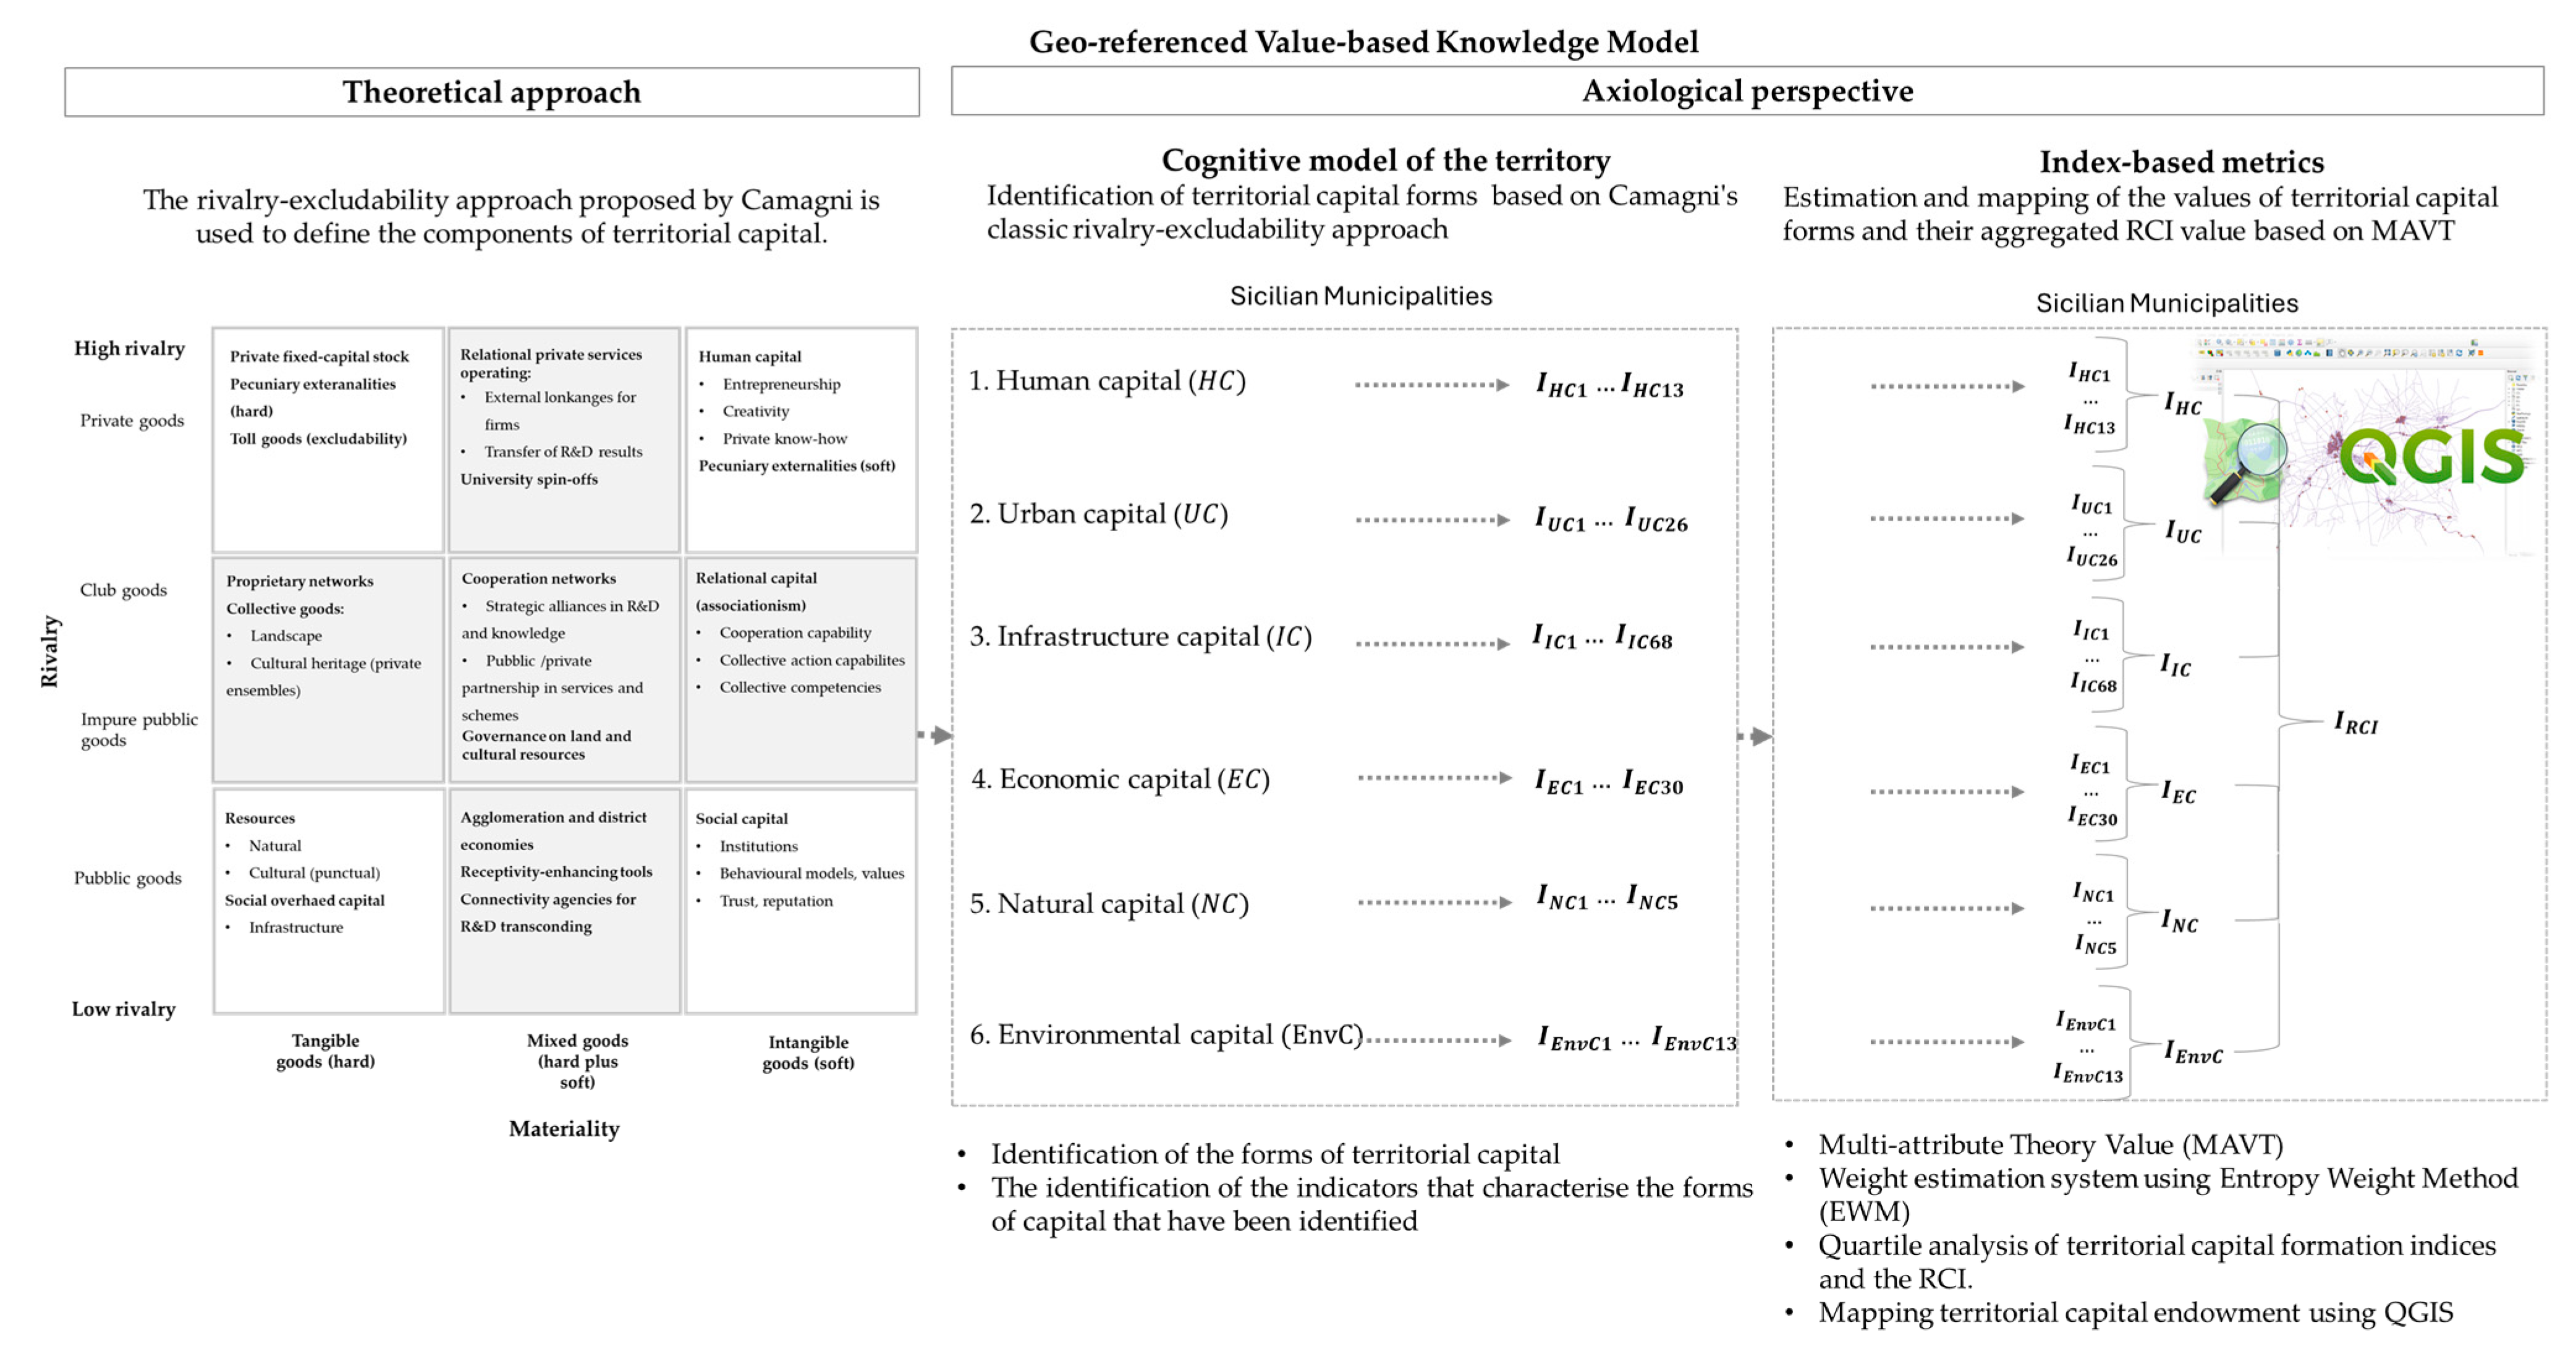
This study proposes a cognitive model that involves identifying and measuring the level of territorial capital components by constructing a system of aggregate indices that measure various forms of territorial capital and its overall endowment (Figure 4).
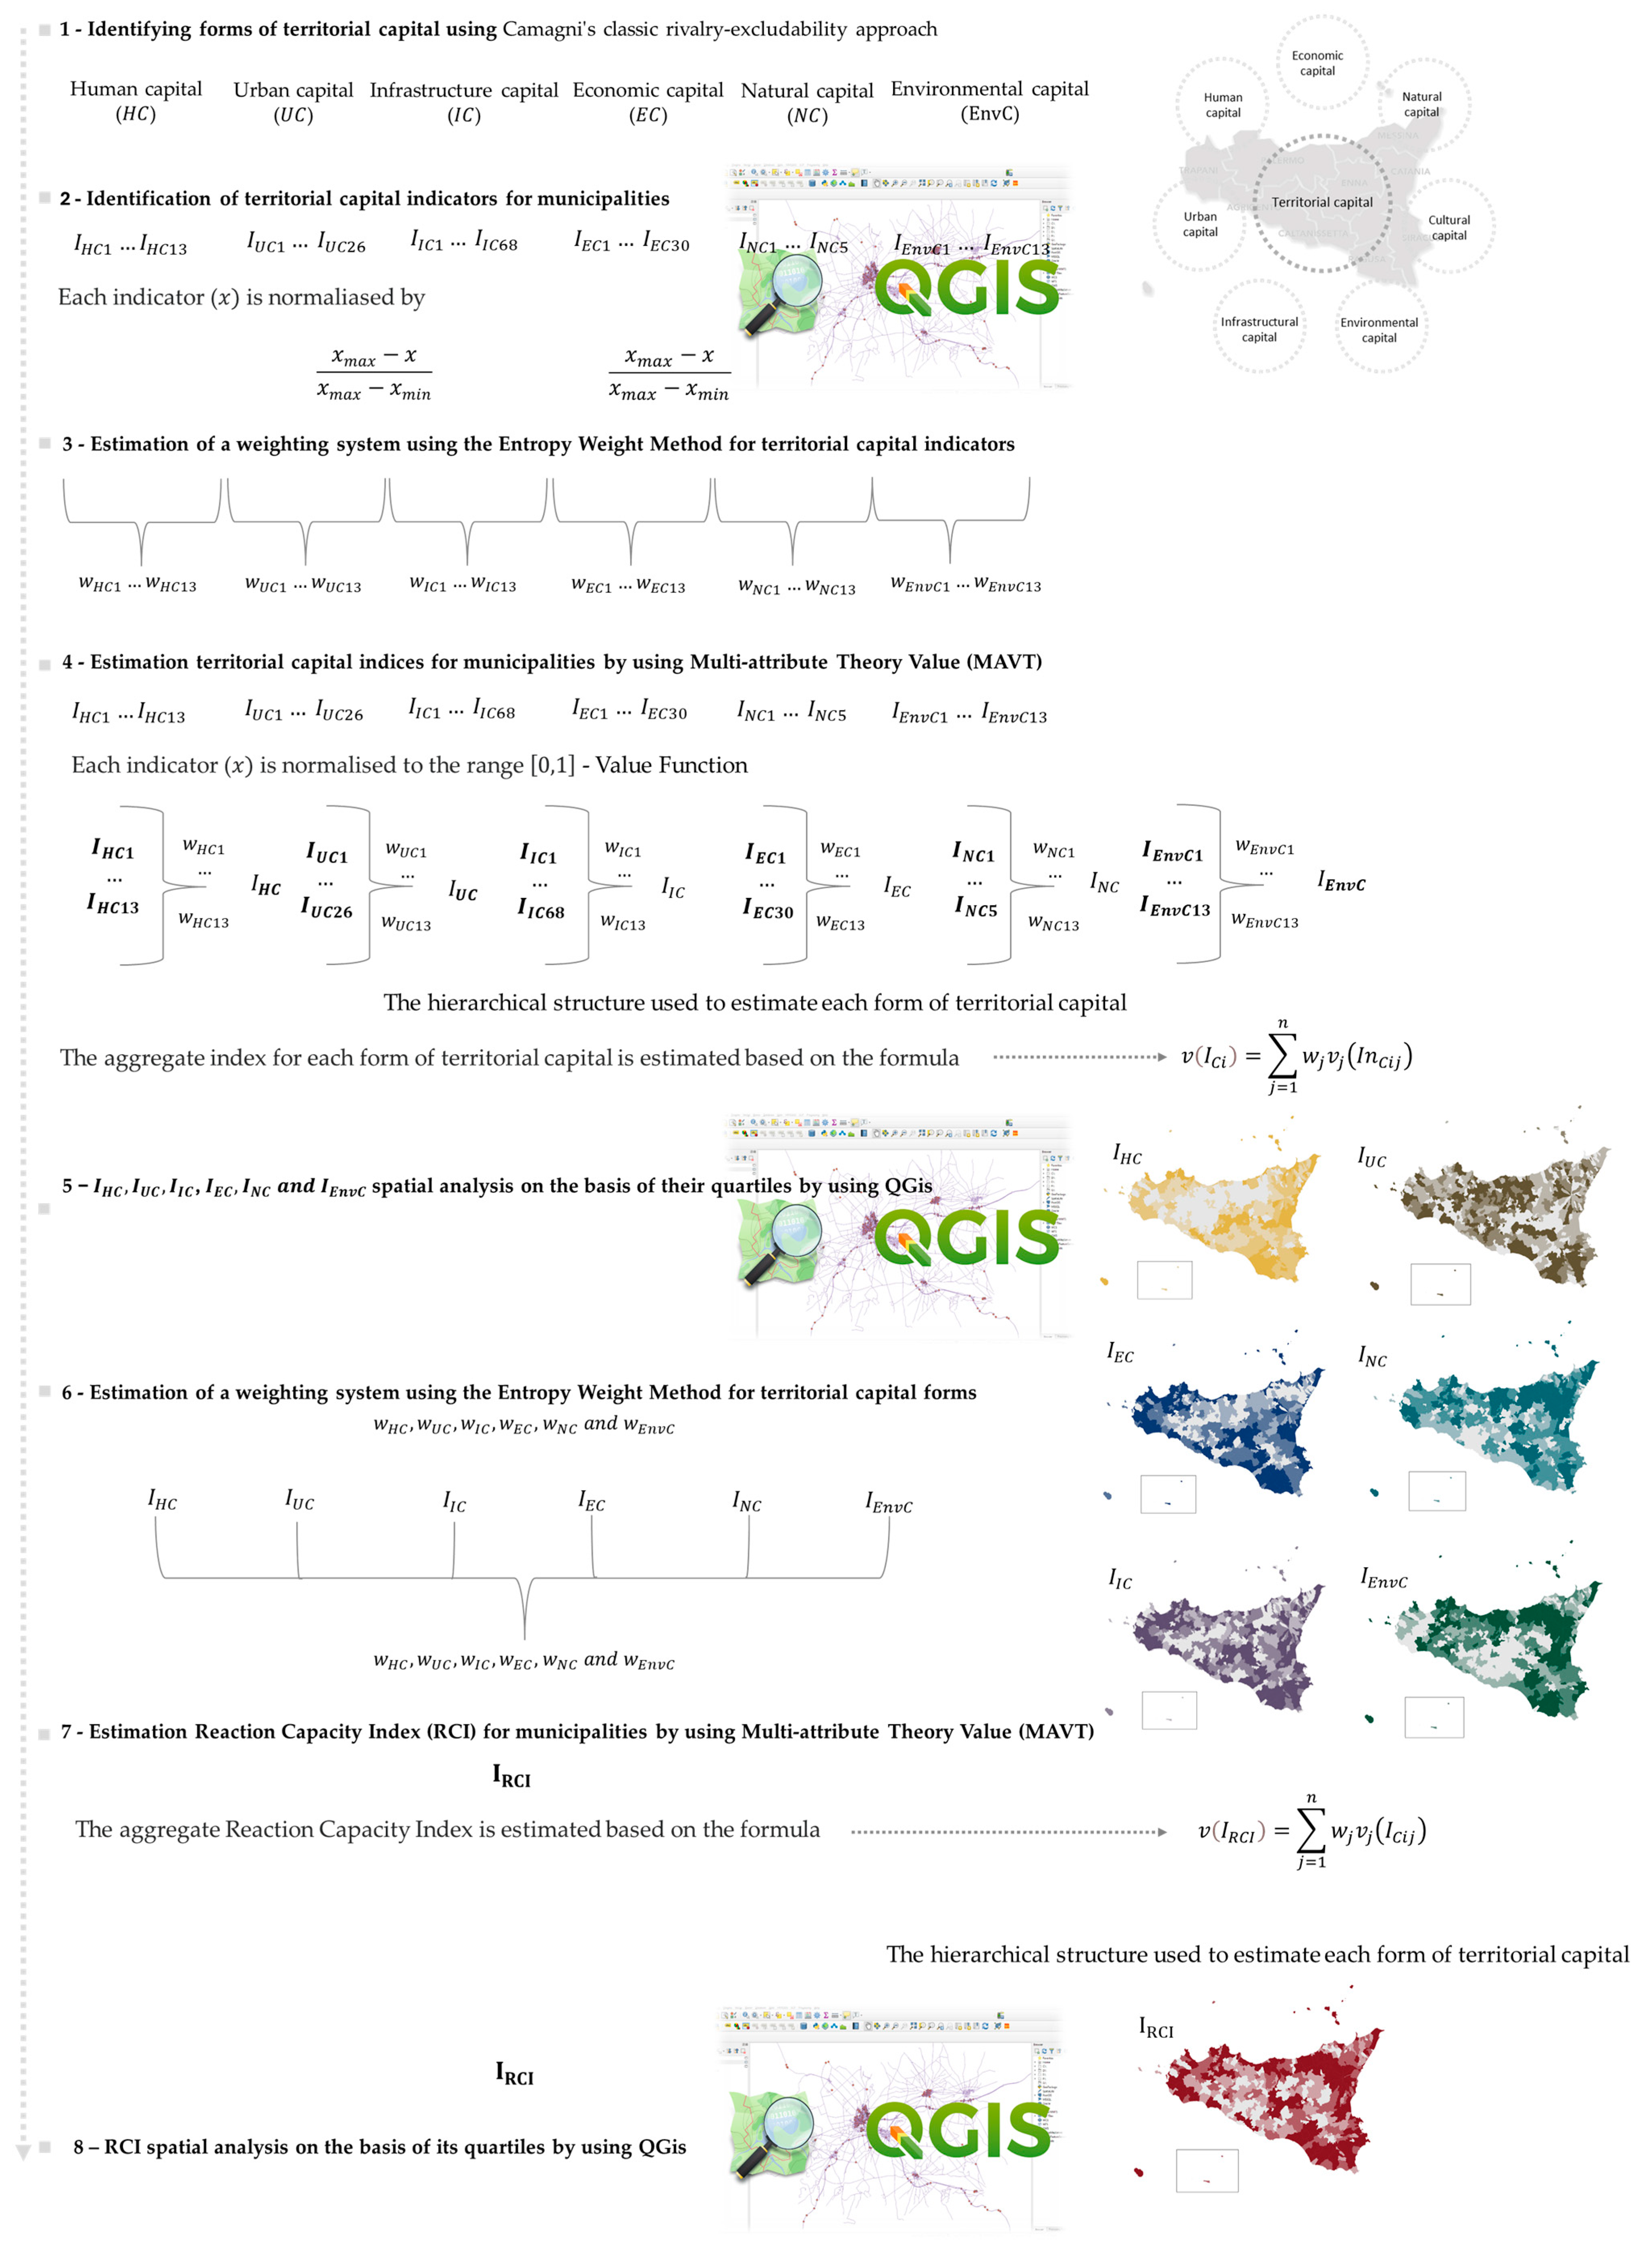
The structure of the methodological approach is characterised by the following phases (Figure 5).
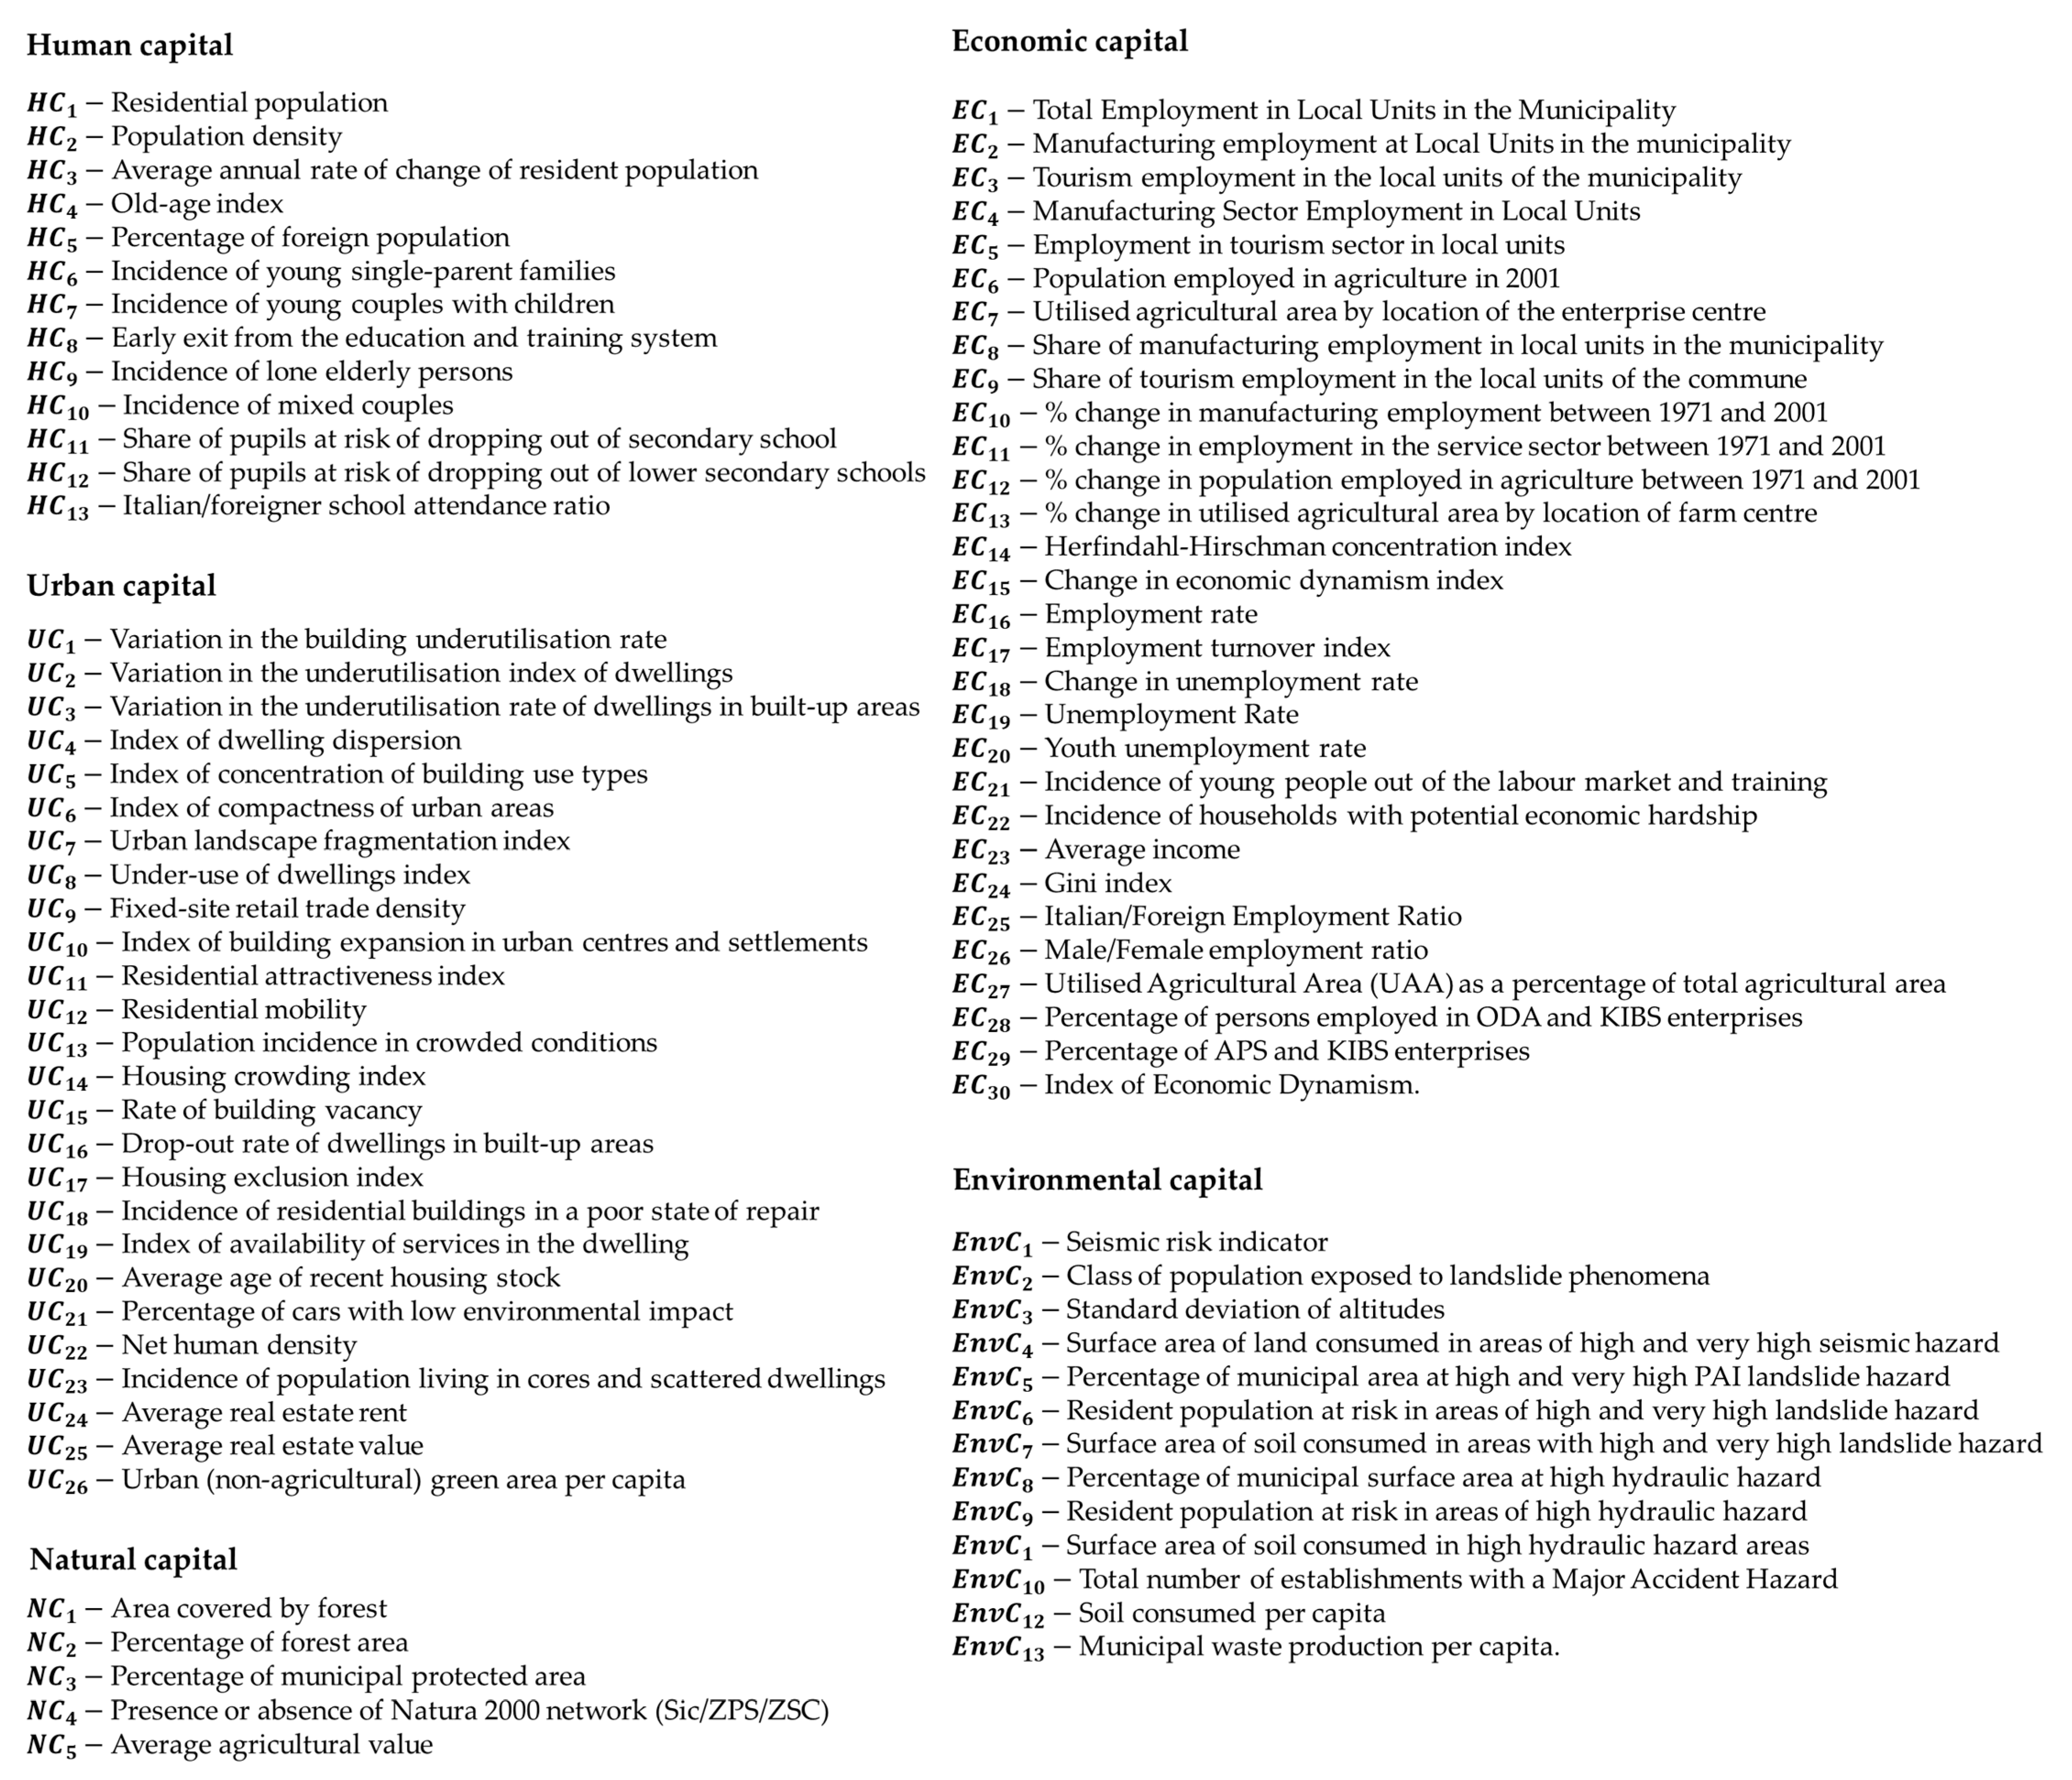
The cognitive model covers six forms of territorial capital: human, urban, infrastructure, economic, natural and environmental. These six forms of territorial capital are characterised using indicators for various Sicilian municipalities. Thirteen indicators were identified for human capital, twenty-six for urban capital, five for natural capital, thirty for economic capital, and sixty-seven for infrastructure capital.
These indicators were selected with reference to the datasets of the Agency for Territorial Cohesion [68] and that of the Council of Ministers [111].
These two datasets provide a fairly comprehensive official collection of data on territorial capital indicators. However, the data are not homogeneous, as they refer to different years of collection (2011, 2012, 2013, 2014 and 2015), and are not up to date.
Figure 6 and Figure 7 shows the 127 indicators that were identified to characterise the six forms of territorial capital. The environmental capital indicators highlight the main risks, including seismic activity, flooding and landslides [112,113,114,115]. These indicators are therefore characterised by an opposite polarity to all the other indicators for the different forms of capital.
The model was developed from an axiological perspective [116,117] and is based on the identification a hierarchical structure for estimating indices.
The first level of the hierarchical structure is characterised by the above-identified indicators for estimating the six aggregate indices of the different forms of territorial capital: I H C , I U C , I I C , I E C , I N C , I E n v C [118,119,120,121]. The second level of the hierarchy is characterised by the indices of the six forms of territorial capital for estimating I R C I index.
The Multi-Criteria Multi-Attribute Value Theory (MAVT) approach was proposed to estimate indices at different levels. This approach is most suitable for the purposes of this study and the chosen analysis perspective.
MAVT is a simplified version of multi-attribute utility theory (MAUT). Unlike MAUT, MAVT does not consider the decision-maker’s risk propensity. Consequently, MAVT is based on simpler elicitation procedures.
The Multi-Attribute Value Theory (MAVT) (Multi-attribute Value Theory) [122,123,124,125] allows decision problems to be structured and analysed using attribute trees (also known as called value trees), and to identify the relative importance of criteria to be identified in the context of the evaluation being undertaken.
The overall objective in an attribute tree is decomposed hierarchically into subordinate objectives (also called criteria) and measurable attributes (also called the lowest level or criteria leaf).
MAVT includes several aggregation models, but the simplest and most widely used is the additive model [126], which can be used when the conditions for preference independence are met. Assuming preference independence, the additive aggregation model can be used. Given this characteristic, it seems that MAVT is a good approach for estimating aggregate indices.
Under these conditions, the value of each index relating to a component of territorial capital or the I R C I , is estimated using Equation (1):
I C i = j = 1 n w j v j x j
where I C i represents an estimate of the aggregate index of a specific component of territorial capital, or I R C I , n   is the number of indicators or of indices, w j is the weight of each indicators or indices j and v j x j the value taken by the value function for the indicator or index j .
Several weighting techniques are described in the literature, which can be grouped into two broad categories: numerical weight estimation and indifference weights [123].
The first category includes ranking, direct rating, ratio estimation and swing weights, and the Entropy Weight Method (EWM). The second category includes the trade-off method [126].
Of the various weighting criteria techniques proposed in the literature, the Entropy Weight Method (EWM) was selected for this case study.
The EWM is a well-researched and widely used model for weighting criteria [127,128].
Compared to other subjective weighting models, main advantage of EWM is that it eliminates the need for human input when allocating weights to indicators/criteria.
This improves the objectivity of the overall assessment results [129,130,131,132,133,134,135,136,137].
For this reason, EWM has become a popular tool for decision-making processes in recent years [138,139].
EWM determines value by measuring the degree of differentiation. The greater the dispersion of the measured value, the greater the differentiation of the index and the more information that can be obtained. According to traditional literature, EWM results are always reliable and effective [140,141].
A spatial analysis of the first-level and second-level results—the estimation of aggregate indices for various territorial capital components and the I R C I index based on quartiles—provides a map showing the level of endowment in Sicilian municipalities [142,143,144]. This analysis was conducted using QGIS.
This mapping provides the knowledge base necessary for evaluating the impact of cohesion policies on the municipalities and NSIA areas involved.
Quartile analysis categorises municipalities into one of four groups according to their level of capital endowment: low, medium, medium-high and high.
These clusters are characterised by the first, second, third and fourth quartiles of the estimated indices, respectively.
Analysing the indices by quartile, province and type of municipality, according to the NSIA classification (i.e., A—Pole, B—Intercommunal Pole, C—Belt, D—Intermediate, E—Peripheral and F—Ultra-peripheral), provides detailed insight into the levels of the various forms of capital.
It shows the number and percentage of municipalities in each province, as well as the number of municipalities in each class NSIA that fall within the different quartiles.

5. Results

With reference to phases 1–5 of the methodological approach proposed in the previous session, the aggregate indices of the six components of territorial capital were estimated, and their values mapped. The level of endowment for various Sicilian municipalities. is highlighted by a map showing the indices based on their quartiles.
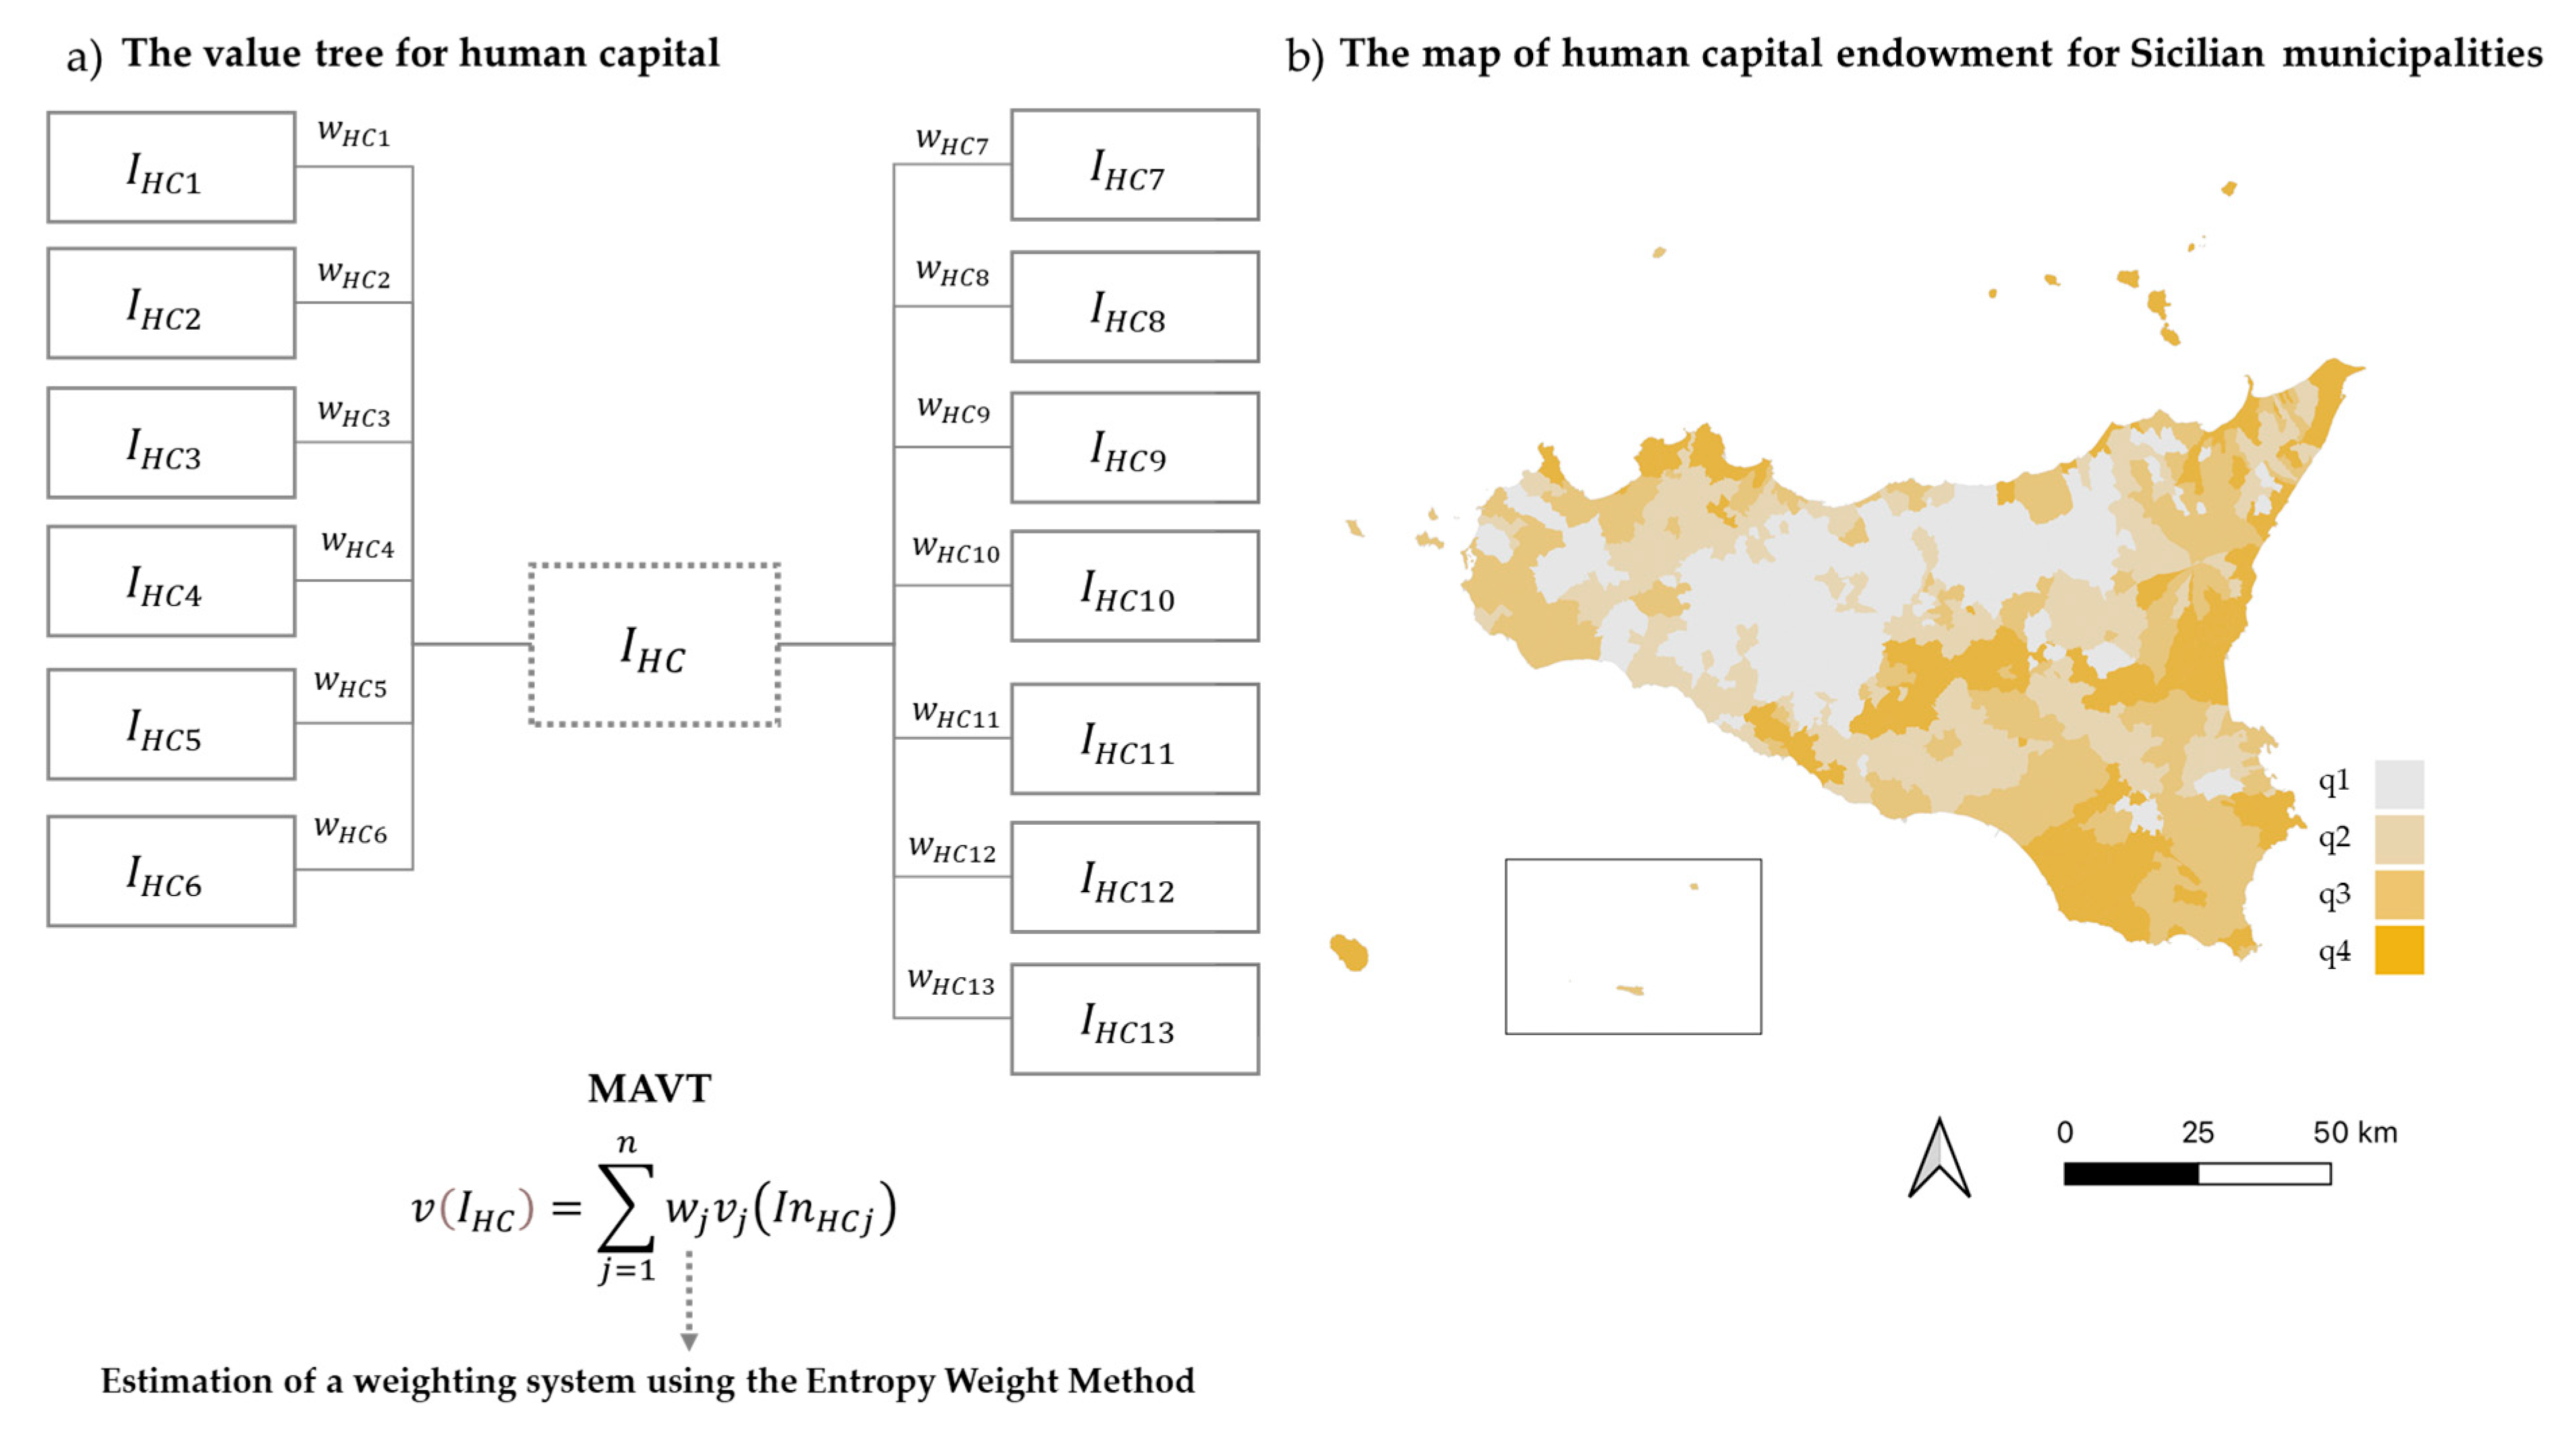
The aggregate human capital index was estimated using the value tree shown in Figure 8a.
Figure 8b shows a map of the level of human capital endowment in different Sicilian areas and municipalities.
It shows higher levels of human capital in the eastern areas and lower levels in the central areas.
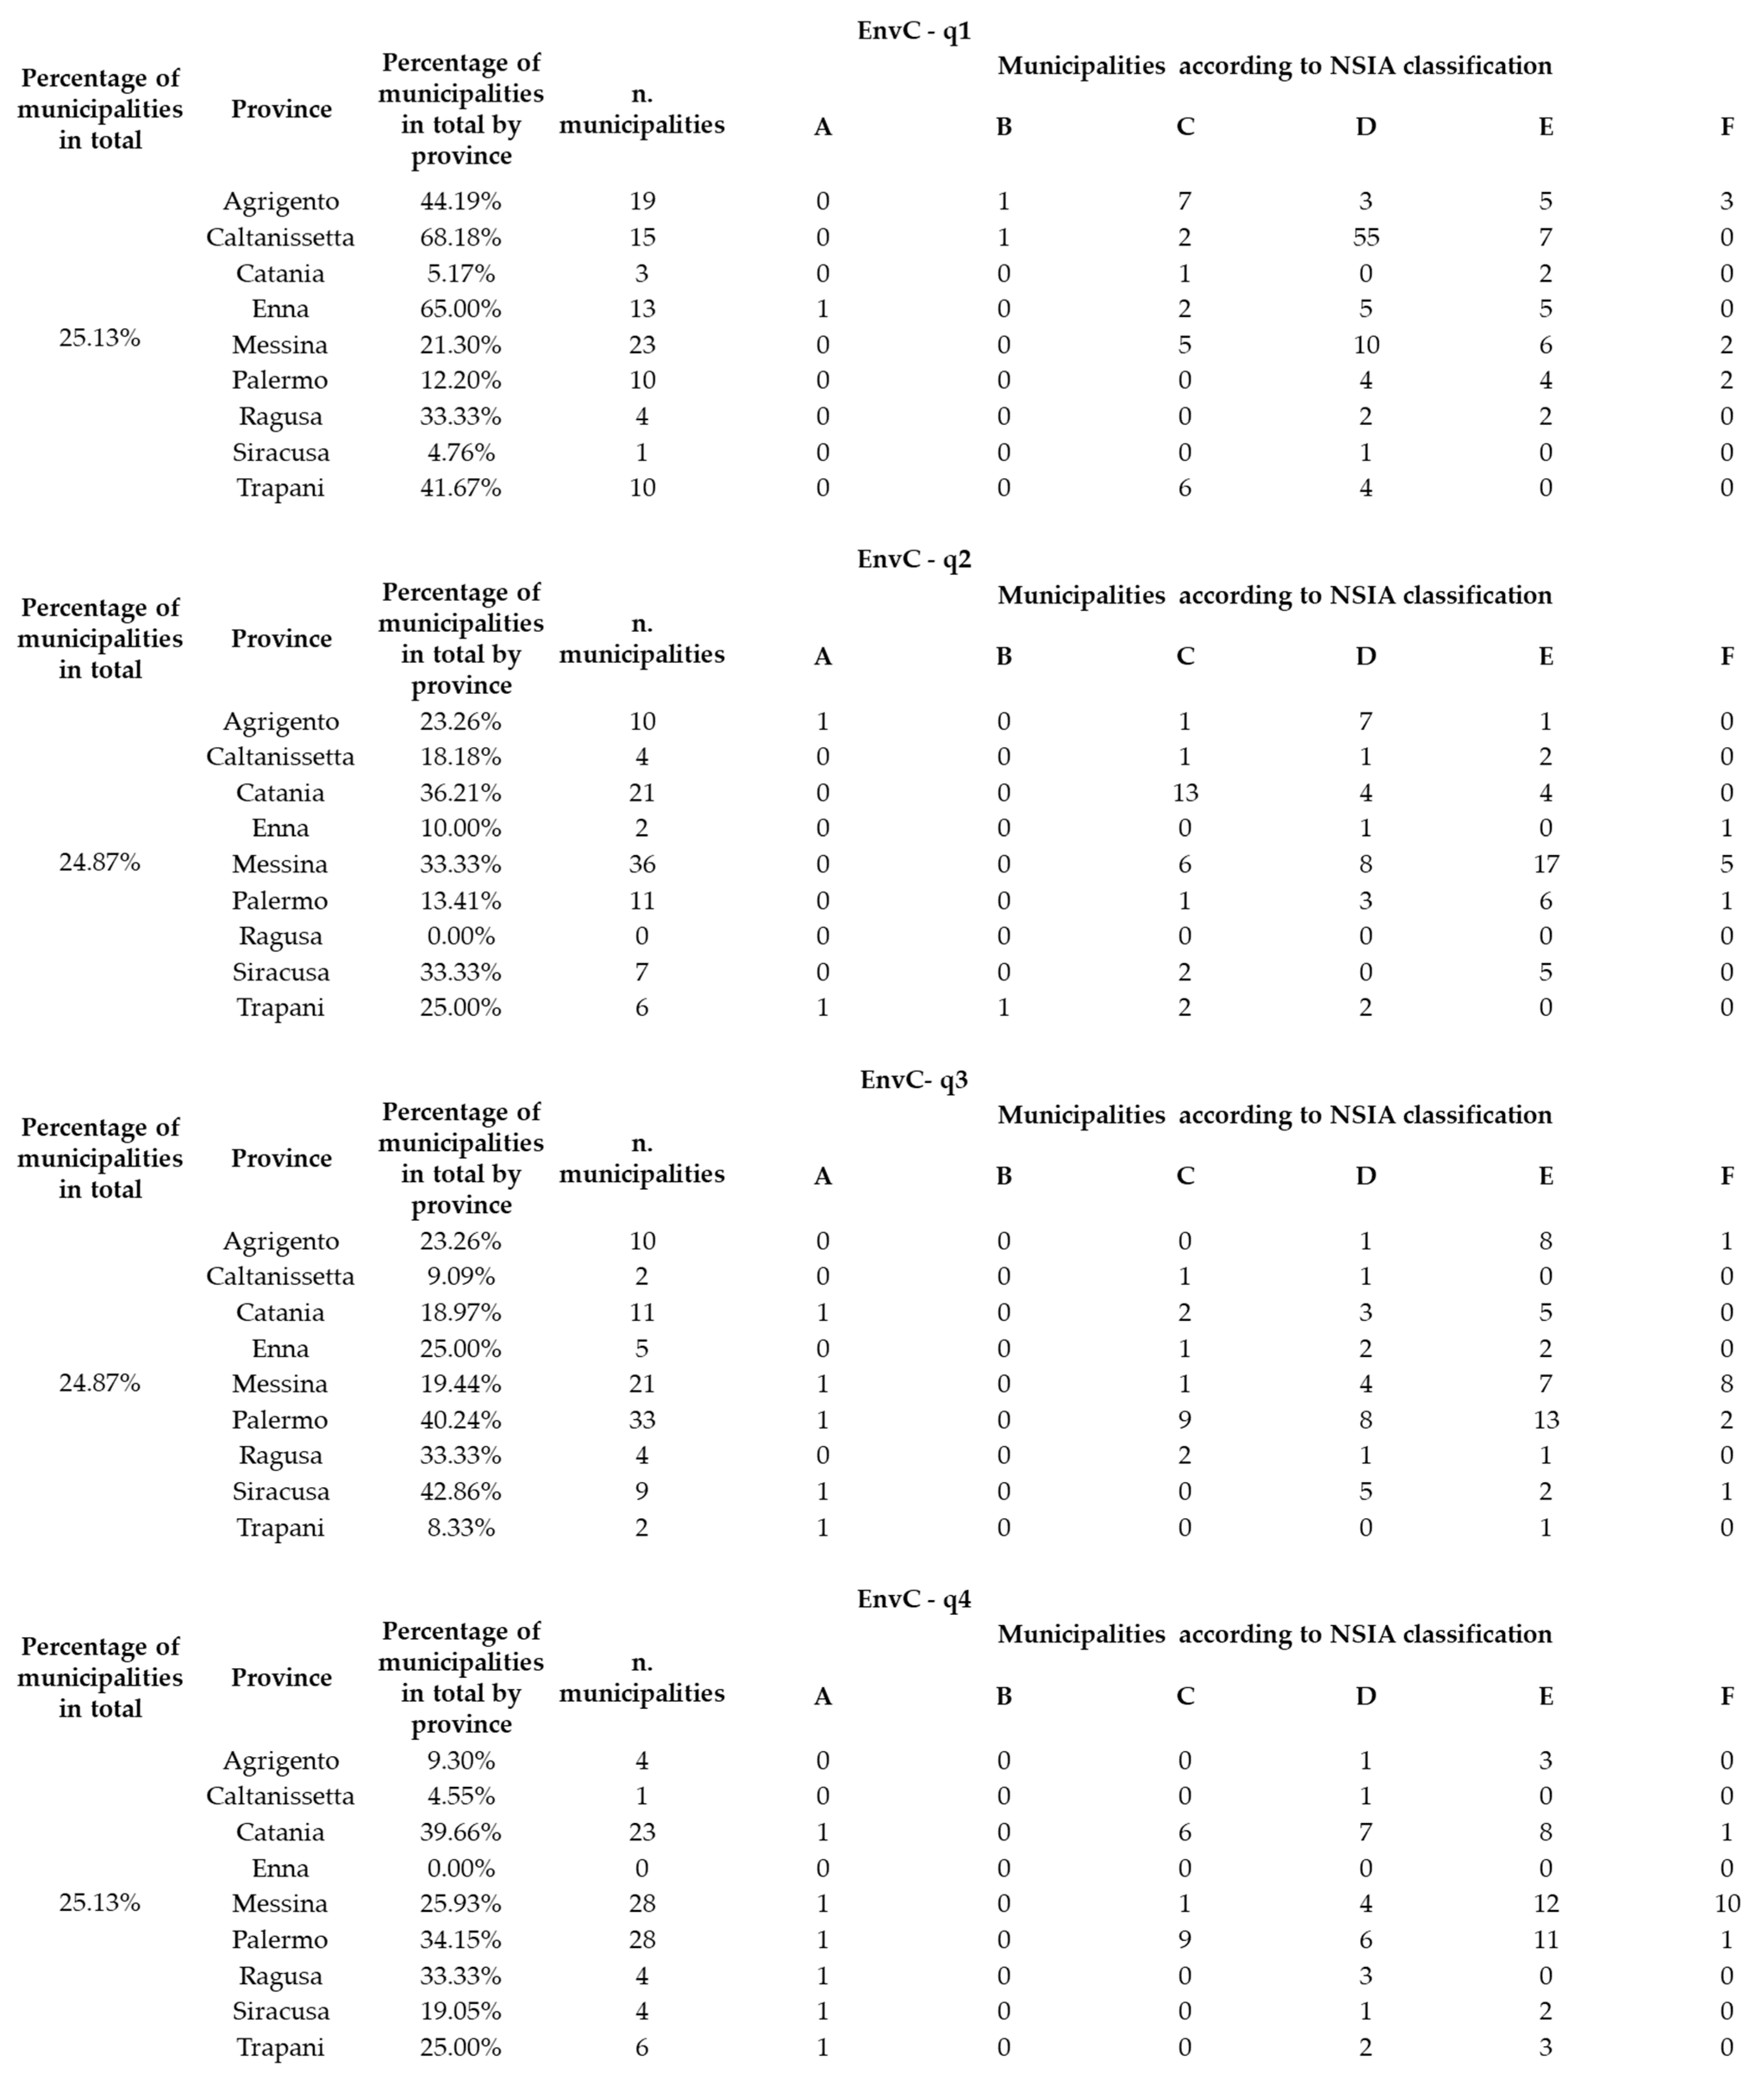
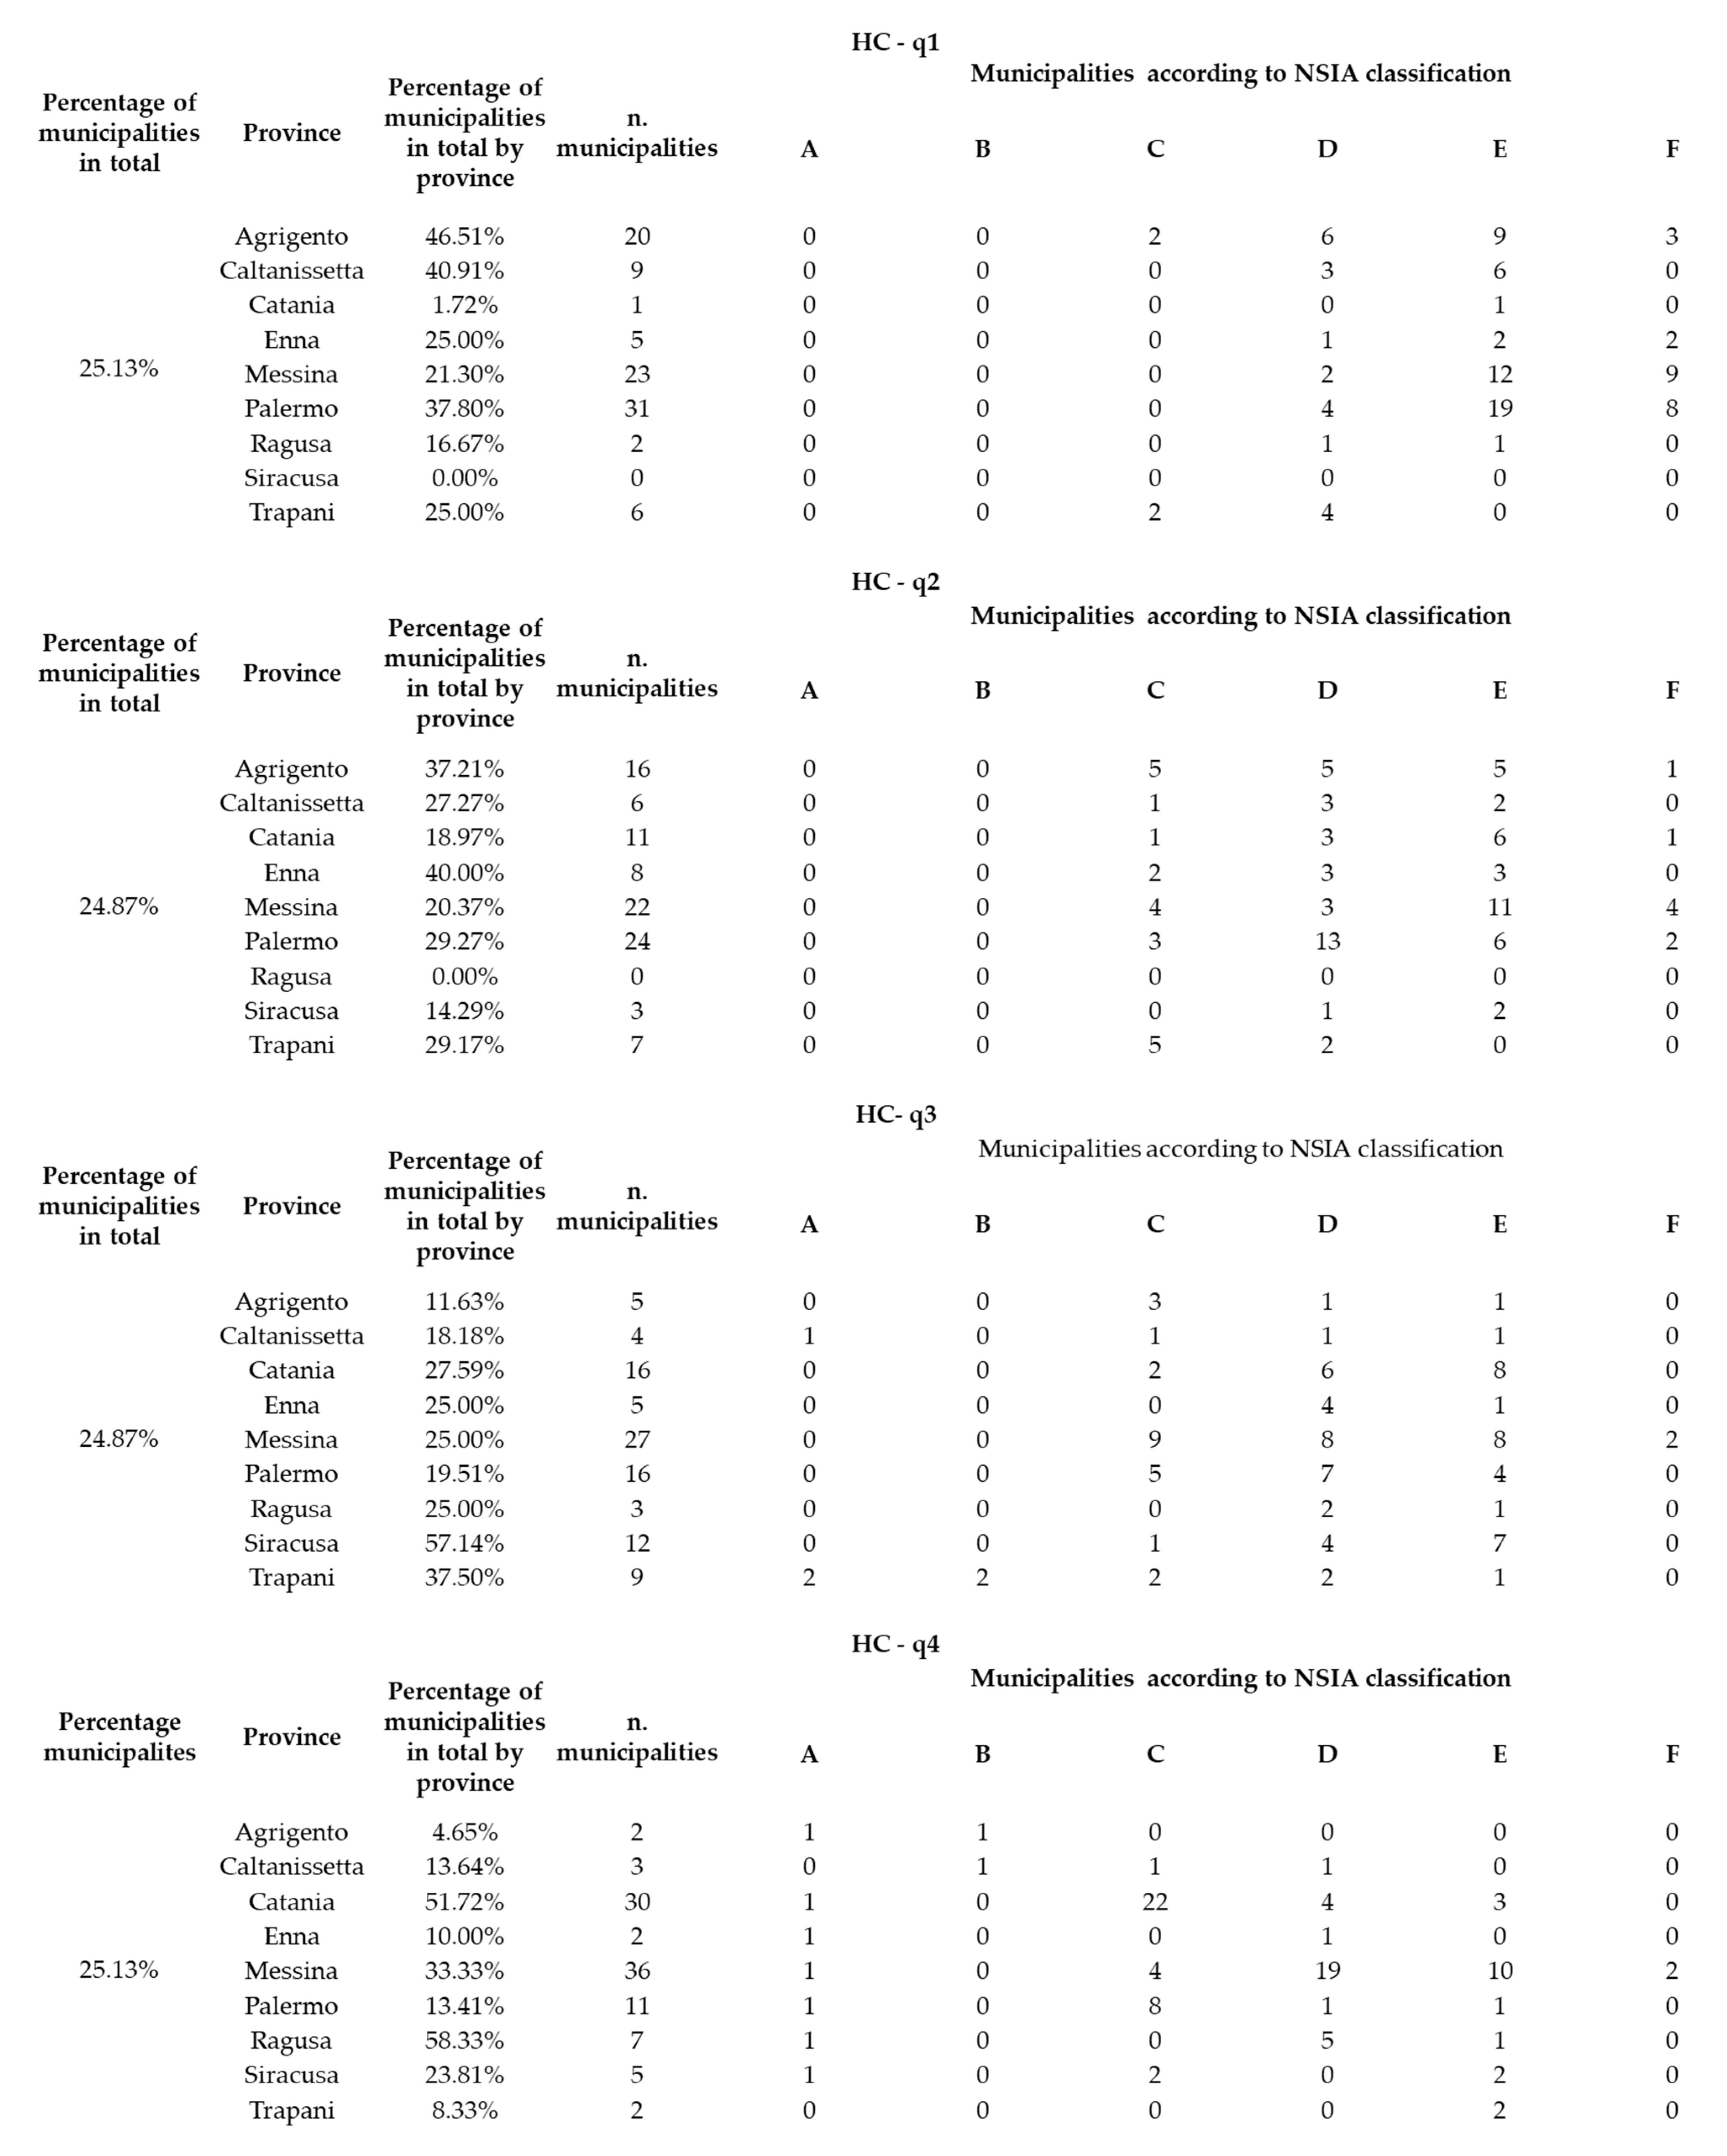
Figure 9 shows the provinces with the lowest and highest levels of human capital. Agrigento and Caltanissetta have the lowest levels, while Catania and Palermo have the highest. Municipalities in the first quartile in Agrigento and Caltanissetta are mostly classified as D (Intermediate), E (Peripheral) or F (Ultra-peripheral).
This indicates that these areas are more vulnerable, as even those that are not extremely peripheral have low human capital.
In the case of the provinces of Catania and Palermo, municipalities in the fourth quartile are classified under all types of NSIA.
This highlights that some peripheral areas benefit from organised proximity, which limits the impact of their geographical remoteness.
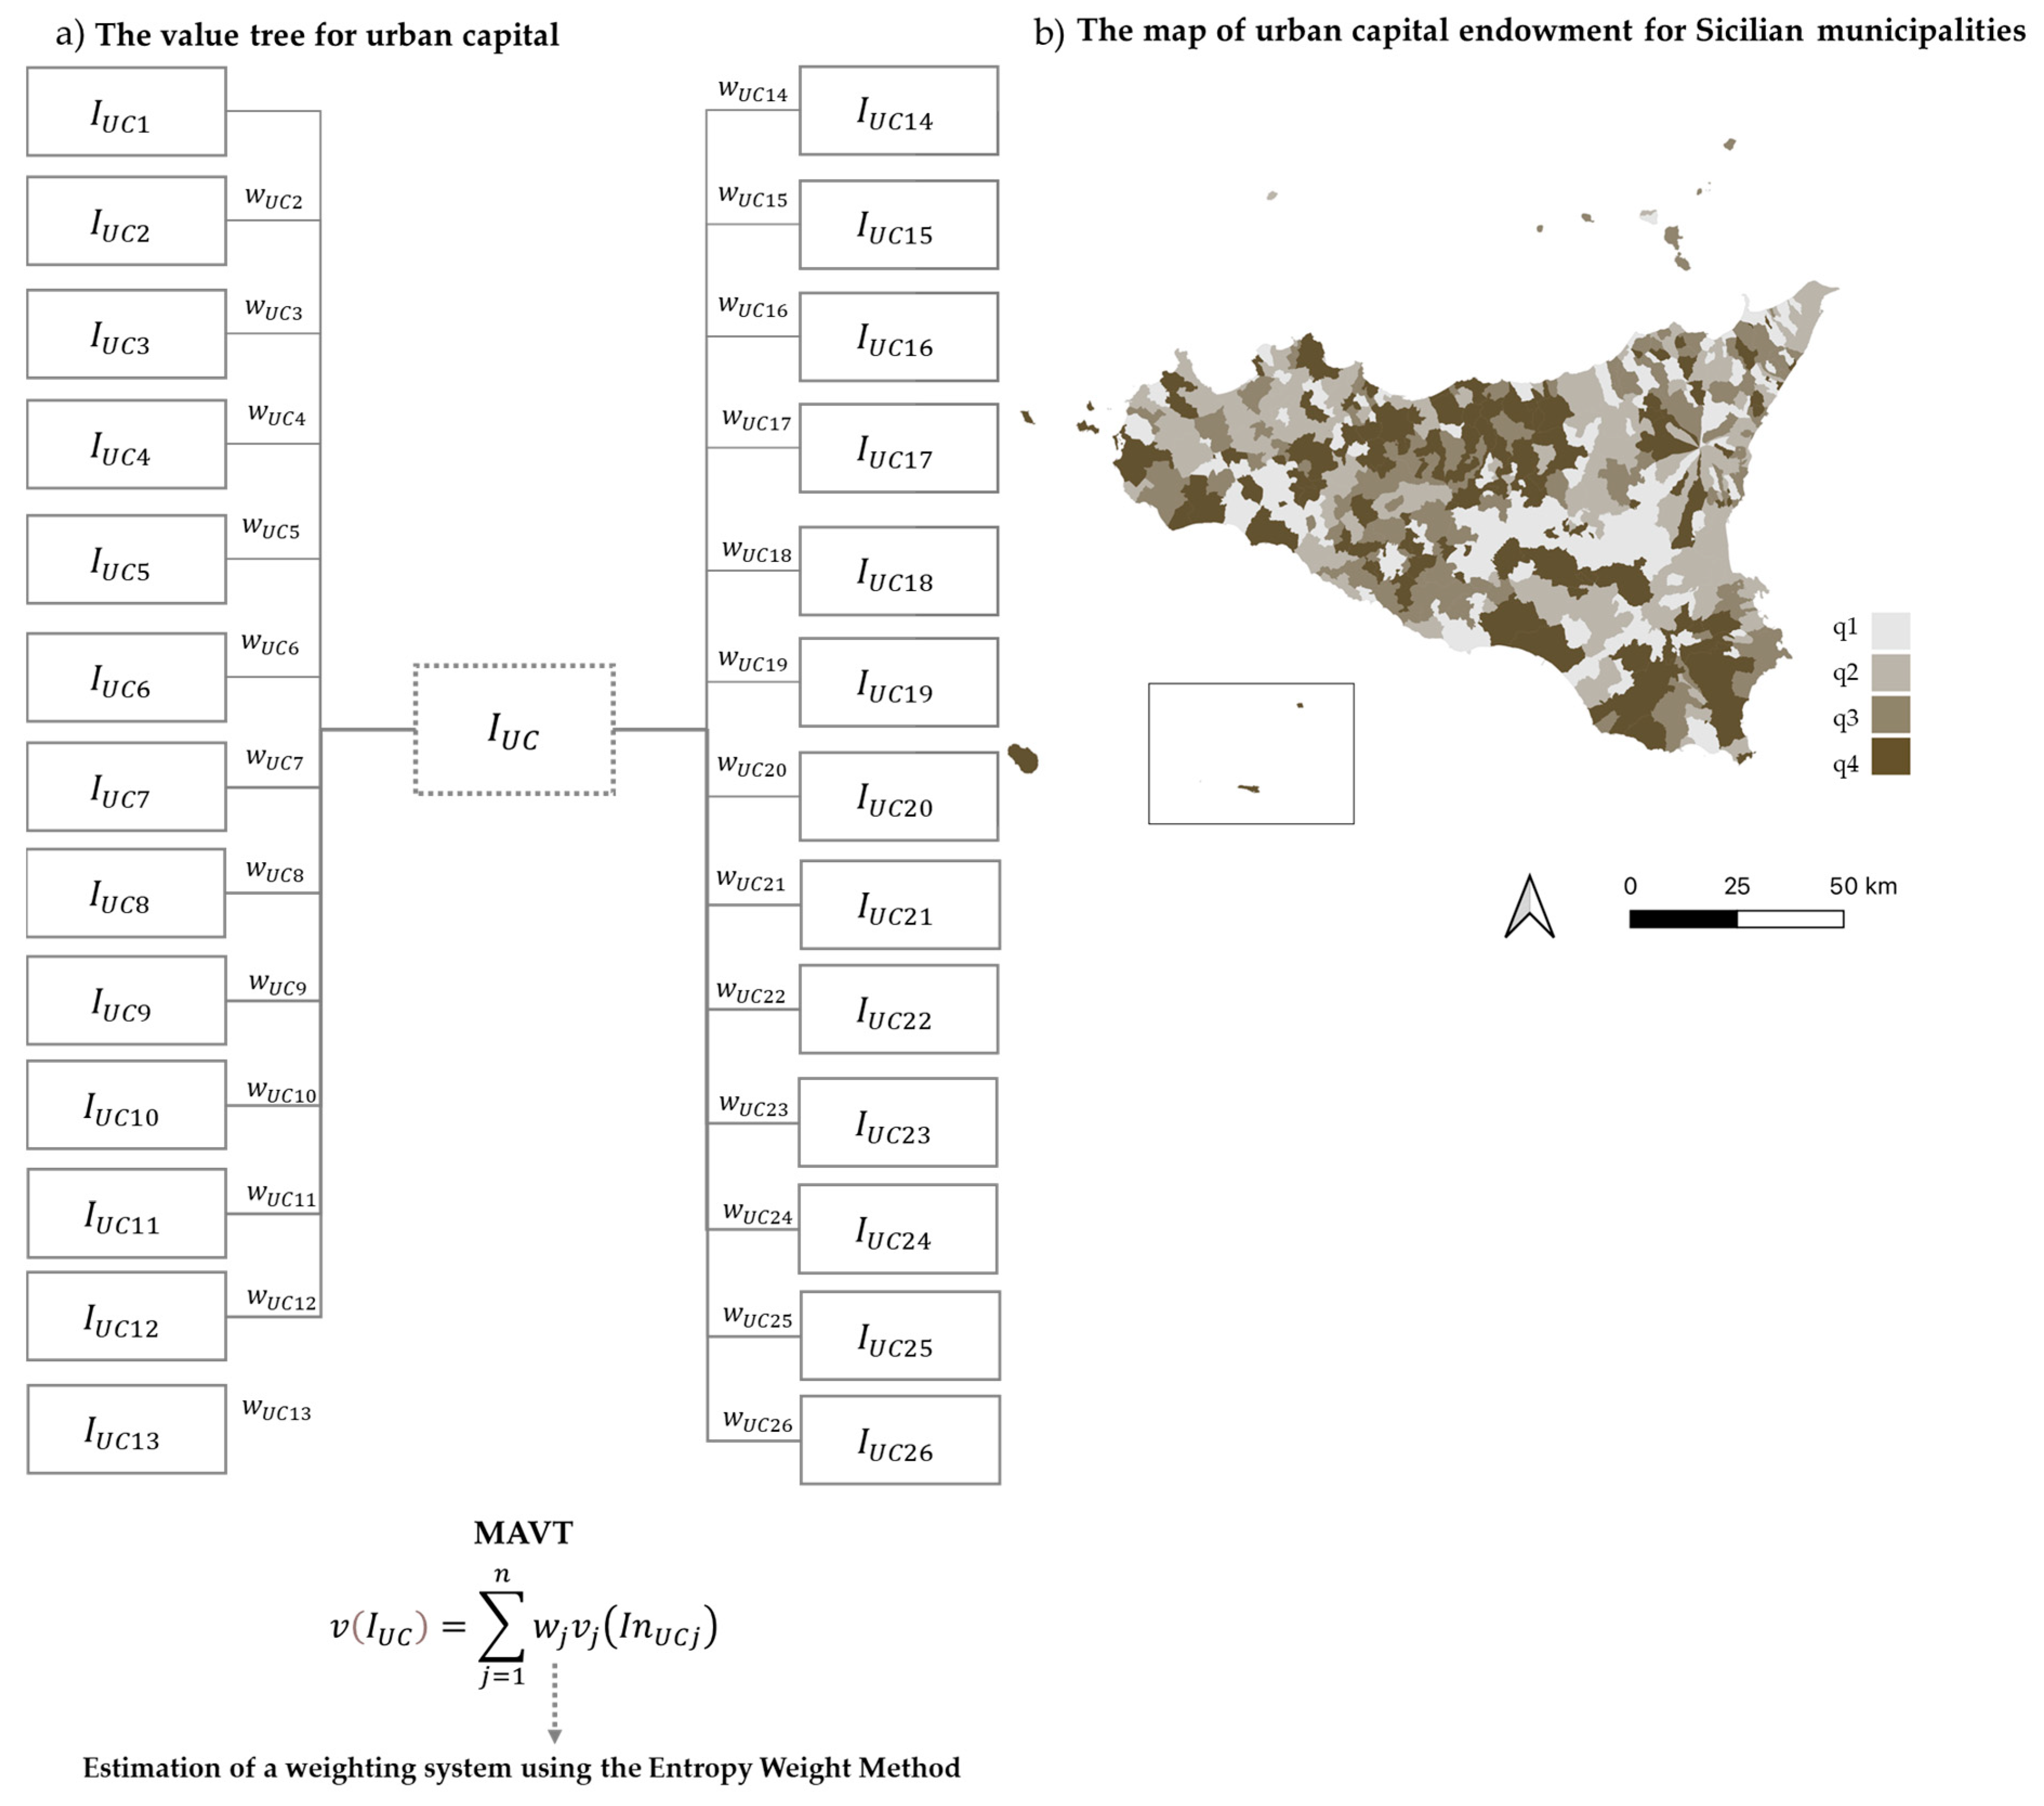
Similarly, the aggregate index for urban capital was estimated using the value tree shown in Figure A1a (see Appendix B).
Figure A1b (see Appendix B) illustrates the level of urban capital endowment in the different Sicilian areas and municipalities.
This map shows that the central areas of Sicily have considerable diversity in urban capital endowment. It shows that both inner and coastal areas have a good supply of urban capital.
This map shows that the central areas of Sicily have a significant diversity in urban capital endowment.
This means that this component of territorial capital is less affected by the typical distinction between inner and coastal areas.
Many Sicilian municipalities have a high level of historical, cultural, architectural and urban heritage [145], as evidenced by the large number of sites included on the World Heritage List.
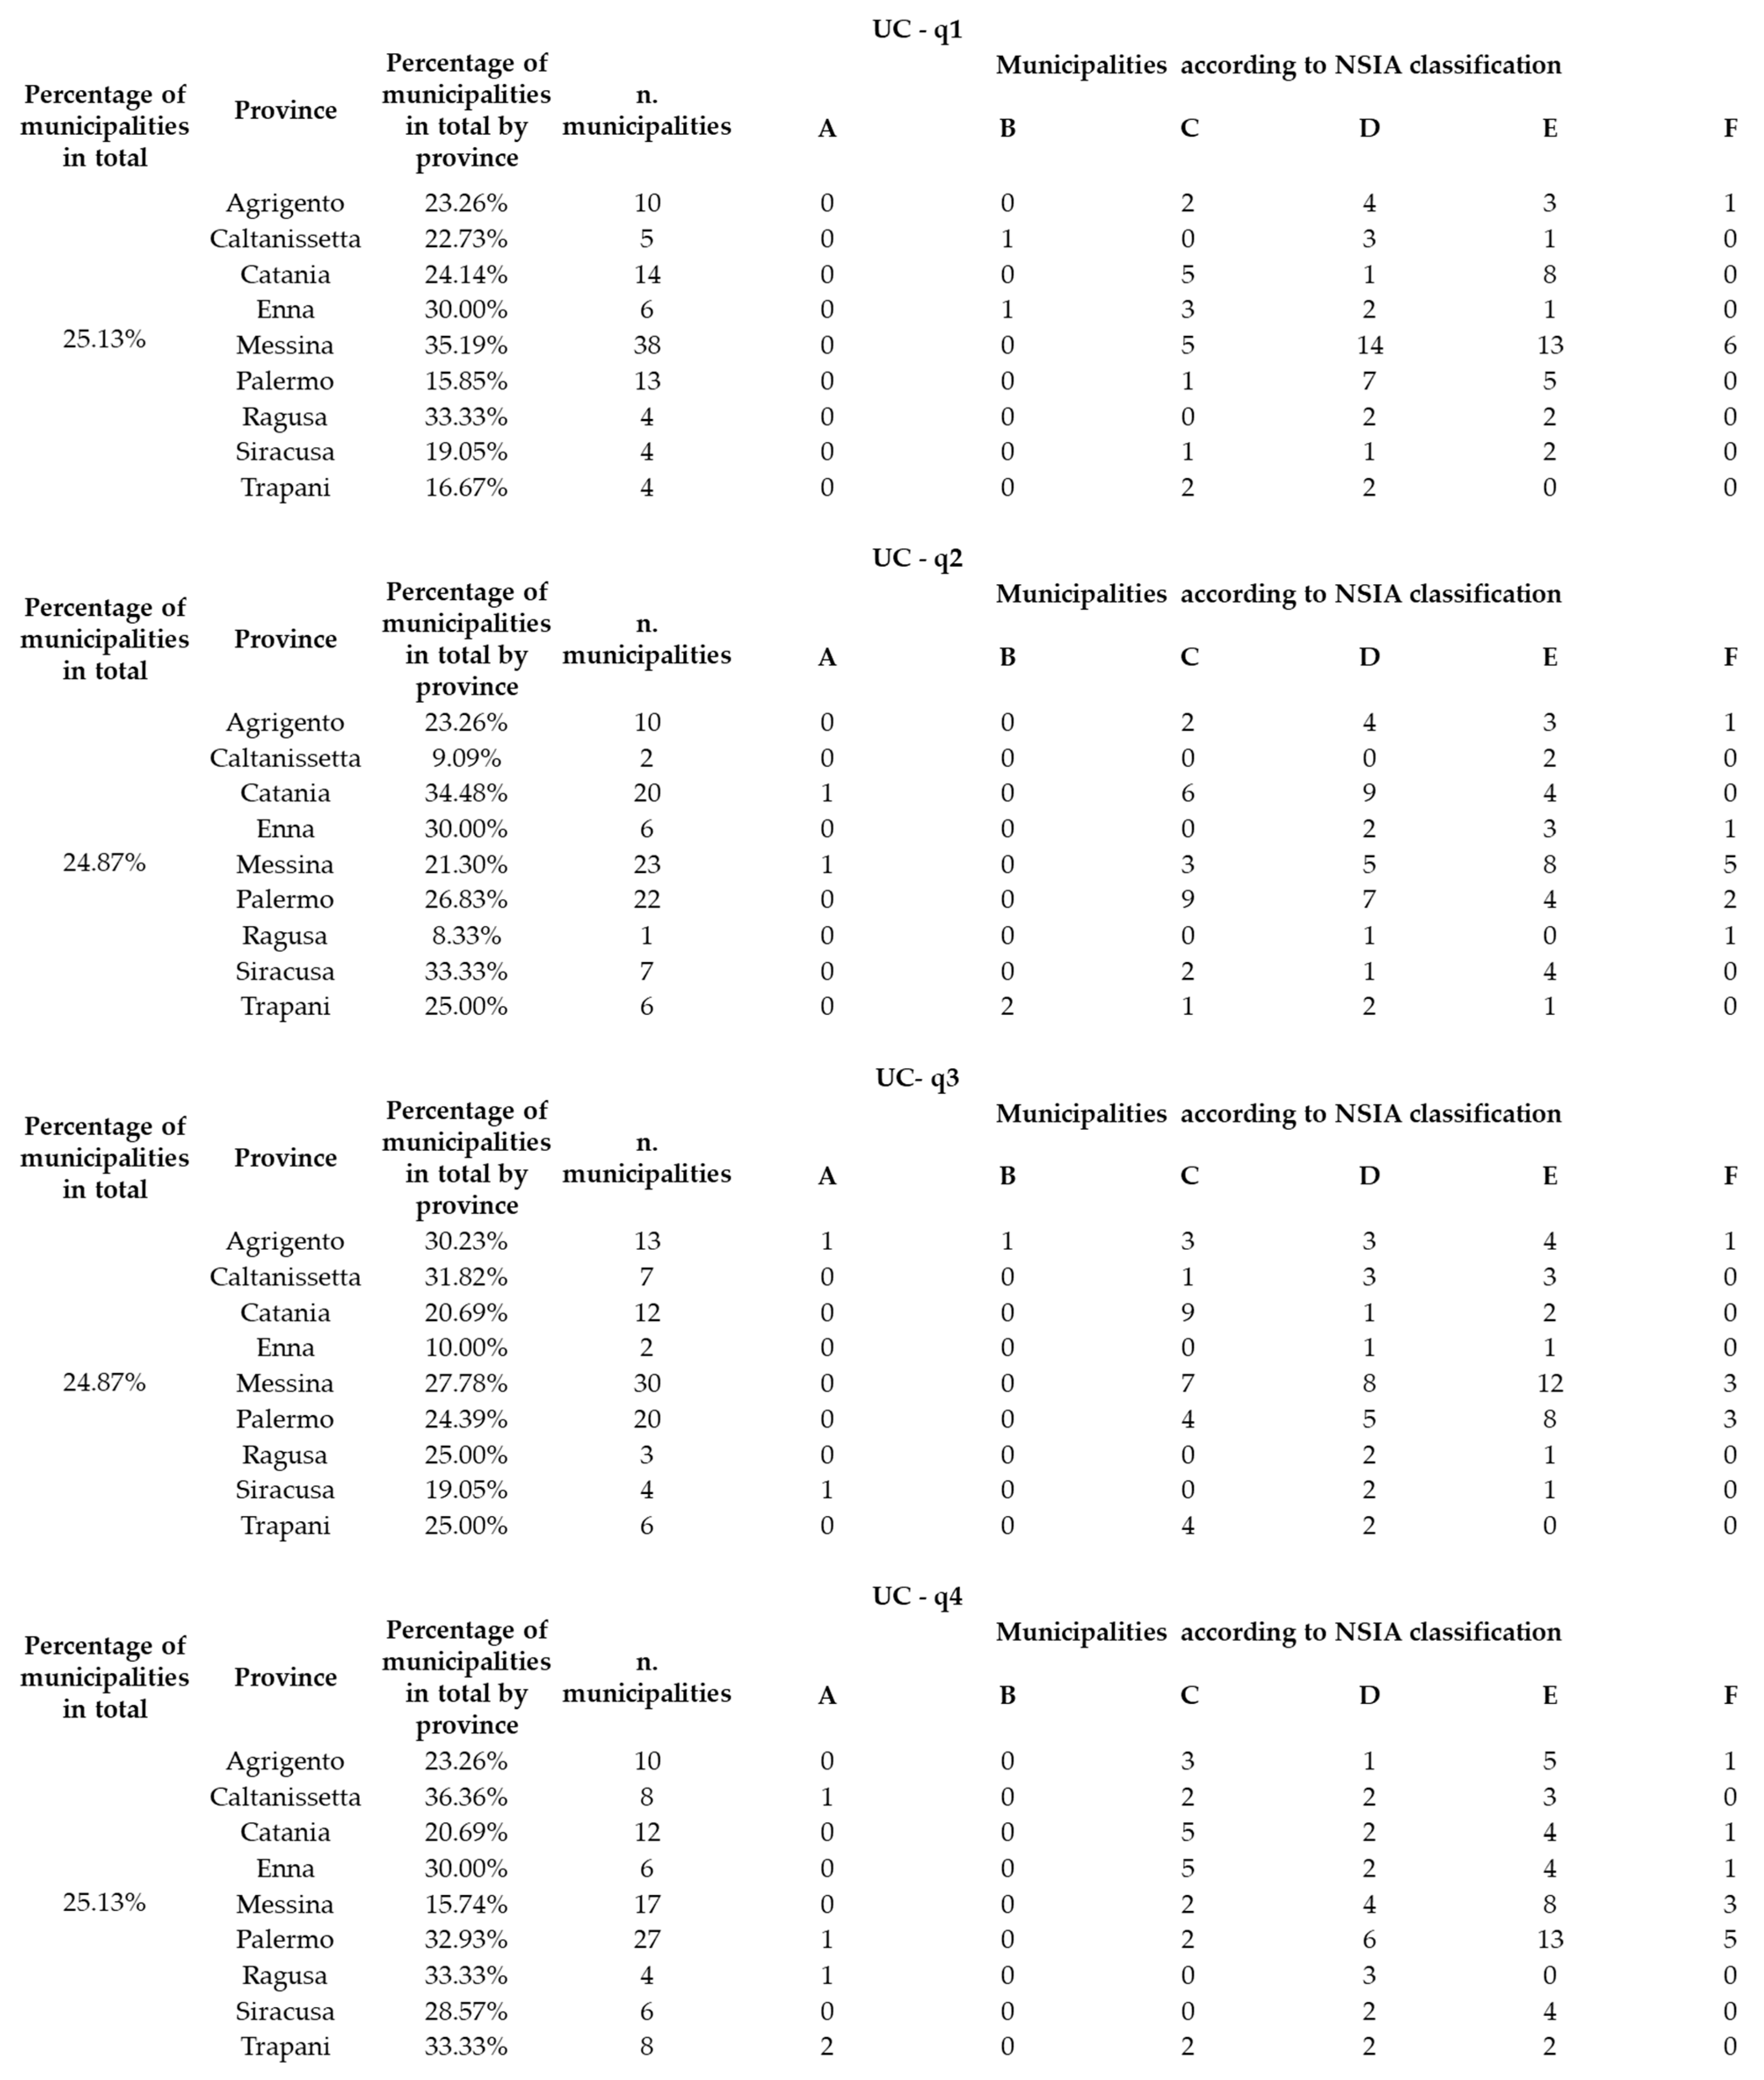
Quartile analysis of the aggregate urban capital index, by province and municipality type according to the NSIA, shows that approximately one-third of municipalities in the provinces of Catania and Syracuse fall into the first quartile, while one-third of municipalities in the provinces of Caltanissetta, Enna, Palermo, Ragusa and Trapani fall into the fourth quartile (see Figure A2 in Appendix B).
The aggregate infrastructure capital index was estimated using the value tree shown in Figure A3a (see Appendix B).
Figure A3b (see Appendix B) shows a map of infrastructure capital endowment. It highlights the levels of infrastructure capital endowment in different Sicilian areas and municipalities.
It shows that coastal areas, particularly in the provinces of Catania, Palermo, Ragusa, Syracuse and Trapani, have a high concentration of infrastructure capital, while inner areas have medium and low levels.
This infrastructure capital mapping confirms that inner areas are underdeveloped compared to coastal areas. These are characterised overall by a lack of services and transport infrastructure, which exacerbates their socio-economic disadvantage.
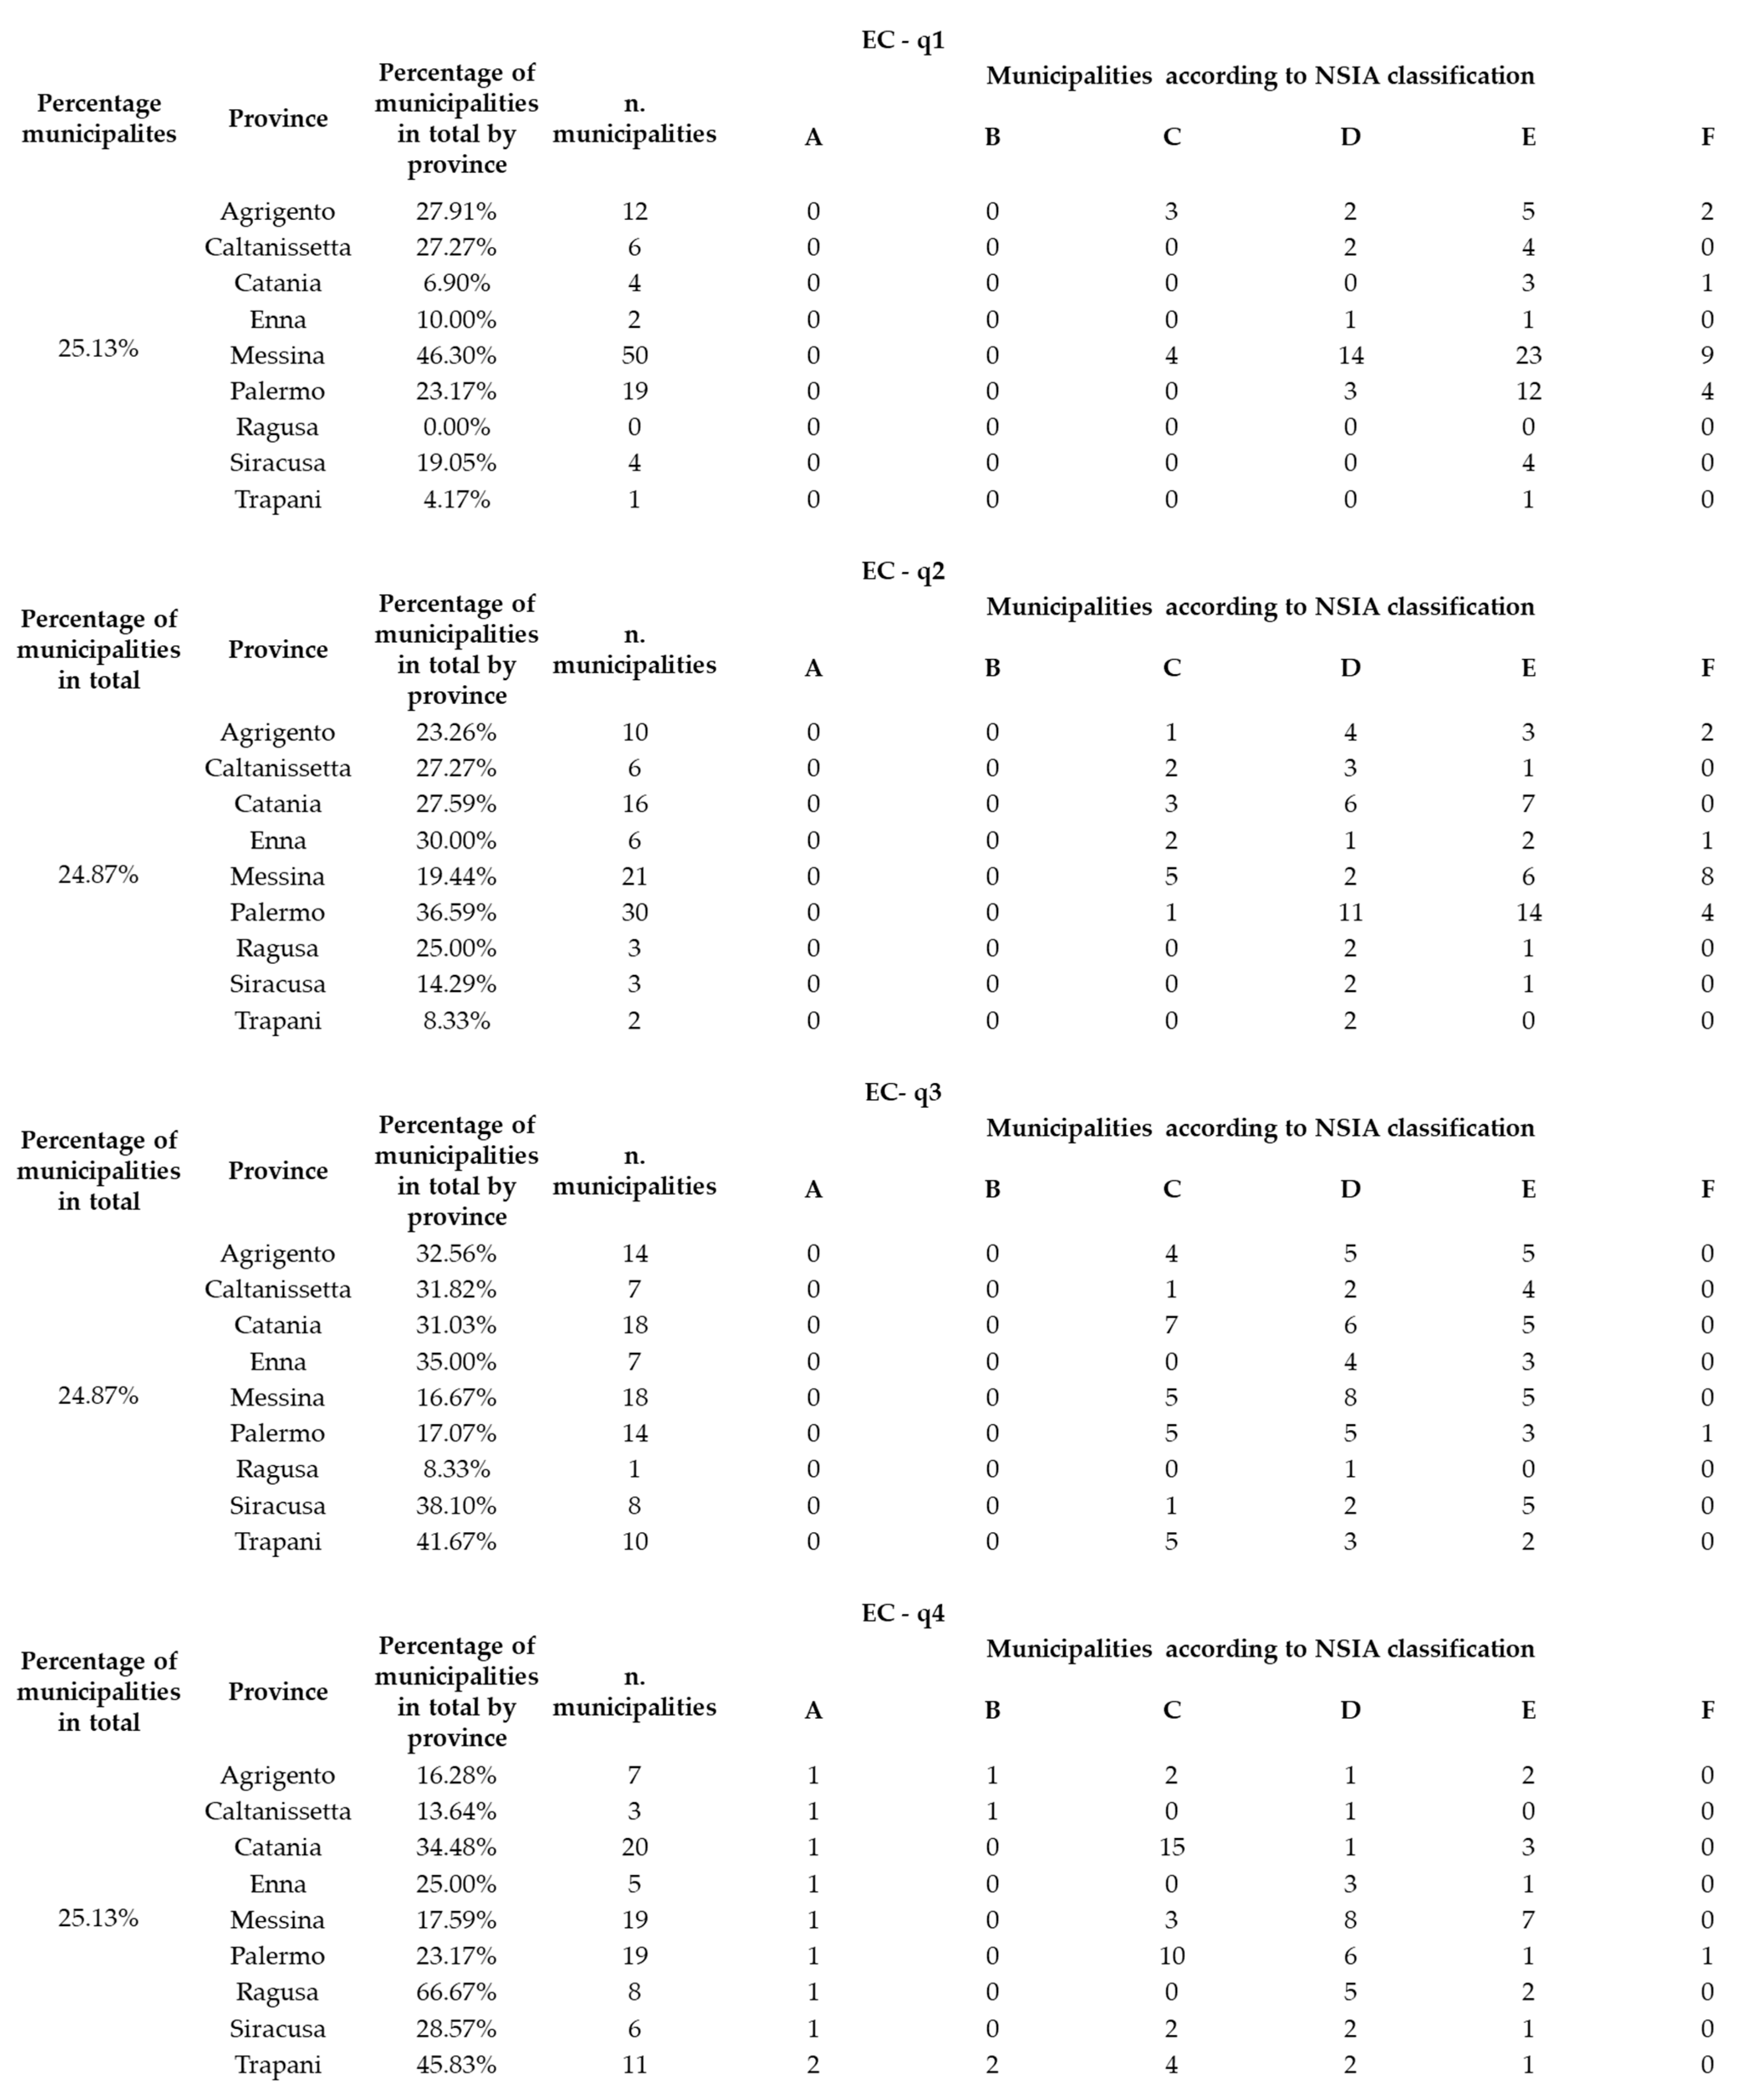
The quartile analysis shows that a high percentage of municipalities in the province of Agrigento fall into the first quartile (see Figure A4 in Appendix B).
It also shows that approximately one-third of municipalities in Catania province have the best infrastructure capital endowment (see Figure A4 in Appendix B).
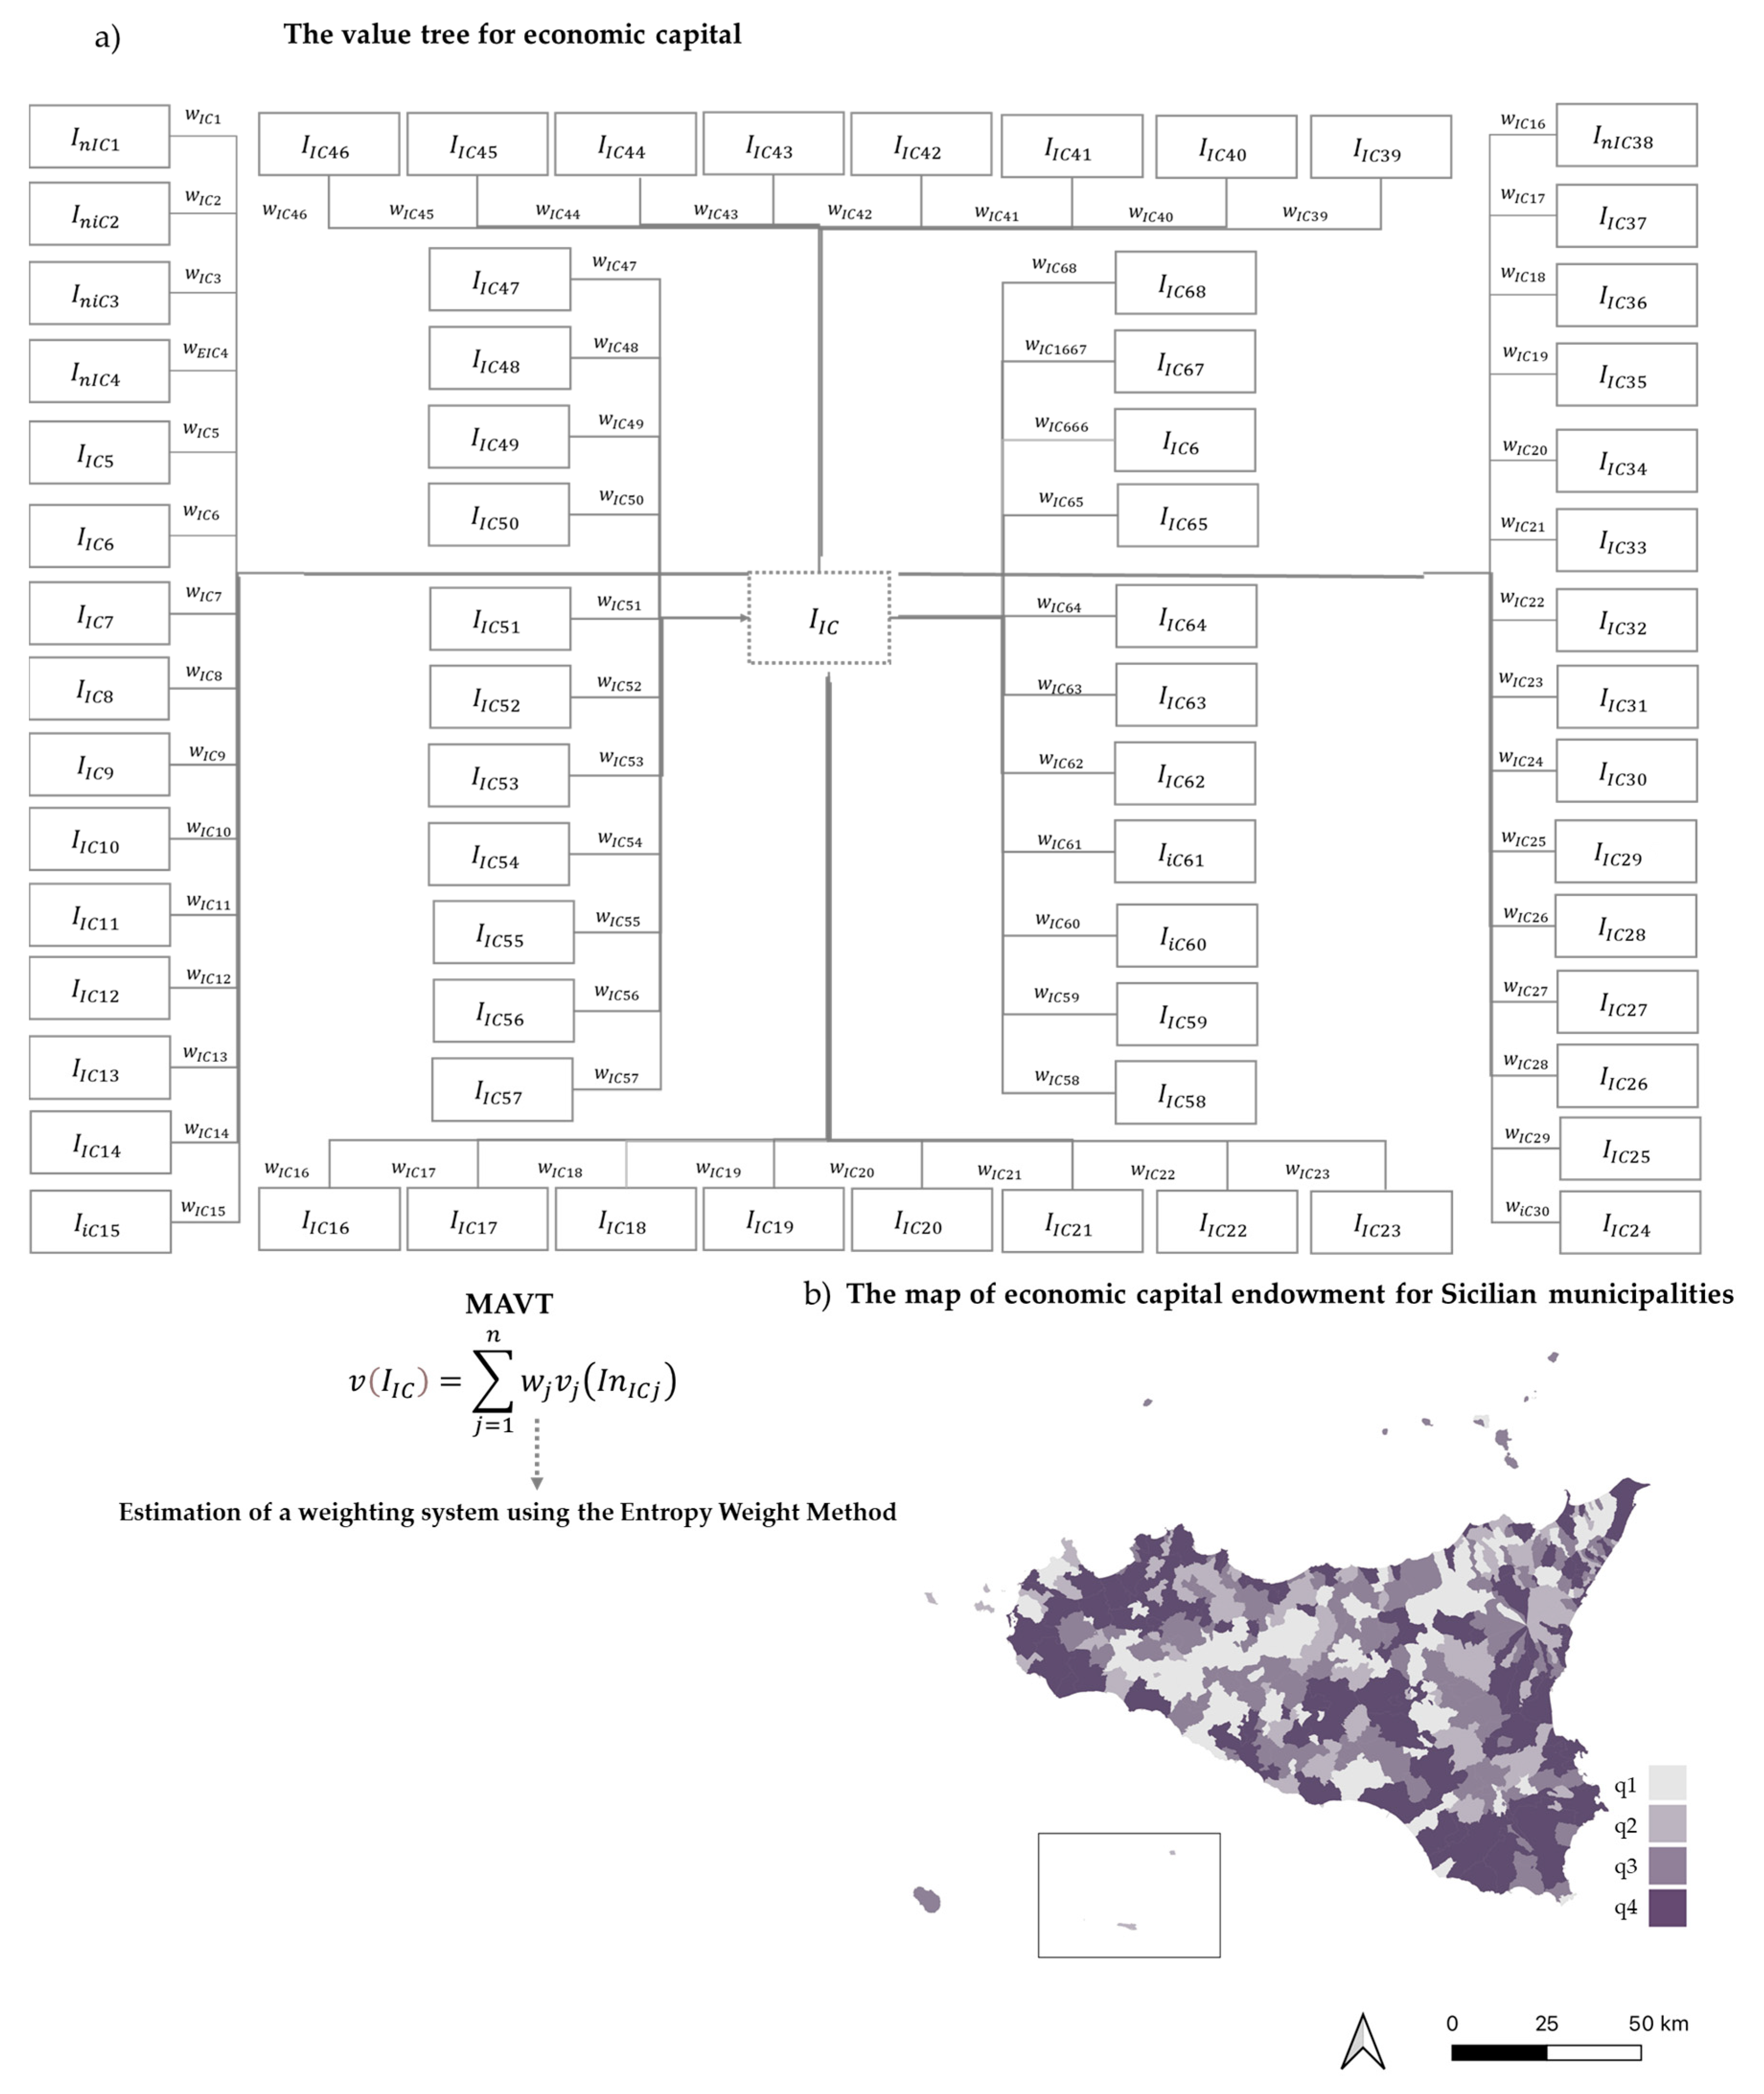
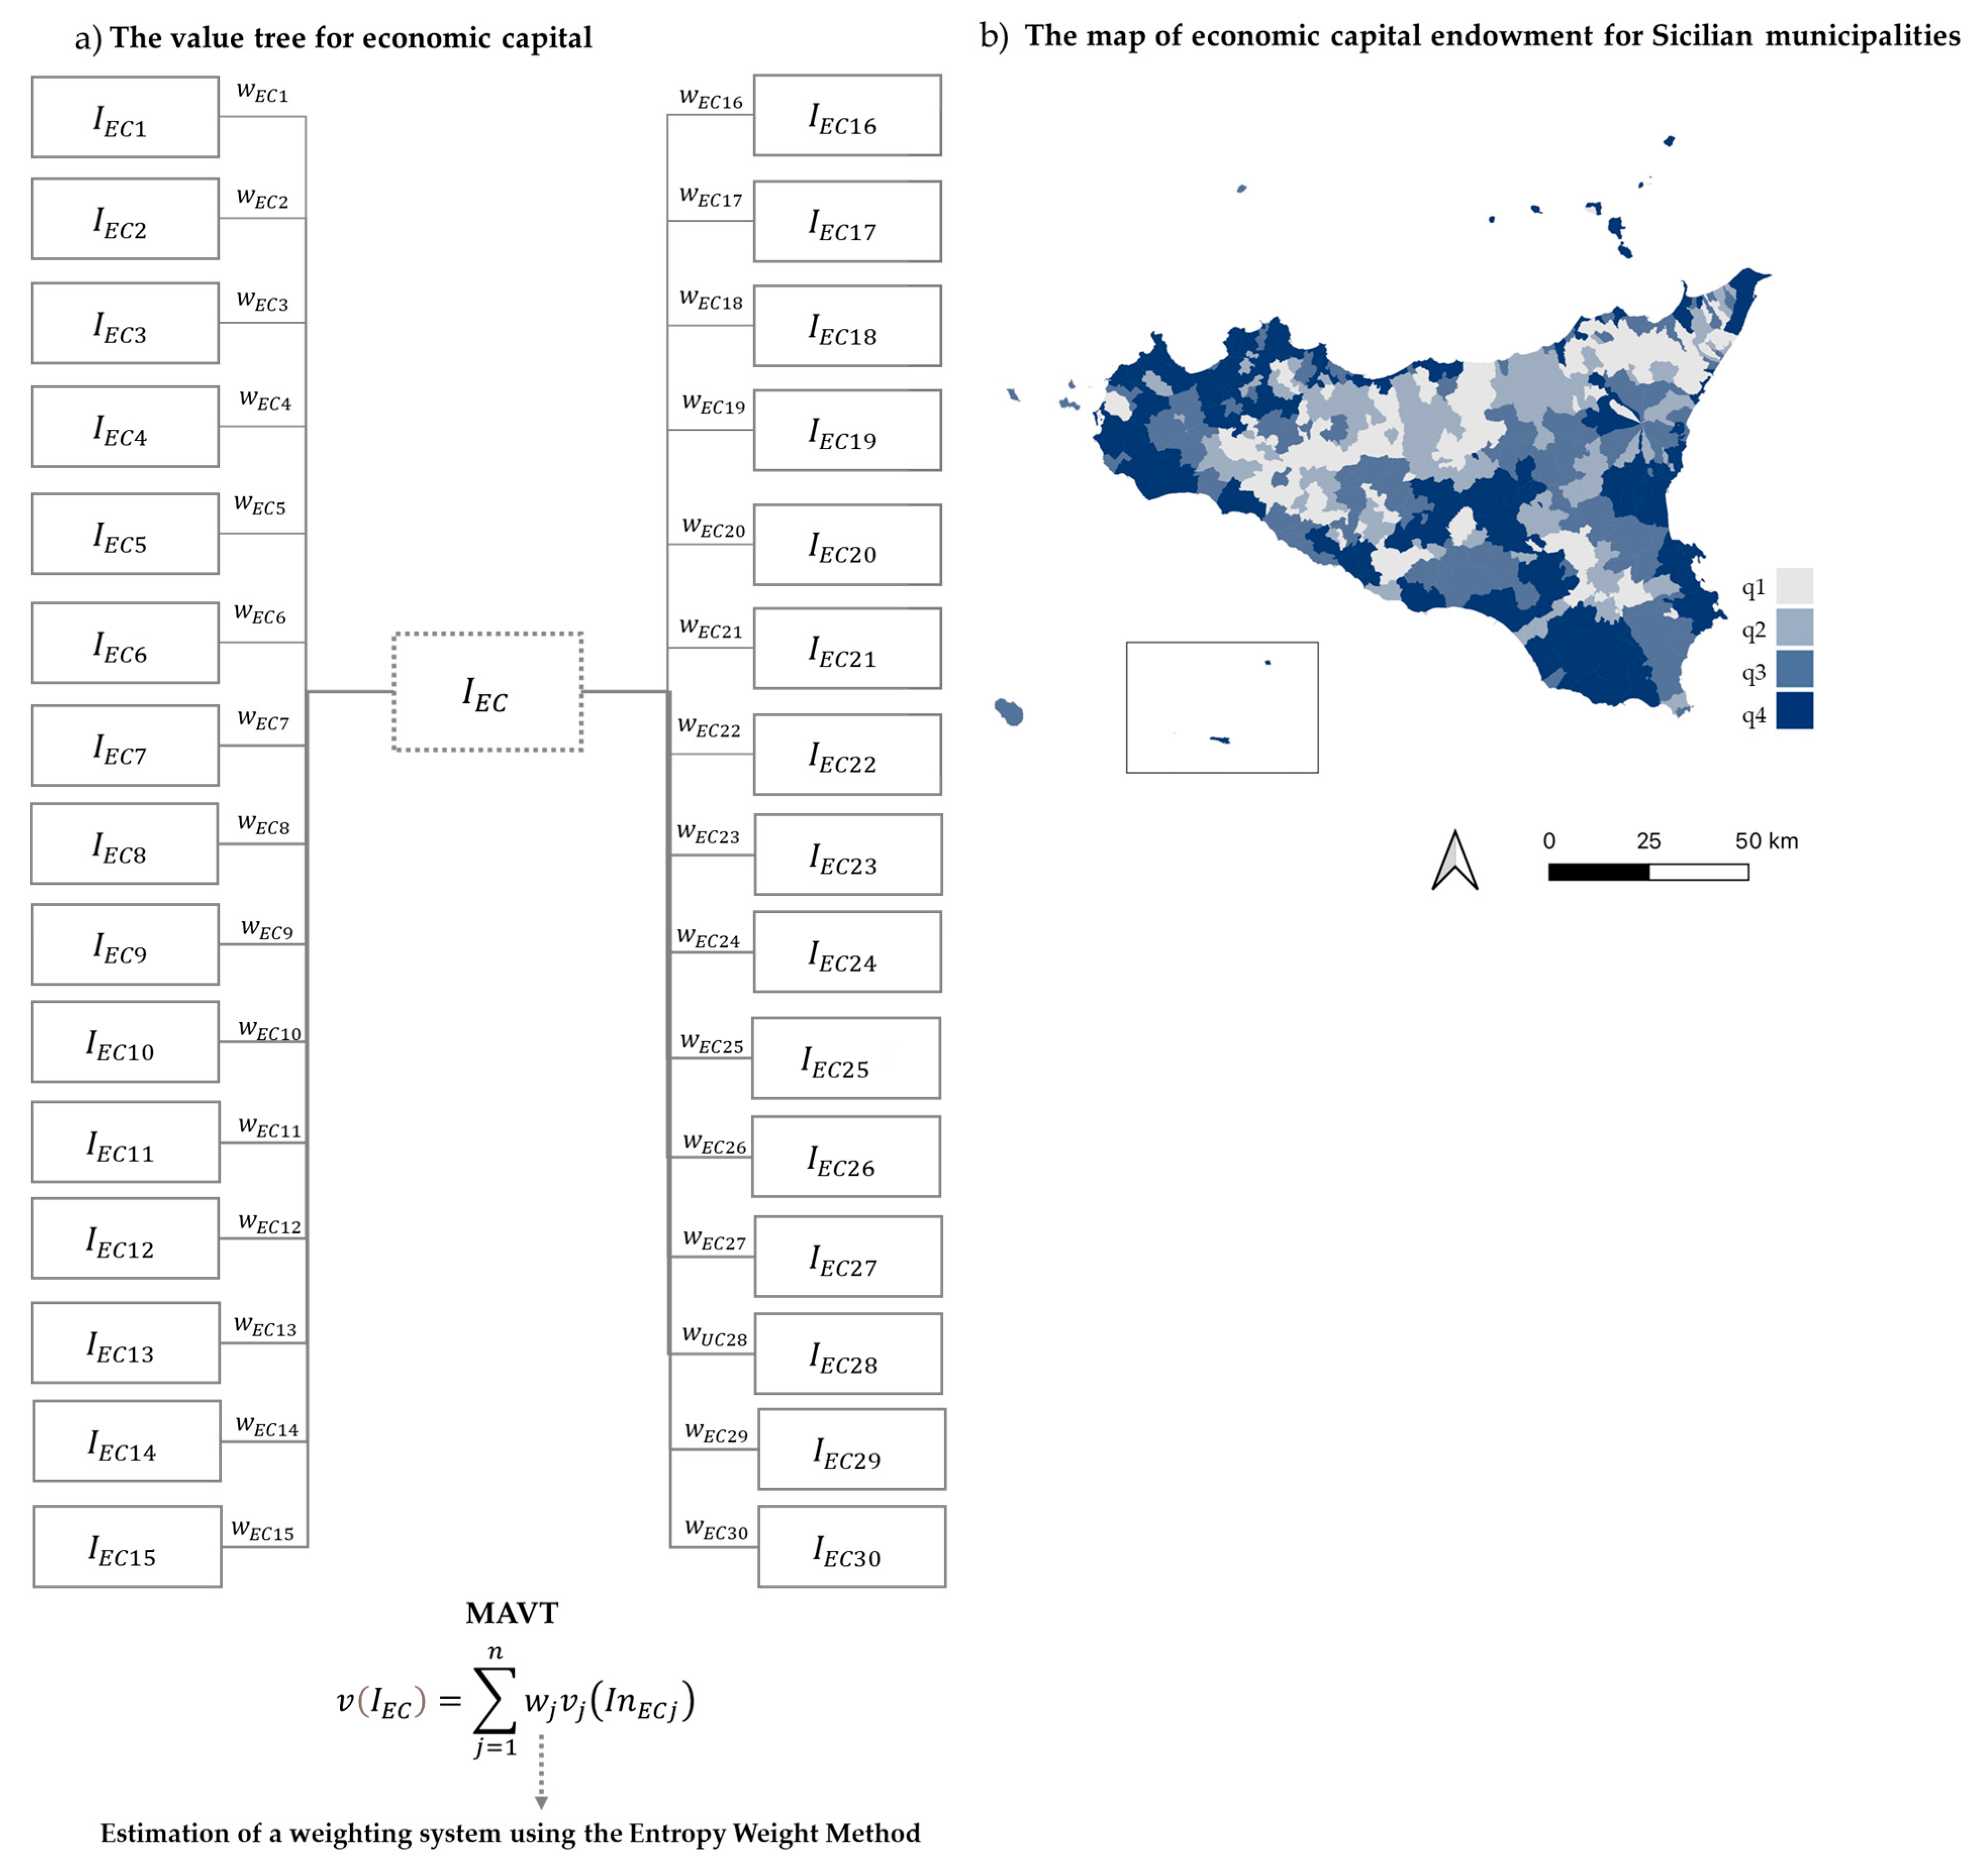
The aggregate index for economic capital was estimated based on the value tree shown in Figure A5a (see Appendix B).
Figure A5b (see Appendix B) shows a map of the level economic capital endowment in different Sicilian areas and municipalities.
This map highlights large with low and medium economic capital endowment, mostly inland, and areas with medium-high and high economic capital endowment, mostly coastal.
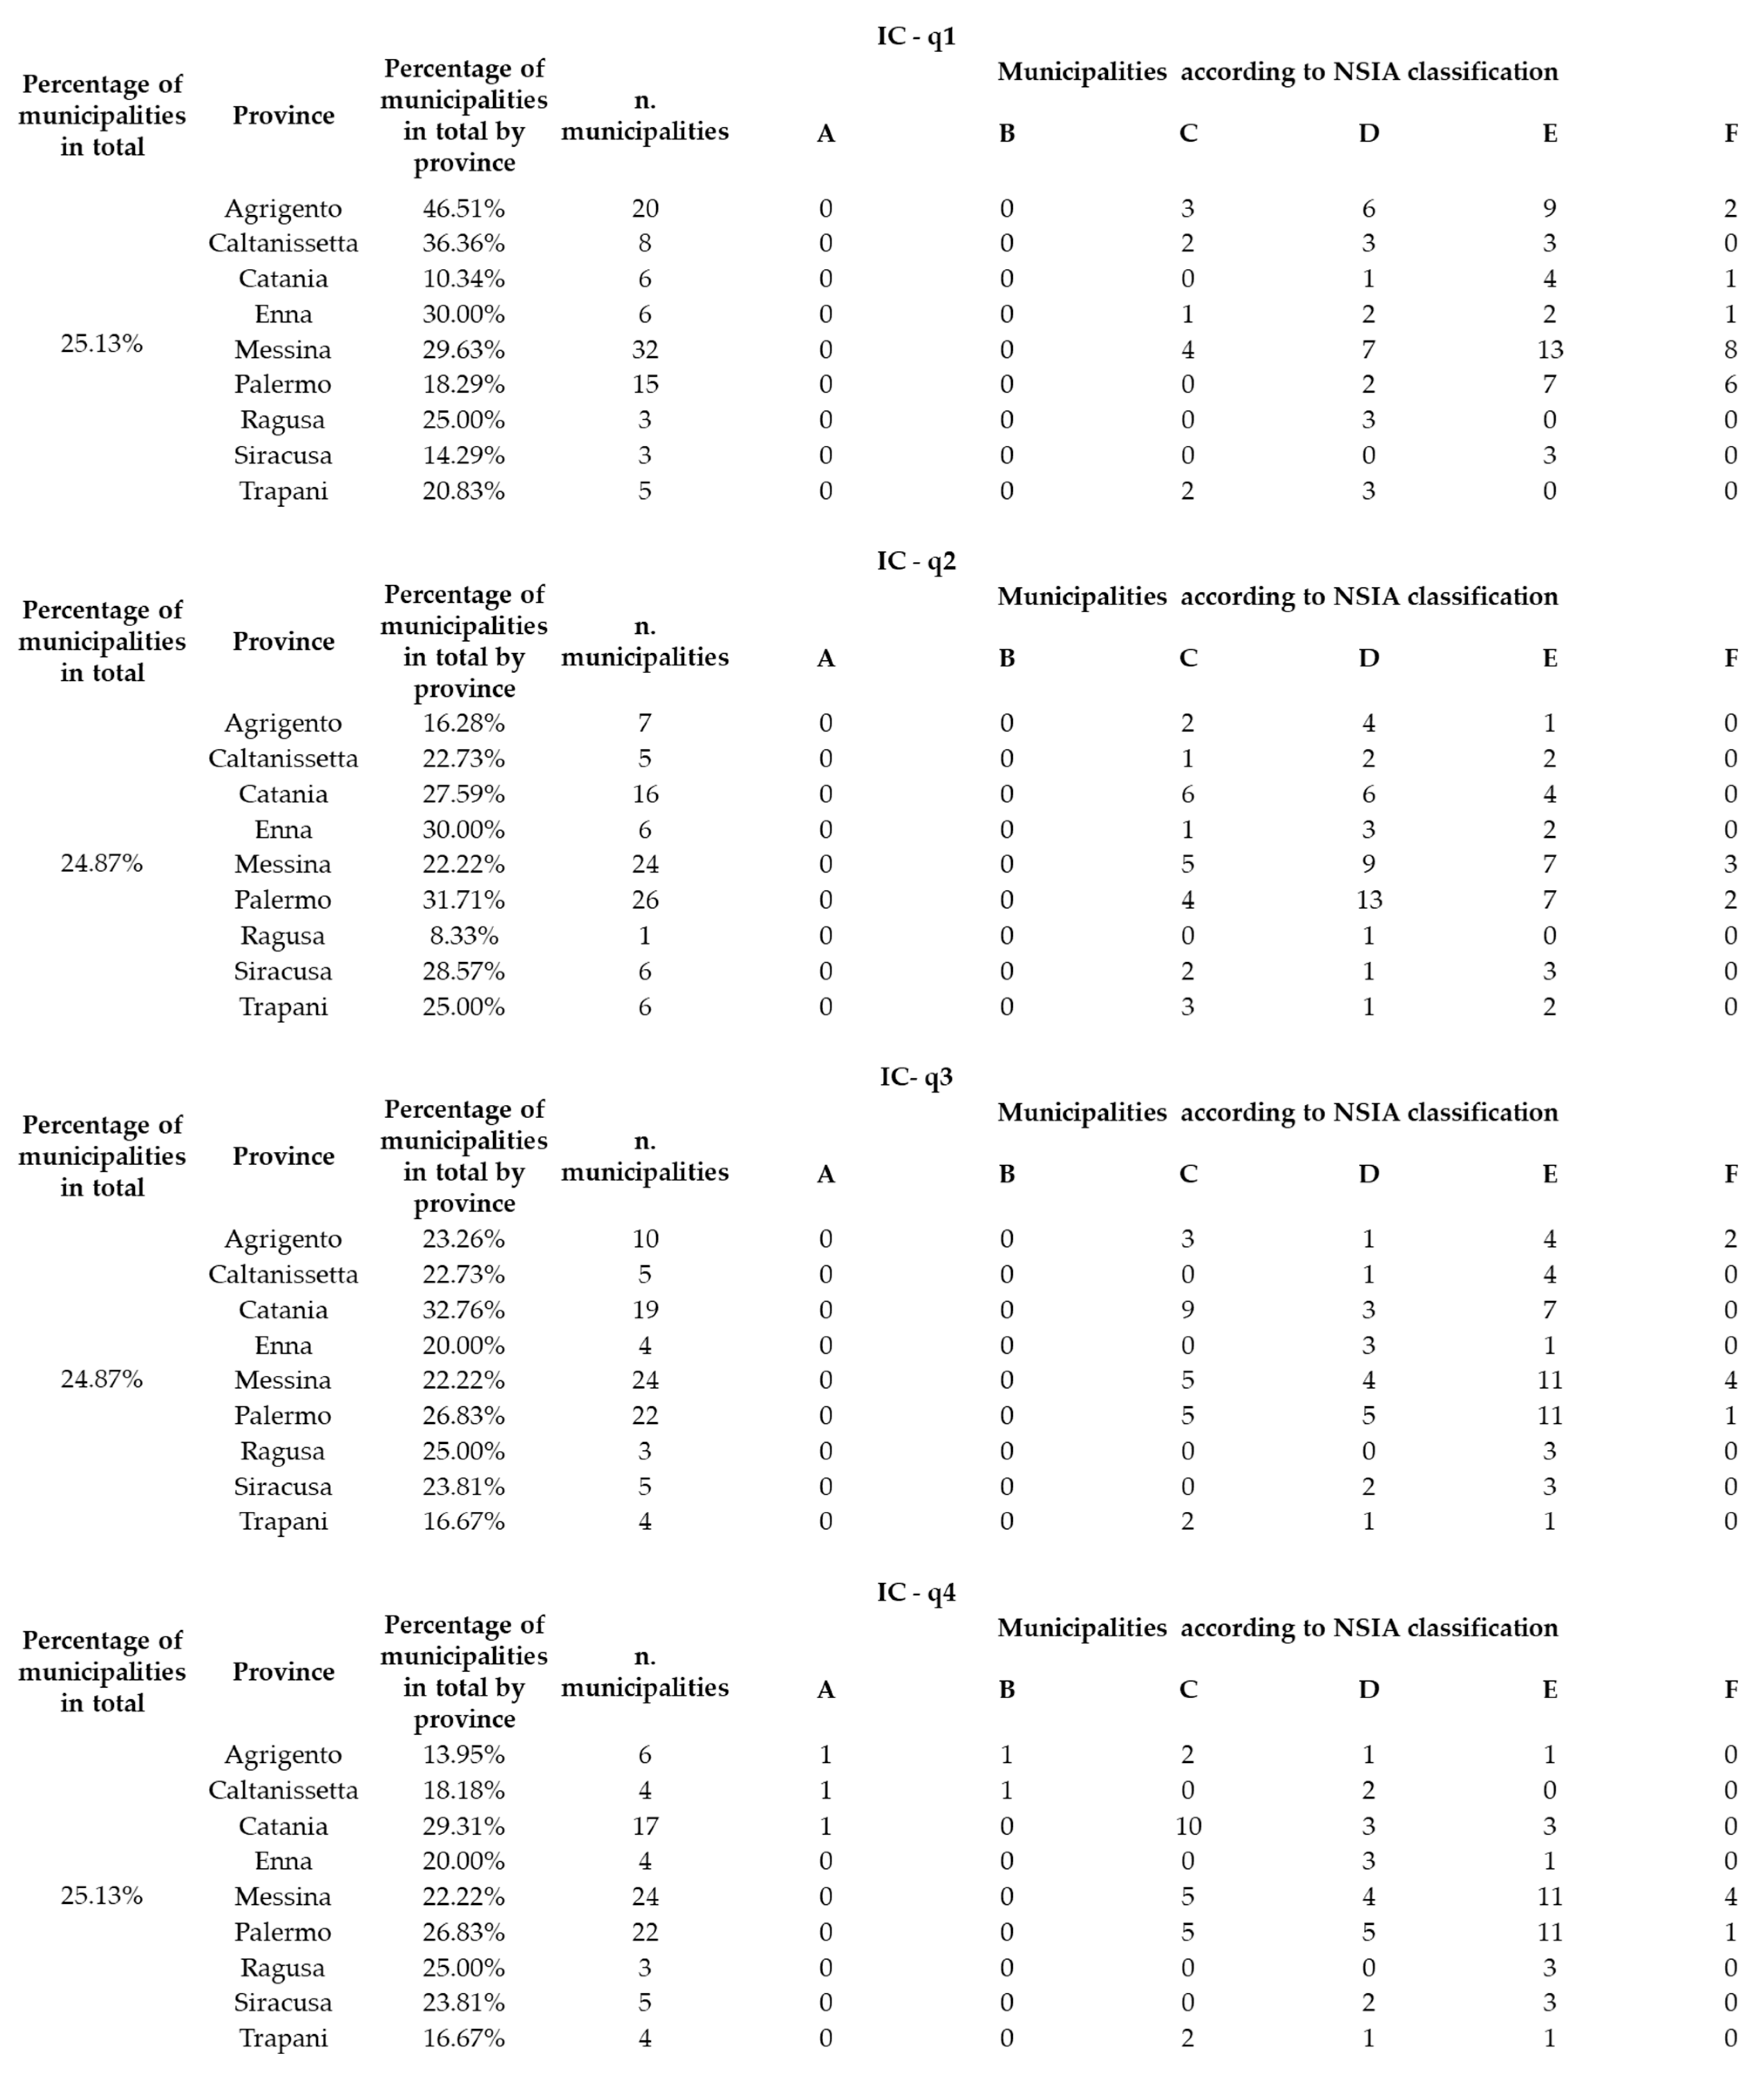
Quartile analysis revealed that a high proportion of municipalities in the province of Messina fell into the first quartile, while a high proportion of municipalities in the province of Ragusa fell into the fourth quartile (see Figure A6 in Appendix B).
In the first case, these are economically vulnerable areas characterised by strong spatial and non-spatial marginality.
In second case, the growth of tourism in recent years, partly due to the UNESCO site “The late Baroque towns of the Val di Noto”, has sustained these areas, as has the development of agriculture.
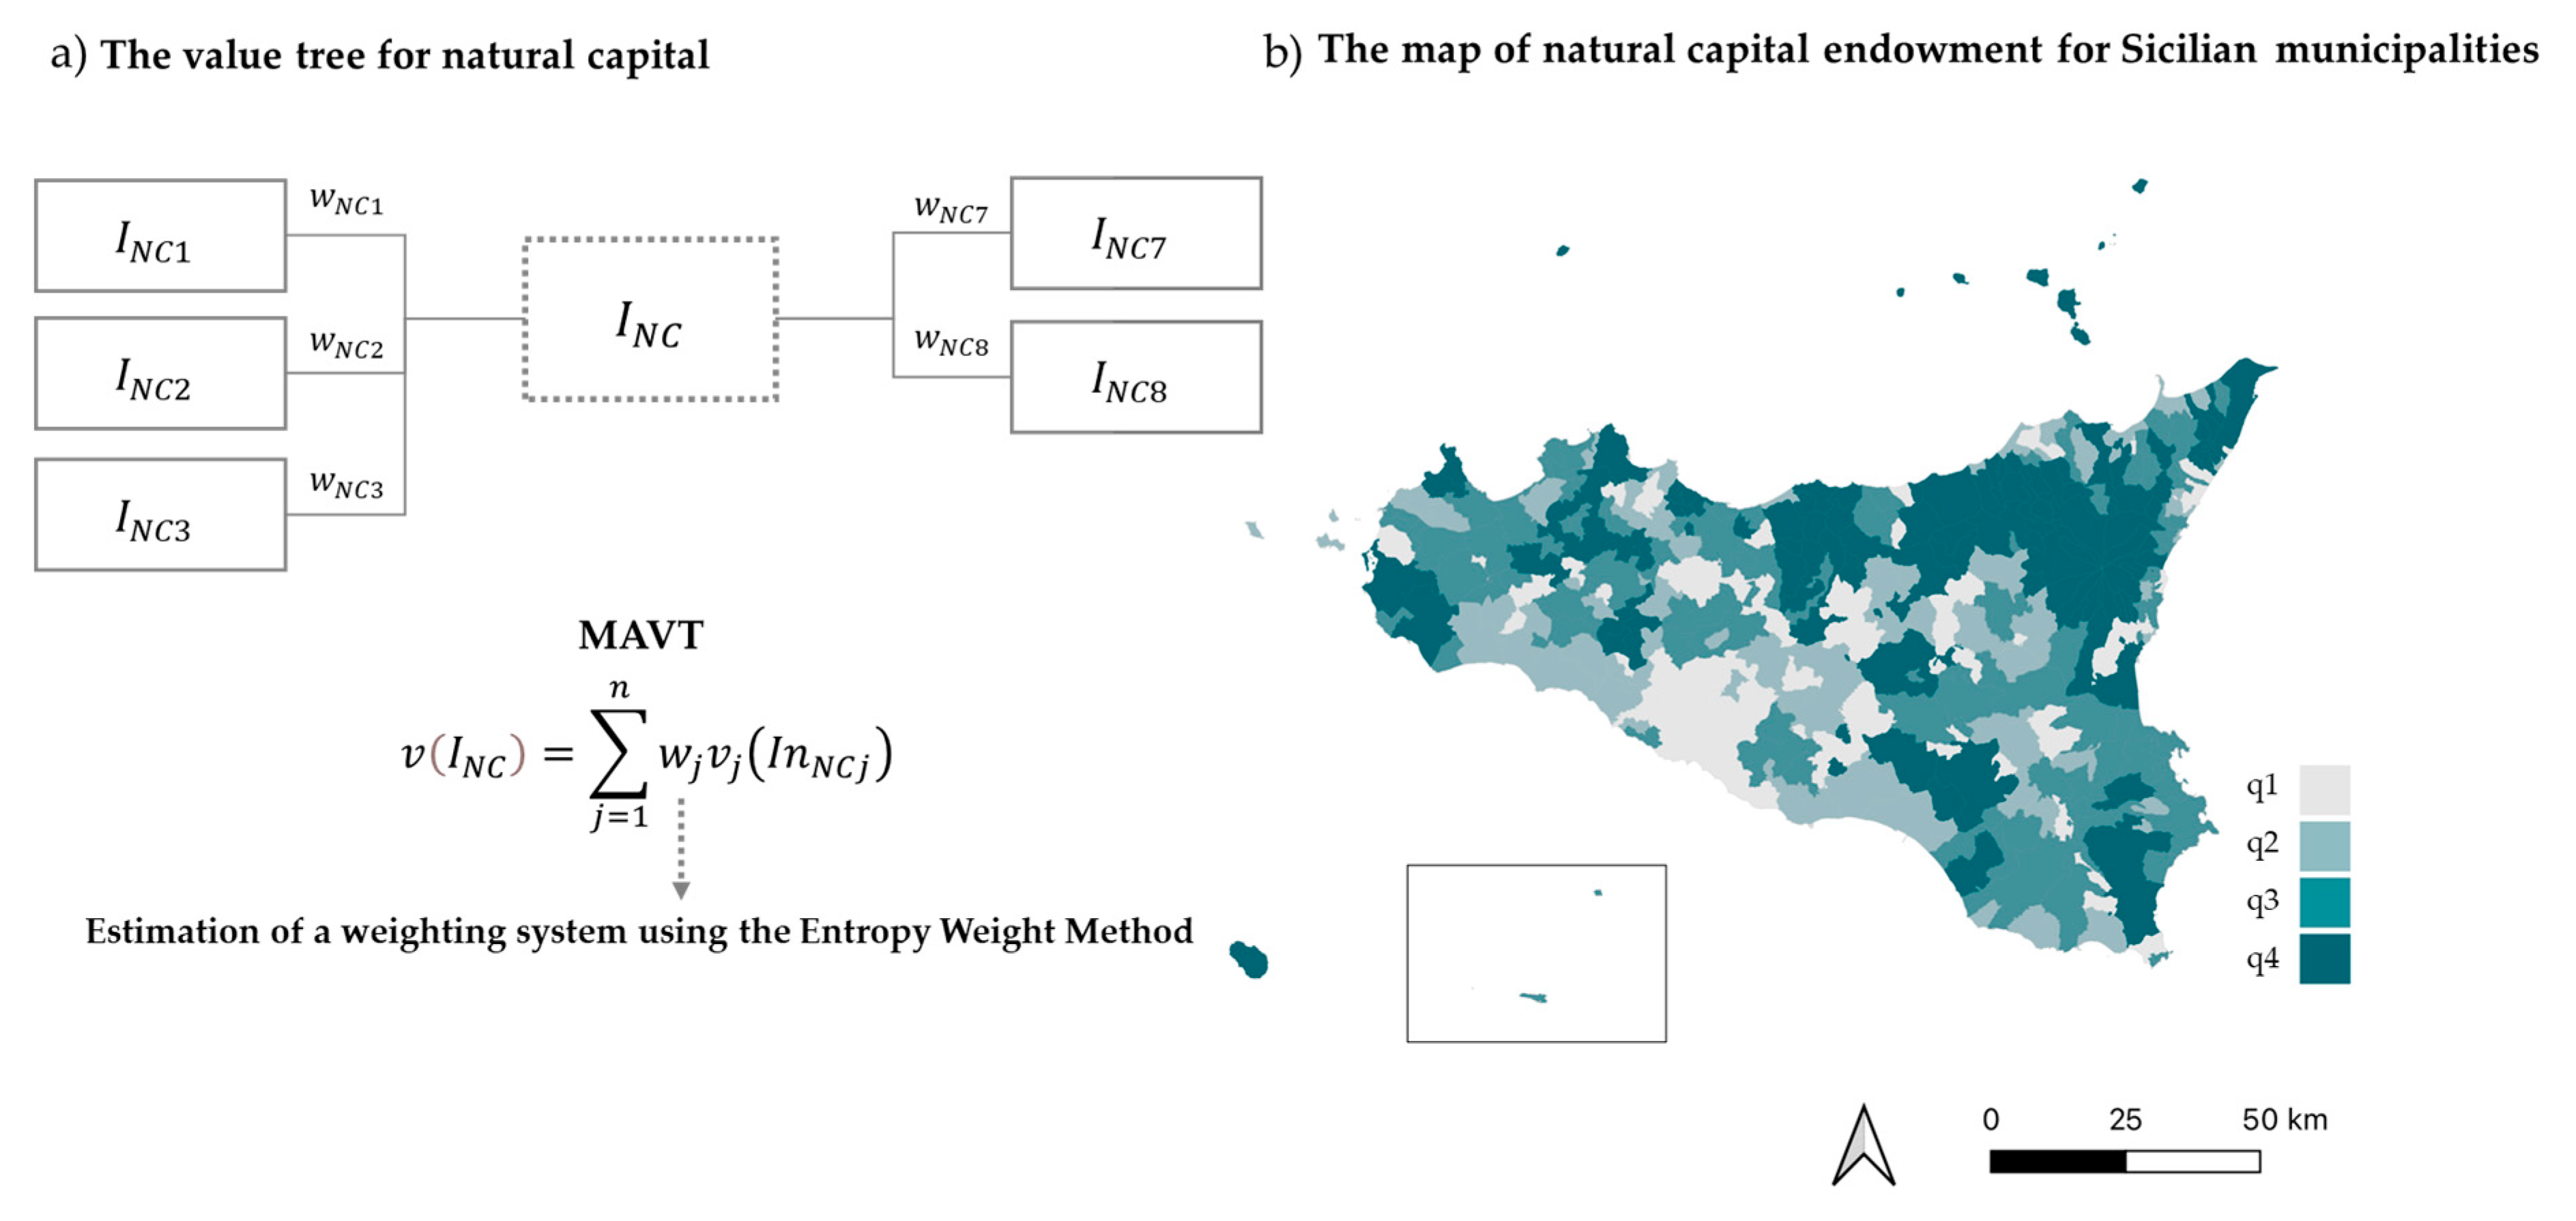
The aggregate natural capital index was estimated based on the value tree shown in Figure A7a (see Appendix B).
Figure A7b (see Appendix B) illustrates the level of natural capital endowment in different Sicilian areas and municipalities.
It highlights areas of high or medium-high natural capital endowment in the east and west of the island, a medium-high endowment in the centre, and a medium or low endowment in the south.
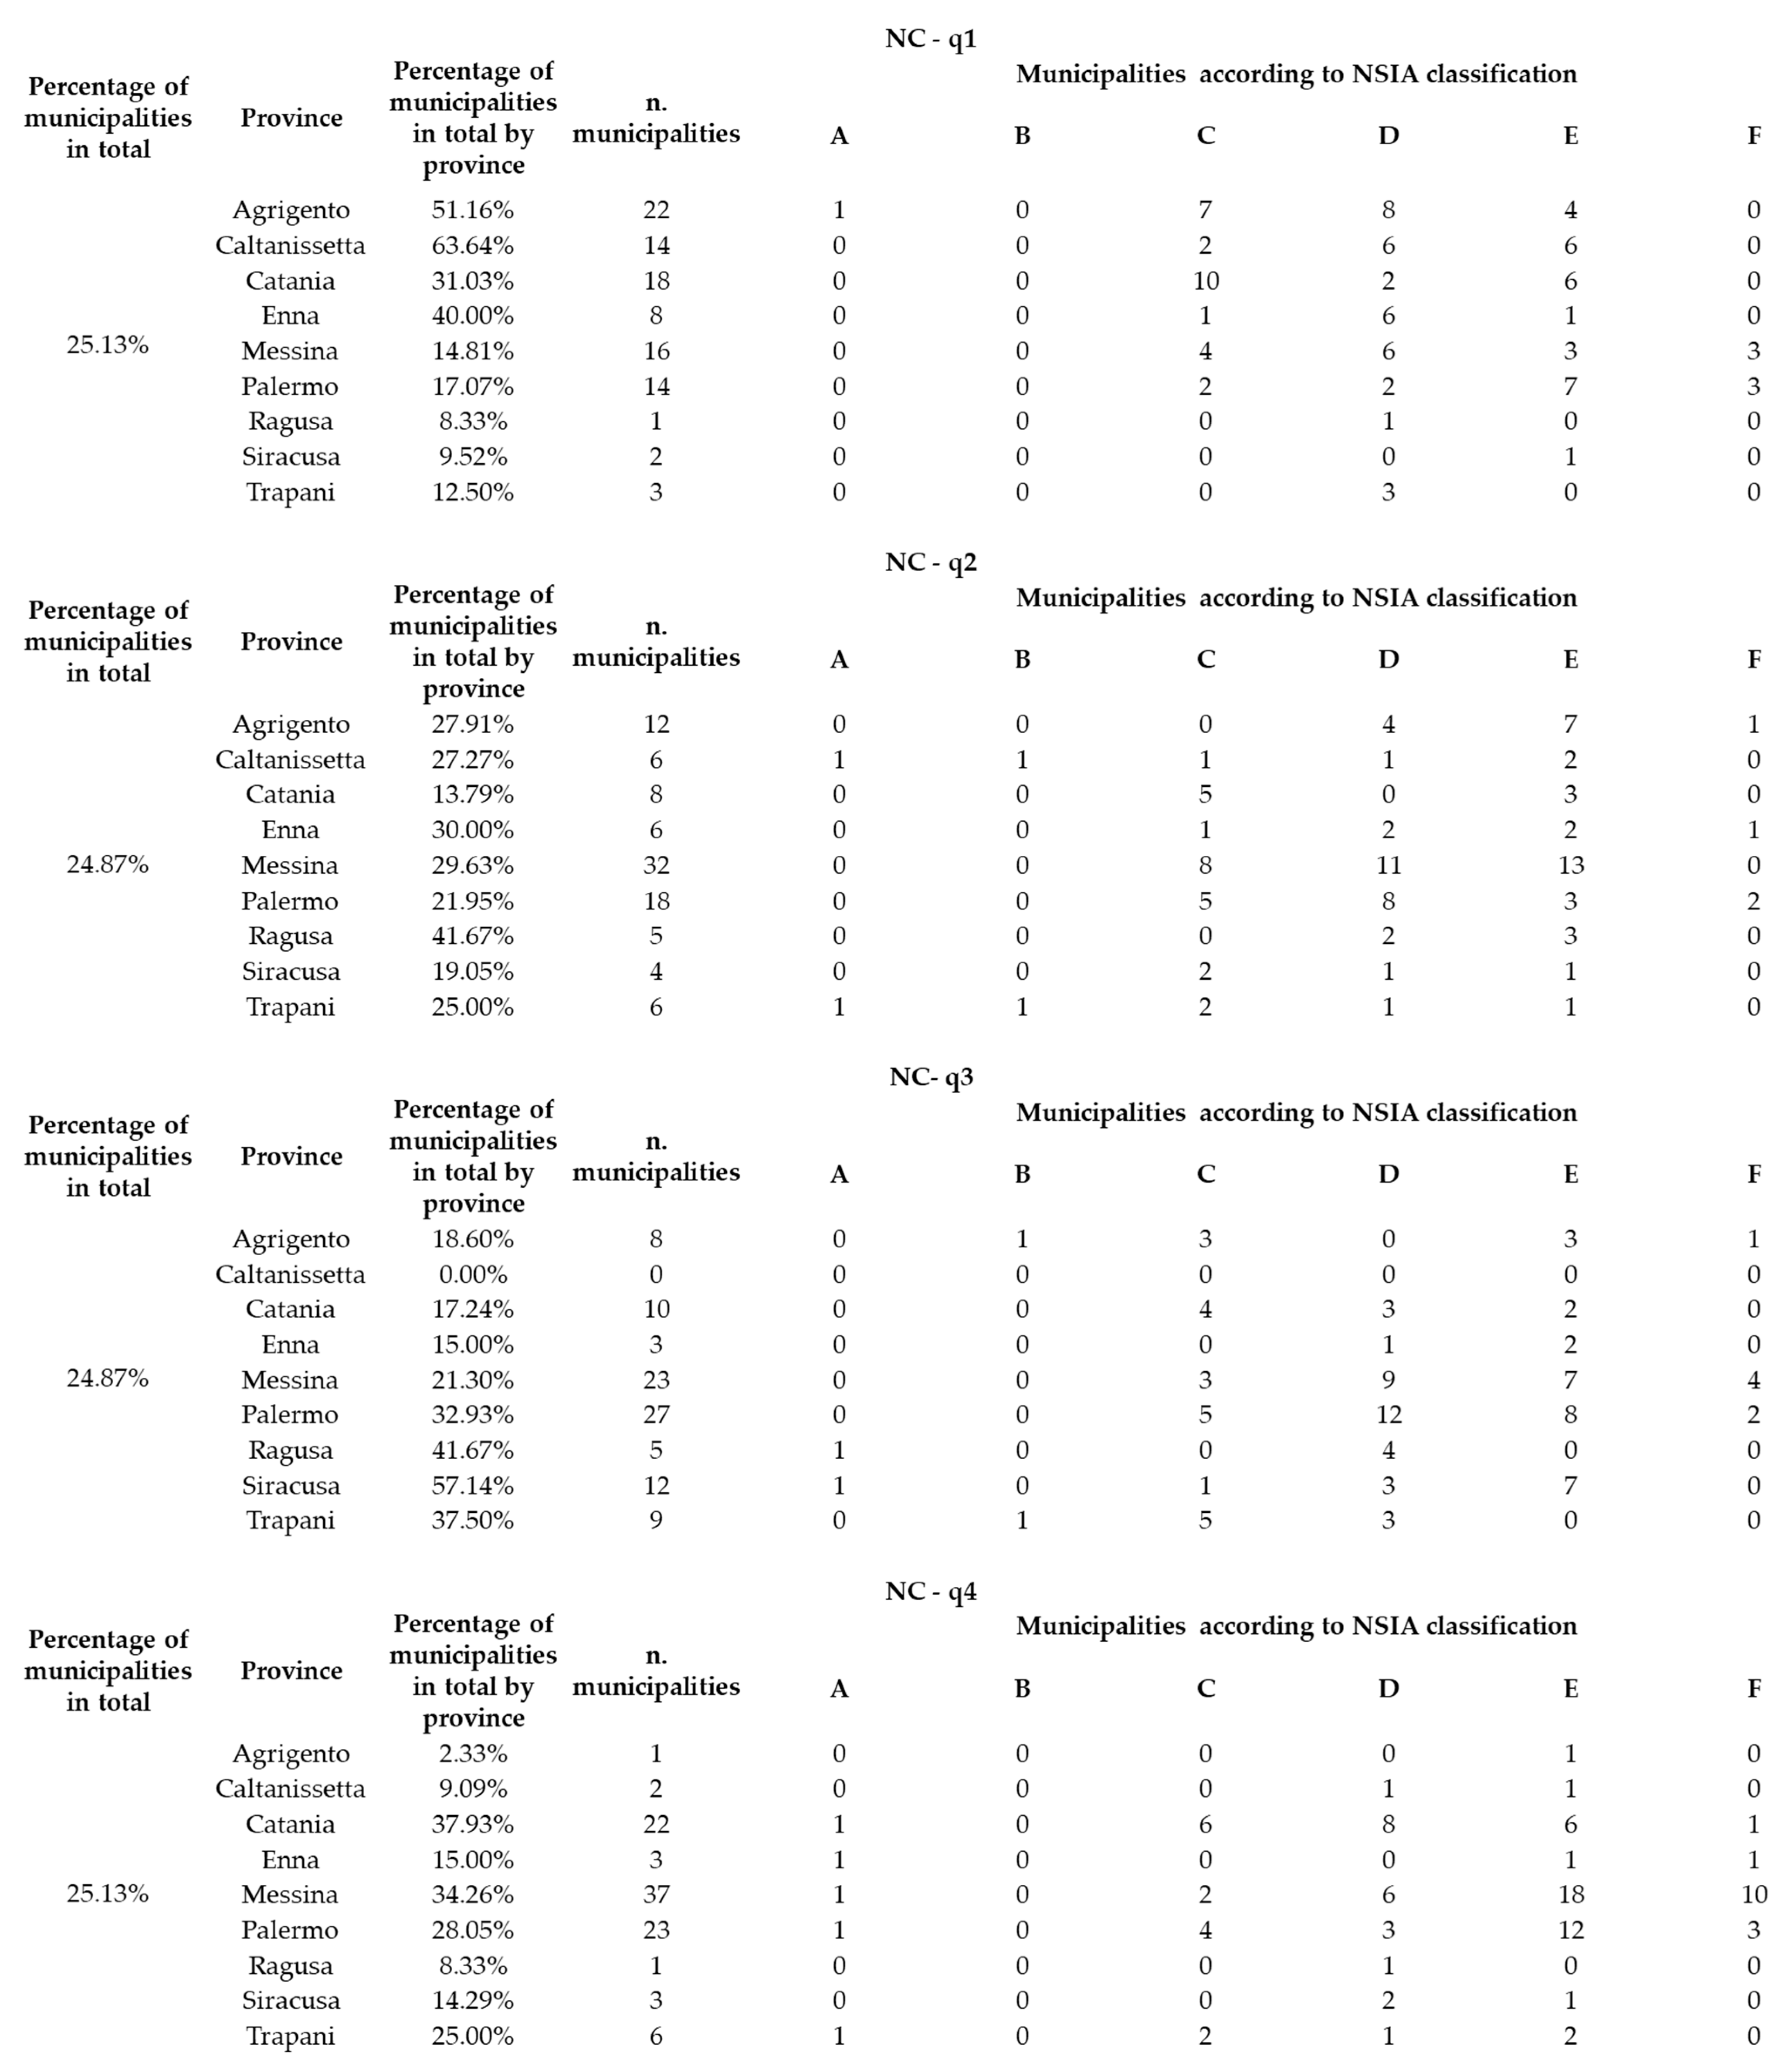
Quartile analysis revealed that a high proportion of municipalities in the province of Caltanissetta fall within the first quartile, while a high proportion of municipalities in the province of Syracuse fall within the fourth quartile. In the latter case, this is due to the presence of several nature reserves spanning multiple municipalities in the province of Syracuse (see Figure A8 in Appendix B).
The aggregate index for environmental capital was estimated based on the value tree shown in Figure A9a (see Appendix B).
Figure A9b (see Appendix B) shows a map of environmental capital endowment.
It illustrates the level in different Sicilian areas and municipalities.
The aggregate environmental capital index provides an integrated measure of the main environmental risks. It takes into account seismic, flooding, landslides, hydraulic s and land consumption risks. This index is characterised by a polarity opposite of that of all other indices.
The environmental capital index map shows which areas of Sicily are most and least exposed to risk. The most exposed areas are in the north and east of the island, while the least exposed areas are in central-south and west.
Quartile analysis shows that a high proportion percentage of municipalities in the province of Enna fall into the first quartile, i.e., they are characterised by low environmental risk (see Figure A10 in Appendix B).
Figure A10 in Appendix B shows that one-third of the municipalities in the provinces of Catania, Palermo and Ragusa fall into the fourth quartile, indicating high environmental risk.
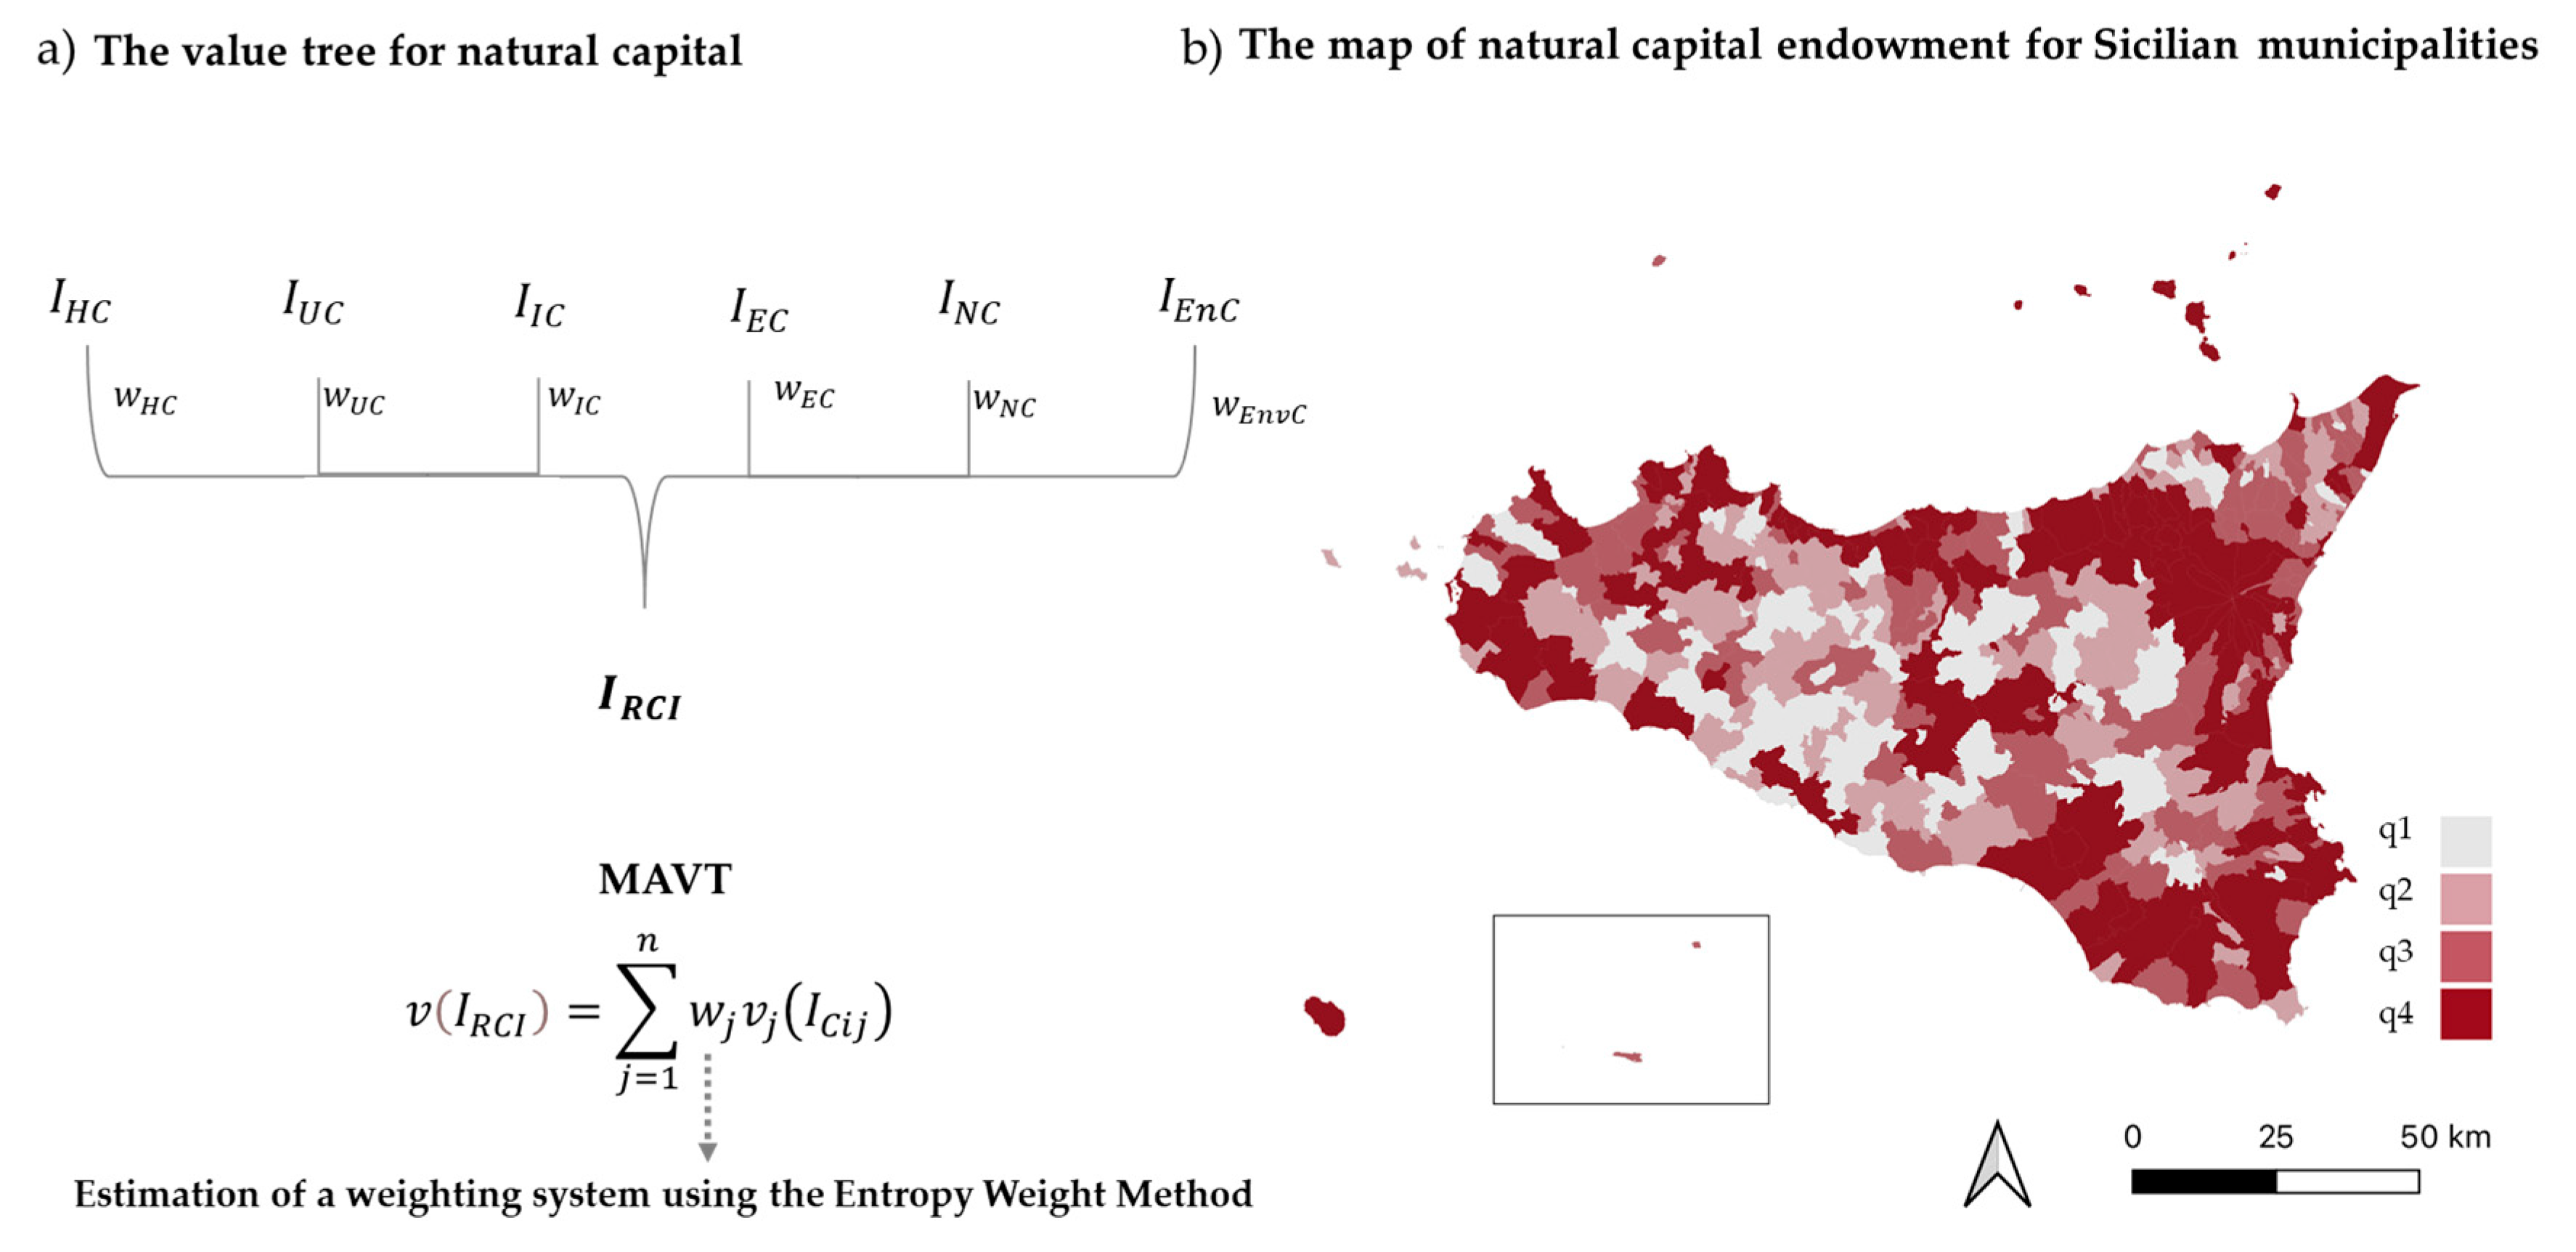
The Reaction Capacity Index ( I R C I ) was estimated using the final level of the hierarchical model structure presented in the “Methods” section (Section 4) and illustrated in Figure 10a.
The I R C I provides an aggregate measure of territorial capital endowment for various Sicilian municipalities.
It can support decision-makers by helping them to identify areas of weakest and measure the territorial rebalancing effects of ex-ante and ex-post cohesion policy strategies.
It can also help to identify of new strategies and financing packages that are tailored to specific contexts and encourage a medium and long-term vision for territorial development.
As can be seen in Figure 10b the level of territorial capital endowment is generally higher in coastal areas, especially in eastern Sicily.
The provincial of Enna, particularly the municipality of the same name, is the only inner area a high level of territorial capital. In general, inner areas are characterised by low to medium levels of territorial capital.
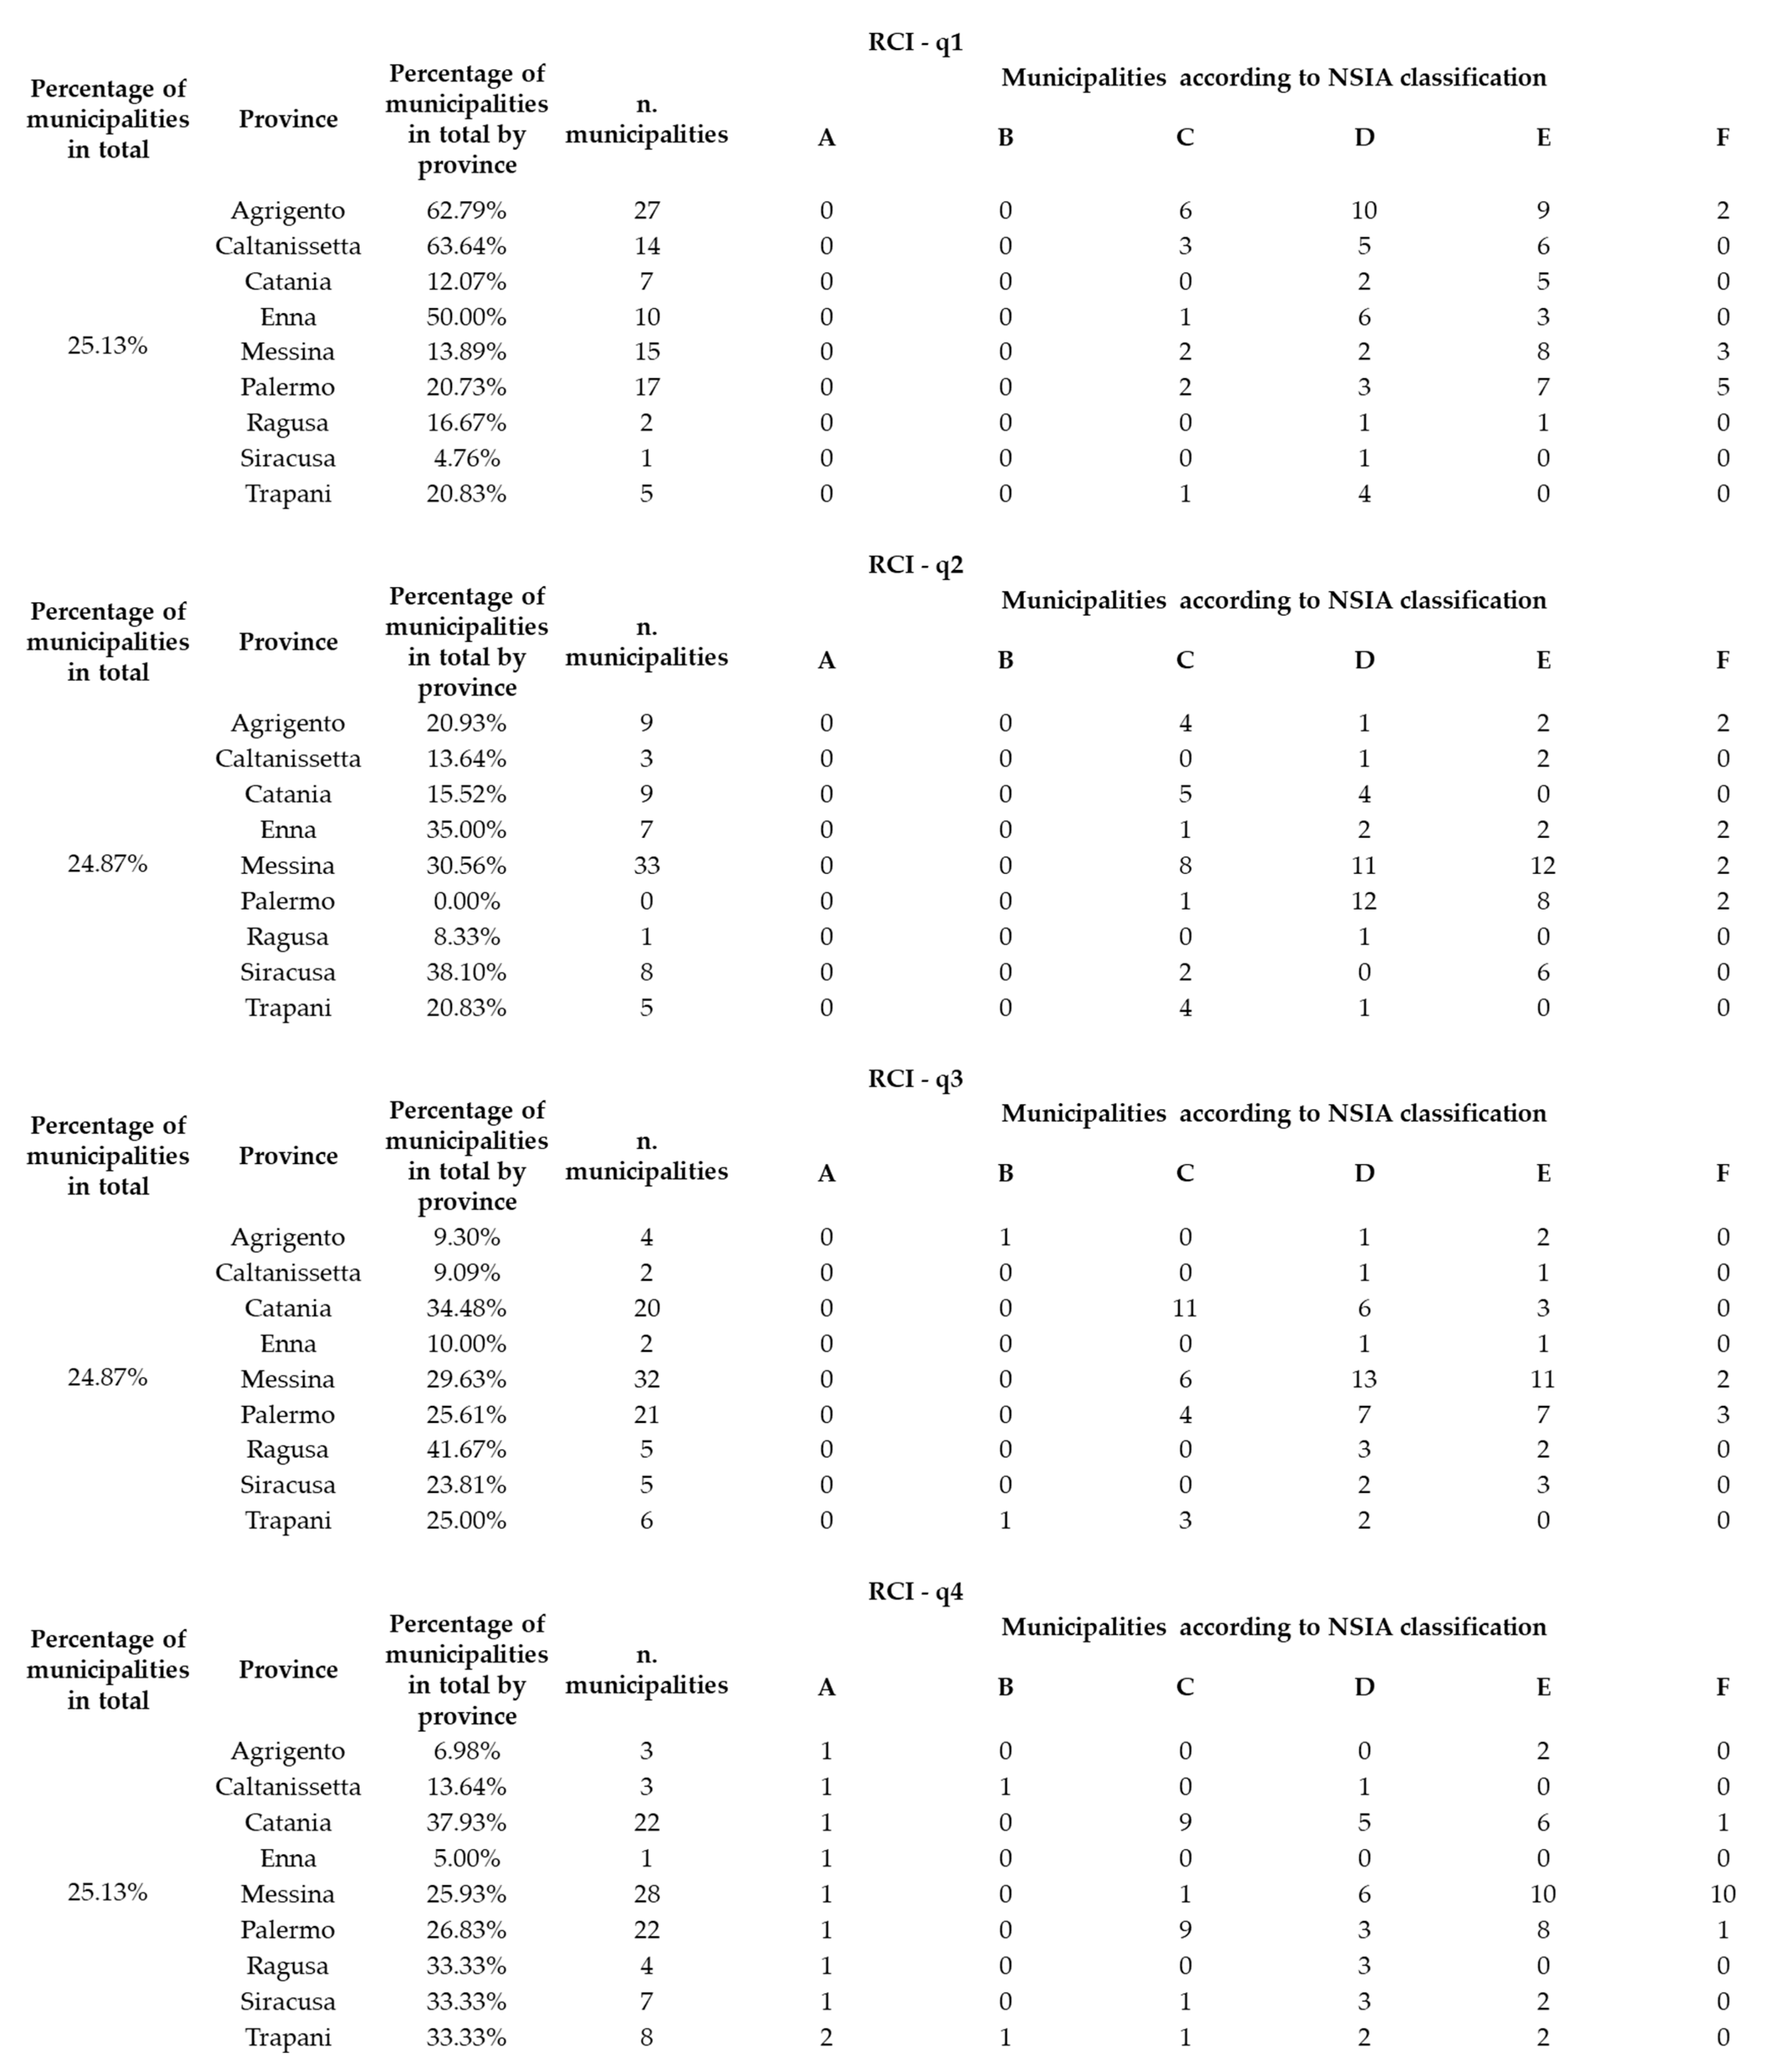
As shown in (see Figure 11), the quartile analysis indicates that a high proportion of municipalities in the provinces of Agrigento, Caltanissetta and Enna are in the first quartile. This highlights the low recovery capacity of these areas, which are generally weaker.
In this case, a strategy aimed at revitalising and enhancing these areas would require significant investment. By contrast, one third of the municipalities in the provinces of Catania, Ragusa, Syracuse and Trapani fall into the fourth quartile, indicating a high level of territorial capital.
Therefore, a strategy aimed at strengthening these municipalities would require less investment, given their greater capacity to react.
I R C I mapping confirmed the traditional contrast between coastal and inner areas. Although inner areas have a low I R C I level, they have good levels of other forms of capital, such as urban and natural capital, as highlighted in the previous paragraphs.
However, these areas are undervalued, primarily due to the low level of infrastructure and economic capital.
The cognitive model, which is based on the estimation of aggregate indices for the six forms of territorial capital and the I R C I , has shown that classifying inner areas according to the NSIA based on the criterion of peripherality in relation to the municipal pole does not provide an exhaustive classification for characterising the different municipalities.
Estimating the indices showed that areas classified as F-Ultra-peripheral or E-Peripheral can have higher levels of specific forms of territorial capital or I R C I than areas in other classes. This highlights that the peripherality criterion fails to capture real differences between areas.

6. Discussion

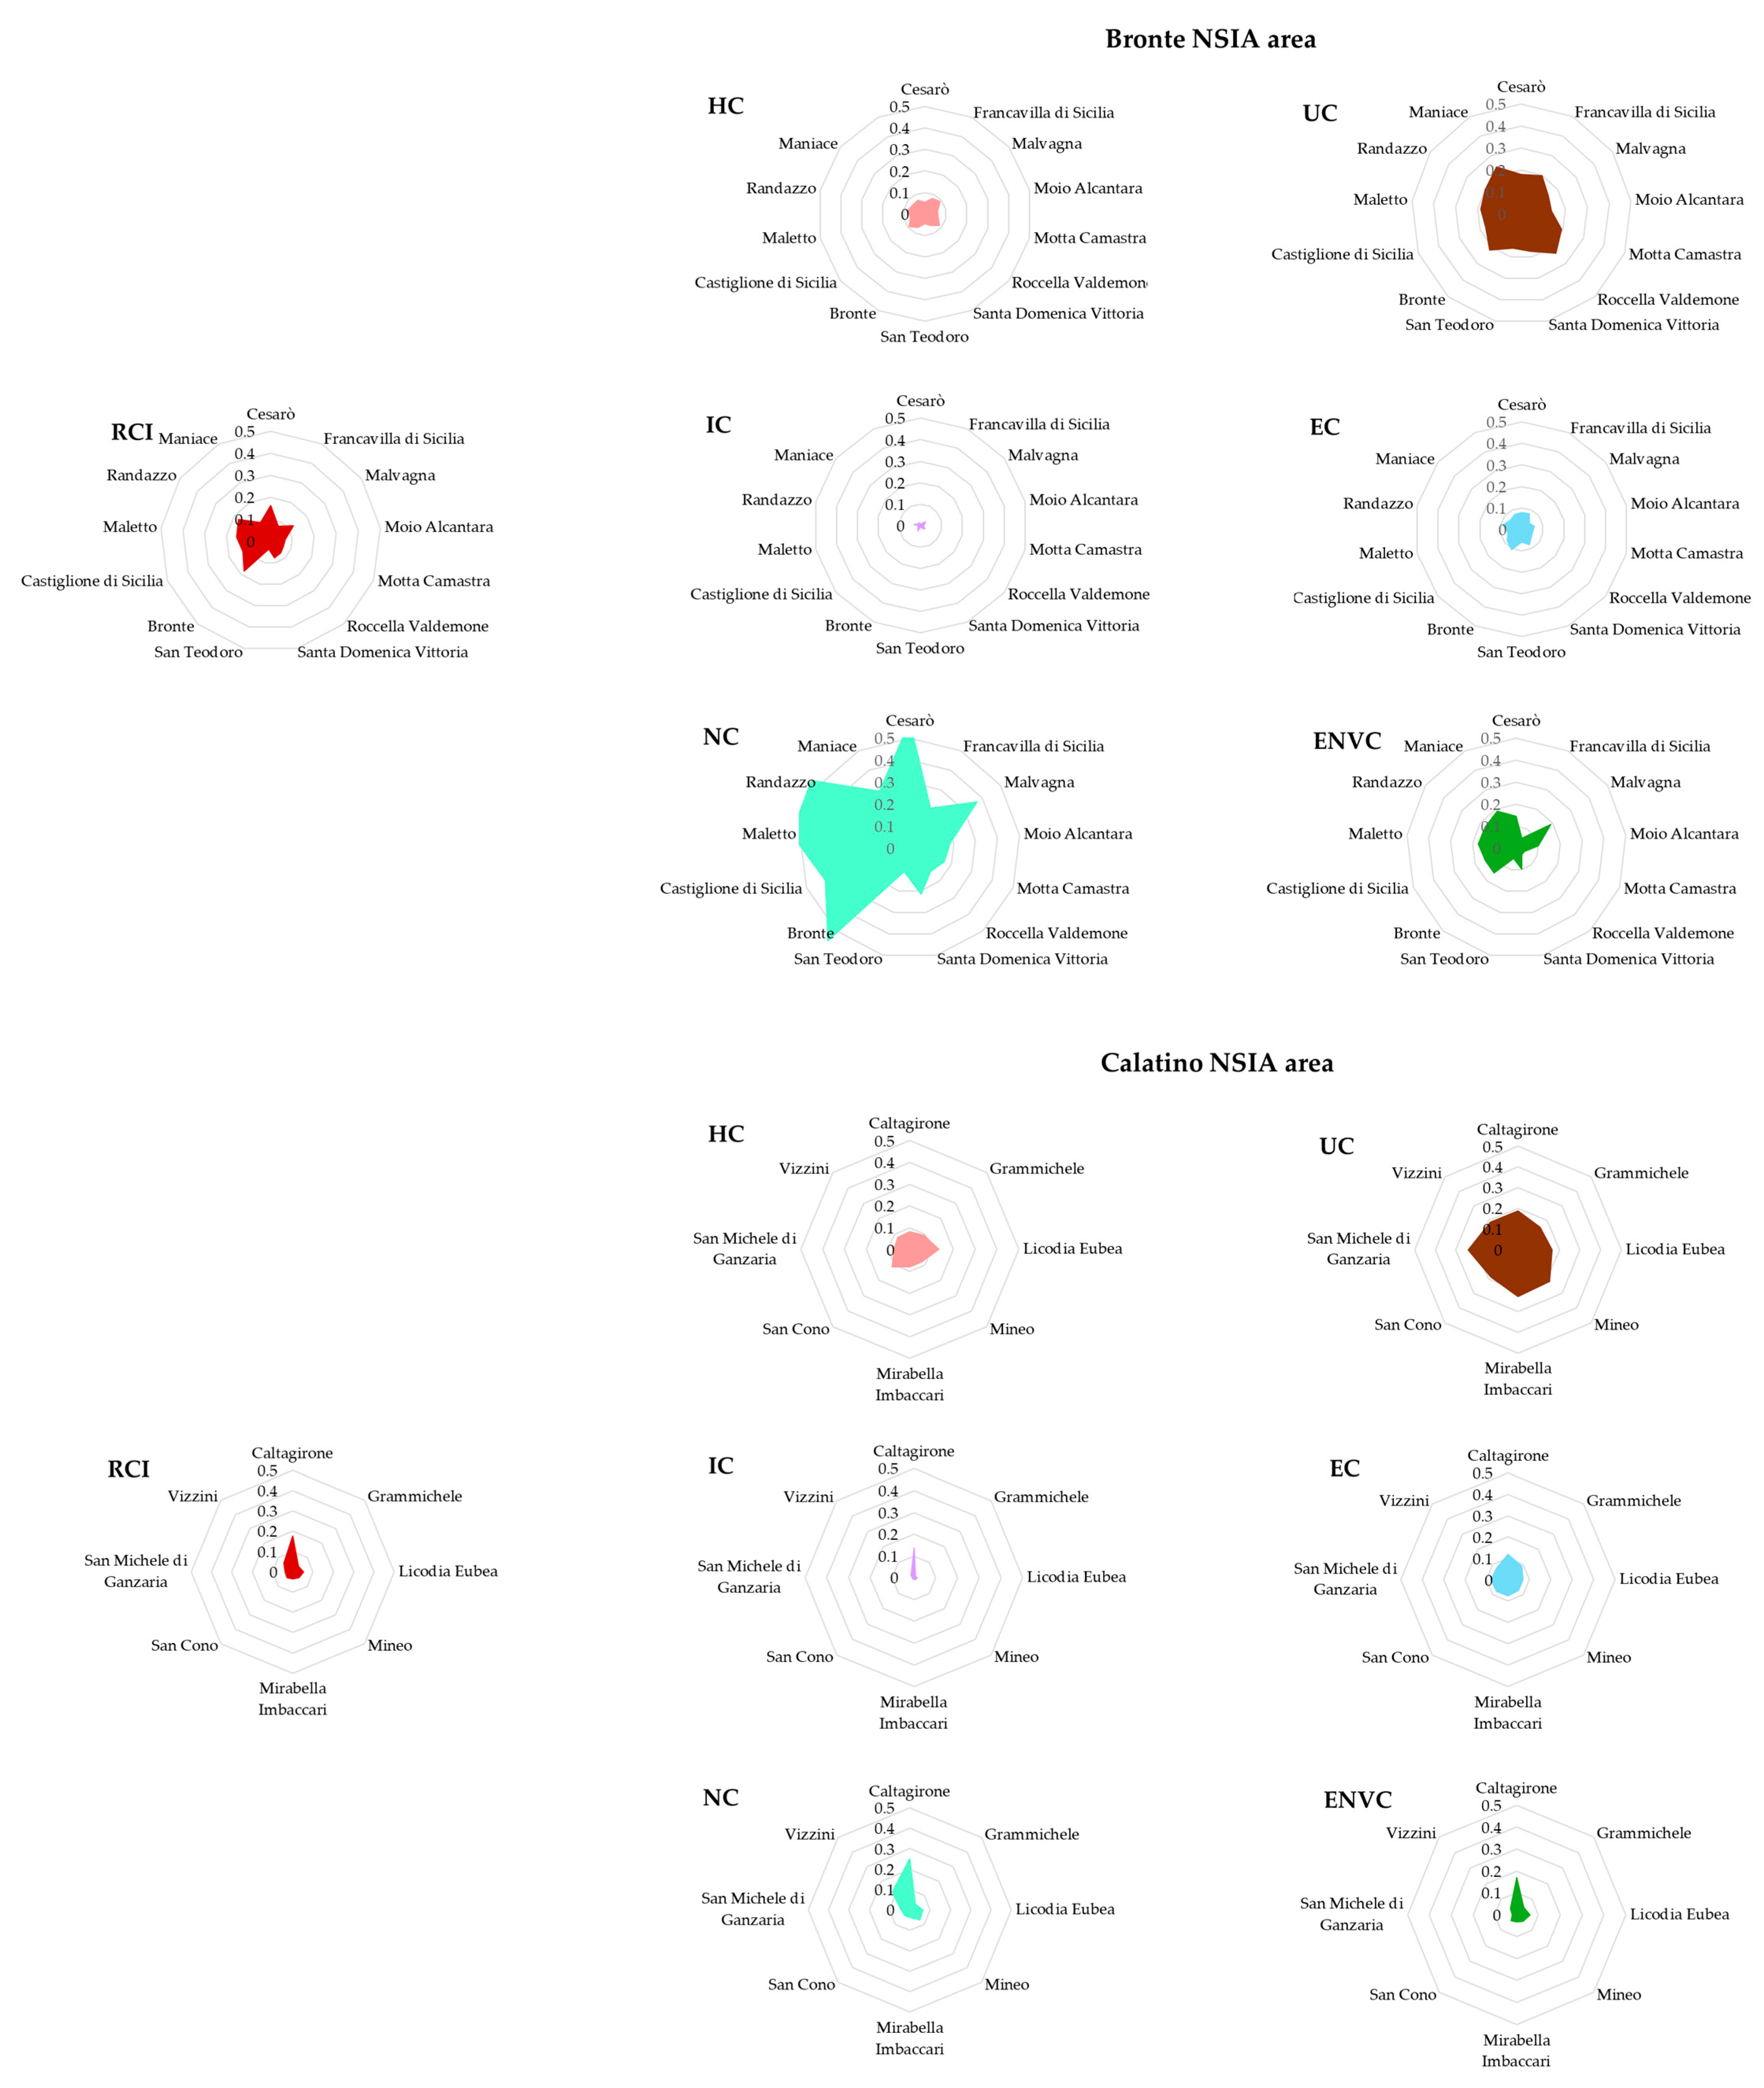
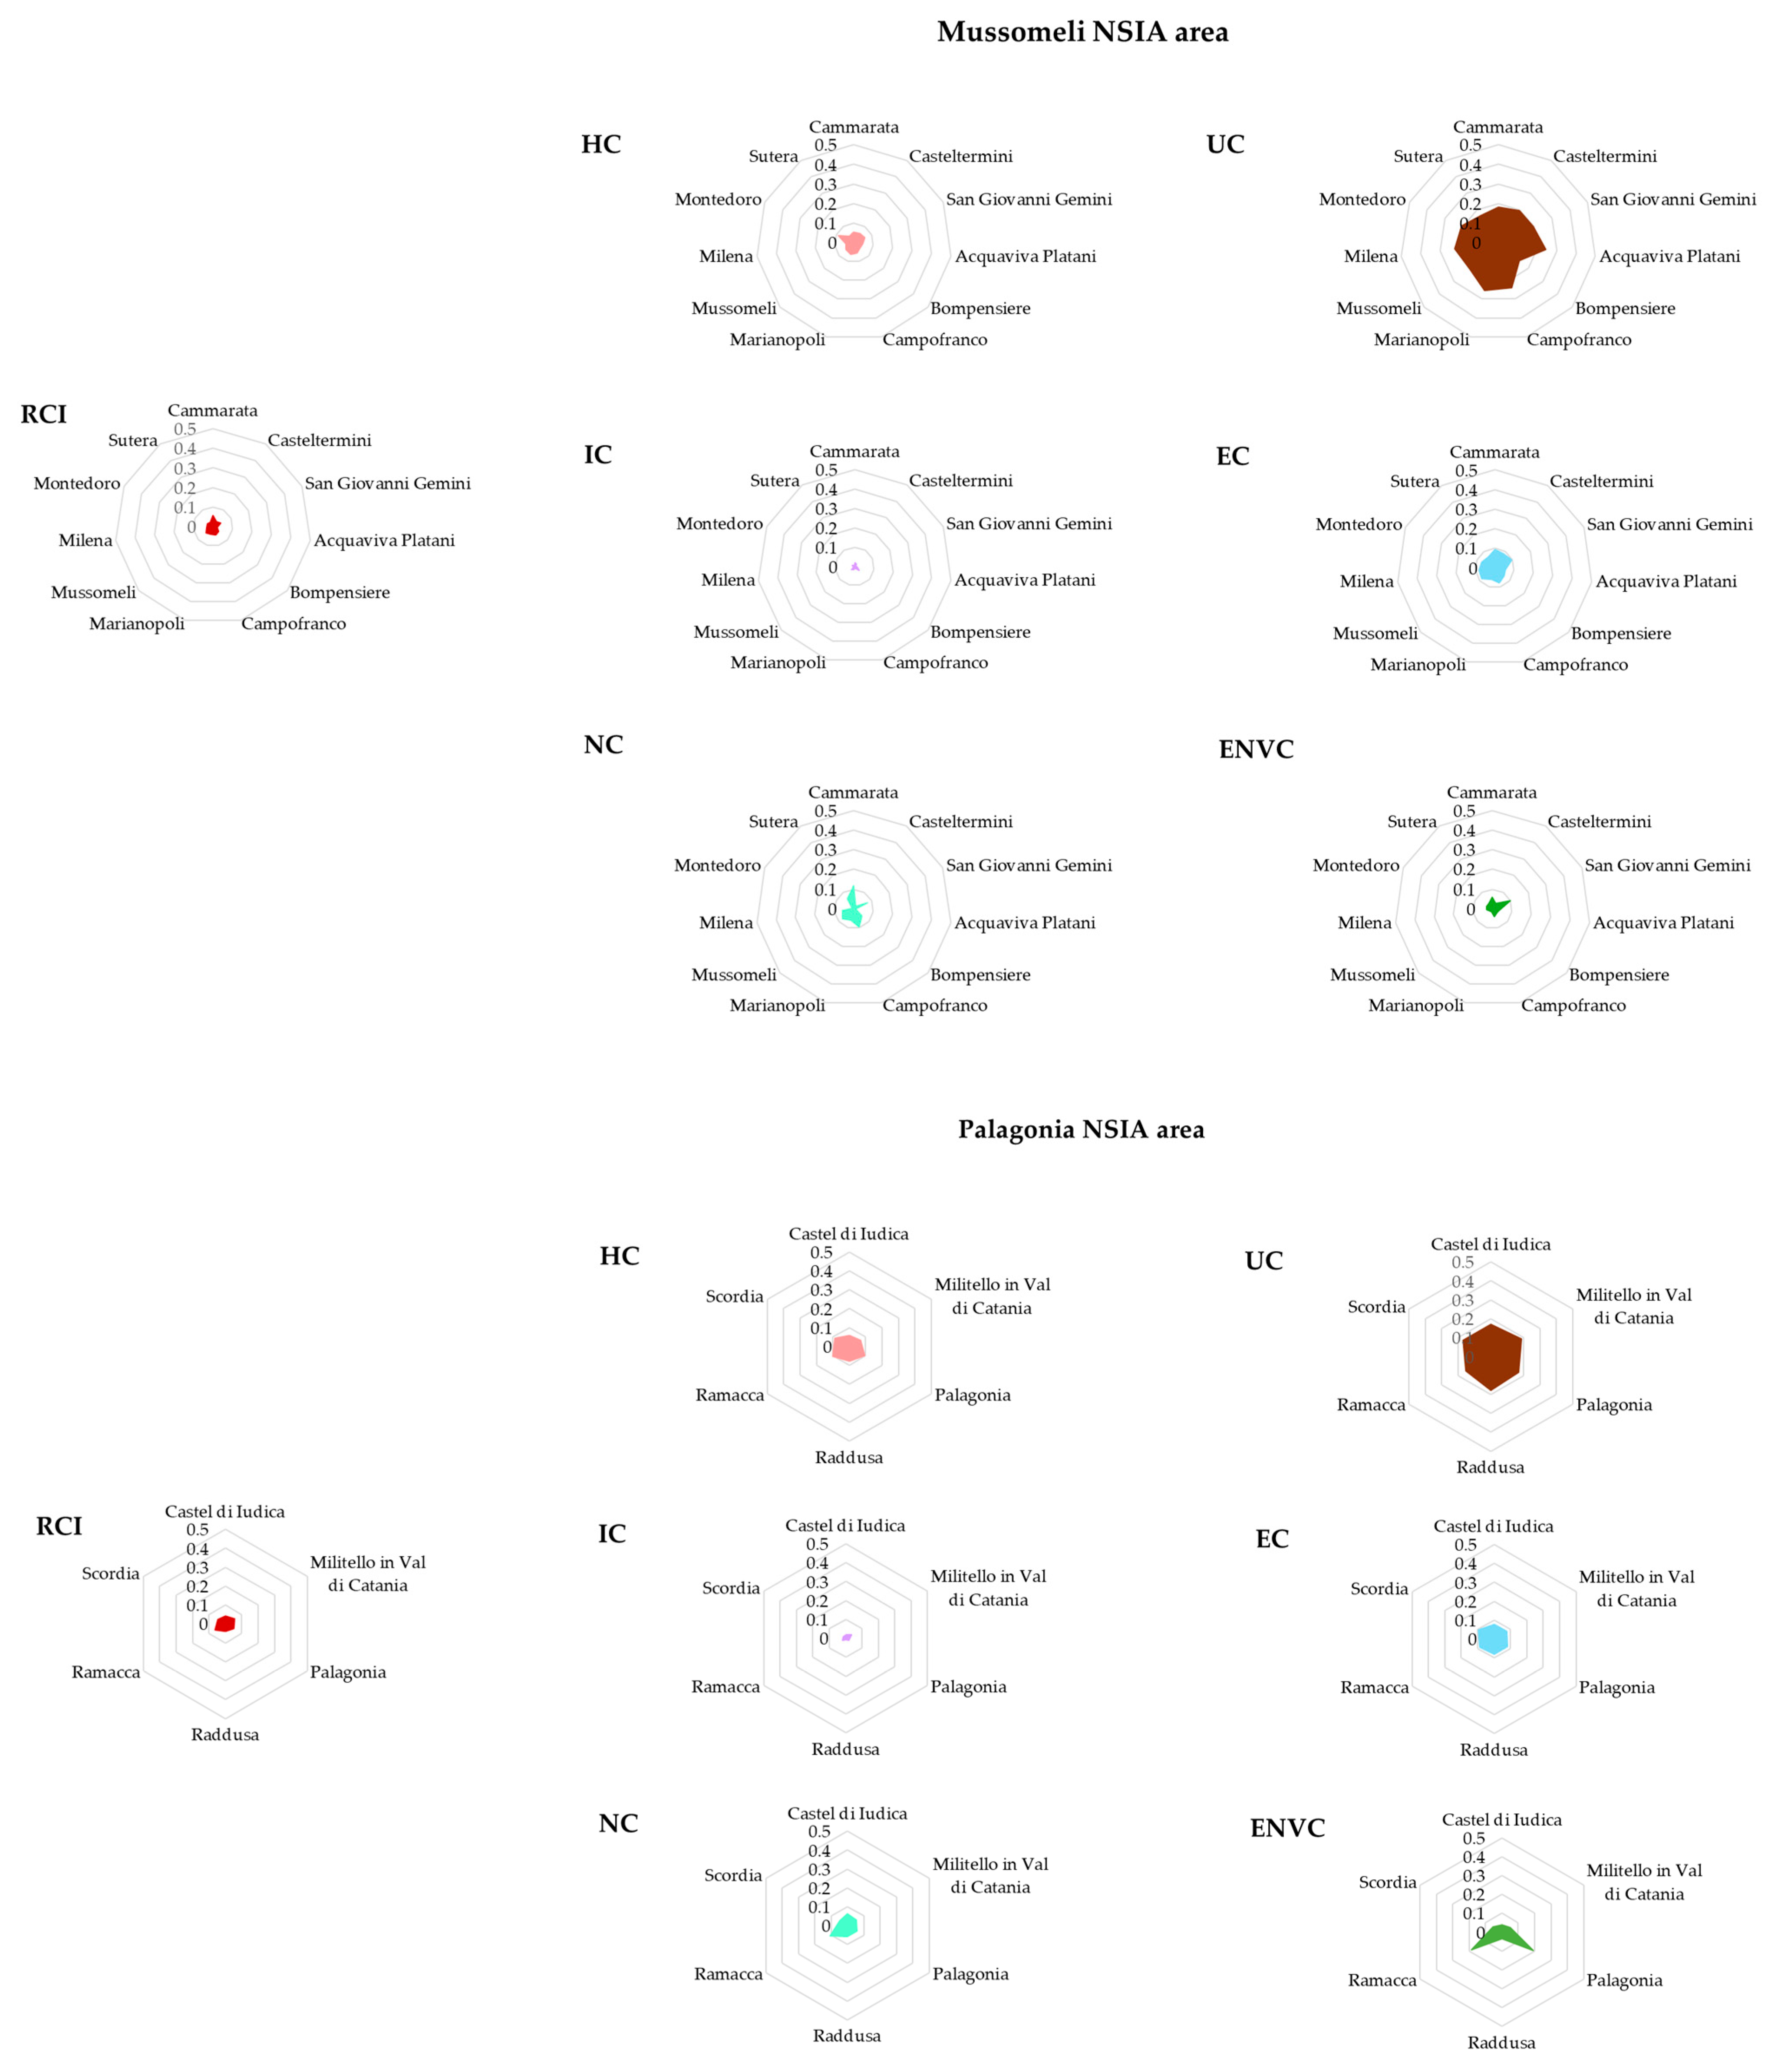
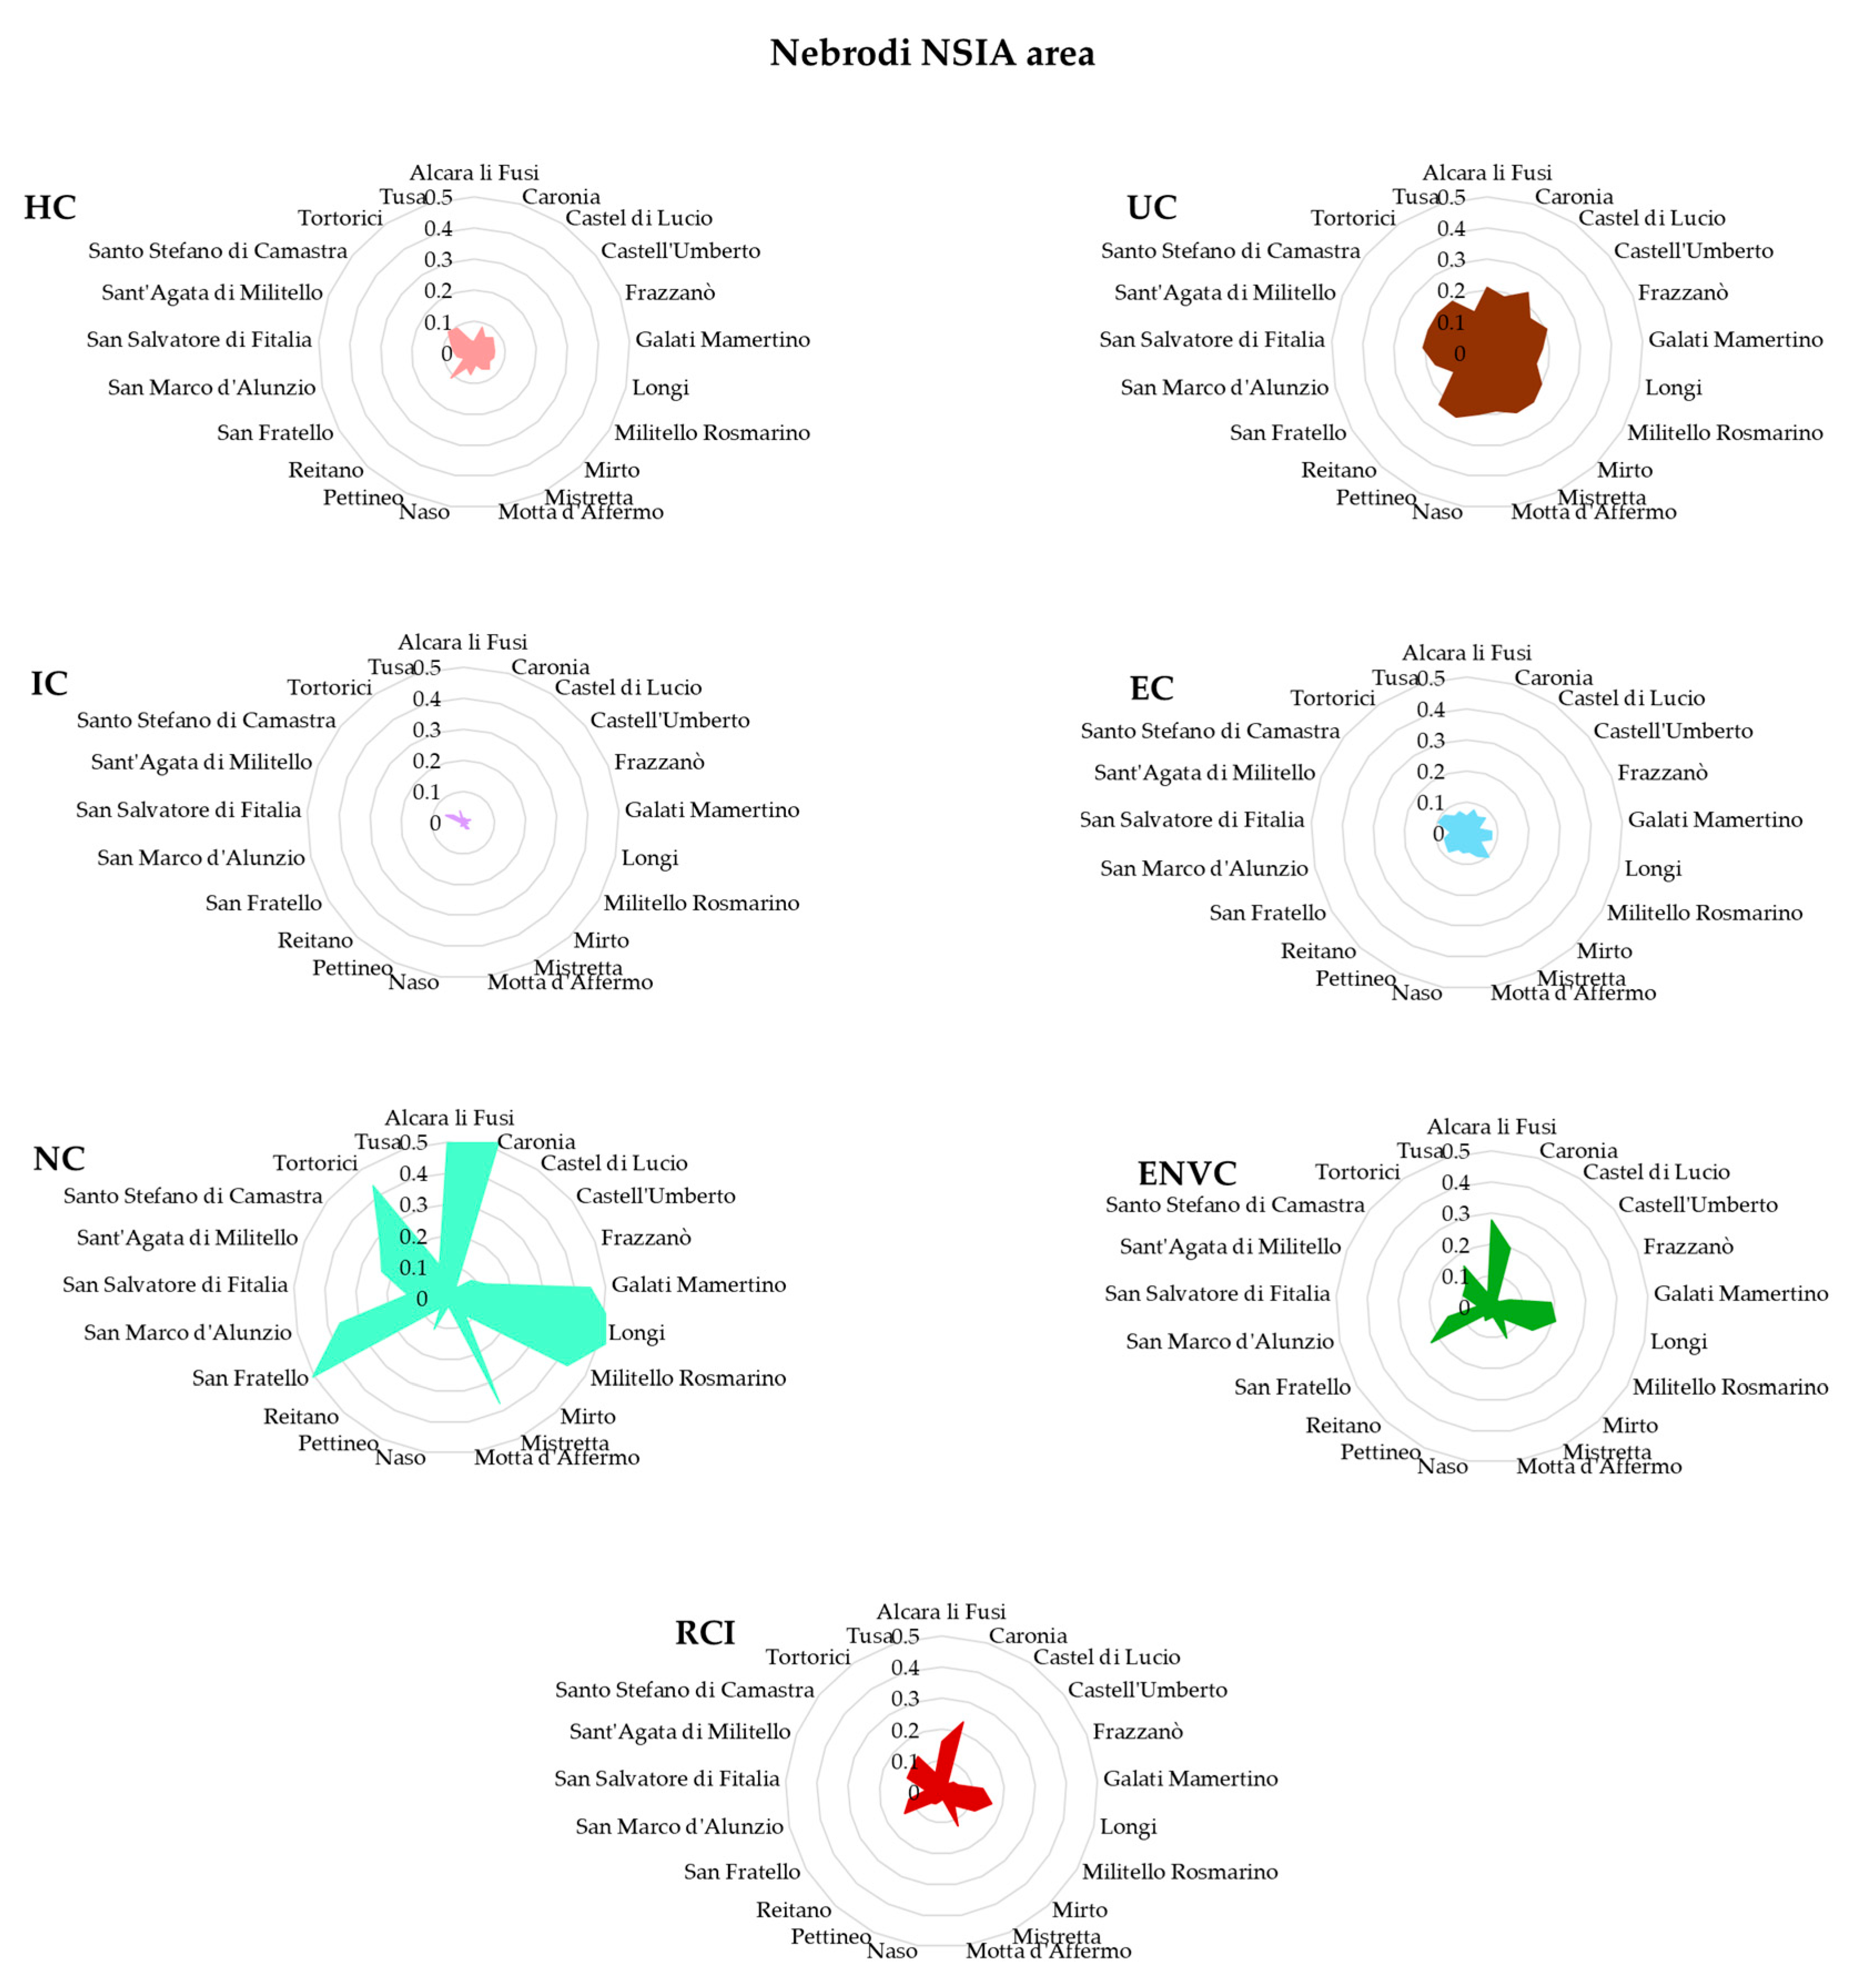
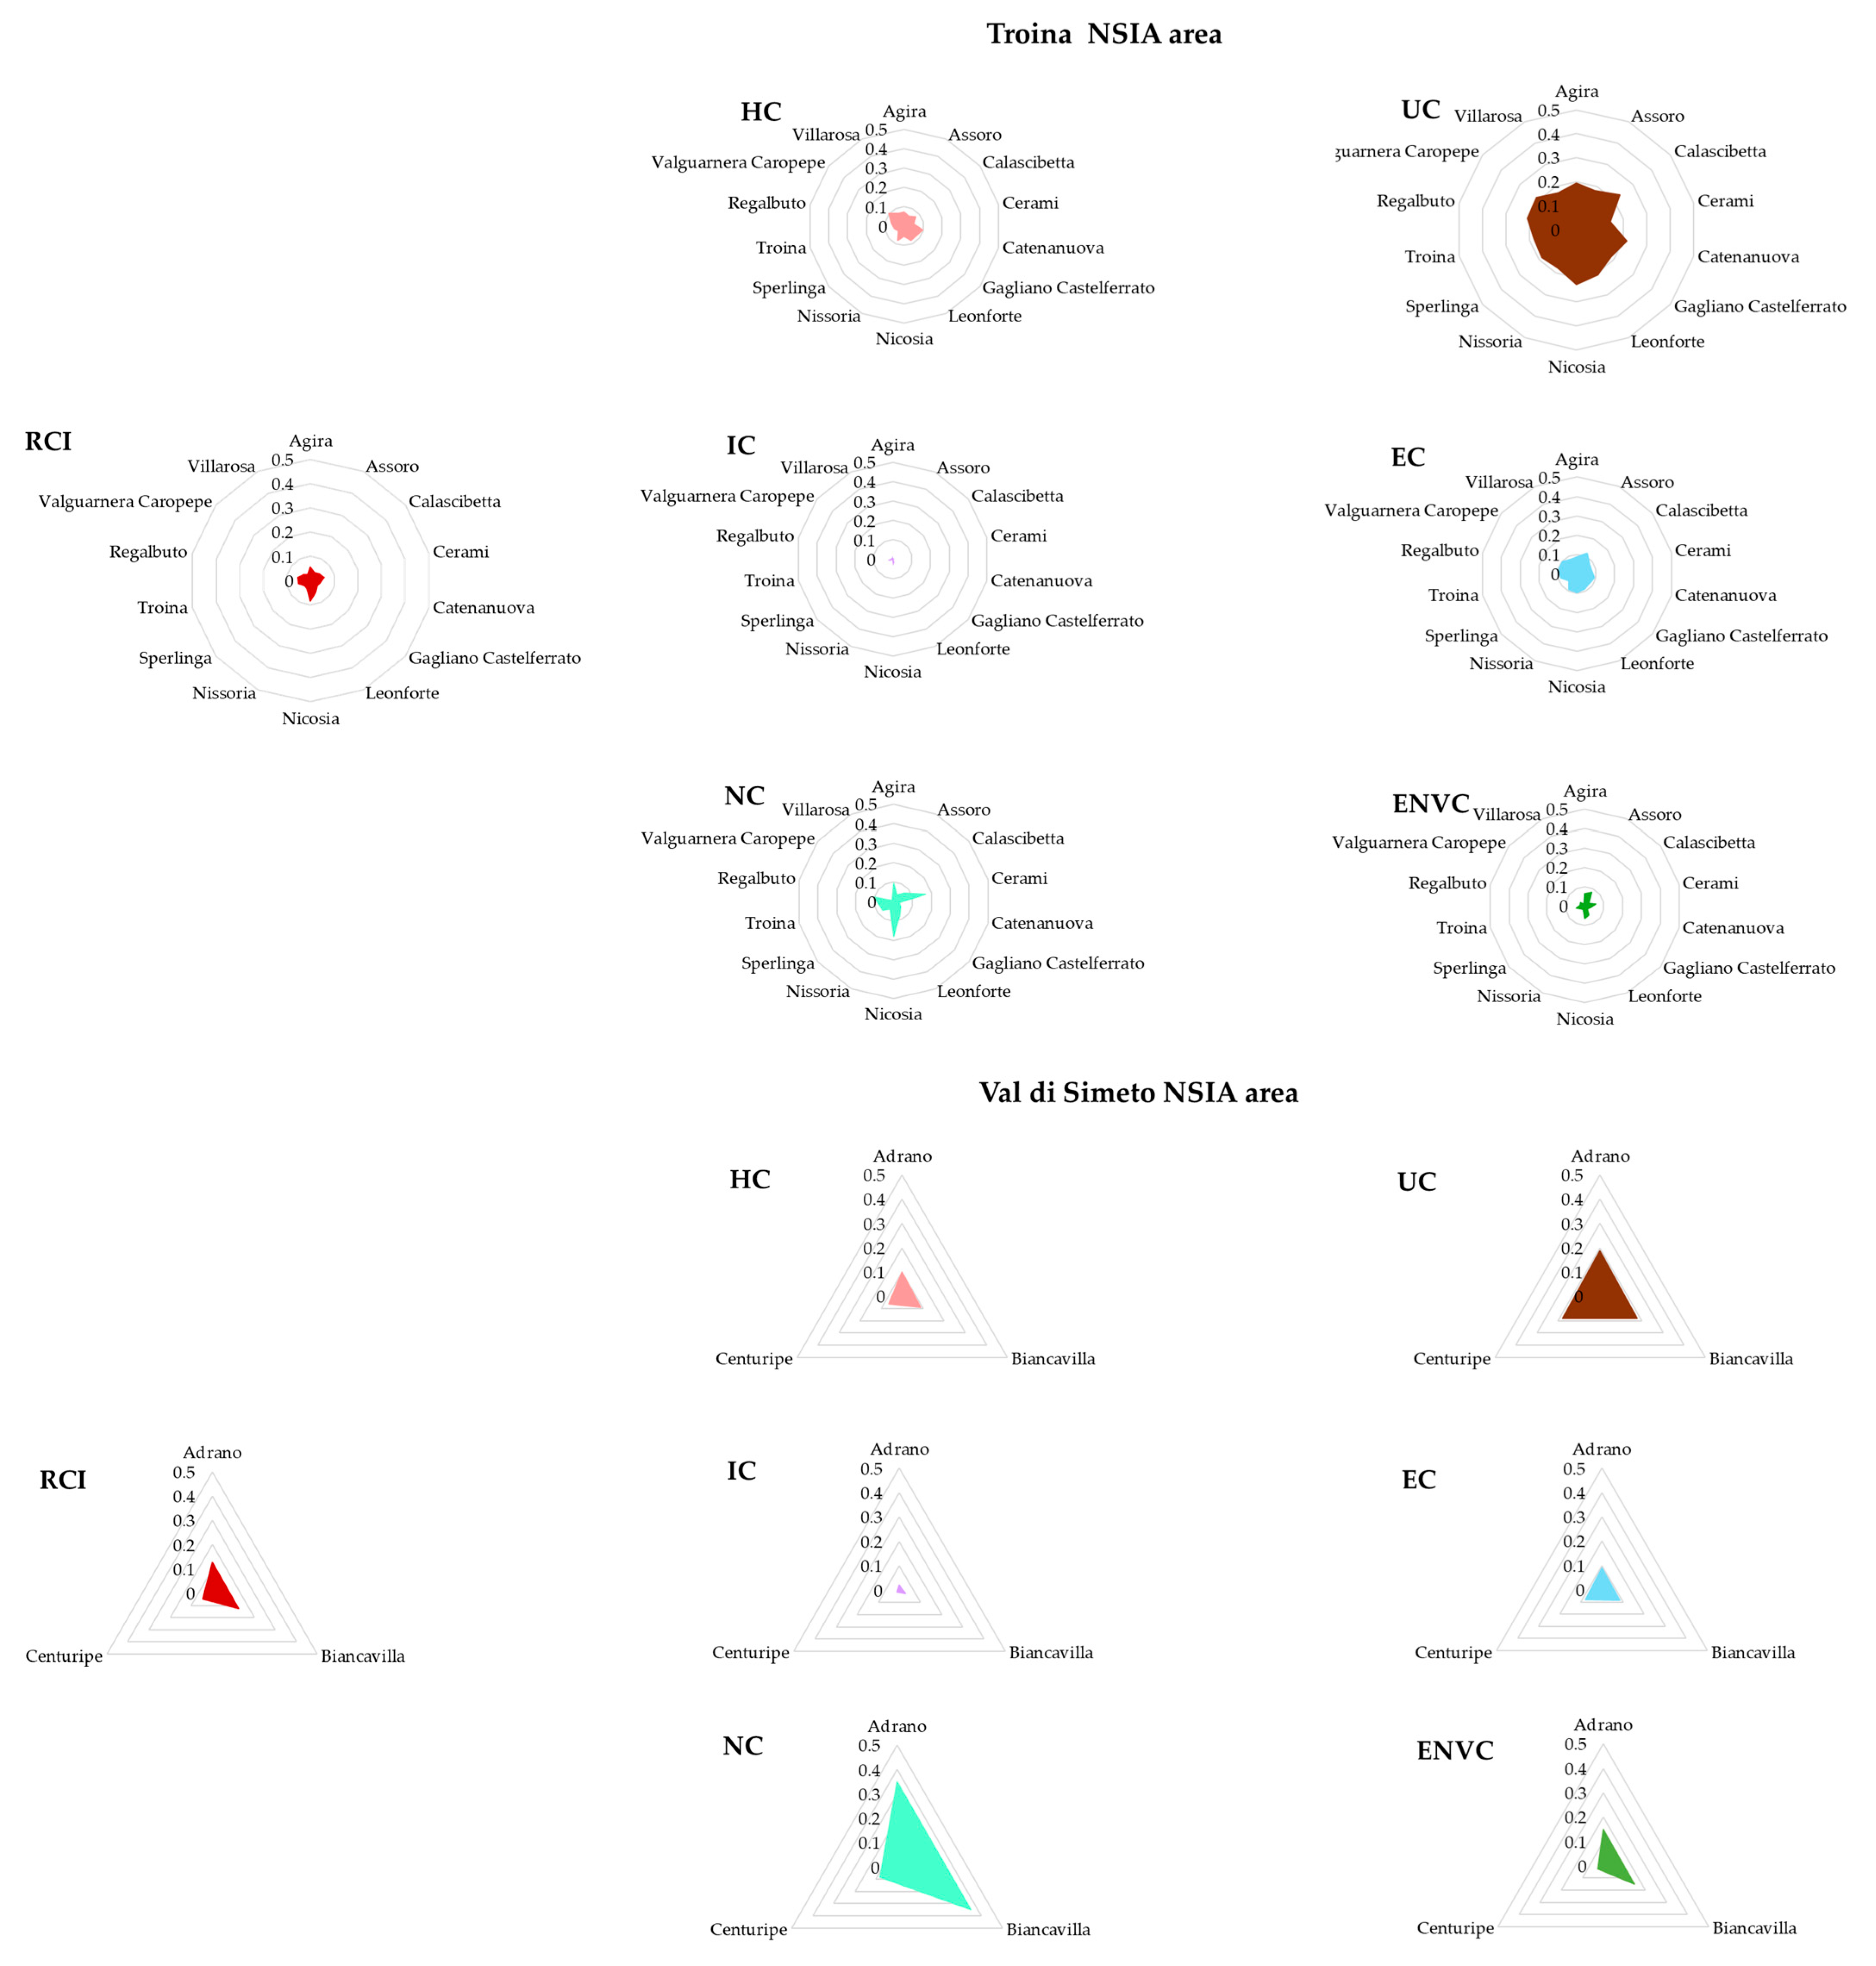
A synoptic analysis of the indicators for the 11 Sicilian NSIA areas reveals how endowed the various forms of territorial capital are, and how well they can react.
Figure 12, Figure 13, Figure 14, Figure 15, Figure 16 and Figure 17 show the levels of the six types of territorial capital and the I R C I for the 11 NSIA areas in Sicily. All Sicilian NSIA areas are characterised by low levels of infrastructure capital, and similar levels human and economic capital. There are minor differences in urban and environmental capital levels, and more significant differences in natural capital levels.
The NSIA areas of Bronte, Madonie, Nebrodi, and Val di Simeto have a greater endowment of natural capital. The Nebrodi Regional Park is located in the NSIA areas of Bronte and Nebrodi. The Madonie Regional Park is located in the Madonie NSIA area, and the Simeto Nature Reserve is located in the Val di Simeto NSIA area.
These areas are of great landscape and natural importance. They represent a valuable natural heritage for the whole of Sicily.
The cognitive model and index structure proposed in this study can support decision-makers in assessing the effects of policies and actions aimed at promoting territorial rebalancing [146], in both the ex-ante and ex post phases.
They can help decision-makers to identify and manage the trade-offs generated by these policies and actions, while also promoting a medium- and long-term development strategy.
For instance, with reference to the NSIA Troina area, we set out below an application of the index system to help decision-makers monitor the impact of cohesion policies over the two programming cycles, 2014–2020 and 2021–2027.
The Troina area’s development strategy is based on three sub-strategies:
  • Development and strengthening of essential services.
  • Strengthening mobility within the area.
  • Promoting heritage identity and strengthening the competitiveness of SMEs.
  • Protecting the environment using ecosystem-based approaches.
The first sub-strategy has been developed based on the following actions:
  • Measures for the digitisation of local public administration.
  • Measures to strengthen and improve school environments.
  • Reorganisation and upgrading of local health services.
  • Integration of services to promote work-life balance.
The second sub-strategy is supported by action and reference measure 1.3.1 of the 2021-27 ERDF PR Plan Programme, and by action and reference measure 5.2.1.18 of the ERDF 2021-27 Programme Plan. These measures demonstrate the synergy and complementarity of financial sources with the investment lines of the Sicily PR OS 1.3, the M1C2 PNRR, the PNRR M5C2 OS 6, the PN Culture 2021–2027, and the PR Sicily 2021–2027.
It has been developed with reference to the list of proposed actions below:
  • Promotion of entrepreneurship through supporting for the creation of new SMEs.
  • Promotion of new investments to increase competitiveness.
  • Enhancing of public spaces to promote tourist and residential appeal.
  • Interventions for the preserving and enhancing of historical and cultural heritage.
  • Integrated measures aimed at enhancing and promoting the use of natural areas.
  • Redevelopment measures for historic centres and open spaces.
The third sub-strategy has been developed based on the following actions:
  • Measures to encourage the creation of energy communities.
  • Measures to improve the integrated water service at every stage of the supply chain.
  • Emergency management and risk prevention measures.
  • Interventions for the construction of infrastructure, equipment, and resources for waste management, collection, reuse, and recycling.
  • Protection of areas falling within Natura 2000 sites.
  • Green infrastructure and the creation of urban forests.
  • Adoption of technological solutions to reduce energy consumption in public buildings and facilities, as well as in public lighting networks.
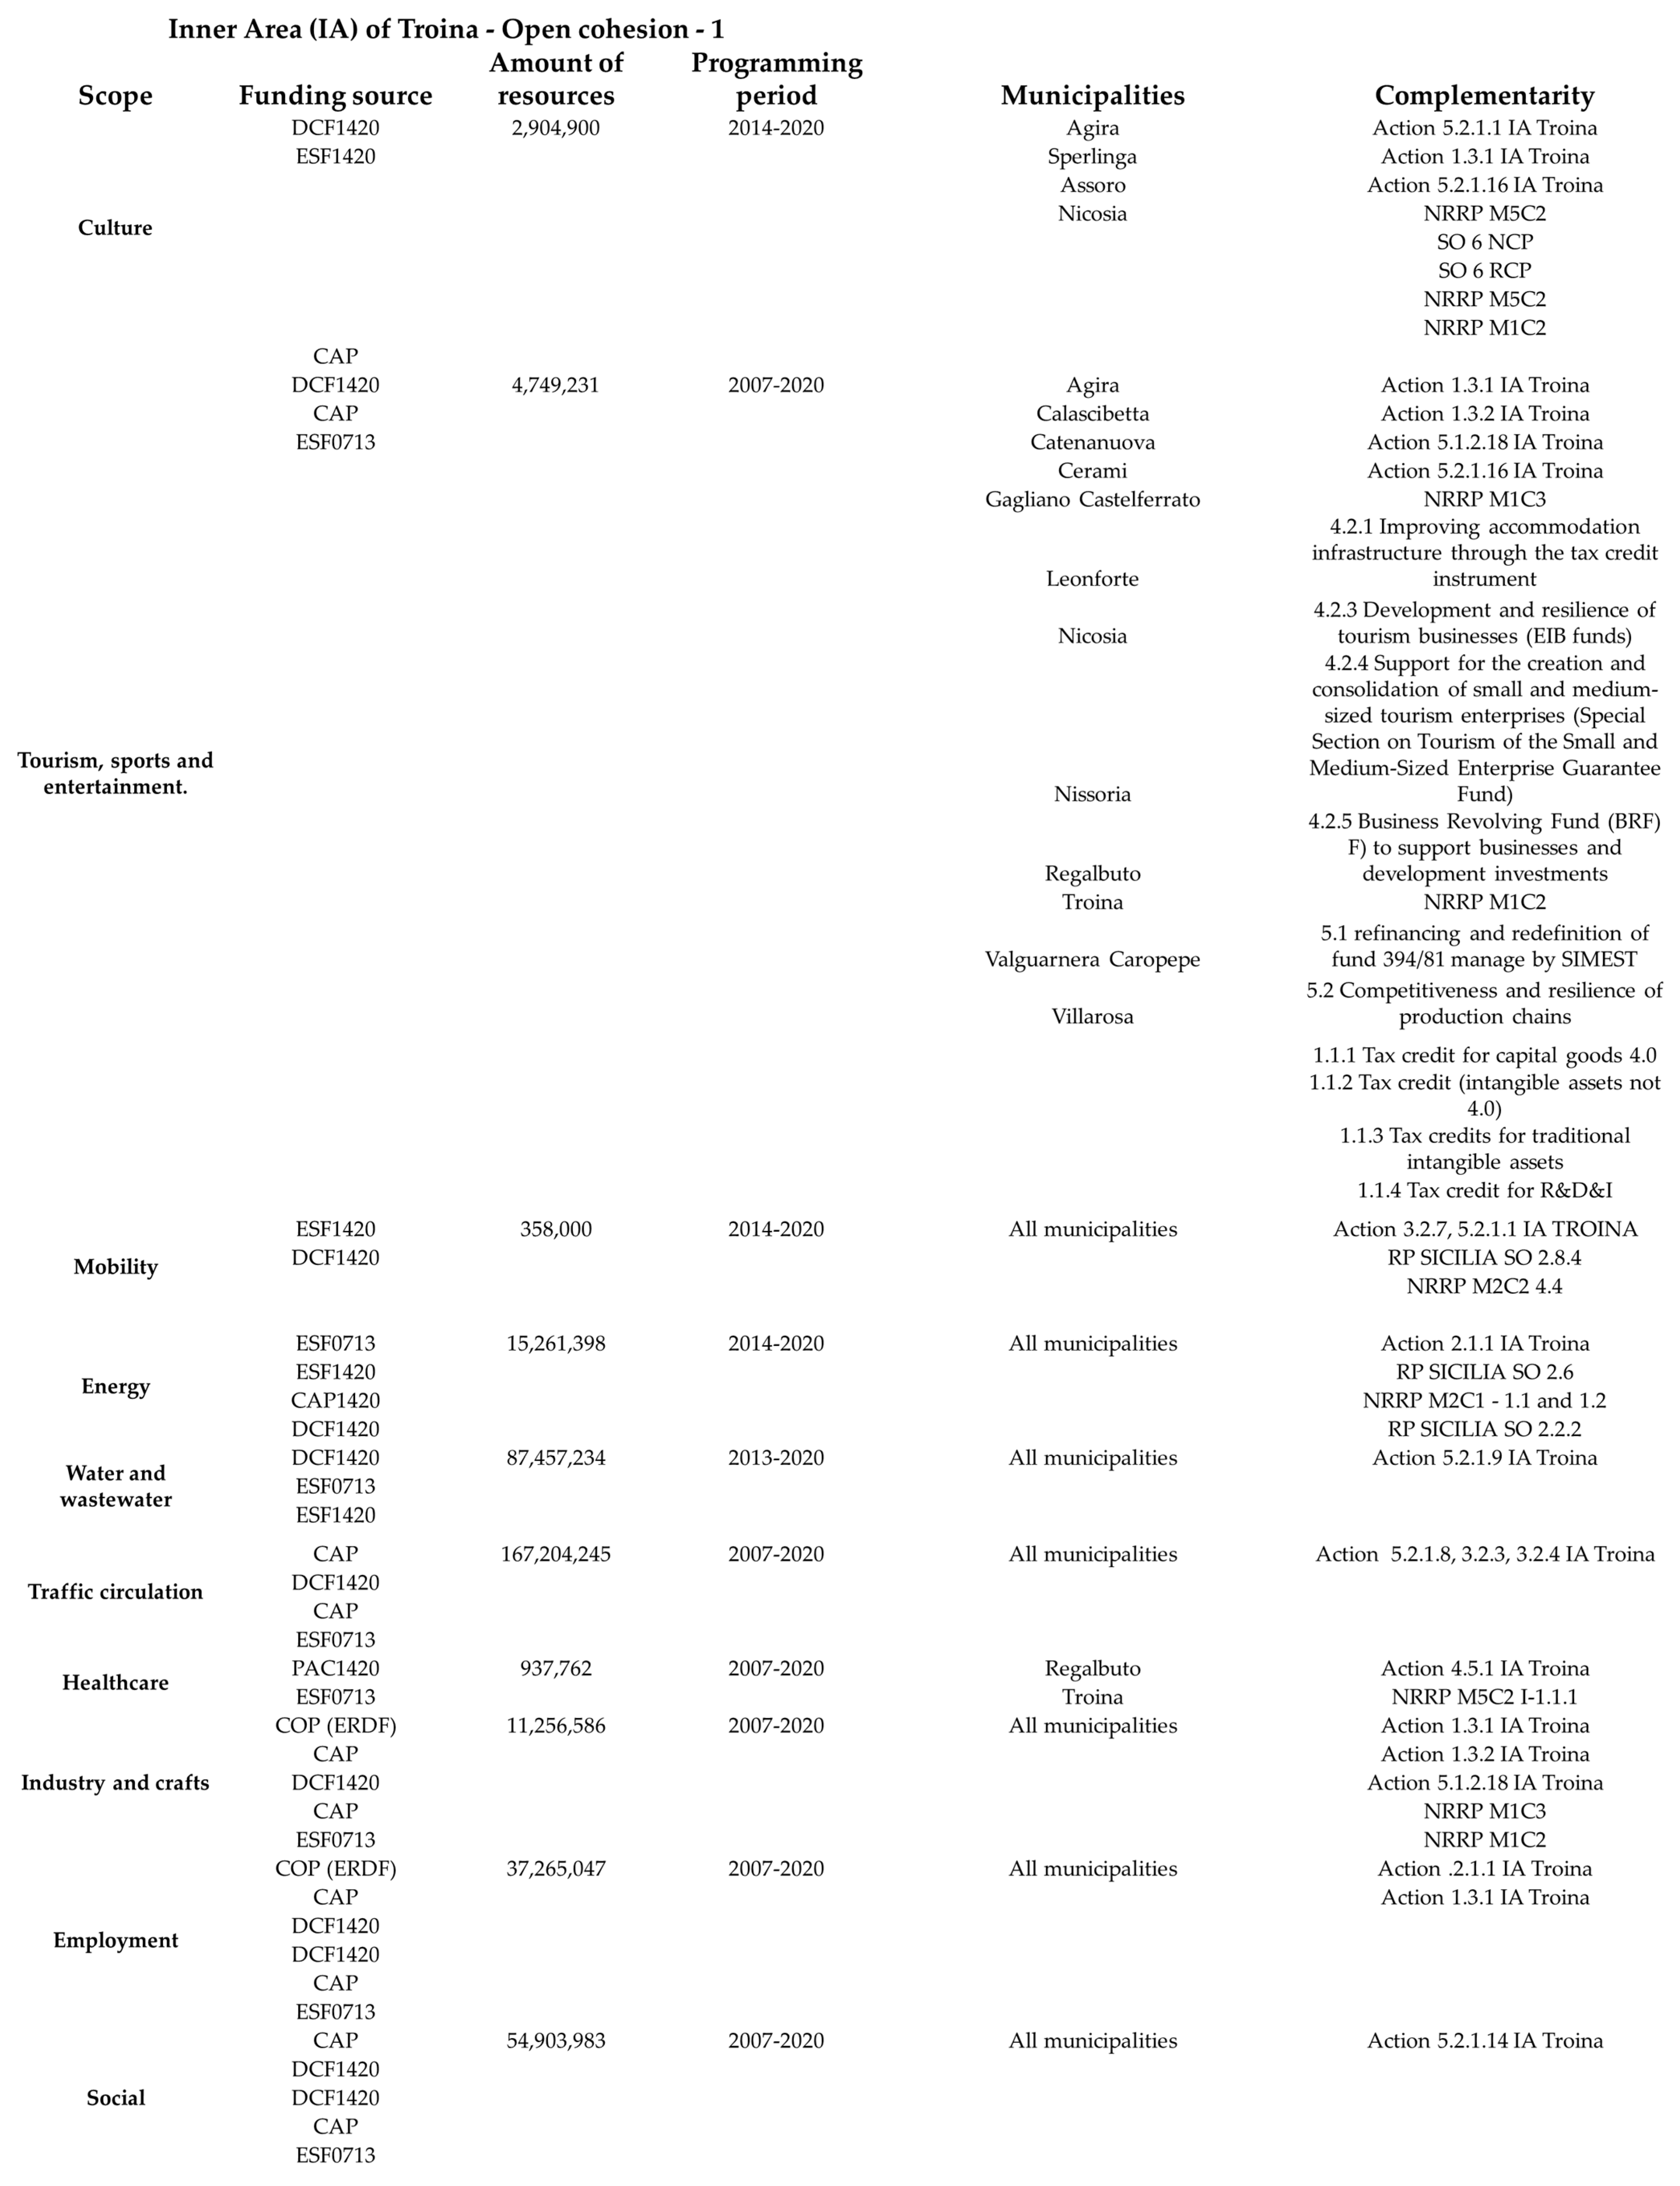
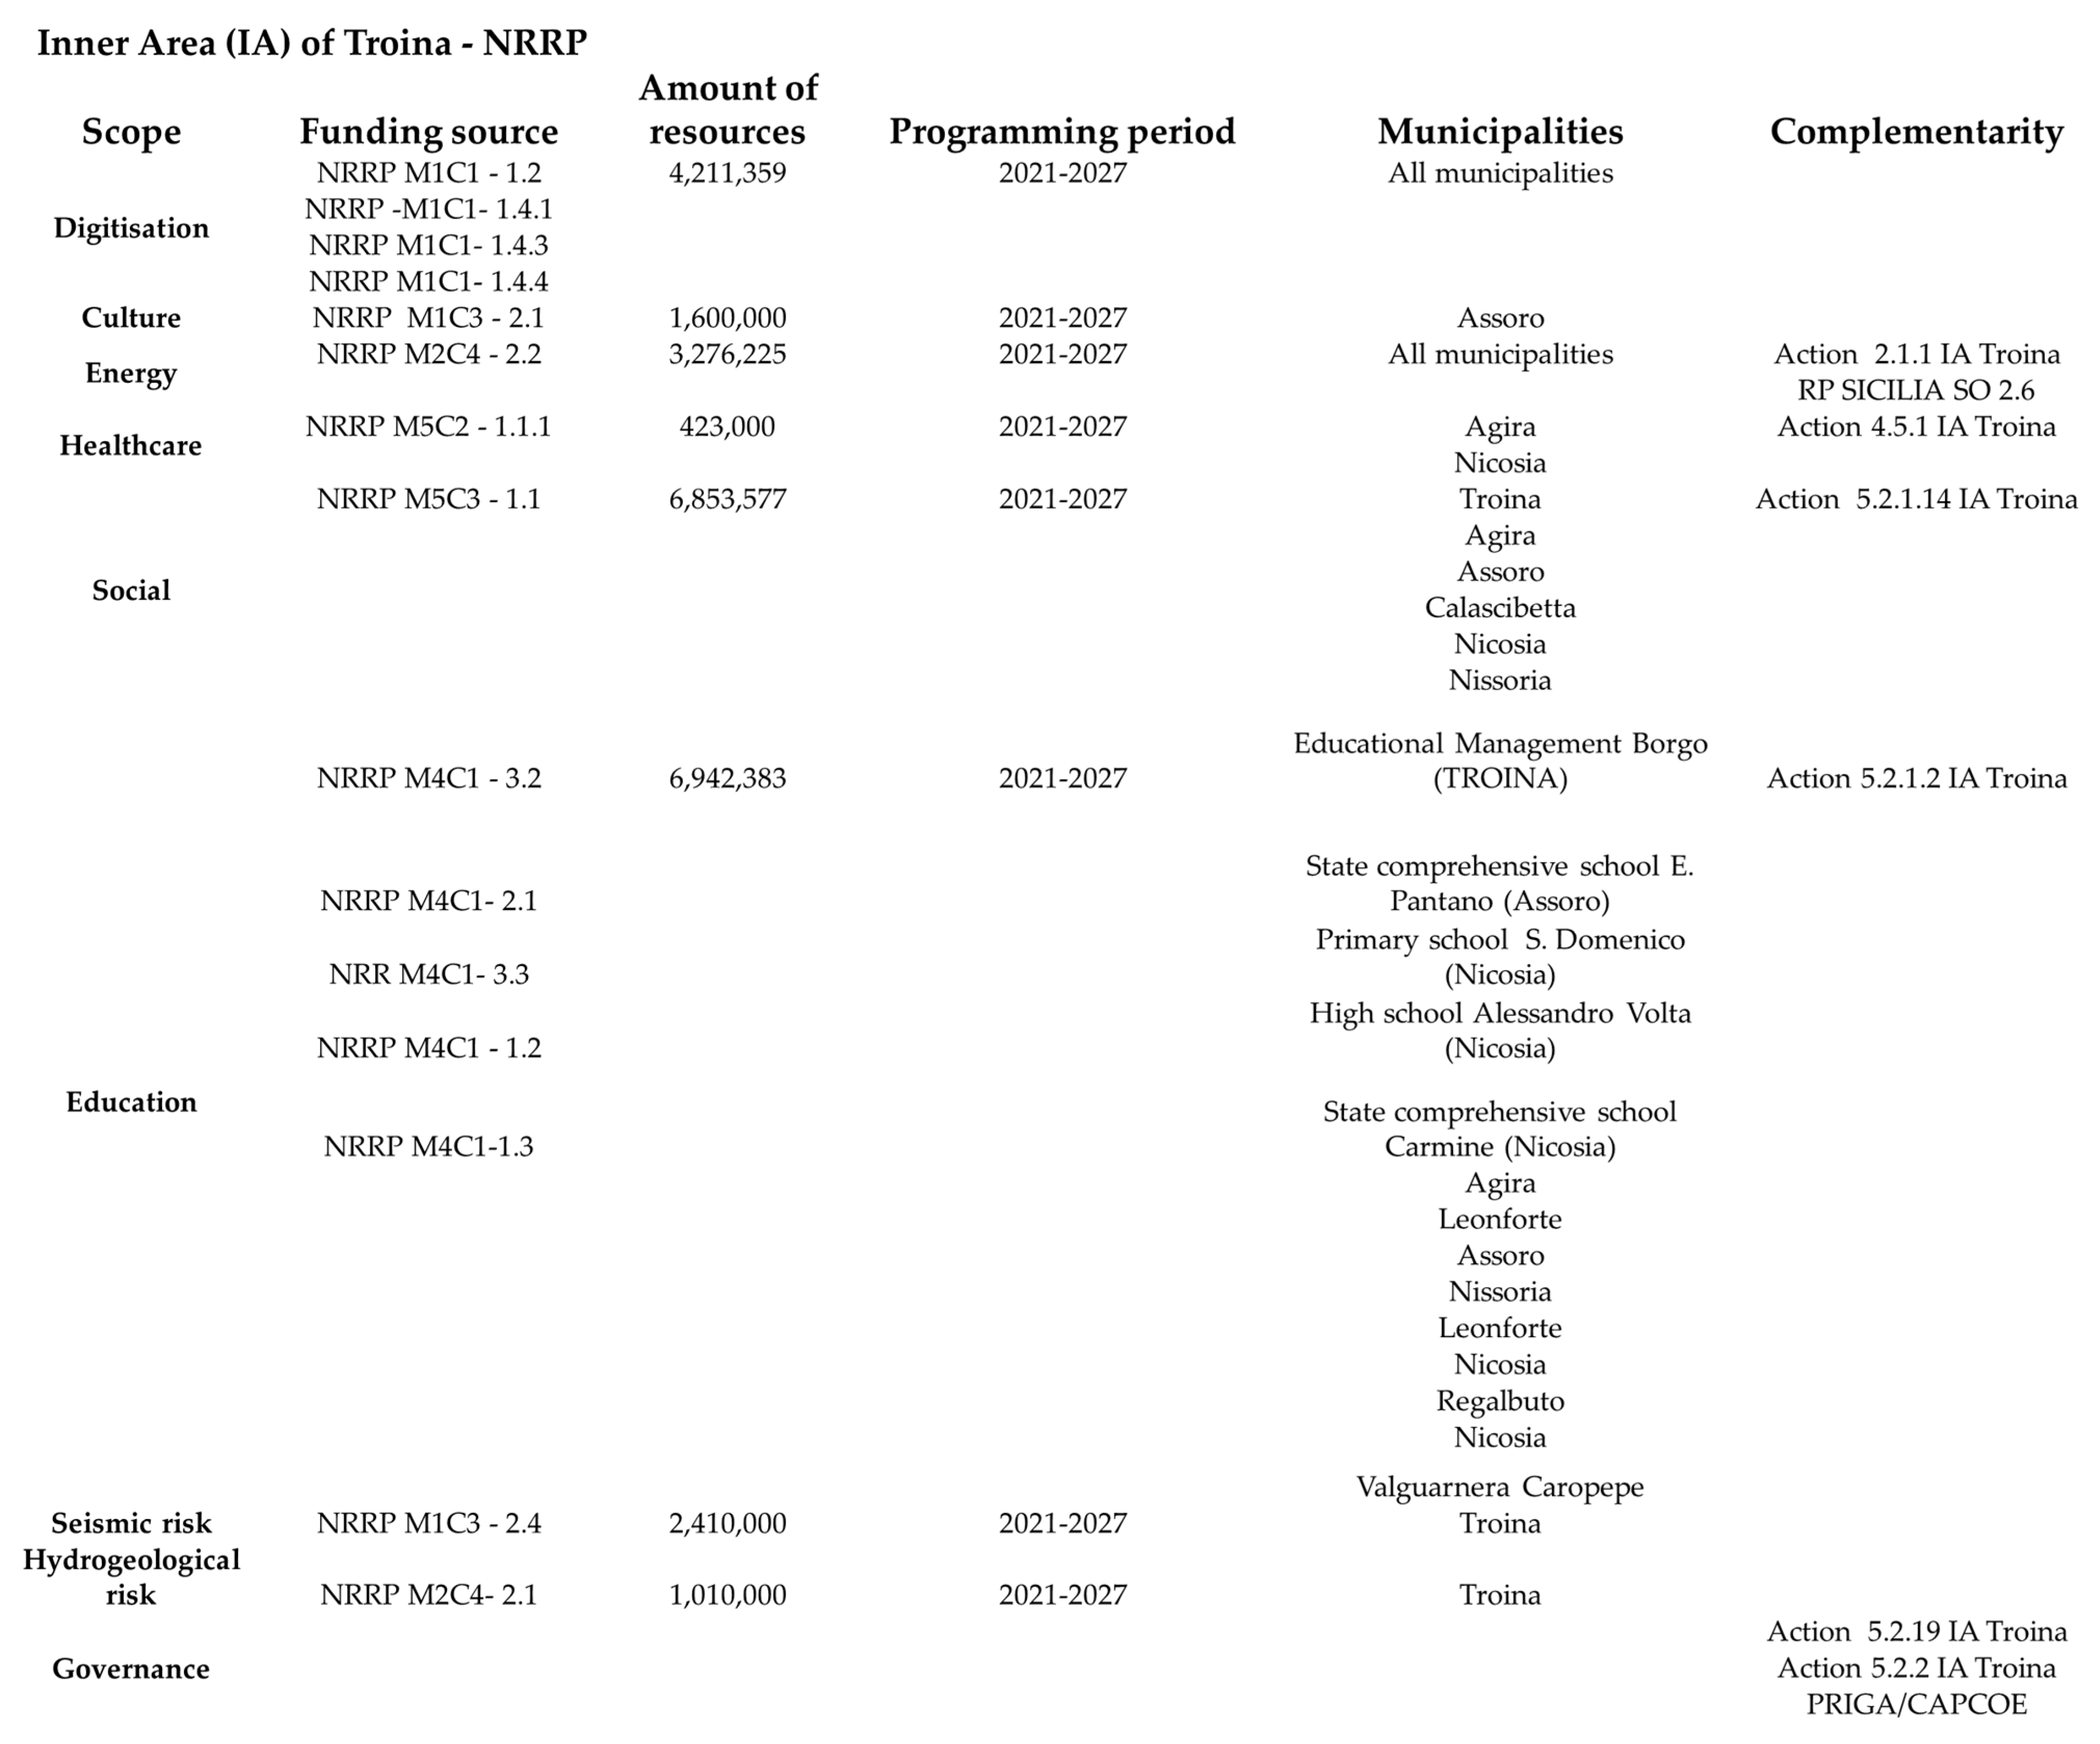
Figure A11, Figure A12 and Figure A13 in Appendix B show the funding that supported the strategies for Troina’s inner area across the various programming cycles.
The interventions that have been carried out or planned have different impacts on enhancing the various forms of territorial capital.
According to the cognitive model proposed in this study, increases in the endowment of capital forms can be measured and the effects on individual municipalities can be highlighted by estimating the six territorial capital forms indices and the aggregate I R C I index.
The cognitive model allows the identification of changes in territorial capital levels and the responsiveness of various municipalities resulting from the interventions carried out and those planned for the 2021–2027 cycle.
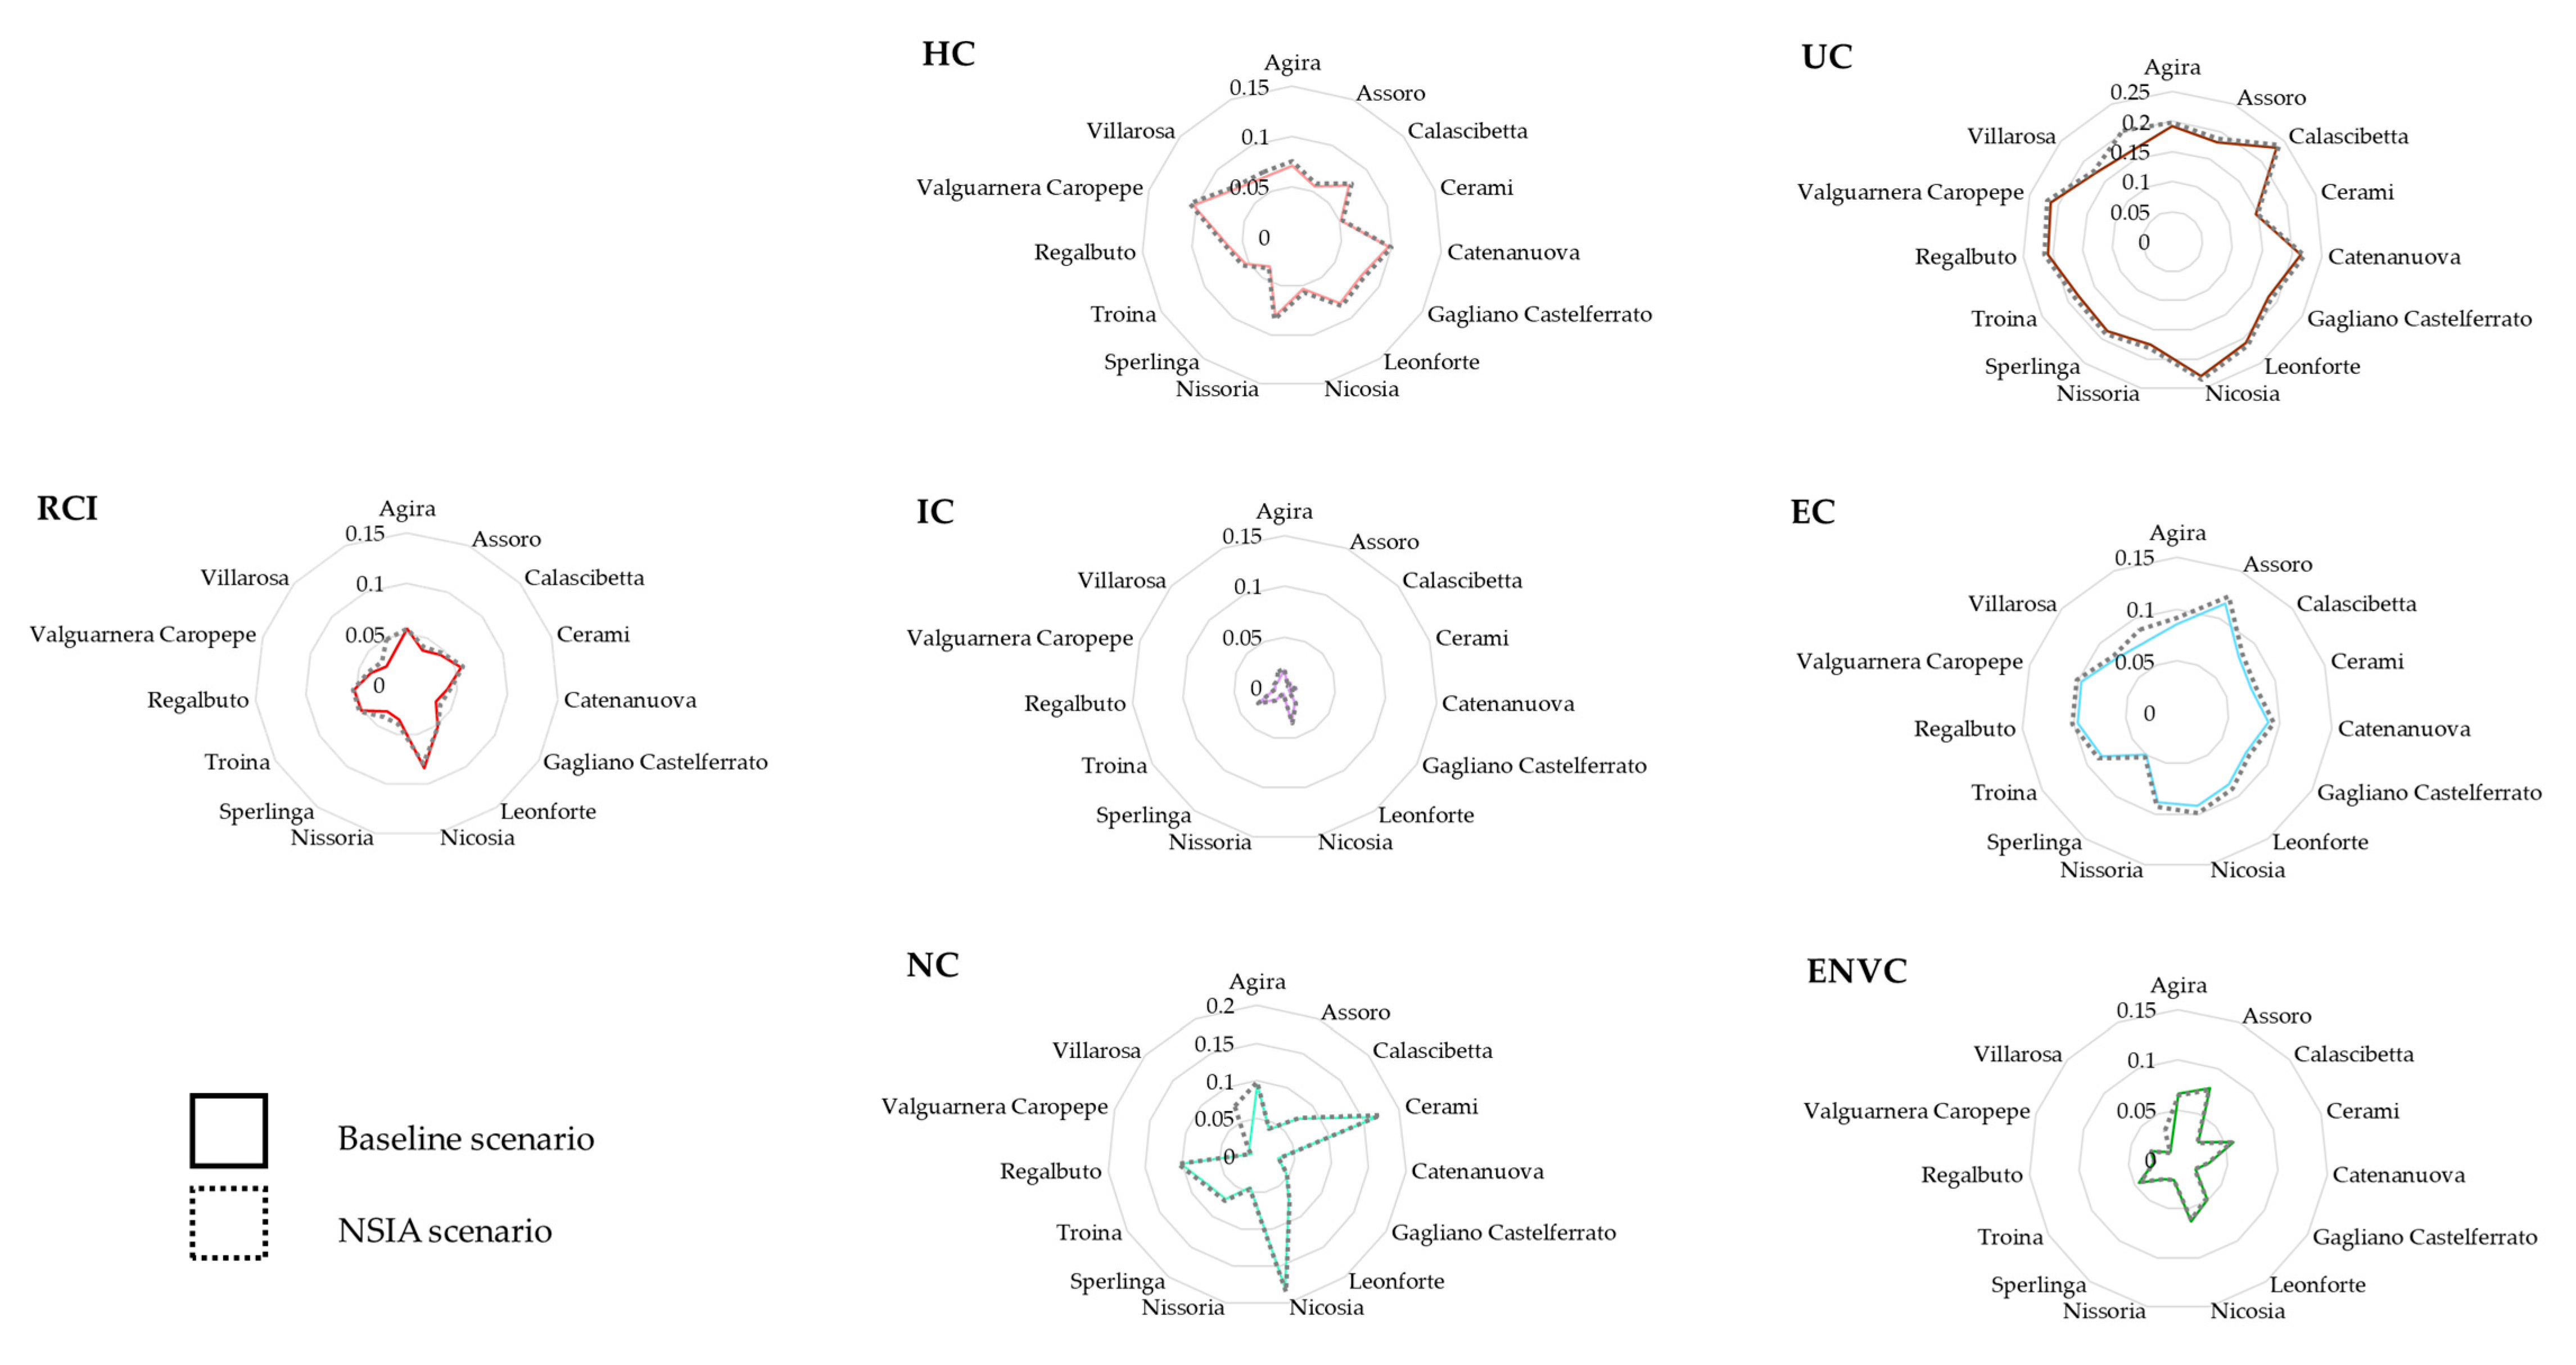
Figure 18 shows the estimated scenarios for the municipalities in the NSIA area of Troina.
The solid line shows the baseline scenario, and the grey dotted line shows the project scenario. The latter incorporates the planned changes to the area’s territorial heritage resulting from the interventions envisaged in the Strategy for this Area (SA).
Some interventions cover all municipalities in the NSIA area of Troina, while others affect individual municipalities. In the former case, the indicators show a minimal increase, as represented by the dotted area in Figure 18.
In the latter case, there is an increase in the endowment of various forms of territorial capital, as well as an increase in the capacity of individual municipalities to react.
The model highlights and measures changes in territorial capital stock both ex ante, to assess the strategy’s effects on the relevant area and municipalities, and ex post phase, to verify the achievement of the strategy’s objectives.
The model can therefore support decision-makers in developing the NSIA strategy [147,148,149,150] and promote a culture of control and monitoring to ensure that the strategy’s objectives are met. This facilitates more effective and efficient management of promoting the revitalisation of these areas and the related funding [151,152].
The mapping of inner areas proposed by NSIA is now the official tool for tackling the marginalisation of these territories. Italy is the first Europe country to address the issue of marginalised areas, developing strategies to revitalise them based on solid knowledge.
This knowledge base provides the foundation for the allocation of financial resources provided for in the various funding packages outlined in the Italian context with reference to cohesion policies developed at European level.
The NSIA’s proposed mapping of inner areas, based on a classification of municipalities according to their remoteness, offers a unified and systematic view of the issue across Italy.
However, it provides limited information, failing to capture the values and potential of these areas, as highlighted Trovato and Nasca (2022) [74].
In other European countries, the issue of marginalised areas is primarily addressed through thematic programmes. Examples include the French programmes “Revitalisation des centres-bourgs” (2014) [153], “Action Cœur de Ville” (2018) [154] and “Petites Villes de Demain” (2020) [155]. In 2008, Switzerland adopted a New Regional Policy (NRP) [156] to support mountain and border regions, rural areas and European territorial cooperation, in line with the Interreg, ESPON, URBACT and INTERACT programmes [157].
In 2016, Spain proposed the “Castilla-La Mancha programme” [158], and in 29 March 2019 approved the General Guidelines for a National Strategy to Address the Demographic Challenge [159].
This strategy maps demographic changes, such as depopulation, and ageing, and the effects of population fluctuation. Spain is also developing a programme called “El plan de España para evitar la despoblación rural” (Spain’s plan to prevent rural depopulation).
This study presents a model that is based on a critical review of the NSIA classification. Referring With reference to the traditional classes of territorial capital components [75], the model supports the development indices that promote an area’s value based on endogenous factors rather than its.
The main limitation of this research relates to the quality of the official databases often provide data from different time periods that is not up to date.
Furthermore, in order to evaluate the strategies and effects generated by funding using index-based metrics, it is necessary to improve data quality and clearly quantify the general and specific objectives for the various thematic areas of the strategies.
This would enable the effectiveness of the adopted strategies and the efficiency of the allocated resources to be measured.
Possible developments of this research will involve further investigation and verification of the proposed cognitive model. In particular, we are developing research on the “Southern question”, and we will therefore extend the implementation of this model to the regions of southern Italy.
The proposed cognitive model can be replicated for all Italian regions, as all the conditions for its applicability are met.
In particular, the datasets used to identify indicators have national coverage, despite the limitations mentioned above.
Further developments in this area of research will focus on implementing the cognitive model in other European contexts, particularly in French municipalities located in the so-called “Diagonale du vide”.
These municipalities are the French equivalents of those in inner areas. It will be interesting to test the cognitive model on this French case to verify its suitability for analysing a context that, while similar, has different characteristics.
Future developments of this research will focus on integrating other components of territorial capital into the cognitive model.
These components can be identified using the five intermediate classes of the rivalry-excludability model proposed by Camagni in 2008 [75].
The research may also address the question of how endogenous factors can be stimulated exogenously.
Integrating other components of territorial capital into the cognitive model, as set out in the five intermediate classes of the rivalry-excludability model proposed by Camagni, could enhance its effectiveness. This could strengthen the model and facilitate its application in complex contexts characterised by local policy heterogeneity, differentiated fiscal flexibility, various potential public/private partnership scenarios, and varying capacities to translate geographical and cognitive proximity into effective links between economic agents.
Currently, the designation of NSIA areas depends on the ability of local authorities to establish a network [160,161]. This mechanism is based on spatial proximity and the convergence of objectives.
Future developments in the Reaction Capacity Index ( I R C I ) and the value-based knowledge approach could facilitate the identification of NSIA areas more effectively [162].
Future developments in this area of research may involve using the Spatial Cycle Model (SCM) [34] to classify inner areas. This model is instrumental in characterising long-term spatial demographic change.
However, this model cannot currently be used due to the lack of time series data for these areas, making it impossible to characterise the phases and sub-phases of the cycle.

7. Conclusions

In recent years, the marginalisation of areas due to progressive social, material, economic and infrastructural vulnerability in urban suburbs, small towns, villages and rural inland areas has become a pressing issue in many countries. This is primarily due to populations, functions, services, infrastructure, technologies and knowledge being concentrated in urbanised and/or coastal areas.
The 2030 Agenda emphasises the importance of identifying measures to support underdeveloped regions, particularly in relation to Goal 11 of the SDGs.
The sustainability goals set out in the 2030 Agenda have raised awareness of this complex issue affecting many regions.
As a result, many researchers and politicians have recognised that this issue cannot be postponed any longer. Research has promoted a renewed awareness of territorial rebalancing and sought to outline measures to tackle this complex problem [163,164]. The concept of peripherality is no longer defined by spatial factors, such as distance and proximity to essential services and opportunities.
Instead, it is now linked to socio-economic performance, political dynamics and the absence of organised forms of proximity—social, legal and institutional—all of which are important factors in identifying new forms of interaction. European cohesion policies promote, and support actions aimed at territorial rebalancing.
The implementation of these policies and their outcomes are closely linked to the definition of the action domain. This domain is represented by the territory and, more specifically, its components.
A key aspect of defining and implementing these policies is the cognitive model of the territory, particularly with regard to the endogenous factors referred to in the literature.
Italy was the first European country to produce a survey of the state of marginalisation in its territories, based on the NSIA classification and a unified knowledge framework.
However, this does not provide an exhaustive representation of exogenous factors, which are a key consideration in the development and implementation of policies aimed at rebalancing and revitalising territories.
This cognitive model is weakened by the partial integration of the representation of exogenous factors, and particularly by the absence of a metric capable of measuring their level.
In this regard, the study proposes a cognitive model based on the concept of territorial capital.
This model identifies the components of territorial capital according to the classic rivalry-excludability approach proposed by Camagni in 2008 [72].
The concept of territorial capital is used to characterise exogenous factors.
The cognitive model was developed from the perspective of an axiological approach to territorial capital.
The proposed model is called the “Geo-referenced Value-based Knowledge Model”. It develops a metric that expresses the level of endowment of various forms of territorial capital, as well as the overall endowment. This is based on the estimation of indices.
The study develops a metric based on the estimation of indices for the different forms of territorial capital ( I H C , I U C , I I C , I E C , I N C , I E n v C ) and the territory’s capacity to react ( I R C I ). This provides an aggregate measure of the territory’s endowment of territorial capital components.
The indices were developed using the Multi-Attribute Theory Value (MAVT) multi-criteria approach.
The cognitive model was developed for Sicilian municipalities and so can also be used for NSIA municipalities.
Estimating the six indices ( I H C , I U C , I I C , I E C , I N C , I E n v C ) for the different forms of territorial capital, as well as the aggregate index ( I R C I ), provides an assessment of the level of each form of territorial capital, as well as an overall assessment of territorial capital for all Sicilian municipalities.
Analysis of the quartiles of the indices, developed using QGIS, reveals different clusters of municipalities based on four levels of capital endowment: low, medium, medium-high and high.
These are characterised by the first, second, third and fourth quartiles of the estimated indices, respectively.
Analysing the indices by quartile, province and municipality type, according to the NSIA classification (i.e., A—Pole, B—Intercommunal Pole, C—Belt, D—Intermediate, E—Peripheral and F—Ultra-peripheral), provides detailed support for understanding the levels of territorial capital in Sicilian municipalities, and allows comparisons to be made between the knowledge model based on the NSIA classification and the new model.
The maps of the six indices and the index ( I R C I ) highlight the distribution and level of various forms of territorial capital, as well as the overall endowment of Sicilian municipalities.
The estimate, quartile analysis and map of the human capital index ( I H C ) reveal the level and distribution of human capital in Sicilian municipalities.
The following results were highlighted in relation to human capital:
  • The highest levels are found in the eastern areas of Sicily, while the lowest levels are found in the central areas.
  • The lowest level is found in the provinces of Agrigento and Caltanissetta. Investment is needed to support the development of municipalities in these provinces.
  • The highest level is found in the provinces of Catania and Palermo.
These results, with reference to provinces and types of municipalities according to the NSIA classification, highlight:
  • The municipalities with the worst endowment, i.e., those in the first quartile of the index, are in the provinces of Agrigento and Caltanissetta. According to the NSIA classification, most of them are classified as D—Intermediate, E—Peripheral or F—Ultra-peripheral. This shows that even municipalities considered less peripheral under the NSIA classification, such as those in class D (Intermediate), have low human capital endowment. Furthermore, it shows that municipalities in different NSIA classes have the same level of human capital endowment.
  • The municipalities with the best endowment, falling within the fourth quartile of the index, are in the provinces of Catania and Palermo. According to the NSIA classification, they fall into all NSIA classes. This suggests that the NSIA classification, and therefore the differentiation into different classes based on the criterion of peripherality, does not accurately reflect their value. In this case, given that these results concern the two main Sicilian provinces, it is likely that some of the more peripheral areas benefit from “organised proximity”, which allows them to mitigate the effects of their geographical peripherality.
The estimate, quartile analysis and map of the urban capital index ( I U C ) reveal the level and distribution of urban capital in Sicilian municipalities.
The following results were highlighted in relation to urban capital:
  • A fairly diverse distribution of urban capital among municipalities in central Sicily. Inner areas in central Sicily have a good level of urban capital. This suggests that the classic contrast between inland and coastal areas does not apply in terms of urban capital.
  • A better distribution in the southern and central-northern areas.
  • Approximately one third of municipalities with a low level are located in the provinces of Catania and Syracuse.
  • Approximately one third of municipalities with a high level of urban capital are located in the provinces of Caltanissetta, Enna, Palermo, Ragusa and Trapani.
The estimate, quartile analysis and map of the infrastructure capital index ( I I C ) reveal the level and distribution of infrastructure capital in Sicilian municipalities.
The following results were highlighted in relation to infrastructure capital:
  • A high concentration in coastal areas, particularly in the provinces of Catania, Palermo, Ragusa, Syracuse and Trapani.
  • A medium and low concentration in inner areas.
These results, with reference to the provinces and types of municipalities according to the NSIA classification, highlight:
  • A high percentage of municipalities with a low level in the province of Agrigento.
  • Approximately one third of municipalities with a high level fall within the province of Catania.
The estimate, quartile analysis and map of the economic capital index ( I E C ) reveal the level and distribution of economic capital in Sicilian municipalities.
The following results were highlighted in relation to economic capital:
  • There are extensive areas with low and medium levels, mostly in inner areas.
  • There is a concentration of medium-high and high levels in coastal areas.
These results, with reference to provinces and types of municipalities according to the NSIA classification, highlight:
  • A high percentage of municipalities with low levels in the province of Messina.
The estimate, quartile analysis and map of the natural capital index ( I N C ) reveal the level and distribution of natural capital in Sicilian municipalities.
The following results were highlighted in relation to natural capital:
  • There are extensive areas with a low level in the southern areas.
  • There are extensive areas with a medium-high level in the central areas.
  • There are extensive areas with a high or medium-high level in the eastern and western areas.
These results, when considered in relation to provinces and types of municipalities according to the NSIA classification, reveal the following:
  • A high percentage of municipalities with a low level in the province of Caltanissetta.
  • A high percentage of municipalities with a high level in the province of Syracuse.
The estimate, quartile analysis and map of the environmental capital index ( I E n v C ) reveal the level and distribution of environmental capital in Sicilian municipalities.
The following results were highlighted in relation to environmental capital:
  • The areas most exposed to environmental risk are in northern and eastern Sicily.
  • The areas least exposed to risk in central, southern and western Sicily.
These results, with reference to the provinces and types of municipalities according to the NSIA classification, highlight the following:
  • A high percentage of municipalities in the province of Enna are characterised by low environmental risk.
  • One third of municipalities in the provinces of Catania, Palermo and Ragusa are characterised by high environmental risk.
The estimate, quartile analysis and map of the Reaction Capacity Index ( I R C I ) reveal the level and distribution of the overall territorial capital endowment for Sicilian municipalities.
The following results were highlighted in relation to the level and distribution of the overall territorial capital endowment:
  • The municipalities with the highest levels of territorial capital are those located on the coast, especially in eastern Sicily, and those in the municipality of Enna.
  • The municipalities characterised by low and medium levels of territorial capital are those located inner areas.
These results, with reference to the provinces and types of municipalities according to the NSIA classification, highlight the following:
  • A high percentage of municipalities in the provinces of Agrigento, Caltanissetta and Enna fall within the first quartile of the index IRCI, meaning they are characterised by a low level of territorial capital. These are the most vulnerable areas. A strategy aimed at revitalising and strengthening these areas would require significant investment.
  • One third of the municipalities in the provinces of Catania, Ragusa, Syracuse and Trapani fall into the fourth quartile of the index IRCI, meaning they have a high level of territorial capital. These are the least vulnerable areas. In this case, a strategy aimed at strengthening these areas would require less investment.
A synoptic analysis of the municipalities in the Sicilian NSIA areas was conducted, using the results on the six indices relating to various forms of territorial capital and to for I R C I .
This analysis highlighted the following:
  • A low level of infrastructure capital.
  • A fairly similar level of human and economic capital.
  • Some minor differences in urban and environmental capital.
  • More marked differences in natural capital.
  • There is greater natural capital in the NSIA areas of Bronte, Madonie, Nebrodi and Val di Simeto.
For example, a simulation was proposed for the NSIA area of Troina to show how the proposed knowledge model based on indices metrics could help decision-makers assess the impact of policies and actions aimed at promoting territorial rebalancing, both before and after implementation.

Author Contributions

Conceptualization, M.R.T.; methodology, M.R.T.; software, M.R.T.; validation, M.R.T.; formal analysis, M.R.T.; investigation, M.R.T. and L.N.; resources, M.R.T.; data curation, M.R.T.; writing—original draft preparation, M.R.T.; writing—review and editing, M.R.T., visualization, M.R.T. and L.N.; supervision, M.R.T.; project administration, M.R.T. All authors have read and agreed to the published version of the manuscript.

Funding

This research received no external funding.

Data Availability Statement

The original contributions presented in this study are included in the article. Further inquiries can be directed to the corresponding author.

Conflicts of Interest

The authors declare no conflicts of interest.

Appendix A

Table A1. Characterisation of the eleven Sicilian NSIA areas based on the programming cycle, municipalities, total surface area and total population [68].
NSIA 2014–2020NSIA-2020MunicipalitiesTot. Surface Area (sq.km.)Tot. Population (ISTAT 2020)
CalatinoE—PeripheralCaltagirone383.3736,241
CalatinoE—PeripheralGrammichele31.0212,561
CalatinoD—IntermediateLicodia Eubea112.452794
CalatinoE—PeripheralMineo246.324991
CalatinoF—Ultra-peripheralMirabella Imbaccari15.304282
CalatinoE—PeripheralSan Cono6.632431
CalatinoE—PeripheralSan Michele di Ganzaria25.812965
CalatinoE—PeripheralVizzini126.755772
NSIA 2021–2027NSIA-2020MunicipalitiesTot. Surface Area (sq.km.)Tot. Population (ISTAT 2020)
CorleoneF—Ultra-peripheralBisacquino64.974203
CorleoneE—PeripheralCampofelice di Fitalia35.29473
CorleoneF—Ultra-peripheralCampofiorito22.351181
CorleoneE—PeripheralCastronovo di Sicilia201.062880
CorleoneF—Ultra-peripheralChiusa Sclafani57.402611
CorleoneE—PeripheralCiminna56.843485
CorleoneE—PeripheralContessa Entellina136.401536
CorleoneE—PeripheralCorleone228.6910,580
CorleoneF—Ultra-peripheralGiuliana23.641730
CorleoneE—PeripheralGodrano39.271087
CorleoneE—PeripheralLercara Friddi37.276340
CorleoneF—Ultra-peripheralPalazzo Adriano129.251863
CorleoneF—Ultra-peripheralPrizzi95.034342
CorleoneE—PeripheralRoccamena33.321388
CorleoneE—PeripheralRoccapalumba31.412298
CorleoneE—PeripheralVicari85.742484
NSIA 2021–2027NSIA-2020MunicipalitiesTot. Surface Area (sq.km.)Tot. Population (ISTAT 2020)
BronteF—Ultra-peripheralCesarò215.752212
BronteE—PeripheralFrancavilla di Sicilia82.113636
BronteF—Ultra-peripheralMalvagna6.90649
BronteF—Ultra-peripheralMoio Alcantara8.76664
BronteE—PeripheralMotta Camastra25.29804
BronteF—Ultra-peripheralRoccella Valdemone40.98583
BronteF—Ultra-peripheralSanta Domenica Vittoria19.98871
BronteF—Ultra-peripheralSan Teodoro13.901260
BronteE—PeripheralBronte250.0118,327
BronteF—Ultra-peripheralCastiglione di Sicilia120.412969
BronteE—PeripheralMaletto40.883613
BronteF—Ultra-peripheralRandazzo204.8410,324
BronteF—Ultra-peripheralManiace35.873739
NSIA 2014–2020NSIA-2020MunicipalitiesTot. Surface Area (sq.km.)Tot. Population (ISTAT 2020)
MadonieF—Ultra-peripheralAlcara li Fusi62.931763
MadonieE—PeripheralCaronia227.263097
MadonieE—PeripheralCastel di Lucio28.781206
MadonieE—PeripheralCastell’Umberto11.432872
MadonieE—PeripheralFrazzanò7.00601
MadonieE—PeripheralGalati Mamertino39.312361
MadonieF—Ultra-peripheralLongi42.111348
MadonieE—PeripheralMilitello Rosmarino29.541197
MadonieE—PeripheralMirto9.27913
MadonieE—PeripheralMistretta127.474434
MadonieE—PeripheralMotta d’Affermo14.58670
MadonieE—PeripheralNaso36.743523
MadonieD—IntermediatePettineo30.621240
MadonieD—IntermediateReitano14.12733
MadonieE—PeripheralSan Fratello67.633350
MadonieE—PeripheralSan Marco d’Alunzio26.141830
MadonieE—PeripheralSan Salvatore di Fitalia15.001178
MadonieE—PeripheralSant’Agata di Militello33.9811,989
MadonieD—IntermediateSanto Stefano di Camastra21.924416
MadonieE—PeripheralTortorici70.505908
MadonieD—IntermediateTusa41.072663
NSIA 2021–2027NSIA-2020MunicipalitiesTot. Surface Area (sq.km.)Tot. Population (ISTAT 2020)
MussomeliE—PeripheralCammarata192.035930
MussomeliD—IntermediateCasteltermini99.517473
MussomeliE—PeripheralSan Giovanni Gemini26.307590
MussomeliD—IntermediateAcquaviva Platani14.72891
MussomeliD—IntermediateBompensiere19.74522
MussomeliD—IntermediateCampofranco36.062758
MussomeliE—PeripheralMarianopoli12.961669
MussomeliE—PeripheralMussomeli163.9010,059
MussomeliD—IntermediateMilena24.562777
MussomeliD—IntermediateMontedoro14.141418
MussomeliD—IntermediateSutera35.551234
NSIA 2014–2020NSIA-2020MunicipalitiesTot. Surface Area (sq.km.)Tot. Population (ISTAT 2020)
NebrodiF—Ultra-peripheralAlcara li Fusi62.93461763
NebrodiE—PeripheralCaronia227.25873097
NebrodiE—PeripheralCastel di Lucio28.77811206
NebrodiE—PeripheralCastell’Umberto11.42822872
NebrodiE—PeripheralFrazzanò6.9981601
NebrodiE—PeripheralGalati Mamertino39.31082361
NebrodiF—Ultra-peripheralLongi42.10991348
NebrodiE—PeripheralMilitello Rosmarino29.53561197
NebrodiE—PeripheralMirto9.2692913
NebrodiE—PeripheralMistretta127.46784434
NebrodiE—PeripheralMotta d’Affermo14.5764670
NebrodiE—PeripheralNaso36.73673523
NebrodiD—IntermediatePettineo30.61641240
NebrodiD—IntermediateReitano14.1173733
NebrodiE—PeripheralSan Fratello67.62923350
NebrodiE—PeripheralSan Marco d’Alunzio26.14071830
NebrodiE—PeripheralSan Salvatore di Fitalia14.99631178
NebrodiE—PeripheralSant’Agata di Militello33.976411,989
NebrodiD—IntermediateSanto Stefano di Camastra21.91734416
NebrodiE—PeripheralTortorici70.50085908
NebrodiD—IntermediateTusa41.07372663
NSIA 2021–2027NSIA-2020MunicipalitiesTot. Surface Area (sq.km.)Tot. Population (ISTAT 2020)
PalagoniaE—PeripheralCastel di Iudica14.144352
PalagoniaE—PeripheralMilitello in Val di Catania62.146792
PalagoniaE—PeripheralPalagonia57.6615,805
PalagoniaE—PeripheralRaddusa23.322875
PalagoniaE—PeripheralRamacca305.3810,377
PalagoniaD—IntermediateScordia24.2616,296
NSIA 2021–2027NSIA-2020MunicipalitiesTot. Surface Area (sq.km.)Tot. Population (ISTAT 2020)
Santa Teresa di RivaE—PeripheralAlì16.69702
Santa Teresa di RivaF—Ultra-peripheralAntillo43.4844
Santa Teresa di RivaE—PeripheralCasalvecchio Siculo33.37749
Santa Teresa di RivaE—PeripheralFiumedinisi35.991294
Santa Teresa di RivaE—PeripheralForza d’Agrò11.18883
Santa Teresa di RivaD—IntermediateFurci Siculo17.863205
Santa Teresa di RivaE—PeripheralLimina9.81735
Santa Teresa di RivaE—PeripheralMandanici11.65557
Santa Teresa di RivaD—IntermediateNizza di Sicilia13.183518
Santa Teresa di RivaD—IntermediatePagliara14.571097
Santa Teresa di RivaE—PeripheralRoccafiorita1.14182
Santa Teresa di RivaD—IntermediateRoccalumera8.773953
Santa Teresa di RivaE—PeripheralSant’Alessio Siculo6.171488
Santa Teresa di RivaD—IntermediateSanta Teresa di Riva8.139271
Santa Teresa di RivaE—PeripheralSavoca8.801660
NSIA 2014–2020NSIA-2020MunicipalitiesTot. Surface Area (sq.km.)Tot. Population (ISTAT 2020)
Terre SicaneE—PeripheralAlessandria della Rocca62.23952567
Terre SicaneF—Ultra-peripheralBivona88.57323298
Terre SicaneE—PeripheralBurgio42.23072532
Terre SicaneE—PeripheralCalamonaci32.89011203
Terre SicaneD—IntermediateCattolica Eraclea62.16383364
Terre SicaneE—PeripheralCianciana38.08153177
Terre SicaneF—Ultra-peripheralLucca Sicula18.6321730
Terre SicaneD—IntermediateMontallegro27.41242385
Terre SicaneE—PeripheralRibera118.52118,058
Terre SicaneE—PeripheralSan Biagio Platani42.66632946
Terre SicaneF—Ultra-peripheralSanto Stefano Quisquina85.51834216
Terre SicaneE—PeripheralVillafranca Sicula17.62921358
NSIA 2021–2027NSIA-2020MunicipalitiesTot. Surface Area (sq.km.)Tot. Population (ISTAT 2020)
TroinaE—PeripheralAgira163.117756
TroinaE—PeripheralAssoro111.504892
TroinaD—IntermediateCalascibetta88.174169
TroinaF—Ultra-peripheralCerami94.871859
TroinaD—IntermediateCatenanuova11.174519
TroinaE—PeripheralGagliano Castelferrato563368
TroinaE—PeripheralLeonforte84.0912,583
TroinaF—Ultra-peripheralNicosia217.8712,947
TroinaE—PeripheralNissoria61.622849
TroinaF—Ultra-peripheralSperlinga58.76691
TroinaF—Ultra-peripheralTroina166.958699
TroinaE—PeripheralRegalbuto169.276830
TroinaE—PeripheralValguarnera Caropepe9.327163
TroinaD—IntermediateVillarosa55.014496
NSIA 2014–2020NSIA-2020MunicipalitiesTot. Surface Area (sq.km.)Tot. Population (ISTAT 2020)
Valle del SimetoE—PeripheralAdrano83.220833,926
Valle del SimetoD—IntermediateBiancavilla70.275322,987
Valle del SimetoE—PeripheralCenturipe174.19465172

Appendix B

Figure A1. (a) The value tree for urban capital; (b) Map of the urban capital endowment in the Sicily region.
Land 14 01916 g0a1
Figure A2. Comparisons between provinces, municipalities, and NSIA classification classes, based on quartiles of the aggregate urban capital index.
Land 14 01916 g0a2
Figure A3. (a) The value tree for infrastructural capital; (b) Map of the infrastructural capital endowment in the Sicily region.
Land 14 01916 g0a3
Figure A4. Comparisons between provinces, municipalities, and NSIA classification classes, based on quartiles of the aggregate infrastructural capital index.
Land 14 01916 g0a4
Figure A5. (a) The value tree for economic capital; (b) Map of the economic capital endowment in the Sicily region.
Land 14 01916 g0a5
Figure A6. Comparisons between provinces, municipalities, and NSIA classification classes, based on quartiles of the aggregate economic capital index.
Land 14 01916 g0a6
Figure A7. (a) The value tree for natural capital; (b) Map of the natural capital endowment in the Sicily region.
Land 14 01916 g0a7
Figure A8. Comparisons between provinces, municipalities, and NSIA classification classes, based on quartiles of the aggregate natural capital index.
Land 14 01916 g0a8
Figure A9. (a) The value tree for environmental capital; (b) Map of the environmental capital endowment in the Sicily region.
Land 14 01916 g0a9
Figure A10. Comparisons between provinces, municipalities, and NSIA classification classes, based on quartiles of the aggregate environmental capital index.
Land 14 01916 g0a10
Figure A11. Funding for NSIA in the Troina area, according to OpenCoesione data 1 [165,166].
Land 14 01916 g0a11
Figure A12. Funding for NSIA in the Troina area, according to OpenCoesione data—2 [166,167].
Land 14 01916 g0a12
Figure A13. Funding for NSIA in the Troina area, according to Italia domani data [166,167].
Land 14 01916 g0a13

References

  1. Trovato, M.R.; Nasca, L.; Giuffrida, S.; Ventura, V. Centre Versus Periphery. Territorial Imbalance from Perspectives of the Multiple Capital Dimensions. In Networks, Markets & People, Proceedings of the NMP 2024, Reggio Calabria, Italy, 22–24 May; Lecture Notes in Networks and Systems; Calabrò, F., Madureira, L., Morabito, F.C., Piñeira Mantiñán, M.J., Eds.; Springer: Cham, Switzerland, 2024; Volume 1186. [Google Scholar] [CrossRef]
  2. Giuffrida, S.; Trovato, M.R.; Strigari, A.; Napoli, G. Houses for One Euro” and the Territory. Some Estimation Issues for the “Geographic Debt” Reduction. In New Metropolitan Perspectives, Proceedings of the NMP 2020, Reggio Calabria, Italy, 18–23 May 2020; Smart Innovation, Systems and Technologies; Bevilacqua, C., Calabrò, F., Della Spina, L., Eds.; Springer: Cham, Switzerland, 2020; Volume 178, pp. 1043–1052. [Google Scholar] [CrossRef]
  3. Halás, M.; Klapka, P.; Tonev, P. A Contribution to Human Geographical Regionalisation of the Czech Republic at the Mezzo Level. In Proceedings of the 17th International Colloquium on Regional Sciences, Hustopece, Czech Republic, 18–20 June 2014; Klimova, V., Zitek, V., Eds.; Masarykova University: Brno, Czech Republic, 2014; pp. 715–721. [Google Scholar]
  4. Copus, A.; de Lima, P. Territorial Cohesion in Rural Europe: The Relational Turn in Rural Development; Routledge: London, UK, 2014. [Google Scholar] [CrossRef]
  5. Leibert, T. The Peripheralization of Rural Areas in Post- socialist Central Europe: A Case of Fragmenting Development? Lessons from Rural Hungary. In Peripheralization; Fischer-Tahir, A., Naumann, M., Eds.; Springer: Wiesbaden, Germany, 2013. [Google Scholar] [CrossRef]
  6. Naumann, M.; Reichert-Schick, A. Infrastructure and Peripheralization: Empirical Evidence from North-Eastern Germany. In Peripheralization; Fischer-Tahir, A., Naumann, M., Eds.; Springer: Wiesbaden, Germany, 2013. [Google Scholar] [CrossRef]
  7. Bürk, T. Voices From the Margin: The Stigmatization Process as an Effect of Socio-Spatial Peripheralization in Small-Town Germany. In Peripheralization; Fischer-Tahir, A., Naumann, M., Eds.; Springer: Wiesbaden, Germany, 2013. [Google Scholar] [CrossRef]
  8. Havlíček, T.; Chromý, P. Contribution to the Theory of Polarized Development of a Territory, with a Special Attention Paid to Peripheral Regions. Geografie 2001, 106, 1–11. [Google Scholar] [CrossRef]
  9. Heidenreich, M. Regional Inequalities in the Enlarged Europe. J. Eur. Soc. Policy 2003, 13, 313–333. [Google Scholar] [CrossRef]
  10. Franzini, M.; Pianta, M. Explaining Inequality; Routledge: London, UK; New York, NY, USA, 2015; ISBN 1317561023. [Google Scholar]
  11. Naumann, M.; Fischer-Tahir, A. Peripheralization: The Making of Spatial Dependencies and Social Injustice; Springer Science & Business Media: Berlin/Heidelberg, Germany, 2013; ISBN 3531190180. [Google Scholar]
  12. Sassen, S. Cities in a World Economy; SAGE Publications, Inc.: Thousand Oaks, CA, USA, 2018; ISBN 9781506362618. [Google Scholar]
  13. Giuffrida, S.; Napoli, G.; Trovato, M.R. Industrial Areas and the City. Equalization and Compensation in a Value-Oriented Allocation Pattern. In Computational Science and Its Applications—ICCSA 2016, Proceedings of the ICCSA 2016, Beijing, China, 4–7 July 2016; Lecture Notes in Computer, Science; Gervasi, O., Murgante, B., Misra, S., Rocha, A.M.A.C., Torre, C.M., Taniar, D., Apduhan, B.O., Stankova, E., Wang, S., Eds.; Springer: Cham, Switzerland, 2016; Volume 9789. [Google Scholar] [CrossRef]
  14. Oppido, S.; Ragozino, S.; Espostio De Vita, G. Peripheral, Marginal, or Non-Core Areas? Setting the Context to Deal with Territorial Inequalities through a Systematic Literature Review. Sustainability 2023, 15, 10401. [Google Scholar] [CrossRef]
  15. Sassen, S. Expulsions: Brutality and Complexity in the Global Economy; Harvard University Press: Cambridge, MA, USA, 2014; ISBN 0674599225. [Google Scholar]
  16. ESPON. Policy Brief: Shrinking Rural Regions in Europe. Towards Smart and Innovative Approaches to Regional Development Challenges in Depopulating Rural Regions. 2017. Available online: https://www.espon.eu/rural-shrinking (accessed on 4 August 2024).
  17. Martinez-Fernandez, C.; Audirac, I.; Fol, S.; Cunningham-Sabot, E. Shrinking Cities: Urban Challenges of Globalization. Int. J. Urban Reg. Res. 2012, 33, 213–225. [Google Scholar] [CrossRef]
  18. Oswalt, P.; Haslam, D.; Kil, W.; Prigge, W.; Ronneberger, K.; Thomas Sugrue, T.; Douglas, S. Shrinking Cities; Hatje Cantz Verlag: Ostfildern, Germany, 2005; Volume 1. [Google Scholar]
  19. Oswalt, P.; Alsop, W.; Baur, R. Shrinking Cities 2; Hatje Cantz Verlag: Ostfildern, Germany, 2006. [Google Scholar]
  20. ESPON; University of Geneva. European Perspective on Specific Types of Territories. Applied Research 2013/1/12. Final Report|Version 20/12/2012. 2012. Available online: https://www.espon.eu/sites/default/files/attachments/GEOSPECS_Final_Report_v8___revised_version.pdf (accessed on 2 June 2024).
  21. ESPON. PROFECY—Processes, Features and Cycles of Inner Peripheries in Europe. Applied Research. Final Report. Version 07/12/2017. 2017. Available online: https://www.espon.eu/sites/default/files/attachments/D5%20Final%20Report%20PROFECY.pdf (accessed on 2 June 2024).
  22. Bernt, M.; Colini, L. Exclusion, Marginalization and Peripheralization. Work. Pap. 2013, 49, 1–30. [Google Scholar]
  23. Kinossian, N. Planning Strategies and Practices in Non-Core Regions: A Critical Response. Eur. Plan. Stud. 2017, 26, 365–375. [Google Scholar] [CrossRef]
  24. Trovato, M.R.; Nasca, L.; Giuffrida, S.; Ventura, V. Convergences Versus Gaps. Capital Axiology as a Cognitive Pattern of Territorial Fragility. In Computational Science and Its Applications—ICCSA 2025 Workshops, Proceedings of the ICCSA 2025, Istanbul, Turkey, 30 June—3 July 2025; Lecture Notes in Computer Science; Gervasi, O., Murgante, B., Garau, C., Karaca, Y., Faginas Lago, M.N., Scorza, F., Brage, A.C., Eds.; Springer: Cham, Switzerland, 2025; Volume 15889. [Google Scholar] [CrossRef]
  25. Friedman, J.R. Regional Development Policy: A Case of Venezuela; The MIT Press: Cambridge, MA, USA, 1966; ISBN 9780262060134. [Google Scholar]
  26. Tiebout, C.M. A Pure Theory of Local Expenditures. J. Political Econ. 1956, 64, 416–424. [Google Scholar] [CrossRef]
  27. Banzhaf, H.S.; Walsh, R.P. Do People Vote with Their Feet? An Empirical Test of Tiebout’s Mechanism. Am. Econ. Rev. 2008, 98, 843–863. Available online: https://www.aeaweb.org/articles?id=10.1257/aer.98.3.843 (accessed on 2 April 2025). [CrossRef]
  28. Hachadoorian, L. Homogeneity tests of Tiebout sorting: A case study at the interface of city and suburb. Urban Sci. 2015, 53, 1000–1021. [Google Scholar] [CrossRef]
  29. Bayer, P.; Ferreira, F.; McMillan, R. A Unified Framework for Measuring Preferences for Schools and Neighborhoods; National Bureau of Economic Research: Cambridge, MA, USA, 2007; Available online: http://www.nber.org/papers/w13236 (accessed on 2 April 2025).
  30. Hanlon, B.; Short, J.R.; Vicino, T.J. Cities and Suburbs: New Metropolitan Realities in the US; Routledge: Oxford, UK, 2009. [Google Scholar]
  31. Bickers, K.; Engstrom, R.N. Tiebout sorting in metropolitan areas. Rev. Policy Res. 2006, 23, 1181–1198. [Google Scholar] [CrossRef]
  32. Heikkila, E.J. Are municipalities Tieboutian clubs? Reg. Sci. Urban Econ. 1996, 26, 203–226. [Google Scholar] [CrossRef]
  33. Hall, P.; Hay, D. Growth Centres in the European Urban System; Heinemann: London, UK, 1980. [Google Scholar]
  34. Klaassen, L.H.; Paelinck, J.H.P. The future of large towns. Environ. Plan. A 1979, 11, 10951104. [Google Scholar] [CrossRef]
  35. Klaassen, L.H.; Scimemi, G. Theoretical issues in urban dynamics. In Dynamics of Urban Development; Klaassen, L.H., Molle, W.T.M., Paelinck, J.H.P., Eds.; Gower: Aldershot, UK, 1981; p. 828. [Google Scholar]
  36. Klaassen, L.H.; Bourdrez, J.A.; Vollmuller, J. Transport and Reurbanization; Gower: Aldershot, UK, 1981. [Google Scholar]
  37. van den Berg, L.; van der Meer, J. Urban Change in the Netherlands. In Dynamics of Urban Development; Klaassen, L.H., Molle, W.T.M., Paelinck, J.H.P., Eds.; Gower: Aldershot, UK, 1981; p. 137169. [Google Scholar]
  38. Cheshire, P.C.; Hay, D.G. Urban Problems in Western Europa: An Economic Analysis; Routledge: London, UK, 1989. [Google Scholar]
  39. Aydalot, P. Economie Régionale et Urbaine; Economica: Paris, France, 1985. [Google Scholar]
  40. van den Berg, L.; Klaassen, L.H. The contagiouness of urban decline. In Spatial Cycles; van den Berg, L., Burns, L.S., Klaassen, L.H., Eds.; Gower: Aldershot, UK, 1987; p. 8894. [Google Scholar]
  41. Kawashima, T. Is disurbanisation foreseeable in Japan? A comparison between US and Japanese urbanisation processes. In Spatial Cycles; van den Berg, L., Burns, L.S., Klaassen, L.H., Eds.; Gower: Aldershot, UK, 1987; p. 100126. [Google Scholar] [CrossRef]
  42. Kühn, M. Peripheralization: Theoretical Concepts Explaining Socio-Spatial Inequalities. Eur. Plan. Stud. 2015, 23, 367–378. [Google Scholar]
  43. Copus, A.; Mantino, F.; Noguera, J. Inner Peripheries: An Oxymoron or a Real Challenge for Territorial Cohesion? Ital. J. Plan. Pract. 2017, 7, 24–49. [Google Scholar]
  44. Spiekermann, K.; Neubauer, J. European Accessibility and Peripherality: Concepts, Models and Indicators; Nordregio: Stockholm, Sweden, 2002. [Google Scholar]
  45. Fischer-Tahir, A.; Naumann, M. Introduction: Peripheralization as the Social Production of Spatial Dependencies and Injustice. In Peripheralization; Fischer-Tahir, A., Naumann, M., Eds.; Springer: Wiesbaden, Germany, 2013. [Google Scholar] [CrossRef]
  46. Copus, A. From Core-Periphery to Polycentric Development: Concepts of Spatial and Aspatial Peripherality. Eur. Plan. Stud. 2001, 9, 539–552. [Google Scholar]
  47. Torre, A.; Rallet, A. Proximity and localization. Reg. Stud. 2005, 39, 47–59. [Google Scholar] [CrossRef]
  48. Esposito De Vita, G.; Marchigiani, E.; Camilla, P. Sui Margini: Una Mappatura Di Aree Interne e Dintorni. BDC 2021, 21, 183–216. [Google Scholar]
  49. European Parliament. Single European Act. Official Journal of the European Communities, No L169/1, 29.06.87. Available online: https://eur-lex.europa.eu/legal-content/EN/TXT/PDF/?uri=CELEX:11986U/TXT (accessed on 2 June 2024).
  50. European Parliament. Treaty of Lisbon. Official Journal of the European Communities, C306, Vo. 50 17-12-2007. Available online: https://eur-lex.europa.eu/legal-content/EN/TXT/?uri=oj:JOC_2007_306_R_TOC (accessed on 2 June 2024).
  51. European Commission; Christophersen, H. Guide to the Reform of the Community’s Structural Funds, Publications Office. 1989. Available online: https://op.europa.eu/en/publication-detail/-/publication/80ad8eda-9206-4a51-9814-be85d4da4886 (accessed on 2 June 2024).
  52. Commission of the European Communities. Green Paper on Territorial Cohesion Turning Territorial Diversity into Strength, Brussels, 6.10.2008 COM(2008) 616 Final. Available online: https://eur-lex.europa.eu/LexUriServ/LexUriServ.do?uri=COM:2008:0616:FIN:EN:PDF (accessed on 2 June 2024).
  53. European Parliament. Green Paper on Territorial Cohesion and Debate on the Future Reform of the Cohesion Policy. Official Journal of the European Union, C 117 E/65, 24-03-2009. Available online: https://op.europa.eu/en/publication-detail/-/publication/d986b0c0-e58d-4ced-8bba-083a28d00ffa/language-it (accessed on 2 June 2024).
  54. European Parliament. The treaty on the functioning of the Europea Union. Official EN Journal of the European Union, C 326/47, 26-10-2012. Available online: https://eur-lex.europa.eu/LexUriServ/LexUriServ.do?uri=CELEX:12012E/TXT:en:PDF (accessed on 2 June 2024).
  55. United Nations. Sustainable Development Goals. 2015. Available online: https://www.un.org/sustainabledevelopment/ (accessed on 3 April 2024).
  56. Piattoni, S.; Polverari, L. Handbook on Cohesion Policy in the EU; Edward Elgar Publishing: Cheltenham/Camberley, UK, 2016; ISBN 1784715670. [Google Scholar]
  57. Viesti, G. The European Regional Development Policies. In The History of the European Union: Constructing Utopia; Amato, G., Moavero-Milanesi, E., Pasquino, G., Reichlin, L., Eds.; Bloomsbury Publishing: London, UK, 2019; pp. 385–400. ISBN 150991742X. [Google Scholar]
  58. Italian Government. Decree-Law No. 77 of 31 May 2021. Governance of the National Recovery and Resilience Plan and Initial Measures to Strengthen Administrative Structures and Accelerate and Streamline Procedures. (Clause 40% PNRR Southern Italy Re-sources), Rome, Italy. Available online: https://www.gazzettaufficiale.it/eli/id/2021/05/31/21G00087/SG (accessed on 2 April 2025).
  59. Italian Government. Law No. 101 of 1 July 2021. Conversion into Law, with Amendments, of Decree-Law No 59 of 6 May 2021 on Urgent Measures Relating to the Supplementary Fund for the National Recovery and Resilience Plan and Other Urgent Investment Measures. (Clause 40% PNRR Southern Italy resources), Rome, Italy. Available online: https://www.gazzettaufficiale.it/eli/id/2021/07/06/21G00111/SG (accessed on 2 April 2025).
  60. Italian Government. Decree- Law the 6 August 2021. Allocation of Financial Resources Provided for the Implementation of the Interventions of the National Recovery and Resilience Plan (NPRR) and Allocation of Targets and Objectives by Six-Monthly Reporting Deadlines. Rome, Italy. Available online: https://www.gazzettaufficiale.it/eli/id/2021/09/24/21A05556/sg (accessed on 2 April 2025).
  61. Italian Government. Decree-Law No. 13 of 24 February 2023. Urgent Provisions for the Implementation of the National Plan for Recovery and Resilience (NPRR) and the National Plan for Complementary Investments to the NPRR (PNC), as Well as for the Implementation of Cohesion Policies and the Common Agricultural Policy. Rome, Italy. Available online: https://www.gazzettaufficiale.it/eli/id/2023/02/24/23G00022/SG (accessed on 3 May 2025).
  62. Comunicazione Della Commissione Europea. EUROPA 2020 Una Strategia per una Crescita Intelligente, Sostenibile e Inclusiva, Bruxelles, 3.3.2010 COM(2010) 2020. Available online: https://eur-lex.europa.eu/LexUriServ/LexUriServ.do?uri=COM:2010:2020:FIN:IT:PDF (accessed on 2 June 2024).
  63. Commissione Europea. Rural Vision. 2022. Available online: https://rural-vision.europa.eu/index_it (accessed on 2 June 2024).
  64. Italian Government. Law No. 178 of 30 December 2020. State Budget for the 2021 Financial Year and Multi-Year Budget for the Three-Year Period 2021-2023. Rome, Italy 2021. Available online: https://www.gazzettaufficiale.it/atto/vediMenuHTML?atto.dataPubblicazioneGazzetta=2020-12-30&atto.codiceRedazionale=20G00202&tipoSerie=serie_generale&tipoVigenza=originario (accessed on 3 May 2025).
  65. Prime Ministerial. Decree 30 November 2021. Countering Deindustrialisation Fund, Rome, Italy. Available online: https://www.gazzettaufficiale.it/eli/id/2022/01/14/22A00106/SG (accessed on 1 April 2024).
  66. Prime Ministerial. Decree 30 September 2021. Marginal Municipalities, Rome, Italy. Available online: https://www.gazzettaufficiale.it/eli/id/2021/12/14/21A07265/sg (accessed on 1 April 2024).
  67. Prime Ministerial. Decree 24 September 2020. Inner Areas Municipalities, Rome, Italy. Available online: https://www.gazzettaufficiale.it/eli/id/2020/12/04/20A06526/sg (accessed on 1 April 2024).
  68. Agency for Territorial Cohesion. National Strategy for Inner Areas. Available online: https://www.agenziacoesione.gov.it/strategia-nazionale-aree-interne/la-selezione-delle-aree/ (accessed on 13 April 2022).
  69. Agenzia per la Coesione Territoriale. PNRR Missione 5, Componente 3, Investimento 1.1.1. 2022. Available online: https://www.agenziacoesione.gov.it/bandi-agenzia/avviso-pubblico-per-la-presentazione-di-proposte-di-intervento-per-servizi-e-infrastrutture-sociali-di-comunita-da-finanziare-nellambito-del-pnrr/ (accessed on 1 April 2024).
  70. Dall’Erba, S.; Le Gallo, J. Regional convergence and the impact of European structural funds 1989–1999: A spatial econometric analysis. Pap. Reg. Sci. 2008, 87, 219–244. [Google Scholar] [CrossRef]
  71. Becker, S.O.; Egger, P.H.; Von Ehrlich, M. Too much of a good thing? On the growth effects of the EU’s regional policy. Eur. Econ. Rev. 2012, 56, 648–668. [Google Scholar]
  72. Fratesi, U. Impact assessment of European cohesion policy: Theoretical and empirical issues. In Handbook on Cohesion Policy in the EU; Piattoni, S., Polverari, L., Eds.; Edward Elgar: Cheltenham, UK, 2016; pp. 443–460. ISBN 978-1-78471-566-3. [Google Scholar]
  73. Fratesi, U.; Perucca, G. EU Regional Policy Effectiveness and the Role of Territorial Capital. In Regeneration of the Built Environment from a Circular Economy Perspective; Research for Development; Della Torre, S., Cattaneo, S., Lenzi, C., Zanelli, A., Eds.; Springer: Cham, Switzerland, 2020. [Google Scholar] [CrossRef]
  74. Trovato, M.R.; Nasca, L. An Axiology of Weak Areas: The Estimation of an Index of Abandonment for the Definition of a Cognitive Tool to Support the Enhancement of Inland Areas in Sicily. Land 2022, 11, 2268. [Google Scholar] [CrossRef]
  75. Camagni, R. Regional competitiveness: Towards a concept of territorial capital. In Modelling Regional Scenarios for the Enlarged Europe; Springer: Berlin/Heidelberg, Germany, 2008; pp. 33–47. ISBN 978-3-540-74736-9. [Google Scholar]
  76. Giuffrida, S.; Trovato, M.R. Why Foundations …? Evaluation as Civil Commitment. In Science of Valuations; Green Energy and Technology; Giuffrida, S., Trovato, M.R., Rosato, P., Fattinnanzi, E., Oppio, A., Chiodo, S., Eds.; Springer: Cham, Switzerland, 2024. [Google Scholar] [CrossRef]
  77. Rolando, D.; Barreca, A.; Rebaudengo, M. The SAVV+P method: Integrating qualitative and quantitative analyses to evaluate the territorial potential. In Proceedings of the ICCSA 2023, Athens, Greece, 3–6 July 2023; Gervasi, O., Murgante, B., Rocha, A.M.A.C., Garau, C., Scorza, F., Karaca, Y., Torre, M.C., Eds.; Springer: Cham, Switzerland, 2023; Volume 14106, pp. 249–261. [Google Scholar] [CrossRef]
  78. Rolando, D.; Barreca, A.; Malavasi, G.; Rebaudengo, M. Data-Driven AI Approach to Address Territorial Strategies. Why Investing in Agri-Food Sector to Enhance the Valsesia Inner Area. In Computational Science and Its Applications—ICCSA 2025 Workshops, Proceedings of the ICCSA 2025, Istanbul, Turkey, 30 June–3 July 2025; Lecture Notes in Computer, Science; Gervasi, O., Murgante, B., Rocha, A.M.A.C., Garau, C., Scorza, F., Karaca, Y., Torre, M.C., Eds.; Springer: Cham, Switzerland, 2025; Volume 15889. [Google Scholar] [CrossRef]
  79. Cappello, C. Resistance to Sardinia’s Guarded Capacity: Multicriterial Mapping for Strategies and Valorization of Abandoned Places. In Computational Science and Its Applications—ICCSA 2024 Workshops, Proceedings of the ICCSA 2024, Hanoi, Vietnam, 1–4 July 2024; Lecture Notes in Computer, Science; Gervasi, O., Murgante, B., Garau, C., Taniar, D., Rocha, A.M.A.C., Faginas Lago, M.N., Eds.; Springer: Cham, Switzerland, 2024; Volume 14819. [Google Scholar] [CrossRef]
  80. Düzgün, E. The Poverty of “Peripheralization”: Re-conceptualizing the Peripheral Space. In Peripheralization; Fischer-Tahir, A., Naumann, M., Eds.; Springer: Wiesbaden, Germany, 2013. [Google Scholar] [CrossRef]
  81. Norese, M.F.; Rolando, D.; Rocco, C. DIKEDOC: A multicriteria methodology to organise and communicate knowledge. Ann. Oper. Res. 2023, 325, 2. [Google Scholar] [CrossRef]
  82. Trovato, M.R. A multi-criteria approach to support the retraining plan of the Biancavilla’s old town. In New Metropolitan Perspectives, Smart Innovation, Systems and Technologies, Proceedings of the 3rd International New Metropolitan Perspectives, Local Knowledge and Innovation Dynamics Towards Territory Attractiveness Through the Implementation of Horizon/Europe2020/Agenda2030, Reggio Calabria, Italy, 22–25 May 2018; Bevilacqua, C., Calabro, F., Della Spina, L., Eds.; Springer: Cham, Switzerland, 2019; Volume 101, pp. 434–441. [Google Scholar] [CrossRef]
  83. Jin, G.; Shi, X.; He, D.; Guo, B.; Li, Z.; Shi, X. Designing a spatial pattern to rebalance the orientation of development and protection in Wuhan. J. Geogr. Sci. 2020, 30, 569–582. [Google Scholar] [CrossRef]
  84. Chang, C.H.; Erbaugh, J.T.; Fajardo, P.; Lu, L.; Molnár, I.; Papp, D.; Robinson, B.E.; Austin, K.G.; Castro, M.; Cheng, S.H.; et al. Global evidence of human well-being and biodiversity impacts of natural climate solutions. Nat. Sustain. 2025, 8, 75–85. [Google Scholar] [CrossRef]
  85. Ferretti, V. From stakeholders analysis to cognitive mapping and Multi-Attribute Value Theory: An integrated approach for policy support. Eur. J. Oper. Res. 2016, 253, 524–541. [Google Scholar] [CrossRef]
  86. Comino, E.; Ferretti, V. Indicators-based spatial SWOT analysis: Supporting the strategic planning and management of complex territorial systems. Ecol. Indic. 2016, 60, 1104–1117. [Google Scholar] [CrossRef]
  87. Martin, W.E.; Wise Bender, H.; Shields, D.J. Stakeholder objectives for public lands: Rankings of forest management alternatives. J. Environ. Manag. 2000, 58, 21–32. [Google Scholar] [CrossRef]
  88. Zhang, W.; Zhang, X.; Wu, G. The network governance of urban renewal: A comparative analysis of two cities in China. Land Use Policy 2021, 106, 105448. [Google Scholar] [CrossRef]
  89. Ferretti, V.; Comino, E. An integrated framework to assess complex cultural and natural heritage systems with Multi-Attribute Value Theory. J. Cult. Herit. 2015, 16, 688–697. [Google Scholar] [CrossRef]
  90. Jaffar, A.; Ming, X.; Riaz Raja, M.; Tetteh, A.; Hussain, A.; Answer, M.; Ali, N. An Innovative Approach in Decision-making Environments: Assessing Performance by Applying Multi-attribute Value Theory (MAVT). Asian J. Multidiscip. Stud. 2015, 3, 141–150. [Google Scholar]
  91. Ferretti, V.; Bottero, M.; Mondini, G. From Indicators to Composite Indexes: An Application of the Multi-Attribute Value Theory for Assessing Sustainability. Adv. Eng. Forum 2015, 11, 536–541. [Google Scholar] [CrossRef]
  92. Siebert, J.U. A Multiplicative Approach in Multiattribute Value Theory: The Aggregated Performance Factor Model. In Decision Analysis and Multiple Criteria Decision Making: Proceedings of the Joint GOR-DASIG Conference; Shaker: Aachen, Germany, 2013; pp. 103–132. [Google Scholar]
  93. Hajkowicz, S. Multi-attributed environmental index construction. Ecol. Econ. 2006, 57, 122–139. [Google Scholar] [CrossRef]
  94. El Gibari, S.; Gómez, T.; Ruiz, F. Building composite indicators using multicriteria methods: A review. J. Bus. Econ. 2019, 89, 1–24. [Google Scholar] [CrossRef]
  95. Ferretti, V.; Bottero, M.; Mondini, G. Decision making and cultural heritage: An application of the Multi-Attribute Value Theory for the reuse of historical building. J. Cult. Herit. 2014, 15, 644–655. [Google Scholar] [CrossRef]
  96. Scolaro Monsù, A.; Cappello, C. The Realms of Abandonment: Measures and Interpretations of Landscape Value/Risk in Northern Sardinia (Italy). Land 2023, 12, 1274. [Google Scholar] [CrossRef]
  97. Sica, F.; Tajani, F.; Guarini, M.R.; Ranieri, R. A Sensitivity Index to Perform the Territorial Sustainability in Uncertain Decision-Making Conditions. Land 2023, 12, 432. [Google Scholar] [CrossRef]
  98. Cerreta, M. Thinking through complex values. In Making Strategies in Spatial Planning; Springer: Dordrecht, The Netherlands, 2010; pp. 381–404. [Google Scholar] [CrossRef]
  99. Giuffrida, S.; Trovato, M.R.; Ventura, V.; Cappello, C.; Nasca, L. Concepts and Tools for the Emergence of the Axiological Subject in the Prospect of Territorial Rebalancing. In Networks, Markets & People, Proceedings of the NMP 2024, Reggio Calabria, Italy, 22–24 May; Lecture Notes in Networks and Systems; Calabrò, F., Madureira, L., Morabito, F.C., Piñeira Mantiñán, M.J., Eds.; Springer: Cham, Switzerland, 2024; Volume 1186. [Google Scholar] [CrossRef]
  100. Trovato, M.R.; Giuffrida, S.; Collesano, G.; Nasca, L.; Gagliano, F. People, Property and Territory: Valuation Perspectives and Economic Prospects for the Trazzera Regional Property Reuse in Sicily. Land 2023, 12, 789. [Google Scholar] [CrossRef]
  101. Camagni, R.; Capello, R. Regional Competitiveness and Territorial Capital: A Conceptual Approach and Empirical Evidence from the European Union. Reg. Stud. 2012, 47, 1383–1402. [Google Scholar] [CrossRef]
  102. Organisation for Economic Co-operation and Development (OECD). OECD Territorial Outlook; OECD: Paris, France, 2001. [Google Scholar]
  103. Camagni, R.; Caragliu, A.; Perucca, G. Draft Version. Territorial capital, relational and human capital. Il CapitaleTerritoriale: Scenari Quali-Quantitativi Di Superamento Della Crisi Economica e Finanziaria Per Le Province Italiane, PRIN. 2011. Available online: https://www.grupposervizioambiente.it/aisre/pendrive2011/pendrive/Paper/Camagni_Caragliu_Perucca.pdf (accessed on 2 April 2024).
  104. Crescenzi, R.; Gagliardi, L.; Percoco, M. Social capital and the innovative performance of Italian provinces. Environ. Plan A 2013, 45, 908–929. [Google Scholar] [CrossRef]
  105. Rodríguez-Pose, A. Do institutions matter for regional development? Reg. Stud. 2013, 47, 1034–1047. [Google Scholar] [CrossRef]
  106. Smetana, S.; Tamásy, C.; Mathys, A.; Heinz, V. Sustainability and regions: Sustainability assessment in regional perspective. Reg. Sci. Policy Pract. 2016, 7, 163–187. [Google Scholar] [CrossRef]
  107. Tödtling., F. Endogenuos approaches to local an regional development policy. In Handbook of Local and Regional Development; Pike, A., Rodriguez-Pose, A., Tomaney, J., Eds.; Routlege: New York, NY, USA, 2010; pp. 333–334. [Google Scholar]
  108. Vazquez-Barquero, A.; Rodriguez-Cohard, J.C. Local development in a global world: Challenges and opportunities. Reg. Sci. Policy Pract. 2018, 11, 885–897. [Google Scholar] [CrossRef]
  109. Presidenza del Consiglio dei Ministri. Dipartimento per le Politiche di Coesione. Nucleo di Valutazione e Analisi per la Programmazione. Criteri per la Selezione delle Aree Interne da Sostenere nel Ciclo 2021–2027. Roma, Italy. 2022. Available online: https://lineaamica.gov.it/docs/default-source/focus/criteri-aree-interne.pdf?sfvrsn=c61e29a0_4 (accessed on 3 May 2025).
  110. Nasca, L.; Giuffrida, S.; Trovato, M.R. Value and Quality in the Dialectics between Human and Urban Capital of the City Networks on the Land District Scale. Land 2022, 11, 34. [Google Scholar] [CrossRef]
  111. Governo Italiano, Presidenza del Consiglio del Consiglio dei Ministri. Urban Index. Indicatori per le Politiche Urbane. Available online: https://www.pnmetroplus.it/wp-content/uploads/2017/05/presentazione_urbanindex_step7.pdf (accessed on 13 April 2022).
  112. Trovato, M.R.; Ventura, V.; Lanzafame, M.; Giuffrida, S.; Nasca, L. Seismic–Energy Retrofit as Information-Value: Axiological Programming for the Ecological Transition. Sustainability 2024, 16, 2435. [Google Scholar] [CrossRef]
  113. Giuffrida, S.; Trovato, M.R.; Circo, C.; Ventura, V.; Giuffrè, M.; Macca, V. Seismic Vulnerability and Old Towns. A Cost-Based Programming Model. Geosciences 2019, 9, 427. [Google Scholar] [CrossRef]
  114. Giuffrida, S.; Carocci, C.; Circo, C.; Giuffrè, M.; Trovato, M.R.; Ventura, V. Axiological Strategies in the Old Towns Seismic Vulnerability Mitigation Planning; Valori e Valutazioni; Dei Tipografia del Genio Civile: Rome, Italy, 2020; pp. 99–106. ISSN 20362404. [Google Scholar]
  115. Minioto, C.; Martinico, F.; Trovato, M.R.; Giuffrida, S. Data and Values: Axiological Interpretations of Building Sprawl Landscape Risk in the Rural Territory of Noto (Italy). Land 2023, 12, 1258. [Google Scholar] [CrossRef]
  116. Trovato, M.R. Axiology of Urban Quality. The City as a Functionings System. In Science of Valuations; Green Energy and Technology; Giuffrida, S., Trovato, M.R., Rosato, P., Fattinnanzi, E., Oppio, A., Chiodo, S., Eds.; Springer: Cham, Switzerland, 2024. [Google Scholar] [CrossRef]
  117. Trovato, M.R. Human Capital Approach in the Economic Assessment of Interventions for the Reduction of Seismic Vulnerability in Historic Centres. Sustainability 2020, 12, 8059. [Google Scholar] [CrossRef]
  118. Giuffrida, S.; Trovato, M.R.; Giannelli, A. Semiotic-Sociological Textures of Landscape Values. Assessments in Urban-Coastal Areas. In Information and Communication Technologies in Modern Agricultural Development, Proceedings of the 8th International Conference, HAICTA 2017, Chania, Greece, 21–24 September 2017; Springer International Publishing: Cham, Switzerland, 2019; pp. 35–50. [Google Scholar]
  119. Giuffrida, S.; Gagliano, F.; Trovato, M.R. Land as Information. A Multidimensional Valuation Approach for Slow Mobility Planning. In Proceedings of the 7th International Conference on Information and Communication Technologies in Agriculture, Food and Environment (HAICTA 2015), Kavala, Greece, 17–20 September 2015; Andreopoulou, Z., Bochtis, D., Eds.; Volume 1498, pp. 879–891, ISSN 16130073. [Google Scholar]
  120. Giuffrida, S.; Trovato, M.R.; Falzone, M. The Information Value for Territorial and Economic Sustainability in the Enhancement of the Water Management Process. In Computational Science and Its Applications—ICCSA 2017, Proceedings of the 17th International Conference, Trieste, Italy, 3–6 July 2017; Springer International Publishing: Cham, Switzerland, 2017; pp. 575–590. [Google Scholar]
  121. Giuffrida, S.; Trovato, M.R. A Semiotic Approach to the Landscape Accounting and Assessment. An Application to the Urban-Coastal Areas. In Proceedings of the 8th International Conference on Information and Communication Technologies in Agriculture, Food and Environment, HAICTA 2017, Chania, Greece, 21–24 September 2017; Salampasis, M., Theodoridis, A., Bournaris, T., Eds.; CEUR Workshop Proceedings: Aachen, Germany, 2017; pp. 696–708, ISSN 16130073. [Google Scholar]
  122. Keeney, R.; Raiffa, H. Decisions with Multiple Objectives: Preferences and Value Trade-Offs; Wiley: New York, NY, USA, 1976. [Google Scholar]
  123. Von Winterfeldt, D.; Edwards, W. Decision Analysis and Behavioral Research; Cambridge University Press: Cambridge, UK, 1986. [Google Scholar]
  124. Belton, V.; Stewart, T. Multiple Criteria Decision Analysis: An Integrated Approach; Kluwer Academic Press: Boston, MA, USA, 2002. [Google Scholar]
  125. Greco, S.; Ehrgott, M.; Figueira, J. Multiple Criteria Decision Analysis: State of the Art Surveys; Springer: Berlin/Heidelberg, Germany, 2005. [Google Scholar]
  126. Beinat, E. Value Functions for Environmental Management; Kluwer Academic Publishers: Dordrecht, The Netherlands, 1997. [Google Scholar]
  127. Liu, L.; Zhou, J.; An, X.; Zhang, Y.; Yang, L. Using fuzzy theory and information entropy for water quality assessment in Three Gorges region, China. Expert Syst. Appl. 2010, 37, 2517–2521. [Google Scholar] [CrossRef]
  128. Zou, Z.-H.; Yun, Y.; Sun, J.-N. Entropy method for determination of weight of evaluating indicators in fuzzy synthetic evaluation for water quality assessment. J. Environ. Sci. 2006, 18, 1020–1023. [Google Scholar] [CrossRef] [PubMed]
  129. Ding, X.W.; Chong, X.; Bao, Z.F.; Xue, Y.; Zhang, S.H. Fuzzy comprehensive assessment method based on the entropy weight method and its application in the water environmental safety evaluation of the heshangshan drinking water source area. Three Gorges Reserv. Area 2017, 9, 329. [Google Scholar]
  130. Taheriyoun, M.; Karamouz, M.; Baghvand, A. Development of an entropy-based fuzzy eutrophication index for reservoir water quality evaluation. Iran. J. Environ. Health Sci. Eng. 2010, 7, 1–14. [Google Scholar]
  131. He, D.; Xu, J.; Chen, X. nformation-Theoretic-Entropy Based Weight Aggregation Method in Multiple-Attribute Group Decision-Making. Entropy 2016, 18, 171. [Google Scholar] [CrossRef]
  132. Von Winterfeldt, D.; Fischer, G.W. Multi-Attribute Utility Theory: Models and Assessment Procedures. In Utility, Probability, and Human Decision Making; Theory and Decision Library; Wendt, D., Vlek, C., Eds.; Springer: Dordrecht, The Netherlands, 1975; Volume 11. [Google Scholar] [CrossRef]
  133. van Valkenhoef, G.; Tervonen, T. Entropy-optimal weight constraint elicitation with additive multi-attribute utility models. Omega 2016, 1–12. [Google Scholar] [CrossRef]
  134. Tzengand, G.H.; Huang, J.J. Multiple Attribute Decision Making: Methods and Applications; CRC Press: Boca Raton, FL, USA, 2011. [Google Scholar]
  135. Zhu, Y.; Tian, D.; Yan, F. Effectiveness of entropy weight method in decision-making. Math. Problems Eng. 2020, 2020, 3564835. [Google Scholar] [CrossRef]
  136. Xue, Y.; Sun, Y.; Zhou, J.; Peng, L.; Zhou, X. Multiattribute Decision-Making in Wargames Leveraging the Entropy–Weight Method in Conjunction With Deep Reinforcement Learning. IEEE Trans. Games 2024, 16, 151–156. [Google Scholar] [CrossRef]
  137. Xie, Z.H.; Wu, W.Z.; Wang, L.X.; Tan, A.H. Entropy based optimal scale selection and attribute reduction in multi-scale interval-set decision tables. Int. J. Mach. Learn. Cyber. 2024, 15, 3005–3026. [Google Scholar] [CrossRef]
  138. Wu, J.; Li, P.; Qian, H.; Chen, J. On the sensitivity of entropy weight to sample statistics in assessing water quality: Statistical analysis based on large stochastic samples. Environ. Earth Sci. 2015, 74, 2185–2195. [Google Scholar] [CrossRef]
  139. Yan, F.; Qian, B.; Xiao, X. Geo-accumulation vector model for evaluating the heavy metal pollution in the sediments of Western Dongting Lake. J. Hydrol. 2019, 567, 112–124. [Google Scholar]
  140. Lu, X.; Li, L.Y.; Lei, K.; Wang, L.; Zhai, Y.; Zhai, M. Water quality assessment of Wei River, China using fuzzy synthetic evaluation. Environ. Earth Sci. 2010, 60, 1693–1699. [Google Scholar] [CrossRef]
  141. Zhou, Y.; Zhang, Q.; Li, K.; Chen, X. Hydrological effects of water reservoirs on hydrological processes in the East River (China) basin: Complexity evaluations based on the multi-scale entropy analysis. Hydrol. Process. 2012, 26, 3253–3262. [Google Scholar] [CrossRef]
  142. Montoyo, A.; Muñoz, R.; Gutiérrez, Y. Geo.IA: Artificial geo-intelligence platform to Solve Citizens problems and facilitate strategic decision making in the public administration. In Proceedings of the CEUR Workshop Proceedings, Athens, Greece, 18 November 2024; Volume 3729, pp. 1–5. [Google Scholar]
  143. Grieco, B.; Sacco, S.; Cannatella, D.; Cerreta, M. Spatial Analysis in Multi-Value Assessment for Rural Landscapes: A Comparative Study of ES, LS, and LCA Frameworks. In Computational Science and Its Applications—ICCSA 2025 Workshops, Proceedings of the ICCSA 2025, Istanbul, Turkey, 30 June–3 July 2025; Lecture Notes in Computer Science; Gervasi, O., Murgante, B., Garau, C., Karaca, Y., Fagina Lago, M.N., Scorsa, F., Braga, A.C., Eds.; Springer: Cham, Switzerland, 2025; Volume 15887. [Google Scholar] [CrossRef]
  144. Cerreta, M.; Poli, G. A complex values map of marginal urban landscapes: An experiment in Naples (Italy). Int. J. Agric. Environ. Inf. Syst. 2013, 4, 41–62. [Google Scholar] [CrossRef]
  145. Trovato, M.R.; Sanzaro, D. A Knowledge and Evaluation Model to Support the Conservation of Abandoned Historical Centres in Inner Areas. Heritage 2024, 7, 1618–1664. [Google Scholar] [CrossRef]
  146. Giuffrida, S.; Gagliano, F.; Giannitrapani, E.; Marisca, C.; Napoli, G.; Trovato, M.R. Promoting Research and Landscape Experience in the Management of the Archaeological Networks. A Project-Valuation Experiment in Italy. Sustainability 2020, 12, 4022. [Google Scholar] [CrossRef]
  147. Han, H.; Laiô, S.K. Decision network: A planning tool for making multiple, linked decisions. Environ. Plan. B Plan. Des. 2011, 38, 115–128. [Google Scholar] [CrossRef]
  148. Liew, A.; Sundaram, D. Flexible modelling and support of interrelated decisions. Decis. Support. Syst. 2011, 46, 786–802. [Google Scholar] [CrossRef]
  149. Coscia, C.; Gron, S.; Vercellino, E. Decision-Making CIA Process (DeMaCIA) to Support SNAI Strategies: The Case of Castelluccio Inferiore in Basilicata, Italy. In Computational Science and Its Applications—ICCSA 2025 Workshops, Proceedings of the ICCSA 2025, Istanbul, Turkey, 30 June–3 July 2025; Lecture Notes in Computer Science; Gervasi, O., Murgante, B., Garau, C., Karaca, Y., Fagina Lago, M.N., Scorsa, F., Braga, A.C., Eds.; Springer: Cham, Switzerland, 2025; Volume 15889. [Google Scholar] [CrossRef]
  150. Tajani, F.; Sica, F.; De Paola, P.; Morano, P. A networking-economic model to enhance the cultural value in small towns. Smart Sustain. Built Environ. 2024; ahead of print. [Google Scholar] [CrossRef]
  151. Morano, P.; Tajani, F.; Di Liddo, F.; Amoruso, P. The public role for the effectiveness of the territorial enhancement initiatives: A case study on the redevelopment of a building in disuse in an Italian small town. Buildings 2021, 11, 87. [Google Scholar] [CrossRef]
  152. Sica, F.; Tajani, F.; Morano, P. A Model for Sustainable Development in Territorial Production System. Sustain. Dev. 2025, 33, 4511–4528. [Google Scholar] [CrossRef]
  153. Ministerè de la Transition Ècologique. Revitalisation des Centres-Bourges 2014. Available online: https://www.centres-bourgs.logement.gouv.fr (accessed on 2 May 2023).
  154. Agence Nationale de la Coèsion de Territories. Action Coeur de Ville. 2018. Available online: https://agence-cohesion-territoires.gouv.fr/action-coeur-de-ville-42 (accessed on 2 May 2023).
  155. Agence Nationale de la Coèsion de Territories. Petites Villes de Demain. 2020. Available online: https://www.agence-cohesion-territoires.gouv.fr/petites-villes-de-demain-45 (accessed on 2 May 2023).
  156. Region Swisse. Swisse Spatial and Regional Development Policies and Programmes. Available online: https://regiosuisse.ch/en/swiss-spatial-and-regional-development-policies-and-programmes (accessed on 2 May 2023).
  157. Region Swisse. Financial Instruments and Measures Within the Framework of the NRP. Available online: https://regiosuisse.ch/en/financial-instruments-and-measures-within-framework-nrp (accessed on 2 May 2023).
  158. Gobierno de Castilla-La Mancha. Inversiòn Territorial Integrada. Estrategia para el Desarrollo de Zonas con Despoblamiento y Declive Socioeconómico en Castilla-La Mancha. 2016. Available online: https://www.castillalamancha.es/sites/default/files/documentos/pdf/20170721/folleto_informativo_iti.pdf (accessed on 2 May 2023).
  159. Ministero de Political Territorial. Estrategia Nacional Frente al Reto Demográfico. 2019. Available online: https://www.mptfp.gob.es/portal/reto_demografico/Estrategia_Nacional.html (accessed on 2 May 2023).
  160. Malavasi, G.; Barreca, A.; Rebaudengo, M.; Rolando, D. A stakeholder analysis to support resilient strategies in the Alta Valsesia inner area. In Proceedings of the ICCSA 2023, Athens, Greece, 3–6 July 2023; LNCS. Gervasi, O., Murgante, B., Rocha, A.M.A.C., Garau, C., Scorsa, F., Karaca, Y., Torre, C.M., Eds.; Springer: Cham, Switzerland, 2023; Volume 14106, pp. 262–276. [Google Scholar] [CrossRef]
  161. Ferretti, M.; Favargiotti, S.; Lino, B.; Rolando, D. Branding4Resilience: Explorative and Collaborative Approaches for Inner Territories. Sustainability 2022, 14, 11235. [Google Scholar] [CrossRef]
  162. Rossitti, M.; Dell’Ovo, M.; Oppio, A.; Torrieri, F. The Italian National Strategy for Inner Areas (SNAI): A Critical Analysis of the Indicator Grid. Sustainability 2021, 13, 6927. [Google Scholar] [CrossRef]
  163. Della Spina, L. Community Branding and Participatory Governance: A Glocal Strategy for Heritage Enhancement. Heritage 2025, 8, 188. [Google Scholar] [CrossRef]
  164. Della Spina, L. Revitalization of Inner and Marginal Areas: A Multi-Criteria Decision Aid Approach for Shared Development Strategies. Valori E Valutazioni 2020, 25, 37–44. [Google Scholar]
  165. Department for Cohesion Policies for Southern Italy. OpenCoesione. Available online: https://opencoesione.gov.it/it/ (accessed on 5 April 2024).
  166. Comuni Della NSIA Area Troina. Strategia Territoriale dell’Area Interna Troina. Caratteristiche, Fabbisogni e Identità dell’Area Interna Troina Nella Programmazione Territoriale 2021–2027 in Sicilia. Available online: https://www.regione.sicilia.it/sites/default/files/2024-11/ALL.%201%20al%20DDG%20N.%20741-2024%20AI%20TROINA.pdf (accessed on 2 May 2023).
  167. Presidency of the Council of Ministers. Italia Domani. Piano Nazionale di Ripresa e Resilienza. Catalogo Open Data. Available online: https://www.italiadomani.gov.it/it/home.html (accessed on 5 April 2024).
Figure 1. Camagni’s proposed classification of territorial capital components [75].
Land 14 01916 g001
Figure 2. The NSIA classifies inner areas according to the criterion of spatial remoteness.
Land 14 01916 g002
Figure 3. (a) The classification of NSIA areas in Italian territory; (b) The classification of NSIA areas in Sicily.
Land 14 01916 g003
Figure 4. Geo-referenced Value-based Knowledge Model.
Land 14 01916 g004
Figure 5. The methogological approach structure.
Land 14 01916 g005
Figure 6. Indicators of forms of territorial capital: HC, UC, EC, NC and ENVC.
Land 14 01916 g006
Figure 7. Indicators of infrastructure capital ( I C ).
Land 14 01916 g007
Figure 8. (a) The value tree for human capital; (b) Map of the human capital endowment in the Sicily region.
Land 14 01916 g008
Figure 9. Comparisons between provinces, municipalities, and NSIA classification classes, based on quartiles of the aggregate human capital index.
Land 14 01916 g009
Figure 10. (a) The value tree for IRCI; (b) Map of the IRCI in the Sicily region.
Land 14 01916 g010
Figure 11. Comparisons between provinces, municipalities, and NSIA classification classes, based on quartiles of the I R C I .
Land 14 01916 g011
Figure 12. I R C I and the six indices representing territorial capital in the NSIA area: Bronte and Calatino.
Land 14 01916 g012
Figure 13. I R C I and the six indices representing territorial capital in the NSIA area: Corleone and Madonie.
Land 14 01916 g013
Figure 14. I R C I and the six indices representing territorial capital in the NSIA area: Mussomeli and Palagonia.
Land 14 01916 g014
Figure 15. I R C I and the six indices representing territorial capital in the NSIA area: Nebrodi.
Land 14 01916 g015
Figure 16. I R C I and the six indices representing territorial capital in the NSIA area: Santa Teresa Riva and Terre Sicane.
Land 14 01916 g016
Figure 17. I R C I and the six indices representing territorial capital in the NSIA area: Troina and Val di Simeto.
Land 14 01916 g017
Figure 18. Comparisons of the NSIA area of Troina’s territorial capital endowment and reaction capacity between the baseline scenario and the project scenario.
Land 14 01916 g018
Table 1. Number of NSIA areas; number of municipalities per periphery class; population and territorial area for the 2014–2020 and 2021–2027 cycles [68].
Cycle 2014–2020 NSIA AreasTot.
Municipalities
A—PoleC—BeltD—
Intermediate
E—
Peripheral
F—
Ultra- Peripheral
Tot.
Population (ISTAT 2020)
Tot.
Surface Area (sq.km.)
72 NSIA Areas in 2014–2020 Cyle106011273334821171,938,90951,205
Cycle 2021–2027 NSIA AreasTot.
Municipalities
A—PoleC—BeltD—
Intermediate
E—
Peripheral
F—
Ultra- Peripheral
Tot.
Population (ISTAT 2020)
Tot.
Surface Area (sq.km.)
67 NSIA Areas in 2014–2020 Cycle110511483584821162,301,49954,615
56 NSIA Areas in 2021–2027 Cycle764 552363691042,056,13938,442
Minor Inland35 311318213,093971
Disclaimer/Publisher’s Note: The statements, opinions and data contained in all publications are solely those of the individual author(s) and contributor(s) and not of MDPI and/or the editor(s). MDPI and/or the editor(s) disclaim responsibility for any injury to people or property resulting from any ideas, methods, instructions or products referred to in the content.