Abstract
Aligning urban land development intensity with green land-use efficiency (GLUE) is crucial for fostering high-quality regional growth. This study aims to examine the coupling and coordination between built-up land intensity (BUI) and GLUE by utilizing multi-source heterogeneous data for Hainan Island (2017, 2020). A coupling coordination degree model and Geographical Detector are applied to quantify BUI, GLUE, and their coupling coordination, while also identifying the underlying driving factors. The results reveal the following: (i) Following the Free Trade Port initiative, BUI increased by 15.8%, while GLUE grew by 4.9%; (ii) The BUI–GLUE system is still in an adjustment phase, with 94% of jurisdictions showing low coordination; (iii) The primary drivers of coupling have shifted from economic fundamentals to policy and institutional guidance, with their interactions demonstrating significant synergies. These findings suggest that policy-induced land expansion may outpace improvements in GLUE, potentially leading to an imbalance in the land system. This paper introduces an innovative Driver–Response–Feedback and Production–Living–Ecological (DRF–PLE) framework and develops a transferable diagnostic tool for evaluating land-use system sustainability in rapidly urbanizing regions.
1. Introduction
Optimizing resource use and advancing green development strategies have become core priorities for numerous countries and regions [1,2,3]. Land is a fundamental resource that plays a central role in these strategies, with its use being an inherently complex systemic issue [4]. The land use system is a multi-dimensional, open system, driven by human activities and characterized by continuous exchanges of materials, energy, and information with external economic, social, and ecological subsystems [5]. Its overall performance can be assessed through the Production–Living–Ecological (PLE) functions [6]. However, the widespread pattern of extensive urban land expansion in China has led to imbalances in land use functions [7], posing a significant challenge to sustainable and high-quality development. In this context, the case of Hainan Free Trade Port (HFTP) presents a particularly urgent challenge. As a key strategic location for building a green, open economy, Hainan’s land use system faces a sharp contradiction: historical development has resulted in inefficiency and a depletion of reserve land resources [8], while growing population and industrial concentration—driven by the development of the HFTP—are placing increasing demands on future land carrying capacity. Compared to 2017, the built-up area of Hainan Island increased by 29.7% in 2023, while during the same period, the built-up area of China grew by 13.2%. This indicates that under the HFTP policy, the level of urbanization on Hainan Island has significantly increased. With the 2025 deadline for the full operation of the HFTP fast approaching, the ability of the system to support high-quality development within stringent resource and environmental constraints has become a critical issue. Green land-use efficiency (GLUE) provides a framework for evaluating how built-up land contributes to regional sustainable development. From a Production–Living–Ecological (PLE) perspective, this study explores how GLUE can be applied to assess sustainability in urban land-use systems and examines how built-up land intensity (BUI) influences GLUE across both time and space during the development phase of the HFTP.
This investigation builds upon the evolving theoretical frameworks, particularly those related to the Production, Living, and Ecological perspectives, to further understand land-use system performance. The academic understanding of this system’s performance has evolved from a singular focus to a more integrated approach. The theoretical foundations of this evolution can be traced back to the 19th century, with von Thünen [9] emphasizing the production function of the land-use system. His theory of land rent was pivotal in uncovering the patterns and intensity of land use as influenced by location within market economies, thus establishing the classical paradigm for land economic efficiency research. In the mid-20th century, a significant shift in research perspectives occurred. Jacobs [10] introduced the urban vitality theory, which focused on the living function of land use. She emphasized the core values of functional diversity and high density, which are crucial for community safety, social interaction, and economic diversity, thereby integrating the ‘social dimension’ into urban design studies. By the latter half of the 20th century, planning ideologies such as ‘compact cities’ [11] and ‘smart growth’ [12] emerged. These ideas, which inherited and expanded upon previous concepts, led to the development of a systematic integration of economic efficiency, social equity, and environmental sustainability. This integration formed the modern analytical framework for evaluating the comprehensive benefits of land use.
As sustainable development becomes a global consensus, the evaluation framework for sustainable land-use research has shifted from a narrow metric of economic output or physical expansion toward multidimensional efficiency. Land-use efficiency (LUE) captures how land, capital, and labor translate into socio-economic outcomes [13]. GLUE extends LUE by explicitly incorporating environmental costs and undesirable outputs, seeking to maximize economic and social benefits while minimizing resource and environmental pressures [14]. In practice, the “living” function—urban vitality, service accessibility, and human well-being—has often been proxied rather than systematically embedded. For example, the UN-Habitat LCRPGR index emphasizes the living dimension by using population density as an indicator of human activity [15], and Yang et al. (2021) employ the Baidu Heat Index to proxy urban vitality [16]. Yet these proxies are typically used in isolation and seldom integrated into a coherent GLUE framework. Methodologically, GLUE is commonly measured with Slack-Based Measure models that accommodate undesirable outputs. Inputs often include built-up land area, fixed asset investment, labor, and energy consumption, while outputs include GDP or fiscal revenue along with negative externalities such as carbon emissions [13,17,18]. Despite their strengths for modeling production–environment trade-offs, standard Slack-Based Measure implementations under-represent the living function and social vitality. Data-wise, most studies rely on city-level panel data, which masks substantial intra-urban heterogeneity and spatial configuration effects within administrative units [19].
A growing body of research documents a complex, often nonlinear relationship between built-up land intensity (BUI) and LUE [20]. Using the Yangtze River Delta, Ruan et al. (2022) identify mismatches between BUI and LUE by comparing built-up intensity with efficiency outcomes [19]. On the one hand, expansion and intensification of built-up areas can raise economic efficiency via scale and agglomeration effects [21], and high-quality transit combined with supportive land development is synergistic with urban vitality [22]. On the other hand, unchecked growth of built-up land frequently comes at the expense of ecological space, weakening regional carbon-sink capacity and degrading ecosystem services [23]. The direction and magnitude of these effects vary markedly by region, city size, and spatial configuration [13,18,19]. These findings underscore the need to move beyond one-way impact studies toward a system view of BUI–GLUE interactions.
However, taken together, the literature reveals gaps: (i) an incomplete treatment of the production–living–ecological functions within GLUE, where the living dimension like social vitality remains weakly integrated; (ii) limited use of heterogeneous, fine-scale data capable of revealing intra-urban spatial variation; and (iii) a lack of bidirectional, dynamic perspectives on the coupling, coordination, and feedback between BUI and GLUE.
To address these gaps, this paper aims to map the spatiotemporal dynamics of BUI–GLUE coordination at fine spatial scales, and identify the drivers that shape this coordination. This study makes several contributions: First, it redefines GLUE through a comprehensive Production–Living–Ecological (PLE) perspective, ensuring functional completeness. Second, it introduces an innovative Driver–Response–Feedback and Production–Living–Ecological (DRF–PLE) framework that explicitly models the complex interactions of BUI and GLUE, including their coupling, coordination, and feedback; Furthermore, to capture the spatiotemporal dynamics of this coordination, we integrate heterogeneous, multi-source data (such as remote sensing, POIs, night-time lights, PM2.5, population grids, and building footprints) at fine spatial scales. Additionally, we identify key drivers and nonlinear patterns that shape the BUI–GLUE coordination. Together, these efforts link multi-functional land-use theory with feedback-based systems thinking, providing a more comprehensive lens on sustainable land use in urban built-up areas.
The remainder of this paper is organized as follows. Section 2 defines the concept of GLUE, followed by the DRF-PLE theoretical framework of BUI and GLUE. Section 3 presents the research region, methodology, and data source. In Section 4, we provide an empirical analysis of the analysis results. Section 5 unveils the logical framework influencing this coupling relationship. Section 6 concludes the paper with a summary of our key findings and discusses potential directions for future research.
2. Theoretical Framework
2.1. Definition of GLUE in Urban Areas
In the era of high-quality development, urban land-use is shifting from a narrow focus on economic returns to the coordinated pursuit of economic, social, and ecological outcomes. We define GLUE as the efficiency of allocating land resources under multiple constraints from a Pareto-efficiency perspective within a given region. GLUE addresses how spatial configuration should support maximum economic output and social welfare subject to maintaining ecological integrity as a binding constraint. To operationalize GLUE, we adopt the production–living–ecological lens and decompose it into three interlinked subsystems: (i) economic output efficiency (production), (ii) social vitality (living), and (iii) ecosystem security (ecology). Together these dimensions provide an integrated framework for assessing land-use performance, which we apply to the HFTP.
Economic output efficiency. This dimension captures the density and quality of value creation per unit of land input. Insights from new economic geography and agglomeration economics suggest that optimized spatial clustering—such as strategic industrial zones in the HFTP—generates knowledge spillovers, reduces transaction costs, and enables shared infrastructure, yielding productivity gains beyond firm-level effects [7]. Accordingly, evaluation goes beyond gross output to examine whether spatial planning facilitates agglomeration and structural upgrading (e.g., phasing out obsolete capacity, fostering high-tech industries). We measure total value creation using GDP and calibrate the intensity and spatial distribution of economic activity with nighttime lights at high spatial and temporal resolution [24].
Social vitality. Social vitality reflects the capacity of urban space to sustain frequent and diverse human activities and interactions, a key signal of regional attractiveness and development potential [25]. Following Jacobs’ view that “street ballet” emerges from dense, mixed-use environments [10,26], we treat vitality as more than population scale; it also concerns the catalytic role of spatial design in enabling co-presence and interaction.
It has been proven that green and sustainable infrastructure in smart city construction can help promote residents’ travel and enhance social interaction and sense of belonging [27]. In the HFTP context, macro-level drivers (business climate, talent policies) shape population flows, while micro-level land-use (e.g., accessibility to amenities) converts flow into sustained interaction. We use population density as the demographic base and incorporate POI density and a POI diversity index to quantify functional mixing and interaction touchpoints.
Ecosystem integrity. Climate change poses a paramount threat to human civilization, and in the effort to combat it and achieve carbon neutrality, the utilization of built-up land plays a crucial role [28]. This dimension evaluates how land-use affects the structure, functions, and resilience of regional ecosystems. Under the landscape-ecology “source–sink” paradigm, urbanization converts service-providing sources (e.g., forests, wetlands) into resource-consuming or pollution-generating sinks (e.g., impervious surfaces). The ecological core of GLUE is to minimize losses of sources and internalize sink externalities to preserve self-regulation capacity. Pressures from anthropogenic emissions and land-cover-induced heat islands jointly erode integrity [23]. We therefore use a multidimensional indicator set: NDVI to characterize source conditions, land surface temperature (LST) to track the urban heat-island signal [29], and PM2.5 concentrations to reflect ambient environmental pressure [19].
This production–living–ecological-based framework offers a coherent, system-oriented basis for evaluating GLUE in the HFTP and aligning land-use decisions with coordinated economic, social, and ecological performance.
2.2. The Mechanism of Coupling and Coordination Between BUI and GLUE
Effective responses to resource scarcity hinge on improving the efficiency of land use. On Hainan Island, land-use transformation under the HFTP has followed a complex, path-dependent trajectory shaped by the principles of green development. Central to this transformation is the interaction between two subsystems, BUI and GLUE. These subsystems evolve from a stage of mutual constraint, where expansion of BUI may undermine ecological or social efficiency, toward a stage of synergistic coupling, where land development and multifunctional efficiency reinforce one another. To conceptualize these dynamics, this study adopts a DRF-PLE framework, which illuminates the pathways through which external drivers (e.g., policy interventions, economic growth) influence BUI, how BUI in turn reshapes GLUE, and how feedback from ecological and social outcomes constrains or redirects further development (Figure 1). This framework emphasizes both the synergies that can arise when development and efficiency are aligned, and the trade-offs that emerge when expansion intensifies resource and ecological pressures. By situating BUI–GLUE interactions within a feedback-based systems perspective, the analysis provides a theoretical basis for identifying conditions under which land-use transformation can achieve high-level coordination rather than low-level lock-in.
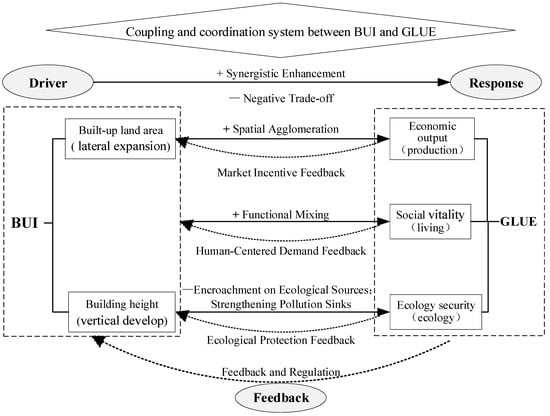
Figure 1.
DRF-PLE analysis framework of urban BUI and GLUE.
Driver: BUI. As a spatial manifestation of modernization, BUI reflects the degree of land development density [19], expressed through both the outward expansion of urban footprints and the vertical increase in floor-area ratios. Within appropriate limits, greater intensity can serve as a key driver of the economic and social dimensions of GLUE. According to agglomeration-economy theory, geographic proximity reduces effective distance and transaction costs, facilitating factor flows, knowledge spillovers, and innovation. These dynamics can yield scale economies that enhance economic output efficiency per unit of land. Moreover, high-intensity development is often associated with mixed land uses and the concentration of public services, thereby expanding public spaces and interaction opportunities. Such environments foster informal encounters and social exchange, catalyzing vitality and cohesion in urban communities.
Response: ecological costs of BUI. The ecological dimension of GLUE, however, often conflicts with intensive land development. Expansion and densification typically convert natural or semi-natural “source” landscapes into impervious “sink” surfaces, fragmenting habitats, undermining connectivity, and threatening biodiversity. Impervious surfaces also alter surface energy and water cycles, exacerbating urban heat-island effects. In addition, intensive human activities increase pollutant emissions (e.g., PM2.5) that may exceed the self-purification thresholds of ecosystems, weakening ecosystem services such as air purification and water regulation, threatening society’s resilience to climate challenges [30,31]. These ecological trade-offs underscore the inherent risks of unrestrained development intensity.
Feedback: regulating effects of GLUE. GLUE does not function solely as an outcome of construction land intensity but also shapes development trajectories through feedback mechanisms. First, economic efficiency exerts market pressure for intensification through “vertical quality improvement,” promoting compact development and seeking to decouple economic growth from land consumption. Second, social vitality generates “soft constraints”: residents’ demands for accessible public space, liveable neighborhoods, and cultural heritage preservation discourage overdevelopment and steer intensity toward mixed-use, human-scale, quality-first patterns. Third, ecological integrity is enforced by “hard constraints” through regulatory instruments—such as the “three zones and three control lines” (ecological redlines, permanent farmland, and urban development boundaries)—which establish binding ecological thresholds, preventing disorderly expansion and ensuring development remains within carrying capacity.
Systemic transition. Construction land intensity and GLUE thus constitute an interactive, dynamically evolving coupled system. For the HFTP, the strategic task is to employ macro-level regulation and micro-level design guidance to shift from an antagonistic coupling—characterized by high input intensity, low performance, and high ecological load—to a synergistic coupling of intensive input, high aggregate benefits, and low ecological costs. Achieving this transition requires institutional innovation and strict ecological safeguards to enable both relative and ultimately absolute decoupling of economic and social gains from ecological pressures. In this sense, the coupling–coordination analysis presented here serves as a diagnostic tool to identify Hainan’s current stage and spatiotemporal trajectory along this evolutionary path.
3. Study Area, Data, and Methodology
In this section, this paper collects and integrates heterogeneous, multi-source data, with Entropy-Weighting Method, to assess the Built-up Land Index (BUI) and Green-Land-Use Efficiency (GLUE) at fine spatial scales. Then, the coupling and coordination degree between BUI and GLUE is identified using the coupling coordination degree model (CCDM). Additionally, by applying the Geographical Detector, we explore the key drivers that influence this coordination. Finally, an empirical study is conducted using Hainan Island as a case study. In Figure 2, we graphically illustrate the sequence of methods used in writing this paper, especially in the Section 4:
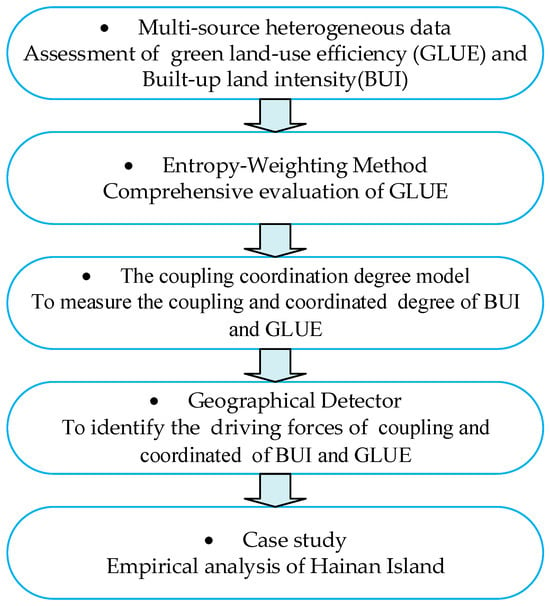
Figure 2.
Sequence of methods used in writing this study Source: Own processing.
3.1. Study Area
Hainan Island covers a total land area of 33,900 square kilometers, with flat terrain on the edges and a towering central area, forming a dome-shaped mountainous terrain. The landforms include mountains, hills, plateaus, and terrace plains, creating a circular, layered topography with clear tiered structures (as shown in Figure 3). In 2024, Hainan Province’s per capita GDP was 75,903 yuan, with the secondary and tertiary sectors accounting for 18.9% and 60.6%, respectively. The permanent urban population is 10.48 million, with an urbanization rate of 63.1%. The urban construction land expansion across the 18 cities and counties of Hainan Island has resulted in a spatial pattern consisting of “two-pole areas” (Haikou, Sanya, Chengmai, Wenchang, Ledong, Baoting, Lingshui), “two-axis areas” (Lingao, Danzhou, Changjiang, Dongfang, Qionghai, Wanning), and “central areas” (Dingan, Tunchen, Baisha, Qiongzhong, Wuzhishan), representing three categories of socio-economic development: developed, medium, and underdeveloped regions on the island [32]. In 2018, Hainan Island focused on building a Free Trade Port and introduced institutional innovations such as tax incentives (e.g., zero tariffs, low tax rates, simplified taxation system) and customs supervision models (e.g., ‘one line open, two lines controlled’), encompassing reforms in trade investment liberalization, cross-border financial services, optimization of the business environment, and ecological civilization.
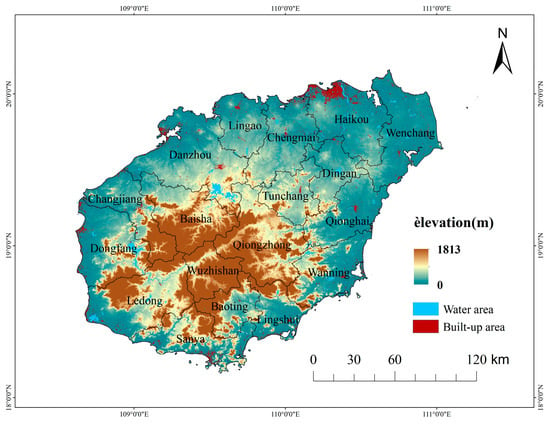
Figure 3.
Location of study area.
3.2. Research Methodology
3.2.1. Entropy-Weighting Method
Entropy is a measure of the uncertainty of the state, or of its average information content [33]. Shannon stated that, the entropy can be interpreted as the average rate at which information is produced by a stochastic source of data. When the data source produces a low-entropy value, the event carries more “information”. The entropy method is an objective and comprehensive weighting method, which is based on the dispersion degree of the evaluation index data to measure the index weight [34]. In the evaluation of GLUE, the entropy of each indicator reflects the information related to urban land green utilization. A larger entropy value indicates a more balanced system structure, with the indicator carrying less information, which leads to a smaller weight in the comprehensive evaluation. Conversely, the smaller the entropy value, the larger the weight of the indicator. The calculation steps are outlined below:
(1) Data dimensionless. To eliminate the influence of different dimensions between indicators, the indicator values are standardized to obtain the normalized values. For positive indicators:
Negative indicators:
where and represent the minimum and maximum values of indicator respectively.
(2) indicates the specific gravity of indicator j:
Calculating , the entropy value of the j-th indicator:
(3) calculating the information utility value of the indicator:
where represents the information utility value of indicator .
(4) calculating the weight of each indicator:
(5) calculating the combined utility value of the indicator:
3.2.2. The Coupling Coordination Degree Model
The coupling coordination degree model (CCDM) is an effective tool to measure the interaction of multiple elements.
Coupling, derived from physics, describes the phenomenon of systems or elements generating synergistic or restrictive relationships through interactions. In social science research, the concept of coupling is widely used to characterize the correlation and coordination between different subsystems. Given the close connection and potential mutual influence between construction land intensity activities and the goal of green, efficient development. The coupling coordination degree model (CCDM), an effective tool to measure the interaction of multiple elements [35], is applied to measure the interaction and coordinated development level of BUI and GLUE.
where , and represent the construction land intensity index, land green utilization efficiency, and the coupling degree between the two, respectively. Although the coupling degree can reflect the extent of interaction between construction land intensity and land green utilization efficiency, it cannot reflect the level of synergy between them. A coupling coordination degree model is then applied to explore the degree of coordinated interaction between the two:
is the coupling coordination degree between BUI and GLUE, is the comprehensive coordination index, and are the coefficients to be determined, Since BUI and GLUE are of equal importance, let [7]; , the larger is, the better the coupling coordination between BUI and GLUE. To investigate the coupling coordination levels between BUI and GLUE on Hainan Island, the coupling degree CI is divided into four types [32]: low coupling stage (), antagonistic stage (), adjustment stage (), and high coupling stage (); The coupling coordination degree is classified into four levels: when , it represents low-level coordinated coupling; when , it represents medium-level coordinated coupling; when it represents high-level coordinated coupling; when , it represents extremely coordinated coupling.
3.2.3. Geographical Detector
The geographic detector model is a statistical method used to explore the spatial differentiation features of geographic phenomena and their driving forces. This study uses the factor detection and interaction detection modules to explain the influencing factors of the coupling coordination between urban construction land intensity and land green utilization efficiency on Hainan Island:
In the equation, represents the explanatory power of the factor, ,the larger the value of , the greater the explanatory power; represents the stratification of the independent variable; and represent the number of units in the layer and the whole region, respectively; and represent the variance within the layer and the entire region, respectively.
3.3. Indicator System and Variables
3.3.1. Land Green Utilization Efficiency
Based on the concept of GLUE under the context of the HFTP construction, this paper comprehensively considers three dimensions: economic output, social vitality, and ecological security, and constructs a comprehensive evaluation indicator system for land green utilization efficiency (see Table 1).

Table 1.
Land green utilization efficiency index system.
3.3.2. Built-Up Land Intensity
This paper comprehensively considers the transformation of urban construction land from a planar spatial form to a three-dimensional spatial form under land development and utilization, depicting the construction land intensity through construction land scale and building height. Among these, the construction land scale is represented by the built-up area index (BUA), which reflects the proportion of construction land within a specific grid. The specific formula is as follows:
ISA represents the impervious surface area within the grid, while TA represents the total area of the grid. The building height (BUH) is normalized:
where BUHmax and BUHmin represent the maximum and minimum values of BUH across all pixels in the region.
Referencing the parameter assignment method used by Ruan [19], .
3.4. Data Sources
To accurately reveal the spatial-temporal characteristics of GLUE and BUI, annual multi-source heterogeneous data of 2010 and 2020 were used, including remote sensing data, statistical data, and vector data (Table 1). This paper uses the annual land cover data of China, treating the impervious surface areas in the data as urban construction land. The nighttime light data comes from the global NPP-VIIRS long-term nighttime lighting data. GDP data is sourced from the modified real GDP at a 1 km × 1 km grid published by Zhao [36], combined with Hainan County GDP statistics, and GDP for 2017 and 2020 was interpolated. POI data is from the Gaode Map open platform, and population density data is provided by WorldPop. PM2.5 data comes from the Atmospheric Composition Analysis Group at Washington University in St. Louis. NDVI data is from the MODIS MOD13A3 v061 product. Temperature data is from the MODIS MYD11A2 v061 product, which provides the average surface temperature over 8-day intervals. By acquiring the data for the entire year of 2017 and 2020 and calculating the average annual surface temperature for each pixel, we obtain the LST data for this paper. After resampling to a 1 km resolution using ArcGIS, all vector and raster data were projected to the same coordinate system through methods such as projection conversion and spatial correction to ensure consistent spatial information. High-speed rail accessibility data is from the high-speed rail network, and socio-economic statistical data is from the Hainan Province Statistical Yearbook (2018 and 2021).
4. Results
4.1. Spatiotemporal Characteristics of BUI and GLUE
The comprehensive evaluation results of GLUE are presented in Figure 4 and Figure 5. Relative to 2017, GLUE increased by 4.90% in 2020; however, this improvement was not statistically significant at the 10% level. Spatially, GLUE exhibits a multi-center and irregular block-aggregation pattern with substantial regional heterogeneity. The spatial hierarchy can be summarized as two-pole areas > two-axis areas > central areas (Table 2). Haikou City and Sanya City, as representative two-pole areas, display the highest GLUE, with a mean value of 0.061 in 2020, forming strip-like and patch-like clusters that produce a core–edge, fan-shaped structure. The central area, by contrast, shows scattered and fragmented clusters of land-use efficiency. In terms of change, the increase in GLUE between 2017 and 2020 followed the order two-axis areas > central areas > two-pole areas, and the regional gap narrowed. This suggests that, alongside progress in the Free Trade Port, regional disparities in GLUE have diminished, with no evidence of a “Matthew effect.”
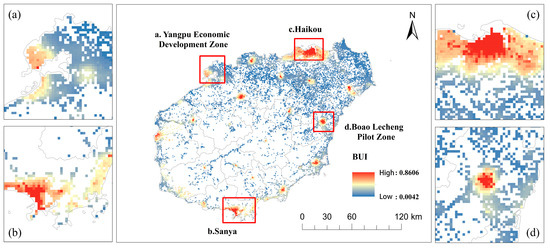
Figure 4.
GLUE of Hainan Island in 2020. (a) Yangpu Economic Development Zone; (b) Sanya city; (c) Haikou city; (d) Boao Lecheng Pilot Zone.
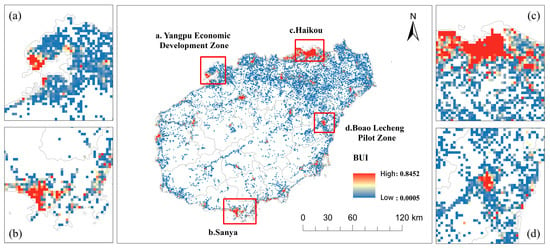
Figure 5.
BUI in Hainan Island in 2020. (a) Yangpu Economic Development Zone; (b) Sanya city; (c) Haikou city; (d) Boao Lecheng Pilot Zone.

Table 2.
The Change of LUE and BUI for Hainan Island Before and After the Implementation of the HFTP Strategy.
During the same period, the BUI index rose by 15.81% (significant at the 1% level). Its spatial distribution also demonstrates strong heterogeneity, consistent with the pattern two-pole areas > two-axis areas > central areas (Figure 5), in line with [32]. This spatial pattern reflects both coastal advantages in marine and tourism resources and locational accessibility. The policy orientation of the HFTP further reinforces these advantages by concentrating development resources in coastal growth poles. To support the functional requirements of the Free Trade Port and provide high-quality living and business environments, urban spatial carriers have expanded substantially. Within subregions such as Haikou, Sanya, Yangpu Economic Development Zone, and Boao Lecheng Pilot Zone, however, the composite index of urban expansion and building height does not clearly exhibit a core–periphery gradient, echoing the findings of [19].
4.2. Coupling Coordination Degree Analysis
4.2.1. Trends and Dynamics of the Coupling Coordination Between BUI and GLUE
Table 3 shows that the coupling degree between BUI and GLUE on Hainan Island increased from 0.768 in 2017 to 0.797 in 2020, indicating a transition from the adjustment stage toward high coupling. Overall, interaction between the two subsystems is relatively close and strengthening. Regionally, in 2020 the two-pole areas reached the high coupling stage, while the two-axis and central areas remained in the adjustment stage, suggesting uneven progress and scope for further improvement. The coupling coordination degree (DI) ranged between 0 and 0.9665, but overall remained low (Figure 6 and Figure 7). From 2017 to 2020, DI increased modestly from 0.165 to 0.170, reflecting a lightly coordinated state. This indicates gradual improvement in BUI–GLUE coordination, yet also reveals limited mutual reinforcement, with coordinated development constrained.

Table 3.
The change in the coupling coordination degree of GLUE and BUI for Hainan Island Before and After the Implementation of the HFTP Strategy.
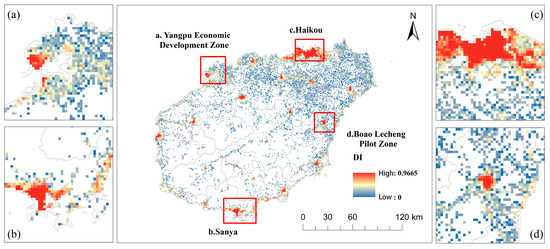
Figure 6.
Coupling coordination degree (DI value) in 2017. (a) Yangpu Economic Development Zone; (b) Sanya city; (c) Haikou city; (d) Boao Lecheng Pilot Zone.
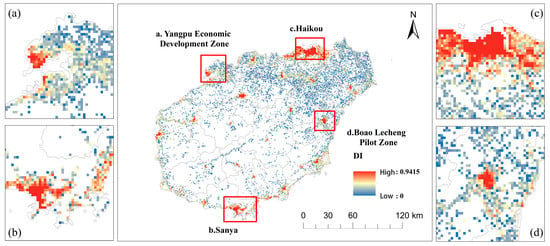
Figure 7.
Coupling coordination degree (DI value) in 2020. (a) Yangpu Economic Development Zone; (b) Sanya city; (c) Haikou city; (d) Boao Lecheng Pilot Zone.
4.2.2. Spatial Differentiation
In 2017, the spatial differentiation of BUI–GLUE coordination is marked, following the pattern two-pole areas > two-axis areas > central areas (Figure 6). The overall coordination level remains low, characterized by “large dispersion with small clusters.” Based on DI values for 2020, regions were classified into four levels. High coordination and extreme coordination areas accounted for only 2.22% and 0.15%, respectively. In these regions, the spatial coincidence of high BUI and high GLUE suggests that land inputs have been more effectively transformed into economic output, social vitality, or ecological security. Regions with moderate and low coordination accounted for 3.50% and 94.13%, respectively, implying that the expansion rate of BUI has generally outpaced improvements in urban economic output and social vitality, resulting in low land-use efficiency in most areas.
Disaggregating by subsystem (Figure 8), in 2020 the coordination between BUI and economic output efficiency (E-DI) and between BUI and social vitality (S-DI) were 0.166 and 0.099, respectively—both at low levels. The coordination between BUI and ecological security (EE-DI) reached 0.421, indicating moderate coordination. These results show that land urbanization on Hainan Island has advanced faster than economic and demographic urbanization: built-up intensity grew more rapidly than either economic output or population inflow. Although Hainan’s GDP rose by 23% between 2017 and 2020, value added per unit area in secondary and tertiary industries declined by 33.89%. Compared with other Free Trade Zones, Hainan retains a higher share of agriculture, slower industrial upgrading, and relatively low economic output efficiency. Population inflows remain modest, with built-up area density falling from 17,400 persons/km2 in 2017 to 15,600 persons/km2 in 2020, reducing social vitality. By contrast, ecological protection in the HFTP is strongly supported by strict regulation: selective land allocation channels clean industries, while high thresholds for energy-intensive and polluting firms prevent the conversion of ecological “source” landscapes into pollution “sinks,” thus safeguarding ecological security.

Figure 8.
The coordination degree of BUI with three dimensions in 2020. (a) E-DI; (b) S-DI; (c) EE-DI.
4.3. Spatial Correlation Analysis
The Moran’s I indices for GLUE, BUI, and their coupling coordination values all fall within [0.606, 0.948] and are significant at the 1% level, indicating strong positive spatial autocorrelation. Nonetheless, their clustering patterns differ (Figure 9). High–high clusters of BUI and GLUE are concentrated in urban cores, while low–high outliers occur on the periphery, consistent with typical urbanization patterns. Compared with BUI, GLUE displays fewer high–low and low–high outliers, but more high–high and low–low clusters, indicating stronger spatial agglomeration and a pronounced core–edge structure. By contrast, the spatial agglomeration of BUI and coupling coordination is less clearly differentiated between urban and suburban areas. Instead, they exhibit more high–low and low–high associations, reflecting the complexity and relative randomness of their spatial distribution.

Figure 9.
Cluster distribution characteristics of each indicator in 2020. (a) GLUE; (b) BUI; (c) DI.
5. Driving Factors of the Coupling Coordination Between BUI and GLUE on Hainan Island
5.1. Selection of Influencing Factors
The coupling coordination between BUI and GLUE constitutes a complex system shaped by multiple drivers. To avoid endogeneity, evaluation indicators used in constructing BUI and GLUE were excluded. Instead, 12 variables were selected across four dimensions—economic development, policy systems, public services, and infrastructure—to examine the formation mechanisms of BUI–GLUE coupling coordination on Hainan Island (Table 4). Economic development is the core driver. Rising income and industrial upgrading can both intensify land use and simultaneously foster greener, more efficient utilization through technological innovation. Policy systems act as macro-level levers. Fixed asset investment, fiscal and regulatory interventions, and environmental regulations influence resource allocation and land-use patterns, steering the system either toward synergy or antagonism. Public services shape population concentration and demand for land. Education and healthcare, in particular, increase rigid land demand while their spatial configuration affects the socio-economic returns to land. Infrastructure provides the physical backbone. Transport systems, such as high-speed rail and highways, alter spatial connectivity and factor flows via a “spatial compression effect.” These may foster compact and efficient land-use patterns or induce inefficient sprawl. Urban utilities (e.g., water supply, drainage) set the carrying capacity and environmental resilience thresholds for urban development.

Table 4.
Influencing factors of the coupling coordination of BUI and LUE on the Hainan Iland.
5.2. Influencing Factors Analysis
Factor detection reveals a shift in dominant drivers between 2017 and 2020 (Figure 10). In 2017, economic and social variables such as industrial structure (X3), education level (X7), per capita income (X1), and fixed asset investment (X4) explained much of the spatial variation in coupling coordination. These factors reflected population mobility, economic dynamism, and social vitality. By 2020, the explanatory power of policy and institutional factors strengthened. Fixed asset investment (X4), high-speed rail accessibility (X9), government regulation (X5), and environmental regulation (X6) emerged as leading determinants, while income (X1), industrial structure (X3), and education level (X7) remained influential but comparatively weaker. This shift indicates a more complex mechanism in which economic, social, policy, and infrastructure drivers jointly shaped BUI–GLUE coordination.
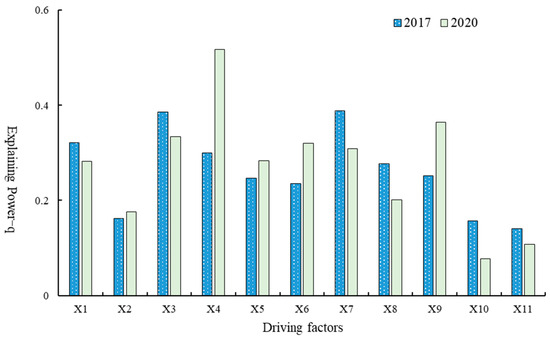
Figure 10.
Driving factors of the coupling coordination pattern of BUI and GLUE of cities (counties) on the Hainan Island.
Interaction detection underscores that the evolution of BUI–GLUE coupling is not the product of single factors but of synergistic enhancement effects (Table 5). Across both years, factor pairs exhibited either two-factor or nonlinear enhancement, with no evidence of weakening or independence. In 2017, strong interactions included income and education, openness and industrial structure, fixed asset investment and rail accessibility, and income and healthcare, highlighting the joint influence of economic and social elements. In 2020, Key interactions shifted toward policy–infrastructure linkages, such as fixed asset investment with education, government with environmental regulation, openness with investment, and income with rail accessibility. These results show that policy actions and transportation infrastructure gained importance in shaping coordination patterns.

Table 5.
Interactive detection results of the coupling coordination pattern of BUI and LUE on the Hainan Iland.
Overall, the coupling coordination pattern is jointly shaped by four interrelated forces (Figure 11).
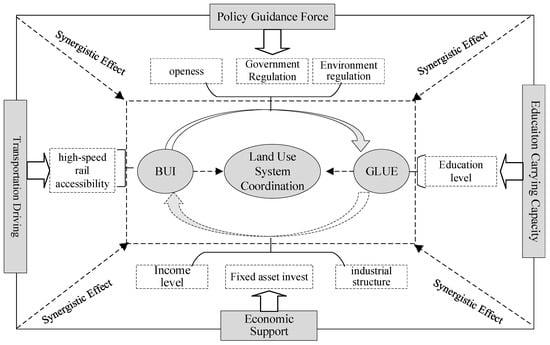
Figure 11.
Driving mechanism of the coupling coordination of BUI and LUE in Hainan Iland.
Economic support: Economic development attracts capital, talent, and technology, generating agglomeration and scale economies. Haikou and Sanya, with larger populations and stronger industrial bases, demonstrate higher coordination by efficiently converting factor inputs into output.
Policy guidance: The Free Trade Port strategy provides strong momentum. Provincial government interventions—such as the concentration of projects in 11 key industrial parks and the implementation of “multi-plan integration” and “three control lines”—redirect factor flows and ensure ecological bottom lines, thereby shaping spatial coordination outcomes.
Educational carrying capacity: High-quality education acts as a magnet for talent, reinforcing population inflows and supporting intensive land development. In Haikou and Sanya, talent–industry feedback loops promote compact and efficient urban forms, driving higher BUI–GLUE coordination.
Transportation driving force: The island’s high-speed rail and highway network reduce transaction costs, strengthen linkages between poles and axes, and facilitate diffusion of policy and economic spillovers. Two-axis regions, such as Yangpu and Boao, benefit from these advantages and function as corridors linking the north–south poles. By contrast, the central region, with weaker resource endowment and a reliance on agriculture, lags in coordination.
6. Discussion and Conclusions
6.1. Discussion
The persistence of low coordination between BUI and GLUE suggests that Hainan’s inefficient use of built-up land results in a sparse population and limited socio-economic activity, failing to fully capitalize on the agglomeration effects of population and economic growth. Rapidly urbanizing coastal regions, including Hainan Island, should prioritize intensification over sprawl by optimizing existing land, advancing industrial upgrading, and promoting compact, mixed-use development. At the same time, social vitality should be strengthened by reallocating inefficient land for education, healthcare, and public service facilities, which would enhance accessibility and attract population inflows. Ecological thresholds should remain binding constraints, enforced through strict adherence to the “three control lines” and selective land allocation to green industries, ensuring that ecological gains are not sacrificed for short-term economic expansion. The results suggest that, over time, policy guidance and transportation accessibility have become increasingly significant factors. Therefore, regional linkages should be reinforced by leveraging the “spatial compression effect” of high speed rail and highway networks, enabling the spillover of policy and market dividends from growth poles to lagging axis and central areas. Finally, a balance between state guidance and market forces is essential: while government regulation remains pivotal, sustainable improvements in green land-use efficiency also require market incentives, social demand, and infrastructure-driven agglomeration. The findings resonate with international debates on urban sustainability. The observed mismatch between land intensity and efficiency is not unique but reflects broader patterns in regions undergoing rapid yet uneven urbanization, echoing results reported elsewhere (e.g., [19]).
This study contributes to international scholarship on urban land-use systems in several ways. By integrating the production–living–ecological perspective with a driver–response–feedback framework, it extends prior research that typically examined unidirectional relationships between urban expansion and LUE, thereby highlighting the bidirectional feedbacks that drive system evolution. At the methodological level, the use of grid-scale, multi-source remote sensing data enables the identification of inefficient land-use clusters and mismatches at a fine spatial resolution, offering practical value for refined spatial governance. In addition, the findings enrich our understanding of how policy regimes and infrastructure investments are associated with land-use efficiency within the strategic context of the HFTP. The DRF–PLE framework and the four identified driving forces, including economic support, policy guidance, educational capacity, and transportation connectivity, provide a transferable analytical lens for diagnosing coordination challenges in Free Trade Zones, special economic regions, and small island jurisdictions where land scarcity, policy shocks, and ecological constraints converge.
Nonetheless, limitations remain: the current analysis relies on observational data, since the observational design and short time frame limit the ability to draw strong causal conclusions, and causal attribution requires future quasi-experimental or spatial econometric designs. Additionally, indicators may be sensitive to data sources, weights, and spatial units, and the short observation window limits assessments of persistence. Addressing these issues in future work, alongside comparative studies across regions, will be crucial for testing the transferability of the Hainan experience and refining strategies for reconciling land development intensity with ecological civilization goals.
6.2. Conclusions
Sustainable land-use governance in the HFTP requires balancing moderate growth in BUI with improvements in GLUE, thereby fostering coordinated progress in the economic, social, and ecological dimensions of urban development. Building on the production–living–ecological framework, this study conceptualized GLUE across economic output, social vitality, and ecological security and developed a coupling–coordination framework for BUI and GLUE, namely DRF-PLE, based on a driver–response–feedback model.
The empirical results highlight several key findings. First, Hainan’s land-use transition has been characterized by rapid growth in construction intensity but lagging improvements in GLUE, with ecological security relatively safeguarded but economic and social efficiency remaining weak. Second, spatial disparities are evident: coastal poles (Haikou and Sanya) serve as growth engines, while most regions remain in low-coordination states. Strong spatial autocorrelation suggests a persistent core–edge structure. Third, the determinants of coordination have shifted: while economic and social fundamentals were dominant in 2017, policy orientation and infrastructure accessibility emerged as stronger drivers by 2020. Factor interactions consistently exhibit synergistic enhancement effects, underscoring the complexity of the coordination mechanism.
Overall, the findings reveal that while Hainan has avoided a “Matthew effect” in GLUE, the coupling system remains locked in low-level coordination, particularly in the domains of economic efficiency and social vitality. Research highlights that in rapidly urbanizing regions, enhancing the coupling coordination between land development intensity, economic production, social vitality, and ecological security is a key priority. This study offers valuable insights into the coupling dynamics between BUI and GLUE in such regions, providing guidance for promoting sustainable land use systems and fostering high-quality economic development.
Author Contributions
Conceptualization, M.J.; methodology, B.L.; software, B.L.; validation, B.L.; formal analysis, M.J.; data curation, B.L.; writing—original draft preparation, M.J.; writing—review and editing, M.J.; supervision, M.J.; funding acquisition, M.J. All authors have read and agreed to the published version of the manuscript.
Funding
This research was funded by the Education Department of Hainan Province, project number: Hnky2024-4; This research was supported by Hainan Provincial Natural Science Foundation of China, grant number 725QN271; This research was supported by The 2024 Hainan Provincial Philosophy and Social Science Planning Project (HNSK(JD)24-08); This research was supported by The 2024 Hainan Provincial Philosophy and Social Science Planning Project (HNSK(QN)24-17).
Data Availability Statement
The raw data supporting the conclusions of this article will be made available by the authors on request.
Conflicts of Interest
The authors declare no conflicts of interest.
References
- United Nations. Transforming Our World: The 2030 Agenda for Sustainable Development. United Nations. 2015. Available online: https://sdgs.un.org/2030agenda (accessed on 21 October 2015).
- European Commission. The European Green Deal. European Commission. 2025. Available online: https://commission.europa.eu/strategy-and-policy/priorities-2019-2024/european-green-deal_en (accessed on 31 March 2025).
- National People’s Congress of the People’s Republic of China. The 14th Five-Year Plan for National Economic and Social Development and Long-Range Objectives Through the Year 2035. 2021. Available online: https://en.ndrc.gov.cn/policies/202203/P020220315511326748336.pdf (accessed on 13 March 2021).
- Li, H.B.; Jin, X.B.; Wu, K.; Han, B.; Sun, R.; Jiang, G.D.; Zhou, Y.K. Evaluation of the support capacity of land use system on regional sustainable development: Methods and empirical evidence. J. Nat. Resour. 2022, 37, 166–185. (In Chinese) [Google Scholar] [CrossRef]
- Sarfo, I.; Qiao, J.; Yeboah, E.; Puplampu, D.A.; Kwang, C.; Fynn, I.E.M.; Sarfo, B.A. Meta-analysis of land use systems development in Africa: Trajectories, implications, adaptive capacity, and future dynamics. Land Use Policy 2024, 144, 107261. [Google Scholar] [CrossRef]
- Zhou, D.; Xu, J.; Lin, Z. Conflict or coordination? Assessing land use multi-functionalization using production-living-ecology analysis. Sci. Total Environ. 2017, 577, 136–147. [Google Scholar] [CrossRef]
- Chen, F.; Li, Y.; Liu, Y. Spatial-temporal evolution and coupling coordination of land use functions across China by fusing multiple-source heterogeneous data. Land Use Policy 2025, 155, 107590. [Google Scholar] [CrossRef]
- Liu, B.L.; Zhang, Z.K.; Ji, X.P.; Jiang, S.N.; Wei, G.E.; Zhou, K.X.; Wang, P.Y. Research on suitability evaluation of land space development and functional space allocation in coastal zone: A case study of Hainan Island. J. Nat. Resour. 2022, 37, 862–879. [Google Scholar] [CrossRef]
- von Thünen, J.H. Der Isolierte Staat in Beziehung auf Landwirtschaft und Nationalökonomie; Gustav Fischer Verlag: Jena, Germany, 1826. [Google Scholar]
- Jacobs, J. The Death and Life of Great American Cities; Random House: New York, NY, USA, 1961. [Google Scholar]
- Dantzig, G.B.; Saaty, T.L. Compact City: A Plan for a Liveable Urban Environment; W.H. Freeman: San Francisco, CA, USA, 1973. [Google Scholar]
- Ewing, R. Is Los Angeles-style sprawl desirable? J. Am. Plann. Assoc. 1997, 63, 107–126. [Google Scholar] [CrossRef]
- Fei, R.; Lin, Z.; Chunga, J. How land transfer affects agricultural land-use efficiency: Evidence from China’s agricultural sector. Land Use Policy 2021, 103, 105300. [Google Scholar] [CrossRef]
- Li, W.; Cai, Z.; Jin, L. Urban green land-use efficiency of resource-based cities in China: Multidimensional measurements, spatial-temporal changes, and driving factors. Sustain. Cities Soc. 2024, 104, 105299. [Google Scholar] [CrossRef]
- UN-Habitat. Indicator 11.3.1: Ratio of Land Consumption Rate to Population Growth Rate. Version 19 July 2016. United Nations Human Settlements Programme, Nairobi. 2016. Available online: https://unstats.un.org/sdgs/metadata/files/Metadata-11-03-01.pdf (accessed on 17 September 2025).
- Yang, J.; Cao, J.; Zhou, Y. Elaborating non-linear associations and synergies of subway access and land uses with urban vitality in Shenzhen. Transp. Res. Part A Policy Pract. 2021, 144, 74–88. [Google Scholar] [CrossRef]
- Lu, X.; Kuang, B.; Li, J. Regional difference decomposition and policy implications of China’s urban land-use efficiency under the environmental restriction. Habitat Int. 2018, 77, 32–39. [Google Scholar] [CrossRef]
- Tan, S.; Hu, B.; Kuang, B.; Zhou, M. Regional differences and dynamic evolution of urban land green use efficiency within the Yangtze River Delta, China. Land Use Policy 2021, 106, 105449. [Google Scholar] [CrossRef]
- Ruan, L.; He, T.; Xiao, W.; Chen, W.; Lu, D.; Liu, S. Measuring the coupling of built-up land intensity and use efficiency: An example of the Yangtze River Delta urban agglomeration. Sustain. Cities Soc. 2022, 87, 104224. [Google Scholar] [CrossRef]
- Sun, Y.; Ma, A.; Su, H.; Su, S.; Chen, F.; Wang, W.; Weng, M. Does the establishment of development zones really improve industrial land-use efficiency? Implications for China’s high-quality development policy. Land Use Policy 2020, 90, 104265. [Google Scholar] [CrossRef]
- Alder, S.; Shao, L.; Zilibotti, F. Economic reforms and industrial policy in a panel of Chinese cities. J. Econ. Growth 2016, 21, 305–349. [Google Scholar] [CrossRef]
- Yuan, C.; Ren, S.; He, J. Urban sprawl and economic vitality: Evidence from 284 cities in China. J. Urban Plann. Dev. 2025, 151, 04025013. [Google Scholar] [CrossRef]
- Ge, K.; Wang, Y.; Liu, X.; Hu, L.; Ke, S.; Jiang, X.; Zhang, W. Spatial effects and influence mechanisms of urban land use green transition on urban carbon emissions. Ecol. Indic. 2025, 172, 113261. [Google Scholar] [CrossRef]
- Cui, Y.; Shi, K.; Jiang, L.; Qiu, L.; Wu, S. Identifying and evaluating the nighttime economy in China using multisource data. IEEE Geosci. Remote Sens. Lett. 2021, 18, 1906–1910. [Google Scholar] [CrossRef]
- Guo, X.; Yang, Y.; Cheng, Z.; Wu, Q.; Li, C.; Lo, T.; Chen, F. Spatial social interaction: An explanatory framework of urban space vitality and its preliminary verification. Cities 2022, 121, 103487. [Google Scholar] [CrossRef]
- Montgomery, J. Making a city: Urbanity, vitality and urban design. J. Urban Des. 1998, 3, 93–116. [Google Scholar] [CrossRef]
- Peráček, T.; Kaššaj, M. Legal Easements as Enablers of Sustainable Land Use and Infrastructure Development in Smart Cities. Land 2025, 14, 681. [Google Scholar] [CrossRef]
- Čechmánek, K.; Palšová, L. Sustainable Ends--Colonial Means? On Sustainability, Planning and Malintentions in Global Green Policies. Jurid. Trib. Trib. Jurid. 2024, 14, 384–401. [Google Scholar] [CrossRef]
- Deng, H.; Liu, K.; Feng, J. Understanding the impact of modifiable areal unit problem on urban vitality and its built environment factors. Geo-Spat. Inf. Sci. 2024, 28, 455–471. [Google Scholar] [CrossRef]
- Li, L.; Zheng, Y.; Ma, S.; Ma, X.; Zuo, J.; Goodsite, M. Unfavorable weather, favorable insights: Exploring the impact of extreme climate on green total factor productivity. Econ. Anal. Policy 2025, 85, 626–640. [Google Scholar] [CrossRef]
- Liu, B.; Sun, Y.; Luo, X.; Zhang, D.; Qian, Z. Research on Yellow River Basin ecosystem resilience and regional economic coupling coordination. J. Nat. Conserv. 2025, 127047. [Google Scholar] [CrossRef]
- Hu, Y.Y.; Liang, Y.J.; Xiong, C.S. Has Hainan International Tourism Island strategy caused the Matthew effect of inter-regional urban construction land expansion? China Land Sci. 2023, 37, 64–73. (In Chinese) [Google Scholar]
- Shannon, C.E. A mathematical theory of communication. Bell Syst. Tech. J. 1948, 27, 379–425. [Google Scholar] [CrossRef]
- Shemshadi, A.; Shirazi, H.; Toreihi, M.; Tarokh, M.J. A fuzzy VIKOR method for supplier selection based on entropy measure for objective weighting. Expert Syst. Appl. 2011, 38, 12160–12167. [Google Scholar] [CrossRef]
- Tang, Y.; Xue, D.Q.; Song, Y.Y.; Zheng, B.K.; Ma, B.B.; Ye, H. Coupling coordination and influencing factors of economic scale-structure-efficiency of resource-based cities on the Loess Plateau. Acta Geogr. Sin. 2025, 80, 793–810. (In Chinese) [Google Scholar]
- Zhao, N.; Liu, Y.; Cao, G.; Samson, E.L.; Zhang, J. Forecasting China’s GDP at the pixel level using nighttime lights time series and population images. Mapp. Sci. Remote Sens. 2017, 54, 407–425. [Google Scholar] [CrossRef]
Disclaimer/Publisher’s Note: The statements, opinions and data contained in all publications are solely those of the individual author(s) and contributor(s) and not of MDPI and/or the editor(s). MDPI and/or the editor(s) disclaim responsibility for any injury to people or property resulting from any ideas, methods, instructions or products referred to in the content. |
© 2025 by the authors. Licensee MDPI, Basel, Switzerland. This article is an open access article distributed under the terms and conditions of the Creative Commons Attribution (CC BY) license (https://creativecommons.org/licenses/by/4.0/).