Article

Assessing Travel-Time Accessibility to Urban Green Spaces in Car-Dependent Cities: Evidence from Erbil and Sulaimaniyah, Kurdistan Region of Iraq

by
Yaseen N. Hassan
1,2,*,
Hawzheen A. Mohammed
3,
Mahmoud Abuhayya
4 and
Sándor Jombach
1
1
Department of Landscape Planning and Regional Development, Institute of Landscape, Architecture, Urban Planning and Garden Art, Hungarian University of Agriculture and Life Sciences, 1118 Budapest, Hungary
2
Department of Horticulture, College of Agricultural Engineering Sciences, University of Sulaimani, Sulaimaniyah 46001, Iraq
3
Independent Researcher, Sulaimaniyah 46001, Iraq
4
Department of Garden Art and Garden Architecture, Institute of Landscape Architecture, Hungarian University of Agriculture and Life Sciences, 1118 Budapest, Hungary
*
Author to whom correspondence should be addressed.
Land 2025, 14(9), 1886; https://doi.org/10.3390/land14091886
Submission received: 1 July 2025 / Revised: 27 August 2025 / Accepted: 5 September 2025 / Published: 15 September 2025
(This article belongs to the Section Urban Contexts and Urban-Rural Interactions)

Abstract

Urban green spaces (UGS) provide numerous benefits, but challenges in availability and accessibility often limit their full potential. This study assesses equity and disparities in car-based accessibility to Large Urban Green Spaces (LUGS > 8 ha) in the rapidly growing cities of Sulaimaniyah and Erbil in the Kurdistan Region of Iraq. Road network accessibility was analyzed using OpenRouteService (ORS) and calibrated with real-time Google Maps data to improve accuracy. Google Earth Engine (GEE) was used for NDVI-based vegetation mapping and LUGS quality assessment. Isochrones based on 5, 10, and 15 min from LUGS entrances were generated to measure served areas and population coverage at citywide and zonal levels. The findings reveal notable spatial inequities in both cities, with disparities especially evident at shorter travel times. Accessibility declines from central to outer zones. Azadi Park and Sami Abdulrahman Park emerged as key service hubs. The number of LUGS active entrances, spatial distribution, and population density are among the key determinants of car accessibility to LUGS. The study highlighted the spatial-temporal suggestion for long- and short-term implementation, with opportunities for enhancement.

1. Introduction

1.1. UGS and Sustainability

Urban green spaces (UGS), including public parks, community gardens, and recreational spaces, are essential to sustainable and livable cities, providing residents with environmental, social, and health benefits. These spaces contribute to sustainable urban development; environmentally, they support urban biodiversity by providing habitats [1], reducing the urban heat island effect through shading and evaporation, improving air quality by filtering pollution [2,3,4], storm water management by absorbing runoff and reducing flood risks [5] and mitigating climate change by sequestering carbon [6]. Socially, UGS support physical and mental health, especially when people have access to and actively engage with them [7].
Due to global urbanization, the role of UGS in enhancing urban resilience and quality of life has become increasingly important [8], with an extra role in semi-arid regions and dense cities when the natural environments are limited [9,10]. Consequently, professionals in this field and policymakers are paying more attention not only to the existence of UGS but also to ensuring easy access for all residents, as the United Nations (UN) 2030 agenda emphasizes the importance of safe and accessible green space in SDG 11 [11].

1.2. Definitions and Classifications of UGS

Urban green space (UGS) is defined differently across studies; here, it refers to green spaces with recreational and esthetic purposes. The current UGS was based on several concepts; in the 20th and 21st centuries, urban planning in America and Europe increasingly emphasized integrating nature into cities. Early approaches promoted ecological planning [12,13], community-driven public spaces [14], regional planning [15], and the development of parks, greenways, and garden city concepts [16]. These ideas helped shape the modern understanding of urban green spaces and their role in creating livable and sustainable cities. Building on this foundation, green-blue infrastructure (or green infrastructure) has emerged, embedding natural systems into urban environments to address social, environmental, and economic challenges [17]. Moreover, UGS has been classified differently according to several criteria: function (such as community parks or heritage parks), ownership type (private, semi-private, and public space), and physical characteristics (such as size and design). UGS is typically categorized as small, medium, large, or very large in size-based classifications. The size includes small pocket parks to large city parks. However, the specific size thresholds for these categories vary significantly across different studies and city planning policies. For example, the size of large urban green space (LUGS) generally starts from 8.1 hectares [18] and 10 hectares [19].

1.3. The Concept of Accessibility and UGS Accessibility in Urban Studies

The concept of accessibility emerged in the second quarter of the 20th century, focusing on spatial proximity in the context of location theory and regional economic planning. It is a foundational concept in urban studies, encompassing the ease with which people can reach desired services, opportunities, and spaces [20]. It was formalized in 1959 as “the potential of opportunities for interaction” by Walter G. Hansen [21]. Building on these foundations, Moshe Ben-Akiva has contributed significantly to the development of disaggregate travel demand models and utility-based measures of accessibility, integrating socioeconomic factors into transport analysis [22]. Accessibility, traditionally associated with transport and mobility, has been expanded to include socio-spatial dimensions such as equity, affordability, and usability [23,24]. It has been classified into four categories: infrastructure-based, location-based, person-based, and utility-based, while considering factors such as transportation mode, travel time, physical ability, and safety [20]. In contemporary research, accessibility is understood as a multifaceted concept encompassing physical, social, and perceived dimensions. This comprehensive framework emphasizes that accessibility is not only a spatial issue but also temporal, functional, and normative. UGS accessibility can be measured using buffer-based or Euclidean distance methods for quick, straight-line estimates that ignore barriers and network-based methods that trace actual walking, cycling, and driving routes. Other techniques, such as the Two or Three-Step Floating Catchment Area and gravity models, incorporate service capacity, demand, and travel time [25,26,27].

1.4. Inequity in UGS Accessibility and Gaps

Equitable access to urban green spaces (UGS) is increasingly recognized as a key indicator of urban environmental justice and well-being [28]. Access disparities often reflect broader socioeconomic inequalities; wealthier neighborhoods typically have greater access to high-quality green spaces, whereas low-income and minority communities often face limited and poor-quality provision [29,30,31]. Global North cities have three times the rate of UGS exposure compared to the Global South [32]. Most existing studies and planning strategies on UGS accessibility emphasize spatial distribution and proximity show inequality in UGS accessibility in the cities: Melbourne (Australia) [33], Singapore [34], Seoul (Korea) [35], Beijing (China) [36], Tehran (Iran) [37], Erbil (Kurdistan-Iraq) [38], Barcelona (Spain) [39], Budapest (Hungary) and Vienna (Austria) [40], Lodz (Poland) [41], Stockholm (Sweden) [42], Berlin (Germany) [43], London (UK), Porto (Portugal) [44] Cape Town (South Africa) [45], Phoenix and New York (US) [46], and Mexico City [47]. Studies indicate that proximity and spatial distribution do not accurately reflect real accessibility regarding travel time or route availability. Urban planning fails to provide access to UGS, particularly for residents of peripheral neighborhoods, without incorporating how people reach these spaces [48].
The literature on sustainable UGS accessibility focused on walkability, cycling, and public transportation [49]. Walking is recognized as the most sustainable means of accessing UGS [50]. Likewise, public transport or transit is frequently promoted for its potential to reduce social inequalities and promote sustainable urban mobility [51,52]. However, in many developing cities, public transport systems are often fragmented, infrequent, or unreliable [53,54]. As a result, the exclusive focus on walking and public transport may mask substantial accessibility gaps in cities where private cars and taxis are the dominant modes of mobility [55,56].

1.5. Car Dependency and Sustainability Concerns

Generally, reliance on automobile accessibility presents serious obstacles to environmental sustainability, according to numerous academics, mainly because it releases pollutants and greenhouse gases that deteriorate air quality and have a negative impact on public health. Dependency on cars also tends to promote sedentary lifestyles, which are linked to several health problems [57]. Those without access are frequently marginalized in society due to an over-reliance on private vehicles, which limits their mobility and exacerbates social injustices [58]. Furthermore, cars are an inefficient use of urban space; each driver takes up the same amount of road space as roughly twenty bus passengers, which increases traffic congestion, raises infrastructure costs, and degrades the environment [59]. Accessibility is often associated with walking, cycling, and public transport; there is a notable lack of global and localized research on car-based accessibility to UGS.

1.6. Urban Growth and Car Dependency in the Kurdistan Region of Iraq

Kurdistan Region of Iraq (KRI), after decades of instability, gained autonomy and self-governance in 1991. Since then, it has undergone fundamental transformations driven by political, economic, global, cultural, and demographic changes. The region currently comprises four governorates: Erbil (Hawler) as the capital, Sulaimaniyah (Slemani or Sulaimani), Duhok, and Halabja. The autonomous management of resources and revenues has enabled the region to accelerate its reconstruction, experience significant urban growth, and undergo rapid spatial expansion. This growth has been increased by internal migration from rural to urban areas within Kurdistan and external migration from other parts of Iraq, due to instability. Moreover, urban expansion has been intensified by immigration from countries like Syria and Iran. This predominantly unplanned growth does not constitute a sustained approach, leading to increased demand for buildings and properties, primarily at the expense of UGS.
Although transport infrastructure in these cities has been developing to some extent, public transport systems remain limited in coverage and efficiency, often failing to provide reliable access across different parts of the city. Additionally, in KRI, car ownership has increased significantly, from about 126 vehicles per 1000 people in 2002 to 435 per 1000 people by 2013 [60]. Government records now indicate that over 2 million vehicles are registered in the region, which, with a current population of 6.37 million, translates to nearly one car for every three people [61]. Notably, over 36% of the population is under the age of 15, resulting in a high car-to-adult ratio. It is estimated that there is about one car for every two adults, with an average household size of about 4.6 people [62]. This suggests that many households have access to a private vehicle. While exact gender-based car ownership data is unavailable, it is evident that the population depends heavily on cars for daily mobility, adding pressure to urban infrastructure and planning efforts.

1.7. Case Studies Justification

Erbil and Sulaimaniyah are chosen as case studies because they are the two largest cities in the KRI and represent rapidly developing urban centers that rely heavily on cars and face similar growth pressures. They are also located in a unique region with no comparable counterpart in Iraq or the surrounding countries (former paragraph). We selected these two cities, rather than just one, because a single city cannot provide a comprehensive picture of the accessibility issues in the KRI. Owing to differences in policies, political leadership, and geography, Erbil serves as the political and administrative capital of the region under the Kurdistan Democratic Party (KDP) and is situated on a flat plateau. In contrast, Sulaimaniyah serves as the cultural and educational capital of the region under the Patriotic Union of Kurdistan (PUK) and is located in a mountainous area.

1.8. Emerging Opportunities for Car-Based Accessibility and Comparative Evidence vs. Public Transport

Although car travel is typically de-emphasized in sustainable mobility frameworks, it plays a crucial role in real-world access, especially in car-dependent urban settings. Some scholars have highlighted that walking accessibility is inappropriate for specific social groups, such as young people, seniors, and people with disabilities, thereby emphasizing the need for car accessibility [63,64]. The development of electric and autonomous vehicles offers promising opportunities to reduce emissions and enhance fuel efficiency, especially when combined with renewable energy and smart infrastructure [65]. Additionally, accessible vehicle designs that consider individuals with disabilities promote inclusivity and independence, ensuring equitable travel opportunities for all and supporting social participation [66]. Car dependency is also emphasized in both developed and developing countries; for instance, a comparative study in developed countries such as Portugal and Lithuania indicates that residents of Coimbra and Vilnius rely mostly on cars rather than other travel modes when accessing UGS [67]. Similarly, in a developing context, traveling by car in Beijing significantly improves park accessibility due to the time-space compression effect, offering faster and broader access than other modes [68]. Another study cited three investigations conducted in Washington, DC, Boston, and San Francisco, which found that car (automobile) accessibility is better compared to public transit [69]. Moreover, a comparative study of 100 cities in the US and Europe highlighted that, although car-oriented cities have a negative impact on well-being, car accessibility provides more effective overall access compared to public transport [70].

1.9. Research Gap: Car-Based Accessibility to UGS in KRI

Despite the evident reliance on private cars for urban mobility in the KRI, there is a noticeable lack of empirical research assessing car-based accessibility to UGS in its major cities. There are two studies about UGS accessibility: first, by car, and second, by walking. First used Erbil as a case study, it reported that approximately 70% of the population could access parks within 5 min by car, increasing to 100% within 15 min [71]. However, this study did not specify the park’s exact size and used the park’s center point for accessibility. Second, UGS accessibility by walking, compared between Sulaimaniyah and Erbil, highlighted significant disparities, for walking accessibility, revealing that nearly 40% of the population in both cities cannot access a UGS > 0.5 ha, within a 15 min walking threshold, and for LUGS > 10 ha, accessibility is less than 10% [38]. This indicates insufficient accessibility by walking and falls below international standards. The current study is unique as the ORS road network system was used and has been adjusted with Google Maps to be more realistic. Moreover, UGS larger than 8 hectares were chosen; this is supported by previous research suggesting that people generally use cars or public transport to access parks of 8 ha. or larger [72,73].
The region is undergoing rapid urban development, and the government’s goal to increase UGS to 15 m2 per capita by 2030, along with plans for an extensive green belt, provides the motivation for this study. Ongoing investments in road infrastructure, including the 150 m and 100 m ring roads in Erbil and Sulaymaniyah, which are currently under construction, make it increasingly important to understand car-based accessibility to UGS. This study offers an empirical assessment that can help urban planners make informed decisions for more sustainable and accessible cities.

1.10. Research Objectives and Key Questions

The primary objective of this paper is to assess equity and disparities in car-based accessibility to Large Urban Green Spaces (LUGS > 8 ha) through real-time network analysis, focusing on travel times, spatial reach, and infrastructure-related factors. These can be achieved by answering these questions.
  • What are the spatial distributions of vegetation; green space; and LUGS, their corresponding entrances, and the population in both case cities?
  • What is the quality of the LUGS in terms of vegetative cover proportion?
  • What are the areas of LUGS and the corresponding population coverage at the city level, as determined using the ORS method based on active gates?
  • How does the enhanced method affect car accessibility?
  • What are the zonal disparities in car access to LUGS?
  • How can we identify the best-performing LUGS considering the number of gates, location in the urban hierarchy, and the density of the surrounding population?
  • What are the spatial equity and disparities in the cities and zonal areas?
The rest of the paper is structured as follows. Section 2 describes the research methodology, including data collection, case study selection, and analytical techniques. Section 3 presents the results, focusing on the spatial distribution of vegetation and urban green spaces, car-based accessibility to large urban green spaces (LUGS) before and after enhancement, zonal disparities, and the key determinants, as well as the LUGS that are most accessible by car. Section 4 discusses the findings in the context of sustainability and equity, while Section 5 summarizes the study’s main contributions and highlights policy implications and future research directions.

2. Materials and Methods

2.1. Data Collection

Urban green spaces data were collected from local municipality sources, green space administrative departments, and previous studies for both cities. Gate locations were identified using Google Earth and local expertise. The gates are generally open from early morning to late at night; however, this does not apply to all gates. Vegetation cover within the LUGS areas was assessed using the Normalized Difference Vegetation Index (NDVI) for April and May over the past four years, utilizing Google Earth Engine (GEE) [74], using Sentinel-2 with a resolution of 10 m, developed and distributed by the European Space Agency (ESA) as part of the Copernicus program. The road network was prepared using the OpenRouteService (ORS Tools plugin) in QGIS, which required free user registration and an API key [75]. It has been developed by the Heidelberg Institute for Geoinformation Technology at Heidelberg University, which provides customizable, open-source routing based on OpenStreetMap (OSM) data [76]. Google Maps, which accounts for real-time traffic and empirical routing, is used to increase accuracy. The population data were obtained from LandScan HD Iraq 2022, which was developed by Oak Ridge National Laboratory (ORNL) in the United States, and we adjusted it with the city census data. The spatial analyses were performed using QGIS version 3.40.1.

2.2. Case Studies

The Kurdistan Region of Iraq (KRI) or Kurdistan Regional Governorate (KRG) is located in the northern part of Iraq, bordered by Iran in the east, Turkey in the north, and Syria to the west (Figure 1). Geographically, it is centered around Latitude 36.5° N and Longitude 44.5° E according to WGS84 coordinates. In recent years, the region has been experiencing rapid urbanization. Sulaimaniyah, as a first case study, is a city with a history of approximately 250 years, but it is known as the region’s cultural capital. The city boundary was recently defined as the 100 m road, with an urban size of approximately 451 km2, with an estimated population of 1.1 million. The second case study is Erbil (Hawler), the capital city of Kurdistan Regional Government (KRG), which has been a continuously inhabited city with urban life for about 6000 years. The core part, which is called citadel (Qallat, Qalla) registered by UNESCO World Heritage as one of the world’s oldest urban settlements [77]. The current urban extent of Erbil, as defined by the 150 m ring road, covers an area of approximately 431 km2, with an estimated population of 1.6 million.
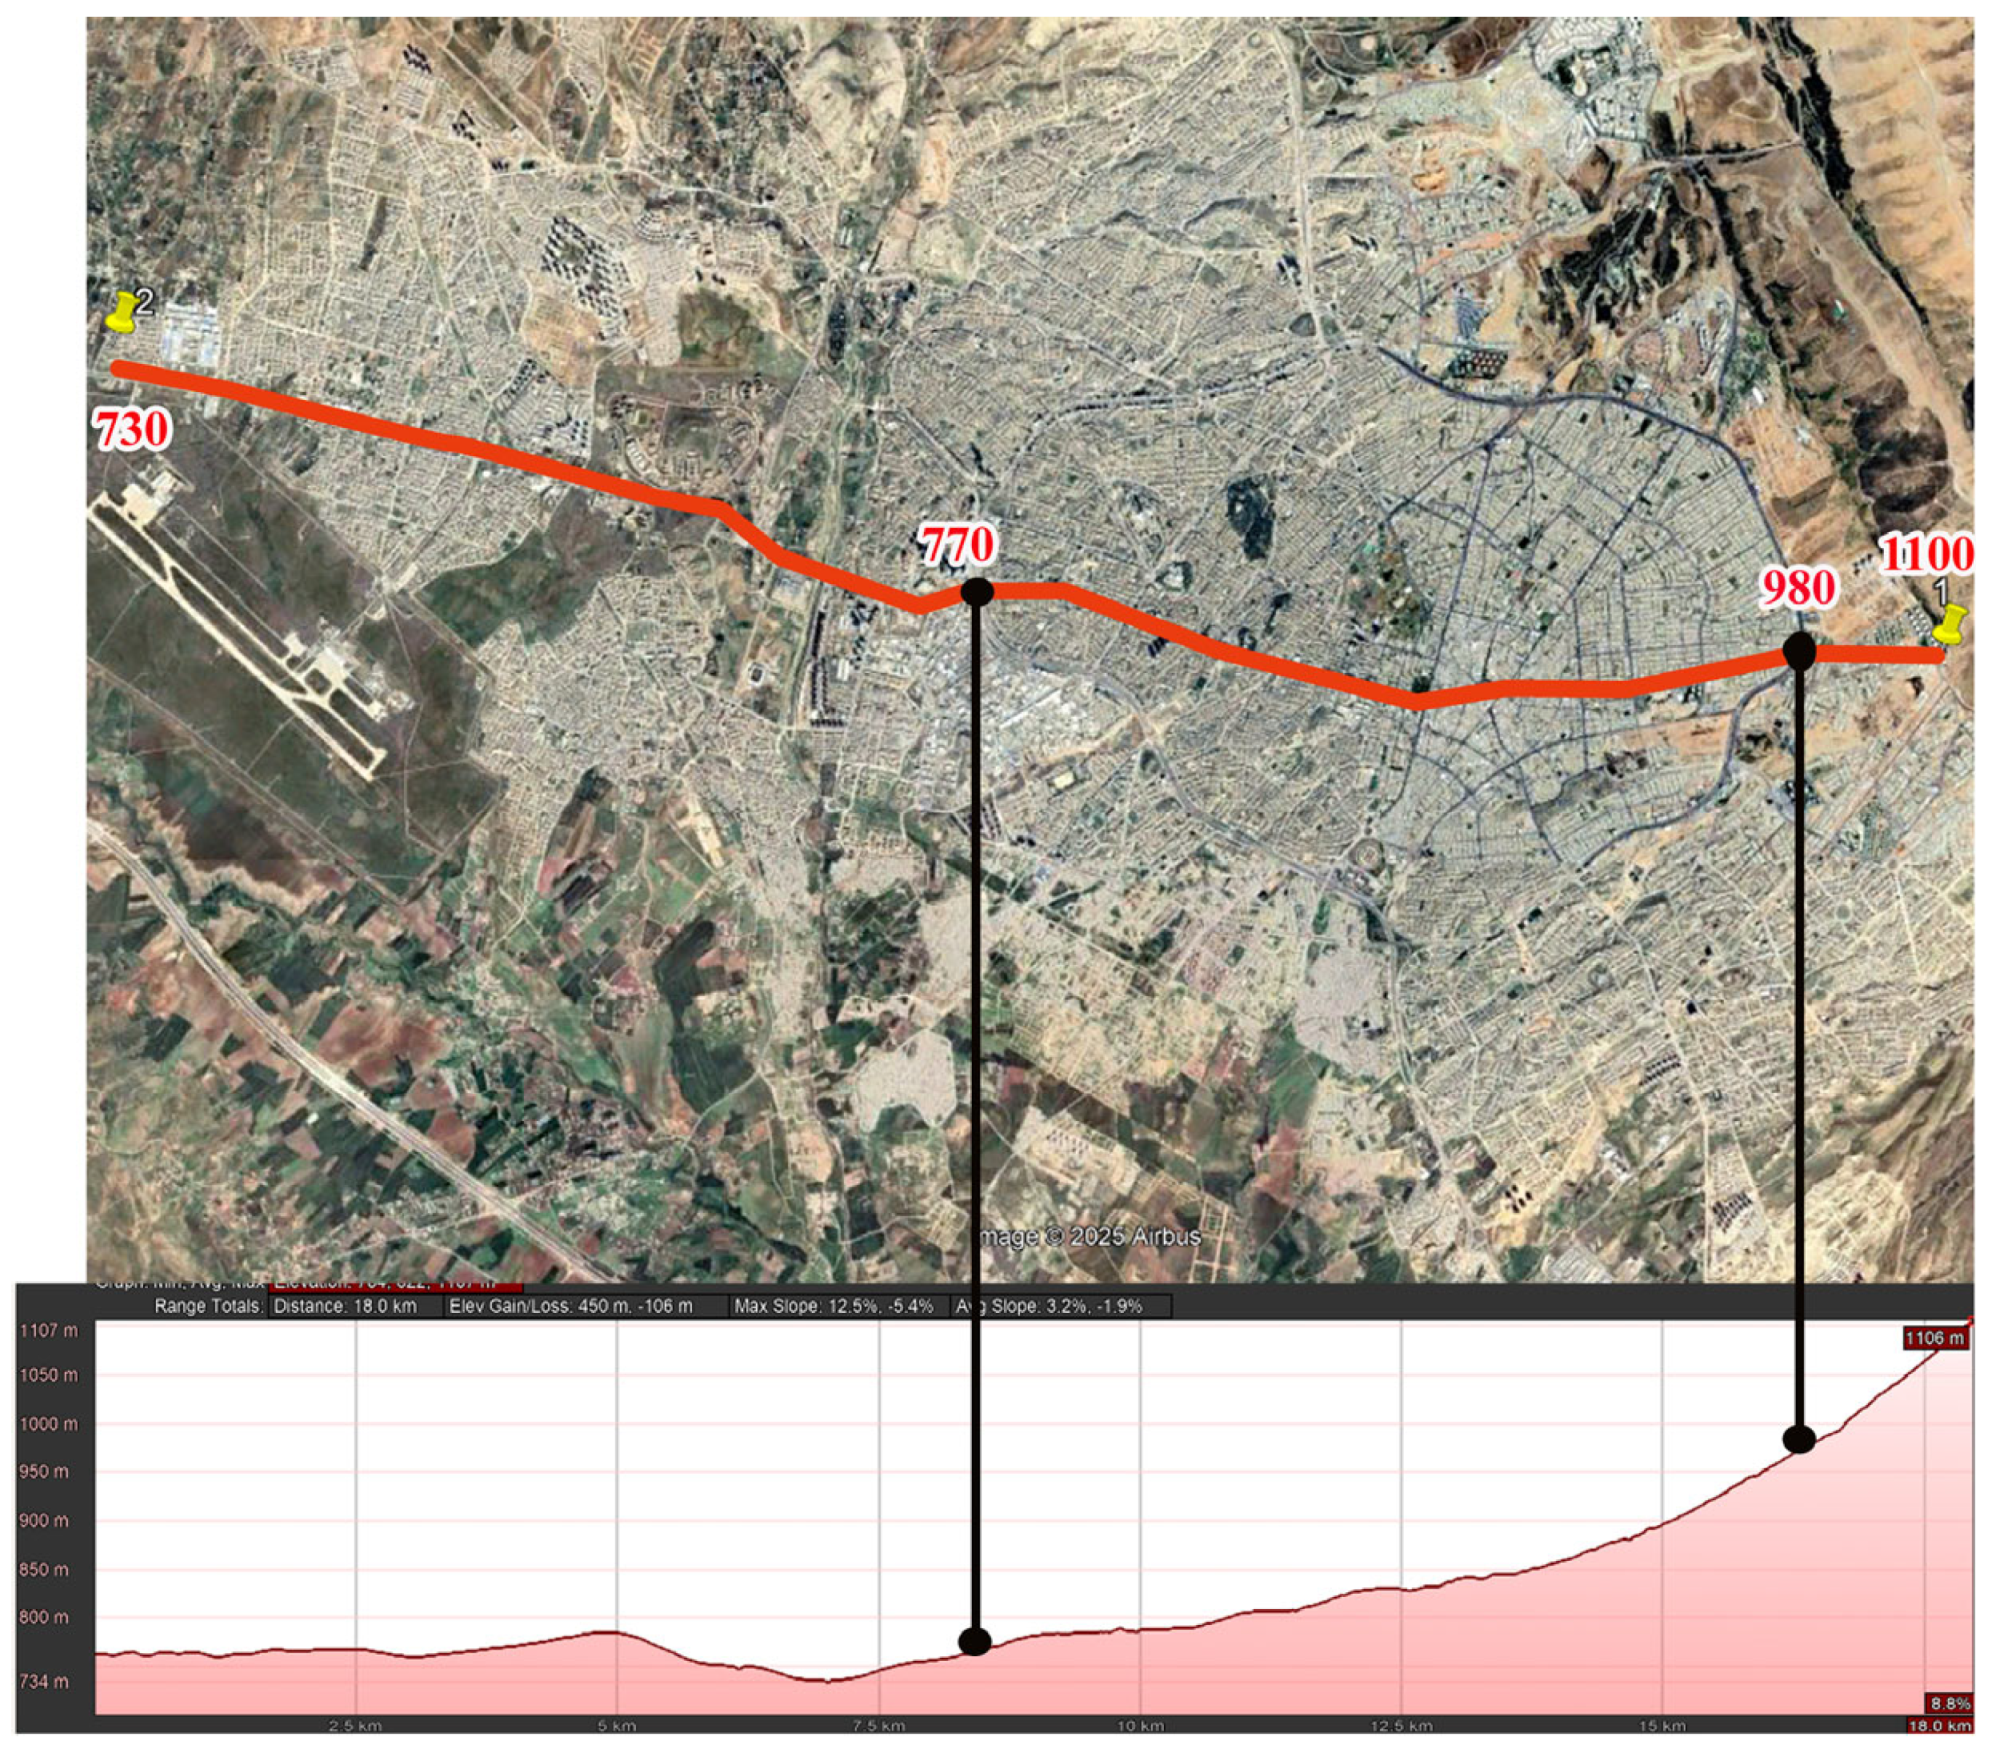
For the elevation profiles of Sulaimaniyah and Erbil, a walking path illustrated in Google Earth shows a transect extending from the mountainous east (Point 1) to the flat western plains (Point 2) in Sulaimaniyah (Figure 2). The eastern segment lies at the foothills of steep mountains, while the west is located within low, open plains. The elevation profile begins at approximately 1100 m in the east, then descends sharply over several kilometers before leveling out for the final 12–13 km, reaching about 730 m in the western plains. The inner core of the city is situated between 770 and 980 m above sea level. The average elevation along the transect is approximately 870 m. In comparison, Erbil lies on a relatively flat plateau, with elevation generally decreasing from east to west (Figure 3). It starts at about 640 m in the east, then gradually decreases toward the west, with the lowest point near 360 m, an average elevation of around 440 m, and the inner core located at an elevation of 380–430 m above sea level.

2.3. Data Analysis

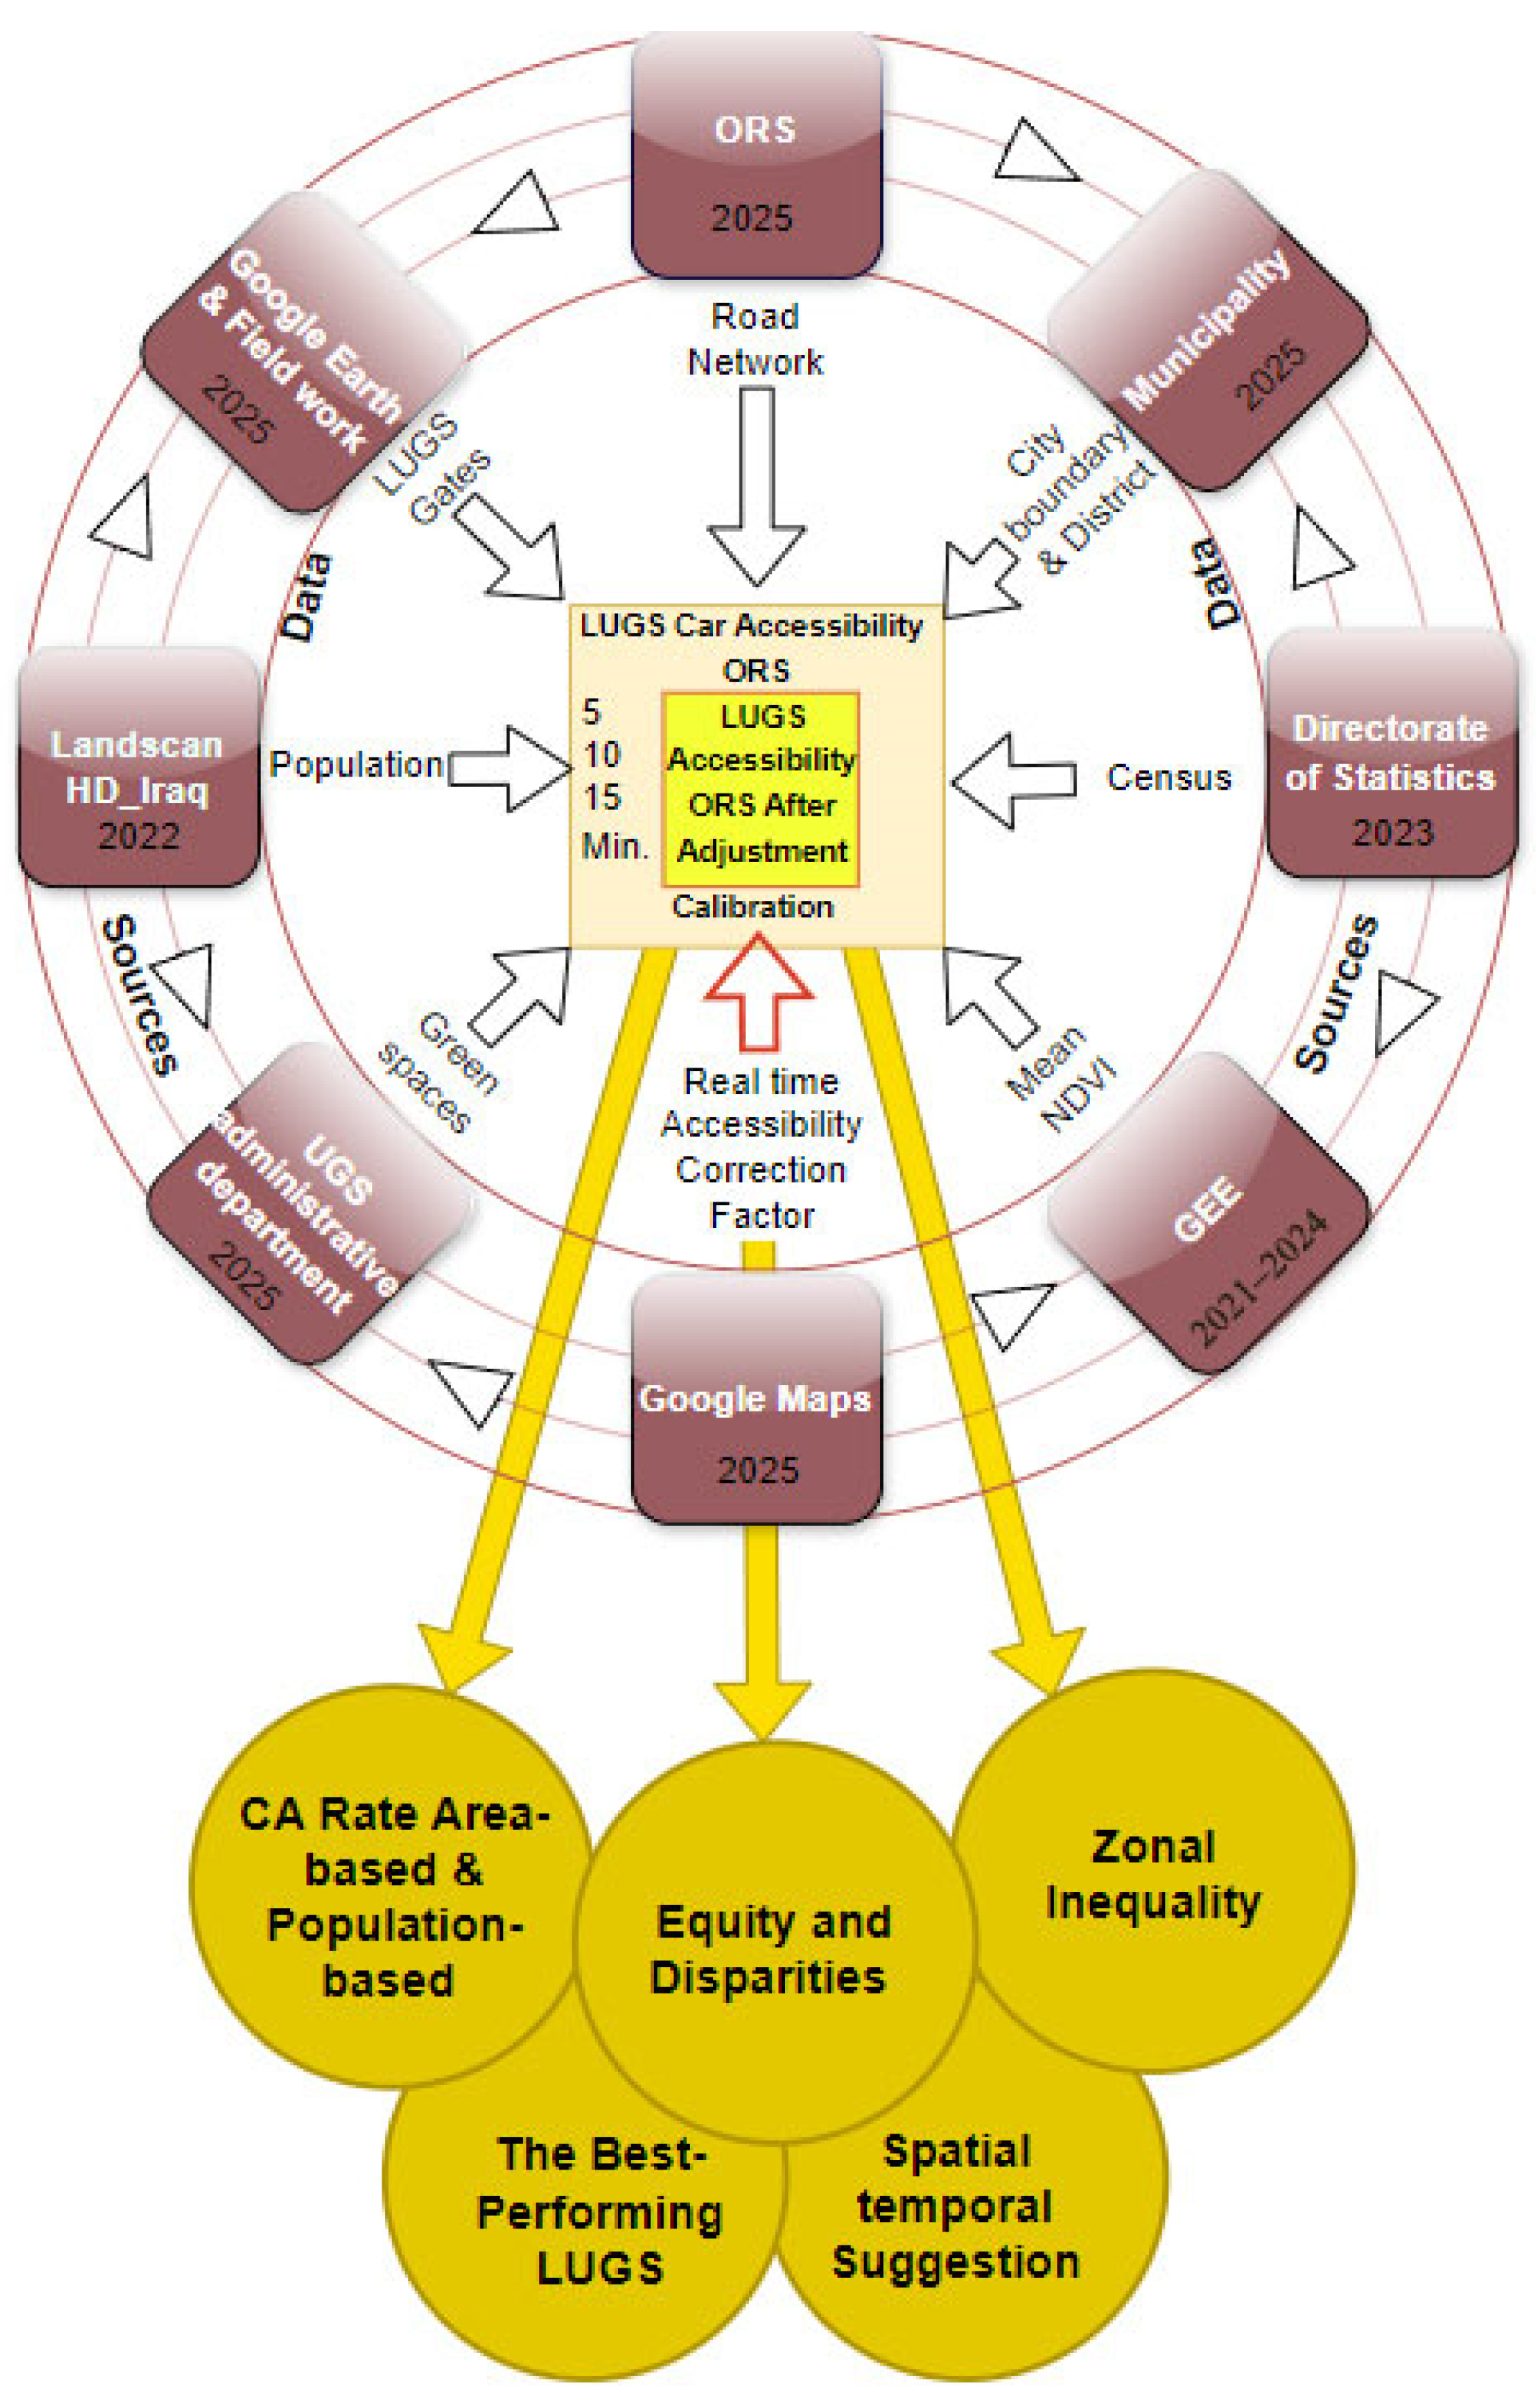
This study analyzed car-based accessibility to Large Urban Green Space (LUGS) using a hybrid geospatial approach (Figure 4). NDVI value converted to vegetation coverage by classifying into binary categories as vegetation and non-vegetation.
Binary NDVI
1 → if NDVI > 0.2 (Vegetation)
0 → if NDVI ≤ 0.2 (Non-Vegetation)
Then it converted to a vegetation area by
where
N v e g = N u m b e r   o f   p i x e l s   c l a s s i f i e d   a s   v e g e t a t i o n
Isochrones generated from a point layer, representing the main entrances (gates) of each LUGS larger than 8 ha, with thresholds of 5, 10, and 15 min for car driving. The first result was obtained using the OpenRouteService (ORS) tools, based on the OpenStreetMap (OSM) road network. The second result also employed ORS, but the catchment areas around LUGS entrances were enhanced through calibration with travel times derived from Google Maps, similar study conducted in 2022 for car accessibility in urban mobility [78].
Figure 4. Methodological workflow, the big ring has brown squares represents the sources, while inside the ring contains the data used in the study. Arrows indicate the direction of movement and approach. The first light yellow square shows the initial results of car accessibility based on ORS before adjustment. The smaller yellow inner square represents car accessibility after adjusting the ORS results using Google Maps. The five yellow circles beneath the main ring represent the detailed results.
Land 14 01886 g004
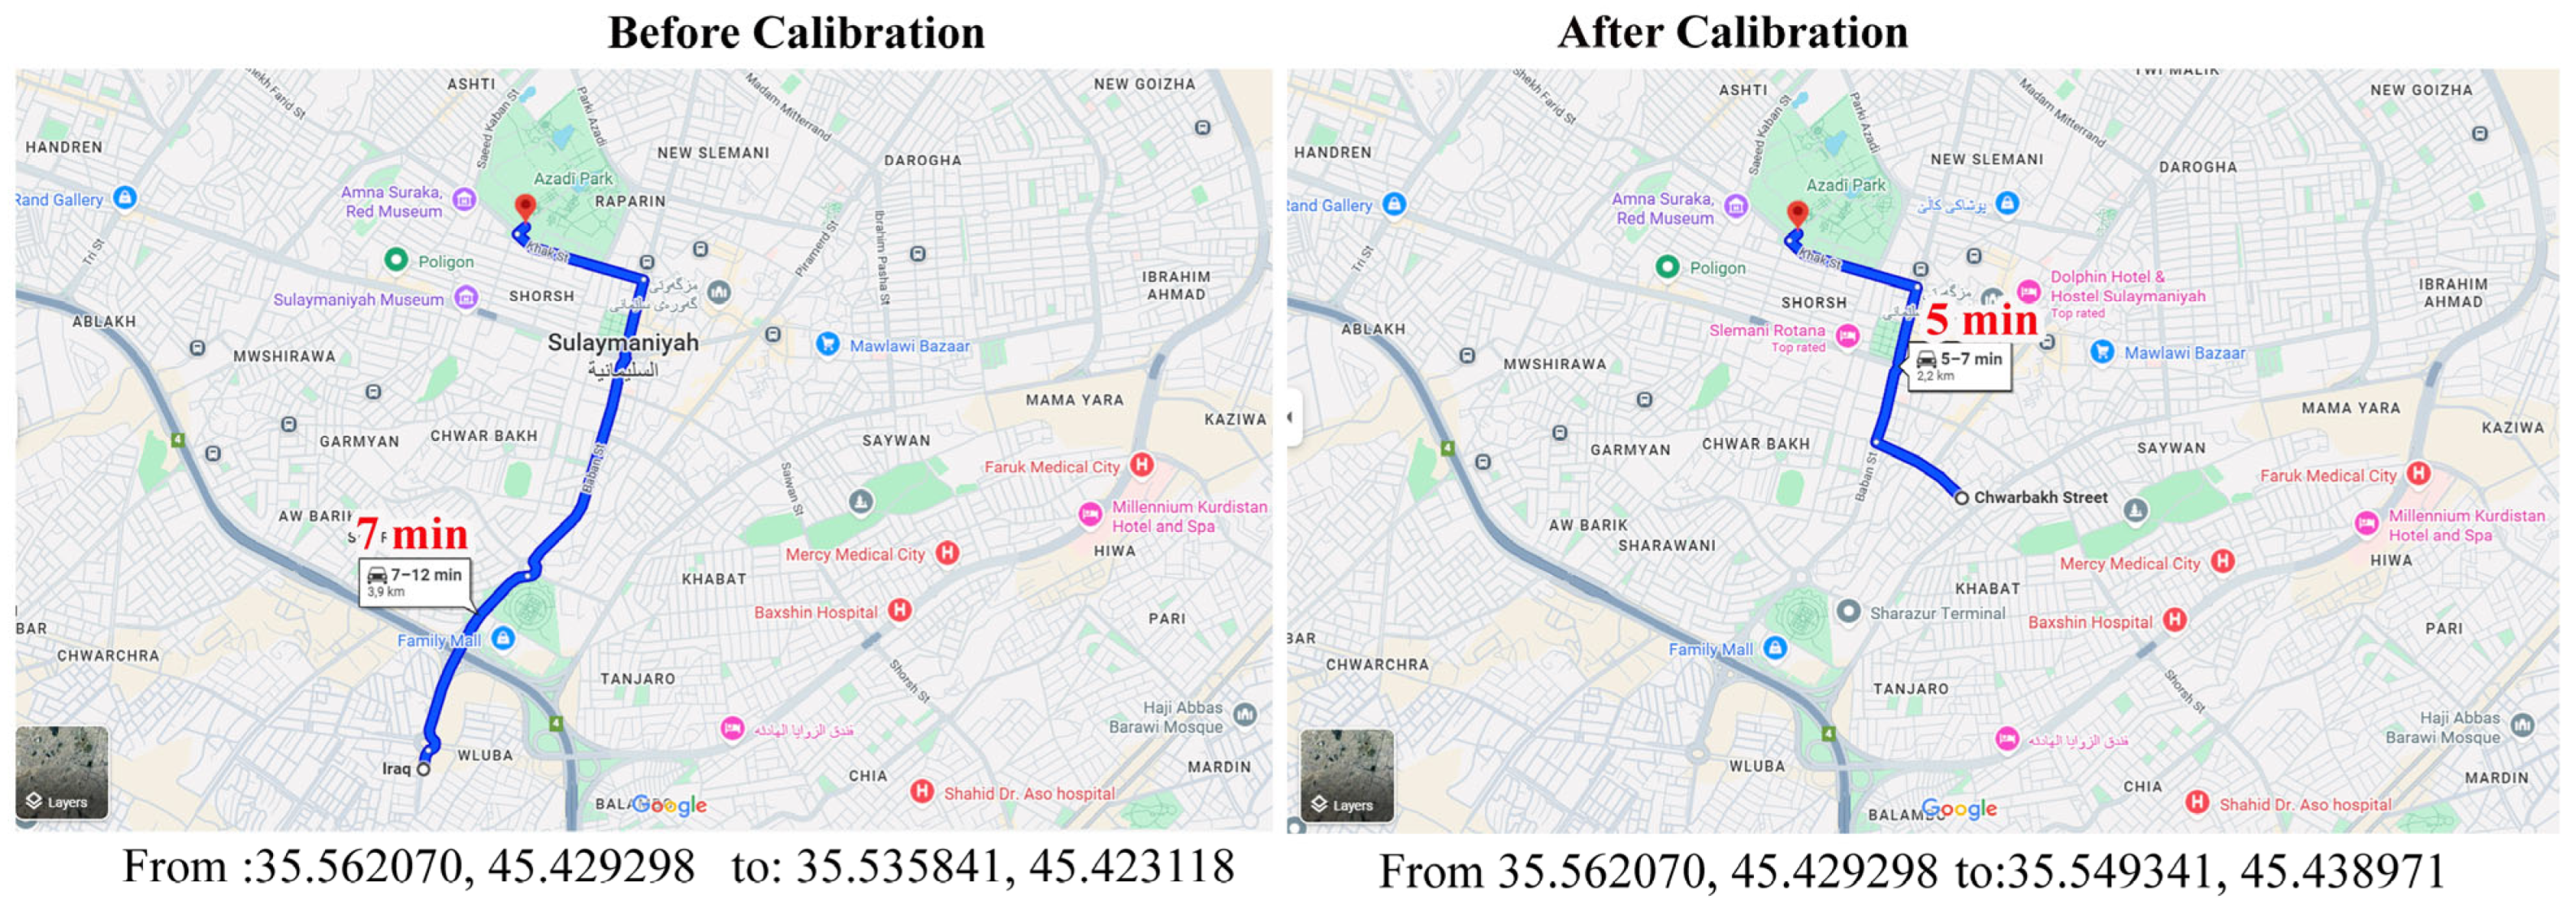
Travel durations from LUGS gates to the outer boundaries of the isochrones were computed using geographic coordinates and compared to Google Maps travel times. The car route was analyzed based on different days in May and June and at various times of day, taking into account both the shortest and fastest available routes. As a result, the ORS analysis consistently overestimates compared to Google Maps. A correction factor of 1.25 (Figure 5), which is the mean value within a range of 1.13 to 1.40, was used to calibrate the results.
This factor was applied to adjust the ORS isochrones, each threshold by this value, enhancing the realism of the resulting accessibility area. To the best of our knowledge, this two-step calibration process in this way represents a novel methodological contribution to improving isochrones-based accessibility analysis.
The cities were analyzed based on city level and three zonal areas. Traditionally, until the end of the 20th century, most of the population in Sulaimaniyah lived within an area surrounded by the 60 m road, and in Erbil, the population was concentrated inside the 100 m ring road. These two areas were considered the core (inner) zones [79]. The remaining urban areas were initially categorized as outer zones. However, to provide a more meaningful spatial distinction, a transitional zone was identified. This transitional zone corresponds to the area immediately surrounding the core: in Erbil, it includes the next developed ring road, which is 1 to 2 km buffer outside the core, while in Sulaimaniyah, it is a 1 km buffer around the inner zone. Areas beyond these buffers were classified as outer zones. The areas falling within any of the defined travel time ranges are classified as “served area” and the population within the served area as “served population” and calculated as follows:
%   S e r v e d   a r e a = A r e a   w i t h i n   t i m e   t h r e s h o l d T o t a l   A r e a ×   100
%   S e r v e d   p o p u l a t i o n = P e o p l e   w i t h i n   t i m e   t h r e s h o l d T o t a l   p o p u l a t i o n × 100

3. Results

3.1. Spatial Distribution of the Vegetation, Green Space, and LUGS

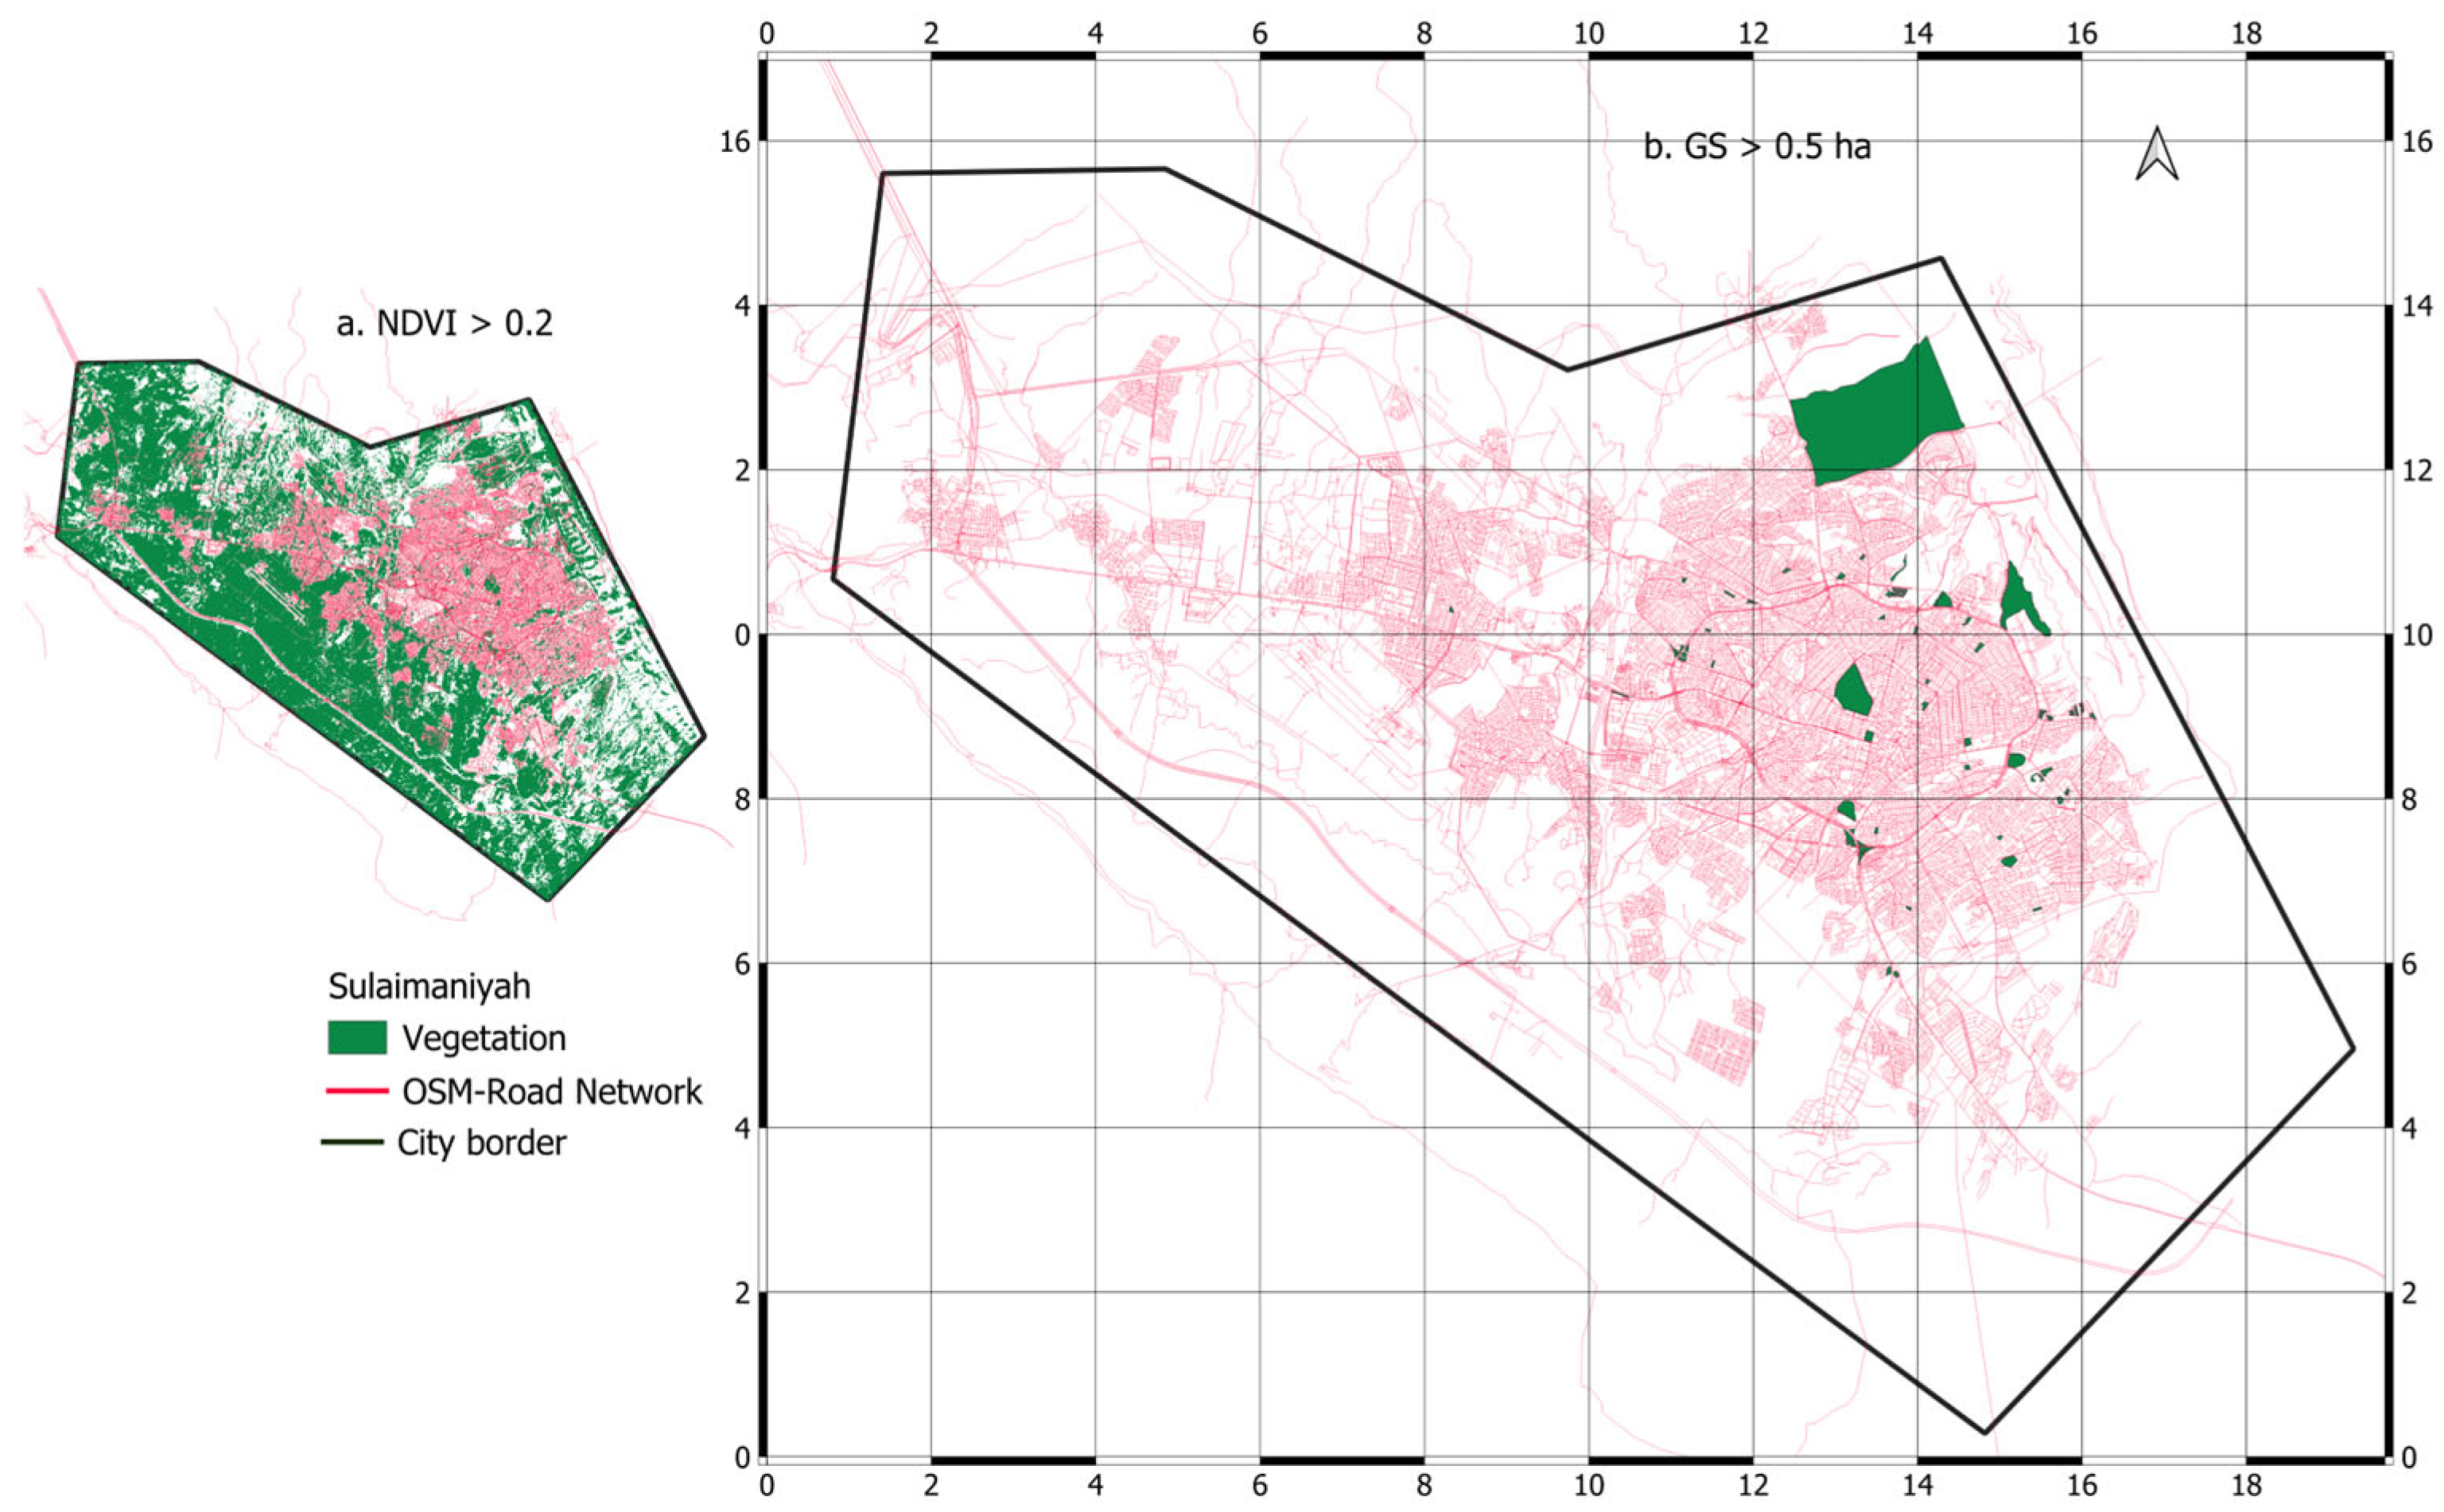
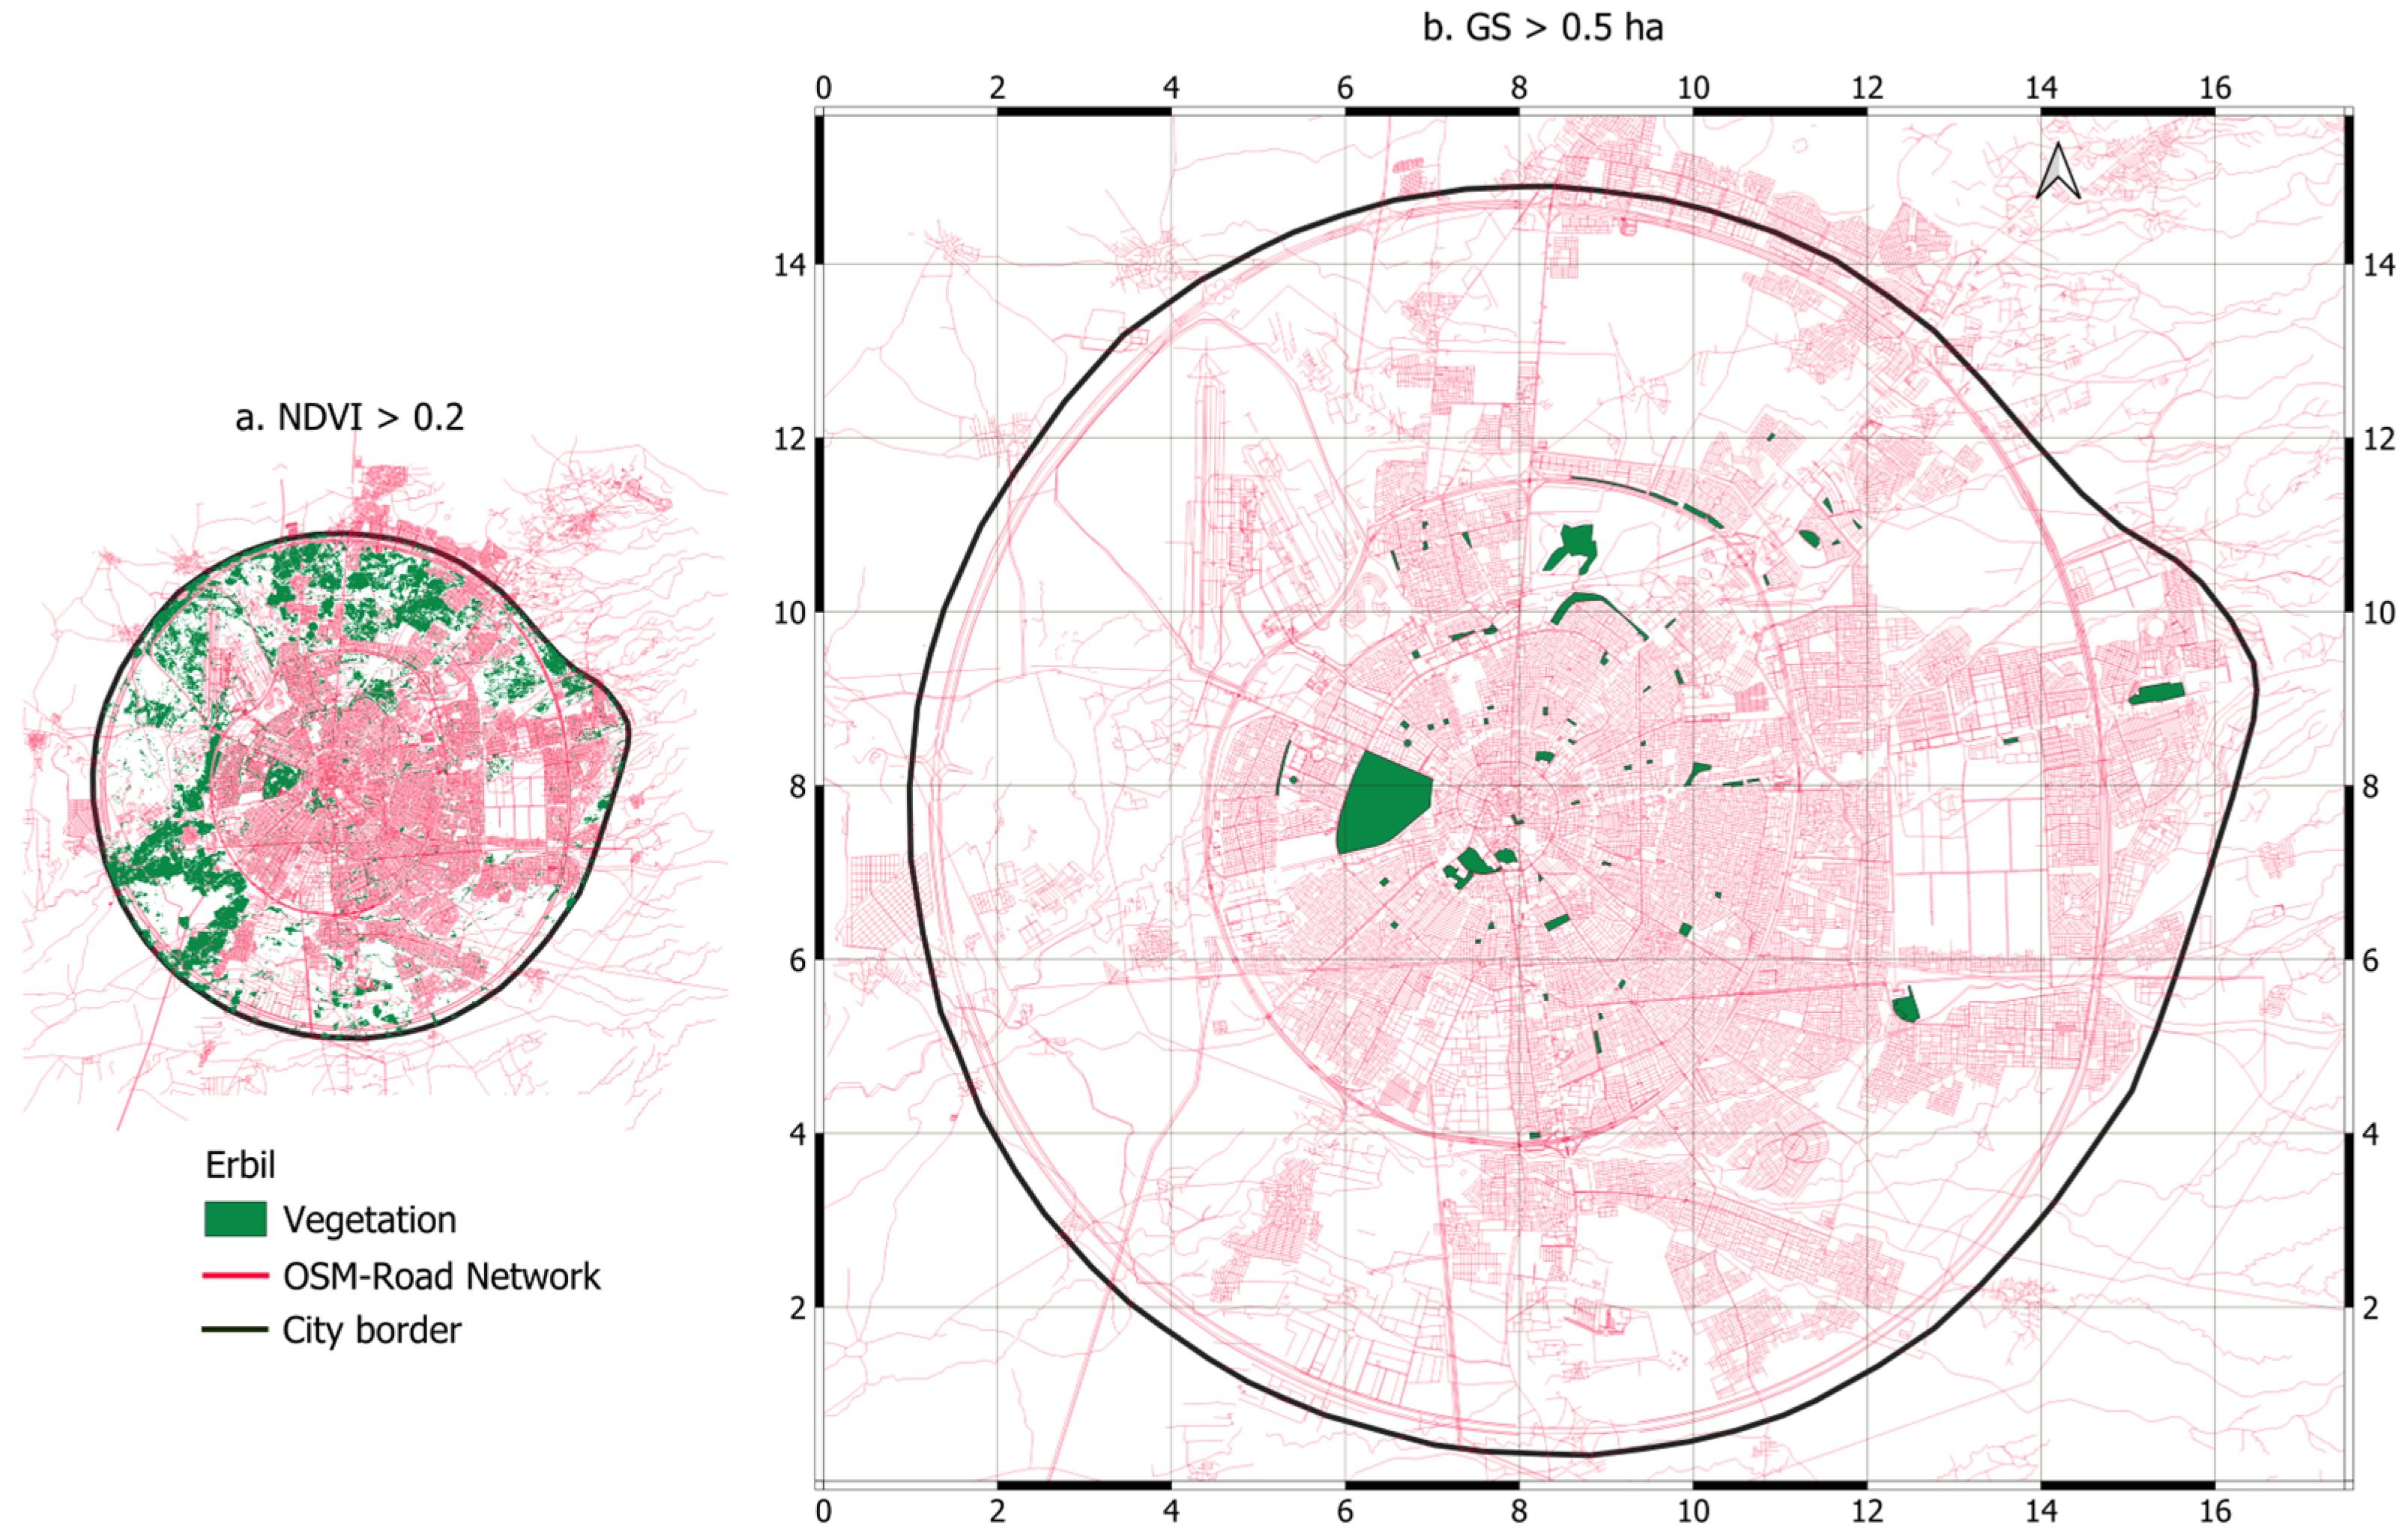
The spatial analysis of Sulaimaniyah’s vegetation and green spaces is illustrated in Figure 6. Using the Normalized Difference Vegetation Index (NDVI) with a threshold greater than 0.2 indicates healthy vegetation. The result shows that approximately 48% of the city’s area is vegetated. This vegetation ranges from small gardens larger than 100 m2, to extensive agricultural land, and temporary seasonal plants, to evergreen species. Meanwhile, municipal data indicate that 634 green spaces are available in the city, including forests, parks, cemeteries, street trees, community gardens, and pocket parks. However, only 61 of these spaces are larger than 0.5 hectares. Erbil’s vegetation and green spaces are illustrated in Figure 7. The result shows that approximately 17% of the city’s area is vegetated. The municipal data indicate that 496 green spaces are available in the city; however, only 75 are larger than 0.5 hectares.
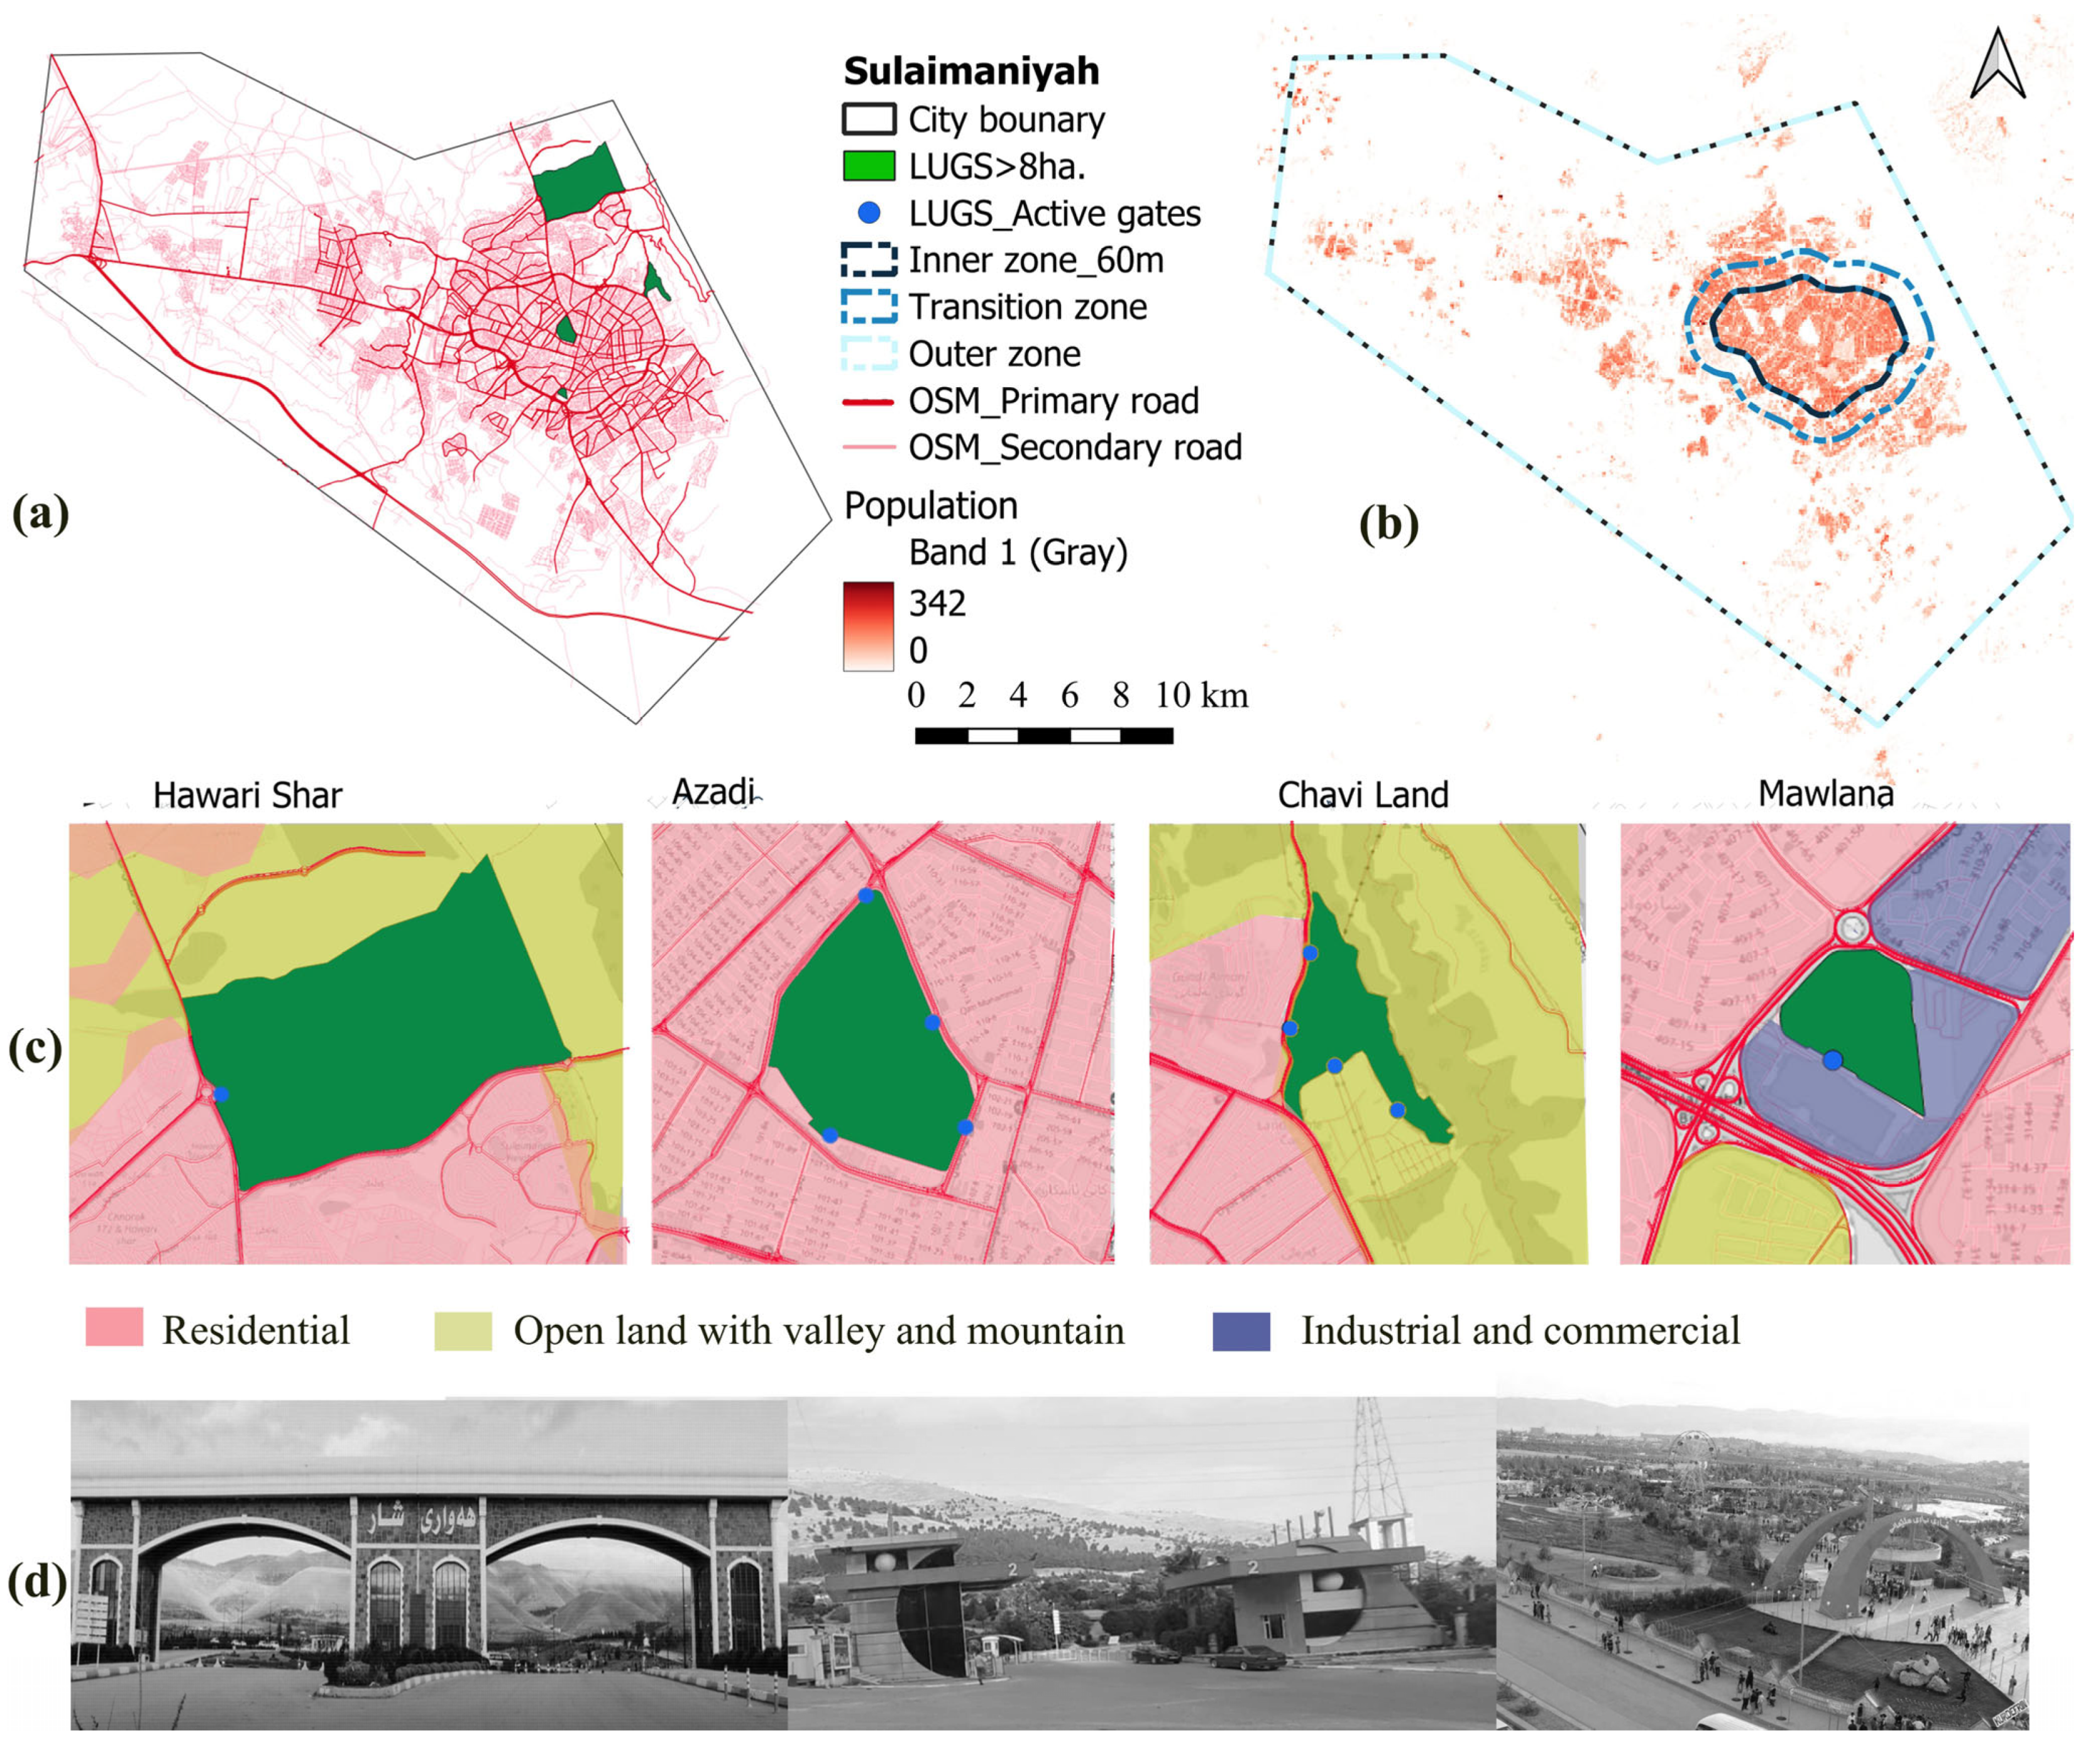
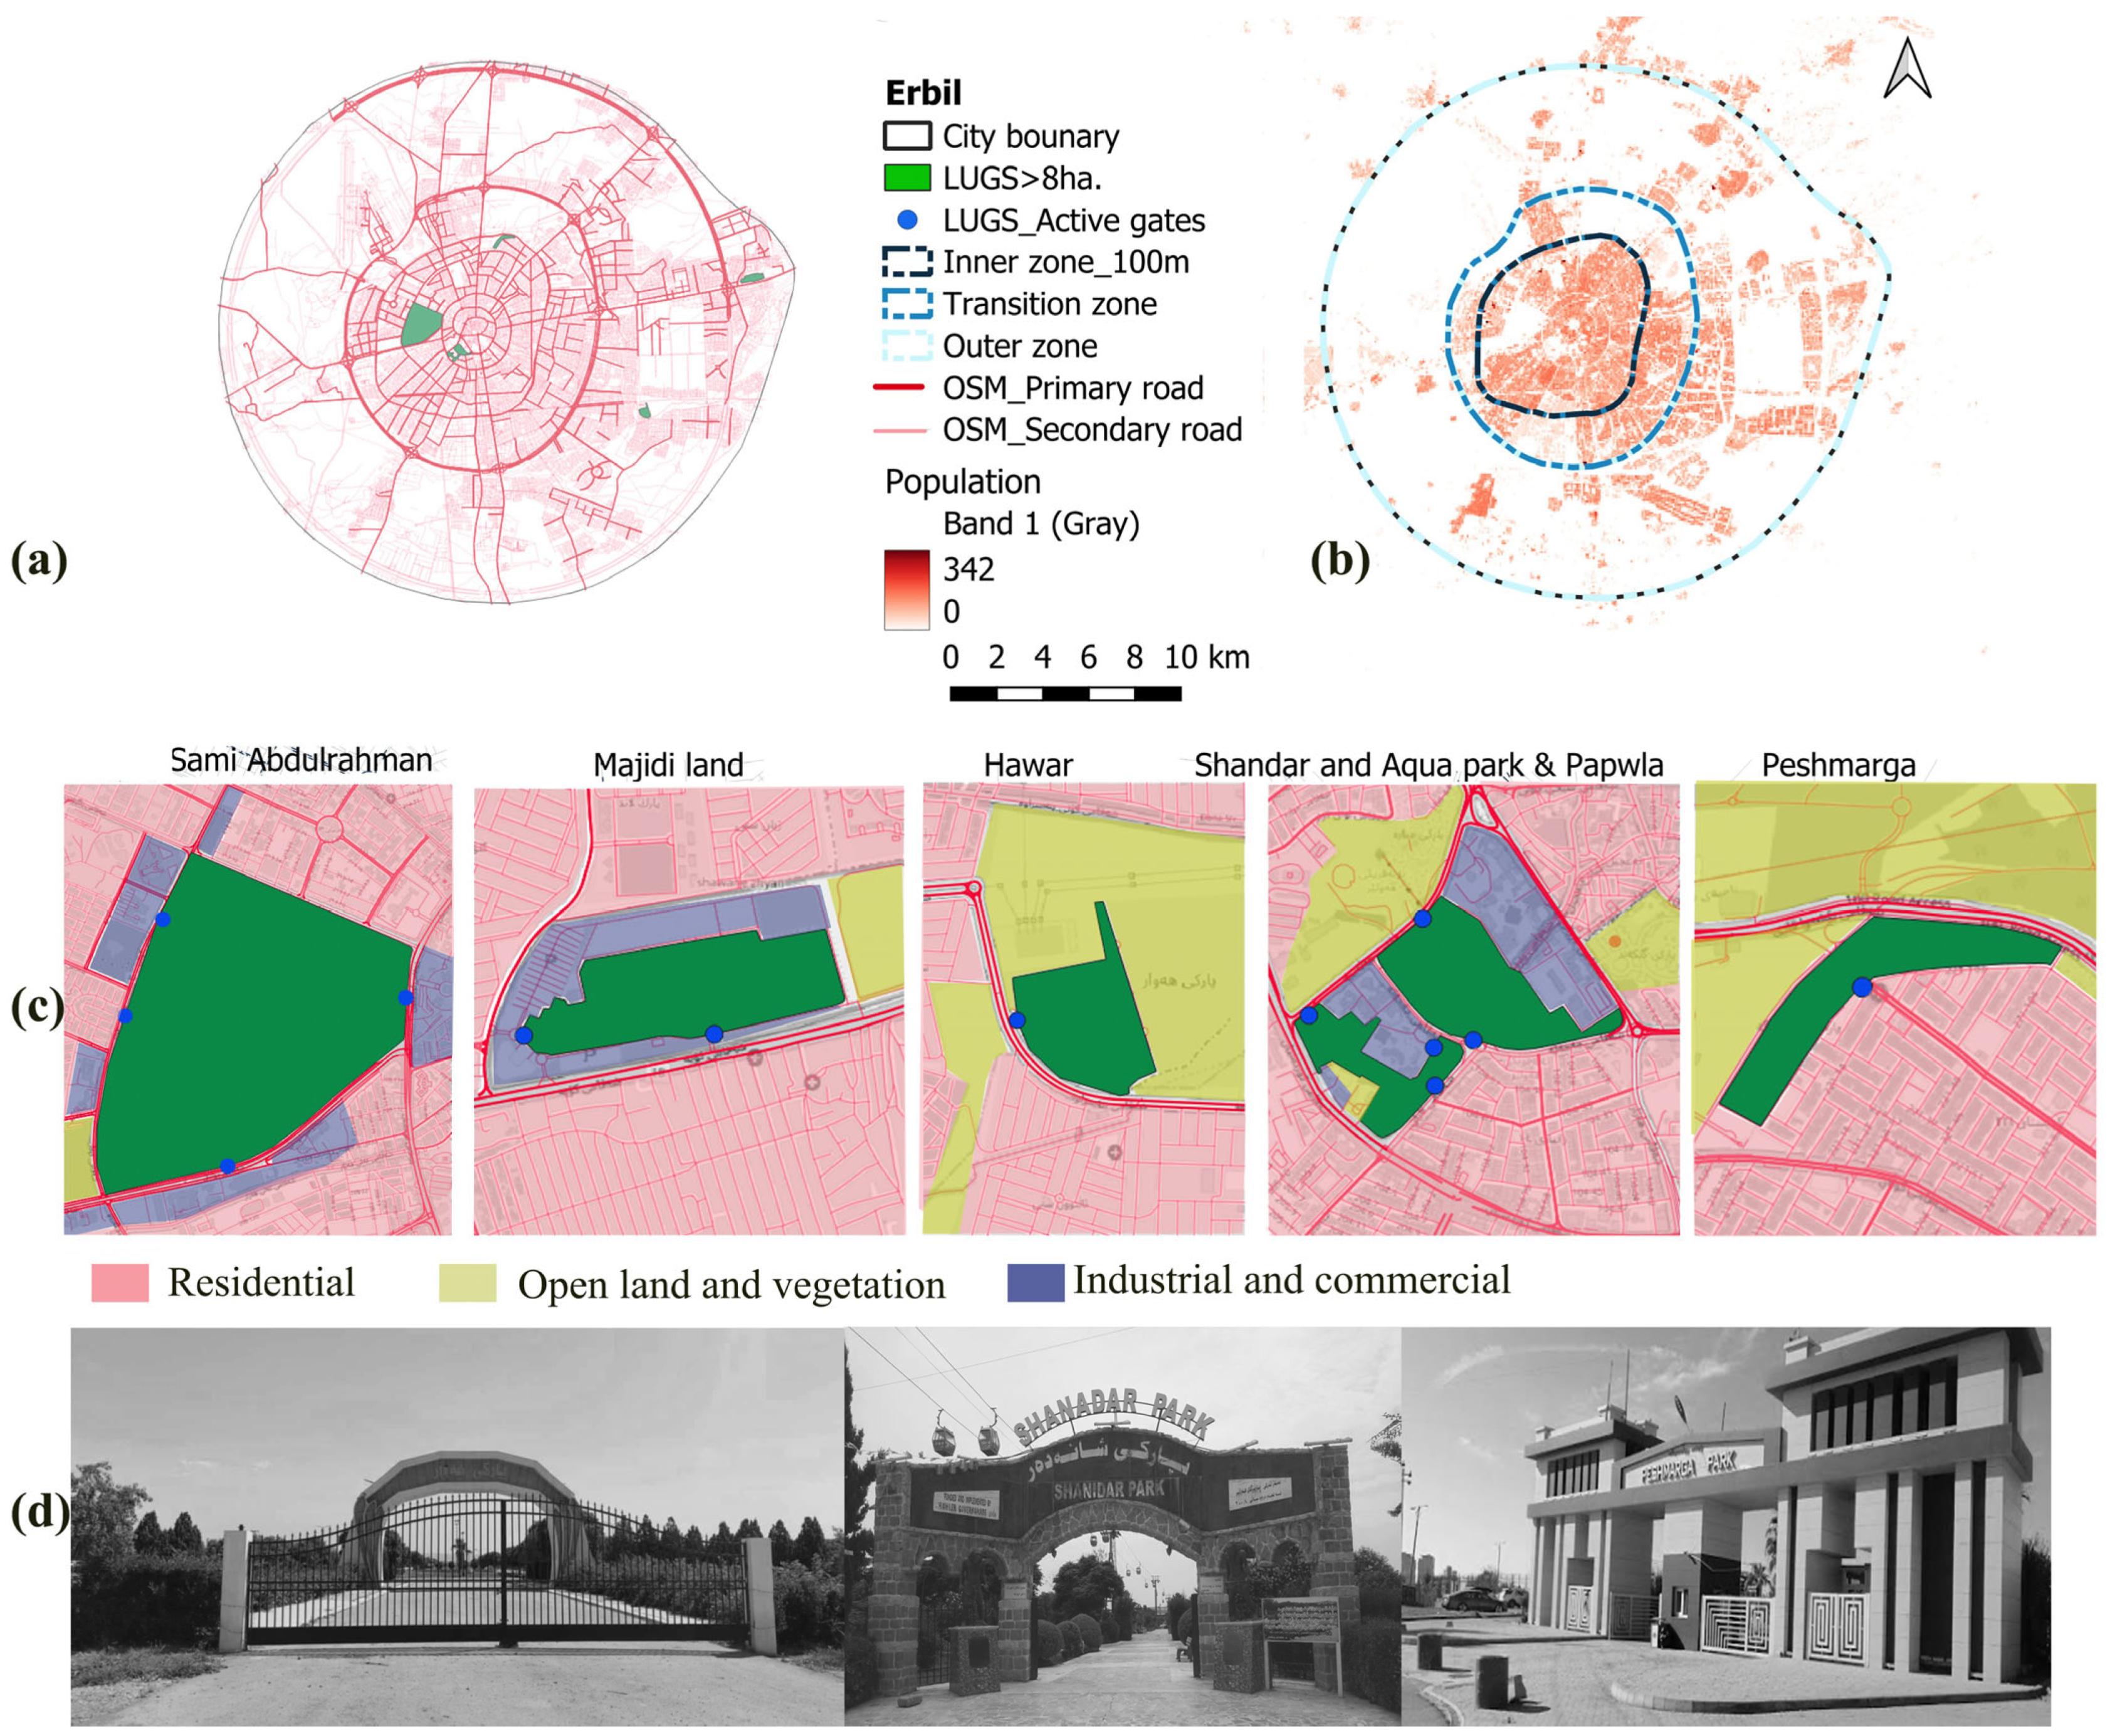
The spatial distribution of LUGS and their entrances is illustrated in Figure 8, and the names, the sizes, and the number of the LUGS gates are shown in Table 1. From all green spaces, only four are classified as LUGS > 8 ha, collectively featuring ten active gates or entrances (Figure 8c,d). These LUGS are primarily located near the urban core and extend toward the northern part of the city. Erbil, with only six LUGS, which are distributed from the city center toward the eastern areas and collectively have thirteen active gates or entrances (Figure 9c,d).
The demographic and spatial characteristics of three urban zones in both Sulaimaniyah and Erbil (inner, transitional, and outer) reveal a transparent urban gradient from a dense core to a sprawling periphery. In Sulaimaniyah (Figure 8), the inner zone, comprising just 6% (27 km2) of the total area, accommodates 33% of the population and has a high density of 13,856 persons per km2, reflecting intense urban development and compact land use. The transitional zone covers 5% (23 km2) of the city, with a moderate density of 7192 persons per km2, and is home to 15% of the population. In contrast, the outer zone comprises 89% (401.2 km2) of the total city area but has the lowest density of 1476 persons per km2, accommodating 52% of the population in more dispersed, suburban settings. This pattern reflects a typical urban structure, with density decreasing progressively outward from the city center.
Similarly, in Erbil (Figure 9), the inner zone covers about 11% (47 km2) of the city area, is home to 32% of the population, and has a high density of 10,901 people per km2, indicating compact, intensive development. The transitional zone accounts for 13% (55 km2) of the area, has a moderate density of 6166 people per km2, and accommodates 21% of residents, likely comprising a mix of older neighborhoods and new urban growth. The large outer zone, covering 73% (330 km2) of the land, is less dense by 2343 people per km2 and houses nearly half the population. This pattern again highlights how population density steadily declines as one moves away from the city center.

3.2. Vegetation Covers of LUGS

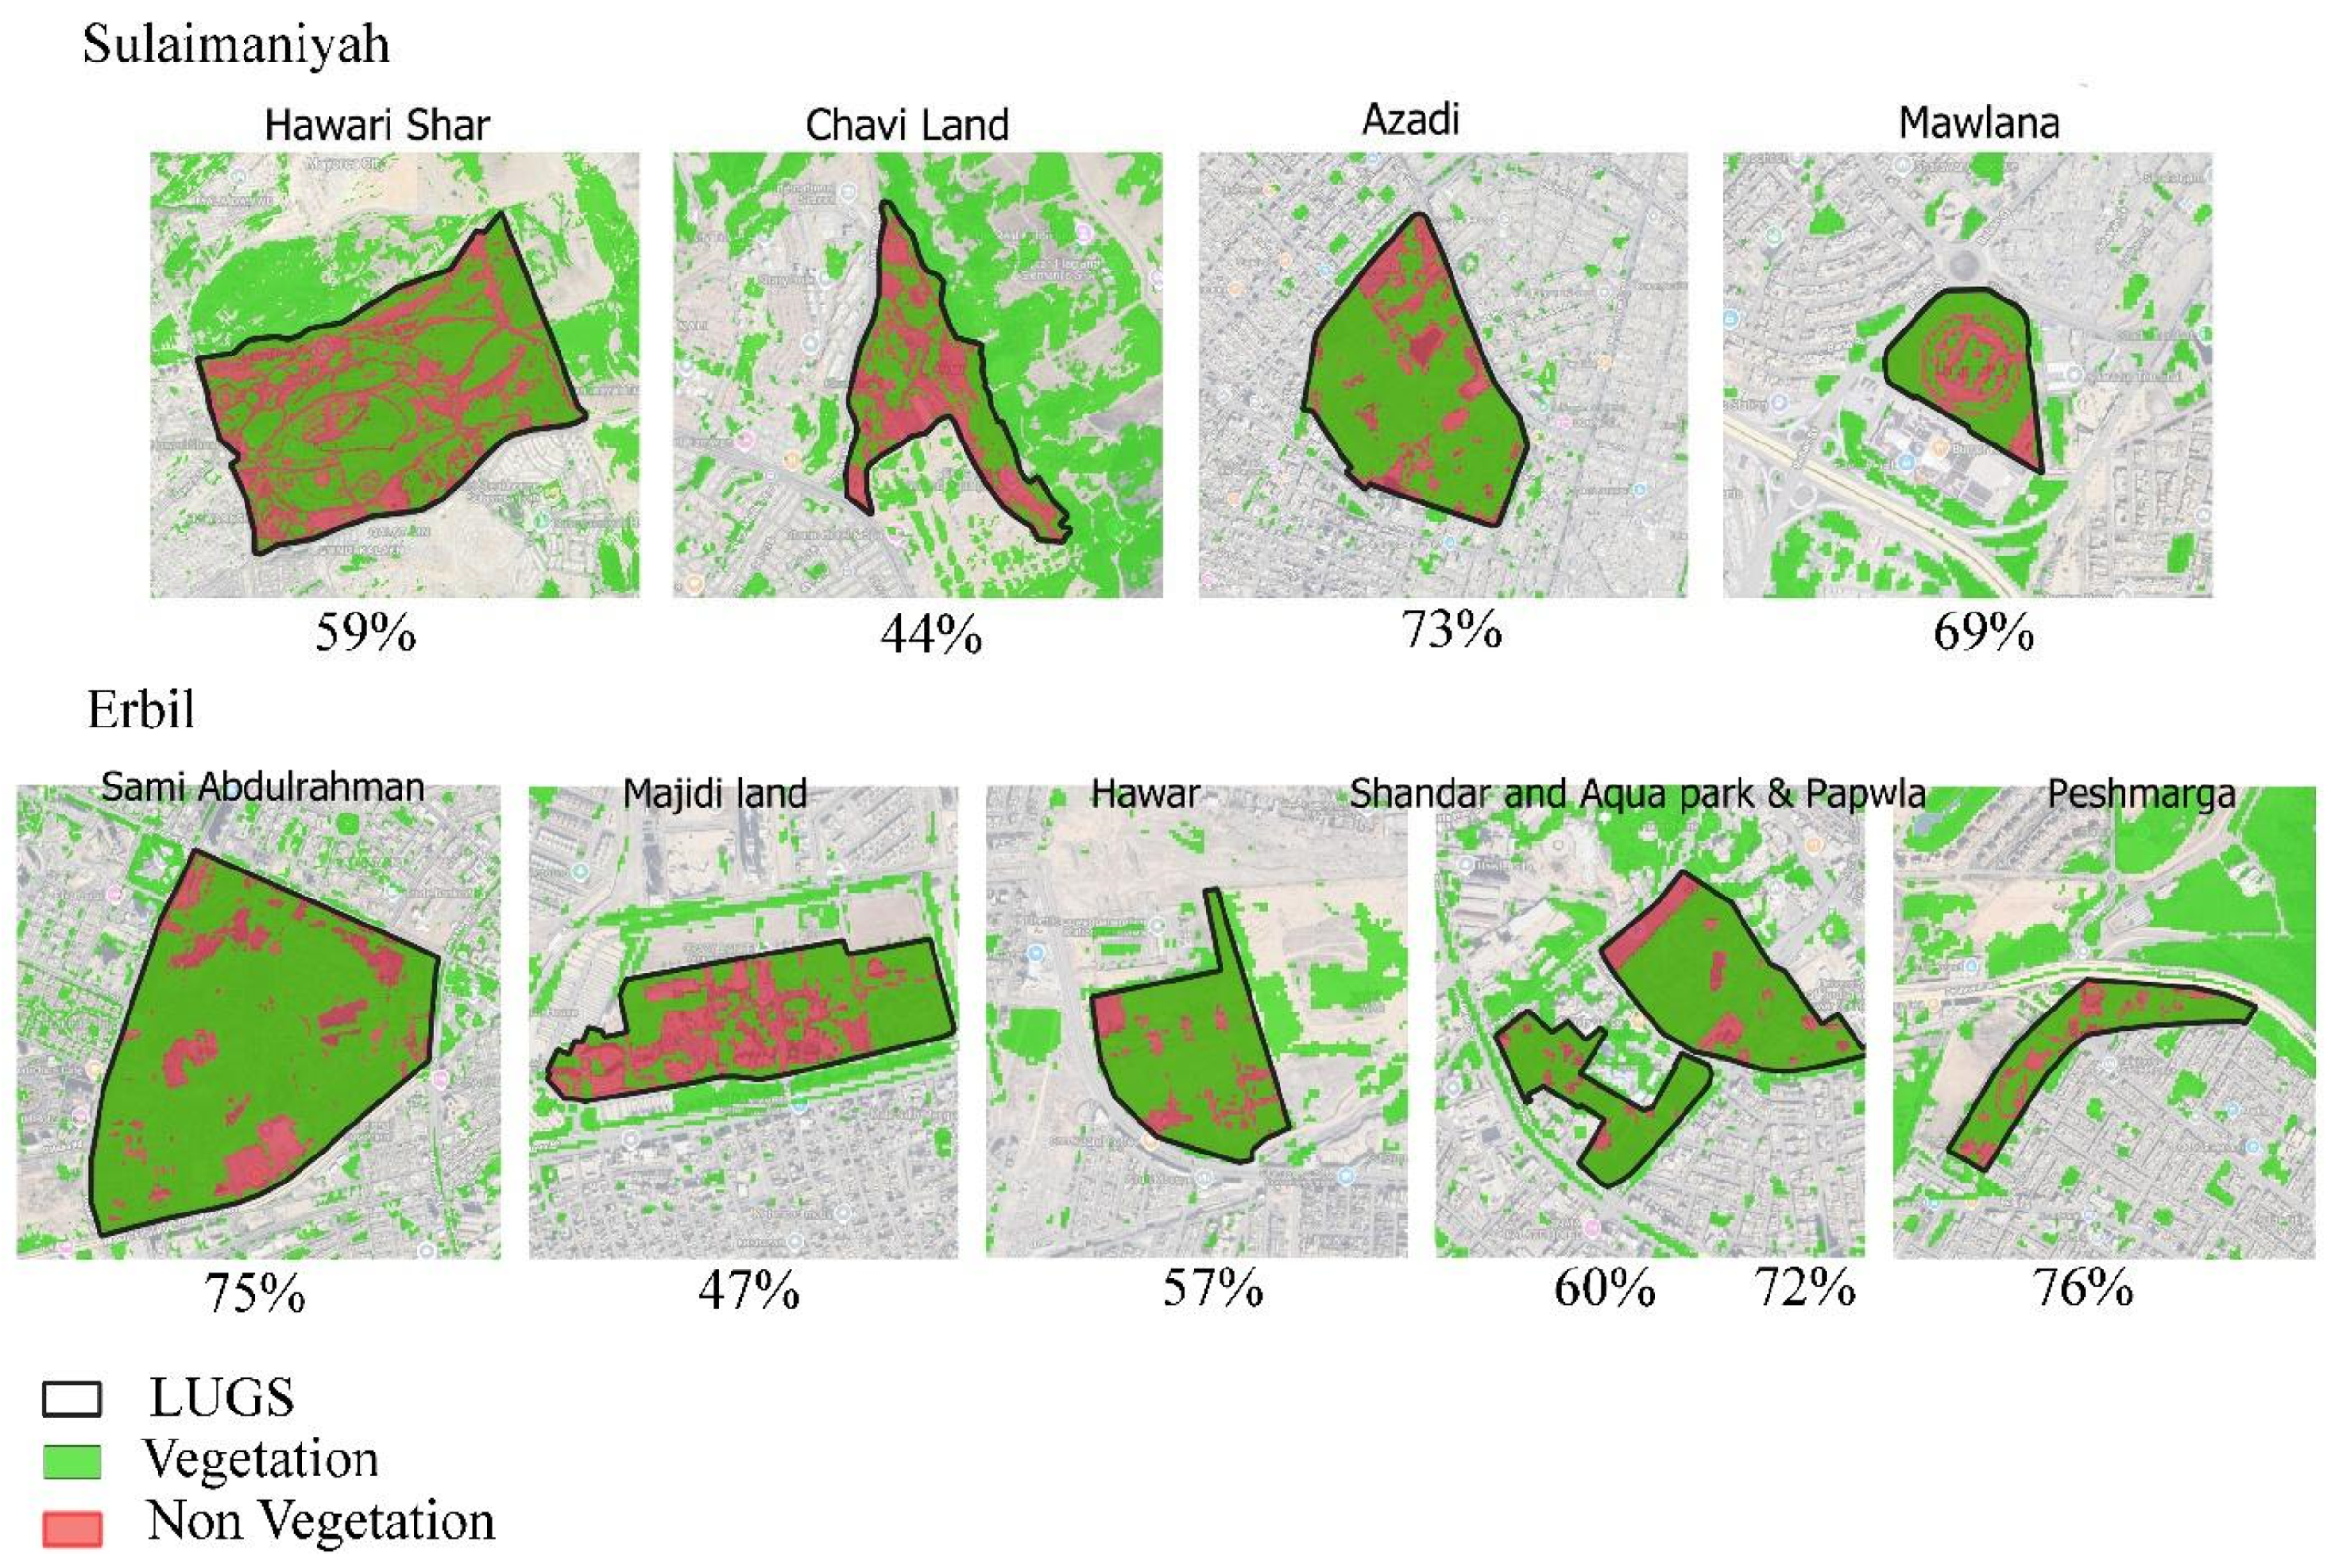
To indicate the quality of LUGS based on vegetation coverage in Sulaymaniyah and Erbil, an NDVI value greater than 0.2 was used (Figure 10). In Sulaymaniyah, Azadi Park (73%) and Mawlana Park (69%) demonstrate high vegetation coverage. At the same time, Hawari Shar Park, despite being the largest area, has a moderate 59%, and Chavi Land shows the lowest at 44%, indicating sparse greenery. In contrast, Erbil shows generally stronger performance, with Peshmarga Park achieving the highest vegetation coverage at 76%, followed closely by Sami Abdulrahman Park with 75% and Shandar Park with 72%, reflecting well-maintained green space. Aqua & Papwla Park and Hawar Park have moderate vegetation levels at 60% and 57%, respectively, whereas Majidi Land trails at 47%. Overall, Erbil’s LUGS display more consistent and higher vegetation coverage than Sulaymaniyah’s.

3.3. Population and Served Area of CA Using ORS

For Sulaimaniyah at the city scale, results based on ORS using OSM road network, indicate that only 14% (62 km2), 31% (139 km2), and 46% (205 km2) of the city land are within the served area corresponding to 5, 10, and 15 min thresholds, respectively. However, the percentage of the population with access to LUGS is higher than the corresponding served area. The results show that 47%, 76%, and 90% of the population live within the 5, 10, and 15 min served areas, respectively.
The served area of CA in Erbil is 21% (92 km2), 61% (265 km2), and 84% (361 km2) for the 5, 10, and 15 min thresholds, respectively. These served areas also correspond to 44%, 87%, and 99% of the population living within the defined travel time thresholds. These results, based on ORS before adjustment, align with a previous study that reported 100% of Erbil’s urban area as being accessible in less than a 15 min car travel time.
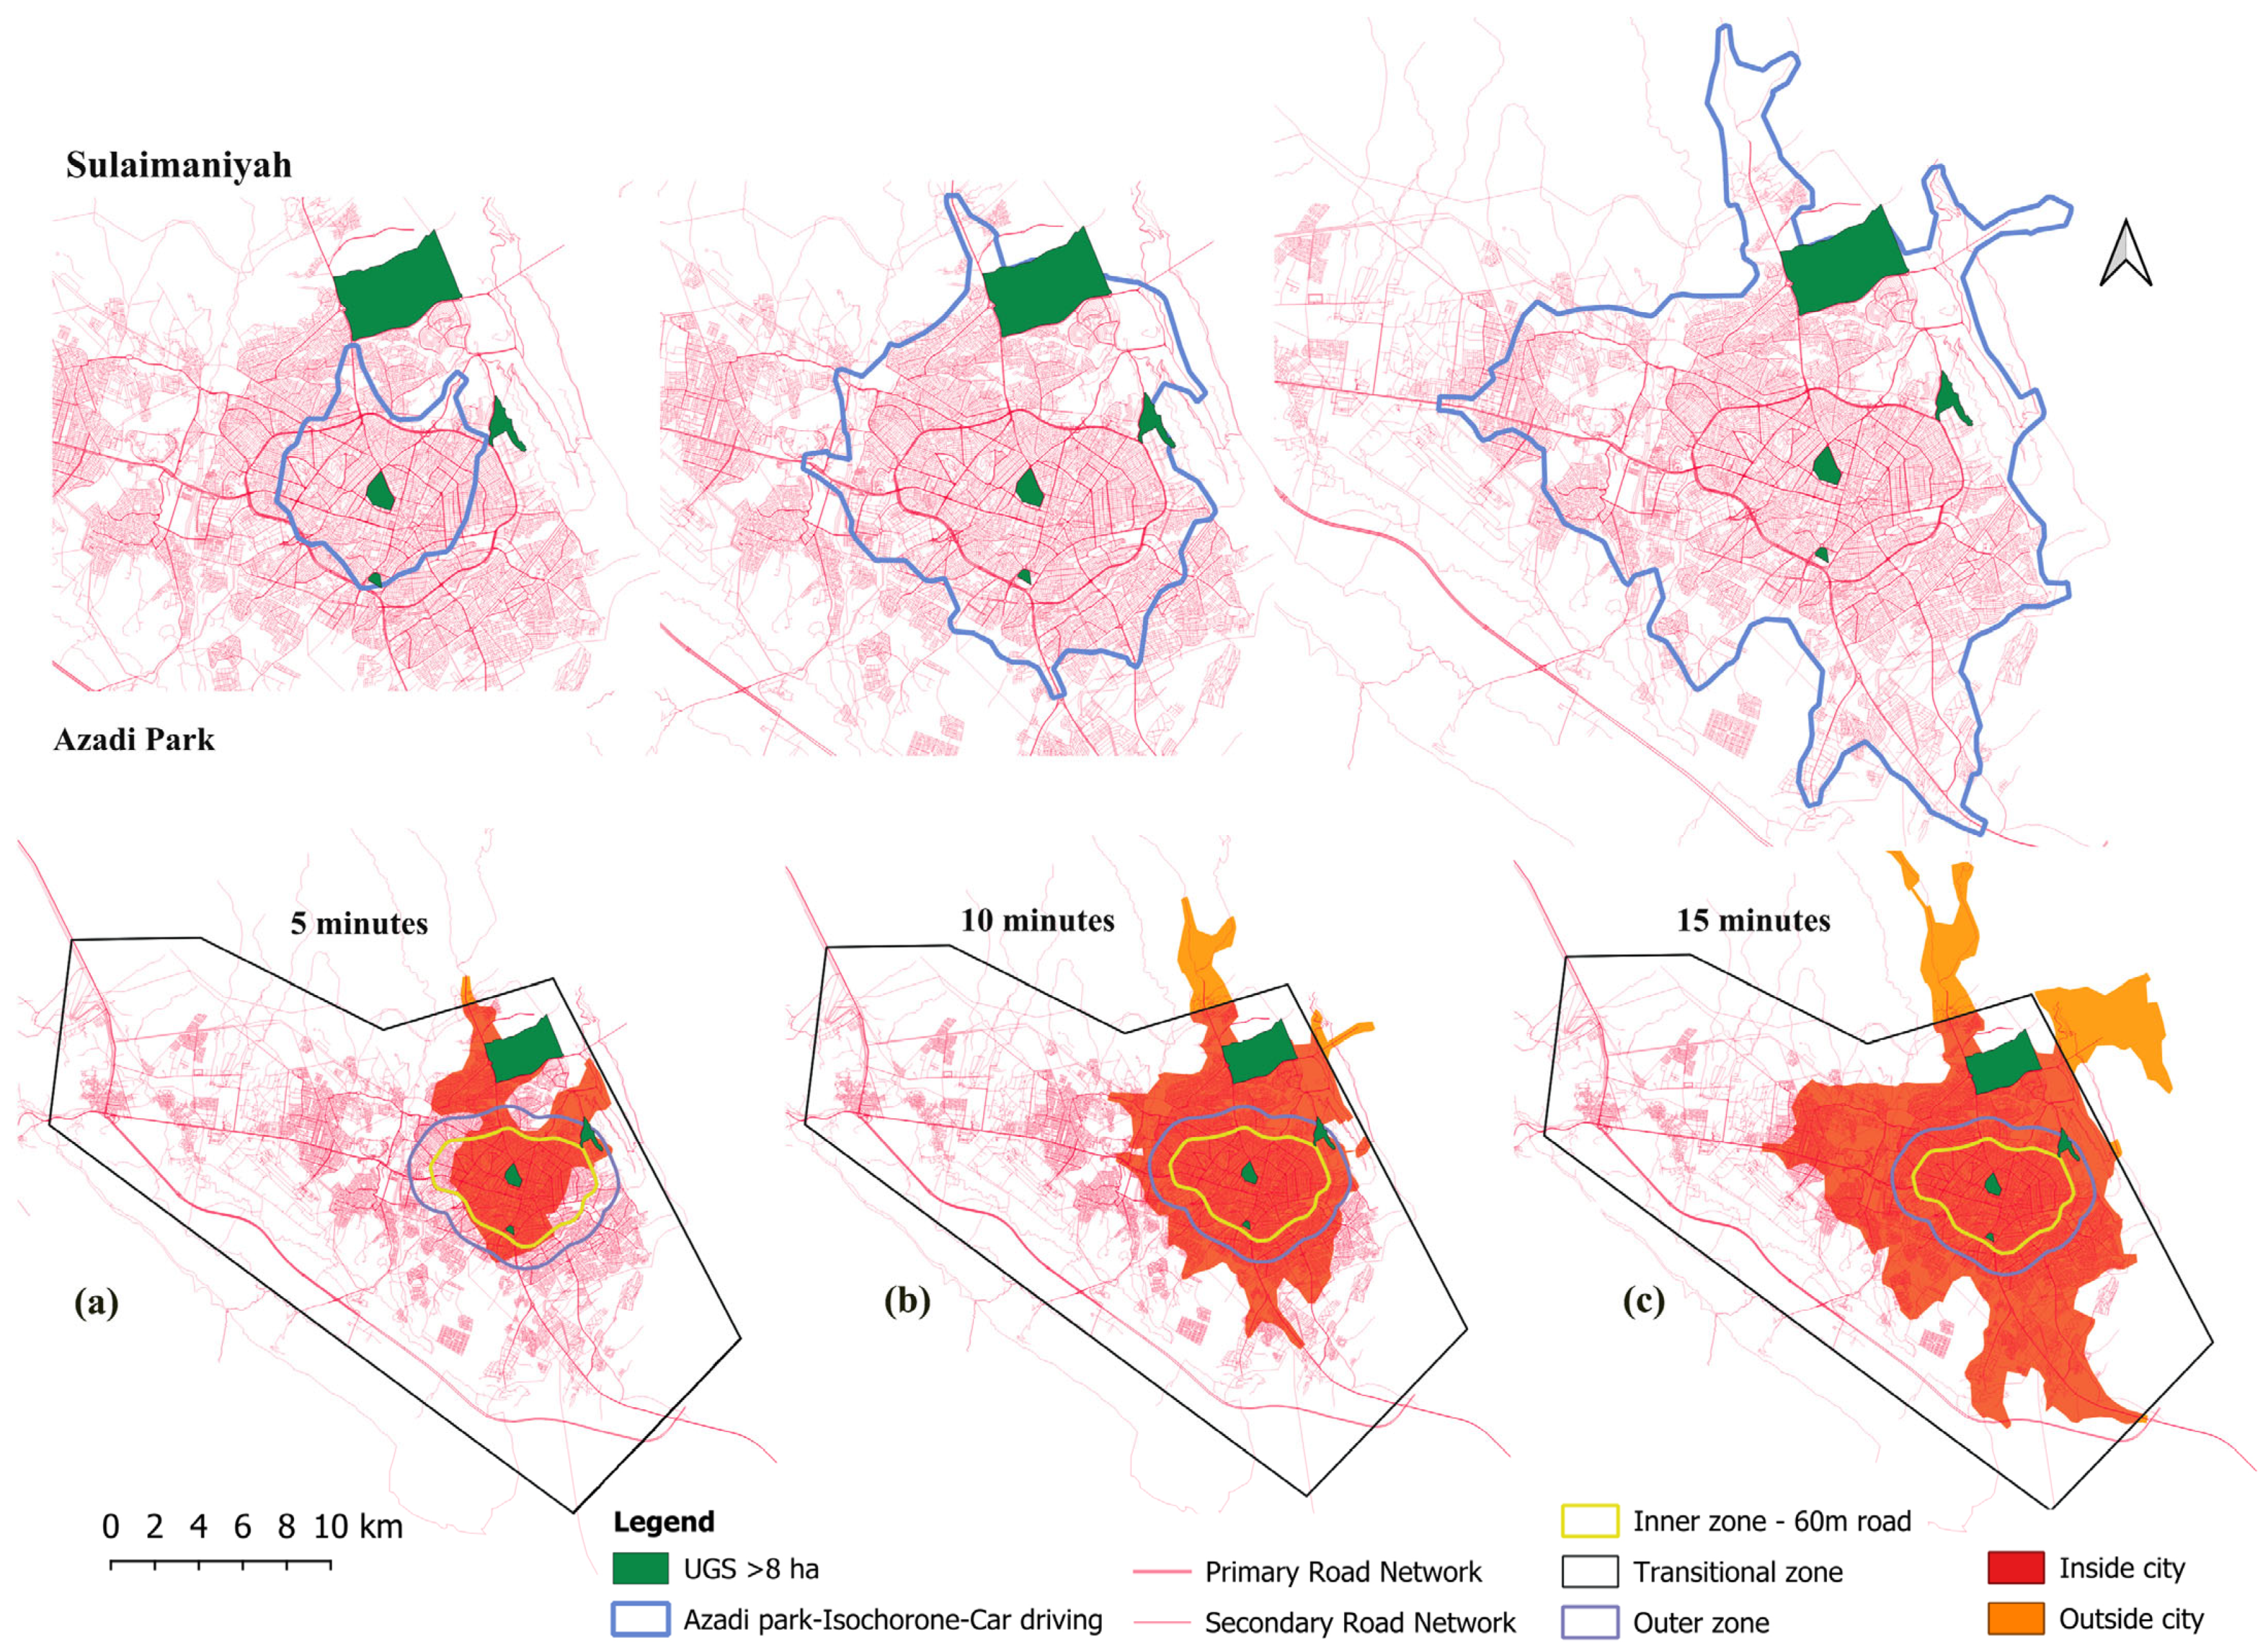
The LUGS served area extended beyond the city boundary. In Sulaimaniyah, the served area within a 5 min driving threshold is minimal but expands significantly to approximately 20 km2 and 50 km2 at the 10 and 15 min thresholds, respectively. This covered the area in the northern part of the city border. In comparison, Erbil shows notably broader coverage; it extends toward the eastern part of the city, with served areas reaching around 35 km2 at 10 min and up to 125 km2 at 15 min.

3.4. Enhanced Car Accessibility

The ORS was adjusted based on Google Maps to give both cities more accurate time-based results. The enhanced isochrones maps were made for both cities using 1.25 as a correction factor based on active gates. The served area and population coverage decreased after the adjustment; however, the rate of decrease varied across the travel time thresholds, with similar patterns in both cities. In Sulaimaniyah, the reduction in served area was approximately 21%, 12%, and 6% for the 5, 10, and 15 min thresholds, respectively. Erbil’s corresponding decreases were around 30%, 15%, and 4%. The results indicate that the previous results, which were based on ORS using OSM, appear easier and faster to reach LUGS, especially for those living closer to the LUGS active gates.
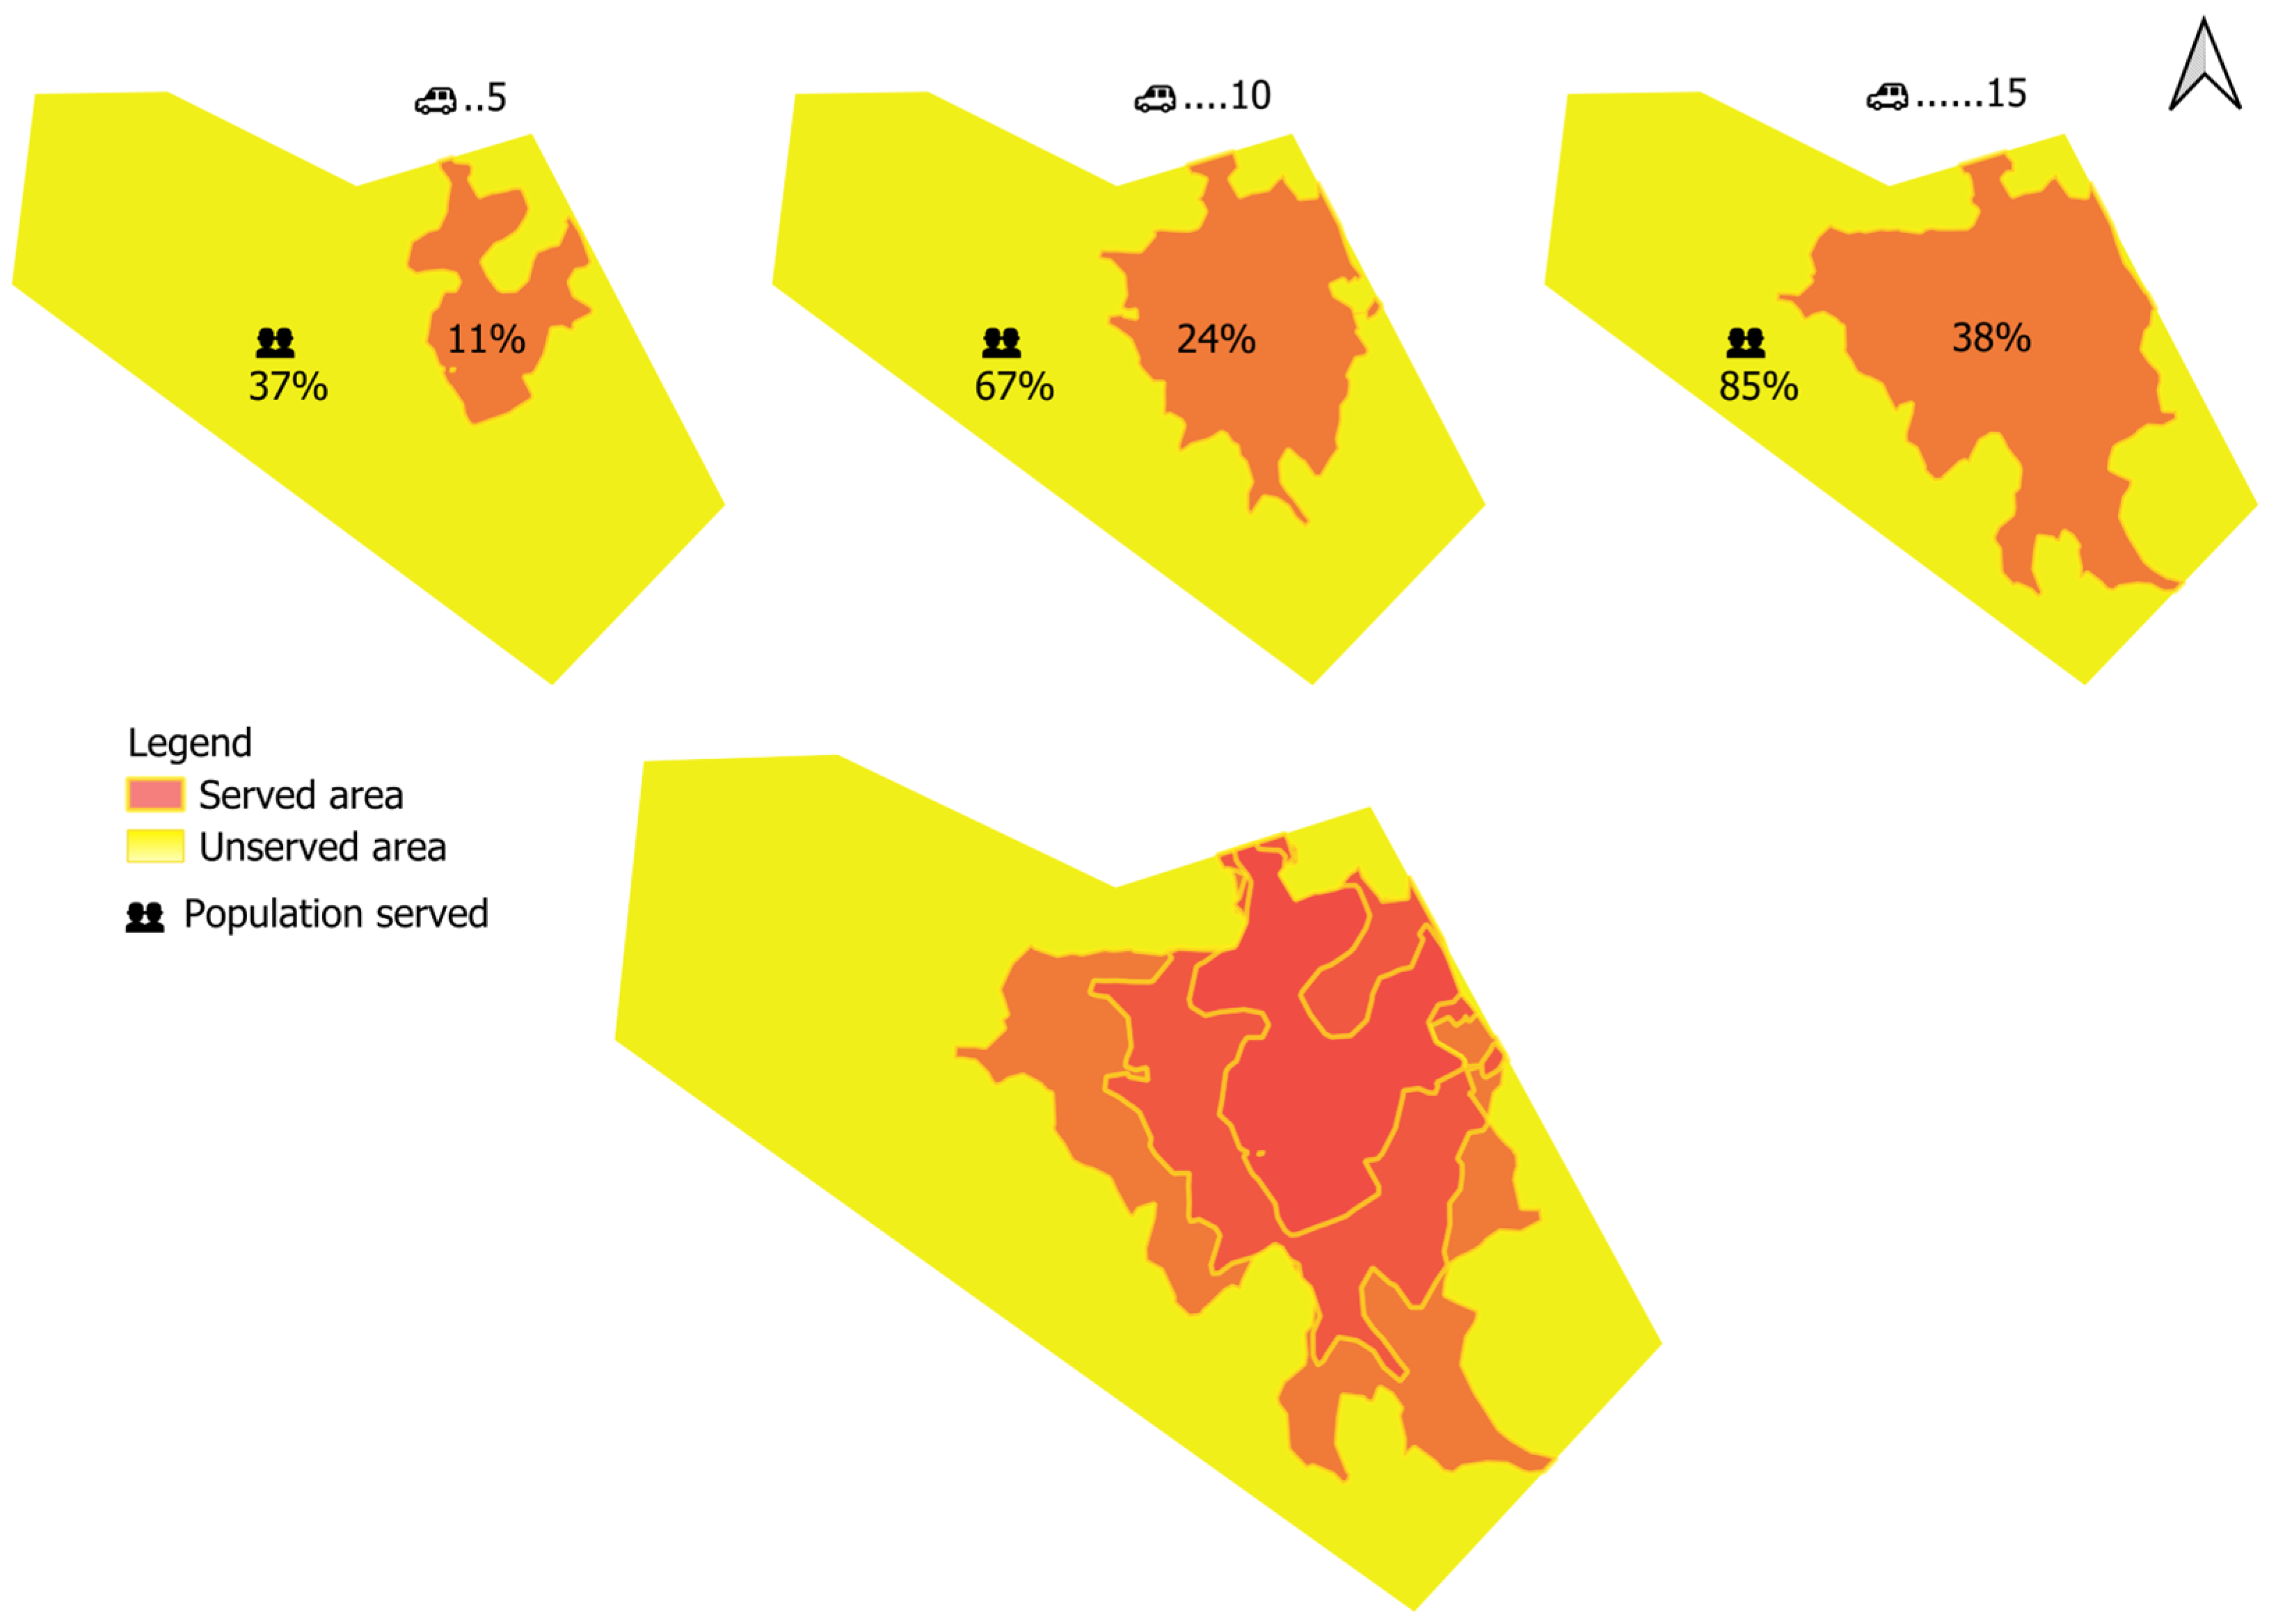
The results of the adjusted ORS analysis showed that in Sulaimaniyah, only 11% (48 km2), 24% (107 km2), and 38% (171 km2) of the area were classified as served areas for the 5, 10, and 15 min thresholds, respectively. These served areas correspond to 37%, 67%, and 85% of the population living within the defined travel time thresholds (Figure 11). The unserved area in Sulaimaniyah is nearly 90% within the 5 min travel threshold; even at the longest travel time, more than 60% remains outside the served area. The population living in unserved areas is not as low as the proportion of served areas might suggest. The unserved population is nearly 60% within the 5 min and decreases to 15% at the 15 min travel time.
In Erbil, the adjusted ORS results were 14% (61 km2), 44% (188 km2), and 71% (305 km2), corresponding to 31%, 74%, and 95% of the population, respectively (Figure 12). Unserved areas are also high by 86%, 56%, and 29% in 5,10, and 15 min thresholds, respectively. The percentage of the unserved population is almost 70% in the 5 min threshold, but decreases to only 5% in the 15 min threshold.

3.5. Zonal Disparities in Car Access to LUGS

In both Sulaimaniyah and Erbil, access to LUGS by car is highest in the inner city, followed by transitional areas, and lowest in outer zones (Figure 13 and Figure 14). In Sulaimaniyah, 82% of the inner core is accessible within 5 min, reaching full coverage in under 10 min, while transitional areas start at 33% and reach nearly 100% by 10 min. Outer zones have a significant shortage, with only 5% coverage after 5 min and 30% after 15 min. Similarly, in Erbil, 71% of the inner zone is reachable within 5 min, achieving full access in less than 10 min, whereas the transitional accessed area is only 9% in 5 min, and 84% in 10 min. The outer zones covered area is 7% in 5 min, 29% in 10 min, and 62% in 15 min of car driving, mirroring the Sulaimaniyah spatial pattern. The comparison reveals that while inner and transitional zones in both cities achieve high accessibility quickly, outer zones struggle regardless of increased travel time.

3.6. Main Determinants and Best Performances in Car Accessibility to LUGS

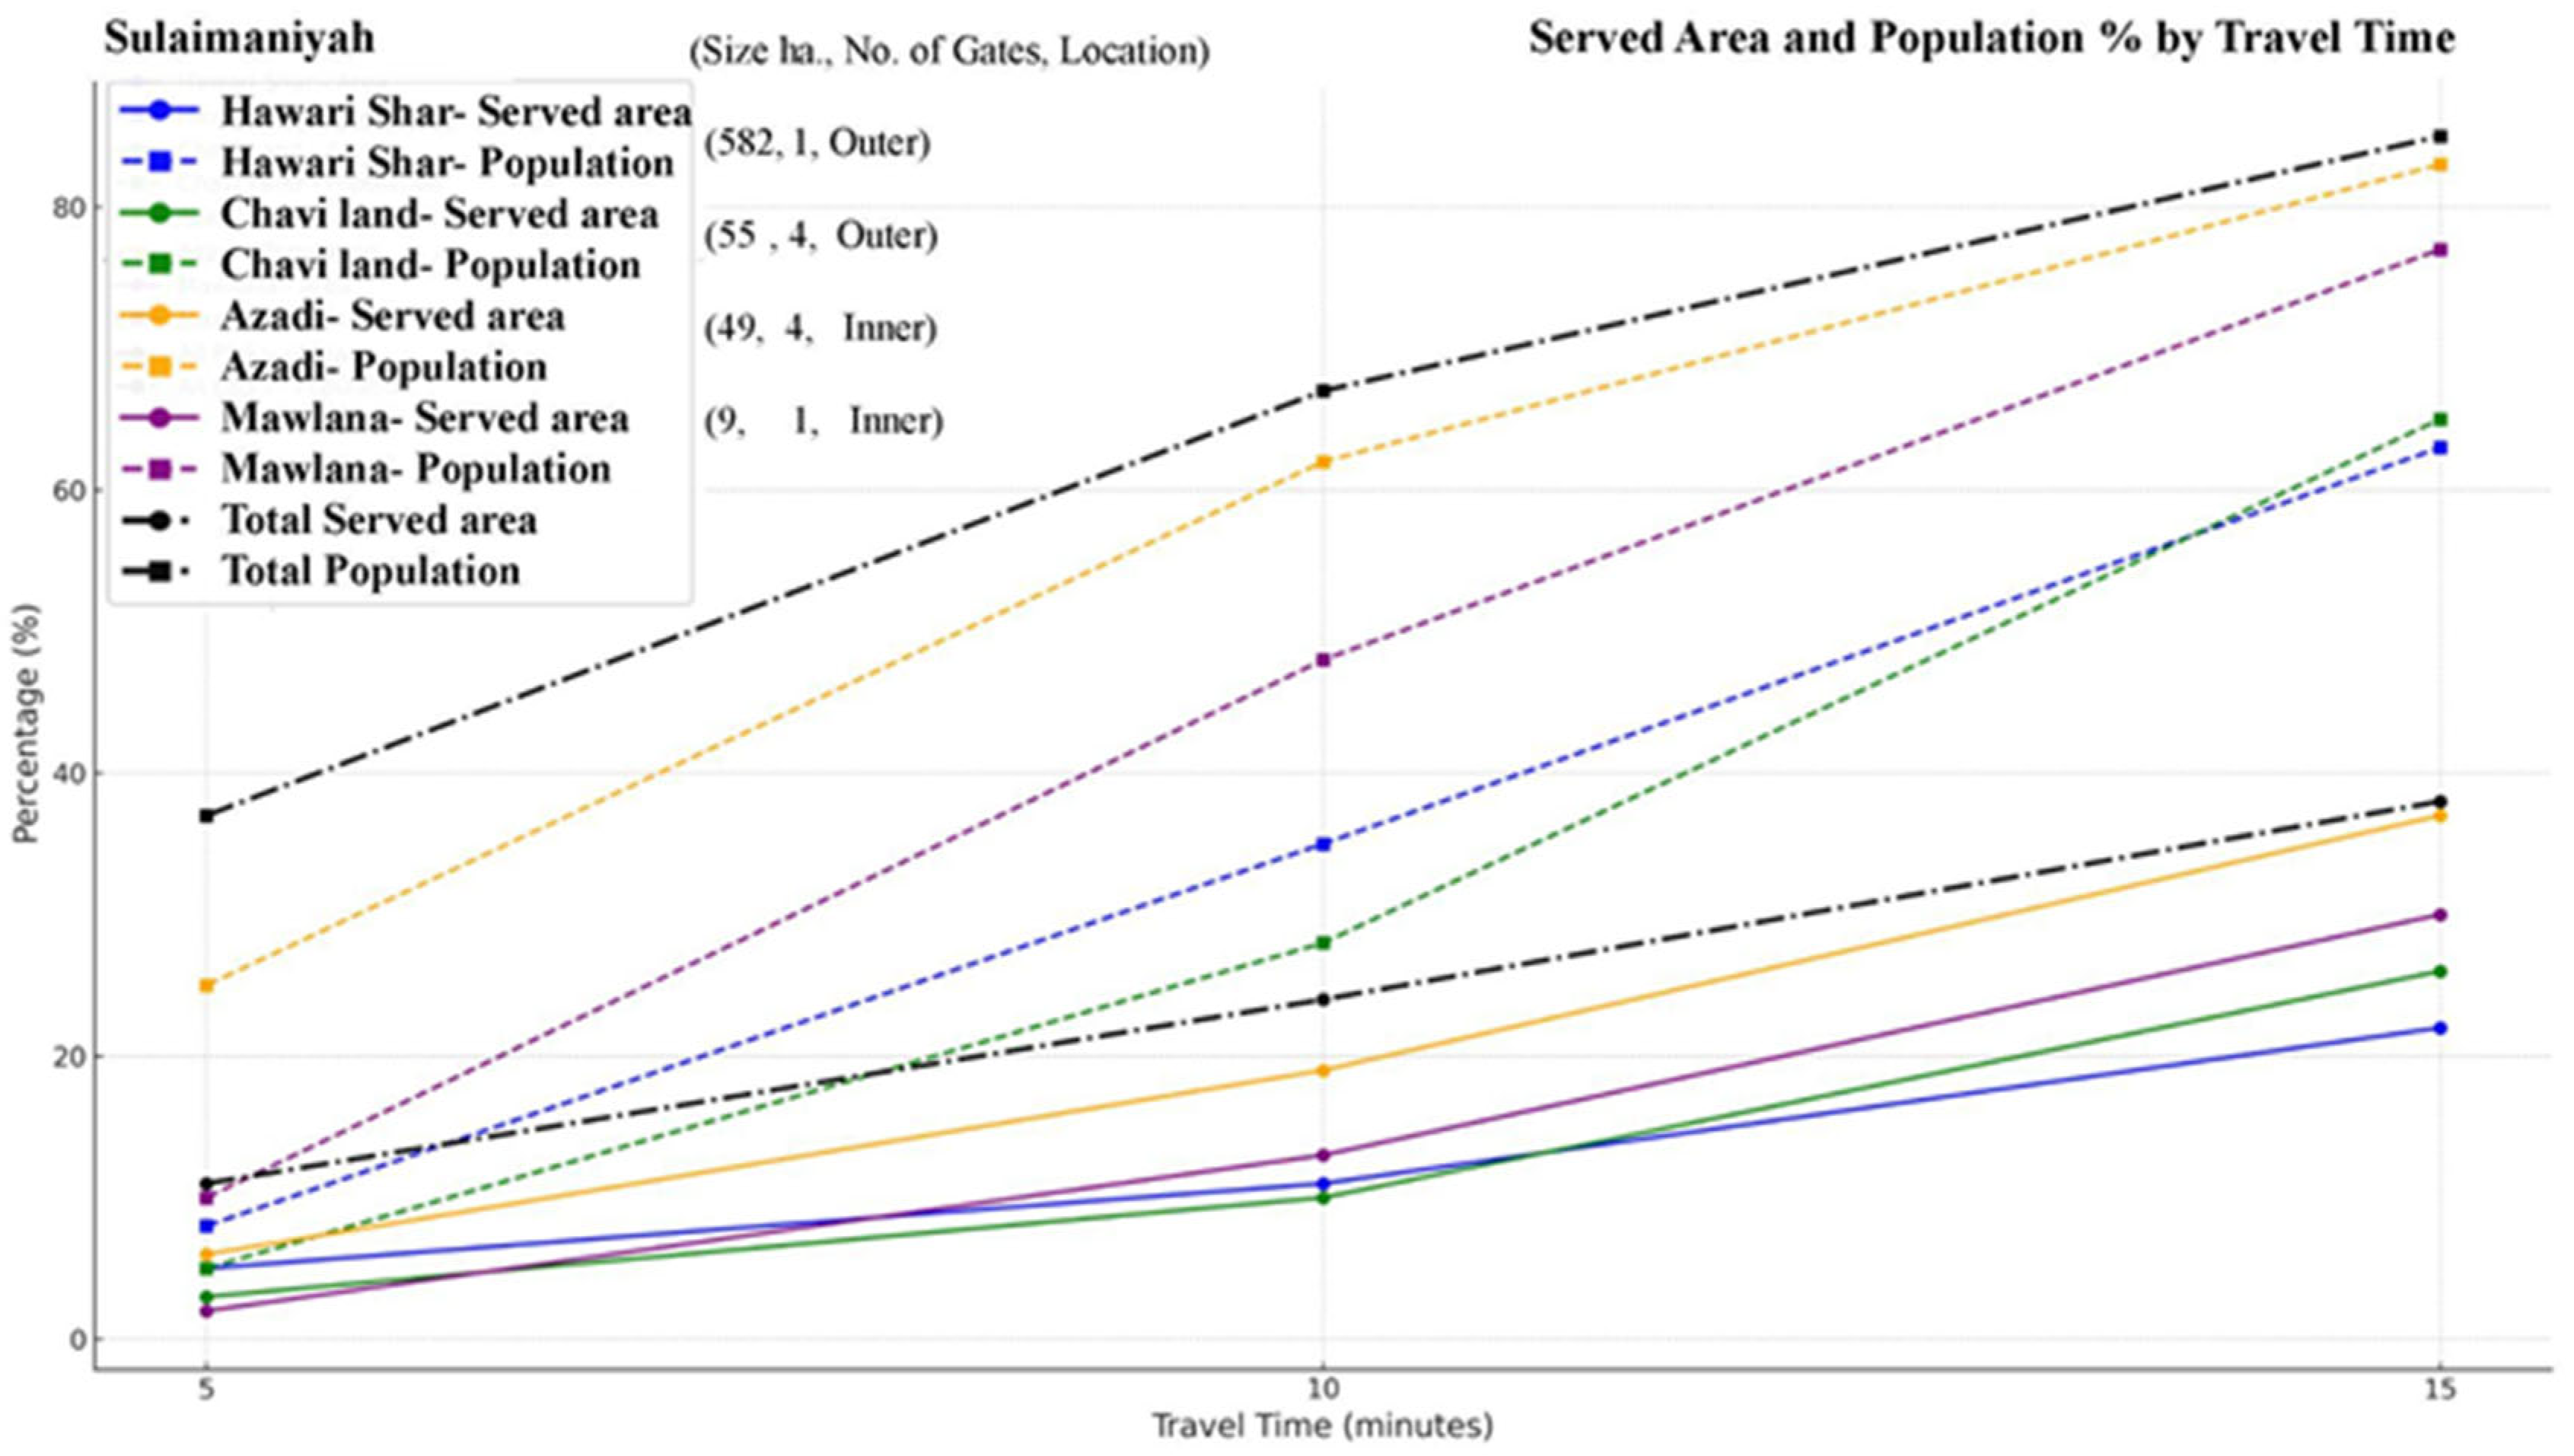
The CA of LUGS is shaped by the combined effects of the number of gates, their spatial distribution, and the surrounding population density. In Sulaimaniyah, First, LUGS equipped with multiple active gates, such as Azadi Park and Chavi Land, each with four entrances, generally demonstrate higher levels of served area and population coverage. The availability of multiple access points improves connectivity from different directions and major roads, as evidenced by Azadi Park, which, due to its four gates, serves up to 84% of the total population within a 15 min drive time. In contrast, LUGS with only a single gate, such as Hawari Shar Park, have a low catchment area despite their considerable size (Figure 15).
Second, population density within the urban fabric further influences accessibility outcomes. Inner zone LUGS, notably Azadi Park and Mawlana Park, benefit from their location within the high-density central area. Azadi Park, with a small size of 49 ha. achieves the highest served area and population coverage, in all time thresholds, due to its location in the city’s densest zone. Transition zone LUGS, such as Chavi Land, perform moderately well due to their proximity to the urban core but remain less effective than LUGS in the inner zone. Outer zone LUGS, such as Hawari Shar Park, are characterized by peripheral locations and have the lowest served population percentages despite their large size (582 ha). Overall, the most effective CA arises where multiple gates, central locations, and high surrounding population density intersect. Among the LUGS analyzed, Azadi Park best exemplifies this combination (Figure 15).
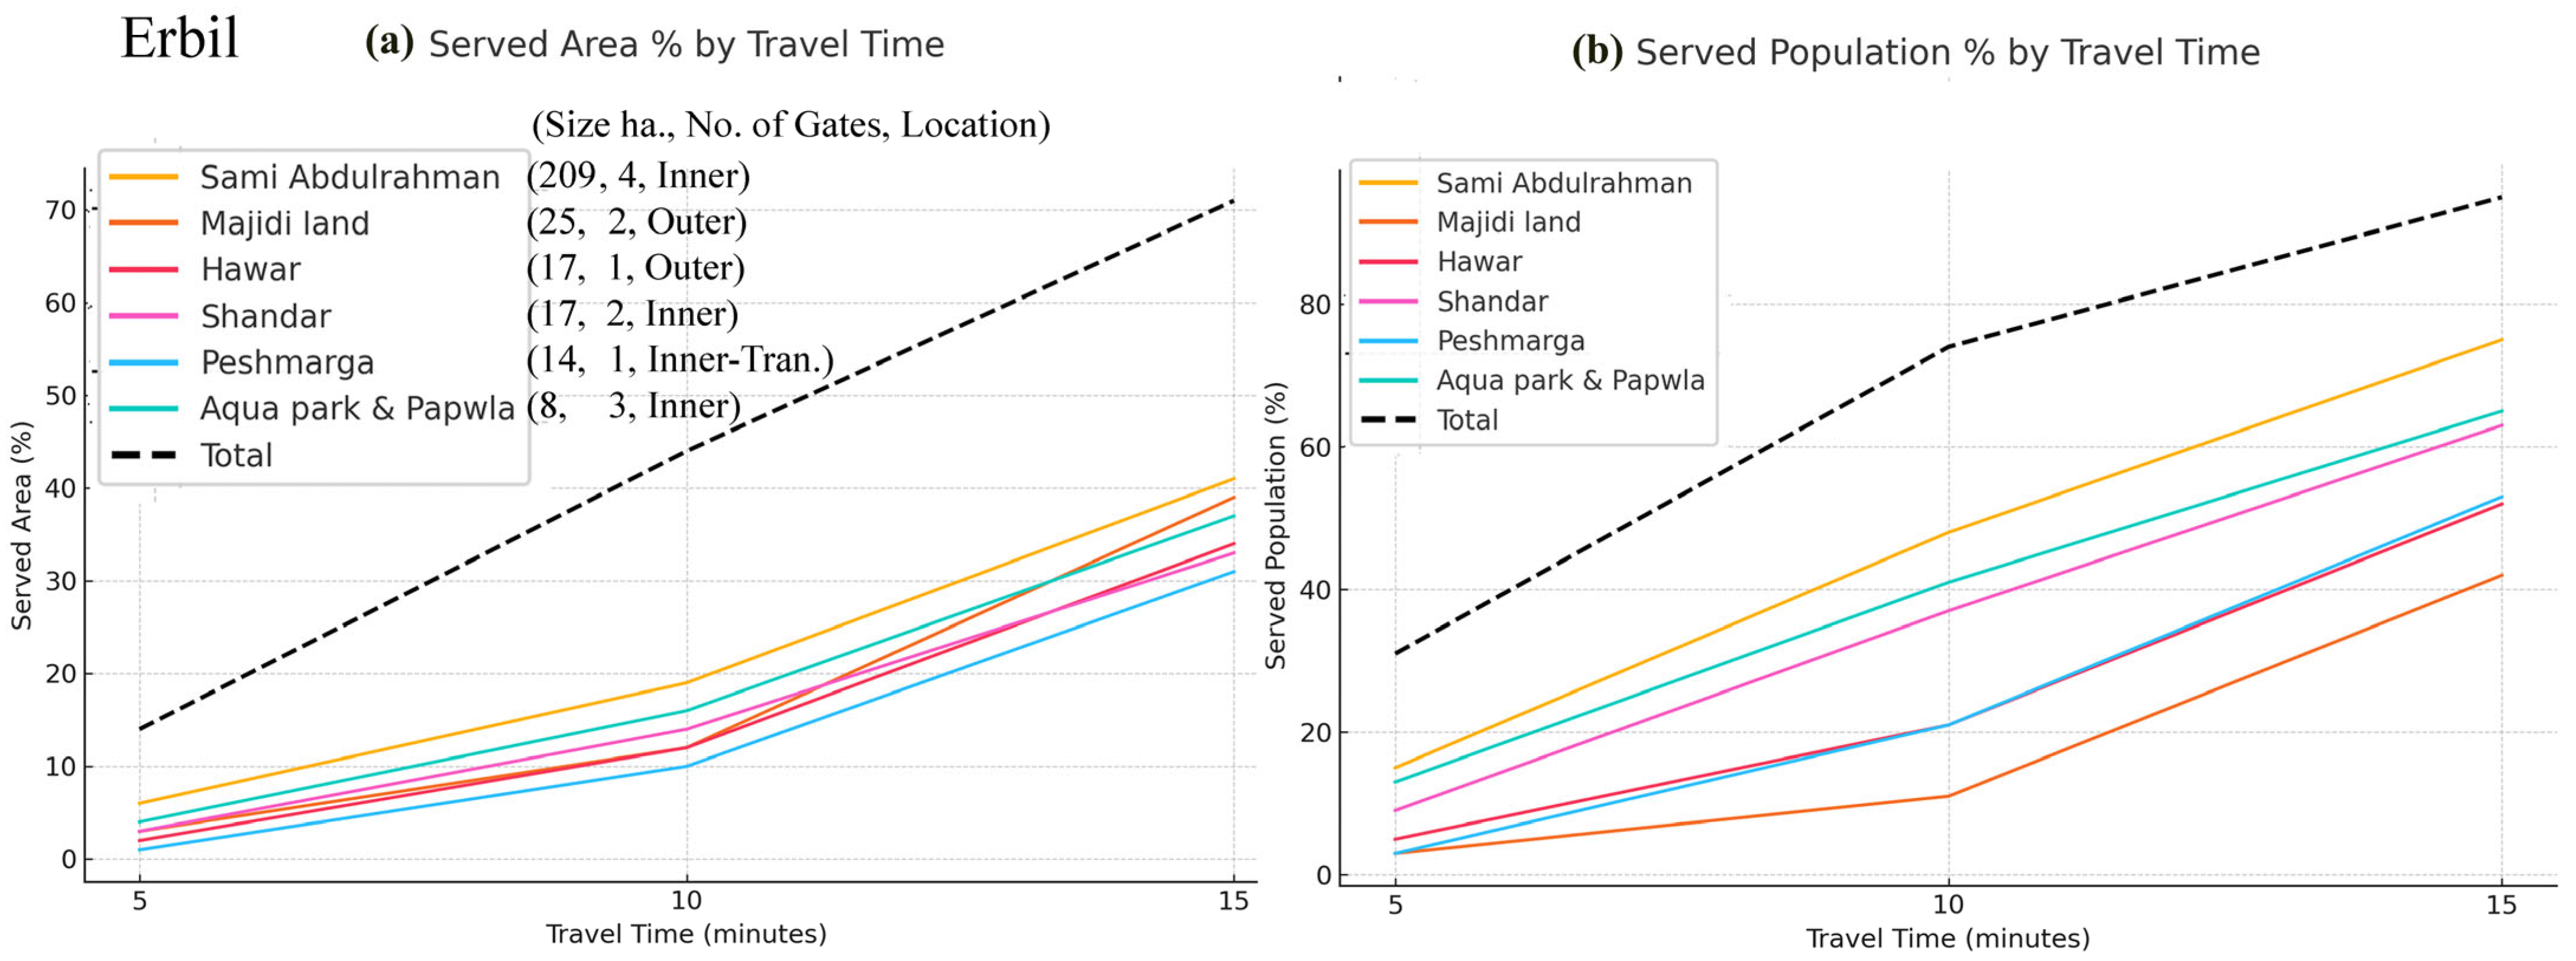
In Erbil, Sami Abdulrahman Park, the largest UGS (209 ha) with four active gates, shows the highest accessibility, serving 41% of the area and 75% of the population within a 15 min drive. Its large size and multiple entry gates influenced accessibility positively. Similarly, Aqua & Papwla Park, though small (8 ha), benefits from three gates and achieves 65% population coverage, illustrating how strong connectivity can equalize smaller size. In contrast, Hawar Park (17 ha), with only one gate, serves 34% of the area and 52% of the population. Moreover, while Shandar Park, equal in size to Hawar Park but with two gates, has higher population coverage, reaching 63%, highlighting the importance of gate availability in relation to the Park size. Peshmarga Park (14 ha) and Majidi Land (25 ha) show lower overall accessibility, as Peshmarga has one gate and Majidi Land is in the outer zone (Figure 16).
Parks like Sami Abdulrahman Park, Shandar Park, and Aqua & Papwla Park, located in high-density central zones, benefit from better infrastructure and proximity to population centers. Peshmarga Park, situated between high- and moderate-density zones, achieves relatively high population coverage (53%) despite its smaller size and limited access, demonstrating the influence of location. Meanwhile, Majidi Land and Hawar Park, located in lower-density outer areas, show limited coverage at shorter travel times. However, their served population improves within the 10 to 15 min range, as it becomes closer to the denser area. Overall, CA to Erbil’s LUGS is shaped by a combination of park size, number of gates, and urban location. Sami Abdulrahman Park stands out as the most accessible example (Figure 16).
Furthermore, active gates or available entrances with and without parking are always key influences. In Sulaimaniyah, nine out of ten active gates have parking facilities, leaving only one without parking in LUGS. The difference in area and population served by active gates with and without parking remains below 0.1% across all time thresholds. The gate without parking is the fourth gate in Chavi Land. Due to its location in a less dense outer zone with limited surrounding road infrastructure, its overall impact is minimal. Of Erbil’s LUGS active gates, only nine have designated parking areas. Despite the difference in the four gates, the impact on both area and population served remains less than 1%. The coverage difference declines from 0.7% within a 5 min threshold to less than 0.1% at the 10 min threshold. This limited impact is mainly due to the proximity of gates to one another; in some cases, gates without parking are located very close to or between other gates, thereby minimizing their influence on overall CA.

3.7. Equity and Disparities

Car accessibility data from Sulaimaniyah and Erbil reveal clear spatial and socioeconomic inequities in LUGS across increasing time thresholds. In Sulaimaniyah, only 37% of the population and 11% of the area are served within a 5 min drive. This rises to 67% and 24% at 10 min, and 85% and 38% at 15 min, respectively. Large unserved areas remain, especially from the east to the south and the northwest outskirts. Similarly, Erbil shows disparities: 31% (population) and 14% (area) at 5 min, 74% and 44% at 10 min, and 95% and 71% at 15 min. Overall, at the city level, Erbil achieves higher population coverage (95% vs. 85% at 15 min) and nearly double the served area (71% vs. 38%) than Sulaimaniyah. These disparities become starker when analyzed by zone. In Sulaimaniyah, the inner zone has 82% coverage at 5 min and full coverage by 10 min. The transitional zone value starts at 33% and reaches 100% by 10 min. The outer zone, however, is underserved, with only 5% coverage at 5 min, 14% at 10, and 30% at 15. Erbil’s inner zone shows 71% at 5 min and 100% by 10. From 9% (5 min) to 100% (15) in the transitional zone. The outer zone performs slightly better than Sulaimaniyah, but still with low values by 7%, 29%, and 62% across the time thresholds.
This zonal analysis underscores a strong core-periphery divide: inner zones enjoy near-universal access, while outer zones remain underserved. Transitional zones show varied patterns, with Erbil improving more sharply over time. Critically, both cities exhibit deep spatial inequities in their outer zones, where access remains limited even after 15 min. These findings reflect broader global trends in urban inequality [80] and point to the need for targeted infrastructure and decentralized services to correct these imbalances.

4. Discussion

The present study builds on our previous research, which focused on pedestrian accessibility to urban green spaces (UGS) larger than 0.5 hectares [38]. That study, conducted for Erbil and Sulaimaniyah, revealed that with high inequality and accessibility, only 65% of the population could access these UGS within a 15 min walk (1200 m). Moreover, less than 10% could reach large urban green spaces (LUGS), such as district parks and city parks [38].
The region of the two cities is highly dependent on private cars and taxis for mobility. Although car travel is not considered part of a sustainable urban transport system, it remains the dominant mode of transport to reach UGS. More recently, a portion of the car fleet consists of hybrid or electric vehicles, offering relatively better sustainability than before.
LUGS access based on walkability and car accessibility shows inequality and disparities. Reaching LUGS in the inner-city zones is easier, where nearly 100% of residents can reach a park within 10 min by car. In contrast, outer zones remain underserved; for example, only 30% of Sulaimaniyah outer zone residents can access LUGS within 15 min of CA. This indicates that most LUGS are concentrated in inner areas, and highlighting rapid development after the 2000s has focused less on LUGS.
Azadi Park in Sulaimaniyah and Sami Abdulrahman Park in Erbil are prime examples of well-performing LUGS. Both parks feature multiple entrances strategically located on all sides, significantly enhancing accessibility. Additionally, they are surrounded by high-capacity road networks that further improve ease of access. These parks also maintain the highest levels of vegetation cover. Sami Abdulrahman has 75%, and Azadi has 73% vegetation, contributing to improved air quality, increased urban livability, a healthier environment in the city cores, and enhanced residents’ well-being. Similarly, Mawlana Park in Sulimaniyah, Shanadar Park, and Aqua & Papwla Park in Erbil have similar locations serving core residents with moderate to high vegetation cover.
A notable inequality is that the inner zones of both cities are served by multiple LUGS, nearly three times more than the outer zones. This spatial imbalance highlights the need for strategic planning to ensure more equitable green space distribution. In some areas, LUGS, located in the north in Sulaimaniyah and east in Erbil, serve populations outside the city boundary. This can be seen as an opportunity for nearby residents, especially since there are no LUGS within a 5 km buffer surrounding the city boundary (Figure 13 and Figure 14).
This study recommends both short- and long-term strategies to address these inequalities. The long-term strategy involves creating new LUGS in underserved areas, particularly in both cities’ southern and western parts, where residential areas contain vacant or underutilized land, and also enhancing public transportation and transportation infrastructure. However, certain areas, such as the eastern zone of Sulaimaniyah, constrained by mountainous terrain, and the northwestern zone of Erbil, occupied by the airport, are unsuitable for such development. Some researchers highlighted that there are challenges and barriers restricting LUGS implementation or road construction, including cost and maintenance, lack of political will, municipal organization, high land prices, real estate pressures for urban development, lack of knowledge, housing shortages, and urban densification [81,82]. However, this is not applicable in the Erbil case study, as the government is committed to increasing UGS to reach 15 m2 per capita (currently around 9 m2) and has a master plan to create a green belt around the city. In addition, some major roads and highways, such as the 150 m ring road, are still under construction [38,83,84].
The short-term strategy focuses on optimizing existing green spaces to improve access. For instance, Hawari Shar Park in Sulaimaniyah, which spans 582 hectares, has great potential to enhance accessibility. Currently, it has only one active entrance, leading to limited usage. Opening one or two additional gates would significantly increase access for nearby residents and promote equity (Figure 8c). In Erbil, Hawar Park can also have better accessibility by connecting to the road network and increasing the gates, as it has only one gate now. The study has some limitations. Although Google Maps was used to calibrate ORS isochrones with realistic data, we relied on the fastest and shortest routes for that specific day. However, real-time travel conditions can vary depending on the time of day, day of the week, and season. Even though these suggestions aim to address current problems, enhancing public transport infrastructure and improving travel schedule management can also greatly promote sustainable development and social equity.
Additionally, the analysis assumes that all identified gates are equally functional and accessible, without accounting for factors such as operating hours, entrance restrictions, or physical barriers (e.g., poor signage).

5. Conclusions

Urban Green Spaces (UGS) provide numerous benefits for city dwellers and are essential for sustainable urban development. They can positively influence socioeconomic conditions and overall well-being, mainly when available and can be accessed. This aligns with the United Nations Sustainable Development Goals (SDGs), particularly Goal 11, which advocates for safe, inclusive, and accessible green spaces for all [11].
This study comprehensively evaluates car-based accessibility to Large Urban Green Spaces (LUGS) in Sulaimaniyah and Erbil, two rapidly urbanizing cities in the KRI. Our previous research has shown that only a few residents (10%) in these cities can access LUGS within a 15 min walk. Moreover, both cities heavily rely on private cars and taxis for daily mobility, with approximately one car for two adults. Public transportation remains limited and infrequent, and it lacks time-based scheduling, making it an unreliable mode of travel for reaching green spaces.
The study employed a hybrid geospatial methodology to highlight CA to LUGS issues in an urban context. This included isochrones modeling using OpenRouteService (ORS), calibrated with real-time data from Google Maps. The research offers a more realistic evaluation of the LUGS served areas and served population by using 1.25 as the correction factor. This approach enhances precision and offers a scalable, replicable model for assessing car-based green space access in other car-dependent urban environments.
The findings highlight significant spatial disparities in LUGS distribution and accessibility, with inner urban zones offering high accessibility due to better road connectivity, higher population density, and availability of multiple LUGS and LUGS entrances. In contrast, outer zones, particularly in southern and western areas, remain underserved, with limited accessibility in both cities within a 15 min drive. Notably, LUGS such as Hawari Shar Park (582 ha) are underutilized due to peripheral locations and restricted gate access. The spatial zoning framework, based on urban development history, highlights sharp accessibility variations, reinforcing existing socio-spatial inequalities.
Three key determinants of LUGS accessibility emerge: (1) proximity to high-density residential areas, (2) integration with road networks, and (3) the number and distribution of active gates. However, in contrast, the size of LUGS alone was not a crucial determinant for LUGS CA compared to the other three factors. Well-planned parks like Azadi and Sami Abdulrahman demonstrate optimal accessibility and vegetation coverage, serving as models for future LUGS development.
From a planning perspective, the study advocates a dual strategy:
Short-term interventions: Expanding gate access in underperforming LUGS and improving road connectivity to enhance immediate service coverage, particularly in dense transitional zones.
Long-term strategies: Developing new LUGS in underserved peripheral areas, guided by spatial data, land availability, and road infrastructure, to achieve equitable green space distribution.
In the Kurdistan Region Governorate, this study shows that car enhances LUGS accessibility, decreasing inequality, as public transport is not available, and walking accessibility is limited. The similar findings mentioned in the studies about Shenzhen and Beijing [68,85]. However, it also underscores the need to integrate LUGS with mobility strategies and enhance public transportation systems. The method and insight shown here can be applied and integrated with other modes of transportation to assess the UGS equitability, thereby supporting sustainable urban planning. Ultimately, ensuring equitable access to high-quality green spaces is vital for enhancing all residents’ environmental, health, and social benefits, regardless of their location within the urban fabric. Adding detailed socio-demographic data, including income levels and gender-specific car ownership, which are currently unavailable, would enable a more comprehensive evaluation of equitable access to urban green spaces (UGS), and uncover additional layers of interpretation and enhance understanding of accessibility disparities.

Author Contributions

Conceptualization, Y.N.H. and S.J.; methodology, Y.N.H.; software, Y.N.H.; validation, Y.N.H., M.A. and S.J.; formal analysis, Y.N.H.; investigation, Y.N.H.; resources, Y.N.H. and H.A.M.; data curation, Y.N.H. and H.A.M.; writing—original draft preparation, Y.N.H.; writing—review and editing, Y.N.H., M.A. and S.J.; visualization, Y.N.H.; supervision, S.J.; project administration, Y.N.H. and S.J.; funding acquisition, S.J. All authors have read and agreed to the published version of the manuscript.

Funding

This work was supported by Hungarian University of Agriculture and life Sciences—MATE.

Conflicts of Interest

The authors declare no conflict of interest.

References

  1. Aronson, M.F.; Lepczyk, C.A.; Evans, K.L.; Goddard, M.A.; Lerman, S.B.; MacIvor, J.S.; Nilon, C.H.; Vargo, T. Biodiversity in the city: Key challenges for urban green space management. Front. Ecol. Environ. 2017, 15, 189–196. [Google Scholar] [CrossRef]
  2. Gill, S.E.; Handley, J.F.; Ennos, A.R.; Pauleit, S. Adapting cities for climate change: The role of the green infrastructure. Built Environ. 2007, 33, 115–133. [Google Scholar] [CrossRef]
  3. Bowler, D.E.; Buyung-Ali, L.; Knight, T.M.; Pullin, A.S. Urban greening to cool towns and cities: A systematic review of the empirical evidence. Landsc. Urban Plan. 2010, 97, 147–155. [Google Scholar] [CrossRef]
  4. Jombach, S.; Üsztöke, L.; Hassan, Y.N.; Chenyu, D. Green Space Intensity, Land Surface Temperature and Green Canopy Top Mapping: A Case Study in the Suburban Settlement of Törökbálint, Hungary. J. Digit. Landsc. Archit. 2023, 8, 417–425. [Google Scholar] [CrossRef]
  5. Hoover, F.-A.; Hopton, M.E. Developing a framework for stormwater management: Leveraging ancillary benefits from urban greenspace. Urban Ecosyst. 2019, 22, 1139–1148. [Google Scholar] [CrossRef] [PubMed]
  6. Gharibi, S.; Shayesteh, K.; Attaiean, B. The Capability of Urban Green Spaces in providing Carbon Sequestration Ecosystem Services. Geogr. Environ. Sustain. 2021, 11, 61–80. [Google Scholar]
  7. Dadvand, P.; Bartoll, X.; Basagaña, X.; Dalmau-Bueno, A.; Martinez, D.; Ambros, A.; Cirach, M.; Triguero-Mas, M.; Gascon, M.; Borrell, C.; et al. Green spaces and general health: Roles of mental health status, social support, and physical activity. Environ. Int. 2016, 91, 161–167. [Google Scholar] [CrossRef]
  8. Abulibdeh, A. Analysis of urban heat island characteristics and mitigation strategies for eight arid and semi-arid gulf region cities. Environ. Earth Sci. 2021, 80, 259. [Google Scholar] [CrossRef]
  9. Scholes, R.J. The future of semi-arid regions: A weak fabric unravels. Climate 2020, 8, 43. [Google Scholar] [CrossRef]
  10. Gupta, K.; Puntambekar, K.; Roy, A.; Pandey, K.; Mahavir; Kumar, P. Smart environment through smart tools and technologies for urban green spaces: Case study: Chandigarh, India. In Smart Environment for Smart Cities; Springer: Berlin/Heidelberg, Germany, 2019; pp. 149–194. [Google Scholar]
  11. United Nations General Assembly. Transforming our world: The 2030 agenda for sustainable development. In Springer eBooks; Springer: Berlin/Heidelberg, Germany, 2015. [Google Scholar] [CrossRef]
  12. Duke, J.A. Three Men in the Wilderness: Ideas and Concepts of Nature During the Progressive Era with Theodore Roosevelt, Gifford Pinchot and John Muir. Master’s Thesis, University of Northern Iowa, Cedar Falls, IA, USA, 2016. [Google Scholar]
  13. Yang, B.; Li, S. Design with Nature: Ian McHarg’s ecological wisdom as actionable and practical knowledge. Landsc. Urban Plan. 2016, 155, 21–32. [Google Scholar] [CrossRef]
  14. Rosenberg, E. Public and private: Rereading jane Jacobs. Landsc. J. 1994, 13, 139–144. [Google Scholar] [CrossRef]
  15. Mercer, C. Geographics for the present: Patrick Geddes, urban planning and the human sciences. Int. J. Hum. Resour. Manag. 1997, 26, 211–232. [Google Scholar] [CrossRef]
  16. Marcus, C.C.; Francis, C. People Places: Design Guidlines for Urban Open Space; John Wiley & Sons: Hoboken, NJ, USA, 1997. [Google Scholar]
  17. Grabowski, Z.J.; McPhearson, T.; Matsler, A.M.; Groffman, P.; Pickett, S.T. What is green infrastructure? A study of definitions in US city planning. Front. Ecol. Environ. 2022, 20, 152–160. [Google Scholar] [CrossRef]
  18. Choi, D.-A.; Park, K.; Rigolon, A. From XS to XL urban nature: Examining access to different types of green space using a ‘just sustainabilities’ framework. Sustainability 2020, 12, 6998. [Google Scholar] [CrossRef]
  19. Gozalo, G.; Morillas, J.; González, D. Perceptions and use of urban green spaces on the basis of size. Urban Urban Green 2019, 46, 126470. [Google Scholar] [CrossRef]
  20. Geurs, K.T.; Van Wee, B. Accessibility evaluation of land-use and transport strategies: Review and research directions. J. Transp. Geogr. 2004, 12, 127–140. [Google Scholar] [CrossRef]
  21. Hansen, W.G. Accessibility and Residential Growth. Master’s Thesis, Massachusetts Institute of Technology, Cambridge, MA, USA, 1959. [Google Scholar]
  22. Ben-Akiva, M.; Lerman, S.R. Disaggregate travel and mobility-choice models and measures of accessibility. In Behavioural Travel Modelling; Routledge: London, UK, 2021; pp. 654–679. [Google Scholar]
  23. Talen, E. Sense of community and neighbourhood form: An assessment of the social doctrine of new urbanism. Urban Stud. 1999, 36, 1361–1379. [Google Scholar] [CrossRef]
  24. Páez, A.; Scott, D.M.; Morency, C. Measuring accessibility: Positive and normative implementations of various accessibility indicators. J. Transp. Geogr. 2012, 25, 141–153. [Google Scholar] [CrossRef]
  25. Luo, W.; Qi, Y. An enhanced two-step floating catchment area (E2SFCA) method for measuring spatial accessibility to primary care physicians. Health Place 2009, 15, 1100–1107. [Google Scholar] [CrossRef] [PubMed]
  26. Higgs, G.; Fry, R.; Langford, M. Investigating the implications of using alternative GIS-based techniques to measure accessibility to green space. Environ. Plan. B Plan. Des. 2012, 39, 326–343. [Google Scholar] [CrossRef]
  27. Chen, P.; Wang, W.; Qian, C.; Cao, M.; Yang, T. Gravity-based models for evaluating urban park accessibility: Why does localized selection of attractiveness factors and travel modes matter? Environ. Plan. B Urban Anal. City Sci. 2024, 51, 904–922. [Google Scholar] [CrossRef]
  28. Williams, C.; Williams, C.; Byrne, C.; Evenden, S.; Soebarto, V.; Caddy-Retalic, S.; Williams, C.; Tefera, Y.; Feng, X.; Lowe, A. Urban green space provision: The case for policy-based solutions to support human health. Med. J. Aust. 2025, 222, 110–113. [Google Scholar] [CrossRef]
  29. Boone, C.G.; Buckley, G.L.; Grove, J.M.; Sister, C. Parks and people: An environmental justice inquiry in Baltimore, Maryland. Ann. Assoc. Am. Geogr. 2009, 99, 767–787. [Google Scholar] [CrossRef]
  30. Wolch, J.R.; Byrne, J.; Newell, J.P. Urban green space, public health, and environmental justice: The challenge of making cities ‘just green enough’. Landsc. Urban Plan. 2014, 125, 234–244. [Google Scholar] [CrossRef]
  31. Nesbitt, L.; Meitner, M.J.; Girling, C.; Sheppard, S.R.; Lu, Y. Who has access to urban vegetation? A spatial analysis of distributional green equity in 10 US cities. Landsc. Urban Plan. 2019, 181, 51–79. [Google Scholar] [CrossRef]
  32. Chen, B.; Wu, S.; Song, Y.; Webster, C.; Xu, B.; Gong, P. Contrasting inequality in human exposure to greenspace between cities of Global North and Global South. Nat. Commun. 2022, 13, 4636. [Google Scholar] [CrossRef]
  33. Koohsari, M.J. Access to public open space: Is distribution equitable across different socio-economic areas. J. Urban Environ. Eng. 2011, 5, 67–72. [Google Scholar] [CrossRef]
  34. Tan, P.Y.; Samsudin, R. Effects of spatial scale on assessment of spatial equity of urban park provision. Landsc. Urban Plan. 2017, 158, 139–154. [Google Scholar] [CrossRef]
  35. Lee, G.; Hong, I. Measuring spatial accessibility in the context of spatial disparity between demand and supply of urban park service. Landsc. Urban Plan. 2013, 119, 85–90. [Google Scholar] [CrossRef]
  36. Wang, C.; Wang, S.; Cao, Y.; Yan, H.; Li, Y. The social equity of urban parks in high-density urban areas: A case study in the core area of Beijing. Sustainability 2023, 15, 13849. [Google Scholar] [CrossRef]
  37. Nasri Roodsari, E.; Hoseini, P. An assessment of the correlation between urban green space supply and socio-economic disparities of Tehran districts—Iran. Environ. Dev. Sustain. 2022, 24, 12867–12882. [Google Scholar] [CrossRef]
  38. Hassan, Y.N.; Zhen, S.; Sharbazhery, A.O.; Du, C.; Jombach, S. Evaluating Urban Green Space Accessibility and Per Capita Distribution in Erbil and Sulaymaniyah, Kurdistan Region of Iraq. In Fábos Conference on Landscape and Greenway Planning; University of Massachusetts Amherst Libraries: Amherst, MA, USA, 2025. [Google Scholar] [CrossRef]
  39. Iraegui, E.; Augusto, G.; Cabral, P. Assessing equity in the accessibility to urban green spaces according to different functional levels. ISPRS Int. J. Geo-Inf. 2020, 9, 308. [Google Scholar] [CrossRef]
  40. Hassan, Y.N.; Ali, Z.F.; Üsztöke, L.; Jombach, S. A Comparative Assessment of UGS Changes and Accessibility Using Per Capita Metrics: A Case Study of Budapest and Vienna. J. Digit. Landsc. Archit. 2024, 9, 723–734. [Google Scholar] [CrossRef]
  41. Biernacka, M.; Kronenberg, J.; Łaszkiewicz, E.; Czembrowski, P.; Parsa, V.A.; Sikorska, D. Beyond urban parks: Mapping informal green spaces in an urban–peri-urban gradient. Land Use Policy 2023, 131, 106746. [Google Scholar] [CrossRef]
  42. Buckland, M.; Pojani, D. Green space accessibility in Europe: A comparative study of five major cities. Eur. Plan. Stud. 2023, 31, 146–167. [Google Scholar] [CrossRef]
  43. Kabisch, N.; Haase, D. Green justice or just green? Provision of urban green spaces in Berlin, Germany. Landsc. Urban Plan. 2014, 122, 129–139. [Google Scholar] [CrossRef]
  44. Hoffimann, E.; Barros, H.; Ribeiro, A.I. Socioeconomic inequalities in green space quality and accessibility—Evidence from a Southern European city. Int. J. Environ. Res. Public Health 2017, 14, 916. [Google Scholar] [CrossRef]
  45. Donaldson, R.; Ferreira, S.; Didier, S.; Rodary, E.; Swanepoel, J. Access to the urban national park in Cape Town: Where urban and natural environment meet. Habitat Int. 2016, 57, 132–142. [Google Scholar] [CrossRef]
  46. Ibes, D.C. A multi-dimensional classification and equity analysis of an urban park system: A novel methodology and case study application. Landsc. Urban Plan. 2015, 137, 122–137. [Google Scholar] [CrossRef]
  47. Ayala-Azcarraga, C.; Diaz, D.; Fernandez, T.; Cordova-Tapia, F.; Zambrano, L. Uneven distribution of urban green spaces in relation to marginalization in Mexico City. Sustainability 2023, 15, 12652. [Google Scholar] [CrossRef]
  48. Ramos, A.G.; Garcia-Macias, J.A. Where Google Maps Doesn’t Go: Mobility Decisions of People in Underserved Neighborhoods. In Proceedings of the 13th International Conference on Ubiquitous Computing and Ambient Intelligence UCAmI 2019, Toledo, Spain, 2–5 December 2019; Volume 31, p. 77. [Google Scholar]
  49. Erath, A.; van Eggermond, M.A.; Ordóñez, S.A.; Axhausen, K.W. Introducing the pedestrian accessibility tool: Walkability analysis for a geographic information system. Transp. Res. Rec. 2017, 2661, 51–61. [Google Scholar] [CrossRef]
  50. Zhang, R.; Huang, L.; Wang, H. Accessibility improvement and renewal of urban park green space for the elderly and the disabled. Forests 2023, 14, 1801. [Google Scholar] [CrossRef]
  51. Chang, Z.; Chen, J.; Li, W.; Li, X. Public transportation and the spatial inequality of urban park accessibility: New evidence from Hong Kong. Transp. Res. Part D Transp. Environ. 2019, 76, 111–122. [Google Scholar] [CrossRef]
  52. Nieuwenhuijsen, M.J. Urban and transport planning pathways to carbon neutral, liveable and healthy cities; A review of the current evidence. Environ. Int. 2020, 140, 105661. [Google Scholar] [CrossRef]
  53. Lucas, K.; Van Wee, B.; Maat, K. A method to evaluate equitable accessibility: Combining ethical theories and accessibility-based approaches. Transportation 2016, 43, 473–490. [Google Scholar] [CrossRef]
  54. ElDeeb, S.; EL-Baky, R.A.A.; Masoumi, H. Unveiling transportation disparities: Investigating accessibility gaps in metropolitan cities using GIS—A case study of Alexandria, Egypt. Front. Sustain. Cities 2024, 6, 1372918. [Google Scholar] [CrossRef]
  55. Un-Habitat. Planning and Design for Sustainable Urban Mobility: Global Report on Human Settlements 2013; Taylor & Francis: Abingdon, UK, 2013. [Google Scholar]
  56. Sun, Y.; Saha, S.; Tost, H.; Kong, X.; Xu, C. Literature review reveals a global access inequity to urban green spaces. Sustainability 2022, 14, 1062. [Google Scholar] [CrossRef]
  57. Glazener, A.; Wylie, J.; van Waas, W.; Khreis, H. The impacts of car-free days and events on the environment and human health. Curr. Environ. Health Rep. 2022, 9, 165–182. [Google Scholar] [CrossRef]
  58. Himanen, V.; Nijkamp, P.; Padjen, J. Transport Mobility, Spatial Accessibility and Environmental Sustainability; Vrije Universiteit Amsterdam: Amsterdam, The Netherlands, 1992. [Google Scholar]
  59. Will, M.-E.; Cornet, Y.; Munshi, T. Measuring road space consumption by transport modes: Toward a standard spatial efficiency assessment method and an application to the development scenarios of Rajkot City, India. J. Transp. Land Use 2020, 13, 651–669. [Google Scholar] [CrossRef]
  60. Al-Obaedi, J.T.S. Highlighting the Ongoing Roads Infrastructure Challenges: Car Ownership Rates in Iraq. Univ. Thi-Qar J. Eng. Sci. 2019, 10, 1–4. [Google Scholar] [CrossRef]
  61. 964media. Kurdistan Region Sees Surge in Vehicle Imports with over 171,000 Cars Entering in 2024. 2025. Available online: https://en.964media.com/30363/ (accessed on 10 June 2025).
  62. Kurdistan Region Statistics Office. Kurdistan Region of Iraq—Population Analysis Report 2021; Kurdistan Region Statistics Office: Erbil, Iraq, 2021.
  63. Rigolon, A. A complex landscape of inequity in access to urban parks: A literature review. Landsc. Urban Plan. 2016, 153, 160–169. [Google Scholar] [CrossRef]
  64. Field, M.J.; Jette, A.M.; Institute of Medicine (US) Committee on Disability in America. Transportation Patterns and Problems of People with Disabilities, in the Future of Disability in America; National Academies Press (US): Washington, DC, USA, 2007. [Google Scholar]
  65. Zeng, T.; Zhang, H.; Moura, S.J.; Shen, Z.J.M. Economic and environmental benefits of automated electric vehicle ride-hailing services in New York City. Sci. Rep. 2024, 14, 4180. [Google Scholar] [CrossRef] [PubMed]
  66. Golbabaei, F.; Dwyer, J.; Gomez, R.; Peterson, A.; Cocks, K.; Bubke, A.; Paz, A. Enabling mobility and inclusion: Designing accessible autonomous vehicles for people with disabilities. Cities 2024, 154, 105333. [Google Scholar] [CrossRef]
  67. Pinto, L.V.; Ferreira, C.S.S.; Inácio, M.; Pereira, P. Urban green spaces accessibility in two European cities: Vilnius (Lithuania) and Coimbra (Portugal). Geogr. Sustain. 2022, 3, 74–84. [Google Scholar] [CrossRef]
  68. Qin, J.; Liu, Y.; Yi, D.; Sun, S.; Zhang, J. Spatial accessibility analysis of parks with multiple entrances based on real-time travel: The case study in Beijing. Sustainability 2020, 12, 7618. [Google Scholar] [CrossRef]
  69. Liu, L.; Zheng, B.; Luo, C.; Bedra, K.B.; Masrabaye, F. Access to city center: Automobile vs. public transit. Int. J. Environ. Res. Public Health 2022, 19, 5622. [Google Scholar] [CrossRef] [PubMed]
  70. Conwell, L.; Eckert, F.; Mobarak, A.M. Transportation Infrastructure and City-Center Accessibility in the US and Europe. 2023. Available online: https://www.fpeckert.me/CEM.pdf (accessed on 25 June 2025).
  71. Kemec, S.; Abdalkarim, S.H. Accessibility analysis of urban green space: The case of Erbil city. ICONARP Int. J. Archit. Plan. 2023, 11, 24–44. [Google Scholar] [CrossRef]
  72. Downward, P.; Lumsdon, L. Tourism transport and visitor spending: A study in the North York Moors National Park, UK. J. Travel Res. 2004, 42, 415–420. [Google Scholar] [CrossRef]
  73. Pettebone, D.; Newman, P.; Lawson, S.R.; Hunt, L.; Monz, C.; Zwiefka, J. Estimating visitors’ travel mode choices along the bear lake road in Rocky Mountain National Park. J. Transp. Geogr. 2011, 19, 1210–1221. [Google Scholar] [CrossRef]
  74. Ermida, S.L.; Soares, P.; Mantas, V.; Göttsche, F.M.; Trigo, I.F. Google earth engine open-source code for land surface temperature estimation from the landsat series. Remote Sens. 2020, 12, 1471. [Google Scholar] [CrossRef]
  75. OpenRouteService. Openrouteservice API Services. 2025. Available online: https://openrouteservice.org/ (accessed on 5 June 2025).
  76. Hecht, R.; Gröbe, M.; Gugulica, M.; Krellenberg, K.; Kreutzarek, N.; Lautenbach, S. A web app to generate and disseminate new knowledge on urban green space qualities and their accessibility. ISPRS Ann. Photogramm. Remote Sens. Spat. Inf. Sci. 2021, 8, 65–72. [Google Scholar] [CrossRef]
  77. Ibrahim, R.I.; Mushatat, S.A.; Abdelmonem, M.G. Erbil. Cities 2015, 49, 14–25. [Google Scholar] [CrossRef]
  78. Acheampong, R.A.; Asabere, S.B. Urban expansion and differential accessibility by car and public transport in the Greater Kumasi city-region, Ghana—A geospatial modelling approach. J. Transp. Geogr. 2022, 98, 103257. [Google Scholar] [CrossRef]
  79. Sabr, C. A study on the urban form of Erbil city (the capital of Kurdistan region) as an example of historical and fast growing city. Humanit. Soc. Sci. Rev. CD-ROM 2014, 3, 325–340. [Google Scholar]
  80. Talen, E. Neighborhoods as service providers: A methodology for evaluating pedestrian access. Environ. Plan. B Plan. Des. 2003, 30, 181–200. [Google Scholar]
  81. Gavrilidis, A.A.; Popa, A.M.; Nita, M.R.; Onose, D.A.; Badiu, D.L. Planning the “unknown”: Perception of urban green infrastructure concept in Romania. Urban For. Urban Green. 2020, 51, 126649. [Google Scholar] [CrossRef]
  82. Pereira, P.; Baró, F. Greening the City: Thriving for Biodiversity and Sustainability; Elsevier: Amsterdam, The Netherlands, 2022; p. 153032. [Google Scholar]
  83. K Alfaris, S. The Green Network Panoramic Vision Erbil City as a Case Study. Cihan Univ.–Erbil Sci. J. (CUESJ) 2022, 6, 2. [Google Scholar]
  84. Salih, A.M.; Erfani, G.; Larimian, T. Mass housing planning and environmental considerations: Case studies of post-war urban redevelopment in Erbil city, Kurdistan. Local Environ. 2025, 1–21. [Google Scholar] [CrossRef]
  85. Xu, M.; Xin, J.; Su, S.; Weng, M.; Cai, Z. Social inequalities of park accessibility in Shenzhen, China: The role of park quality, transport modes, and hierarchical socioeconomic characteristics. J. Transp. Geogr. 2017, 62, 38–50. [Google Scholar] [CrossRef]
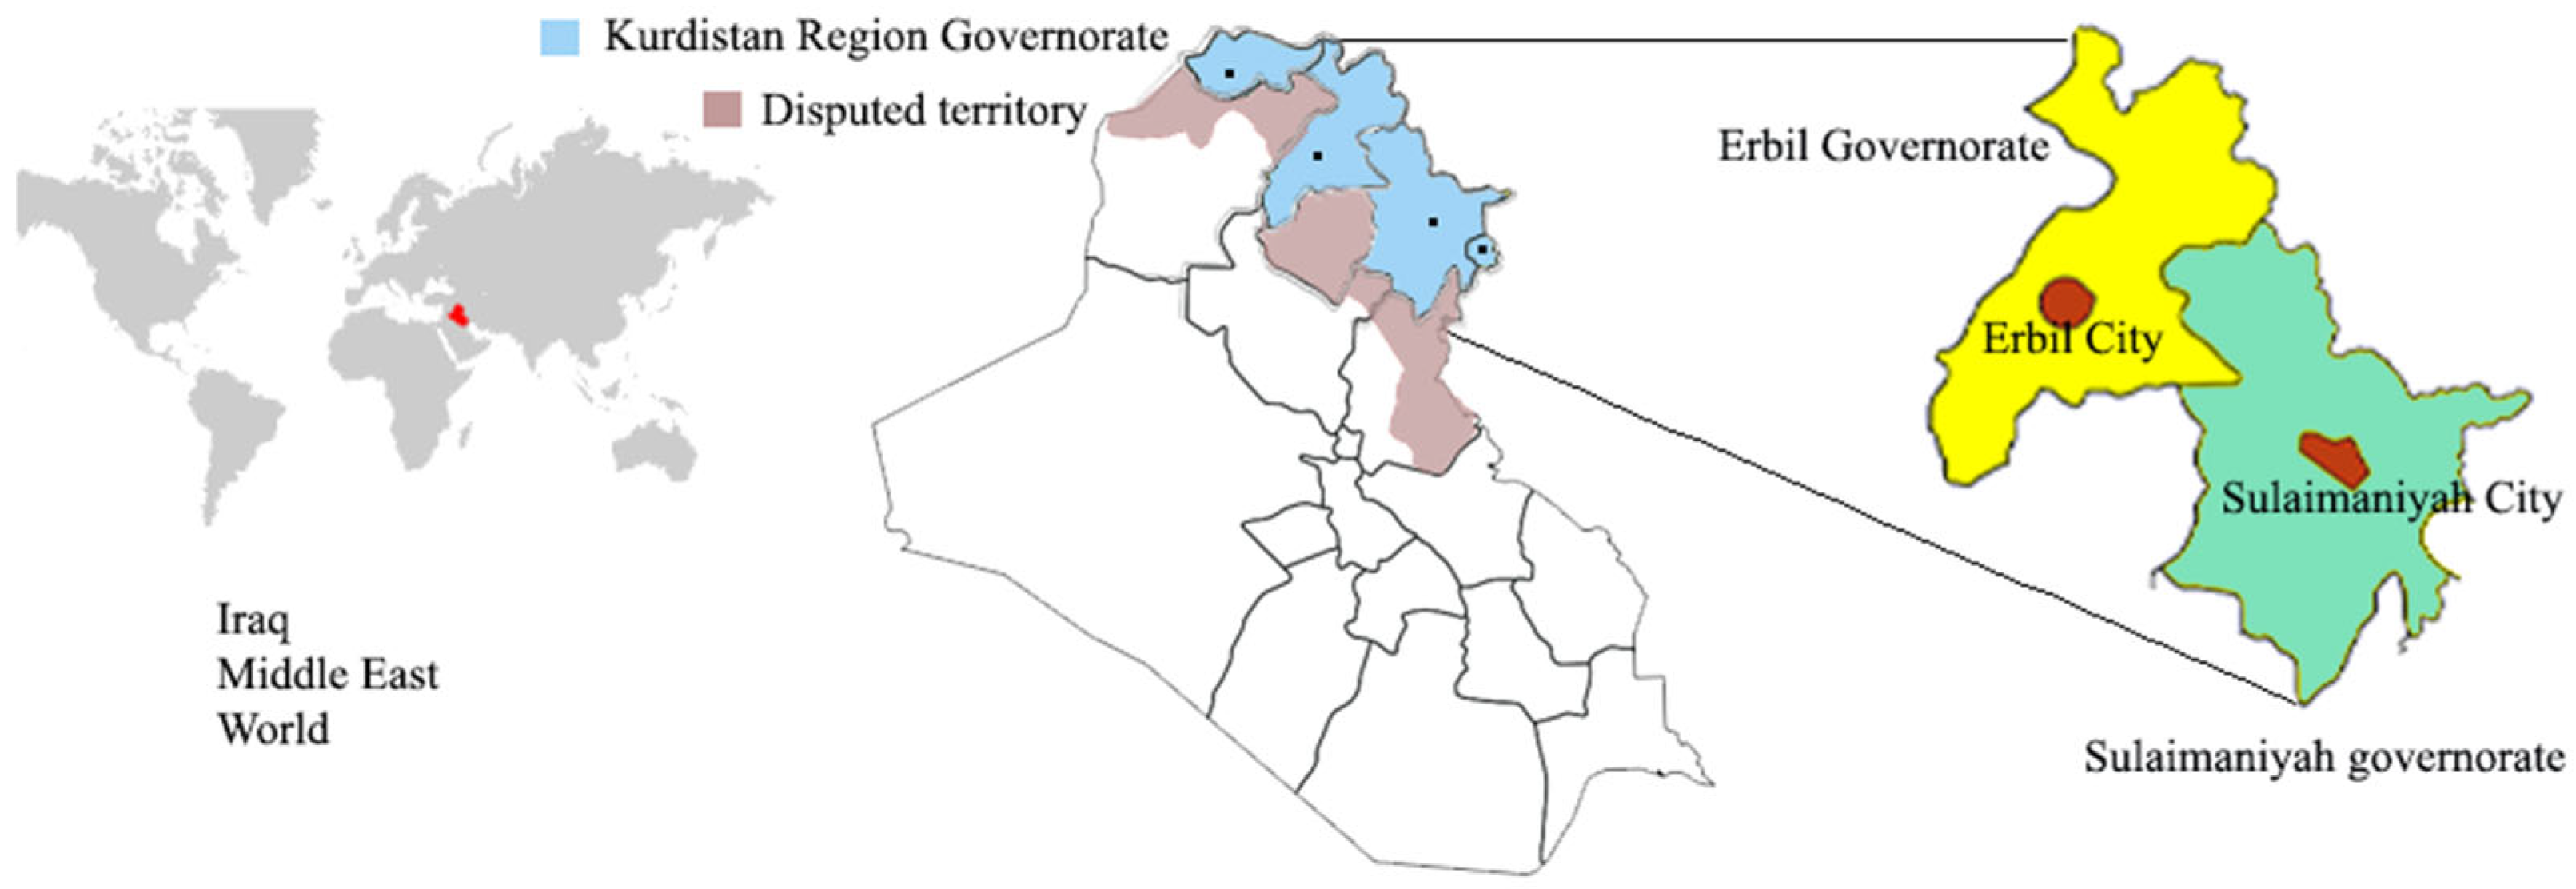
Figure 1. The Location of the Study Area within the Kurdistan Region Governorate, North of Iraq.
Land 14 01886 g001
Figure 2. Sulaimaniyah elevation profile based on the walking road from point 1 to point 2, source: google earth.
Land 14 01886 g002
Figure 3. Erbil elevation profile based on the walking road from point 1 to point 2, source: google earth.
Land 14 01886 g003
Figure 5. Point-to-point route network and time duration on Google Maps before and after calibration.
Land 14 01886 g005
Figure 6. (a) Sulaimaniyah’s vegetation coverage in April and May, (b) spatial distribution of green spaces bigger than 0.5 ha.
Land 14 01886 g006
Figure 7. (a) Erbil’s vegetation coverage in April and May, (b) spatial distribution of green spaces bigger than 0.5 ha.
Land 14 01886 g007
Figure 8. Sulaimaniyah, (a) city boundary, road network, and spatial distribution of LUGS, (b) population density and distribution within inner, transition, and outer zone of the city, (c) number and location of active gates and urban context, (d) example of the gates. source: author and google.com.
Land 14 01886 g008
Figure 9. Erbil, (a) city boundary, road network and spatial distribution of LUGS, (b) population density and distribution within inner, transition and outer zone of the city, (c) number and location of active gates and urban context, (d) example of the gates, source: author and google.com.
Land 14 01886 g009
Figure 10. The quality LUGS based on vegetation cover.
Land 14 01886 g010
Figure 11. Proportion of served and unserved areas and population in Sulaimaniyah by 5-, 10-, and 15-min car drive times from LUGS.
Land 14 01886 g011
Figure 12. Proportion of served and unserved areas and population in Erbil by 5-, 10-, and 15-min car drive times from LUGS.
Land 14 01886 g012
Figure 13. LUGS car accessibility in Sulaimaniyah at City and zonal levels, inside/outside the city boundary, and an example of Azadi Park: (a) 5 min, (b) 10 min, (c) 15 min.
Land 14 01886 g013
Figure 14. LUGS car accessibility in Erbil at city and zonal levels, inside/outside the city boundary, and an example of Sami Abdulrahman Park: (a) 5 min, (b) 10 min, (c) 15 min.
Land 14 01886 g014
Figure 15. Individual LUGS: served area and population across three time thresholds.
Land 14 01886 g015
Figure 16. Erbil individual LUGS: (a) served area, (b) served population, across three time thresholds.
Land 14 01886 g016
Table 1. Names, sizes, and number of active entrances of LUGS in Sulaimaniyah and Erbil.
Sulaimaiyah LUGSSize Ha.Active GateErbil LUGSSize Ha.Active Gate
Hawari Shar Park 5821Sami Abdulrahman Park2094
Chavi land554Majidi land252
Azadi Park494Hawar Park171
Mawlana Park91Shandar Park172
Peshmarga Park141
* Aqua & Papwla Park84
* Aqua Park and Papwla Park are distinct in origin, but due to the absence of strong spatial boundaries, they were treated as one combined park in the analysis.
Disclaimer/Publisher’s Note: The statements, opinions and data contained in all publications are solely those of the individual author(s) and contributor(s) and not of MDPI and/or the editor(s). MDPI and/or the editor(s) disclaim responsibility for any injury to people or property resulting from any ideas, methods, instructions or products referred to in the content.