Article

Analysis of the Correlation Between the Accessibility of Built Environment Elements and Residents’ Self-Rated Health in New Rural Communities

School of Urban Design, Wuhan University, Wuhan 430072, China
*
Author to whom correspondence should be addressed.
Land 2025, 14(9), 1867; https://doi.org/10.3390/land14091867
Submission received: 20 May 2025 / Revised: 7 September 2025 / Accepted: 9 September 2025 / Published: 12 September 2025

Abstract

In the contexts of rapid urbanization and the Healthy China Strategy, understanding how the built environment affects residents’ health has become a pressing issue for the development of new rural communities. This study aims to investigate the associations between facility accessibility and residents’ health, and to provide evidence for health-oriented rural planning. Taking Pujiang County in Chengdu as the case study, we measured the accessibility of nine categories of facilities using GIS-based network analysis and evaluated residents’ health through the Self-Rated Health Measurement Scale (SRHMS). Gradient Boosting Decision Trees (GBDT) combined with SHAP interpretation were employed to examine and explain the influence of accessibility factors on health outcomes. The results indicate that the accessibility of road entrances, public toilets, garbage transfer points, schools, and community service centers is negatively associated with residents’ health, with variations across physical, mental, and social health dimensions. Moreover, social health is insufficiently explained by physical accessibility alone, implying the additional importance of social and cultural conditions. These findings offer practical guidance for optimizing facility layout and spatial design in new rural communities and provide an empirical basis for promoting health-oriented rural planning in China and similar contexts.

1. Introduction

In recent years, China’s urbanization has entered a stage of high-quality development, in which the construction of new rural communities is regarded as a crucial mechanism for promoting urban–rural integration, improving living environments, and enhancing public services [1,2,3,4]. New rural communities refer to modern and centralized residential settlements formed within designated rural areas through standardized planning, unified construction, and the integration of social organization [2,5]. Compared with traditional scattered rural settlements, this model alleviates problems such as resource wastage, inadequate public facilities, and insufficient health services by concentrating layouts, standardizing infrastructure planning, and improving the provision of public service facilities [6,7]. However, despite significant improvements in hardware conditions, the maintenance and enhancement of residents’ health outcomes have not met expectations, prompting further academic exploration into the factors related to the built environment. The built environment refers to the physical space created and transformed by human activities, including road networks, public service facilities, green spaces, and open spaces [8]. Among various built environment features, accessibility is considered a key mechanistic variable linking spatial layout and resident health, reflecting the ease with which residents can obtain specific resources or services within certain time and cost constraints [9,10,11]. In new rural communities, although spatial layouts are centralized and functional zoning is clearly defined, resource distribution may still exhibit structural imbalances. The level of accessibility directly affects opportunities for residents to engage in physical exercise, access medical services, and participate in public activities and social interactions, thereby influencing their health outcomes [12,13]. Therefore, examining the relationship between the built environment of new rural communities and resident health from an “accessibility” perspective not only contributes to deepening academic research on urban and rural healthy spaces but also addresses the practical need to optimize the allocation of public resources and improve the health levels of rural residents.
A substantial body of empirical evidence demonstrates that the accessibility of the built environment is significantly associated with residents’ self-rated health, with marked disparities observed across urban–rural contexts and different social groups [8,14,15,16]. Comparative studies in China indicate that rural residents are generally disadvantaged in terms of access to public facilities, transportation nodes, and recreational spaces, which may partly explain their lower health outcomes compared to urban residents [17]. Similar patterns were confirmed in Europe through four waves of Eurobarometer cross-sectional surveys [18]. The health effects of accessibility to different types of facilities exhibit considerable heterogeneity and complexity [19,20,21]. Green space accessibility is positively linked to mental well-being, physical activity, and cardiovascular health, although these effects vary by gender, age, and socioeconomic status [22,23]. A longitudinal study in Wales demonstrated that residential proximity to green and blue space was associated with long-term improvements in mental health, particularly among socioeconomically disadvantaged groups [24]. Proximity to sports and recreational facilities generally promotes physical activity, however its effectiveness depends on facility quality, safety, and sociocultural context [25]. Evidence from Sweden indicates that these positive effects are substantially weaker in low socioeconomic status (SES) neighborhoods compared to high-SES communities [26]. Public transportation accessibility may also improve health by encouraging walking and social interaction [27,28,29]. However, the finding from suburban Scarborough, Canada, suggests that low-income populations may experience adverse effects due to increased exposure to environmental risks near transit nodes [30]. In terms of measurement approaches, researchers have employed diverse methods to assess accessibility, ranging from simple Euclidean distances to network-based measures that more accurately reflect actual travel conditions, and further to complex models incorporating travel cost and service capacity [31,32,33]. A systematic review of health service accessibility in Australia over the past two decades highlighted that network-based measures are particularly critical in addressing inequalities between urban and remote rural areas [34]. Regarding health measurement, self-rated health (SRH) has been widely used by the World Health Organization, the U.S. Centers for Disease Control and Prevention, and the European Union for population health monitoring. Its reliability and validity have been consistently validated in large-scale surveys [35,36,37]. Some scholars have further differentiated within the SRH framework among physical, mental, and social dimensions to reveal the multi-level characteristics of health [38,39].
Although existing studies have yielded substantial findings, research focusing on new rural communities remains inadequate. First, there is a lack of targeted investigation into the specific research object [40,41]. Most studies concentrate on urban residents or urban–rural comparisons, with limited systematic analysis devoted to new rural communities as an emerging spatial form [5,42]. These communities differ from both traditional villages and urban neighborhoods in terms of spatial intensification, functional zoning, and transportation organization, suggesting that the mechanisms through which accessibility affects health may be unique. Second, existing research often focuses on a single type of facility (such as healthcare or green spaces), paying insufficient attention to the combined effects of multiple facility types [43]. Although a few recent studies have begun to incorporate factors such as public service centers, public toilets, squares, garbage transfer points, and educational resources, overall, this line of inquiry remains underdeveloped [44,45,46,47]. Third, methodological limitations are notable. Traditional statistical methods, such as multiple regression and spatial regression, can reveal linear relationships but often fail to capture complex nonlinear effects and interactions between variables [48]. In recent years, machine learning methods, such as gradient boosting machines and random forests, have been increasingly applied in public health and built environment research [49]. However, their use remains relatively limited in studies on the relationship between accessibility and health, particularly those incorporating interpretability approaches, such as SHAP, to uncover the marginal effects of different types of facilities.
Building upon the identified research gaps, this study examines the relationship between the built environment and residents’ health in new rural communities in China from an accessibility perspective. To this end, we constructed a multidimensional accessibility indicator system covering public services, daily amenities, and recreational environments, and employed GIS-based measurement methods to obtain precise spatial data. Meanwhile, self-rated health (SRH) was used as the core health measurement tool to comprehensively evaluate residents’ physical, mental, and social well-being. Methodologically, the Gradient Boosted Decision Trees (GBDT) model along with the SHAP interpretability approach were introduced to uncover the nonlinear effects and marginal contributions of various built environment elements on health. Through this framework, this study not only addresses the limitations of traditional statistical methods in capturing complex relationships but also provides new evidence for understanding the interaction mechanisms between spatial characteristics and health outcomes in new rural communities.
To achieve the aforementioned research objectives, the structure of this paper is organized as follows: Section 2 introduces the materials and methods, including the measurement of self-rated health and the accessibility of built environment elements, the modeling approach using Gradient Boosting Decision Trees (GBDT), and the interpretability analysis supplemented by SHAP. Section 3 presents the model results, highlighting the strength and variation in associations between the accessibility of different built environment elements and residents’ self-rated health. Section 4 discusses the underlying mechanisms behind the findings and derives policy implications along with future research directions based on the results. Section 5 summarizes the main findings, discusses the theoretical and practical significance of the results, and reflects on the study’s limitations and future directions. Through rigorous data analysis and methodological innovation, this study aims to provide new evidence and theoretical insights for health-oriented planning and management of new rural communities.

2. Materials and Methods

2.1. Study Area

The survey area of this study is Pujiang County, Chengdu City, Sichuan Province, covering six new rural communities (Figure 1). All these communities belong to the same county and were constructed in accordance with the unified planning of Chengdu’s new rural construction, showing a high degree of consistency in terms of spatial layout, public facility allocation, and residential form. Most residents are relocated and resettled as a whole, with relatively similar population structure and social and cultural backgrounds; the main groups are generally middle-aged and elderly farmers and migrant workers returning to their hometowns, and the forms of community activities are quite similar. Spatially, the distance between the communities is relatively short, with the maximum distance between any two points not exceeding 20 km. This similarity in the built environment and population-social conditions provides a favorable prerequisite for cross-community data collection and model analysis.
The survey was conducted in July 2023 by eight trained researchers. Data collection methods included household questionnaires (the questionnaire is provided in Appendix A), on-site guided surveys, and semi-structured interviews. To facilitate statistical modeling, demographic variables were numerically coded (Table 1). To minimize comprehension biases due to older age or limited education, the research team, with assistance from local village committees, provided necessary explanations to ensure accurate and complete questionnaire responses. A total of 105 questionnaires were distributed, with 77 valid responses received. In accordance with the Self-Rated Health Measurement Scale (SRHMS) requirement that respondents must be at least 14 years old, ineligible individuals were excluded. After further processing of missing values and outliers, a final valid sample of 72 responses meeting the research criteria was obtained. This sample covers six communities, with balanced age distribution and reasonable gender proportion, reflecting the overall profile of residents in the target area.

2.2. Measurement

2.2.1. Accessibility

Researchers initially quantified the elements of the built environment using the “3Ds” framework (density, diversity, design). Subsequently, this framework was gradually expanded into the “5Ds” framework, with the addition of destination accessibility and distance to transit, which has been widely adopted in studies on travel behavior and health effects [28,50,51]. Among the dimensions of this framework, density and diversity are more reflective of the characteristics of the overall spatial pattern, rather than the accessibility dimension at the individual level. Therefore, based on the “5Ds” framework, this study selects the accessibility of three dimensions—design, destination, and transportation—as the accessibility indicator system for this research. Specifically, the design dimension includes green space, square, public toilet, community service center, and garbage transfer point; the destination dimension includes hospital and school; and the transportation dimension includes road entrance and bus stop. This measurement system not only aligns with the theoretical development context of accessibility research in built environment studies but also adapts to the actual construction situation of new rural communities.
In terms of measurement methods, this study employed Geographic Information System (GIS) technology to obtain the spatial distance between residents’ addresses and various built environment elements [52,53]. Based on vector maps from the National Platform for Common Geospatial Information Services, combined with facility locations confirmed through field surveys, nine built environment elements were spatially matched with the residential locations of the 72 surveyed samples. Using the Network Analysis tool in ArcMap 10.8, the shortest travel distance from each residence to various facilities was calculated and used as the indicator of accessibility. This approach more accurately reflects actual travel conditions compared to straight-line distance, ensuring the accuracy and comparability of the measurement results.

2.2.2. Self-Rated Health

Residents’ health status was assessed using the Self-Rated Health Measurement Scale (SRHMS). Developed by domestic scholars, the scale draws on internationally recognized health measurement tools, such as the Short Form 36 Health Survey (SF-36) and Medical Outcomes Study scales (MOS), has been adapted to the Chinese context with demonstrated reliability and validity in large-scale surveys [54,55]. The SRHMS consists of three subscales: physical health (170 points), mental health (150 points), and social health (120 points), comprising a total of 10 dimensions and 48 items. This multi-item structure allows a comprehensive assessment of health across multiple levels.
During the survey, participants rated each item based on their personal perception using a scale from 0 to 10, with higher scores indicating better self-rated health. With reference to norm-based results provided in previous studies, the SRHMS serves as a robust tool for measuring overall health status and variations across different health dimensions. Owing to its comprehensive structure and cross-cultural comparability, this study adopted the SRHMS as the core health measure for the dependent variable, providing a reliable basis for examining the relationship between built environment accessibility and multidimensional health outcomes.

2.3. Methods

2.3.1. Research Framework

To systematically analyze the relationship between built environment accessibility and self-rated health in new rural communities, this study developed a stepwise analytical framework (Figure 2). First, questionnaire surveys and field investigations were conducted to collect residents’ health data and spatial data on the built environment. Second, GIS-based network analysis was used to measure accessibility indicators from residences to various facilities, while the SRHMS was applied to quantify health levels. For the processing of the dependent variable, the SRHMS scores were transformed from continuous variables into categorical variables using three distinct cutoff methods—mean, median, and mid-range—to compare model performance across classification strategies. In terms of statistical analysis, the Gradient Boosted Decision Trees (GBDT) model was introduced to capture nonlinear relationships, supplemented by the SHapley Additive exPlanations (SHAP) method to enhance model interpretability and reveal the marginal contributions of accessibility to different built environment elements. Finally, based on the model results, design and planning recommendations were proposed for health-oriented spatial optimization in new rural communities. This framework not only overcomes limitations of traditional linear approaches but also helps elucidate the mechanisms through which complex environmental factors influence multidimensional health outcomes.

2.3.2. GBDT

This study employs a Gradient Boosting (GB) framework with Decision Trees as base learners, i.e., a Gradient Boosted Decision Trees (GBDT) model. GBDT is an ensemble learning method based on the boosting principle. It sequentially trains multiple weak learners (typically regression trees), where each iteration fits a new weak learner to the residual errors from the previous round, thereby minimizing the value of the loss function [56]. The core idea is to iteratively optimize the following objective:
F m x = F m 1 x + ν γ m h m x
where F m x denotes the model at the m -th iteration, h m x is the regression tree fitted to the residual errors; γ m represents the optimal step size, and ν is the learning rate.
The residuals are given by the negative gradient:
r i m = L y i , F x i F x i F = F m 1
where r i m denotes the residual of sample i at the m -th iteration, L y i , F x i is the loss function that quantifies the discrepancy between the predicted and true values, F x i represents the predicted value of sample i , and F m 1 refers to the model obtained from the ( m 1 ) -th iteration.
The GBDT model effectively captures complex nonlinear relationships and handles high-dimensional feature data, with relatively flexible requirements regarding variable distribution and scale. It can simultaneously process both numerical and categorical features, offering strong applicability. The model also demonstrates excellent generalization performance. By tuning hyperparameters such as the learning rate, base learner depth, and number of iterations, it achieves a balance between bias and variance, thereby improving prediction stability. In studying health issues in new rural communities, nonlinear associations and interaction effects often exist between the built environment and health outcomes. The GBDT model is capable of capturing such complex relationships more comprehensively, making it particularly suitable for research contexts with limited sample sizes but numerous features. In this study, the GBDT model was implemented using the Scikit-learn library (version 1.2.2, Python 3.10). Key hyperparameters were optimized through five-fold cross-validation and grid search, with the Area Under the Curve (AUC) used as the evaluation metric to ensure model robustness and predictive accuracy.

2.3.3. SHAP

While the GBDT model demonstrates significant advantages in predictive accuracy, its “black box” nature limits intuitive understanding of causal mechanisms. To enhance the interpretability of the model, this study introduces SHAP (SHapley Additive exPlanations), a method rooted in cooperative game theory that leverages Shapley values. By quantifying the marginal contribution of each feature to the prediction outcome across all possible feature subsets, SHAP assigns importance scores to features and indicates the direction (positive or negative) of their effects. The Shapley value is computed as follows:
f x = ϕ 0 + j = 1 p ϕ j
where ϕ 0 is the mean prediction value across all samples, and ϕ j denotes the contribution of feature j to the prediction outcome.
The Shapley value is calculated as follows:
ϕ j = S N { j } S ! p S 1 ! p ! f S { j } x S { j } f S x S
where N represents the entire set of features, S denotes a subset of features excluding j , and f S is the prediction based on feature subset S .
The SHAP method has two major theoretical advantages, namely consistency and local accuracy. It can simultaneously provide both global feature importance rankings and local explanations for individual predictions. In this study, SHAP analysis was conducted using the SHAP package (version 0.41.0, Python 3.10). This method was employed not only to identify the built environment and personal attribute variables that contribute most to predicting residents’ self-rated health but also to reveal nonlinear relationships and threshold effects between different features and health outcomes. This approach offered robust data support for result interpretation and the formulation of health-oriented design strategies [57].

3. Results

3.1. Model Comparison

Prior to formal analysis, this study compared the performance of three classification methods for SRHMS health data—mean, median, and mid-range (Table 2, Table 3 and Table 4). Overall, the classification approaches showed significant differences in model performance. The mid-range classification achieved the highest AUC (0.8846) in the social health dimension, with near-perfect accuracy and recall. However, it performed poorly in both comprehensive health (AUC = 0.5139) and physical health (AUC = 0.3056), indicating limited model stability. The median classification also yielded suboptimal results overall: while the mental health model achieved an acceptable AUC (0.6161), performance in other dimensions was close to random level. In contrast, the mean classification demonstrated the most robust overall performance. It performed notably well in both comprehensive health (AUC = 0.7407) and physical health (AUC = 0.703). Although the mental health model had relatively low recall, its AUC (0.6852) still surpassed those obtained with other methods. Only in the social health dimension did this method show limited explanatory power (AUC = 0.5000), suggesting that built environment accessibility offers little predictive insight for this aspect of health. In summary, the mean classification exhibited clear advantages in predicting overall and physical health, with relatively balanced performance across dimensions. Therefore, all subsequent results and discussions in this paper are based on the mean classification approach.

3.2. Overall Model Performance Evaluation

Based on the mean-based classification results, this study constructed four GB classification models targeting comprehensive self-rated health, self-rated physical health, self-rated mental health, and self-rated social health, respectively (Table 4). The comprehensive self-rated health model achieved an AUC value of 0.7407, an overall accuracy of 0.6667, precision and recall values of 0.7500 and 0.6667, respectively, and an F1-score of 0.7059, indicating strong discriminative ability and a balanced performance between precision and recall in predicting overall health levels. The self-rated physical health model attained an AUC value of 0.7037 and an accuracy of 0.6667. Its recall (0.7778) was higher than its precision (0.7000), suggesting a relative advantage in identifying individuals with poorer physical health, though with slightly lower precision compared to the comprehensive health model. The self-rated mental health model demonstrated relatively weaker performance, with an AUC value of 0.6852, an accuracy of 0.5333, a precision of 0.7500, but a recall of only 0.3333, resulting in a low F1-score (0.4615). This indicates that while the model effectively identified individuals predicted as healthy, its ability to detect those with poorer mental health was limited. The self-rated social health model yielded an AUC value of only 0.5000, approaching random classification performance. However, its recall reached 0.8889, indicating a tendency to predict most samples as healthy, which consequently reduced its precision (0.6154). The F1-score was 0.7273.
In summary, the comprehensive self-rated health and self-rated physical health models exhibited the best performance in distinguishing different health statuses, followed by the self-rated mental health model. The low AUC value of the social health model suggests that built environment and personal attribute features contributed limited predictive power for this dimension. Therefore, to ensure the reliability of the results, subsequent analyses will focus only on the first three health dimensions—comprehensive health, physical health, and mental health—for SHAP-based feature importance and local interpretation.

3.3. Self-Rated Health

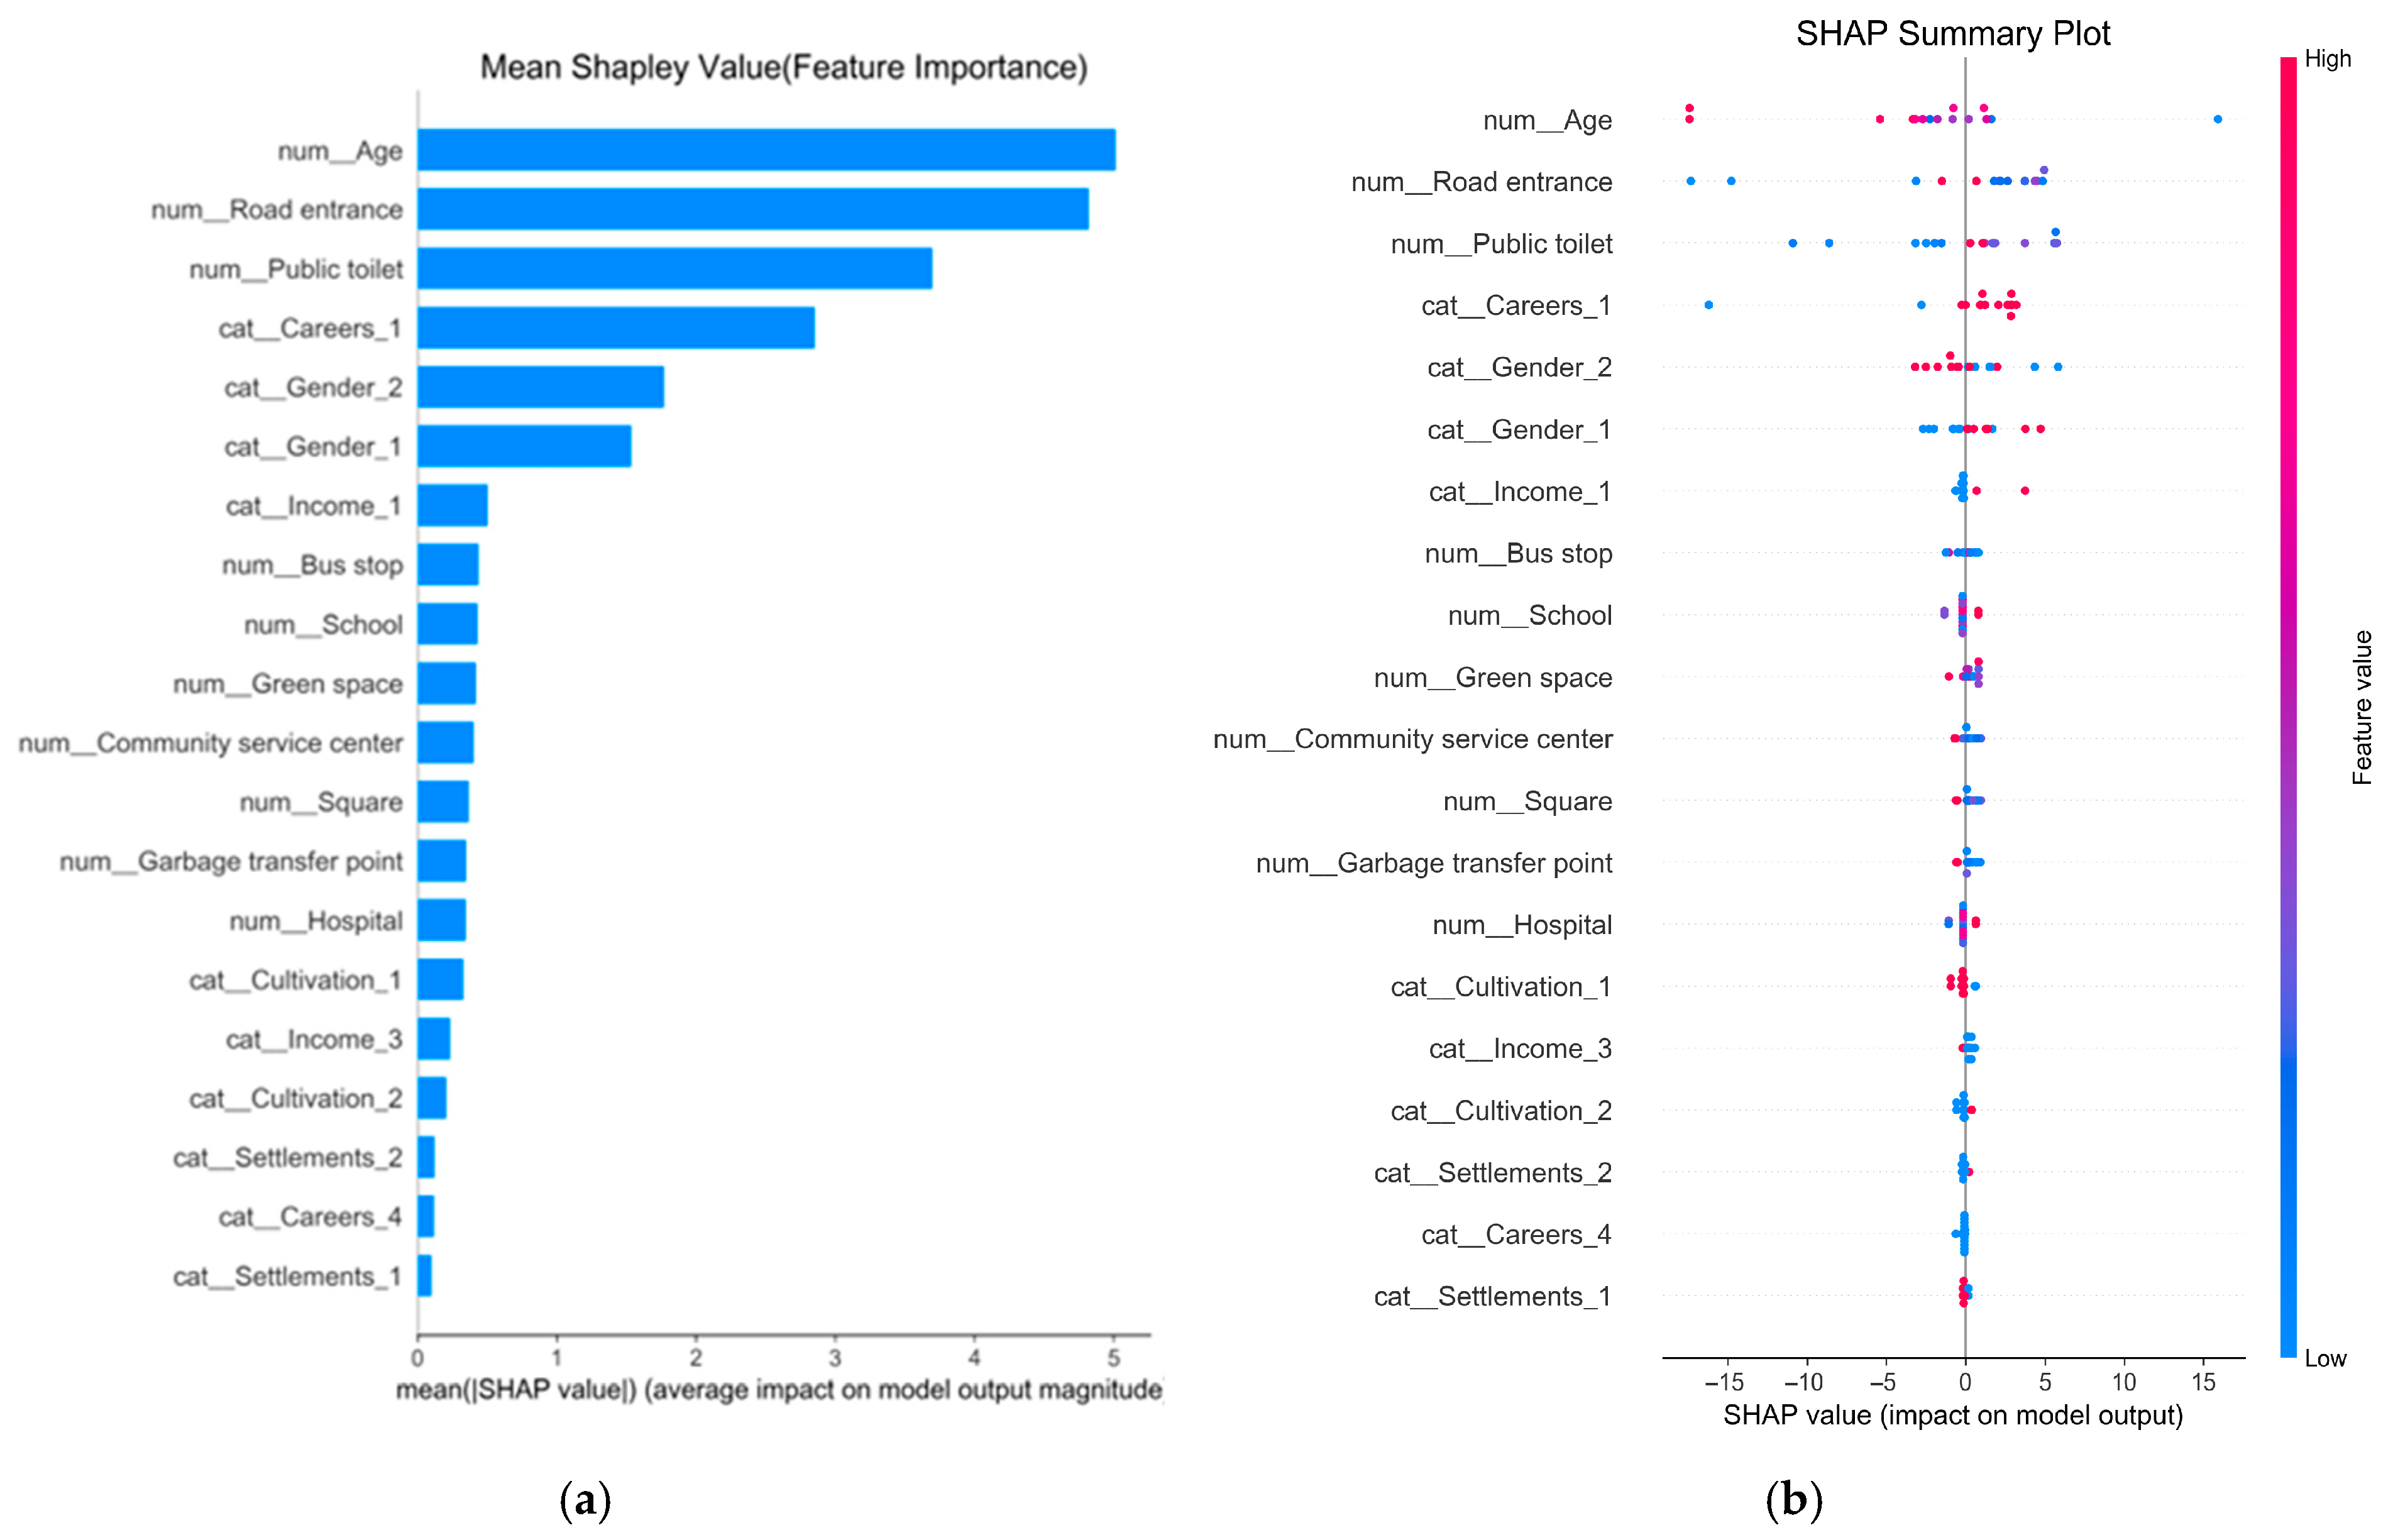
The comprehensive health model demonstrated the best predictive performance (AUC = 0.7407, F1 = 0.7059). The SHAP summary plot revealed that the three most important features were, in descending order: age (num_Age) has the highest mean|SHAP|value (5.01), and its mean SHAP value is significantly negative (−2.32). This indicates that age growth is highly correlated with self-rated health, showing a negative correlation. In the beeswarm plot, older individuals (red dots) were almost entirely distributed in the negative SHAP value region (−5 to 0), while younger individuals (blue dots) were located in the positive region, further confirming this trend. Distance to road entrance ranked second in importance (mean|SHAP| = 4.82). Although its overall mean SHAP value was close to zero, its impact was asymmetrical: most high-distance values showed no significant positive effect, while low-distance samples exhibited clear negative contributions (−10 to −15), suggesting that transportation convenience may come with noise and pollution risks. Distance to public toilet ranked third (mean|SHAP| = 3.70), showing a “closer-negative, farther-positive” pattern: samples closer to public toilet mostly had negative SHAP values, while those farther away showed partial positive contributions. Additionally, individuals identified as farmers (cat_Careers_1) almost entirely fell within the positive region, indicating a tendency toward better self-rated health in this group. The gender variable showed a divergent pattern: most males (cat_Gender_1) were located in the positive region, while females (cat_Gender_2) were concentrated in the negative region. Other environmental factors, such as distance to bus stop, school, and green space, ranked lower but still showed certain marginal contributions (Table 5, Figure 3).

3.4. Self-Rated Physical Health

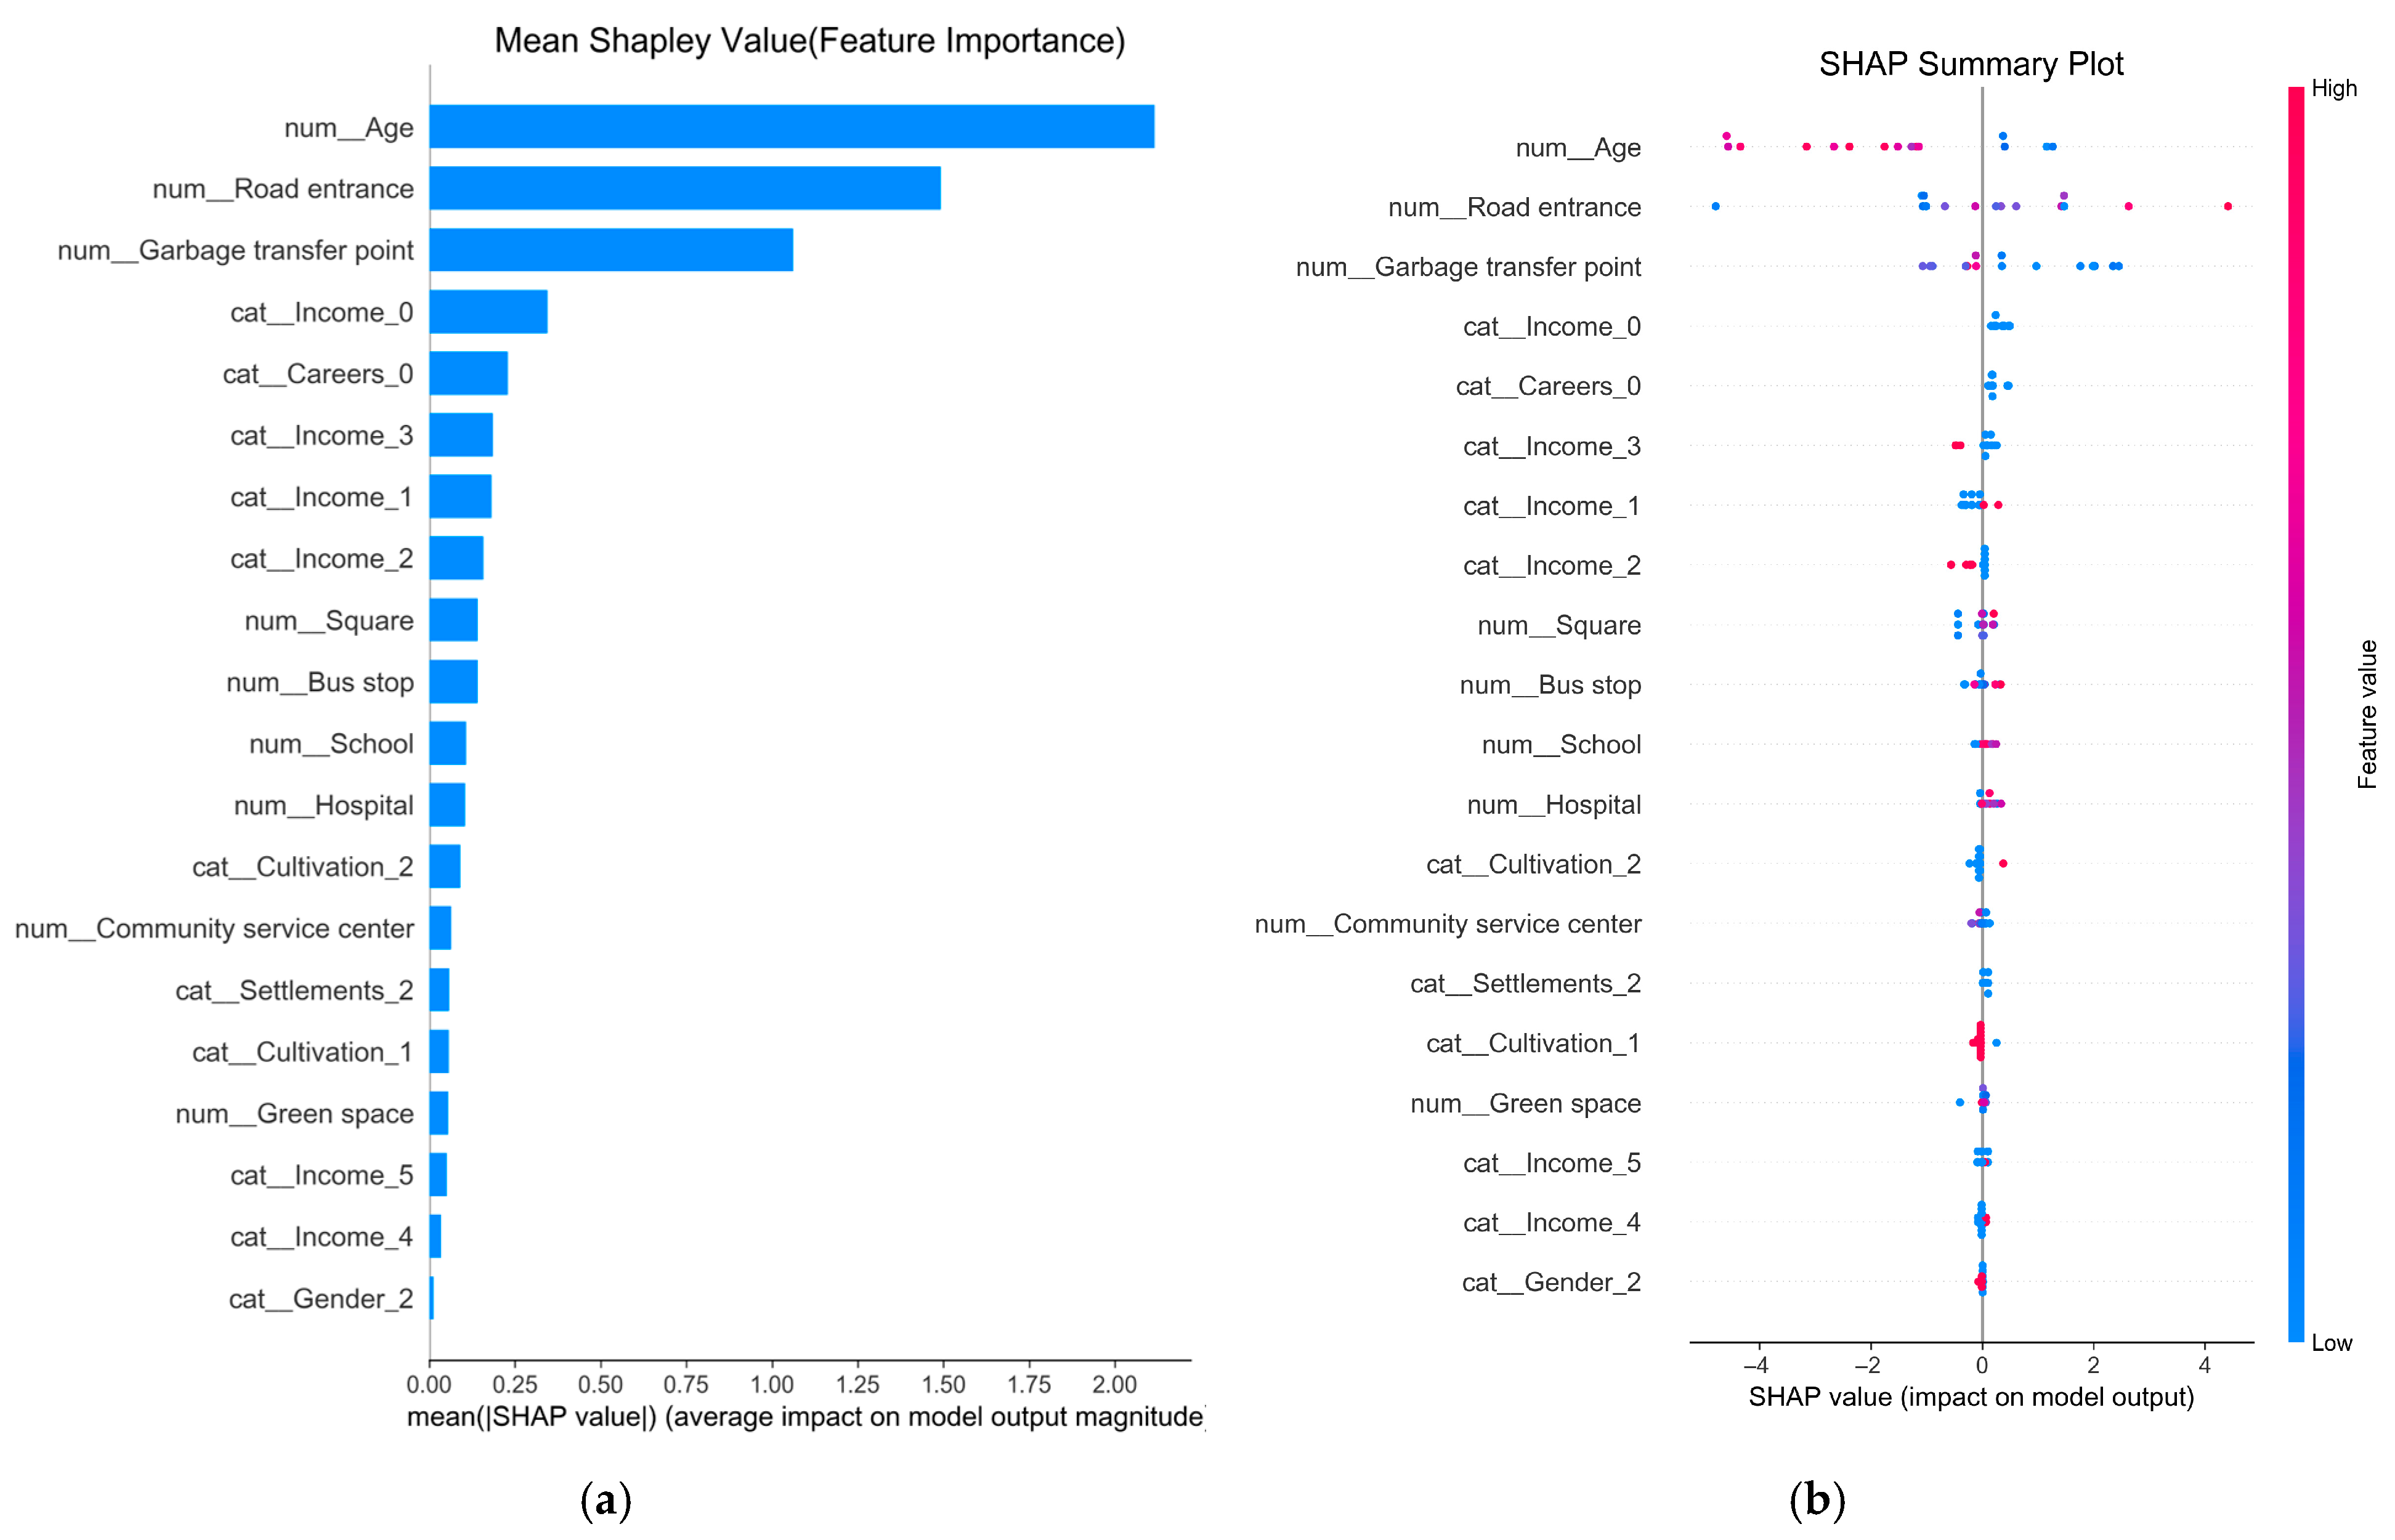
The physical health model demonstrated performance close to that of the comprehensive health model (AUC = 0.7037, F1 = 0.7368). SHAP analysis identified age, distance to road entrance, and distance to garbage transfer point as the top three most influential features. Age remained the most important negative predictor (mean|SHAP| = 2.12). Older individuals were concentrated in the negative SHAP value region (−5 to −1) in the beeswarm plot, while younger individuals were distributed in the positive region (0 to 1), consistent with the trend observed in the comprehensive health model. Distance to road entrance ranked second in importance (mean|SHAP| = 1.49), with an overall positive mean SHAP value. The beeswarm plot showed that individuals living farther from road entrance were more likely to be predicted as healthy, whereas those living closer were concentrated in the negative region, indicating adverse effects of traffic-related environmental exposure on physical health. Distance to garbage transfer point ranked third (mean|SHAP| = 1.06). Higher distances (farther) showed positive contributions, while lower distances (closer) exhibited negative impacts, suggesting that greater distance from garbage transfer point may improve physical health, potentially due to better environmental hygiene conditions. Variables related to income level and occupation type also ranked among the top ten in importance, highlighting the significant role of socioeconomic status (SES) in physical health. Other factors, such as distance to square and bus stop, showed lower contributions but may still indirectly support health by promoting physical activity and social interaction (Table 6, Figure 4).

3.5. Self-Rated Mental Health

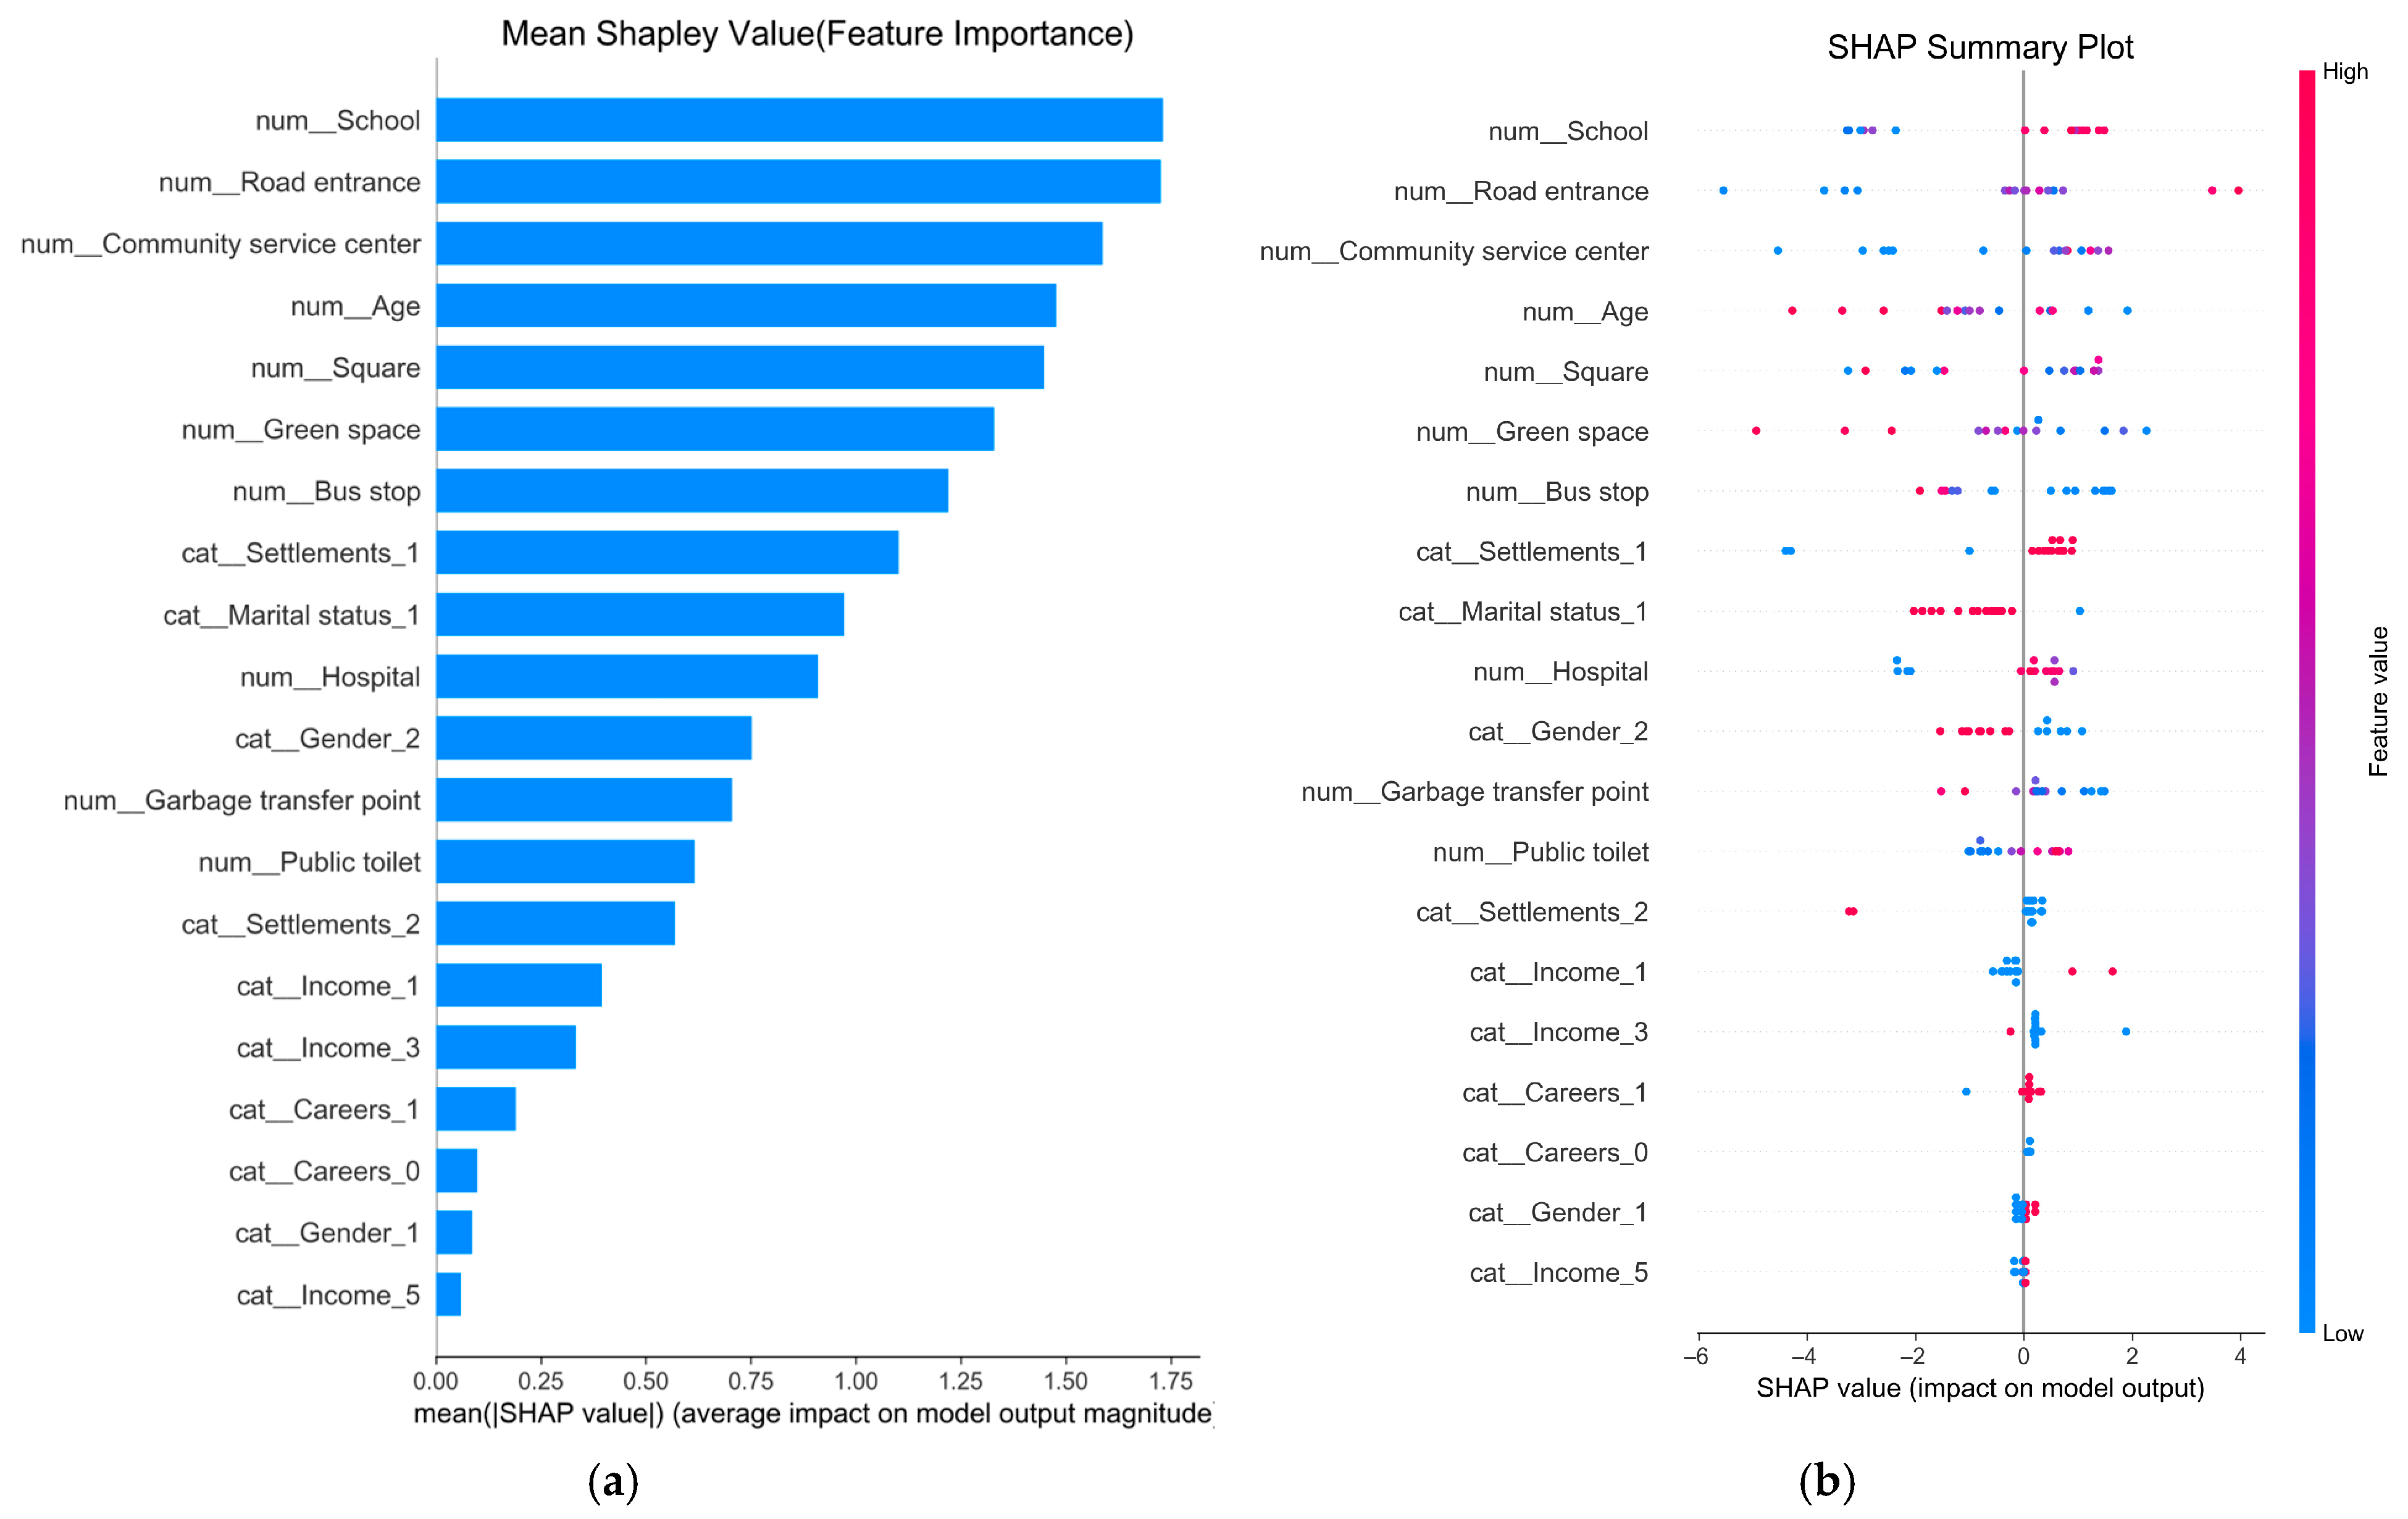
The mental health model demonstrated relatively lower overall performance (AUC = 0.6852, F1 = 0.4615), yet SHAP results revealed several key influencing factors. Distance to school, road entrance, and community service center ranked as the top three predictors, all exhibiting negative directional effects. Both distance to school and road entrance showed the highest mean|SHAP| values (1.73). The beeswarm plot indicated that samples located closer to schools were concentrated in the negative SHAP value region (−2 to −4), while those farther away mostly exhibited positive values (0 to 2.5). Similarly, for road entrance, samples with lower distance (closer proximity) were clustered in the negative region (−6 to −3), suggesting that proximity to roads is associated with poorer mental health. Distance to community service center ranked third (mean|SHAP| = 1.59). The beeswarm plot revealed that lower distance (closer proximity) often corresponded to negative SHAP values, while higher distances (farther away) showed positive contributions, indicating that proximity to public service facilities may, in certain contexts, contribute to psychological stress. Age remained a negative predictor in mental health outcomes, with older residents concentrated in strongly negative regions (−3 to −5) and younger individuals distributed in positive regions (0 to 1.5). The effects of distance to public squares and green space exhibited nonlinear patterns: both excessively close and excessively far distances were associated with negative contributions. Sociodemographic characteristics such as marital status and settlement status also ranked among the top ten important features, highlighting the role of social support networks in mental health (Table 7, Figure 5).

3.6. Self-Rated Social Health

The social health model demonstrated the weakest predictive performance (AUC = 0.5000, approaching random classification levels), suggesting that built environment accessibility plays a limited role in explaining social health outcomes. SHAP summary results indicated that distance to road entrance and community service center ranked as the top two features, yet their mean contribution values were low, reflecting overall limited explanatory power. Other variables, such as age, distance to public square, bus stop proximity, and occupation type, also appeared among the top ten features but exhibited negligible marginal effects. Overall, social health is more likely driven by social relationships, community interactions, and cultural factors rather than physical built environment characteristics.

4. Discussion

4.1. Key Findings and Interpretation

Based on an empirical analysis of new rural communities in Pujiang County, Chengdu, this study combined GIS-measured accessibility data of nine built environment elements with self-rated health measurements, employing both GBDT modeling and SHAP interpretation methods. The research revealed that the accessibility of road entrance, public toilet, garbage transfer point, school, and community service shows a negative correlation with residents’ health, though their performance varies across different health dimensions. In contrast, social health can hardly be explained by physical accessibility. The following discussion will be conducted based on model results, survey findings, and existing research.

4.1.1. Relationship Between Road Entrance and Health

The findings indicate that accessibility to road entrance is an important variable the dimensions of comprehensive health, physical health, and mental health, though its effects vary in direction and magnitude. In the comprehensive health dimension, SHAP local interpretation shows that residents living close to roads exhibit a significant negative effect in some cases, which suggests that road traffic noise, exhaust pollution, and safety risks may exert adverse impacts on residents’ health [58]. This duality was further confirmed in the physical health model: residents living farther from road entrance reported higher self-rated physical health, implying that the adverse effects of environmental exposure outweigh the advantages of travel convenience. In the mental health dimension, proximity to road entrance exhibited even stronger negative effects, likely due to noise disturbance, traffic congestion, and safety concerns [59,60]. In new rural communities, it is recommended to guarantee fundamental transportation accessibility while introducing micro-level design interventions such as green buffers, noise control measures, traffic calming, and carefully planned entrance and exit points [61,62]. At the same time, macro-level strategies like relocating main access routes away from residential clusters and distributing traffic nodes more evenly should be adopted. Together, these integrated approaches can balance convenience with potential health risks, enhancing the benefits of accessibility while reducing negative environmental impacts.

4.1.2. Relationship Between Environmental Sanitation Facility and Health

Both the comprehensive health and physical health models indicate a significant negative correlation between environmental sanitation facilities—such as public toilet and garbage transfer point—and residents’ health outcomes. Specifically, proximity to public toilet was associated with lower comprehensive health levels, while closeness to garbage transfer point reduced physical health ratings. This suggests that although such facilities are essential for community functioning, their NIMBY effects cannot be overlooked [63]. Prolonged exposure to unpleasant odors, pest breeding, unclean environments, and potential pathogen risks contribute to negative health perceptions among residents. This finding is consistent with existing studies, which highlight that environmental sanitation facilities often cause resident dissatisfaction due to noise, odor, and visual pollution—factors that in turn adversely affect health perceptions [64,65,66]. Similarly, relevant research has found that residents living in close proximity to waste disposal facilities report significantly poorer self-rated health than those residing farther away [49,67]. These results suggest that in the planning of rural communities, the siting of sanitation facilities should not only take service coverage into account but also integrate buffer zones or strengthened environmental management measures, from a health-sensitive perspective.

4.1.3. Relationship Between Public Service Facility and Health

In the mental health model, the negative contributions of proximity to schools and community service center suggest that while educational and public service facilities provide essential social functions, they may also impose environmental pressures—including noise, congestion, and high-frequency activities—that adversely affect residents’ psychological well-being. This effect may be particularly pronounced in communities with a higher proportion of elderly residents or greater demand for quiet living environments, where time-specific usage patterns can cause short-term high-intensity disturbances, thereby negatively influencing mental health assessments [58,68,69,70]. This finding highlights the need to balance accessibility with environmental mitigation in public service facility planning. Design-stage interventions—such as time-based traffic management, separate entrance and exit routes, activity buffer zones, and neighborhood communication mechanisms—should be introduced to reduce negative externalities for surrounding residents. The conclusion underscores the importance of integrating accessibility research with environmental quality and spatiotemporal usage patterns.

4.1.4. Social Health Cannot Be Adequately Explained by Physical Accessibility

The social health model achieved an AUC of only 0.5, indicating almost no predictive power, which implies that physical accessibility of the built environment contributes minimally to social health outcomes. Field survey results revealed that many residents considered “quality of neighborhood relationships” and “availability of collective activities” more important than the proximity to facilities. For instance, in two communities with similar levels of facility accessibility, one exhibited strong social cohesion due to residents’ active participation in group dancing and volunteer services, while the other showed poorer social health outcomes resulting from insufficient neighborly interaction. This finding confirms that social health relies more heavily on social capital and cultural activities rather than spatial accessibility alone.
It aligns with existing research, which emphasizes that the core of social health lies in community cohesion and interpersonal networks [71,72]. Relevant studies focusing on the elderly population have also confirmed that social health is more strongly shaped by neighborhood support and residents’ participation than by the accessibility of physical facilities [73,74,75]. The results of this study further build on these insights, highlighting that in new rural communities, improving social health does not rely solely on optimizing the spatial distribution of facilities; instead, the key lies in creating platforms for residents to interact and fostering a lively community culture.

4.2. Policy Implications

The findings of this study reveal that the accessibility of the built environment in new rural communities exerts both positive and negative effects on residents’ health, underscoring the need for health-oriented planning that balances convenience and risk mitigation. In terms of transportation infrastructure, while proximity to road entrance improves travel and medical access, it also increases exposure to noise, vehicle emissions, and safety hazards. This suggests that road layout should be optimized by relocating entrance appropriately and introducing green buffers to reduce environmental disturbances, while maintaining convenient external connectivity. The placement of environmental sanitation facilities also requires improvement. Proximity to public toilet and garbage transfer point was associated with poorer health outcomes, highlighting the pronounced NIMBY effects within compact community layouts. Therefore, such facilities should not be concentrated in core residential areas. Instead, spatial buffering, enclosed design, and enhanced environmental management should be implemented to minimize exposure risks. Public service facilities, such as school and community center, showed dual effects on mental health, indicating that their siting and operation should incorporate measures such as time-based management and traffic flow optimization to prevent convenience from turning into psychological stress. On the other hand, the limited explanatory power of the social health model suggests that improvements in this dimension depend more on social capital and community culture than physical proximity. Thus, the development of new rural communities should not only focus on health-oriented physical spatial provision but also strengthen social connectedness through the creation of vibrant public spaces, cultural and volunteer activities, and community self-governance mechanisms. Integrating physical environments with social interaction will more effectively promote multidimensional health outcomes.

5. Conclusions

This study examined new rural communities in Pujiang County, Chengdu, and systematically revealed the complex mechanisms through which built environment accessibility affects physical, mental, and social health. The analysis was based on residents’ self-rated health measurements and network accessibility indicators of nine built environment elements, using GIS-based shortest-path calculations combined with Gradient Boosting Decision Trees (GBDT) and SHAP interpretability analysis. The key findings include the following: The accessibility of road entrance may have a negative impact on health due to noise, exhaust fumes, and safety hazards, and this impact can be verified in both physical health and mental health dimensions.; environmental sanitation facilities including public toilet and garbage transfer point exhibited clear NIMBY effects when located in close proximity; and variations in social health could not be sufficiently explained by physical accessibility alone and were more dependent on social capital, neighborhood interactions, and governance mechanisms. This study addresses a research gap in empirical studies on the built environment and health in new rural communities. By integrating refined network accessibility metrics with interpretable machine learning methods, it reveals nonlinear and localized effects of environmental factors, providing a methodological contribution and empirical evidence to support replicable evaluation frameworks.
Despite these insights, several limitations remain. First, the limited sample size and single-region focus (Pujiang County) constrain the generalizability and subgroup analysis capabilities of the results. Future studies should expand the sample size and include multi-regional comparisons to enhance external validity. Second, while the GBDT model and SHAP method effectively captured nonlinear relationships and variable importance, they fell short of establishing strict causal mechanisms and did not fully account for spatial dependence. Future research could advance in several directions: data enhancement includes integrating multi-source data such as big mobility data, remote sensing imagery, and health records; in terms of methodological refinement, multi-model cross-validation and causal inference approaches should be adopted to improve robustness; in the aspect of indicator, future research may shift from a purely “distance-oriented” approach to one that incorporates “quality and perception-oriented” metrics to better reflect residents’ actual experiences. Causal and spatial analysis can introduce causal inference frameworks (e.g., instrumental variables or natural experimental designs) and spatial heterogeneity models to strengthen interpretability and mechanism identification.

Author Contributions

Conceptualization, X.Y., C.L. and W.L.; Data curation, K.L.; Funding acquisition, X.Y.; Investigation, X.Y., C.L. and K.L.; Methodology, X.Y., C.L., W.L. and K.L.; Project administration, X.Y.; Software, W.L. and X.H.; Supervision, X.Y. and W.L.; Validation, X.Y.; Visualization, C.L.; Writing—original draft, C.L. and X.H.; Writing—review and editing, X.Y. and W.L. All authors have read and agreed to the published version of the manuscript.

Funding

This research is funded by National Natural Science Foundation of China Youth Science Fund (52008301) and Fundamental Research Funds for the Central Universities (600460051). The former is an important program under the National Natural Science Foundation of China (NSFC) talent projects. It supports young scientific and technological researchers to select their own research topics within the scope of the Foundation, conduct basic research, and develop their ability to independently undertake scientific projects and carry out innovative studies. And the latter is a research start-up fund for newly recruited vocational teachers, which is used to support the research of self initiated research projects. One of the important research contents of the independent project number 600460051 is to provide research funding for the healthy built environment of new rural communities.

Institutional Review Board Statement

The survey in this study has obtained IRB approval under the ethical review approval number WHU-NS-IRB2023007. The approval document is retained for verification and can be provided in full for journal review. This study was conducted strictly in line with the IRB-approved protocol, complying with ethical standards and regulatory requirements to fully protect participants’ rights, interests and privacy.

Data Availability Statement

The data presented in this study are available on request from the corresponding author due to privacy reasons.

Conflicts of Interest

The authors declare that they have no known competing financial interests or personal relationships that could have appeared to influence the work reported in this paper.

Appendix A. Questionnaire on Healthy Development in New Rural Community

Dear Residents,
Greetings!
We are the “Healthy Rural Area Investigation” research team from Wuhan University. Through this questionnaire, we aim to understand your and your village’s basic information. All responses will be used solely for research purposes, and real names will not be recorded. We kindly ask you to answer truthfully. Unless otherwise specified, please select only one option per question by marking √ next to your choice. For open-ended questions, please write your answer on the provided line. Based on the results of this survey on healthy community development, we will propose recommendations for further improving the living environment in your community. We sincerely hope you can provide accurate responses and complete the questionnaire promptly. Thank you very much for your support! Wishing you success in your work and happiness in your family.
Contact Persons:
Li Kehao: 15136819377
Liu Chao: 13129952835
July 2023
I. Individual Characteristics
1. Your gender: __________, Your age: _________ years old, Your occupation:
(1) Farmer (2) Government employee (3) Self-employed individual
(4) Worker (5) Other
2. Your marital status:
(1) Unmarried (2) Married (3) Divorced (4) Widowed
3. The house number of your current residence: Village _________ Number _________
4. Your status:
(1) Local permanent resident (2) Settled non-local resident
5. You have lived in this village for _________ years. Your current primary residence is:
(1) Old family home (2) New rural community (3) Residence in county town or other urban area
6. Your household has _________ members. Last year, your total annual household income was as follows:
(1) <¥50,000 (2) ¥50,000–¥100,000 (3) ¥100,000–¥200,000
(4) >¥200,000
7. Does your household still engage in farmland cultivation?
(1) Yes, still cultivating farmland (2) No, no longer cultivating farmland
II. Self-Rated Health Scale Survey
Instructions:
This scale consists of 48 questions concerning your experiences over the past four weeks. Below each question is a scale divided into 10 increments. Please mark an “×” at the position that best reflects your situation for each item. (Note: Only one “×” per scale.)
Example:
How would you describe your sleep?
Very poor 0–1–2–3–4–5–6–7–8–9–10 Very good
(0: very poor sleep; 10: very good sleep; between 0 and 10: closer to 0 indicates worse sleep, closer to 10 indicates better sleep.)
Questions:
1. How would you describe your eyesight?
Very poor 0–1–2–3–4–5–6–7–8–9–10 Very good
2. How would you describe your hearing?
Very poor 0–1–2–3–4–5–6–7–8–9–10 Very good
3. How would you describe your appetite?
Very poor 0–1–2–3–4–5–6–7–8–9–10 Very good
4. Do you often experience gastrointestinal discomfort (e.g., bloating, diarrhea, constipation)?
Very often 0–1–2–3–4–5–6–7–8–9–10 Never
5. Do you get tired easily?
Very easily 0–1–2–3–4–5–6–7–8–9–10 Not easily
6. How would you describe your sleep?
Very poor 0–1–2–3–4–5–6–7–8–9–10 Very good
7. Do you experience pain of varying intensity?
Very often 0–1–2–3–4–5–6–7–8–9–10 Never
8. Do you have difficulty dressing yourself?
Very difficult 0–1–2–3–4–5–6–7–8–9–10 Not difficult
9. Do you have difficulty grooming yourself?
Very difficult 0–1–2–3–4–5–6–7–8–9–10 Not difficult
10. Do you have difficulty performing daily household chores?
Very difficult 0–1–2–3–4–5–6–7–8–9–10 Not difficult
11. Can you go shopping alone for daily items?
Very difficult 0–1–2–3–4–5–6–7–8–9–10 Not difficult
12. Do you have difficulty eating by yourself?
Very difficult 0–1–2–3–4–5–6–7–8–9–10 Not difficult
13. Do you have difficulty bending or kneeling?
Very difficult 0–1–2–3–4–5–6–7–8–9–10 Not difficult
14. Do you have difficulty climbing up or down at least one flight of stairs?
Very difficult 0–1–2–3–4–5–6–7–8–9–10 Not difficult
15. Do you have difficulty walking half a li (0.25 km)?
Very difficult 0–1–2–3–4–5–6–7–8–9–10 Not difficult
16. Do you have difficulty walking three li (1.5 km)?
Very difficult 0–1–2–3–4–5–6–7–8–9–10 Not difficult
17. Do you have difficulty engaging in high-energy activities (e.g., intense exercise, farm labor, moving heavy objects)?
Very difficult 0–1–2–3–4–5–6–7–8–9–10 Not difficult
18. Overall, how would you rate your physical health compared to your peers?
Much worse 0–1–2–3–4–5–6–7–8–9–10 Much better
19. Do you feel optimistic about the future?
Not at all 0–1–2–3–4–5–6–7–8–9–10 Very much
20. Are you satisfied with your current life situation?
Not at all 0–1–2–3–4–5–6–7–8–9–10 Very much
21. Do you feel confident in yourself?
Not at all 0–1–2–3–4–5–6–7–8–9–10 Very much
22. Do you feel safe in your daily living environment?
Not at all 0–1–2–3–4–5–6–7–8–9–10 Very much
23. Do you feel happy?
Not at all 0–1–2–3–4–5–6–7–8–9–10 Very much
24. Do you feel mentally tense?
Very much 0–1–2–3–4–5–6–7–8–9–10 Not at all
25. Do you feel downhearted or low in spirit?
Very much 0–1–2–3–4–5–6–7–8–9–10 Not at all
26. Do you feel afraid without reason?
Very much 0–1–2–3–4–5–6–7–8–9–10 Not at all
27. Do you repeatedly check things you have done to feel assured?
Very much 0–1–2–3–4–5–6–7–8–9–10 Not at all
28. Do you feel lonely even when you are with others?
Very much 0–1–2–3–4–5–6–7–8–9–10 Not at all
29. Do you feel restless or unsettled?
Very much 0–1–2–3–4–5–6–7–8–9–10 Not at all
30. Do you feel empty, bored, or that life lacks meaning?
Very much 0–1–2–3–4–5–6–7–8–9–10 Not at all
31. How would you describe your memory?
Very poor 0–1–2–3–4–5–6–7–8–9–10 Very good
32. Can you concentrate easily on one task?
Not at all 0–1–2–3–4–5–6–7–8–9–10 Very much
33. How would you describe your ability to think or handle problems?
Not at all 0–1–2–3–4–5–6–7–8–9–10 Very much
34. Overall, how would you rate your mental health?
Very poor 0–1–2–3–4–5–6–7–8–9–10 Very good
35. Can you properly handle unpleasant things that happen in your life, studies, or work?
Not at all 0–1–2–3–4–5–6–7–8–9–10 Very well
36. Can you adapt quickly to new living, learning, or working environments?
Not at all 0–1–2–3–4–5–6–7–8–9–10 Very well
37. How do you evaluate the roles you take in work, study, and life?
Very poorly 0–1–2–3–4–5–6–7–8–9–10 Very well
38. Is your family life harmonious?
Not at all 0–1–2–3–4–5–6–7–8–9–10 Very well
39. Do you have many close colleagues, classmates, neighbors, relatives, or partners?
Very few 0–1–2–3–4–5–6–7–8–9–10 Very many
40. Do you have friends with whom you can share joys and sorrows?
Not at all 0–1–2–3–4–5–6–7–8–9–10 Very much
41. Do you discuss issues with your friends or relatives?
Not at all 0–1–2–3–4–5–6–7–8–9–10 Very often
42. Do you regularly stay in touch with relatives and friends (e.g., visits, phone calls, messages)?
Not at all 0–1–2–3–4–5–6–7–8–9–10 Very often
43. Do you often participate in social or group activities (e.g., party/league gatherings, unions, student associations, religious events, friend meetups, sports, entertainment)?
Not at all 0–1–2–3–4–5–6–7–8–9–10 Very often
44. Can you rely on your family for help when needed?
Not at all 0–1–2–3–4–5–6–7–8–9–10 Very much
45. Can you rely on your friends for help when needed?
Not at all 0–1–2–3–4–5–6–7–8–9–10 Very much
46. When facing difficulties, do you actively seek help from others?
Not at all 0–1–2–3–4–5–6–7–8–9–10 Very much
47. Overall, how would you rate your social functioning (e.g., interpersonal relationships, social interactions) compared to your peers?
Much worse 0–1–2–3–4–5–6–7–8–9–10 Much better
48. Overall, how would you rate your health compared to your peers?
Much worse 0–1–2–3–4–5–6–7–8–9–10 Much better

References

  1. Zang, Y.; Liu, Y.; Yang, Y.; Woods, M.; Fois, F. Rural decline or restructuring? Implications for sustainability transitions in rural China. Land Use Policy 2020, 94, 104531. [Google Scholar] [CrossRef]
  2. Yuan, J.; Lu, Y.; Ferrier, R.C.; Liu, Z.; Su, H.; Meng, J.; Song, S.; Jenkins, A. Urbanization, rural development and environmental health in China. Environ. Dev. 2018, 28, 101–110. [Google Scholar] [CrossRef]
  3. Chen, M.; Zhou, Y.; Huang, X.; Ye, C. The integration of new-type urbanization and rural revitalization strategies in China: Origin, reality and future trends. Land 2021, 10, 207. [Google Scholar] [CrossRef]
  4. Zhang, X.; Brandt, M.; Tong, X.; Ciais, P.; Yue, Y.; Xiao, X.; Zhang, W.; Wang, K.; Fensholt, R. A large but transient carbon sink from urbanization and rural depopulation in China. Nat. Sustain. 2022, 5, 321–328. [Google Scholar] [CrossRef]
  5. Lang, W.; Chen, T.; Li, X. A new style of urbanization in China: Transformation of urban rural communities. Habitat Int. 2016, 55, 1–9. [Google Scholar] [CrossRef]
  6. Zhang, C.; Gong, P. Healthy China: From words to actions. Lancet Public Health 2019, 4, e438–e439. [Google Scholar] [CrossRef]
  7. Zhang, R.; Yuan, Y.; Li, H.; Hu, X. Improving the framework for analyzing community resilience to understand rural revitalization pathways in China. J. Rural Stud. 2022, 94, 287–294. [Google Scholar] [CrossRef]
  8. Rao, M.; Prasad, S.; Adshead, F.; Tissera, H. The built environment and health. Lancet 2007, 370, 1111–1113. [Google Scholar] [CrossRef] [PubMed]
  9. Jackson, L.E. The relationship of urban design to human health and condition. Landsc. Urban Plan. 2003, 64, 191–200. [Google Scholar] [CrossRef]
  10. Jiang, Y.; Long, H.; Ives, C.D.; Deng, W.; Chen, K.; Zhang, Y. Modes and practices of rural vitalisation promoted by land consolidation in a rapidly urbanising China: A perspective of multifunctionality. Habitat Int. 2022, 121, 102514. [Google Scholar] [CrossRef]
  11. Ewing, R.; Cervero, R. Travel and the built environment: A synthesis. Transp. Res. Rec. 2001, 1780, 87–114. [Google Scholar] [CrossRef]
  12. Dannenberg, A.L.; Jackson, R.J.; Frumkin, H.; Schieber, R.A.; Pratt, M.; Kochtitzky, C.; Tilson, H.H. The impact of community design and land-use choices on public health: A scientific research agenda. Am. J. Public Health 2003, 93, 1500–1508. [Google Scholar] [CrossRef]
  13. Hasson, R.; Sallis, J.F.; Coleman, N.; Kaushal, N.; Nocera, V.G.; Keith, N. COVID-19: Implications for physical activity, health disparities, and health equity. Am. J. Lifestyle Med. 2022, 16, 420–433. [Google Scholar] [CrossRef]
  14. Zou, Y.; Wang, D. Differences in the influence of the built environment on physical activities for people with normal weight, overweight, and obesity. Health Place 2024, 90, 103385. [Google Scholar] [CrossRef]
  15. Chen, S.; Bao, Z.; Lou, V. Assessing the impact of the built environment on healthy aging: A gender-oriented Hong Kong study. Environ. Impact Assess. Rev. 2022, 95, 106812. [Google Scholar] [CrossRef]
  16. Dixon, B.N.; Ugwoaba, U.A.; Brockmann, A.N.; Ross, K. Associations between the built environment and dietary intake, physical activity, and obesity: A scoping review of reviews. Obes. Rev. 2021, 22, e13171. [Google Scholar] [CrossRef] [PubMed]
  17. Zhu, W.; Chi, A.; Sun, Y. Physical activity among older Chinese adults living in urban and rural areas: A review. J. Sport Health Sci. 2016, 5, 281–286. [Google Scholar] [CrossRef]
  18. Moreno-Llamas, A.; García-Mayor, J.; De la Cruz-Sánchez, E. Urban–rural differences in perceived environmental opportunities for physical activity: A 2002–2017 time-trend analysis in Europe. Health Promot. Int. 2023, 38, daad087. [Google Scholar] [CrossRef] [PubMed]
  19. Kim, J.; Ahn, C.R.; Nam, Y. The influence of built environment features on crowdsourced physiological responses of pedestrians in neighborhoods. Comput. Environ. Urban Syst. 2019, 75, 161–169. [Google Scholar] [CrossRef]
  20. Lin, L.; Moudon, A.V. Objective versus subjective measures of the built environment, which are most effective in capturing associations with walking? Health Place 2010, 16, 339–348. [Google Scholar] [CrossRef]
  21. Hansen, A.Y.; Umstattd Meyer, M.R.; Lenardson, J.D.; Hartley, D. Built environments and active living in rural and remote areas: A review of the literature. Curr. Obes. Rep. 2015, 4, 484–493. [Google Scholar] [CrossRef]
  22. Paquet, C.; Orschulok, T.P.; Coffee, N.T.; Howard, N.J.; Hugo, G.; Taylor, A.W.; Adams, R.J.; Daniel, M. Are accessibility and characteristics of public open spaces associated with a better cardiometabolic health? Landsc. Urban Plan. 2013, 118, 70–78. [Google Scholar] [CrossRef]
  23. Zhang, R.; Zhang, C.Q.; Rhodes, R.E. The pathways linking objectively-measured greenspace exposure and mental health: A systematic review of observational studies. Environ. Res. 2021, 198, 111233. [Google Scholar] [CrossRef]
  24. Geary, R.S.; Thompson, D.; Mizen, A.; Akbari, A.; Garrett, J.K.; Rowney, F.M.; Watkins, A.; Lyons, R.A.; Stratton, G.; Lovell, R.; et al. Ambient greenness, access to local green spaces, and subsequent mental health: A 10-year longitudinal dynamic panel study of 2 3 million adults in Wales. Lancet Planet. Health 2023, 7, e809–e818. [Google Scholar] [CrossRef] [PubMed]
  25. Li, H.; Ta, N.; Yu, B.; Wu, J. Are the accessibility and facility environment of parks associated with mental health? A comparative analysis based on residential areas and workplaces. Landsc. Urban Plan. 2023, 237, 104807. [Google Scholar] [CrossRef]
  26. Høyer-Kruse, J.; Schmidt, E.B.; Hansen, A.F.; Pedersen, M.R.L. The interplay between social environment and opportunities for physical activity within the built environment: A scoping review. BMC Public Health 2024, 24, 2361. [Google Scholar] [CrossRef] [PubMed]
  27. Xu, L.; Han, H.; Yang, C.; Liu, Q. The Influence Mechanism of the Community Subjectively Built Environment on the Physical and Mental Health of Older Adults. Sustainability 2023, 15, 13211. [Google Scholar] [CrossRef]
  28. Giles-Corti, B.; Kelty, S.F.; Zubrick, S.R.; Villanueva, K.P. Encouraging walking for transport and physical activity in children and adolescents: How important is the built environment? Sports Med. 2009, 39, 995–1009. [Google Scholar] [CrossRef]
  29. Cervero, R.; Kockelman, K. Travel demand and the 3Ds: Density, diversity, and design. Transp. Res. Part D Transp. Environ. 1997, 2, 199–219. [Google Scholar] [CrossRef]
  30. Parga, J.P.F.A.; Tiznado-Aitken, I.; Jamal, S.; Farber, S.; Yu, A.; Higgins, C. Perceived accessibility and self-rated health: Examining subjective well-being in the suburbs of Scarborough, Canada. Transp. Res. Part A Policy Pract. 2024, 190, 104261. [Google Scholar] [CrossRef]
  31. Wolff, M. Taking one step further–Advancing the measurement of green and blue area accessibility using spatial network analysis. Ecol. Indic. 2021, 126, 107665. [Google Scholar] [CrossRef]
  32. Yiqiu, Z.; Xinlei, D.; Yajuan, W.; Wenguo, W.; Mingjing, W. GIS-based accessibility analysis of urban park green space landscape. Sci. Rep. 2025, 15, 28498. [Google Scholar] [CrossRef]
  33. Wood, S.M.; Alston, L.; Beks, H.; Namara, K.M.; Coffee, N.T.; Clark, R.A.; Shee, A.W.; Versace, V.L. The application of spatial measures to analyse health service accessibility in Australia: A systematic review and recommendations for future practice. BMC Health Serv. Res. 2023, 23, 330. [Google Scholar] [CrossRef]
  34. Mazzulla, G.; Pirrone, C.G. Accessibility Measures: From a Literature Review to a Classification Framework. ISPRS Int. J. Geo-Inf. 2024, 13, 450. [Google Scholar] [CrossRef]
  35. Maddox, G.L. Self-assessment of health status a longitudinal study of selected elderly subjects. J. Chronic Dis. 1964, 17, 449–460. [Google Scholar] [CrossRef]
  36. Fayers, P.M.; Sprangers, M.A.G. Understanding self-rated health. Lancet 2002, 359, 187–188. [Google Scholar] [CrossRef]
  37. Layes, A.; Asada, Y.; Kephart, G. Whiners and deniers–What does self-rated health measure? Soc. Sci. Med. 2012, 75, 1–9. [Google Scholar] [CrossRef]
  38. Eriksson, I.; Undén, A.L.; Elofsson, S. Self-rated health. Comparisons between three different measures. Results from a population study. Int. J. Epidemiol. 2001, 30, 326–333. [Google Scholar] [CrossRef]
  39. Ye, Y.; Shu, X. Unequal but Widespread Despairs: Social Inequalities and Self-Rated Health Trends in the United States in 1972–2018. Soc. Sci. Med. 2025, 367, 117732. [Google Scholar] [CrossRef] [PubMed]
  40. Levinson, H.S.; Wynn, F.H. Effects of density on urban transportation requirements. Highw. Res. Rec. 1963, 38–64. [Google Scholar]
  41. McCormack, G.R.; Shiell, A. In search of causality: A systematic review of the relationship between the built environment and physical activity among adults. Int. J. Behav. Nutr. Phys. Act. 2011, 8, 125. [Google Scholar] [CrossRef]
  42. McCormack, G.R.; Shiell, A.; Doyle-Baker, P.K.; Friedenreich, C.M.; Sandalack, B.A. Subpopulation differences in the association between neighborhood urban form and neighborhood-based physical activity. Health Place 2014, 28, 109–115. [Google Scholar] [CrossRef]
  43. Wang, M.; Qiu, M.; Chen, M.; Zhang, Y.; Zhang, S.; Wang, L. How does urban green space feature influence physical activity diversity in high-density built environment? An on-site observational study. Urban For. Urban Green. 2021, 62, 127129. [Google Scholar] [CrossRef]
  44. Ramirez, L.K.B.; Hoehner, C.M.; Brownson, R.C.; Cook, R.; Orleans, C.T.; Hollander, M.; Barker, D.C.; Bors, P.; Ewing, R.; Killingsworth, R.; et al. Indicators of activity-friendly communities: An evidence-based consensus process. Am. J. Prev. Med. 2006, 31, 515–524. [Google Scholar]
  45. Pikora, T.; Giles-Corti, B.; Bull, F.; Jamrozik, K.; Donovan, R. Developing a framework for assessment of the environmental determinants of walking and cycling. Soc. Sci. Med. 2003, 56, 1693–1703. [Google Scholar] [CrossRef]
  46. Handy, S.; Cao, X.; Mokhtarian, P. Correlation or causality between the built environment and travel behavior? Evidence from Northern California. Transp. Res. Part D Transp. Environ. 2005, 10, 427–444. [Google Scholar] [CrossRef]
  47. Iacono, M.; Krizek, K.J.; El-Geneidy, A. Measuring non-motorized accessibility: Issues, alternatives, and execution. J. Transp. Geogr. 2010, 18, 133–140. [Google Scholar] [CrossRef]
  48. Han, Y.; Qin, C.; Xiao, L.; Ye, Y. The nonlinear relationships between built environment features and urban street vitality: A data-driven exploration. Environ. Plan. B Urban Anal. City Sci. 2024, 51, 195–215. [Google Scholar] [CrossRef]
  49. Chen, Y.; Zhang, X.; Grekousis, G.; Huang, Y.; Hua, F.; Pan, Z.; Liu, Y. Examining the importance of built and natural environment factors in predicting self-rated health in older adults: An extreme gradient boosting (XGBoost) approach. J. Clean. Prod. 2023, 413, 137432. [Google Scholar] [CrossRef]
  50. Ewing, R.; Greenwald, M.J.; Zhang, M.; Walters, J.; Feldman, M.; Cervero, R.; Thomas, J. Measuring the Impact of Urban Form and Transit Access on Mixed Use Site Trip Generation Rates—Portland Pilot Study; US Environmental Protection Agency: Washington, DC, USA, 2009. [Google Scholar]
  51. Ewing, R.; Cervero, R. Travel and the built environment: A meta-analysis. J. Am. Plan. Assoc. 2010, 76, 265–294. [Google Scholar] [CrossRef]
  52. Brownson, R.C.; Hoehner, C.M.; Day, K.; Forsyth, A.; Sallis, J.F. Measuring the built environment for physical activity: State of the science. Am. J. Prev. Med. 2009, 36, S99–S123.e12. [Google Scholar] [CrossRef]
  53. Zhang, C.J.P.; Barnett, A.; Ming, W.K.; Lai, P.C.; Lee, R.S.; Cerin, E. How urban environments affect quality of life in older socio-demographic groups: The role of physical activity behaviour. In Handbook of Quality of Life Research; Edward Elgar Publishing: Cheltenham, UK, 2024; pp. 355–371. [Google Scholar]
  54. Xu, J.; Xie, Y.; Li, B.; Hu, M. The study of validity on self-rated health measurement scale-the revised version 1.0. Chin. J. Clin. Rehab. 2002, 6, 2082–2085. [Google Scholar]
  55. Xu, J.; Zhang, J.; Feng, L.; Qiu, J. Self-rated health of population in southern China: Association with socio-demographic characteristics measured with multiple-item self-rated health measurement scale. BMC Public Health 2010, 10, 393. [Google Scholar] [CrossRef]
  56. Friedman, J.H. Greedy function approximation: A gradient boosting machine. Ann. Stat. 2001, 29, 1189–1232. [Google Scholar] [CrossRef]
  57. Lundberg, S.M.; Lee, S.I. A unified approach to interpreting model predictions. Adv. Neural Inf. Process. Syst. 2017, 30, 4768–4777. [Google Scholar]
  58. Pun, V.C.; Manjourides, J.; Suh, H.H. Close proximity to roadway and urbanicity associated with mental ill-health in older adults. Sci. Total Environ. 2019, 658, 854–860. [Google Scholar] [CrossRef]
  59. Dzhambov, A.; Tilov, B.; Markevych, I.; Dimitrova, D. Residential road traffic noise and general mental health in youth: The role of noise annoyance, neighborhood restorative quality, physical activity, and social cohesion as potential mediators. Environ. Int. 2017, 109, 1–9. [Google Scholar] [CrossRef]
  60. Conceição, M.A.; Monteiro, M.M.; Kasraian, D.; Berg, P.; Haustein, S.; Alves, I.; Azevedo, C.L.; Miranda, L. The effect of transport infrastructure, congestion and reliability on mental wellbeing: A systematic review of empirical studies. Transp. Rev. 2023, 43, 264–302. [Google Scholar] [CrossRef]
  61. Silva, C.; Xue, S. Situating spatial determinism in urban design and planning for sustainable walkability: A simulation of street morphology and pedestrian behaviour. Discov. Sustain. 2024, 5, 212. [Google Scholar] [CrossRef]
  62. Goel, R.; Tiwari, G.; Varghese, M.; Bhalla, K.; Agrawal, G.; Saini, G.; Jha, A.; John, D.; Saran, A.; White, D.; et al. Effectiveness of road safety interventions: An evidence and gap map. Campbell Syst. Rev. 2024, 20, e1367. [Google Scholar] [CrossRef]
  63. Wang, Y.; Shen, C.; Bartsch, K.; Zuo, J. Exploring the trade-off between benefit and risk perception of NIMBY facility: A social cognitive theory model. Environ. Impact Assess. Rev. 2021, 87, 106555. [Google Scholar] [CrossRef]
  64. Sun, W.; Wu, Y.; Wang, L.; Li, X.; Guo, Q.; Hu, Z. Associations between environmental perception and self-rated health in the city hierarchy of China: Findings from a national cross-sectional survey. Soc. Sci. Med. 2024, 348, 116785. [Google Scholar] [CrossRef]
  65. Braubach, M. Residential conditions and their impact on residential environment satisfaction and health: Results of the WHO large analysis and review of European housing and health status (LARES) study. Int. J. Environ. Pollut. 2007, 30, 384–403. [Google Scholar] [CrossRef]
  66. Lin, Y.; Fu, H.; Zhong, Q.; Zuo, Z.; Chen, S.; He, Z.; Zhang, H. The influencing mechanism of the communities’ built environment on residents’ subjective well-being: A case study of Beijing. Land 2024, 13, 793. [Google Scholar] [CrossRef]
  67. Honold, J.; Beyer, R.; Lakes, T.; Meer, E. Multiple environmental burdens and neighborhood-related health of city residents. J. Environ. Psychol. 2012, 32, 305–317. [Google Scholar] [CrossRef]
  68. Thornton, L.E.; Pearce, J.R.; Kavanagh, A.M. Using Geographic Information Systems (GIS) to assess the role of the built environment in influencing obesity: A glossary. Int. J. Behav. Nutr. Phys. Act. 2011, 8, 71. [Google Scholar] [CrossRef]
  69. Dinwiddie, G.Y.; Gaskin, D.J.; Chan, K.S.; Norrington, J.; McCleary, R. Residential segregation, geographic proximity and type of services used: Evidence for racial/ethnic disparities in mental health. Soc. Sci. Med. 2013, 80, 67–75. [Google Scholar] [CrossRef]
  70. Van Cauwenberg, J.; Van Holle, V.; Simons, D.; Deridder, R.; Clarys, P.; Goubert, P.; Nasar, J.; Salmon, J.; Bourdeaudhuij, I.D.; Deforche, B. Environmental factors influencing older adults’ walking for transportation: A study using walk-along interviews. Int. J. Behav. Nutr. Phys. Act. 2012, 9, 85. [Google Scholar] [CrossRef]
  71. Wakefield, S.E.L.; Poland, B. Family, friend or foe? Critical reflections on the relevance and role of social capital in health promotion and community development. Soc. Sci. Med. 2005, 60, 2819–2832. [Google Scholar] [CrossRef]
  72. Carrasco, M.A.; Bilal, U. A sign of the times: To have or to be? Social capital or social cohesion? Soc. Sci. Med. 2016, 159, 127–131. [Google Scholar] [CrossRef] [PubMed]
  73. Yen, I.H.; Michael, Y.L.; Perdue, L. Neighborhood environment in studies of health of older adults: A systematic review. Am. J. Prev. Med. 2009, 37, 455–463. [Google Scholar] [CrossRef]
  74. Chatterji, S.; Byles, J.; Cutler, D.; Seeman, T.; Verdes, E. Health, functioning, and disability in older adults—Present status and future implications. Lancet 2015, 385, 563–575. [Google Scholar] [CrossRef]
  75. Keating, N. A research framework for the United Nations Decade of Healthy Ageing (2021–2030). Eur. J. Ageing 2022, 19, 775–787. [Google Scholar] [CrossRef]
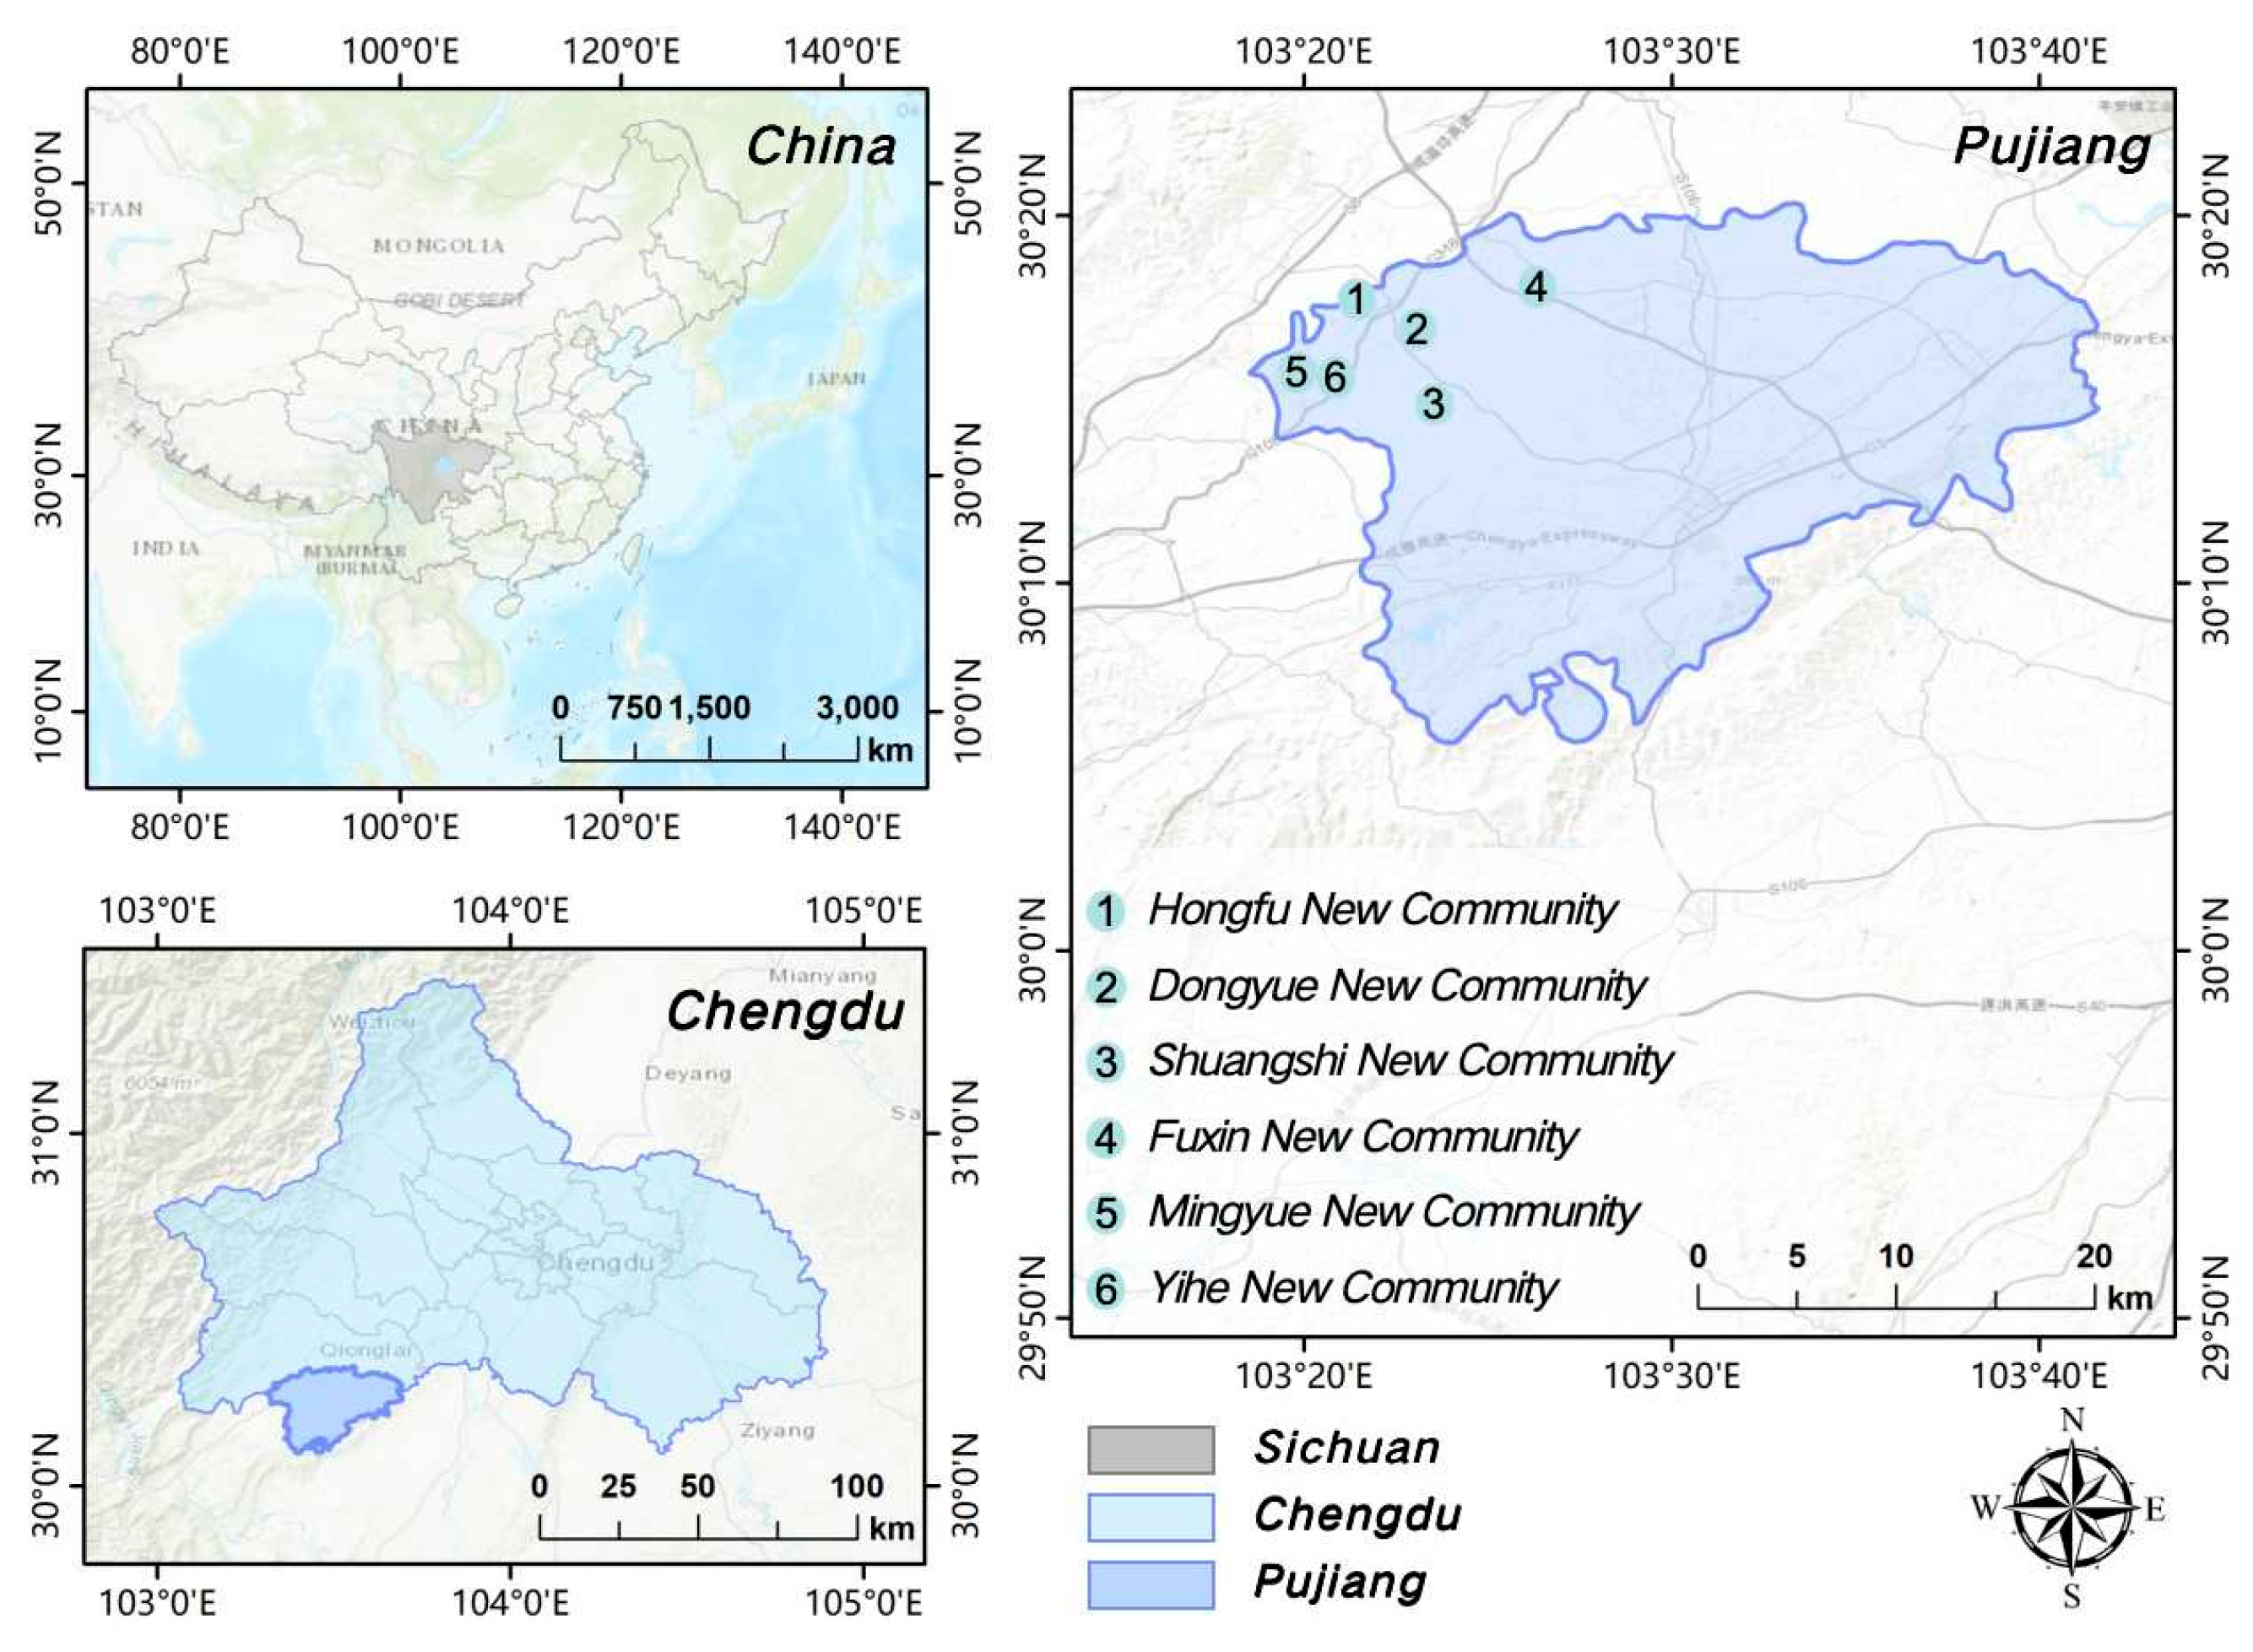
Figure 1. Map of the study area.
Land 14 01867 g001
Figure 2. Path of research on the correlation between the accessibility of built environment elements and residents’ self-rated health in new rural communities.
Land 14 01867 g002
Figure 3. (a) SHAP feature importance bar plot for Self-Rated Health; (b) SHAP beeswarm plot for self-rated health.
Land 14 01867 g003
Figure 4. (a) SHAP feature importance bar plot for Self-Rated Physical Health; (b) SHAP beeswarm plot for self-rated physical health.
Land 14 01867 g004
Figure 5. (a) SHAP feature importance bar plot for Self-Rated Mental Health; (b) SHAP beeswarm plot for self-rated mental health.
Land 14 01867 g005
Table 1. Coding Scheme of Demographic Characteristics.
VariablesCodeDefinition
Gender1Male
2Female
Age--
Career1peasants
2government official
3individual businesses
4workers
Marital status1married
2unmarried
3divorcee
4bereaved of one’s spouse
Settlement1Living in a rural community
2Living in a rural community or county
Income1<50,000 CNY
250,000 CNY–100,000 CNY
3100,000 CNY–200,000 CNY
4>200,000 CNY
Cultivation1Still engaged in farming activities
2Not engaged in farming activities
Missing values were coded as 0.
Table 2. Comparison of Model Performance under Mid-Range Classification.
AUCAccuracyPrecisionRecallF1-Score
Self-rated Health0.51390.73330.78570.91670.8462
Self-rated Physical Health0.30560.60000.75000.75000.7500
Self-rated Mental Health0.43180.66670.71430.90910.8000
Self-rated Social Health0.88460.93330.92861.00000.9630
Table 3. Comparison of Model Performance under Median-based Classification.
AUCAccuracyPrecisionRecallF1-Score
Self-rated Health 0.51790.46670.44440.57140.5000
Self-rated Physical Health0.37500.40000.25000.14290.1818
Self-rated Mental Health0.61610.66670.62500.71430.6667
Self-rated Social Health0.58930.60000.57140.57140.5714
Table 4. Comparison of Model Performance under Mean-based Classification.
AUCAccuracyPrecisionRecallF1-Score
Self-rated Health 0.74070.66670.75000.66670.7059
Self-rated Physical Health0.70370.66670.70000.77780.7368
Self-rated Mental Health0.68520.53330.75000.33330.4615
Self-rated Social Health0.50000.60000.61540.88890.7273
Table 5. SHAP Feature Importance for Self-Rated Health.
Feature NameMean|SHAP|ValueMean SHAP ValueImportance Rank
num__Age5.01−2.321
num__Road entrance4.82−0.072
num__Public toilet3.70−0.113
cat__Careers_12.860.294
cat__Gender_21.770.405
cat__Gender_11.530.296
cat__Income_10.500.097
num__Bus stop0.440.038
num__School0.43−0.229
num__Green space0.420.2510
Table 6. SHAP Feature Importance for Self-Rated Physical Health.
Feature NameMean|SHAP|ValueMean SHAP ValueImportance Rank
num__Age2.12−1.691
num__Road entrance1.490.192
num__Garbage transfer point1.060.573
cat__Income_00.340.344
cat__Careers_00.230.235
cat__Income_30.190.016
cat__Income_10.18−0.147
cat__Income_20.16−0.118
num__Square0.14−0.049
num__Bus stop0.14−0.0110
Table 7. SHAP Feature Importance for Self-Rated Mental Health.
Feature NameMean|SHAP|ValueMean SHAP ValueImportance Rank
num__School1.73−0.621
num__Road entrance1.73−0.462
num__Community service center1.59−0.513
num__Age1.48−0.894
num__Square1.45−0.355
num__Green space1.33−0.436
num__Bus stop1.220.087
cat__Settlements_11.10−0.198
cat__Marital status_10.97−0.839
num__Hospital0.91−0.2810
Disclaimer/Publisher’s Note: The statements, opinions and data contained in all publications are solely those of the individual author(s) and contributor(s) and not of MDPI and/or the editor(s). MDPI and/or the editor(s) disclaim responsibility for any injury to people or property resulting from any ideas, methods, instructions or products referred to in the content.