Abstract
The Yellow River Delta region is not only a concentrated area of human activities in coastal zones, but also a zone strongly influenced by regional environmental changes, where land cover changes are significantly affected by natural factors. Current historical LUCC datasets overlook the importance of partitioning to obtain accurate information on the potential maximum distribution range, which may lead to uncertainties in climate and environmental predictions. This study aims to reconstruct historical cropland changes in the Yellow River Delta via a region-adapted allocation model, supporting improved LUCC data accuracy and related research. Based on historical river course, settlement, and cropland survey data, this study identifies natural factors using historical settlement density through correlation analysis. Subsequently, a reclamation suitability model conforming to regional characteristics was constructed, and it obtains the cropland changes in the Yellow River Delta Basin at a spatial resolution of 0.5′ × 0.5′ over five time periods since 1855. The research indicates the following: (1) Through the method of analyzing the correlation between historical settlement density and natural factors, it is found that elevation (−), soil pH (+), soil organic carbon density (−), and NDVI (+) are the primary natural factors influencing the distribution of farmland in the Yellow River Delta. (2) The amount of farmland in the Yellow River Delta increased initially and then decreased after 1885; the average reclamation rate increased from 5.65%, peaked at 23.46% in the early 20th century, and then fell back to 7.68%. Spatially, the reclamation area expanded from scattered local areas along the Yellow River towards the sea, with a distinct coastal distribution. (3) Evaluation through absolute difference analysis shows that, compared with the HYDE 3.2 data, our reconstruction reflects the impacts of coastal changes, river distribution, and regional policy history on the allocation results. Based on the findings of this study, relevant issues can be improved from two aspects: first, by correlating settlement density with natural factors to identify key regional natural factors, which can then be applied to the update of LUCC data in small spatial units and similar regions to enhance data accuracy; second, by referring to the historical laws of cropland reclamation and suitability conditions, to optimize the current land planning of the Yellow River Delta and balance cropland utilization with ecological protection.
1. Introduction
Land use and land cover change (LUCC) is one of the core drivers of global environmental change, significantly influencing the climate system, biogeochemical cycles, and ecosystem services [1,2,3]. It also reflects the long-term interaction between human activities and the natural environment [4,5]. On one hand, humans transform the natural environment through land use; on the other, natural constraints in turn shape the intensity and mode of human activities, with the two sides forming a dynamic coupling system via the exchange of materials and energy [6]. Therefore, reconstructing the spatiotemporal dynamics of historical LUCC and analyzing its driving mechanisms have become key topics in exploring global environmental change. Internationally established global historical LUCC datasets, such as the Historical Database of the Global Environment (HYDE) [7,8,9,10], Sustainability and Global Environment (SAGE) [11,12], PJ [13], KK10 [14], etc., primarily use farmland statistics and historical population data to construct the spatial patterns of land use at specific time points through linear interpolation. These datasets provide basic data support for Earth system models and long-term human–environment relationship research [15,16,17,18]. However, limited by the completeness of original data and differences in grid allocation methods, the reconstruction results of different datasets significantly diverge at the regional scale [19,20,21], and have overlooked the importance of obtaining accurate information on the potential maximum distribution range through zoning, leading to controversies about their reliability in simulating key processes such as regional climate responses and ecosystem evolution [22,23]. Especially in regions with intensive human activities and complex ecosystems, existing datasets struggle to accurately characterize the nonlinear impacts of LUCC on surface processes and environmental feedbacks [24,25], necessitating the integration of multi-source data and new methods [26,27] to improve the spatiotemporal resolution and mechanistic interpretation of historical LUCC research.
Increasing the reconstruction of historical farmland cover at the regional scale is a way to enhance the reliability and accuracy of historical LUCC datasets. Optimizing the reconstruction of historical cropland cover at the regional scale requires not only relying on rich data from historical documents, inventories, and statistical records to establish the allocation relationship between proxy indicators and cropland, but also needs to obtain the potential maximum distribution range (i.e., the theoretically maximum geographical boundary where cropland could be distributed in a specific historical period) based on the historical conditions and observational data of the study area, so as to construct a reasonable grid-based allocation method. At present, some researchers have considered changes in river courses and coastlines in the grid-based reconstruction of cropland in different regions and at different scales. When reconstructing the cropland pattern in the Manas River Basin of Xinjiang during the Republic of China period, Zhang et al. established a buffer zone for allocation according to the principle that the probability of cropland distribution is higher in areas closer to rivers and canals [28]. He et al. found that in eastern China, in addition to being affected by land reclamation suitability, cropland distribution is also restricted by coastline factors. When reconstructing the grid-based farmland in China over the past millennium, they took into account coastal changes in the Song, Yuan, Ming, and Qing dynasties, as well as the modern period [29]. Meanwhile, some studies have found that human farming activities are often carried out near river courses, reflecting the relationship between settlement distribution and riverbeds. Wang et al. reconstructed the cropland pattern in the middle reaches of the Yarlung Zangbo River Valley in Tibet during the late Qing Dynasty and the Republic of China period using settlement factors, and found that cropland was mostly distributed in the broad river valleys of the main stream and major tributaries of the Yarlung Zangbo River [30]. Li et al. found that the reclamation rate in areas where ancient river courses were abandoned increased significantly [31]. This potential relationship between the distribution of cropland and river courses/valleys has led to the inclusion of settlements in the model allocation considerations in the above studies. The Yellow River Delta in China has experienced several river diversions and coastline changes in the past [32,33,34,35], but its evolutionary history is not reflected in some current mainstream global historical LUCC datasets. The status of historical farmland cover changes in the Yellow River Delta and the appropriate grid allocation methods for this region in historical periods remain unclear [36,37].
The Yellow River Delta is characterized by flat terrain, fertile soil, and a developed agricultural industry, having been one of China’s major grain-producing areas since ancient times and an important land reserve resource. Since the Yellow River diverted to the sea in Shandong, the Yellow River Delta has been influenced by various factors such as sediment deposition and flow path changes, becoming one of the fastest land-forming estuarine deltas in China and the world. Its land cover has been in a continuous dynamic change process [38,39]. However, the characteristic of being adjacent to the sea makes the quality of local cultivated land highly affected by seawater erosion and groundwater salinity. Its ecosystem is simultaneously new, sensitive, fragile, and unstable. The changes in natural factors caused by dynamic coastline changes [40,41] have led the region to face serious problems such as cultivated land soil erosion, productivity decline, and salinization [42], further complicating the historical cultivated land patterns. As a typical region characterized by intense land-sea interactions and a high coupling of ecological vulnerability with human activities, the LUCC in the Yellow River Delta is directly linked to regional food security, ecosystem functions, and sustainable development. Research on its long-term temporal changes holds crucial value for understanding the laws governing how estuarine-coastal systems respond to natural and human-driven factors [43]. Reconstructing the evolution status and distribution characteristics of farmland cover changes in the Yellow River Delta since the Qing Dynasty and clarifying their driving mechanisms not only provide a more accurate reconstruction results of the spatial distribution and quantity changes in cultivated land, but also offer references for cultivated land protection and ecological environment improvement in the delta region.
Therefore, this study integrates existing datasets with historical statistics and multi-source survey data. Through a quantitative analysis method of historical settlement density improvement factors, coupled with environmental change factors such as coastline and water system changes, it constructs a multi-dimensional cropland grid allocation model, systematically reconstructs the dynamic evolution process of cropland spatial distribution in the Yellow River Delta since 1855, and finally forms a 0.5′ × 0.5′ high-precision grid cropland cover dataset. This provides important support for accurately characterizing the LUCC characteristics of this region and improving the reliability and spatiotemporal resolution of datasets at the regional scale.
2. Overview of the Study Area
The study area of this paper is located at the estuary of the Yellow River in Shandong Province (Figure 1), a modern delta formed by the long-term deposition of sediments such as sand carried by the Yellow River after the river burst through the Tongwaxiang dyke in 1855 and diverted into the Daqing River course. With Ninghai as its vertex, it stretches from the Tao’er River Estuary in the north to the Zhimai River Estuary in the south, mainly including two modern administrative districts, Dongying District and Kenli District, with a total area of approximately 5400 km2.
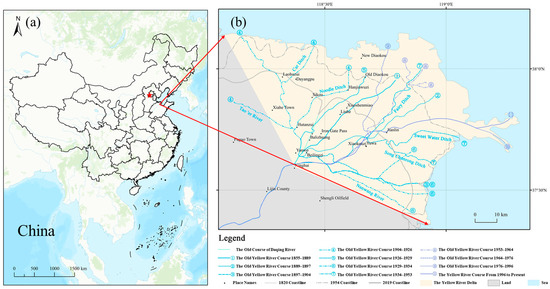
Figure 1.
Location and geographical situation of the study area. (a) represents the geographic location of the study area in China; (b) represents the historical changes of river courses and coastlines in the Yellow River Delta (cited from Liu [36,37]).
The Yellow River Delta belongs to a typical temperate continental monsoon climate, with an average annual precipitation of about 530 mm. Precipitation is concentrated in summer, featuring simultaneous rainfall and heat. The terrain is dominated by plains, gradually descending from west to east, with an average altitude of 1–5 m. Historically, the Yellow River has experienced multiple course changes. In the past 1000 years, two major course changes occurred in 1128 and 1855 AD. The former was a man-made diversion: the river originally flowed north into the Bohai Sea, then captured the Huaihe River course, and finally emptied entirely into the Southern Yellow Sea [37]. The latter was a natural diversion, where the Yellow River returned to its ancient course and re-entered the Bohai Sea. In the nearly 300 years since the Yellow River diverted to Shandong, the abandoned river channel was not static but underwent a transformation from multiple streams to a unified old course. The tail channel frequently swung north and south, experiencing six large-scale natural diversions in 1889, 1897, 1904, 1926, 1929, and 1934, and four artificial diversions in 1953, 1964, 1976, and 1996, forming 11 river channels [44]. Sediments carried by the river silted up in the lower reaches of the channel and the shallow sea near the estuary, improving the local saline-alkali soil [45].
Suitable climate, flat terrain, convenient irrigation conditions, fertile sediments, and land expansion caused by sediment deposition in the estuary have provided continuous material support for local agricultural development. Historically, large areas of arable land deposited by frequent course changes in the Yellow River’s tail have become an important way to release the agricultural production pressure in North China. During the Ming and Qing dynasties, the old riverbed and new river beaches were successively reclaimed, and the cultivable range continued to expand [37]. At present, the Yellow River Delta has become one of the most important cultivated land resource reserves and agricultural production bases in China. Meanwhile, sediment deposition and frequent flow path changes have brought about the extension of new deltas [46], making the Yellow River Delta one of the fastest land-forming estuarine deltas in China and even the world. The land cover continues to be in a dynamic change process, further exacerbating the complexity of the cultivated land pattern.
3. Data Sources and Research Methods
3.1. Data Sources
The core focus of this study is the spatiotemporal dynamic changes in cropland—a single land use type—in the Yellow River Delta, and the construction and selection of the data system are all centered around the goal of “reconstructing cropland changes”:
- Vector data of the lower Yellow River channel from 1855 to the present
Vector data depicting the lower Yellow River channel spanning from 1855 to 2000 is obtained from the 1:1,000,000 Main Channel Variation Database (1855–2005) of the lower Yellow River. This database is published by the National Earth System Science Data Center, which operates under the National Science and Technology Infrastructure Platform (http://www.geodata.cn, accessed on 25 June 2021). It covers details regarding the alterations of the Yellow River’s channel across 11 distinct time intervals, with the time nodes being: 1855, 1889, 1897, 1904, 1926, 1929, 1934, 1953, 1964, 1976, 1996, and 2005.
- 2.
- Coastline data of the Yellow River Delta
The coastline of the Yellow River Delta in 1820 is sourced from the China Historical Geographic Information System (CHGIS) (https://chgis.fas.harvard.edu, accessed on 25 June 2021). The 1954 coastline was generated by performing georeferencing and vectorization on “The Channel Change Map of Yellow River Estuary Delta Since 1855” from the book Chinese Historical Physical Geography [47]. Modern shoreline data were extracted from the 1:4,000,000 Administrative Division Map of China, which is available from the National Basic Geographic Information Center (https://www.webmap.cn, accessed on 25 June 2021).
- 3.
- Cultivated land area data
The cultivated land quantity data by county (district) in the study area are sourced from the Cropland Cover of the Shandong Province dataset established by [48] and others, which quantitatively reconstructs the cultivated land area and reclamation rate data of Shandong over the past 300 years using historical literature and modern remote sensing data through data correction and multi-source cultivated land data relationship model verification. The time resolution is 50–100 years, the spatial resolution is by county (district), and the time sections used include the 17th century, 18th–19th centuries, early 20th century, late 20th century, and early 21st century. As a dataset with “cropland” as its core indicator, it directly provides quantitative baseline data for analyzing the temporal changes in cropland in the study area.
- 4.
- Other basic data required for cultivated land gridding allocation
The physical geographic element data involved in the construction and analysis of the cultivated land gridding allocation model can be divided into four categories: climate, topography, soil, and others. Among them, climate indicators include annual average precipitation, annual average temperature, and average water vapor pressure; topographic indicators include altitude and slope; soil indicators include soil silt content, soil clay content, soil sand content, soil gravel content, soil bulk density, soil pH, soil total nitrogen content, soil cation exchange capacity, and soil organic carbon density; comprehensive indicators are normalized vegetation index and salinity. The data sources and relevant information are shown in Table 1.

Table 1.
Data sources involved in the construction and analysis of the cultivated land gridding allocation model.
3.2. Research Methods
3.2.1. Key Factor Discrimination Method Based on Historical Settlement Density
As an important carrier of human agricultural production and living activities, the formation and developmental evolution of the spatial pattern of rural settlements are deeply coupled with processes such as land reclamation suitability and cultivated land development history [49]. From the perspective of the human–land relationship, there is an inherent logic between settlement distribution density and land reclamation suitability: areas with strong reclamation suitability are more likely to attract human settlement and reclamation, often with higher settlement density; conversely, areas with weak reclamation suitability have limited settlement development and relatively lower density [22,50]. Therefore, historical settlement density can indirectly reflect the strength of land reclamation suitability and directly indicate the historical process of cultivated land development, serving as a key bridge connecting natural factors and reclamation suitability analysis (Figure 2).
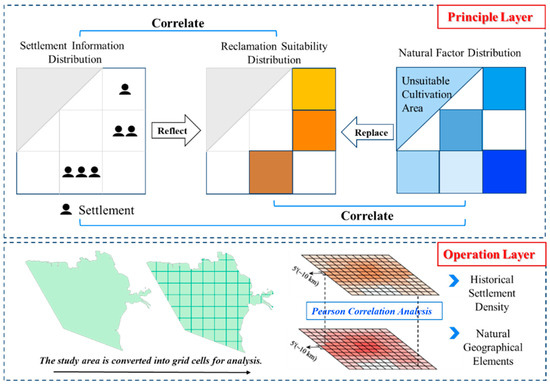
Figure 2.
Regional key factor discrimination method based on historical settlement density.
Historical settlement density is used to replace reclamation suitability as the core medium for correlation analysis of natural factors. The theoretical logic is constructed in the Principle Layer, and data quantification is implemented in the Operation Layer. The two layers cooperate to complete the analytical closed loop of “from natural factors to human—land relationships”, providing a foundation for subsequent exploration of the driving factors for cultivated land development. Based on the above logic, a “historical settlement density-reclamation suitability-natural factor” correlation analysis framework is constructed. The specific operations are divided into two steps:
- (1)
- Spatial scale unification: Physical geographic elements (such as topography, climate, soil, etc.) have multi-scale characteristics. To ensure the consistency of analysis, the spatial resolution of each element index is first unified, and 10 km × 10 km (5′ × 5′) is selected as the analysis scale. This scale can effectively cover regional natural condition differences and avoid information redundancy caused by excessively fine resolution [51,52].
- (2)
- Correlation analysis: Using SPSS 26.0 statistical analysis software, Pearson correlation analysis is carried out on historical settlement density and natural factors (topographic relief, hydrothermal conditions, soil texture, etc.) to quantify the correlation strength and significance between them. By analyzing the coupling relationship between settlement distribution and natural conditions, the key natural influencing factors driving regional cultivated land development are excavated, laying a foundation for subsequent research on the evolution of human–land relationships and land use history.
3.2.2. Land Reclamation Suitability Model Considering Delta Sedimentary Pattern Changes and Reclamation Priority
In historical periods, farmland was typically distributed around settlements, so historical settlement density can indicate the distribution of cultivated land. In this study, a farmland gridding allocation method based on settlement density [27] is adopted. The basic algorithm applied in the settlement density method is shown in the following formula:
To determine the total cropland area in a specific region w for a given year t, we first sum up the cropland areas of all N settlements within that region and year. This is expressed as follows:
where represents the cropland area of the N-th settlement in region w and year t, and N is the total number of settlements in that region and year.
Next, we calculate the average cropland area per settlement in region w and year t. This is obtained by dividing the total cropland area by the number of settlements in that region and year:
where denotes the average cropland area per settlement in year t and region w, and denotes the number of settlements in year t and region w.
From the above two formulas, we can deduce that the total cropland area in a region is equivalent to the product of the average cropland area per settlement and the number of settlements:
When scaling down to the grid level, for a specific grid i in year t, the cropland area is calculated as the product of the average cropland area per settlement in region w (where grid i is located) and the number of settlements within grid i in year t:
Next, the settlement density of the grid is used as the weight, and the calculation formula is as follows:
In Formulas (5)–(7), the value range of is from 0 to 1, representing the weight of cultivated land area allocation in grid i and year t. is the normalized result.
Secondly, the reclamation suitability model is corrected by incorporating river channel buffer zones and coastline change factors. During the allocation, the natural environment of the Yellow River Delta is comprehensively considered, and combined with the natural factor identification method, the factors included in the cultivated land area allocation model are determined. For positive correlation factors (X, Y, Z, …) and negative correlation factors (A, B, C, …), maximum and minimum normalization processing is performed:
In the formula, Xi (Ai) is the max (min) normalization result of the positive (negative) correlation in grid i, and Gi is the positive (negative) correlation factor of grid i; Gmax and Gm in are the max and min values of the positive (negative) correlation factors in the Yellow River Delta, respectively.
Each physical geographic factor has the same importance for land reclamation suitability. According to the normalization results of each factor, the reclamation suitability based on natural factors is calculated by the geometric mean method:
In the formula, Ni is the land reclamation degree indicated by the physical geographic factors of grid i; n is the number of physical geographic factors; Xi, Yi, Zi etc., are the normalization results of the natural factors of grid i.
The cultivated land allocation weight and the unit grid reclamation rate of grid i become
During allocation, it is considered that the old river channel still has reclamation potential within 70 years after the river diversion. The Yellow River’s old channels, since 1855, have been selected to establish a 3 km buffer zone of the channel, and the reclamation rate within the buffer zone is allocated in segmented cycles. It is assumed that the area within 3 km of the channel is the maximum reclamation rate area, and the reclamation rate outside the buffer zone does not exceed the upper limit of the reclamation rate within the 3 km area. At the same time, the upper limit of the grid reclamation rate is set at 90%. For the cultivated land exceeding 90% of the grid area during the allocation process, it will be reallocated to other grids with a reclamation rate of less than 90% until the reclamation rate of all grids in the study area does not exceed 90%.
4. Results
4.1. Discrimination of Regional Key Factors Based on Historical Settlement Density
(1) Scatter Distribution Characteristics of Historical Settlement Density and Physical Geographic Element Indicators
By analyzing the scatter distribution of historical settlement density and physical geographic element indicators (Figure 3), it is found that there are physical geographic elements within each region that show a certain correlation with the reclamation intensity, reflecting the influence degree and rules of different elements on human reclamation activities and settlement distribution.
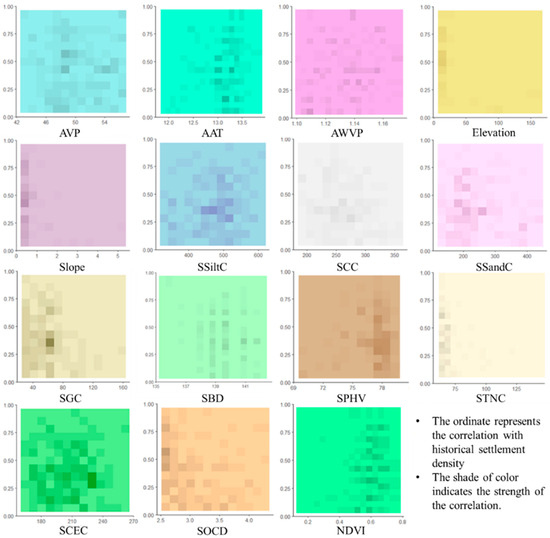
Figure 3.
Scatter distribution diagram of historical settlement density and physical geographic element indicators (the abbreviations of each factor correspond to Table 1).
Soil properties are the core factors affecting the suitability of cultivated land and settlement distribution. Soil pH shows obvious characteristics related to historical settlements in different intervals. In the interval of 6.9–7.8, the higher the value, the higher the reclamation intensity; while when it is above 7.8, the reclamation intensity shows a weakening trend, and overly alkaline soil will restrict reclamation and development. Soil organic carbon, total nitrogen content, and gravel content show a negative correlation with settlement density. In coastal wetlands, in the vegetation growth areas such as reeds and spartina alterniflora, the soil organic carbon and total nitrogen contents are high, but they are not suitable for crop growth; the increase in gravel content will inhibit the distribution of settlements and reclamation activities due to the increase in cultivation difficulty. Soil silt, clay, sand, and cations do not show strong regularities like the above indicators; in-depth analysis combined with regional characteristics and correlation is needed.
In the scatter distribution of topographic indicators such as altitude and slope, the high-density settlement points are concentrated in the regions of low altitude (altitude < 50 interval) and gentle slope (slope < 2 interval), reflecting that residents tend to settle and reclaim in the flat and easily developable Yellow River Delta region; the settlement density in steep slope regions is extremely low due to the high cultivation difficulty.
Among the climatic indicators, from the scatter distribution of average precipitation, average temperature, and settlement density, the settlement density is higher when precipitation and temperature are in the median interval; the scatter distribution of the water vapor indicator also presents a similar rule of “a moderate interval is more suitable for settlement distribution”, reflecting the human–land relationship under the synergistic effect of climatic elements. NDVI indirectly reflects the vegetation coverage, and in the regions where its value is moderate (0.2–0.6), the settlement distribution is more concentrated, which not only ensures the ecological foundation but also facilitates reclamation and development.
In summary, the scatter distribution of historical settlement density and natural geographical factors clearly demonstrates the multi-dimensional impacts of factors such as soil, topography, and climate on human reclamation activities: soil indicators constrain the intensity of reclamation through fertility and physicochemical properties, while topographic and climatic indicators regulate settlement distribution through development difficulty and hydrothermal conditions, collectively outlining the historical pattern of regional human–environment interaction. This provides the necessary quantitative basis for further constructing a historical cultivated land spatial allocation model based on reclamation suitability allocation weights.
(2) Correlation between Historical Settlement Density and Physical Geographic Elements
Through Pearson correlation analysis, the correlation between the physical geographic element indicators and historical settlement density in the study area was further analyzed (Table 2). The physical geographic elements significantly correlated with historical settlement density (p < 0.05) were screened out, including temperature (0.264), elevation (−0.355**), slope (−0.354**), soil pH (0.254**), etc. However, the simple correlation analysis did not exclude the “collinearity interference” among elements, so it was necessary to segment each indicator and compare the results of correlation analysis and partial correlation analysis simultaneously [50].
Table 2.
Results of correlation coefficients between historical settlement density and each physical geographic element indicator, controlled fixed variables, and their partial correlation.
By introducing partial correlation analysis, after fixing the influence of other elements, the net association between the target element and settlement density was recalculated. The factors with relatively high correlation with settlement density included: soil organic carbon density (−0.438), soil total nitrogen content (−0.294), precipitation (0.280), temperature (0.199), etc. Combined with the judgment of the prior knowledge of physical geography experts, through the three-stage process of “preliminary screening by correlation analysis—net association by partial correlation analysis—verification by expert knowledge”, the main control physical geographic element indicators affecting historical settlement density were finally selected: elevation (−); soil pH (+); soil organic carbon density (−); NDVI (+). Each indicator provides key parameter support for the subsequent evolution of the regional human–land relationship and the simulation of land use history.
4.2. Gridded Allocation of Cultivated Land in the Yellow River Delta Since 1855
In terms of quantitative change characteristics, according to the reconstruction results of cultivated land quantity in the Yellow River Delta (Table 3), the total cultivated land area in the Yellow River Delta shows a dynamic feature of first increasing and then decreasing. Since 1885, cultivated land reclamation has shown a trend of accelerated growth, with the reclamation peak appearing in the early 20th century. During this period, the average reclamation rate increased from 5.65% to 23.46%, presenting the characteristics of a small cultivated land area, limited spatial distribution, and low reclamation intensity. The cultivated land area increased from 158.67 km2 to 619.09 km2. After the early 20th century, the overall reclamation intensity in the Yellow River Delta gradually declined. By the early 21st century, the average reclamation rate decreased by about 16 percentage points, showing the characteristics of wide spatial distribution of cultivated land and high reclamation intensity.
Table 3.
The interval and average of the cropland fraction in the Yellow River Delta since 1855.
In terms of spatial pattern changes, river channel buffer zones and coastline change factors were incorporated into the construction of the reclamation suitability model. Based on the reclamation suitability model considering natural factors and settlement factors, the spatial distribution map of reclamation rates in the Yellow River Delta since 1855 was obtained (Figure 4), which shows the changes in reclamation scope and intensity in this region.
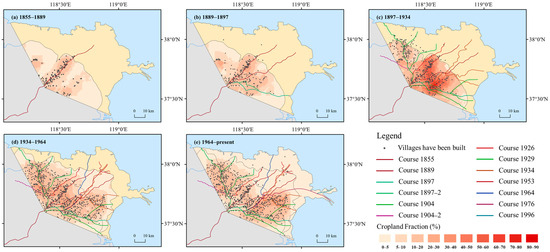
Figure 4.
Spatial distribution of reclamation rates in the Yellow River Delta since 1855.
From the perspective of cultivated land spatial distribution (Figure 4a), the reclamation in the Yellow River Delta was in the early stage from 1855 to 1889, with a relatively limited reclamation scope. Affected by the Yellow River flow path (based on the 1855 flow path) and initial development conditions, cultivated land was mainly concentrated in local areas. Grids with low reclamation rates (1–5% and 5–10%) accounted for a high proportion, and grids with reclamation rates exceeding 15% were only sporadically distributed. In this stage, the proportion of cultivated land grids in the total study area was relatively small, the reclamation intensity was weak, and grids with relatively high reclamation rates were mostly distributed in areas close to early human activities with good foundations and tightly associated with the old Yellow River channels. The overall reclamation scope showed an initial trend of expanding toward the sea, but the range was small.
From 1889 to 1897 (Figure 4b), the reclamation intensity in the Yellow River Delta increased. The proportion of cultivated land grids rose compared with the 1855–1889 stage, the proportion of grids with low reclamation rates (0–5%, etc.) began to decrease, and the proportion of grids with reclamation rates exceeding 50% slowly increased. On the basis of the original concentrated areas, the reclamation scope expanded slightly toward the surrounding and shallow sea directions along the 1855 flow path of the Yellow River and the influence range of new river systems. The distribution range of high-reclamation-rate grids was extended, and supported by conditions such as river water sources, new, relatively concentrated reclamation areas appeared along the banks of some tributaries.
From 1897 to 1934 (Figure 4c), the reclamation intensity in the Yellow River Delta significantly increased. By the later stage of this period, the proportion of grids with reclamation rates exceeding 20% increased substantially, and the proportion of grids with reclamation rates less than 10% decreased significantly. Taking the old flow path formed by the Tongwaxiang breach of the Yellow River in 1855 as the core axis, the reclamation scope expanded significantly toward the northwest and southeast directions and further extended to the sea. Cultivated land development around villages intensified, and high-reclamation-rate grids showed prominent contiguous distribution characteristics along both banks of the Yellow River flow paths in different periods (1855, 1889, etc., and newly evolved flow paths). The spatial pattern of cultivated land transformed from local fragmentation to zonal and planar expansion along the flow paths. The reason is that during this period, the lower reaches of the Yellow River underwent multiple avulsions, depositing large areas of fertile farmland and providing a natural basis for the expansion of cultivated land; meanwhile, spontaneous reclamation driven by population pressure and organized migration jointly promoted the rapid expansion of cultivated land area [53,54].
From 1934 to 1964 (Figure 4d), the reclamation intensity of the Yellow River Delta began to decrease compared with the previous stage. This was influenced by changes in the natural environment and adjustments in human development strategies: on the natural front, local swings of the Yellow River channel caused siltation and erosion, affecting the stability of some cultivated land; on the human front, urbanization led to the occupation of cultivated land, the development of the petroleum industry directly and indirectly reduced cultivated land, and in addition, extensive farming and improper irrigation aggravated secondary soil salinization, resulting in the abandonment of cultivated land. Against this backdrop, the reclamation scope expanded on the original basis around the new Yellow River course, and some offshore areas were transformed from low reclamation rates to medium-high reclamation rates due to improved development conditions, with the distribution of cultivated land becoming increasingly closely related to river systems.
Since 1964 (Figure 4e), the reclamation intensity and spatial pattern of the Yellow River Delta have entered a new development stage. The reclamation rate distribution has shown diversification, including contiguous inland and old channel core areas with reclamation rates >10%, as well as offshore and ecologically sensitive areas with low reclamation rates (such as <5%) due to ecological protection and natural conditions of coastal tidal flats. Overall, the reclamation scope has been further optimized and adjusted along the modern Yellow River flow paths and artificial water conservancy networks on the basis of the previous period. In some areas, the reclamation scope has shrunk to the land or remained stable under the influence of ecological protection policies, but in suitable newly silted coastal areas for development, new cultivated land has continued to expand, presenting a complex spatial pattern under the game between development and protection. While high-reclamation-rate areas are consolidated in the core belt of traditional flow paths, they moderately extend to areas with suitable water and soil conditions.
Overall, the changes in the spatial pattern of cultivated land in the Yellow River Delta since 1855 have always been interwoven with the changes in the Yellow River flow paths, human development intensity, and ecological environment conditions. From the initial local sporadic development, through large-scale expansion along the flow paths, to the current pattern of coordinated development and protection, it profoundly reflects the land use evolution process driven by natural and humanistic factors.
5. Discussion
5.1. Comparative Analysis with HYDE3.2 Dataset
Among historical LUCC datasets, HYDE3.2 is currently the most widely used global farmland coverage dataset, but its reconstruction accuracy for regional scales is insufficiently sensitive. The reclamation rate spatial data of the HYDE3.2 dataset in 1890, 1900, 1930, 1960, and 2000 were selected for comparison with the farmland coverage reconstructed in this study. To maintain consistency in spatial resolution (5′ × 5′), the cultivated land gridding reconstruction results in this paper were first upscaled.
The results show significant differences in the total cultivated land area and spatial distribution between this study and HYDE3.2. From the reconstruction of the reclamation rate spatial pattern (Figure 5), although the reconstruction results of the five time sections of HYDE3.2 show a decreasing trend of reclamation rate from land to sea, and the 1930 map records the spatial process of significant expansion of reclamation in the Yellow River Delta in the early 20th century, the irrationality of spatial allocation of cultivated land data in HYDE3.2 is more obvious. On the one hand, the HYDE dataset does not consider the migration process of the coastline in the Yellow River Delta, and the cultivated land data from the 17th century to the early 20th century are allocated to the sea area that had not yet formed land at that time. On the other hand, the high-reclamation-rate areas in the HYDE dataset over the past 300 years are mainly distributed along the modern Yellow River after the artificial course change in 1976, without considering the changes in the Yellow River channel.
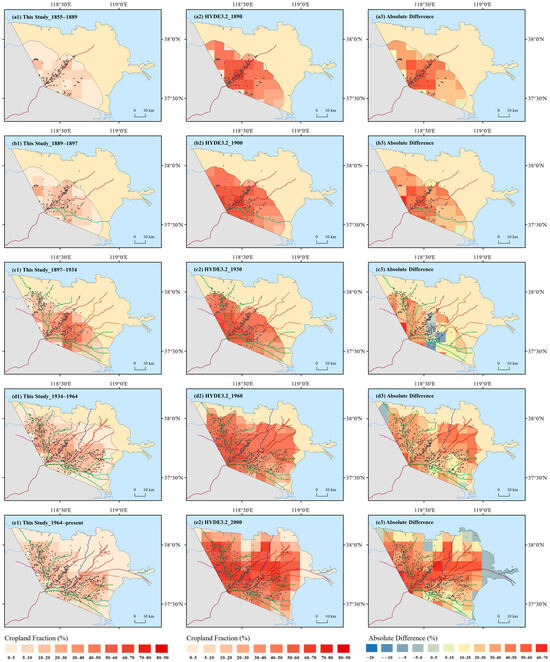
Figure 5.
Comparison between the reconstruction results of this study and HYDE3.2.
The absolute differences between the reconstruction results of this paper and the HYDE3.2 dataset mainly occur in inland areas and along the modern Yellow River, and the positive/negative values of the differences and their spatial distribution change with time, which can be divided into two stages: from 1855 to the end of the 19th century, the grid reclamation rate data in this paper mostly show positive differences compared with HYDE3.2, with the largest difference in inland areas reaching 40% at the end of the 19th century. Over time, the negative value areas gradually shift to the area along the estuary section of the Yellow River, and the gap narrows to about −20%; since the early 20th century, grids with absolute negative differences have gradually increased, concentrated in coastal areas, while the reclamation rate differences in coastal areas show a distribution of positive and negative values. However, grids with positive values still occupy an absolute advantage, concentrated in inland areas, and the difference gradually narrows from 60% to 10% over time.
Compared with the HYDE reconstruction results, the farmland reconstructed in this paper has experienced three stages: stable growth—rapid growth—contraction. The main reasons for this result are as follows: during the Shunzhi period, the Shandong region promulgated land policies such as the official provision of cattle and seeds, and the postponement of taxation. These policies directly boosted farmers’ enthusiasm to reclaim wasteland in the Yellow River Delta, promoting the rapid conversion of uncultivated inland land into cropland and thus facilitating the expansion of cultivated land. From 1855 to the mid-20th century, despite frequent natural disasters, plagues, and wars in the late Qing Dynasty and the early Republic of China, the population in the entire Shandong region still showed a slight increase as a whole. The large areas of fertile land silted up by frequent course changes in the Yellow River estuary just became a breakthrough for releasing agricultural production pressure. After the mid-20th century, the development of urbanization in terms of population and land has generally been uncoordinated across the country. Urban construction land has expanded excessively, with extensive and inefficient land use. Low-quality urbanization has come at the cost of occupying high-quality cultivated land, directly leading to a reduction in the area of cultivated land cover. Moreover, this inefficient model has further intensified the spatial conflict between cultivated land and construction land, restricting the sustainable development of cultivated land cover.
5.2. Discussion on Uncertainties of Cultivated Land Gridding Allocation Model
The uncertainties in this study mainly include three aspects: rural settlement estimation, gridded cultivated land allocation, and cultivated land area reconstruction. First, although the rural settlement density index has a good effect in indicating the cultivated land reclamation process, it also has certain limitations: the scales of rural settlements vary, resulting in different cultivated land areas for each village. Meanwhile, the settlement data extracted from local gazetteers and county annals lack micro-level information on land-use changes within settlements. In reality, there are subtle differences in internal land use characteristics among different rural settlements. In our cultivated land allocation modeling, we assumed that the scale of each rural settlement and the information on internal land-use changes were consistent. Both of these simplifications may lead to errors in the results. Additionally, the Yellow River frequently changed its course and burst its banks in historical periods, leading to the destruction of numerous villages whose specific locations were not effectively recorded. As a result, the spatial pattern of rural settlements in the Yellow River Delta reconstructed based on modern local gazetteers and county annals cannot fully reflect the real situation at that time, further causing uncertainties in the reconstruction of cultivated land patterns. Second, regarding gridded cultivated land allocation, setting river channel buffer zones and abandoned settlements are the main references in this study’s gridded cultivated land allocation. During allocation, multi-level buffer zones should be introduced into the farmland distribution grid model of this region, and relevant parameters should be set according to the time characteristics of river channel construction. Furthermore, the cultivated land area in this paper was allocated using the area of adjacent periods, which may be inconsistent with the actual situation in specific years.
Meanwhile, when identifying key factors using historical settlement density, due to the difficulty in obtaining large-scale historical natural environment factor data, we assume that the relationship between natural geographical elements (ancient and modern) and land reclamation suitability is consistent, which, however, fails to reflect short-term fluctuations in historical natural conditions.
6. Conclusions
Using a farmland allocation model based solely on modern farmland distribution and modern natural factors is not suitable for delta areas with frequently shifting river mouths. To better reconstruct the regional cultivated land pattern, this paper integrates existing datasets with historical statistical and survey data. According to the characteristics of regional historical river channels and coastlines, it adopts a factor identification method based on historical settlement density and combines it with the settlement density method for gridding allocation, and uses a natural land suitability dataset for correction, forming a 0.5′ × 0.5′ gridded result of cultivated land in the Yellow River Delta since 1855. It analyzes its spatiotemporal characteristics, finally compares our results with the reconstruction results of the HYDE dataset, and analyzes the influencing factors. The main conclusions are as follows.
- (1)
- The Yellow River Delta is one of the fastest land-forming deltas in the world. This paper uses historical settlement density to select natural factors affecting cultivated land allocation, improves the settlement density method to allocate cultivated land based on this, and modifies the grid distribution results based on historical Yellow River channel distributions. Such an allocation method is applicable in the Yellow River Delta, and the research results accurately demonstrate the historical fact that cultivated land in the Yellow River Delta has experienced stable growth—rapid growth—contraction since 1855.
- (2)
- The main control physical geographic element indicators affecting historical settlement density in the study area are the following: elevation (−); soil pH (+); soil organic carbon density (−); NDVI (+). Each indicator provides key parameter support for subsequent regional human–land relationship evolution and land use history simulation.
- (3)
- The quantity of cultivated land in the Yellow River Delta first increased and then decreased since 1885; from 1885 to the early 20th century, reclamation accelerated, with the reclamation rate rising from 5.65% to 23.46% to reach its peak. After 1934, the average reclamation rate declined to 7.68%. Spatially, the reclamation scope has expanded from local sporadic areas along the Yellow River course to the sea since 1855, the intensity decreased after 1934, and a complex pattern of competition between development and protection has emerged since 1964, whose evolution is jointly driven by Yellow River course changes, human activities, and ecological conditions.
- (4)
- The differences among the reconstruction results of this study, the HYDE dataset, and regional reconstruction results are mainly due to different cultivated land area data and grid allocation methods. The HYDE dataset does not consider the influence of Yellow River channel changes and coastlines during allocation.
This study reveals the evolution mechanism of cultivated land in the Yellow River Delta through an allocation method that integrates historical settlement factors and natural suitability, providing a new paradigm for reconstructing the land use history of estuarine deltas. It deepens the understanding of the interaction mechanism among “natural conditions, human activities, and land use” in estuarine and delta regions, and provides a new analytical perspective for comprehending the evolution of human–land relationships in similar areas. In the future, multi-source archaeological and historical literature data can be further integrated, and a river channel dynamic process model can be constructed to improve the simulation accuracy of human–land relationship evolution in complex geomorphological areas, providing more detailed historical references for watershed ecological protection and sustainable development. This study clarifies the long-term evolution characteristics of ecosystems under the coupled effects of the Yellow River course changes and human activities. In particular, by integrating the correlation law between the changes in reclamation intensity, wetland degradation, and salinization in areas with high reclamation rates around the river course, it can provide targeted historical references for the refined protection of cultivated land near the river course, the restoration of estuarine wetlands, and the management of salinized soils.
Author Contributions
Conceptualization and writing, L.L. and Y.Y.; methodology, L.L.; revision and validation, L.L.; original draft preparation, Y.L. and L.L. All authors have read and agreed to the published version of the manuscript.
Funding
Supported by National Natural Science Foundation of China (Grant No. 40571165).
Data Availability Statement
The original contributions presented in this study are included in the article. Further inquiries can be directed to the corresponding author.
Conflicts of Interest
The author declares that there are no known competing financial interests or personal relationships that influenced the work reported in this paper.
Correction Statement
This article has been republished with a minor correction to the Data Availability Statement. This change does not affect the scientific content of the article.
References
- Barnes, A.D.; Allen, K.; Kreft, H.; Corre, M.D.; Jochum, M.; Veldkamp, E.; Clough, Y.; Daniel, R.; Darras, K.; Denmead, L.H.; et al. Direct and cascading impacts of tropical land-use change on multi-trophic biodiversity. Nat. Ecol. Evol. 2017, 1, 1511–1519. [Google Scholar] [CrossRef]
- Davis, K.F.; Koo, H.I.; Dell’Angelo, J.; D’Odorico, P.; Estes, L.; Kehoe, L.J.; Kharratzadeh, M.; Kuemmerle, T.; Machava, D.; Pais, A.d.J.R.; et al. Tropical forest loss enhanced by large-scale land acquisitions. Nat. Geosci. 2020, 13, 482–488. [Google Scholar] [CrossRef]
- van Vliet, J. Direct and indirect loss of natural area from urban expansion. Nat. Sustain. 2019, 2, 755–763. [Google Scholar] [CrossRef]
- Tubiello, F.N.; Salvatore, M.; Ferrara, A.F.; House, J.; Federici, S.; Rossi, S.; Biancalani, R.; Condor Golec, R.D.; Jacobs, H.; Flammini, A.; et al. The Contribution of Agriculture, Forestry and other Land Use activities to Global Warming, 1990–2012. Glob. Change Biol. 2015, 21, 2655–2660. [Google Scholar] [CrossRef] [PubMed]
- Alexander, P.; Rounsevell, M.D.A.; Dislich, C.; Dodson, J.R.; Engström, K.; Moran, D. Drivers for global agricultural land use change: The nexus of diet, population, yield and bioenergy. Glob. Environ. Change 2015, 35, 138–147. [Google Scholar] [CrossRef]
- Turner, B.L.; Clark, W.C.; Kates, R.W.; Richards, J.F.; Mathews, J.T.; Meyer, W.B. The Earth as Transformed by Human Action: Global and Regional Changes in the Biosphere over the Past 300 Years; Cambridge University Press: Cambridge, UK, 1990. [Google Scholar]
- Goldewijk, K.; Battjes, J.J. A Hundred Year (1890–1990) Database for Integrated Environmental Assessments; National institute of public health and the environment (RIVM): Bilthoven, The Netherlands, 1997. [Google Scholar]
- Goldewijk, K.K.; Beusen, A.; van Drecht, G.; de Vos, M. The HYDE 3.1 spatially explicit database of human-induced global land-use change over the past 12,000 years. Glob. Ecol. Biogeogr. 2011, 20, 73–86. [Google Scholar] [CrossRef]
- Goldewijk, K.K.; Beusen, A.; Doelman, J.; Stehfest, E. Anthropogenic land use estimates for the Holocene—HYDE 3.2. Earth Syst. Sci. Data 2017, 9, 927–953. [Google Scholar] [CrossRef]
- Chini, L.; Hurtt, G.; Sahajpal, R.; Frolking, S.; Goldewijk, K.K.; Sitch, S.; Ganzenmüller, R.; Ma, L.; Ott, L.; Pongratz, J.; et al. Land-use harmonization datasets for annual global carbon budgets. Earth Syst. Sci. Data 2021, 13, 4175–4189. [Google Scholar] [CrossRef]
- Ramankutty, N.; Foley, J.A. Estimating historical changes in global land cover: Croplands from 1700 to 1992. Glob. Biogeochem. Cycles 1999, 13, 997–1027. [Google Scholar] [CrossRef]
- Ramankutty, N.; Foley, J. ISLSCP II Historical Croplands Cover, 1700–1992; NASA: Washington, DC, USA, 2010. [Google Scholar]
- Pongratz, J.; Reick, C.; Raddatz, T.; Claussen, M. A reconstruction of global agricultural areas and land cover for the last millennium. Glob. Biogeochem. Cycles 2008, 22, GB3018. [Google Scholar] [CrossRef]
- Kaplan, J.O.; Krumhardt, K.; Ellis, E.C.; Ruddiman, W.F.; Lemmen, C.; Goldewijk, K.K. Holocene carbon emissions as a result of anthropogenic land cover change. Holocene 2011, 21, 775–791. [Google Scholar] [CrossRef]
- Chen, H.; Wang, X.; Lu, H.; Balen, R.V. Anthropogenic impacts on Holocene fluvial dynamics in the Chinese Loess Plateau, an evaluation based on landscape evolution modeling. Geomorphology 2021, 392, 107935. [Google Scholar] [CrossRef]
- Sterling, S.M.; Ducharne, A.; Polcher, J. The impact of global land-cover change on the terrestrial water cycle. Nat. Clim. Change 2013, 3, 385–390. [Google Scholar] [CrossRef]
- Chakraborty, T.C.; Qian, Y. Urbanization exacerbates continental- to regional-scale warming. One Earth 2024, 7, 1387–1401. [Google Scholar] [CrossRef]
- He, C.; Liu, Z.; Wu, J.; Pan, X.; Fang, Z.; Li, J.; Bryan, B.A. Future global urban water scarcity and potential solutions. Nat. Commun. 2021, 12, 4667. [Google Scholar] [CrossRef]
- Li, S.; He, F.; Liu, X.; Hua, L. Historical land use reconstruction for South Asia: Current understanding, challenges, and solutions. Earth-Sci. Rev. 2023, 238, 104350. [Google Scholar] [CrossRef]
- He, F.; Li, S.; Yang, F.; Li, M. Evaluating the accuracy of Chinese pasture data in global historical land use datasets. Sci. China Earth Sci. 2018, 61, 1685–1696. [Google Scholar] [CrossRef]
- Fang, X.; Ye, Y.; Zeng, Z. Interaction of extreme climate event—Cultivation—Policy management. Sci. China Earth Sci. 2006, 36, 680–688. (In Chinese) [Google Scholar]
- Fang, X.; Zhao, W.; Zhang, C.; Zhang, D.; Wei, X.; Qiu, W.; Ye, Y. Methodology for credibility assessment of historical global LUCC datasets. Sci. China Earth Sci. 2020, 63, 1013–1025. [Google Scholar] [CrossRef]
- Yang, F.; He, F.; Li, S.; Li, M.; Wu, P. A new estimation of carbon emissions from land use and land cover change in China over the past 300 years. Sci. Total Environ. 2023, 863, 160963. [Google Scholar] [CrossRef] [PubMed]
- Zhang, X.; Wang, F.; Lu, W.; Li, S.; Zheng, J. Gridded reconstruction of the population in the traditional cultivated region of China from 1776 to 1953. Sci. China Earth Sci. 2021, 65, 365–378. [Google Scholar] [CrossRef]
- Gaillard, M.-J. LandCover6k: Global anthropogenic land-cover change and its role in past climate. Past. Glob. Change Mag. 2015, 23, 38–39. [Google Scholar] [CrossRef]
- Jia, R.; Fang, X.; Yang, Y.; Yokozawa, M.; Ye, Y. A 28-time-point cropland area change dataset in Northeast China from 1000 to 2020. Earth Syst. Sci. Data 2024, 16, 4971–4994. [Google Scholar] [CrossRef]
- Wu, Z.; Fang, X.; Ye, Y. A Settlement Density Based Allocation Method for Historical Cropland Cover: A Case Study of Jilin Province, China. Land 2022, 11, 1374. [Google Scholar] [CrossRef]
- Zhang, L.; Liu, J. Reconstruction of cropland spatial patterns of the Manas River Basin of Xinjiang in the late Qing and Republican period. Resour. Sci. 2020, 42, 1428–1437. [Google Scholar] [CrossRef]
- He, F.; Yang, F.; Zhao, C.; Li, S.; Li, M. Spatially explicit reconstruction of cropland cover for China over the past millennium. Sci. Sin. (Terrae) 2023, 53, 115–131. [Google Scholar] [CrossRef]
- Wang, Y.; Tao, J.; Liu, F.; Zhang, Y.; Chen, Q. Reconstruction of cropland spatial pattern in 1830 in the middle reaches of Yarlung Zangbo River Valley. Geogr. Res. 2015, 34, 2355–2367. [Google Scholar]
- Li, J.; Ye, Y.; Wei, X. Reconstruction of cropland change in the southern area of the Daqing River Basin over the past 300 years. Prog. Geogr. 2019, 38, 883–895. [Google Scholar]
- Cui, B.-L.; Li, X.-Y. Coastline change of the Yellow River estuary and its response to the sediment and runoff (1976–2005). Geomorphology 2011, 127, 32–40. [Google Scholar] [CrossRef]
- Chang, G.H.; Liu, Q.S. Analysis on spatio-temporal feature of coastline change in the Yellow River Estuary and its relation with runoff and sand-transportation. Geogr. Res. 2004, 23, 339–346. (In Chinese) [Google Scholar]
- Cui, B.L.; Li, X.Y. The impact of hydrological characteristics of the Yellow River coastline changes in the Yellow River Delta. J. Nat. Resour. 2006, 21, 957–964. (In Chinese) [Google Scholar]
- Bi, N.S.; Wang, H.J.; Wu, X.; Saito, Y.; Xu, C.L.; Yang, Z.S. Phase change in evolution of the modern Huanghe (Yellow River) Delta: Process, pattern, and mechanisms. Mar. Geol. 2021, 437, 106516. [Google Scholar] [CrossRef]
- Ye, Y.; Liu, Y.T.; Gao, S.Q.; Lou, L.; Zhang, X.P.; Wang, F.H. The Influence of Historical River System Changes on Settlement Distribution and Implications for Cropland Gridding in the Yellow River Delta. Land 2025, 14, 812. [Google Scholar] [CrossRef]
- Liu, Y.T.; Ye, Y.; Jiang, C.; Jiang, J.F.; Wang, F.H.; Li, J.; Zhang, X.P. Dynamics of Rural Settlement Patterns in the Yellow River Delta in Response to River Diversion and Avulsion Since 1855. Rural. Landsc. Soc. Environ. Hist. 2024, 11, 2. [Google Scholar] [CrossRef]
- Zhang, X.J.; Wang, G.Q.; Xue, B.L.; Zhang, M.X.; Tan, Z.X. Dynamic landscapes and the driving forces in the Yellow River Delta wetland region in the past four decades. Sci. Total Environ. 2021, 787, 147644. [Google Scholar] [CrossRef]
- Sun, Z.G.; Mou, X.J.; Chen, X.B.; Wang, L.L. Actualities, problems and suggestions of wetland protection and restoration in the Yellow River Delta. Wetl. Sci. 2011, 9, 107–115. [Google Scholar]
- Yang, C.; Lv, D.T.; Jiang, S.Y.; Lin, H.; Sun, J.Q.; Li, K.J.; Sun, J. Soil salinity regulation of soil microbial carbon metabolic function in the Yellow River Delta, China. Sci. Total Environ. 2021, 790, 148258. [Google Scholar] [CrossRef]
- Liu, J.K.; Engel, B.A.; Wang, Y.; Zhang, G.F.; Zhang, Z.M.; Zhang, M.X. Multi-scale analysis of hydrological connectivity and plant response in the Yellow River Delta. Sci. Total Environ. 2020, 702, 134889. [Google Scholar] [CrossRef]
- Wang, Y.X.; Wu, C.S.; Zhao, Z.H.; Yu, B.W.; Liu, G.H. Assessing spatiotemporal heterogeneity of coastal organic nonpoint source pollution via soil erosion in Yellow River Delta, China. Ecol. Indic. 2024, 166, 112519. [Google Scholar] [CrossRef]
- Man, Y.; Du, J.Z.; Lian, Z.M.; Wang, Q.; Cui, B.S. A framework to quantitatively assess the influence of land use and land cover on coastal wetland hydrological connectivity from a landscape resistance perspective. Sci. Total Environ. 2024, 992, 171140. [Google Scholar] [CrossRef]
- Administration Bureau of the Yellow River Estuary, the Yellow River Conservancy Commission. Annals of the Yellow River in Dongying City; Qilu Publishing House: Jinan, China, 1995. [Google Scholar]
- Wang, J. Study on the characteristics and formation mechanism of groundwater chemical composition in the Yellow River Delta. Master’s Thesis, Ocean University of China, Qingdao, China, 2012. [Google Scholar]
- Kong, D.X.; Miao, C.Y.; Borthwick, A.G.L.; Duan, Q.Y.; Liu, H.; Sun, Q.H.; Ye, A.Z.; Di, Z.H.; Gong, W. Evolution of the Yellow River Delta and its relationship with runoff and sediment load from 1983 to 2011. J. Hydrol. 2015, 520, 62–73. [Google Scholar] [CrossRef]
- Zhang, X.G.; Wang, S.C.; Zou, Y.L. Historical and Physical Geography of China; Science Press: Beijing, China, 2013. [Google Scholar]
- Ye, Y.; Wei, X.Q.; Li, F.; Fang, X.Q. Reconstruction of cropland cover changes in the Shandong Province over the past 300 years. Sci. Rep. 2015, 5, 13642. [Google Scholar] [CrossRef]
- Zeng, Z.Z.; Fang, X.Q.; Ye, Y. The Process of Land Cultivation Based on Settlement Names in Jilin Province in the Past 300 Years. Acta Geogr. Sin. 2011, 66, 985–993. (In Chinese) [Google Scholar]
- Jia, D.; Li, Y.K.; Fang, X.Q. Complexity of factors influencing the spatiotemporal distribution of archaeological settlements in northeast China over the past millennium. Quat. Res. 2018, 89, 413–424. [Google Scholar] [CrossRef]
- Zhang, C.P.; Fang, X.Q.; Ye, Y.; Tang, C.C.; Wu, Z.L.; Zheng, X.; Zhang, D.Y.; Jiang, C.; Li, J.; Li, Y.K.; et al. A spatially explicit reconstruction of cropland cover in China around 1850 C.E. employing new land suitability based gridded allocation algorithm. Quat. Int. 2022, 641, 62–73. [Google Scholar] [CrossRef]
- Zhang, C. Development of a Gridded Allocation Algorithm of Historical Cropland Derived from the Physiogeographic Factors—A Case Study of China; Beijing Normal University: Beijing, China, 2021. (In Chinese) [Google Scholar]
- Office of Zhanghua County Place Name Committee. Gazetteer of Place Names in Zhanghua County, Shandong Province; Ocean Press: Beijing, China, 1988. (In Chinese) [Google Scholar]
- Editorial Committee of Local Chronicles of Hekou District, Dongying City. Annals of Hekou District; Zhonghua Book Company: Beijing, China, 2002. (In Chinese) [Google Scholar]
Disclaimer/Publisher’s Note: The statements, opinions and data contained in all publications are solely those of the individual author(s) and contributor(s) and not of MDPI and/or the editor(s). MDPI and/or the editor(s) disclaim responsibility for any injury to people or property resulting from any ideas, methods, instructions or products referred to in the content. |
© 2025 by the authors. Licensee MDPI, Basel, Switzerland. This article is an open access article distributed under the terms and conditions of the Creative Commons Attribution (CC BY) license (https://creativecommons.org/licenses/by/4.0/).