Article

Prediction of Ecological Zoning and Optimization Strategies Based on Ecosystem Service Value and Ecological Risk

College of Tropical Agriculture and Forestry, Hainan University, Haikou 570228, China
*
Author to whom correspondence should be addressed.
Land 2025, 14(9), 1824; https://doi.org/10.3390/land14091824
Submission received: 26 June 2025 / Revised: 3 August 2025 / Accepted: 5 September 2025 / Published: 7 September 2025

Abstract

As a typical coastal tourist city, Sanya has experienced large-scale urbanization driven by tourism development, leading to landscape fragmentation, disorderly urban sprawl, and irrational resource utilization. These factors have intensified regional ecological risks and caused the degradation of ecosystem service functions, thereby constraining sustainable urban development. Therefore, establishing urban ecological zoning can identify the dynamic relationship between ecological conditions and urban growth, ease human-land conflicts, and promote high-quality urban development. This study employed the value equivalency method and the landscape ecological risk index method to calculate the ecosystem service value (ESV) and the ecological risk index (ERI) of Sanya City from 2000 to 2020 and to delineate ecological zones. The PLUS model was used to predict the changes in ecological zoning of Sanya City under a natural development scenario in 2030. The results demonstrate the following: (1) The ecological risk in the study area shows a distribution pattern of “high in the south and low in the north,” with low-risk areas being the dominant type, accounting for about 80% of the total area. Over time, the area of high-risk zones has shown an increasing trend, while that of low-risk zones has decreased year by year. (2) The ecosystem service value in the study area shows a distribution pattern of “high in the north and low in the south,” with a decreasing trend over time, with a cumulative reduction of 2.11 × 10⁸ ten thousand yuan from 2000 to 2020. (3) Among the four ecological zones, the ecological protection zone is the dominant type, accounting for about 50%. The increase in the ecological early warning zone is the most significant. In contrast, the ecological optimization and improvement zones show a marked decrease. The prediction results show that by 2030, the ecological early warning and ecological protection zones will increase, while the other zones will decrease. This study adopts a temporal-dynamic approach by constructing a framework that integrates historical evolution with future simulation, providing scientific evidence for building Sanya’s ecological security pattern and spatial governance. It offers practical significance for coordinating regional ecological conservation with urban development.

1. Introduction

Since the reform and opening up in China, the national urbanization rate has surged from 17.9% in 1978 to 63.89% in 2020. While this rapid expansion has propelled socio-economic growth and population concentration, it has also exerted profound pressure on natural ecological space. Extensive urban-development models are often accompanied by uncontrolled encroachment on ecological areas, disrupting landscape structure [1] and ecosystem functions [2], and triggering regional ecological imbalances and resource over-consumption [3] that constrain sustainable urban development. This tension between urbanization and ecological conservation is particularly acute in tourism-oriented cities [4,5]. As a quintessential tropical coastal tourist city, Sanya possesses unique natural resources and landscape advantages, rendering it strategically crucial for ecological conservation. Yet, within its distinctive narrow “mountain-sea” spatial configuration, the city faces dual pressures: on one side, the historic urban core, constrained by legacy layouts and topography, must expand northward into former ecological land to sustain tourism growth; on the other side, the Sanya Territorial Spatial Plan (2021–2035) mandates systematic protection of ecologically sensitive areas such as national parks and tropical rainforest reserves, thereby limiting urban sprawl. Against this backdrop, scientifically delineated urban ecological zoning becomes a key tool for accurately identifying regional ecological issues and management objectives, enabling differentiated ecological restoration and refined control, and ultimately optimizing the balance between territorial development and conservation.
Ecological zoning divides areas based on ecological features or potential for socio-economic growth [6]. The scientific evaluation of ecological conditions is essential for properly outlining ecological zones [7]. Early ecological zoning relied on single evaluation indices, primarily considering natural factors like climate and vegetation [8,9]. Recently, advances in remote sensing and GIS technologies have facilitated a multidimensional shift in ecological zoning frameworks. For example, Wang et al. proposed an integrated zoning method that considers the causal interactions between ESV and ERI [10], while Sun et al. evaluated the changes in human activity intensity and the supply-demand balance of ecosystem services in the study area, using a four-quadrant model to divide the region into four types based on their relationship [11]. Multidimensional zoning approaches combining multiple factors yield more reliable ecological zoning results. This study integrates the two previously independent dimensions of ecosystem services and ecological risk, establishing a research framework centered on ecological security [12,13]. Compared to evaluations using single indicators, ecological zoning based on ecosystem services and landscape ecological risk more accurately reflects the scientific and comprehensive nature of the results, capturing diverse changes in natural environments and emphasizing the dynamic shifts in regional ecosystems.
Ecosystem services value (ESV) refers to the direct or indirect benefits ecosystems provide to humans [14,15,16,17]. Qualitative assessment of ecosystem service value can effectively identify environmental conditions critical for human health and survival [18] and be an important indicator of regional ecological security [19,20,21]. The value equivalency factor based on per-unit area is used to track dynamic trends among evaluation methods. Focusing on overall change trends offers a more precise understanding, is easier to apply, and aids in exploring long-term ESV changes, supporting management and decision-making [22]. This approach is beneficial for assessing ecosystem service value across different spatial scales, such as provinces, cities, counties [23], urban agglomerations [24], and river basins [25]. In contrast to ESV, the ecological risk index (ERI) is generally used to assess the potential threats to the structure and function of ecosystems [26]. Assessing ecological risk means being able to guard against significant dangers in the ecological environment through scientific and practical methods that involve guarding and resolving potential ecological risks [27]. Using the landscape ecological risk index, this study examines the negative impacts of either natural factors or human activities on the interactions between ecological conditions and landscape patterns by focusing on land-cover change [28]. The approach explicitly incorporates scale effects, temporal variation, and regional spatial heterogeneity, enhancing spatial visualization for regional ecological management [29].In summary, ESV and ERI represent two opposite dimensions of ecosystems [30], and integrating the two for ecological zoning helps overcome zoning limitations based on a single indicator [31].
Notably, existing explorations of ecological zoning still exhibit limitations: on the one hand, most studies concentrate on static characteristics at a specific time point [6], thereby largely overlooking the spatiotemporal processes and evolutionary trends of ecological value and ecological risk. Considering the significance of environmental construction for long-term human sustainability, it is necessary to further broaden the temporal dimension of research based on existing studies, predict future trends in ecological environment evolution, and optimize adaptive management strategies accordingly. On the other hand, there is currently a lack of research using tourist cities as case study sites. As an important economic and social activity with distinct human-environment interactions, tourism can negatively impact natural ecosystems [4,5], mainly due to the blind “de-naturalization” of tourism destination development, which fails to reflect the connotation of “ecotourism truly”.
Against this backdrop, this study explores the spatiotemporal evolution characteristics of ERI and ESV within the jurisdiction of Sanya City (limited to the main land area), predicts the trends of these two factors, and delineates ecological zones, aiming to provide support for alleviating the contradictions between urban ecological protection and construction development, promoting the sustainable use of land resources, and driving high-quality regional development. Therefore, the key scientific questions focused on in this paper are:
  • How have the ESV and ERI in Sanya City changed during the study?
  • What are the ecological zoning results of Sanya City in 2030? Compared with the zoning results in 2020, what dynamic changes will occur?
To address the above issues, this paper sets the following three specific objectives: (1) evaluate the spatiotemporal changes in ESV and ERI in Sanya City for the years 2000, 2010, and 2020; (2) predict future land-use scenarios using the PLUS model and obtain the ESV and ERI in 2030; (3) delineate ecological zones based on the predicted ecosystem service value and ecological risk, and to propose corresponding ecological management strategies, aiming to provide references for regional ecological security as well as the monitoring and protection of the ecological environment. In summary, this study addresses the temporal dimension gap in existing research, improving the timeliness and adaptability of zoning schemes. Integrating the two key dimensions of regional development through the ESV-ERI approach establishes a scientific basis for decision-making in similar tourism-oriented cities. It holds significant value for achieving economic growth and ecological conservation synergy.

2. Materials and Methods

2.1. Overview of the Study Area

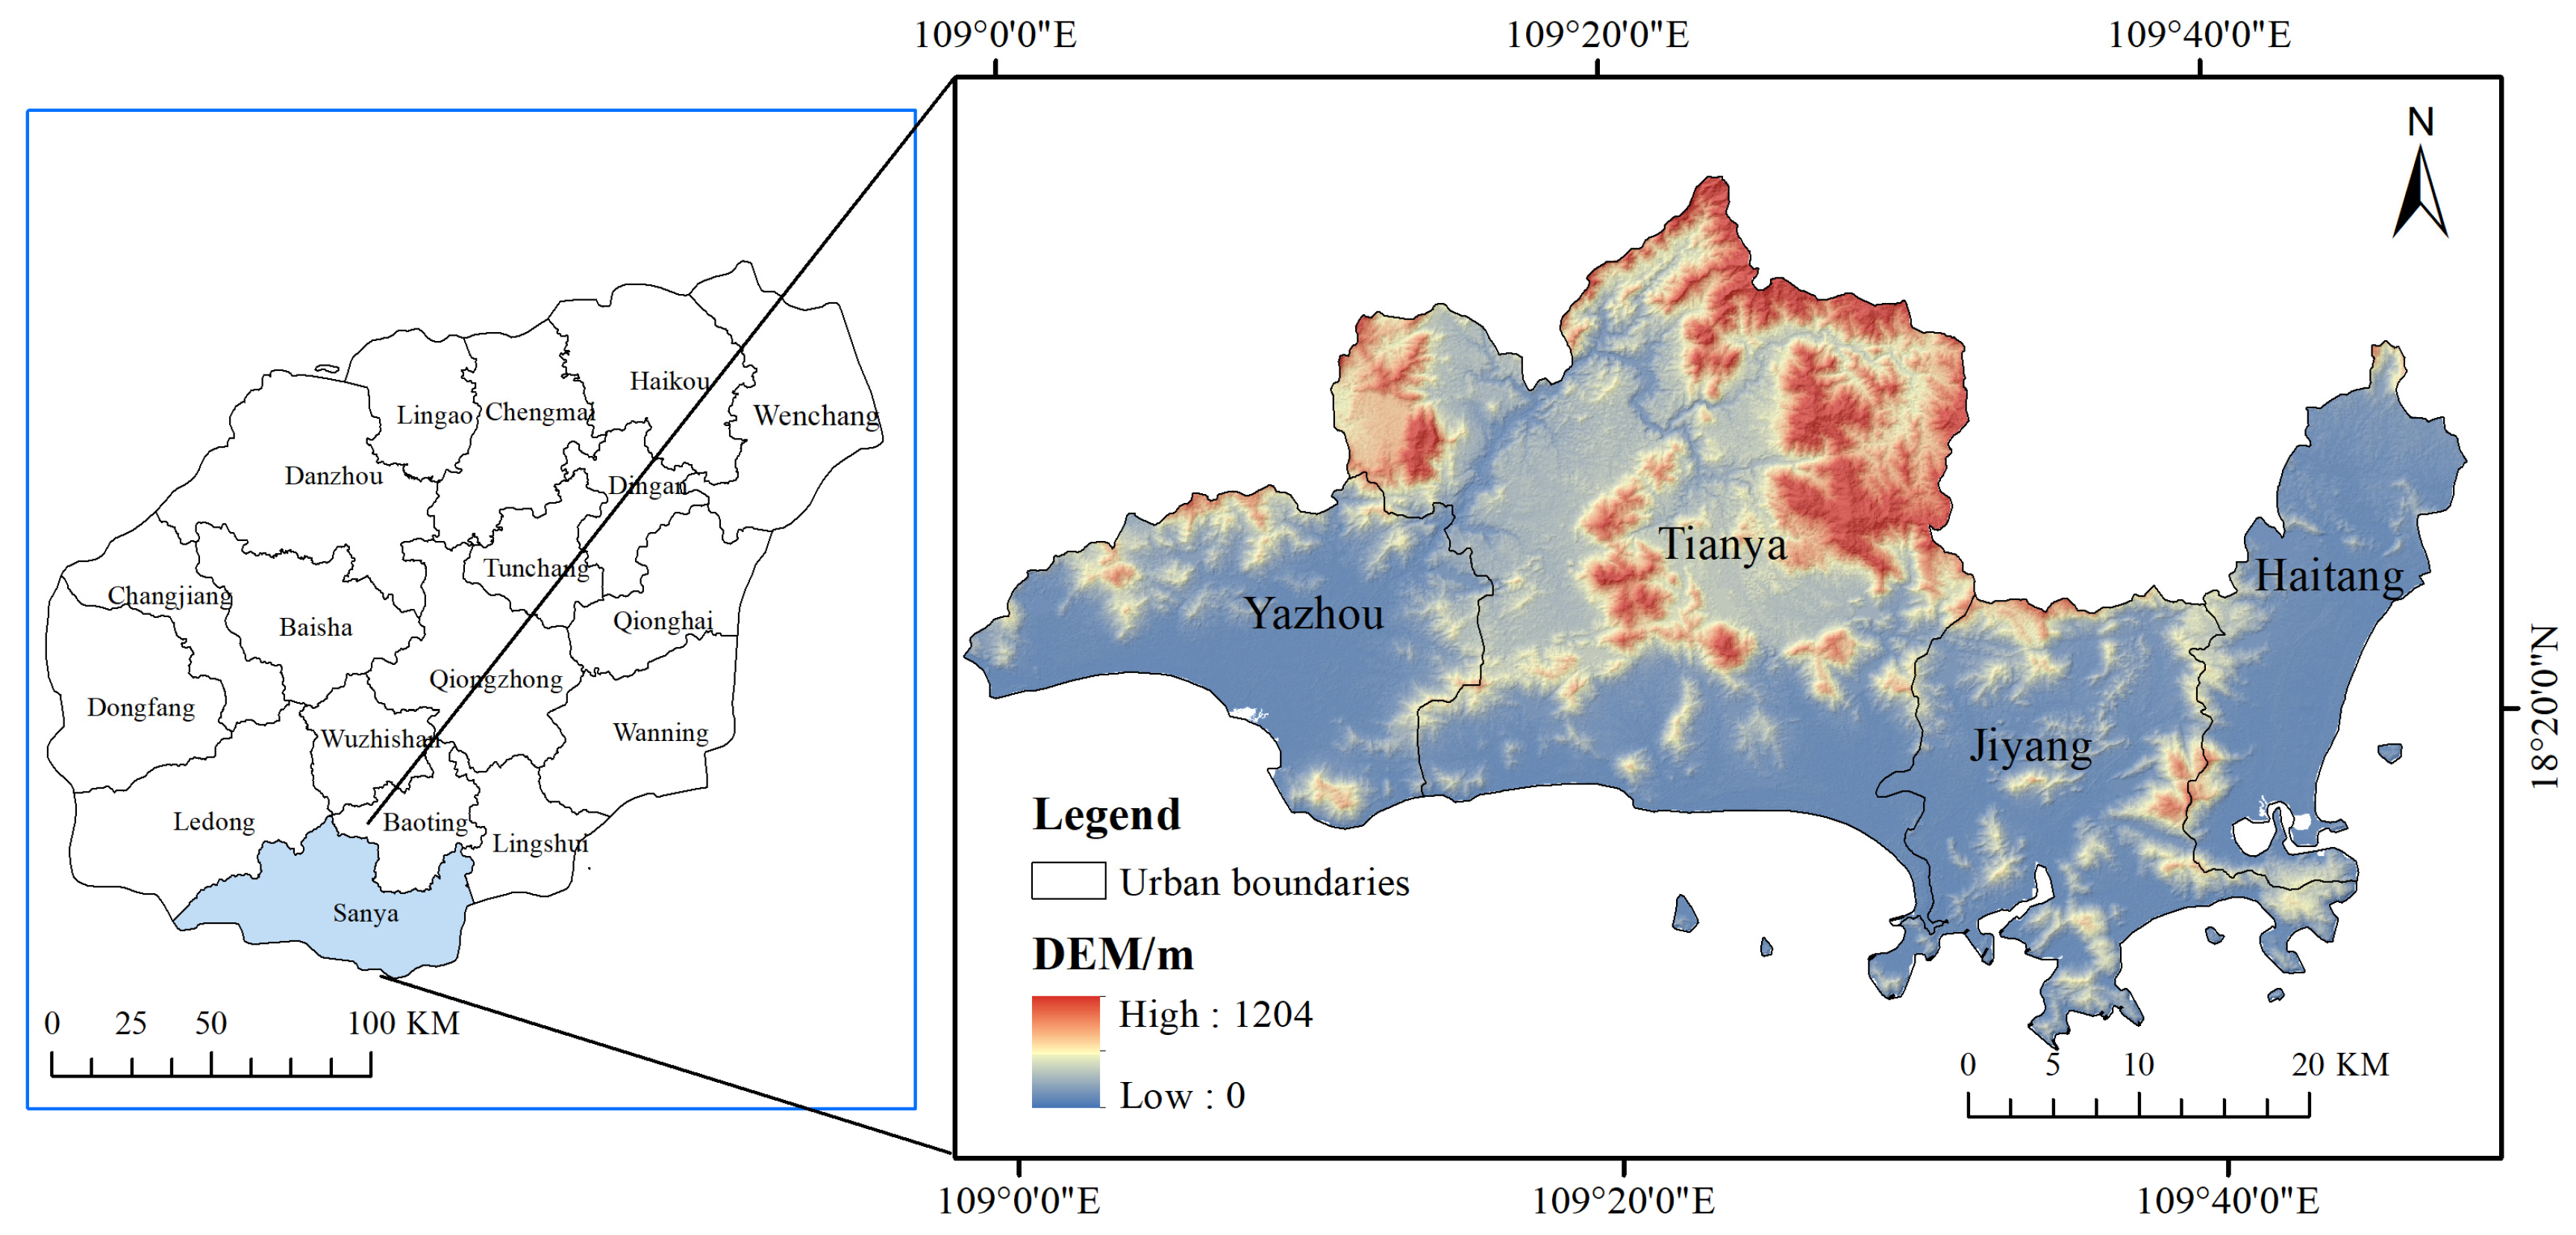
Sanya City is located in the southern part of Hainan Province. It features a tropical marine monsoon climate, characterized by warm and humid conditions throughout the year, with an average annual temperature of about 25 °C. The city’s total land area is approximately 1919 km2, comprising four administrative districts: Jiyang, Tianya, Yazhou, and Haitang. With mountains to its back and the sea in front, Sanya City has vast farmlands in the central area, and its terrain shows a distinct characteristic of being higher in the north and lower in the south. The highest peak in the northern mountainous region reaches 1011 m, while the southern part faces the South China Sea with a flat topography. The city’s landform, extending from north to south, successively includes mountains, hills, terraces, plains, and coastal zones, forming a multi-level topographical unit and a complete “mountain-river-sea” ecological continuum (Figure 1). These unique natural geographical conditions have nurtured one of China’s most typical tropical marine and terrestrial composite ecosystems. In recent years, under the Belt and Road Initiative framework and the Hainan Free Trade Port policies, Sanya City has been accelerating the attraction of global investment and talent, injecting new momentum into urban development. Despite its rapid urbanization, Sanya City faces issues such as over-reliance on the tourism industry, continuous encroachment of urban construction land on ecological land, increased landscape fragmentation, and compromised ecosystem service functions, further increasing ecological risks. There is an urgent need to promote the synchronous improvement of regional ecosystem services and environmental security while maintaining rapid economic development to achieve sustainable development.

2.2. Data Sources and Processing

The datasets employed in this study are listed in Table 1. All land-use data and driving factors were obtained from authoritative platforms to ensure accuracy and completeness. This study is based on multi-source data from 2000, 2010, and 2020. The data mainly includes data on land-use, socio-economic, natural geographical, and transportation accessibility. The land-use data were obtained from the Resource and Environmental Science & Data Center (https://www.resdc.cn/ accessed on 22 August 2025). According to the land-use characteristics of the study area and the Land Use Status Classification (GB/T21010—2017) [32], land-use types were classified into six categories: cropland, forest land, grassland, water bodies, bare land, and construction land. Grain yield and average national grain prices were derived from the Sanya City Statistical Yearbooks and the National Compilation of Agricultural Product Cost and Benefit Data for 2000–2020. Data on population density, rural settlement locations, per capita GDP, soil, temperature, and precipitation were sourced from the Resource and Environmental Science & Data Center (https://www.resdc.cn/ accessed on 19 March 2025). The DEM data with a spatial resolution of 30 m were obtained from NASA (https://www.earthdata.nasa.gov/ accessed on 16 March 2025). Primary traffic data, including expressways, national highways, provincial roads, county roads, and railways, were obtained from the OpenStreetMap platform (https://www.openstreetmap.org/ accessed on 19 March 2025). District government location data were sourced from the National Geographical Information Resource Catalogue Service System (https://www.webmap.cn/ accessed on 19 March 2025).
The grid method can accurately reflect spatial differences in relevant data and improve the analytical precision of ESV and ERI [33]. The optimal grid size is typically 2–5 times the average landscape patch area [34]. After comprehensively considering the study area’s size and experimental testing, this study selected a 1 km × 1 km grid as the evaluation unit. To ensure the proper functioning and simulation accuracy of the PLUS model, ArcGIS 10.8 was used to unify the spatial coordinates of the land-use and driving factor raster data required by the model to WGS 1984/UTM zone 48 N, with a resolution of 30 m. All raster data were clipped using a unified study area boundary shapefile (shp) to ensure consistency in the processing scope and the number of rows and columns across all datasets.

2.3. Research Methods

2.3.1. Ecological Risk Assessment

The ecological risk index effectively assesses the likelihood and severity of negative impacts on landscape patterns in the study area caused by natural or human factors [35]. In this research, the ecological risk index is created based on the landscape structure of the regional ecosystem, including three indices: landscape disturbance index, landscape fragility index, and landscape loss index. Fragstats 4.2 software is employed to calculate these landscape indices, resulting in the ecological risk index for each evaluation unit and highlighting the spatial differences in ecological risk within the region. The relevant calculation formula is provided bellows:
E R I k = i = 1 n A k i A k × R i
where ERIk is the ecological risk index of the k-th risk sub-area; i corresponds to six different landscape types; Aki is the area of landscape type i within the k-th evaluation unit; Ak is the total area of the k-th evaluation unit; Ri represents the landscape loss level of landscape type i reflecting the extent of loss experienced by the ecosystem represented by each landscape type under combined natural and anthropogenic disturbances, and is determined by the landscape fragility Vi and the landscape disturbance index Ei and its calculation formula is as follows:
R i = E i × V i
where Vi is the degree of landscape fragility, which indicates the ecosystem’s vulnerability to strong human-induced external disturbances, the ecological risk is reduced when the fragility is low [36]. Referring to existing research [37], vulnerability indices were assigned to cultivated land, forest land, grassland, water bodies, construction land, and unused land; after normalization, the values are 0.19, 0.10, 0.14, 0.24, 0.05, and 0.29, respectively.
It is calculated by normalizing the values for each land-use type. Ei is the landscape disturbance index; its specific calculation formula is shown in the table.
E i = a C i + b N i + c D i
Referring to existing research, where a, b, and c correspond to the weight values of 0.5, 0.3, and 0.2 [38]. Ci is represents landscape fragmentation, reflecting changes in landscape structure, function, and ecological processes. Ni is landscape isolation, which refers to the degree of separation of individual patches of landscape types. Di is landscape dominance, used to describe the supremacy of patches within a given landscape type [39]. The detailed explanations of these three indices are provided in Appendix A3.

2.3.2. Ecosystem Service Value Assessment

Based on the ecosystem service value equivalency table established by Xie et al. [40,41], the economic value of a unit ecosystem service value equivalency in China is determined to be 3406.50 yuan/hm2. According to data statistics, the average actual grain yield per unit area in Hainan Province during the study period was 4385.17 kg/hm2, while the national average grain yield per unit area during the same period was 5305.59 kg/hm2. The ecosystem service equivalency correction coefficient for the study area is calculated to be 0.827. Accordingly, the ecosystem service value per standard equivalency unit in the study area is 2815.54 yuan/hm2. Combined with the research results of Lei et al. on Hainan Island and its local areas [42], the ecosystem service value equivalency for Sanya City is revised. The value equivalency for construction land is zero and is not included in the calculation. Based on the revised value equivalencies and the areas of different land-use types, the value coefficients for provisioning, regulating, and cultural services per unit area in Sanya City are obtained (Table 2):

2.3.3. Ecological Zoning Identification

Z-score standardization eliminates dimensional differences between the two indicators and renders them directly comparable [29]. This study standardized ESV and ERI for the 2151 grid cells across Sanya City. After standardization, the zero value was used as the cut-off point to classify each grid into either high (Z > 0) or low (Z < 0) categories. Statistically, zero represents the city-wide mean, while positive and negative values indicate deviations above or below this mean. The resulting four-quadrant diagram uses the standardized ESV as the x-axis and the standardized ERI as the y-axis. The four quadrants correspond to four distinct ecological zones: (1) high ESV–high ERI, (2) low ESV–high ERI, (3) low ESV–low ERI, and (4) high ESV–low ERI. Grid cells falling into each quadrant are assigned to their respective ecological zone [27] The specific calculation formulas are as follows:
x = x i x - S
x - = 1 n i = 1 n x i
S = 1 n i = 1 n ( x x - ) 2
where x denotes the standardized ESV (or ERI); xi represents the ESV (or ERI) of grid cell i; x - is the mean value; n is the total number of grids; and S is the standard deviation.

2.3.4. Natural Scenario Prediction Based on the PLUS Model

The PLUS model is primarily used to predict land-use change. It integrates the Land Expansion Analysis Strategy (LEAS) and the Cellular Automata (CA) model based on a multi-type random seed mechanism. The PLUS model offers a more interpretable explanation of the factors influencing land-use changes and achieves higher simulation accuracy [43].
The LEAS module extracts the expansion areas of different land-use types based on the land-use data from 2010 and 2020. It employs the random forest algorithm to output the development probability of each land-use type and the contribution degree of its driving factors, achieving a probabilistic expression and quantitative interpretation of the land-use expansion process [44]. Using the initial land-use data, the CA module simulates the future land-use spatial pattern of the study area by adjusting various parameter values and integrating random seed generation technology with a threshold decrement mechanism [45].
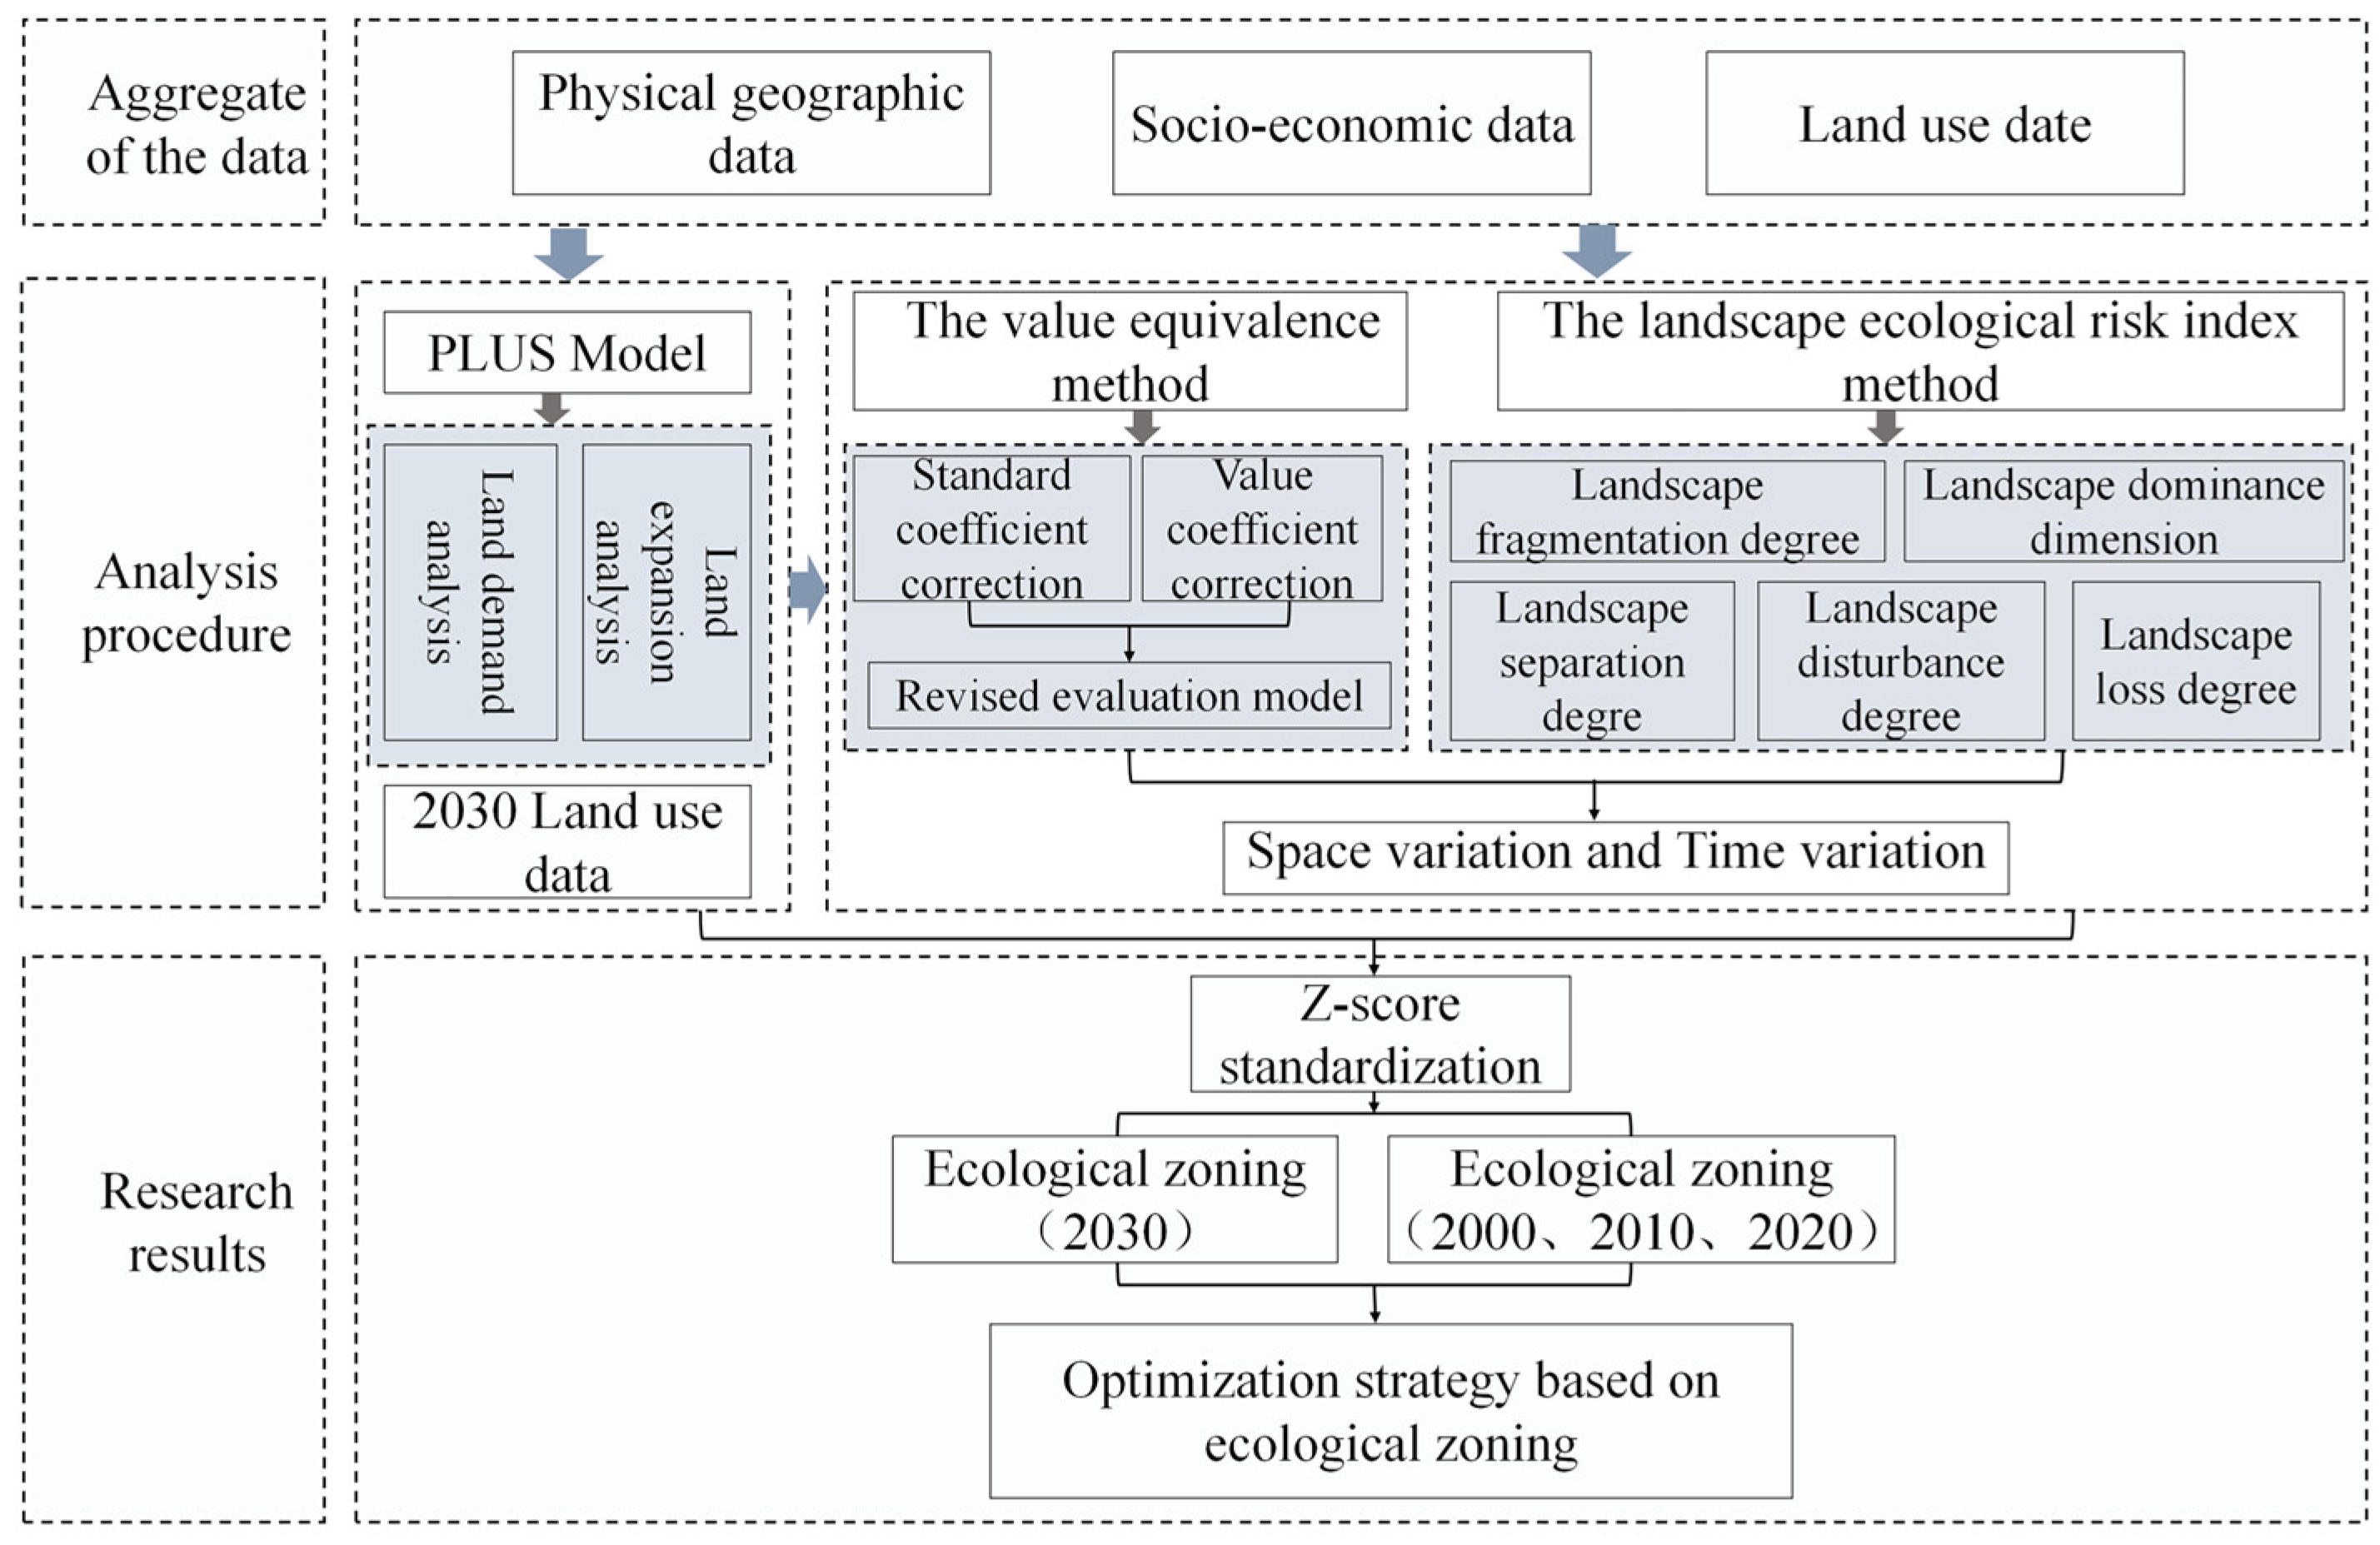
This study employed PLUS V1.4 for simulation. In selecting driving factors and setting their weights, we followed established research [27,46,47] and comprehensively considered natural geography, socio-economic conditions, and traffic accessibility. A total of sixteen driving factors were selected, including elevation, GDP, population density, and annual precipitation, with consistent weights assigned to all drivers [48]. To ensure the accuracy of the PLUS model, land-use conditions for 2020 were predicted using 2000 and 2010 as baseline years and then compared with the actual 2020 land-use data (Figure A1). The Kappa coefficient was used to evaluate simulation accuracy; the validation yielded a Kappa coefficient of 0.823 and an overall simulation accuracy of 0.917 (Table A1). These results indicate that the PLUS model performs reliably and can be used to project future land-use patterns in the study area. After confirming the model’s reliability, the study incorporated land-demand quantities (Table A2), the land-transition cost matrix (Table A3), and neighborhood weights (Table A4) to generate the 2030 land-use dataset under the natural-development scenario (Figure A2). Figure 2 illustrates the technical route of this study.

3. Results

3.1. Land-Use Changes

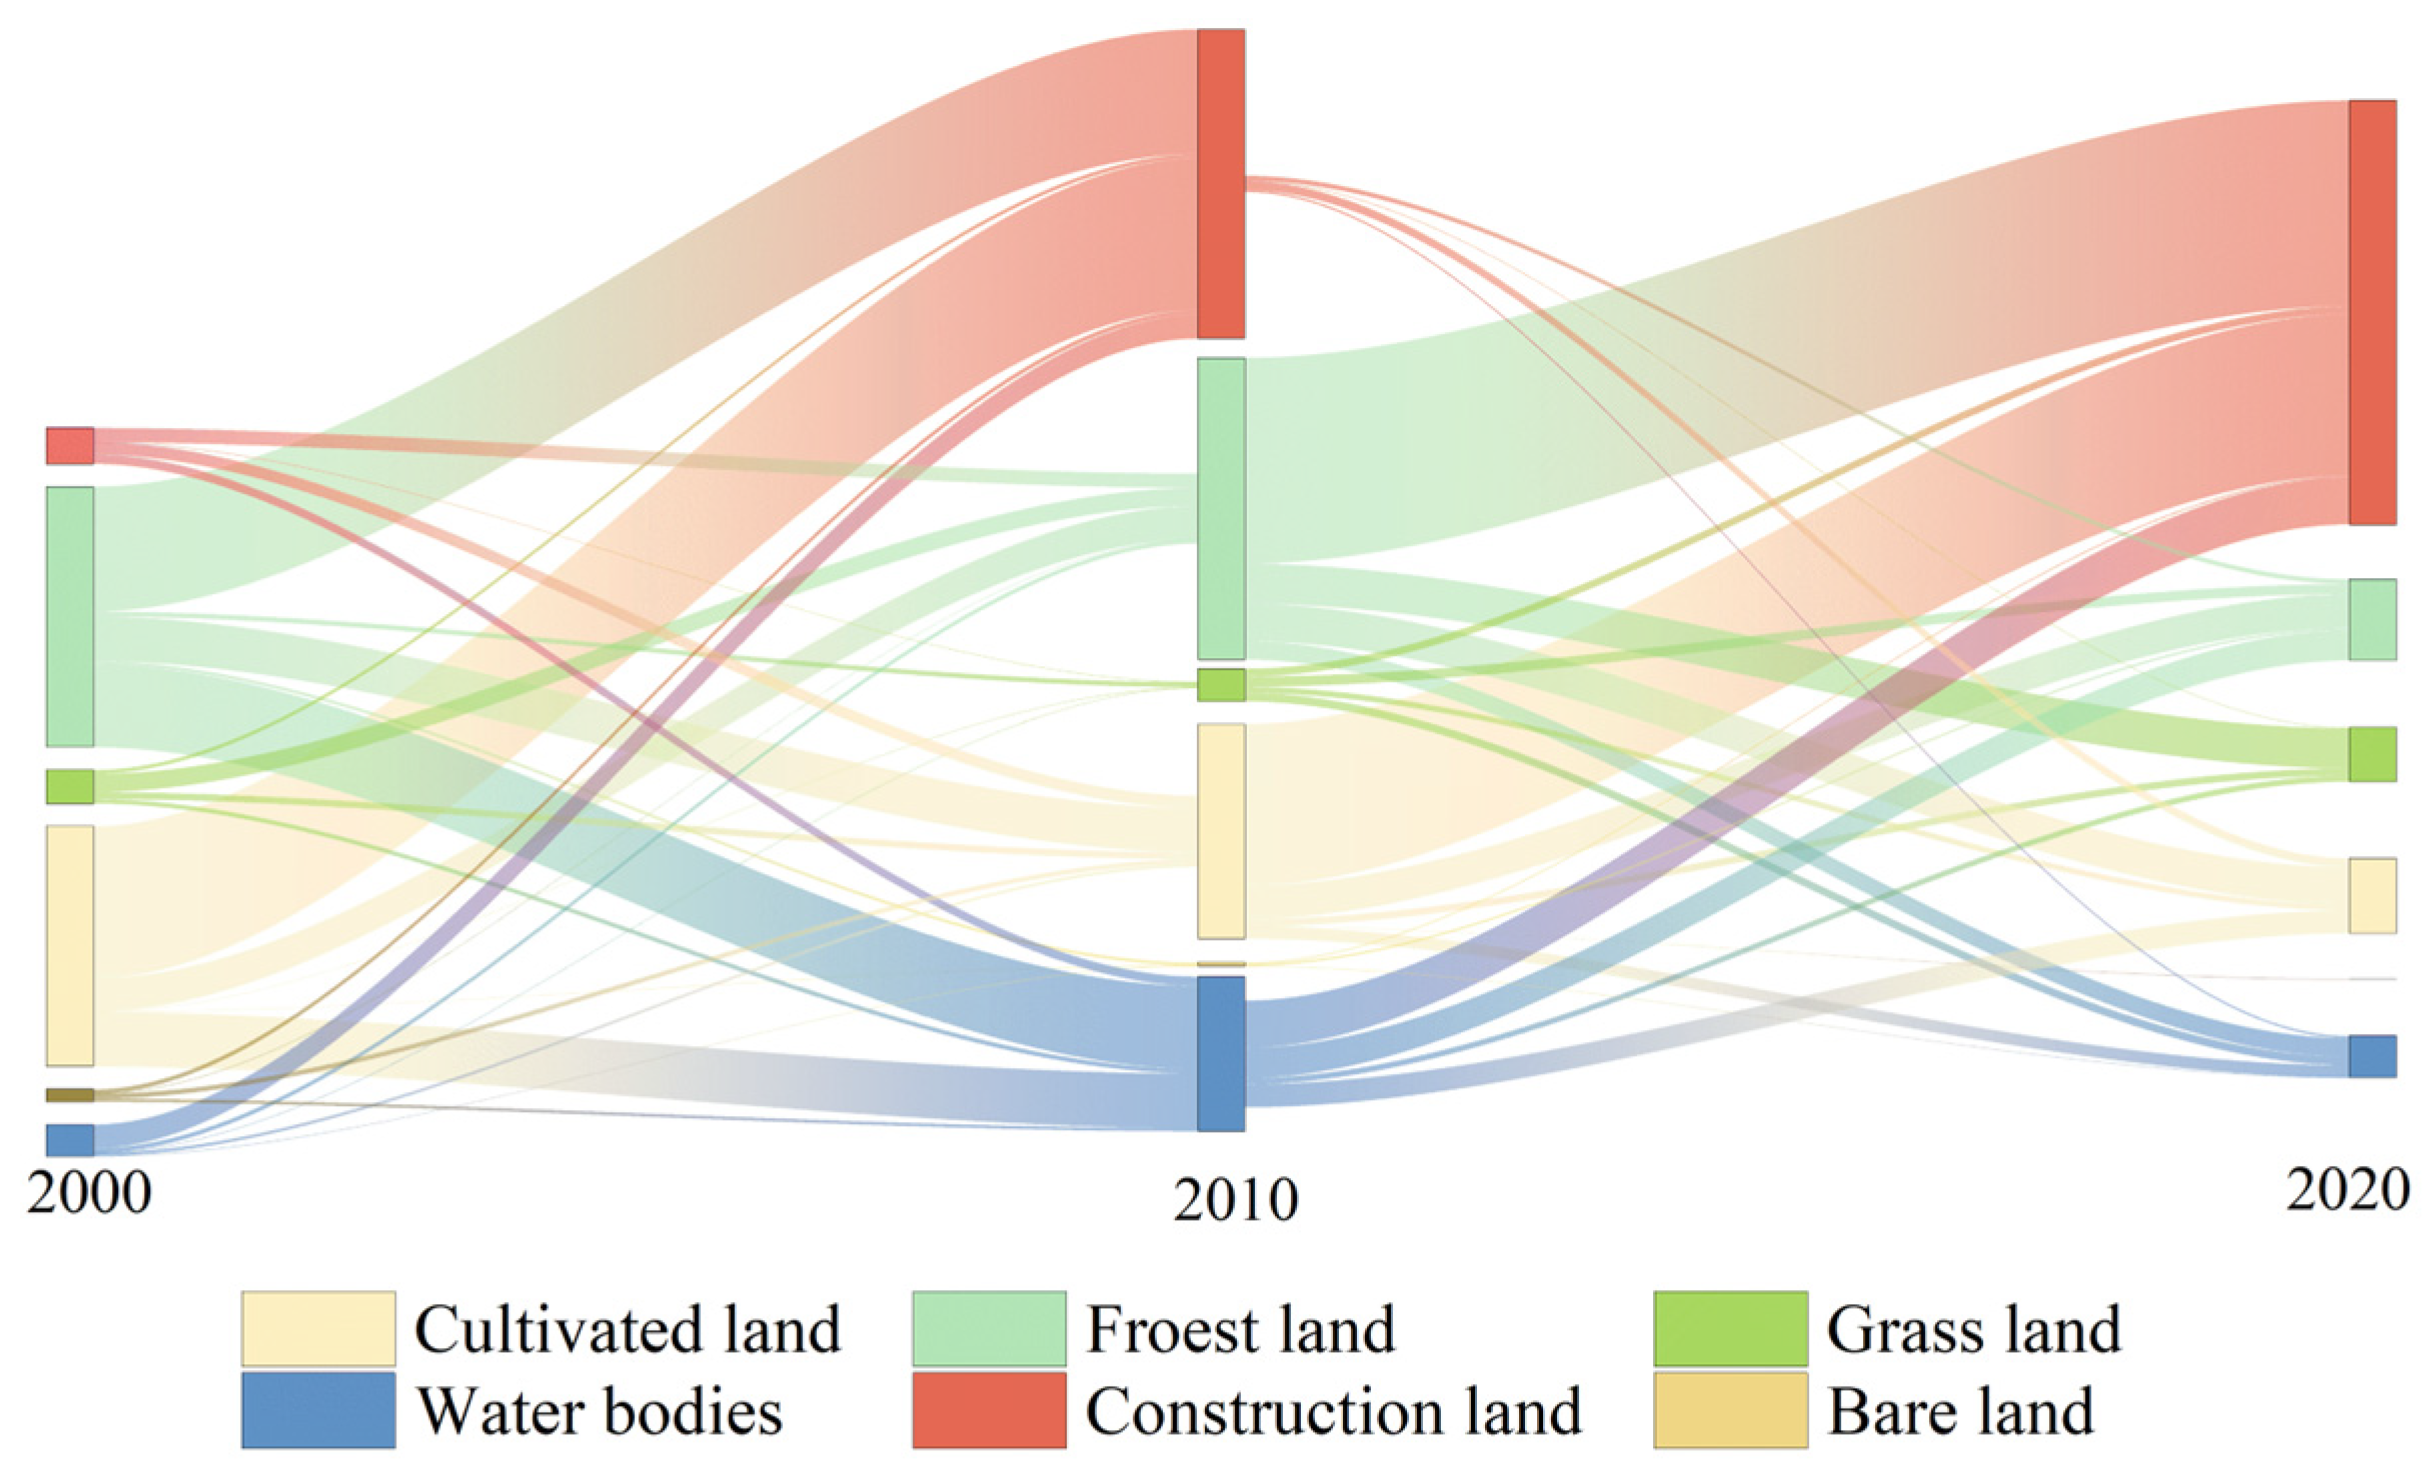
As shown in Figure 3, the land-use types in Sanya City experienced various changes during the study period. Forest land was the dominant land-use type in the study area, accounting for approximately 75% of the total area, followed by cultivated land, which made up about 15%. In terms of change trends across periods, from 2000 to 2010, water bodies and construction land increased by 31.40% and 105.39%, respectively, while all other land-use types declined. Between 2010 and 2020, water bodies decreased by 12.53% compared to the previous decade, while the trends for the remaining types remained unchanged. Between 2000 and 2020, water bodies and construction land grew, with increases of 14.93% and 265.86%, respectively. Construction land expanded significantly, adding 10,488.87 hm2 over the two decades. Among the declining land types, unused land experienced the sharpest proportional reduction, mainly due to its small initial share. Cultivated and forest land decreased by 4653.36 hm2 and 6305.65 hm2, respectively. Because forest land occupies a large share of the total area, its relative decline appears modest, resulting in reduction rates of 16.1% for cultivated land and 4.3% for forest land (Table 3).
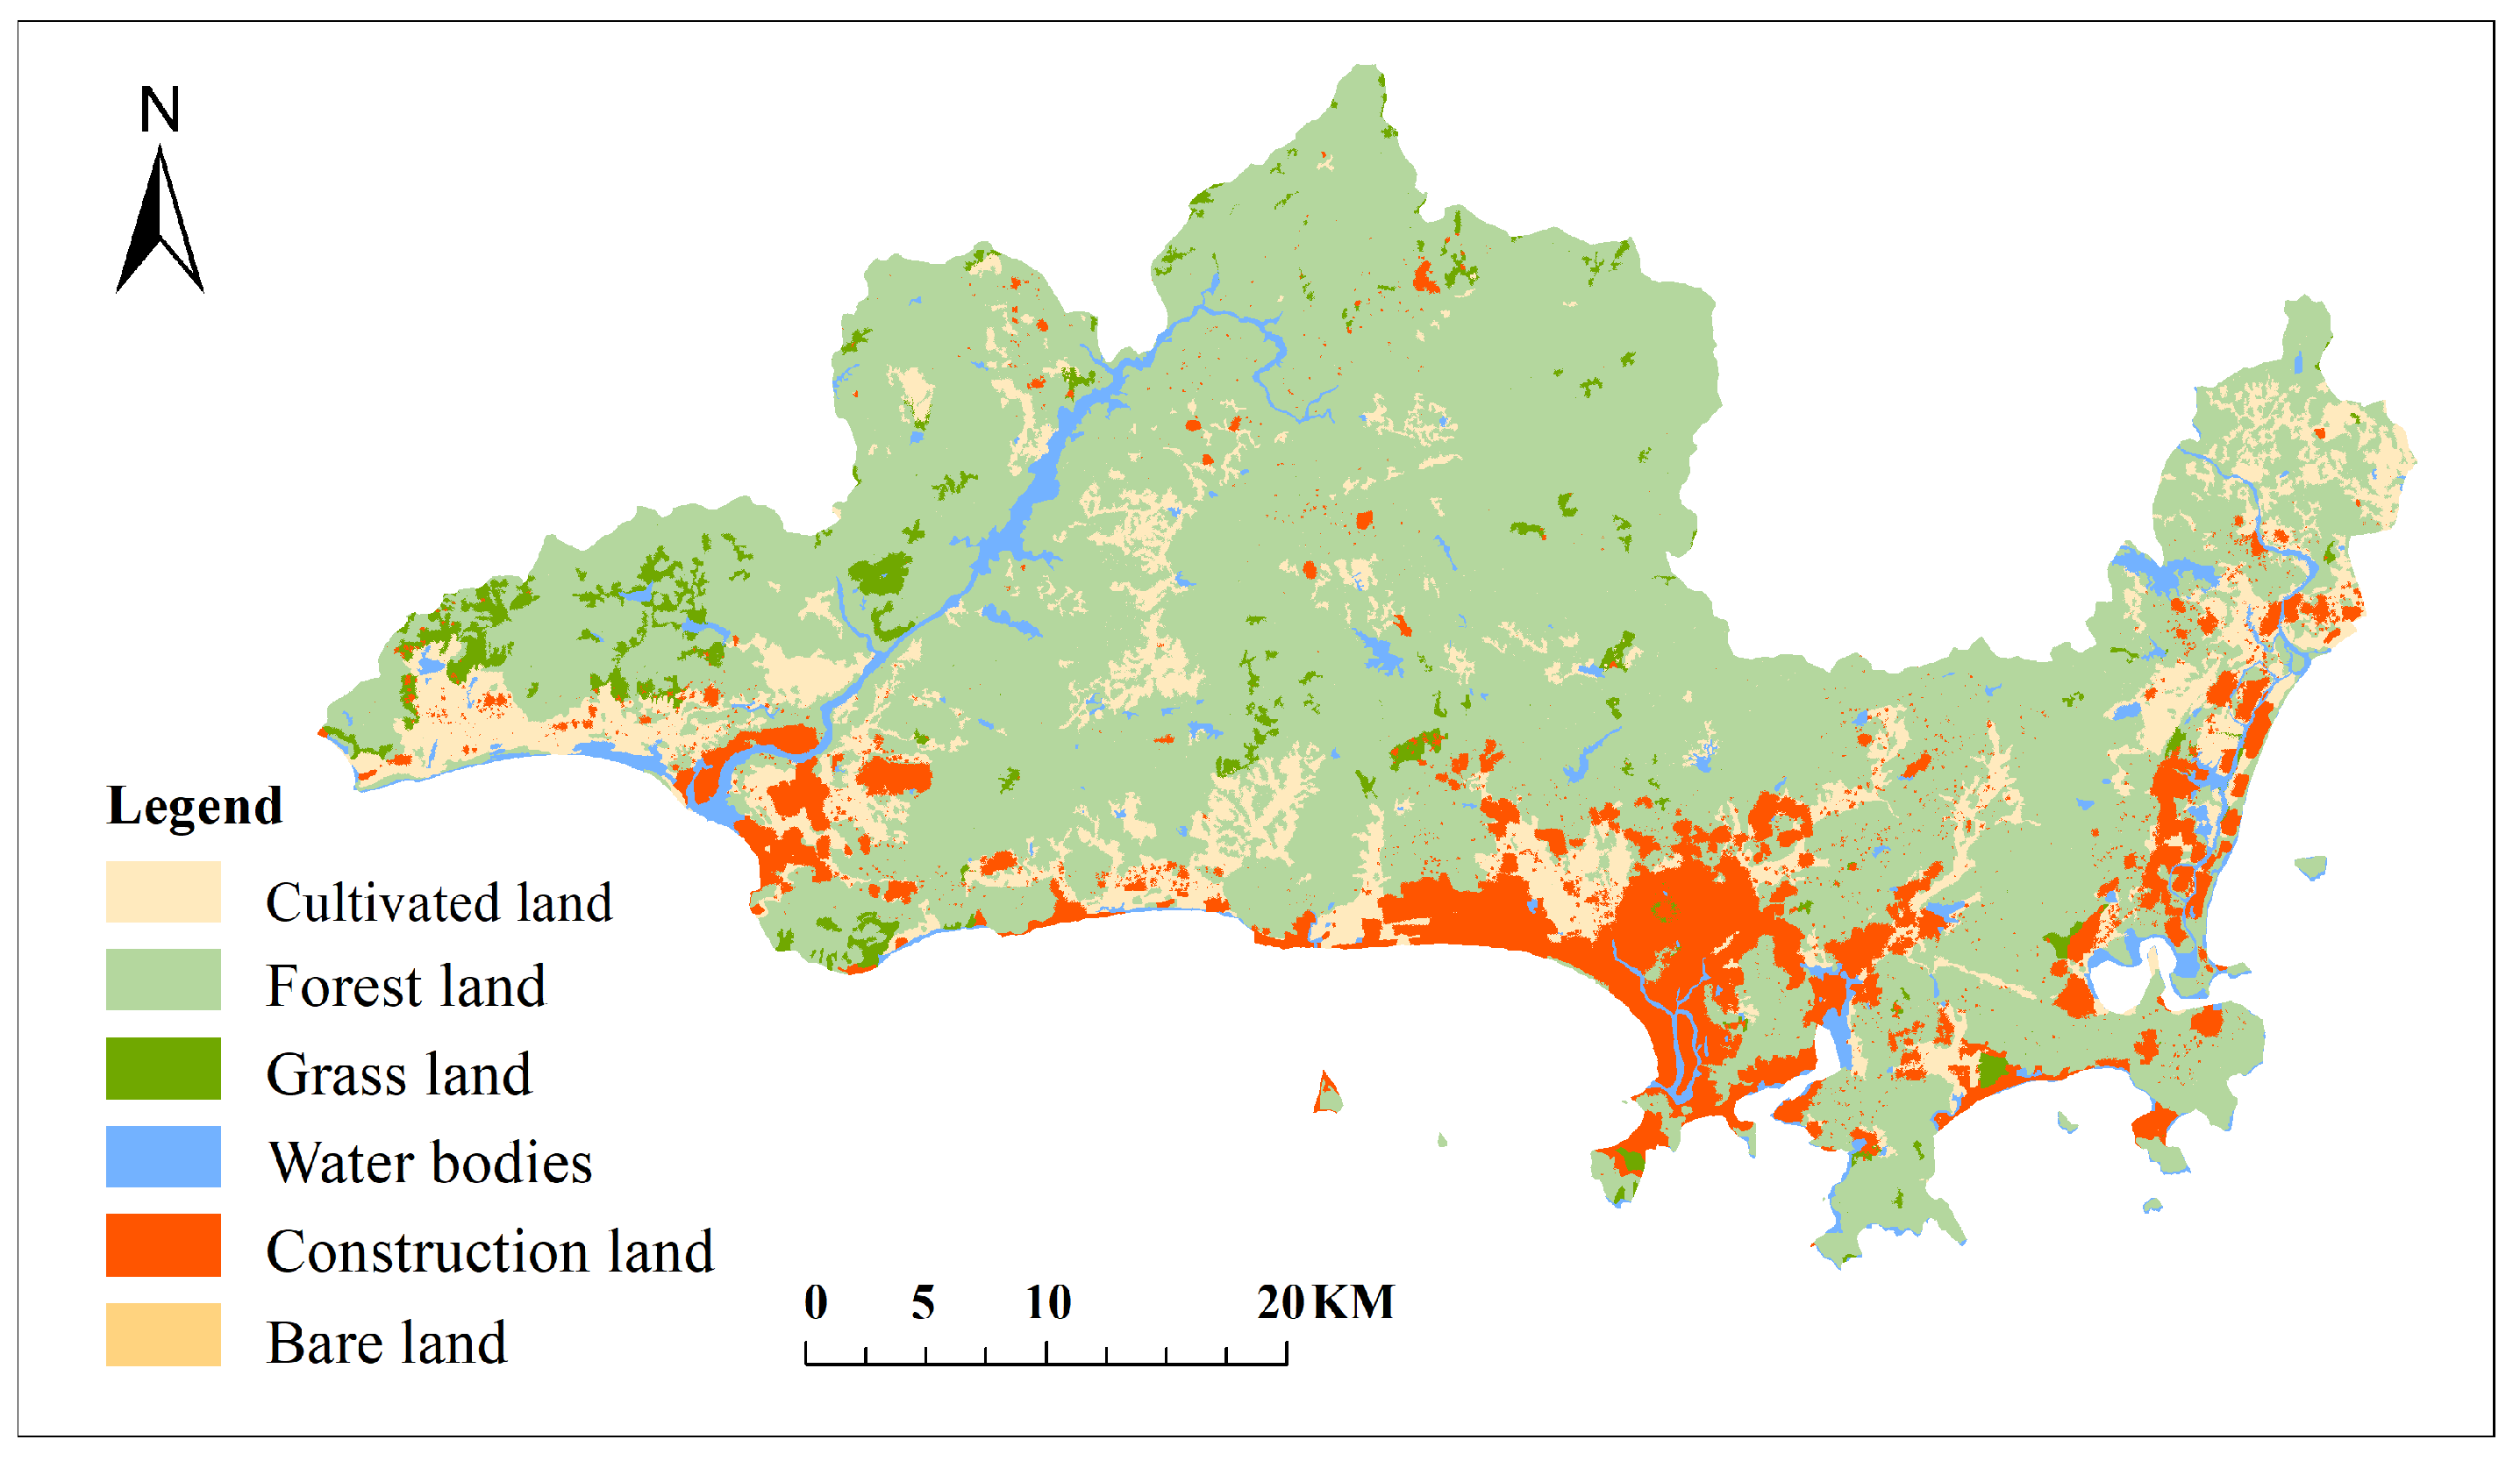
According to the Sankey Diagram of Land-Use (Figure 4), land types have continuously changed across the three periods. Between 2000 and 2020, the largest area of land conversion occurred from forest land, with a total of 4977.99 hm2 being converted into construction land. Cropland followed, with 4747.41 hm2 being converted into construction land, resulting in a significant increase in the construction land area. Some cropland and forest land were also transformed into water bodies. Specifically, 6161.68 hm2 of cropland and 1387.351 hm2 of forest land were converted into water bodies. These conversions to water bodies are mainly concentrated in the Ningyuan River basin in Tianya District. In contrast, the areas converted from construction land back to forest land and cropland were 156.781 hm2 and 163.351 hm2, respectively. This phenomenon mainly resulted from rapid urban tourism development in Sanya during its early stages, which increased the demand for land resources and consequently led to encroachment on surrounding forestlands and farmlands, ultimately altering the spatial land-use structure. As shown in Figure 2, urban construction land expansion during the study period predominantly occurred along the southern coastline, concentrating in Sanya Bay, Haitang Bay, and Yazhou Bay. These areas directly correspond to Sanya’s primary residential zones and tourism development districts, demonstrating the city’s active response to Hainan’s International Tourism Island policy by vigorously developing local tourism to boost economic growth and accelerate urban expansion. At the same time, this indirectly reflects the incomplete implementation of farmland protection and ecological conservation policies, resulting in an imbalanced land-use structure.

3.2. Spatiotemporal Characteristics of Ecological Risk

This study derived various landscape pattern indices for the period 2000–2020 using Fragstats 4.2 software (Table A5, Table A6 and Table A7), and calculated the landscape risk index through Formula (1). To visually represent the spatial distribution of ecological risk in each period, the ordinary kriging interpolation method in ArcGIS 10.8 was employed to obtain the spatial patterns of environmental risk for each year (Figure 5). The ordinary kriging method analyzes spatial autocorrelation through variogram modeling, effectively captures spatial variations in data, and generates prediction error surfaces, making it suitable for ecological risk data with strong spatial dependence [49].
Referring to previous studies [50], the natural breaks classification method was used, with the natural breakpoints of 2000 serving as the benchmark. The ecological risk index for each year was then divided into five ecological risk zones (Table 4), including low ecological risk areas (ERI ≤ 0.015), medium-low ecological risk areas (0.015 < ERI ≤ 0.017), medium ecological risk areas (0.017 < ERI ≤ 0.019), medium-high ecological risk areas (0.019 < ERI ≤ 0.021), and high ecological risk areas (ERI > 0.021).
Specifically, from 2000 to 2020, the areas of different risk zones in Sanya City exhibited stable increasing or decreasing trends. The areas of high-risk, medium-high-risk, and medium-risk zones showed an increasing trend, while the regions of low-risk and medium-low-risk zones decreased. From 2000 to 2010, the changes in the areas of different ecological risk zones were relatively mild. The increases in the regions of medium-risk, medium-high-risk, and high-risk zones were mainly due to the conversion from low-risk and medium-low-risk zones, increasing from 6.09%, 8.12%, and 6.63% to 6.39%, 8.39%, and 7.91%, respectively. From 2010 to 2020, medium-risk, medium-high-risk, and high-risk zones increased more rapidly, reaching 7.60%, 10.36%, and 9.65%, respectively.
Regarding spatial patterns, the overall spatial distribution of ecological risk in all three periods showed a “high in the south and low in the north” pattern. Most risk zones were low-risk and medium-low-risk, accounting for over 80% of the study area. However, as the study period progressed, the areas of low and medium-low-risk zones decreased from 63.76% and 15.39% in 2000 to 59.67% and 12.71% in 2020, indicating that the ecological risk in the study area has been increasing year by year. The medium and higher-risk zones were mainly distributed in Sanya City’s primary economic regions: Sanya Bay, Yazhou Bay, and Haitang-Yalong Bay, with a few in the Ningyuan River basin in Yazhou District. In contrast, the low and medium-low-risk zones were concentrated in the central and northern regions, with a small portion in the mountainous areas along the southern coastline.

3.3. Spatiotemporal Characteristics of Ecosystem Service Value

To clarify the spatial distribution pattern of ESV, this study used the natural breaks classification method based on the natural breakpoints of the year 2000 to divide the ESV of the three periods into five levels [50] (Table 5), namely low-value areas (ESV ≤ 2.8 × 10⁶), medium-low value areas (2.8 × 10⁶ < ESV ≤ 4 × 10⁶), medium value areas (4 × 10⁶ < ESV ≤ 5.6 × 10⁶), medium-high value areas (5.6 × 10⁶ < ESV ≤ 10 × 106), and high-value areas (ESV > 10 × 106).
The changes in ESV over the three periods are shown in Figure 6. The ESV in 2000, 2010, and 2020 were 1.11 × 10¹⁰ ten thousand yuan, 1.09 × 10¹⁰ ten thousand yuan, and 1.08 × 10¹⁰ ten thousand yuan, respectively, with reductions of 1.53 × 10⁸ and 0.57 × 10⁸ ten thousand yuan, resulting in a total decrease of 1.9%. Overall, the study area was predominantly characterized by medium-high value areas, which accounted for over 50%, while low-value and medium-low value areas were relatively small, occupying less than 15%. Despite the large proportion of medium-high value areas, their area has decreased yearly, from 57.91% in 2000 to 54.87% in 2020, with a reduction rate of 5.25%. In contrast, although low-value areas had a smaller proportion, their increase was significant, rising from 9.52% in 2000 to 12.55% in 2020, with an increase rate of 3.18%. This indicates that the ESV in the study area has been gradually decreasing. It is worth noting that high-value areas were distributed around water bodies and showed a positive correlation with water body area, indicating that between 2000 and 2010, the addition of numerous reservoirs in Tianya District increased the water body area and promoted the positive cycle of ecosystem services in the water body range.
From different landscape perspectives, the analysis of the value contributions of various landscapes to ecosystem service value shows that forest land had the highest contribution, followed by water bodies. The contribution of forest ecosystems accounted for about 80%, while water bodies accounted for 15%. Despite the high proportion of forest land in ecosystem service value, it showed a downward trend, decreasing from 80.2% in 2000 to 78.2% in 2020. Similarly, the contribution of cropland also reduced, from 3.1% in 2000 to 2.6% in 2020. In contrast, the contribution of water bodies increased, rising from 14.4% in 2000 to 16.9% in 2020, while the grassland change was insignificant (Table 6).

3.4. Ecological Zoning Construction

3.4.1. Evolution of Ecological Zoning

The scatter plot with ESV on the x-axis and ERI on the y-axis was obtained through Z-score standardization (Figure 7). Figure 8 illustrates the spatiotemporal changes in different ecological zones, which are represented by different quadrants: ecological control zones (high value-high risk), ecological early warning zones (low value-high risk), ecological improvement zones (low value-low risk), and ecological protection zones (high value-low risk). The changes in the areas of these zones are shown in Table 7.
The ecological control zones (H-H) had the lowest proportion and exhibited minor changes. The proportion fluctuated over the three periods but showed an overall downward trend, with 11.81%, 12.13%, and 11.60%, respectively. The main land-use types in this zone were water bodies and the surrounding construction land, which were primarily distributed in the Fenghuang Ridge of Sanya Bay, the Liupan Ridge of Yalong Bay, the Shiguilin Ridge of Haitang Bay, and the Ningyuan River water area in Yazhou District. As the fourth-largest river in Hainan Province, the Ningyuan River has abundant water resources that can be converted into significant ecological value. However, the surrounding areas of the river are often accompanied by human settlements, resulting in construction land and cropland. Over time, the formation of an urban area at the estuary of the Ningyuan River in Yazhou Bay indicates that human activities have, to some extent, increased landscape fragmentation and, consequently, landscape risk. Additionally, some high-value, high-risk areas exist in Haitang Bay and Yalong Bay. This is due to the varying degrees of development and construction in these areas, which have disrupted the original natural conditions. Although the original natural conditions were preserved during development, the increase in impervious surface areas in the surrounding regions has disrupted the benign ecological system cycle, decreasing environmental value.
The distribution of ecological early warning zones (L-H) is mainly concentrated along the bays, specifically in the three central urban areas of Sanya City: Sanya Bay, Yazhou Bay, and Haitang-Yalong Bay. This pattern aligns with the historical trend of urban expansion in the study area. The predominant land-use type in this zone is construction land, which has been continuously expanding over the three periods, accounting for 7.62%, 9.67%, and 11.75%, respectively. With the increasing level of urbanization in Sanya City, a significant amount of construction land has encroached upon the original cropland, forest land, and water bodies. This has led to a noticeable human-land conflict, resulting in a continuous decrease in ecological value and increased ecological risk within the zone.
The predominant land-use type in ecological improvement zones (L-L) is cultivated land. With the continuous decrease in cultivated land area over the years, this zone has also shown a declining trend, accounting for 22.46%, 21.48%, and 17.68% of the total area during the study periods, respectively. This zone is primarily distributed around economically active areas but lacks close connections with the economic core. Land-use intensity is relatively low, resulting in relatively low ecological risk. Since cultivated land has a relatively low contribution to ecosystem services, the ecological value it can provide is limited and significantly lower than that of other zones. The singularity of land-use type is also a significant characteristic of this zone, with relatively low human activity frequency, making it difficult to impact ecological changes significantly and thus maintaining a relatively stable ecological environment.
The ecological protection zones (H-L) account for approximately half of the total area of the study region, with area proportions of 51.60%, 49.37%, and 50.12% across the three periods, respectively. These zones are primarily located in the northern mountainous regions of the study area, with a smaller portion distributed in the southern coastal mountainous areas. The dominant land-use type is forest land, with a small amount of grassland. The northern part of this zone, specifically the Baopo Ridge, borders the Hainan Tropical Rainforest National Park and extends eastward and southward to include areas such as the Da Hui Ridge and Liupan Ridge. The high vegetation coverage and superior natural ecological environment in these zones result in minimal disturbance to the ecosystem, allowing for the provision of high ecosystem service value and the maintenance of a positive system operation. Additionally, due to the complex topography and distance from human activity centers, the ecological risk in these zones remains stable.

3.4.2. Ecological Zoning Based on the PLUS Model

By predicting land-use changes under a natural development scenario, obtained the 2030 landscape indices (Table A8). The corresponding changes in ERI (Figure 9a) and ESV (Figure 9b) were inferred, resulting in the ecological zoning status for 2030 under natural development (Figure 9c). As shown in Table 8, the ecological protection zones remain the largest in area proportion, accounting for 52.16% of the total area. The fastest-growing area is the ecological early warning zone, which is projected to account for 25.43% in 2030. The ecological control and improvement zones are expected to shrink in area compared to 2020. Figure 9c intuitively shows that a significant portion of the ecological control zones has been converted to ecological early warning zones compared to 2020.

4. Discussion

4.1. Impact of Land-Use Changes on ESV and ERI

Land-use changes alter landscape structure and characteristics, leading to the gradual replacement of natural ecological landscapes by urban landscapes [51,52]. Against the backdrop of accelerating global economic integration, China took the lead in launching the construction of Hainan International Tourism Island in 2008, and subsequently proposed the Free Trade Port development strategy in 2018. This series of significant policies has propelled Hainan Province into a stage of rapid development, facilitating the in-depth development of resources across the province, fast improvement of transportation infrastructure, and clustered development of modern service and tourism industries. Therefore, like most urban areas, the land-use changes in Sanya City are primarily associated with urbanization [53]. This study calculated the dynamic changes in ESV and ERI based on land-use data. The results indicate that during the study period, ERI increased while ESV decreased in Sanya City. This conclusion is similar to the findings of previous studies [29], suggesting that urban expansion is not conducive to the benign development of ecosystems. It is worth noting that this conclusion differs from some agriculturally dominated regions in Europe. For example, in the European Alps, land changes are mainly related to land abandonment and agricultural intensification [54], which have led to a decline in ecosystem services. In a study on Austria by Schirpke et al., it was also pointed out that urbanization and agricultural development can negatively impact ecosystem service functions [55].
During the study period, the area of low-value zones for ecosystem services in Sanya City continued to expand. As noted in the research by Wang et al. [56], The tourism-driven urbanization process has not yielded positive ecological effects. For instance, rapid urban sprawl and the construction of tourism facilities have encroached upon many natural habitats, particularly the degradation of key ecological areas such as cultivated land and forestland, which directly weakens the regulatory and supporting functions of the regional ecosystem. Although this development model has brought short-term economic benefits, it has failed to achieve coordinated progress between financial development and ecological protection. Instead, it has intensified conflicts in land use and increased the pressure on ecological carrying capacity. Notably, the high-value zones for ecosystem services are distributed around water areas, showing a positive correlation with changes in the area of water bodies. This phenomenon is closely linked to the expansion of water areas resulting from large-scale reservoir construction in Tianya District in recent years. The expansion of water areas has directly enhanced the regional hydrological regulation capacity and water resource supply services, strengthening the area’s soil and water conservation capacity, thereby forming a multi-level mechanism for improving service value. This confirms the multiple benefits of water resource management in optimizing ecosystem services.
During the study period, the area of high ecological risk zones in Sanya City gradually increased. This is consistent with the findings of Li et al. [57], primarily attributed to the fragmentation and division of landscape elements such as ecological green spaces and rivers during urban construction and tourism development. These phenomena have significantly weakened the ecological connectivity between patches while increasing the degree of landscape heterogeneity. The distribution of relatively high-risk zones around the central urban area and along the Ningyuan River indicates that the expansion of the Ningyuan River’s water area has been accompanied by human activities such as construction and farming, which have, to some extent, exacerbated ecological risks. In contrast, the central and northern regions, characterized by high forest coverage, have lower ecological risks. Additionally, the north area features greater topographic relief, and the mountainous regions gradually border the Hainan Tropical Rainforest National Park to the north, which has, to some extent, restricted the development of human activities, maintained favorable ecological effects in the region, and thus reduced ecological risks. The above studies show that unreasonable land changes negatively impact ecosystems and can lead to landscape fragmentation, exacerbating ecological risk. Therefore, it is necessary to conduct ecological zoning of urban space to provide a basis for the policy design and overall layout of urban ecological protection

4.2. Rationality of Zoning Method Based on ESV and ERI

This study improves the traditional ecological zoning method based on a single-factor index by using ESV and ERI as multi-dimensional evaluation aspects to construct a more comprehensive ecological zoning framework. ESV and ERI are indicators of ecological security [58,59], but they approach it from different angles. Ecological risk reflects the adverse impacts of landscape patterns and ecological processes, while ecosystem services reflect the harmonious coexistence of human-land relationships [60]. Both are essential in regional ecosystems’ health and sustainable development [61]. Early ecological zoning studies mainly focused on single indicators, using ESV and ERI as independent indicators to characterize the ecological environment. For example, Liang et al. used ecological risk to delineate ecological zones in the Qilian Mountains [62]. Bai et al. used a composite index of ecosystem services to delineate ecological zones in the Qinling-Daba Mountains region of China [63]. After evaluating ecological sensitivity, Raj et al. categorized The Aravalli Range into different ecological grades [64]. These methods have obvious limitations: they fail to reveal the synergies and trade-offs between different ecological processes, cannot accurately reflect the spatial association characteristics of ecological functions, and do not fully reflect the essential attributes of ecosystems as complex systems where safety constraints and development needs interact [31]. Considering that the rapid urbanization in Sanya City has been continuously encroaching on the original natural landscapes, causing certain ecological damage, the evaluation using ESV and ERI can clarify the interrelationship between the two, thereby maintaining the integrity and uniqueness of the ecosystem.
The specific methods adopted for zoning mainly include Z-score standardization and spatial autocorrelation. Although the spatial correlation method can present the spatial agglomeration characteristics of data, its analysis results are highly dependent on the selection of spatial weight matrices and sensitive to boundary effects, which easily lead to deviations [65]. Therefore, this study adopts the more basic and intuitive Z-score standardization method for ecological zoning to clarify the dynamic change relationship between ESV and ERI.

4.3. Optimization Strategies for Ecological Zones

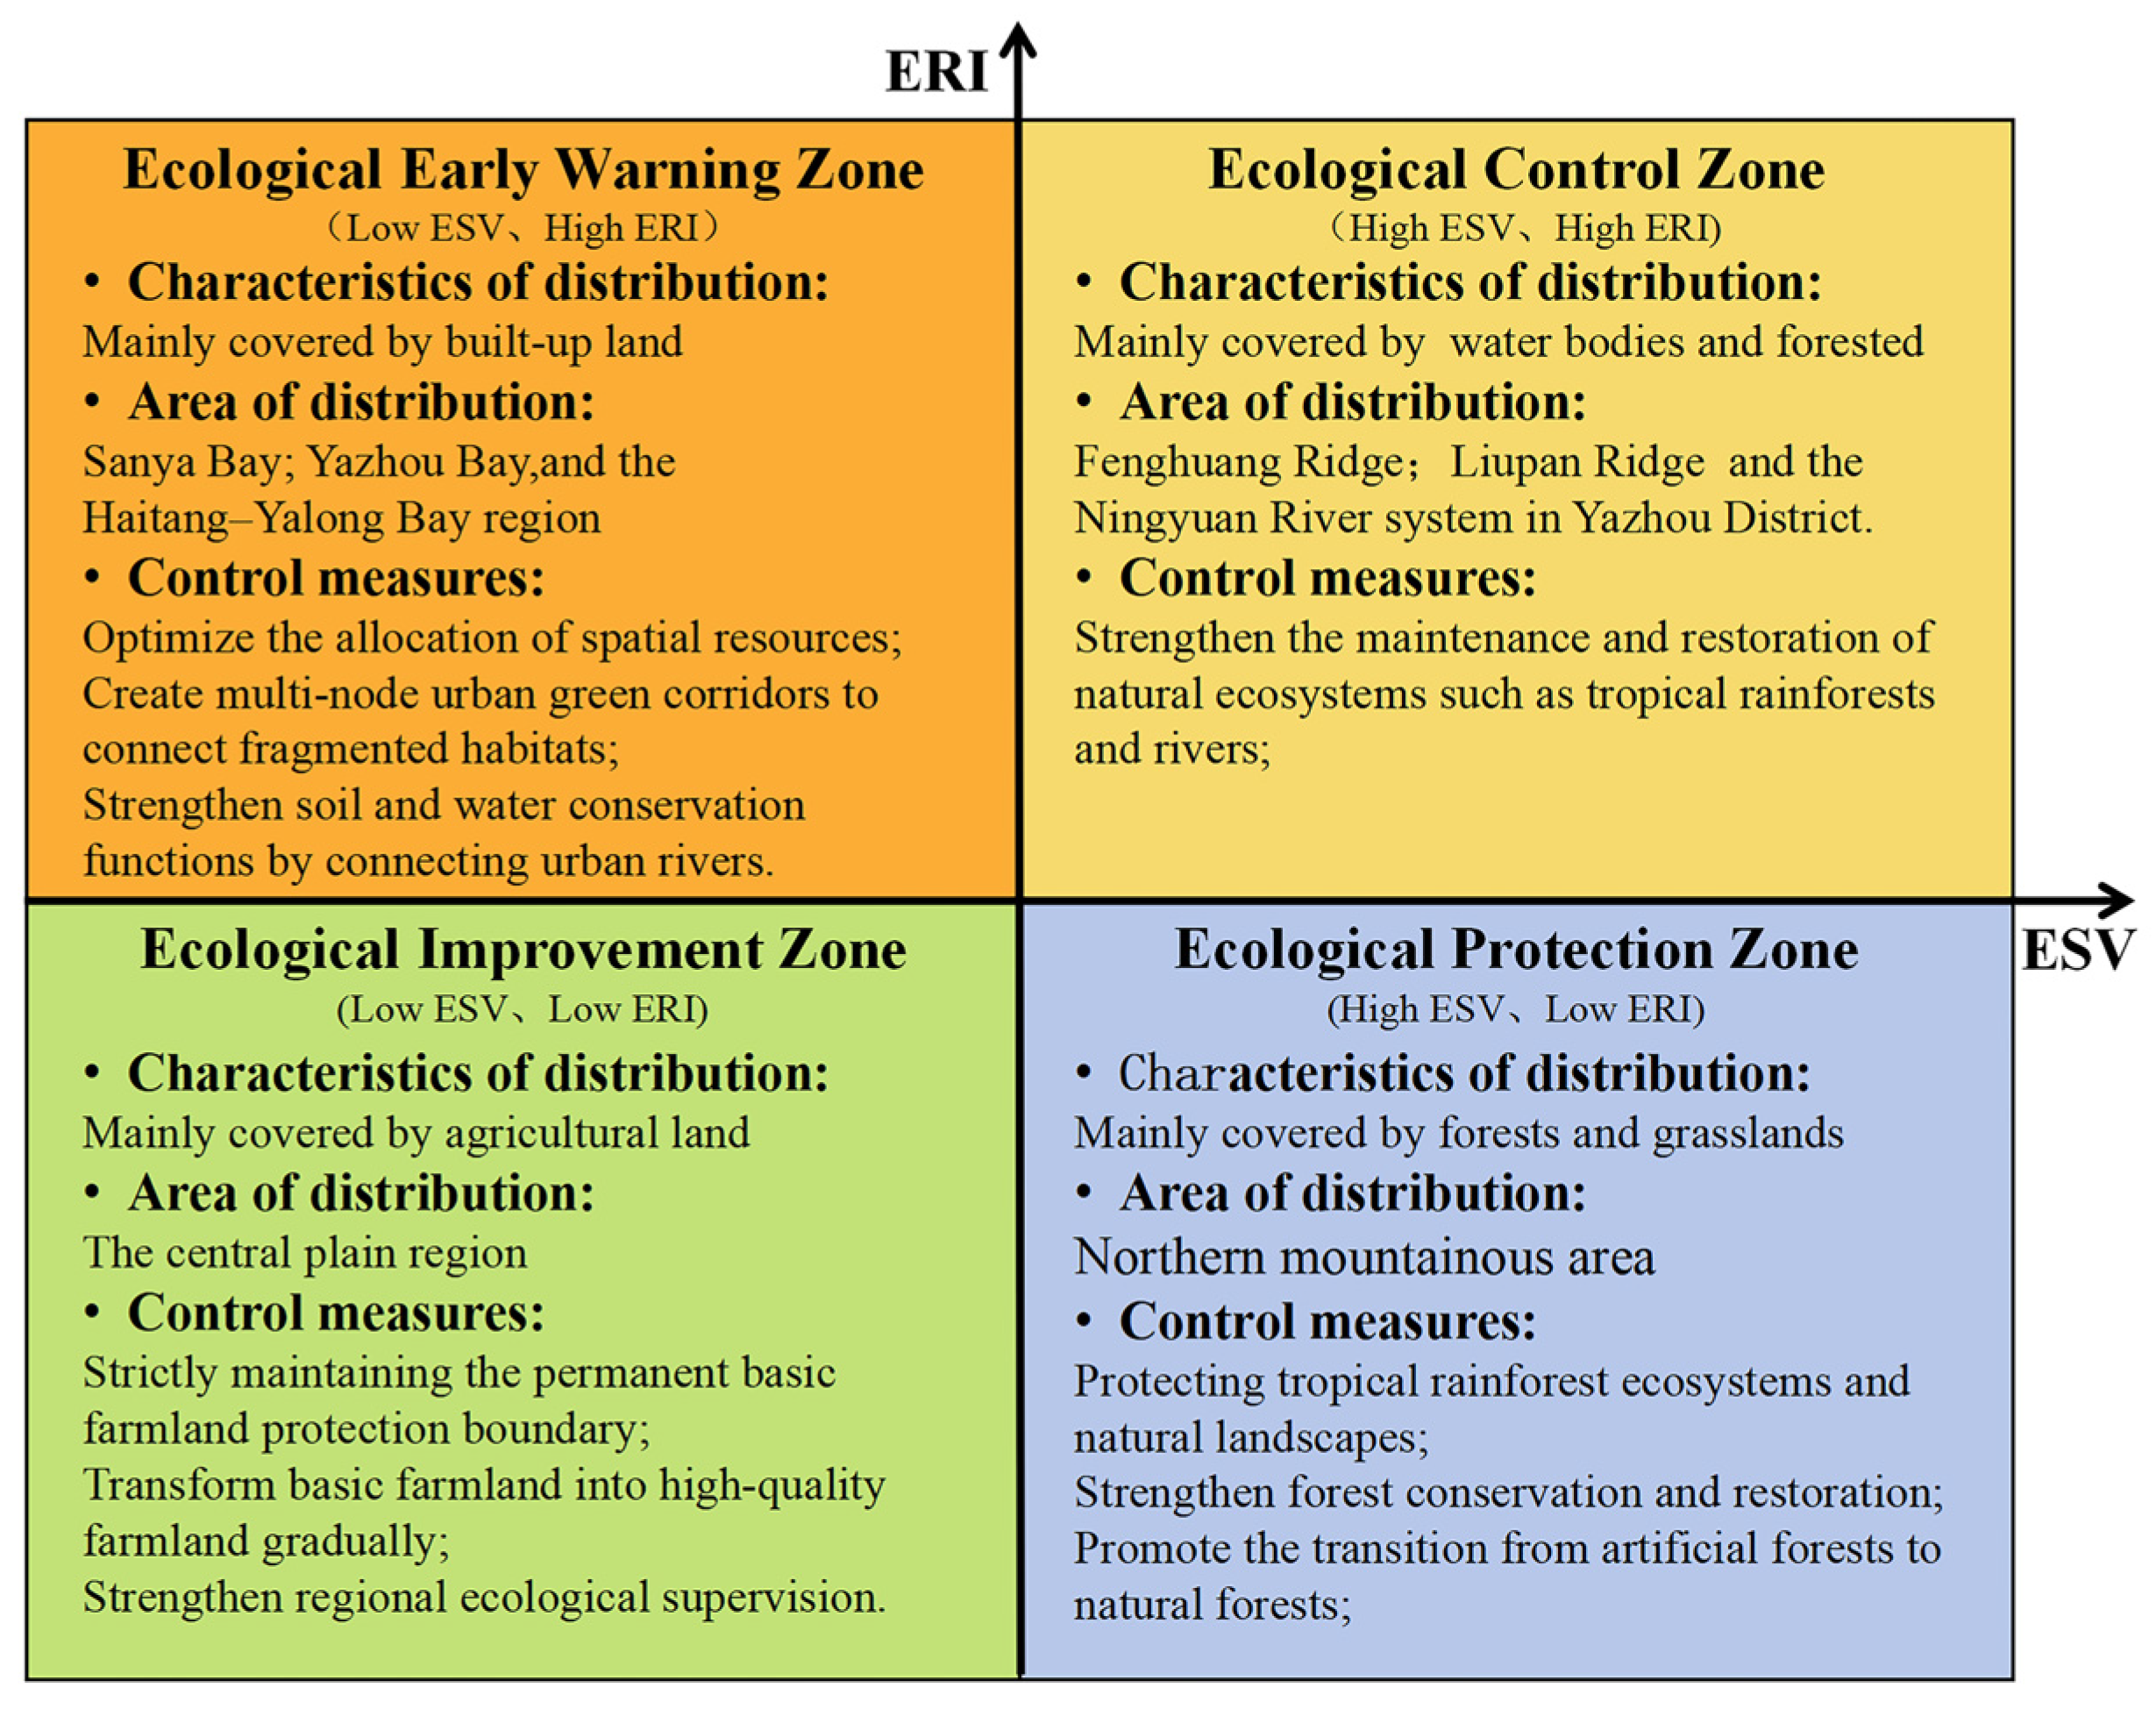
Differentiated ecological governance measures are formulated for various ecological zones based on the results of ecological zoning, comprehensively considering the spatial structure of urban economic development, prominent characteristics of the ecological environment, and the objective outcomes of landscape dynamics. Meanwhile, given Sanya’s position as a typical tourist city, environmental protection policies will be further strengthened to ensure a positive interaction between tourism development and environmental protection (Figure 10). The specific management strategies are outlined as follows:
(1)
Ecological Control Zone (H-H): This area is a priority region for ecological restoration and risk prevention, with “water bodies and forestlands as the primary land-use types. It is necessary to adhere to the concept that mountains, rivers, forests, farmlands, lakes, grasslands, and deserts form a community of life, strengthening the protection and restoration of natural ecosystems such as tropical rainforests and river basins. Adhering to the principle of overall planning for land and sea, measures such as water body restoration, protection of river basin corridors, protection and restoration of tidal flat wetlands, and protection and restoration of habitats for endangered species should be taken to strengthen the structure and functions of the aquatic ecosystem gradually.
(2)
Ecological Early Warning Zone (L-H): This area exhibits a high level of urbanization, with construction land as the primary land-use type and is a typical ecologically fragile region. Simulation results indicate that against the background of the construction of the Free Trade Port, this area will continue to expand. Such expansion reflects the demands of economic development and presents challenges to regional ecological security. To achieve ecological governance in this area, priority should be given to optimizing the allocation of urban spatial land resources. In ensuring land for industrial projects within the Hainan Free Trade Port, the landscape pattern of mountains and waters should be protected, and the characteristics of coastal cities should be preserved. Secondly, in response to the development needs of the tourism industry, the spatial pattern of “blue veins + green networks” will be developed by integrating ecological elements such as water systems and green spaces. Emphasis will be placed on constructing blue corridors dominated by water systems such as the Sanya River, Linchun River, and Ningyuan River, and ecological restoration projects will be carried out by considering rivers and their riparian zones in a coordinated manner. Simultaneously, projects to connect regional and urban green corridors will be developed, and an urban green network “connecting mountains and seas” will be constructed to ensure that tourism activity intensity aligns with the carrying capacity of the urban ecosystem.
(3)
Ecological Improvement Zone (L-L): This area should prioritize enhancing the overall ecological level and actively explore mechanisms and pathways for the value conversion of ecological resources. Affected by the predominant land type, this area exhibits a high degree of landscape aggregation, a stable ecosystem, and low human activity intensity. On one hand, it is necessary to strictly adhere to the red line to protect permanent basic farmland, gradually convert all permanent basic farmland into high-standard farmland, limit the conversion of cultivated land to non-grain uses, and enhance ecosystem service value. On the other hand, efforts should be directed towards promoting the transformation of regional ecological advantages into industrial advantages. On the premise of not reducing ecological functions, not damaging the ecosystem, and complying with the requirements of spatial access, intensity control, and style management and control, appropriate development and utilization, and structural layout adjustments can be carried out to create specific economic value [66].
(4)
Ecological Protection Zone (H-L): This area is primarily concentrated in the northern part of the study area, with forestland as the main land-use type. The primary task in this area is to develop characteristic economies while protecting the original natural forests appropriately. In the future, local governments will prioritize ongoing ecological protection projects, promoting the management and preservation of natural forest resources while establishing a robust biodiversity monitoring network to enhance regional environmental protection [67]. Meanwhile, relying on the unique natural geographical environment, it will orderly develop under-forest economic industrial zones, legally and moderately promote the construction of forest health and wellness bases, nature education, etc., to encourage the integrated model of “ecology + tourism”.
Figure 10. Ecological zoning and strategies.
Land 14 01824 g010

4.4. Innovations and Limitations

Compared to previous studies, the main innovation of this research lies in the construction of the “ESV-ERI-PLUS” research method. Based on this framework, the study analyzes the dynamic changes in ecological zoning in Sanya City from 2000 to 2020 and simulates the results of zoning changes under a natural scenario in 2030. This research framework addresses the deficiency of existing studies, which cannot predict future ecological zoning, and provides practical significance for the sustainable development of cities. On one hand, the ecological zoning scheme based on dynamic simulation offers scientific support for formulating differentiated ecological regulation strategies. On the other hand, this zoning is based on natural factors, breaking the restrictive boundaries of original administrative divisions and avoiding deviations in management policies. In addition, previous studies have focused more to such regions as nature reserves [10], river basins [68,69], urban agglomerations [70], ecologically fragile areas [71], and typical mountainous regions [63], there is a lack of research on urban ecological space delineation at the city scale, which is crucial for the compilation, implementation, and management of various spatial plans in China. Relevant research holds significant practical value for rapidly urbanizing tourist cities with substantial ecological protection needs.
However, this study also has some limitations. First, the basic data used in this study are limited by the difficulty of acquiring land-use data with a resolution of 30 m. Considering that landscape pattern indices obtained at different scales may vary, this could, to some extent, affect the differentiation of the research results. It would be advisable to consider using land-use data with higher precision in the future. Second, the study area is located in a coastal region prone to typhoons, which are often difficult to prevent and can cause destruction to natural ecosystems and landscape patterns [72]. This poses a challenge to the prediction and accuracy of ecological zoning. Future research should further expand the consideration of extreme weather and incorporate it into land-use prediction models to more accurately simulate changes in ecological patterns. Therefore, when conducting accuracy validation for land-use change predictions, the more persuasive Kappa Simulation coefficient is used instead of the Kappa coefficient. [73] Moreover, the results of this study are only a basic stage of urban ecological zoning. To improve the zoning plan, it is necessary to consider more socio-economic and policy factors and to optimize the existing comprehensive evaluation framework based on regional policies and the needs of the target population [74]. Additionally, due to the failure to consider inflation in this paper, the ecosystem service values of different years may not be economically comparable. If necessary, future studies should conduct supplementary analysis incorporating inflation to assess the actual economic impact of ecosystem services.

5. Conclusions

This study employed a zoning method based on ESV and ERI to assess the spatiotemporal changes in urban ecological zoning and predict changes in ecological zones in the study area under a natural development scenario by 2030, proposing targeted management strategies for each zone. The main conclusions of this study are as follows:
(1) Forest land is the predominant land-use type in the study area, followed by cultivated land, accounting for 75% and 15% of the study area, respectively. Regarding land-use changes, the increase in construction land is the most significant, followed by water bodies. Over the past two decades, construction land increased by 10,488.8 hm2, mainly due to the substantial conversion of forest and cultivated land. (2) ERI is primarily characterized by low and medium-low value zones, accounting for approximately 80% of the study area. As the study period progresses, low and medium-low value zones continue to decrease, while high and medium-high value zones increase. (3) ESV is primarily characterized by medium-high value zones, accounting for about 55% of the total study area. Throughout the study period, ESV showed an overall decreasing trend, with a total reduction of 2.11 × 10⁸ ten thousand yuan, representing a decline of 1.9%. (4) From 2000 to 2020, the study area was primarily characterized by ecological protection zones, accounting for about 50%, with forest land as the primary land-use type, concentrated in the northern mountainous regions. Prediction results indicate that by 2030, ecological early warning zones (L-H) and ecological protection zones (H-L) will increase, while ecological control zones (H-H) and ecological improvement zones (L-L) will decrease in size. This suggests that the study area’s overall ERI and ESV will increase. In terms of change rates, the increase in ecological early warning zones is the most significant, primarily consisting of construction land, indicating that the growth rate of this zone correlates with urban construction, emphasizing the need to focus on urban ecology.
The research results indicate that the rapid development of urbanization will encroach on a significant amount of ecological land, leading to increasingly prominent ecological issues. Accordingly, this study proposes the following overall control strategies: First, in terms of urban construction, the intensity and density of development should be strictly regulated. Prioritizing the demarcation of cultivated land, permanent basic farmland, and ecological protection red lines, areas with high risks of natural disasters should be avoided. Along with the trend of population changes and the status of existing construction land, urban development boundaries should be reasonably demarcated to form an efficient and intensive spatial pattern. Second, in terms of ecological restoration, efforts should be made to promote the conservation and restoration of forest land in forest parks, strengthen the protection and restoration of public welfare forests and natural forests, implement large-scale enclosures for security, and promote the succession of artificial forests to natural forests. Ecological restoration should be carried out in ecologically damaged areas (such as water bodies, wetlands, etc.) to consolidate the city’s natural ecological background. In the future, the research will further expand the analytical framework, focusing on exploring the coupling mechanism and direct connection between the ecological environment and urban development to achieve the coordination and unity of urban ecology and development.
Author Contributions

Conceptualization, Q.L. and P.Z.; Data curation, Q.L. and Y.Z.; Investigation, Q.L. and S.Z.; Methodology, Q.L. and P.Z.; Resources, Y.M., S.Z., and Y.Z.; Writing—original draft, Q.L.; Writing—review and editing, Q.L. and P.Z. All authors have read and agreed to the published version of the manuscript.

Funding

This research received no external funding.

Data Availability Statement

The data presented in this study are available on request from the corresponding author.

Acknowledgments

The authors would like to acknowledge all experts’ contributions in building the model and formulating the strategies in this study. All individuals included in this section have consented to the acknowledgement. We thank the four anonymous reviewers for their valuable comments and suggestions.

Conflicts of Interest

The authors declare no conflicts of interest.

Abbreviations

The following abbreviations are used in this manuscript:
ESVEcosystem Service Value
ERIEcological Risk Index

Appendix A

Appendix A.1. PLUS Model Accuracy Assessment

This study employs the PLUS model to identify historical land-use changes. Using the LEAS and CARS modules within PLUS, we simulate future land-use demand under the natural-development scenario. To evaluate model reliability, we use 2000–2010 data, together with the driving factors detailed in the main text, to predict the 2020 land-use pattern. The predicted 2020 map is then compared with the actual 2020 land-use map (Figure A1). Model accuracy is assessed by the kappa statistic provided within PLUS, which measures agreement between the simulated and actual land-use distributions.
The Kappa coefficient is a widely recognized indicator for evaluating land-use change, and its specific calculation formula is as follows:
k a p p a = P o P c 1 P c
In the equation, P o denotes the observed accuracy of the simulation, and P c denotes the expected accuracy of the prediction. A Kappa coefficient greater than 0.75 indicates reliable prediction.
In this study, the Kappa coefficient reached 0.823, with an overall accuracy of 0.917 (Table A1). This demonstrates that the PLUS model and the selected driving factors exhibit strong adaptability and predictive reliability, thereby providing solid support for the subsequent 2030 land-use forecast.
Figure A1. Comparison of predicted (a) and actual (b) land-use patterns for 2020.
Land 14 01824 g0a1
Table A1. Accuracy validation table.
MetricKappaOverall Accuracy
Value0.8230.917

Appendix A.2. Land-Use Prediction Using the PLUS Model

After confirming the reliability of the PLUS model, we predicted land-use change for 2030 using the following parameter settings:
(1)
Land-use demand projection: the study employed the built-in Markov-chain module in PLUS, treating 2010 as the base year and using the 2010–2020 land-transition probability matrix to derive the required number of grid cells for each land-use type in 2030; details are provided in Table A2.
Table A2. Target land-demand quantities under the natural-development scenario.
Land-Use TypeCultivated LandForest LandGrass landWater BodiesConstruction LandBare Land
2030248,8021,499,89164,64067,097219,5516
(2)
Land-use Transition Cost Matrix Configuration: this parameter specifies whether one land-use type can convert into another. A value of 1 indicates an allowed transition, while 0 indicates a prohibited transition. Guided by the Sanya Territorial Spatial Plan (2021–2035), we defined future conversion rules among the six land-use types under the natural-development scenario; the matrix is presented in Table A3.
Table A3. Land-use transition cost matrix.
Land-Use TypeCultivated LandForest LandGrass landWater BodiesConstruction LandBare Land
Cultivated Land111111
Forest Land111011
Grass land111111
Water Bodies001100
Construction Land111011
Bare Land111111
(3)
Neighborhood-weight setting: The neighborhood weight, ranging from 0 to 1, reflects the difficulty of conversion between different land-use types. A higher value indicates greater resistance to conversion and stronger expansion potential. In contrast, a lower value implies an easier transition to other types. Based on observed land-use expansion data and the proportional area of each class, we iteratively calibrated the neighborhood weights; the final values are listed in Table A4.
Table A4. Neighborhood factor weight parameters.
Land-Use TypeCultivated LandForest LandGrass landWater BodiesConstruction LandBare Land
Neighborhood-weight0.0620.1760.020.2380.4910.012
Following the above validation and prediction steps, we produced the 2030 land-use map under the natural-development scenario (Figure A2).
Figure A2. Land-use Map under the natural development scenario for 2030.
Land 14 01824 g0a2

Appendix A.3. The Landscape Pattern Indices

(1)
Landscape Fragmentation Index (Ci)
c i = n i A i
(2)
Landscape Isolation Index (Ni)
N i = A A i n i A
(3)
Landscape Dominance Index (Di)
D i = Q i + M i 4 + L i 2
In the above formulas, n i is the number of patches of landscape type i, Ai is the total area of landscape type i, and A is the total landscape area; Qi is the number of quadrats where patch i appears divided by the total number of quadrats, Mi is the number of patch i divided by the total number of patches, and Li is the area of patch i divided by the total area of quadrats. All the above values were obtained using Fragstats 4.2 software.
The landscape pattern indices for 2000–2030 are presented in the following tables:
Table A5. Landscape pattern indices for 2000.
TYPEAiniCiNiDiEiViRiQiMiLi
Cultivated Land28,844.73217.000.010.110.260.090.190.020.460.260.15
Forest Land14,4625.1187.000.000.020.680.140.100.010.960.220.76
Grass land5664.42154.000.030.480.110.180.140.030.190.180.03
Water Bodies5963.13191.000.030.500.130.190.240.050.240.230.03
Construction Land3945.3390.000.020.520.060.180.050.010.100.110.02
Bare Land194.134.000.022.240.000.680.290.200.010.000.00
Table A6. Landscape pattern indices for 2010.
TYPEAiniCiNiDiEiViRiQiMiLi
Cultivated Land26,298214.000.010.120.240.090.190.020.440.250.14
Forest Land141,757.7186.000.000.020.670.140.100.010.950.210.75
Grass land5241.24145.000.030.500.100.180.140.030.180.170.03
Water Bodies7835.31203.000.030.400.150.160.240.040.260.230.04
Construction Land8103.42122.000.020.300.100.120.050.010.160.140.04
Bare Land60.662.000.035.070.001.540.290.440.000.000.00
Table A7. Landscape pattern indices for 2020.
TYPEAiniCiNiDiEiViRiQiMiLi
Cultivated Land24,191.37250.000.010.140.240.100.190.020.430.250.13
Forest Land138,319.38184.000.000.020.650.140.100.010.930.190.73
Grass land5557.32161.000.030.500.100.180.140.030.180.160.03
Water Bodies6853.59197.000.030.450.130.170.240.040.250.200.04
Construction Land14,434.2188.000.010.210.150.100.050.000.250.190.08
Bare Land4.231.000.2451.440.0015.550.294.440.000.000.00
Table A8. Landscape pattern indices for 2030.
TYPEAiniCiNiDiEiViRiQiMiLi
Cultivated Land22,392.18267.000.010.160.250.100.190.020.490.270.12
Forest Land134,990.20173.000.000.020.620.130.100.010.940.130.71
Grass land5082.57124.000.020.480.090.170.140.020.210.100.03
Water Bodies6972.75205.000.030.450.090.170.240.040.260.040.04
Construction Land19,926.72236.000.010.170.290.110.050.010.490.460.10
Bare Land0.543.005.5622.350.009.480.292.710.000.000.00

References

  1. Zhang, W.; Chang, W.J.; Zhu, Z.C.; Hui, Z. Landscape Ecological Risk Assessment of Chinese Coastal Cities Based on Land Use Change. Appl. Geogr. 2020, 117, 102174. [Google Scholar] [CrossRef]
  2. Li, W.; Wang, Y.; Xie, S.; Cheng, X. Coupling Coordination Analysis and Spatiotemporal Heterogeneity between Urbanization and Ecosystem Health in Chongqing Municipality, China. Sci. Total Environ. 2021, 791, 148311. [Google Scholar] [CrossRef]
  3. Yi, H.; Kreuter, U.P.; Han, D.; Güneralp, B. Social Segregation of Ecosystem Services Delivery in the San Antonio Region, Texas, through 2050. Sci. Total Environ. 2019, 667, 234–247. [Google Scholar] [CrossRef]
  4. Drius, M.; Bongiorni, L.; Depellegrin, D.; Menegon, S.; Pugnetti, A.; Stifter, S. Tackling Challenges for Mediterranean Sustainable Coastal Tourism: An Ecosystem Service Perspective. Sci. Total Environ. 2019, 652, 1302–1317. [Google Scholar] [CrossRef]
  5. Nuarsa, I.W.; As-syakur, A.R.; Gunadi, I.G.A.; Sukewijaya, I.M. Changes in Gross Primary Production (GPP) over the Past Two Decades Due to Land Use Conversion in a Tourism City. ISPRS Int. J. Geo-Inf. 2018, 7, 57. [Google Scholar] [CrossRef]
  6. Zhang, Y.; Yang, R.; Li, X.; Sun, M.; Zhang, L.; Lu, Y.; Meng, L.; Liu, Y.; Wang, C. Designing a Sustainable Development Path Based on Landscape Ecological Risk and Ecosystem Service Value in Southwest China. Sustainability 2023, 15, 3648. [Google Scholar] [CrossRef]
  7. Li, Z.; Cheng, X.; Han, H. Analyzing Land-Use Change Scenarios for Ecosystem Services and Their Trade-Offs in the Ecological Conservation Area in Beijing, China. Int. J. Environ. Res. Public Health 2020, 17, 8632. [Google Scholar] [CrossRef] [PubMed]
  8. Ecological Zonation as a Tool for Restoration of Degraded Forests in Northern Mongolia|Kusbach|Geography, Environment, Sustainability. Available online: https://ges.rgo.ru/jour/article/view/832 (accessed on 26 June 2025).
  9. A New Approach to Ecological Zoning of the Earth in a Changing Climate|Nature Sustainability. Available online: https://www.nature.com/articles/s41893-024-01419-2?utm_source=xmol&utm_medium=affiliate&utm_content=meta&utm_campaign=DDCN_1_GL01_metadata (accessed on 26 June 2025).
  10. Wang, S.; Chen, Y.; Jin, H.; Li, Y. Ecological Management Zoning Based on the Causation between Ecological Risk and Ecosystem Services in the Gaoligong Mountain. Ecol. Indic. 2024, 167, 112673. [Google Scholar] [CrossRef]
  11. Yongxiu, S.; Shiliang, L.; Fangning, S.; Yi, A.; Mingqi, L.; Yixuan, L. Spatio-Temporal Variations and Coupling of Human Activity Intensity and Ecosystem Services Based on the Four-Quadrant Model on the Qinghai-Tibet Plateau. Sci. Total Environ. 2020, 743, 140721. [Google Scholar] [CrossRef] [PubMed]
  12. Zhang, Y.; Hu, X.; Wei, B.; Zhang, X.; Tang, L.; Chen, C.; Wang, Y.; Yang, X. Spatiotemporal Exploration of Ecosystem Service Value, Landscape Ecological Risk, and Their Interactive Relationship in Hunan Province, Central-South China, over the Past 30 Years. Ecol. Indic. 2023, 156, 111066. [Google Scholar] [CrossRef]
  13. Karimian, H.; Zou, W.; Chen, Y.; Xia, J.; Wang, Z. Landscape Ecological Risk Assessment and Driving Factor Analysis in Dongjiang River Watershed. Chemosphere 2022, 307, 135835. [Google Scholar] [CrossRef]
  14. Costanza, R.; d’Arge, R.; de Groot, R.; Farber, S.; Grasso, M.; Hannon, B.; Limburg, K.; Naeem, S.; O’Neill, R.V.; Paruelo, J.; et al. The Value of the World’s Ecosystem Services and Natural Capital. Ecol. Econ. 1998, 25, 3–15. [Google Scholar] [CrossRef]
  15. Costanza, R.; De Groot, R.; Sutton, P.; Van der Ploeg, S.; Anderson, S.J.; Kubiszewski, I.; Farber, S.; Turner, R.K. Changes in the Global Value of Ecosystem Services. Glob. Environ. Change 2014, 26, 152–158. [Google Scholar] [CrossRef]
  16. Bratman, G.N.; Anderson, C.B.; Berman, M.G.; Cochran, B.; de Vries, S.; Flanders, J.; Folke, C.; Frumkin, H.; Gross, J.J.; Hartig, T.; et al. Nature and Mental Health: An Ecosystem Service Perspective. Sci. Adv. 2019, 5, eaax0903. [Google Scholar] [CrossRef]
  17. Groot, R.S.; Wilson, M.A.; Boumans, R.M.J. A Typology for the Classification, Description and Valuation of Ecosystem Functions, Goods and Services. Ecol. Econ. 2002, 41, 393–408. [Google Scholar] [CrossRef]
  18. Crossman, N.D.; Burkhard, B.; Nedkov, S.; Willemen, L.; Petz, K.; Palomo, I.; Drakou, E.G.; Martín-Lopez, B.; McPhearson, T.; Boyanova, K.; et al. A Blueprint for Mapping and Modelling Ecosystem Services. Ecosyst. Serv. 2013, 4, 4–14. [Google Scholar] [CrossRef]
  19. Ecosystem Services for 2020|Science. Available online: https://www.science.org/doi/10.1126/science.1196431 (accessed on 15 June 2025).
  20. Lautenbach, S.; Kugel, C.; Lausch, A.; Seppelt, R. Analysis of Historic Changes in Regional Ecosystem Service Provisioning Using Land Use Data. Ecol. Indic. 2011, 11, 676–687. [Google Scholar] [CrossRef]
  21. Yang, M.; Zhao, X.; Wu, P.; Hu, P.; Gao, X. Quantification and Spatially Explicit Driving Forces of the Incoordination between Ecosystem Service Supply and Social Demand at a Regional Scale. Ecol. Indic. 2022, 137, 108764. [Google Scholar] [CrossRef]
  22. Li, K.; Zhang, B. Analysis of the Relationship between Landscape Fragmentation and Ecosystem Service Value in Northern Shaanxi, China. Environ. Sci. Pollut. Res. 2023, 30, 94537–94551. [Google Scholar] [CrossRef] [PubMed]
  23. Wang, Y.; Zhang, Z.; Chen, X. Spatiotemporal Change in Ecosystem Service Value in Response to Land Use Change in Guizhou Province, Southwest China. Ecol. Indic. 2022, 144, 109514. [Google Scholar] [CrossRef]
  24. Zhang, M.; Ao, Y.; Liu, M.; Zhao, Y.; Lin, K.; Cheng, T. Ecological Security Assessment Based on Ecosystem Service Value and Ecological Footprint in the Pearl River Delta Urban Agglomeration, China. Ecol. Indic. 2022, 144, 109528. [Google Scholar] [CrossRef]
  25. Zhao, Y.; Zhang, X.; Wu, Q.; Huang, J.; Ling, F.; Wang, L. Characteristics of Spatial and Temporal Changes in Ecosystem Service Value and Threshold Effect in Henan along the Yellow River, China. Ecol. Indic. 2024, 166, 112531. [Google Scholar] [CrossRef]
  26. Xu, W.; Wang, J.; Zhang, M.; Li, S. Construction of Landscape Ecological Network Based on Landscape Ecological Risk Assessment in a Large-Scale Opencast Coal Mine Area. J. Clean. Prod. 2021, 286, 125523. [Google Scholar] [CrossRef]
  27. Wei, Y.; Zhou, P.; Zhang, L.; Zhang, Y. Spatio-Temporal Evolution Analysis of Land Use Change and Landscape Ecological Risks in Rapidly Urbanizing Areas Based on Multi-Situation Simulation—A Case Study of Chengdu Plain. Ecol. Indic. 2024, 166, 112245. [Google Scholar] [CrossRef]
  28. Wang, B.; Ding, M.; Li, S.; Liu, L.; Ai, J. Assessment of Landscape Ecological Risk for a Cross-Border Basin: A Case Study of the Koshi River Basin, Central Himalayas. Ecol. Indic. 2020, 117, 106621. [Google Scholar] [CrossRef]
  29. Wu, Y.; Gu, C.; Zhang, Y. Towards Sustainable Management of Urban Ecological Space: A Zoning Approach Hybridized by Ecosystem Service Value and Ecological Risk Assessment. Land 2022, 11, 1220. [Google Scholar] [CrossRef]
  30. Jiang, Z.; Gan, X.; Liu, J.; Bi, X.; Kang, A.; Zhou, B. Landscape Ecological Risk Assessment and Zoning Control Based on Ecosystem Service Value: Taking Sichuan Province as an Example. Appl. Sci. 2023, 13, 12103. [Google Scholar] [CrossRef]
  31. Li, H.; Zhu, Y.; Tang, Y.; Song, M. Ecological Zoning Based on Value–Risk in the Wuling Mountains Area of Hunan Province. Sustainability 2024, 16, 1397. [Google Scholar] [CrossRef]
  32. GB/T 21010-2017; Current Land Use Classification. China Standards Press; Ministry of Land and Resources of the People’s Republic of China: Beijing, China, 2017.
  33. Shi, F.; Zhou, B.; Zhou, H.; Zhang, H.; Li, H.; Li, R.; Guo, Z.; Gao, X. Spatial Autocorrelation Analysis of Land Use and Ecosystem Service Value in the Huangshui River Basin at the Grid Scale. Plants 2022, 11, 2294. [Google Scholar] [CrossRef]
  34. Zhu, K.; He, J.; Zhang, L.; Song, D.; Wu, L.; Liu, Y.; Zhang, S. Impact of Future Development Scenario Selection on Landscape Ecological Risk in the Chengdu-Chongqing Economic Zone. Land 2022, 11, 964. [Google Scholar] [CrossRef]
  35. Li, W.; Kang, J.; Wang, Y. Spatiotemporal Changes and Driving Forces of Ecological Security in the Chengdu-Chongqing Urban Agglomeration, China: Quantification Using Health-Services-Risk Framework. J. Clean. Prod. 2023, 389, 136135. [Google Scholar] [CrossRef]
  36. Wang, H.; Liu, X.; Zhao, C.; Chang, Y.; Liu, Y.; Zang, F. Spatial-Temporal Pattern Analysis of Landscape Ecological Risk Assessment Based on Land Use/Land Cover Change in Baishuijiang National Nature Reserve in Gansu Province, China. Ecol. Indic. 2021, 124, 107454. [Google Scholar] [CrossRef]
  37. Deng, R.; Ding, X.; Wang, J. Landscape Ecological Risk Assessment and Spatial Pattern Evolution Analysis of the Central Yunnan Urban Agglomeration from 1995 to 2020 Based on Land Use/Cover Change. Sustainability 2023, 15, 16641. [Google Scholar] [CrossRef]
  38. Xie, H.; Wang, P.; Huang, H. Ecological Risk Assessment of Land Use Change in the Poyang Lake Eco-Economic Zone, China. Int. J. Environ. Res. Public Health 2013, 10, 328–346. [Google Scholar] [CrossRef]
  39. Jin, X.; Jin, Y.; Mao, X. Ecological Risk Assessment of Cities on the Tibetan Plateau Based on Land Use/Land Cover Changes—Case Study of Delingha City. Ecol. Indic. 2019, 101, 185–191. [Google Scholar] [CrossRef]
  40. Xie, G.; Zhang, C.; Zhang, L.; Chen, W.; Li, S. Improvement of the Evaluation Method for Ecosystem Service Value Based on per Unit Area. J. Nat. Resour. 2015, 30, 1243–1254. [Google Scholar]
  41. Xie, G.; Zhen, L.; Lu, C.; Xiao, Y.; Chen, C. Expert Knowledge Based Valuation Method of Ecosystem Services in China. J. Nat. Resour. 2008, 23, 911–919. [Google Scholar]
  42. Lei, J.; Chen, Z.; Wu, T.; Li, X.; Yang, Q.; Chen, X. Spatial Autocorrelation Pattern Analysis of Land Use and the Value of Ecosystem Services in Northeast Hainan Island. Acta Ecol. Sin. 2019, 39, 2366–2377. [Google Scholar] [CrossRef]
  43. Liang, X.; Guan, Q.; Clarke, K.C.; Liu, S.; Wang, B.; Yao, Y. Understanding the Drivers of Sustainable Land Expansion Using a Patch-Generating Land Use Simulation (PLUS) Model: A Case Study in Wuhan, China. Comput. Environ. Urban Syst. 2021, 85, 101569. [Google Scholar] [CrossRef]
  44. Luan, C.; Liu, R.; Li, Y.; Zhang, Q. Comparison of Various Models for Multi-Scenario Simulation of Land Use/Land Cover to Predict Ecosystem Service Value: A Case Study of Harbin-Changchun Urban Agglomeration, China. J. Clean. Prod. 2024, 478, 144012. [Google Scholar] [CrossRef]
  45. Xu, W.; Song, J.; Long, Y.; Mao, R.; Tang, B.; Li, B. Analysis and Simulation of the Driving Mechanism and Ecological Effects of Land Cover Change in the Weihe River Basin, China. J. Environ. Manag. 2023, 344, 118320. [Google Scholar] [CrossRef]
  46. Liu, J.; Kong, X.; Zhu, Y.; Zhang, B. A Study on Land Use Change Simulation Based on PLUS Model and the U-Net Structure: A Case Study of Jilin Province. Ecol. Indic. 2025, 176, 113619. [Google Scholar] [CrossRef]
  47. Zhang, S.; Zhong, Q.; Cheng, D.; Xu, C.; Chang, Y.; Lin, Y.; Li, B. Landscape Ecological Risk Projection Based on the PLUS Model under the Localized Shared Socioeconomic Pathways in the Fujian Delta Region. Ecol. Indic. 2022, 136, 108642. [Google Scholar] [CrossRef]
  48. Meng, R.; Meng, Z.; Li, H.; Cai, J.; Qin, L. Changes in Landscape Ecological Risk in the Beijing-Tianjin Sandstorm Source Control Project Area from a Spatiotemporal Perspective. Ecol. Indic. 2024, 167, 112569. [Google Scholar] [CrossRef]
  49. Munyati, C.; Sinthumule, N.I. Comparative Suitability of Ordinary Kriging and Inverse Distance Weighted Interpolation for Indicating Intactness Gradients on Threatened Savannah Woodland and Forest Stands. Environ. Sustain. Indic. 2021, 12, 100151. [Google Scholar] [CrossRef]
  50. Meng, X.; Wang, Z.; Wang, B.; Sa, R. Spatiotemporal Dynamics and Correlations Between the Ecosystem Service Values and the Landscape Ecological Risks in Hohhot-Baotou-Ordos. Environ. Sci. 2024. [Google Scholar] [CrossRef]
  51. Hasan, S.S.; Zhen, L.; Miah, M.G.; Ahamed, T.; Samie, A. Impact of Land Use Change on Ecosystem Services: A Review. Environ. Dev. 2020, 34, 100527. [Google Scholar] [CrossRef]
  52. Hou, L.; Wu, F.; Xie, X. The Spatial Characteristics and Relationships between Landscape Pattern and Ecosystem Service Value along an Urban-Rural Gradient in Xi’an City, China. Ecol. Indic. 2020, 108, 105720. [Google Scholar] [CrossRef]
  53. Qiu, H.; Hu, B.; Zhang, Z. Impacts of Land Use Change on Ecosystem Service Value Based on SDGs Report--Taking Guangxi as an Example. Ecol. Indic. 2021, 133, 108366. [Google Scholar] [CrossRef]
  54. Egarter Vigl, L.; Schirpke, U.; Tasser, E.; Tappeiner, U. Linking Long-Term Landscape Dynamics to the Multiple Interactions among Ecosystem Services in the European Alps. Landsc. Ecol. 2016, 31, 1903–1918. [Google Scholar] [CrossRef]
  55. Schirpke, U.; Tasser, E.; Borsky, S.; Braun, M.; Eitzinger, J.; Gaube, V.; Getzner, M.; Glatzel, S.; Gschwantner, T.; Kirchner, M.; et al. Past and Future Impacts of Land-Use Changes on Ecosystem Services in Austria. J. Environ. Manag. 2023, 345, 118728. [Google Scholar] [CrossRef]
  56. Wang, B.; Hu, C.; Li, J. Coupling and Coordination Relationship between the Tourism Economy and Ecosystem Service Value in Southern Jiangsu, China. Int. J. Environ. Res. Public Health 2022, 19, 16136. [Google Scholar] [CrossRef] [PubMed]
  57. Li, J.; Liu, X.; Wang, Y.; Peng, X.; Tang, H.; Li, M. Ecological Tourism Suitability Evaluation and Landscape Ecological Risk Analysis of the Yangtze River Delta Region from 2000 to 2020 Based on the MaxEnt Model. J. Asian Archit. Build. Eng. 2025, 24, 1–18. [Google Scholar] [CrossRef]
  58. Xiong, H.; Hu, H.; Han, P.; Wang, M. Integrating Landscape Ecological Risks and Ecosystem Service Values into the Ecological Security Pattern Identification of Wuhan Urban Agglomeration. Int. J. Environ. Res. Public Health 2023, 20, 2792. [Google Scholar] [CrossRef] [PubMed]
  59. Wang, F.; Wu, Y.; Zhang, Y.; Wang, J.; Xue, Z.; Tan, X.; Jia, W. Research on Ecosystem Service Value and Landscape Ecological Risk Prediction and Zoning: Taking Fujian Province as an Example. Ecol. Model. 2025, 507, 111173. [Google Scholar] [CrossRef]
  60. Guo, H.; Cai, Y.; Li, B.; Wan, H.; Yang, Z. An Improved Approach for Evaluating Landscape Ecological Risks and Exploring Its Coupling Coordination with Ecosystem Services. J. Environ. Manag. 2023, 348, 119277. [Google Scholar] [CrossRef]
  61. Li, B.; Yang, Z.; Cai, Y.; Xie, Y.; Guo, H.; Wang, Y.; Zhang, P.; Li, B.; Jia, Q.; Huang, Y.; et al. Prediction and Valuation of Ecosystem Service Based on Land Use/Land Cover Change: A Case Study of the Pearl River Delta. Ecol. Eng. 2022, 179, 106612. [Google Scholar] [CrossRef]
  62. Liang, L.; Sun, Y.; Guan, Q.; Pan, N.; Du, Q.; Mi, J.; Shan, Y. Projection of Landscape Ecological Risk and Exploration of Terrain Effects in the Qilian Mountains, China. Land Degrad. Dev. 2023, 34, 4575–4593. [Google Scholar] [CrossRef]
  63. Bai, J.; Wang, X.; Tu, Y.; Zhou, J.; Wang, X.; Yao, W.; Sun, Z. Integration of Ecosystem Service Composite Index and Driving Thresholds for Ecological Zoning Management: A Case Study of Qinling-Daba Mountain, China. J. Environ. Manag. 2025, 384, 125309. [Google Scholar] [CrossRef]
  64. Raj, A.; Sharma, L.K. Spatial E-PSR Modelling for Ecological Sensitivity Assessment for Arid Rangeland Resilience and Management. Ecol. Modell. 2023, 478, 110283. [Google Scholar] [CrossRef]
  65. Griffith, D.A.; Chun, Y. Spatial Autocorrelation and Uncertainty Associated with Remotely-Sensed Data. Remote Sens. 2016, 8, 535. [Google Scholar] [CrossRef]
  66. Shi, Y.; Shao, C.; Zhang, Z. Efficiency and Driving Factors of Green Development of Tourist Cities Based on Ecological Footprint. Sustainability 2020, 12, 8589. [Google Scholar] [CrossRef]
  67. Huang, Z.; Bai, Y.; Alatalo, J.M.; Yang, Z. Mapping Biodiversity Conservation Priorities for Protected Areas: A Case Study in Xishuangbanna Tropical Area, China. Biol. Conserv. 2020, 249, 108741. [Google Scholar] [CrossRef]
  68. Xie, Y.; Zhu, Q.; Bai, H.; He, H.; Zhang, Y. Combining Ecosystem Service Value and Landscape Ecological Risk to Subdivide the Riparian Buffer Zone of the Weihe River in Shaanxi. Ecol. Indic. 2024, 166, 112424. [Google Scholar] [CrossRef]
  69. Feng, M.; Li, Y.; Xu, L.; Zhang, T. Basin Ecological Zoning Based on Supply–Demand Assessment and Matching of Green Infrastructure: A Case Study of the Jialing River Basin. Forests 2025, 16, 561. [Google Scholar] [CrossRef]
  70. Chao, L.I.; Wenhao, N.I.U.; Huaiyu, H.; Shunbo, Y.A.O.; Zhiwen, G. Study on Spatial and Temporal Evolution of Ecological Risk and Ecological Zoning Identification in Guangdong-Hong Kong-Macao Greater Bay Area under the Background of Urbanization. J. Environ. Eng. Technol. 2024, 14, 562–573. [Google Scholar] [CrossRef]
  71. Duan, Y.; Halike, A.; Luo, J.; Yao, K.; Yao, L.; Tang, H.; Tuheti, B. Multi-Scale Supply and Demand Relationships of Ecosystem Services under Multiple Scenarios and Ecological Zoning to Promote Sustainable Urban Ecological Development in Arid Regions of China. Sustainability 2024, 16, 9641. [Google Scholar] [CrossRef]
  72. Pei-Yang, Q.; Xiao-Xuan, G.U.; Chang-Xin, L.I.U.; Ze-Yu, C.A.O.; Ting-Ting, Z.; Chen, L.I.N.; Qin-Chang, C.; Xiu-Fan, P.; Fei-Fei, C.; Hua-Liang, L.I.; et al. Damage to the Mangrove Forests in Dongzhaigang of Hainan Caused by Super Typhoon “Yagi. ” Chin. J. Plant Ecol. 2025, 49, 540. [Google Scholar] [CrossRef]
  73. van Vliet, J.; Bregt, A.K.; Hagen-Zanker, A. Revisiting Kappa to Account for Change in the Accuracy Assessment of Land-Use Change Models. Ecol. Modell. 2011, 222, 1367–1375. [Google Scholar] [CrossRef]
  74. Bai, Y.; Wong, C.P.; Jiang, B.; Hughes, A.C.; Wang, M.; Wang, Q. Developing China’s Ecological Redline Policy Using Ecosystem Services Assessments for Land Use Planning. Nat. Commun. 2018, 9, 3034. [Google Scholar] [CrossRef]
Figure 1. Location map of Sanya City.
Land 14 01824 g001
Figure 2. Research technical route.
Land 14 01824 g002
Figure 3. Land-use changes in Sanya City from 2000 to 2020.
Land 14 01824 g003
Figure 4. Sankey Diagram of Land-Use transfers in Sanya City from 2000 to 2020.
Land 14 01824 g004
Figure 5. Spatial distribution of ecological risk in Sanya City from 2000 to 2020.
Land 14 01824 g005
Figure 6. Spatial distribution of ecosystem service value in Sanya City from 2000 to 2020.
Land 14 01824 g006
Figure 7. Scatter plot of ecological zoning in Sanya City from 2000 to 2020.
Land 14 01824 g007
Figure 8. Spatiotemporal changes in ecological zoning in Sanya City.
Land 14 01824 g008
Figure 9. Ecological zoning of Sanya City under the natural development scenario in 2030. (a) Spatial distribution of ecological risk of Sanya City in 2030 (b) Spatial distribution of ecosystem service value of Sanya City in 2030 (c) Ecological zoning of Sanya City in 2030.
Land 14 01824 g009
Table 1. Datasets used in the study.
TypeDataSpatial ResolutionSource
Land-Use DataLand Use30 mhttps://www.resdc.cn/
(accessed on 19 March 2025)
Physical GeographySoil
Slopehttps://www.earthdata.nasa.gov/,
(accessed on 16 March 2025)
Aspect
DEM
Socioeconomic DataAdministrative DivisionVector datahttps://www.resdc.cn/,
(accessed on 19 March 2025)
Annual PrecipitationStatistical data
Mean Temperature
Population Density
Per Capita GDP
Grain Yield Datahttps://tjj.sanya.gov.cn/,
(accessed on 16 March 2025)
Average Grain Pricehttps://www.shujuku.org/,
(accessed on 16 March 2025)
Transportation AccessibilityDistance to County RoadsVector datahttps://www.openstreetmap.org/,
(accessed on 19 March 2025)
Distance to Railways
Distance to Provincial Roads
Distance to Highways
Distance to National Roads
Distance to Major Rivers
Distance to District Governmenthttps://www.webmap.cn/,
(accessed on 19 March 2025)
Distance to Major Villageshttps://www.resdc.cn/,
(accessed on 19 March 2025)
Table 2. Ecosystem service value coefficients per unit area for different land-use types in Sanya City (yuan/hm2).
Ecosystem ServiceSecondary TypeCultivated LandForest LandGrasslandWater BodiesConstruction LandBare Land
Provisioning ServicesFood Production3102.56783.17873.541988.050.0030.12
Raw Material Production873.541807.321295.241114.510.0090.37
Water Supply−2741.10933.78722.9316,386.330.0060.24
Regulating ServicesGas Regulation2470.005964.144548.414036.340.00301.22
Climate Regulation1295.2417,832.1812,048.778885.970.00271.10
Purification of the Environment361.465211.093976.0913,795.840.00873.54
Hydrological Regulation3403.7811,657.198825.72190,491.070.00572.32
Supporting ServicesSoil Conservation2018.177259.385542.434879.750.00361.46
Nutrient Cycling Maintenance421.71542.19421.71391.590.0030.12
Biodiversity481.956596.705030.3615,693.520.00331.34
Cultural ServicesAesthetic Landscape210.852891.712229.029970.360.00150.61
Total11,898.1661,478.8545,514.23267,633.330.003072.44
Table 3. Land-use changes in Sanya City from 2000 to 2020.
Land-Use Type200020102020
Area (hm2)Proportion (%)Area (hm2)Proportion (%)Area (hm2)Proportion (%)
Cultivated Land28,844.730.1526,2980.1424,191.370.13
Forest Land144,625.050.7614,17580.7513,8319.40.73
Grass land5664.420.035241.240.035557.320.03
Water Bodies5963.130.037835.310.046853.590.04
Construction Land3945.330.028103.420.0414,434.20.08
Bare Land194.130.0060.660.004.230.00
Table 4. Changes in ecological risk level distribution in Sanya City from 2000 to 2020 (%).
Risk LevelLow RiskMedium-Low RiskMedium RiskMedium-High RiskHigh Risk
200063.7615.396.098.126.63
201063.2914.026.398.397.91
202059.6712.717.6010.369.65
Table 5. Changes in distribution of ecosystem service value levels in Sanya City from 2000 to 2020 (%).
Value LevelLow ValueMedium-Low ValueMedium ValueMedium-High ValueHigh Value
20009.528.7721.0957.912.71
201010.028.5220.4356.714.32
202012.558.8520.3854.873.35
Table 6. Changes in ecosystem service value for different land-use types in Sanya City from 2000 to 2020 (106 yuan/hm2).
YearCultivated LandForest LandGrass landWater BodiesConstruction LandBare LandTotal
Ecosystem Service Value2000343.208891.38257.811595.930.000.6011,088.92
2010312.908715.12238.551668.780.000.1910,935.53
2020287.838503.72252.941834.250.000.0110,878.75
Proportion (%)20003.180.22.314.40.000.00100
20102.876.72.118.50.000.00100
20202.678.22.316.90.000.00100
Table 7. Changes in ecological zoning in Sanya City from 2000 to 2020.
Ecological ZoneProportion (%)Change Rate (%)
Year2000 2010 2020 2000–20102010–2020
Ecological Control Zone11.8112.1311.602.70−4.39
Ecological Early Warning Zone14.1117.0220.6020.5821.09
Ecological Improvement Zone22.4621.4817.68−4.36−17.69
Ecological Protection Zone51.6249.3750.12−4.351.51
Table 8. Changes in ecological zoning area in Sanya City under the natural development scenario in 2030.
Ecological ZoneEcological Control ZoneEcological Early Warning ZoneEcological Improvement ZoneEcological Protection Zone
Proportion (%)8.0425.4314.3752.16
Change Rate (%)
(2020–2030)
−30.6723.43−18.754.08
Disclaimer/Publisher’s Note: The statements, opinions and data contained in all publications are solely those of the individual author(s) and contributor(s) and not of MDPI and/or the editor(s). MDPI and/or the editor(s) disclaim responsibility for any injury to people or property resulting from any ideas, methods, instructions or products referred to in the content.