Article

Spatio-Temporal Patterns and Trade-Offs/Synergies of Land Use Functions at the Township Scale in Special Ecological Functional Zones

1
Faculty of Geographical Science and Engineering, College of Geographical Sciences, Henan University, Zhengzhou 450046, China
2
Henan Urban and Rural Planning and Design Institute Co., Ltd., Zhengzhou 450044, China
3
Key Laboratory of Geospatial Technology for the Middle and Lower Yellow River Regions, Ministry of Education, Henan University, Kaifeng 475004, China
*
Author to whom correspondence should be addressed.
Land 2025, 14(9), 1812; https://doi.org/10.3390/land14091812
Submission received: 31 July 2025 / Revised: 3 September 2025 / Accepted: 4 September 2025 / Published: 5 September 2025

Abstract

Against the backdrop of urban–rural integrated development, special ecological function zones, as spatial carriers with significant regional ecological value and rural development functions, are confronted with a striking conflict between ecological conservation and regional advancement. This contradiction is comprehensively reflected in the interactions among land use functions (LUFs) that differ in nature and intensity. Therefore, exploring the trade-off and synergy (TOS) among regional LUFs is not only of great significance for optimizing territorial spatial patterns and advancing rural revitalization but also provides scientific evidence for the differentiated administration of regional land use. Taking 185 townships in the Funiu Mountain area of China as research units, this study constructs a land use assessment system based on the ‘Production–Living–Ecological’ (PLE) framework, utilizing multi-source datasets from 2000 to 2020. Spearman correlation analysis, geographically weighted regression (GWR), and bivariate local spatial autocorrelation methods are employed to examine the spatio-temporal dynamics of LUFs and the spatial non-stationarity of their TOSs. The findings indicate that, throughout the research period, the production function (PF) displayed a fluctuating declining trend, whereas the living function (LF) and ecological function (EF) demonstrated a fluctuating increasing trend. Notably, EF held an absolute dominant position in the overall structure of LUFs. This is highly consistent with the region’s positioning as a special ecological function zone and also a direct reflection of the effectiveness of continuous ecological construction over the past two decades. Spatially, PF is stronger in southern, eastern, and northern low-altitude townships, correlating with higher levels of economic development; LF is concentrated around townships near county centers; and high EF values are clustered in the central and western areas, showing an opposite spatial pattern to PF and LF. A synergistic relationship is observed between PF and LF, while both PF and LF exhibit trade-offs with EF. The TOSs between different function changes demonstrate significant spatial non-stationarity: linear synergy was the primary type for PF-LF, PF-EF, and LF-EF combinations, but each combination exhibited unique spatial characteristics in terms of non-stationarity. Notably, towns identified as having different types of trade-off relationships in the study of spatial non-stationarity are key areas for township spatial governance and optimization. Through the allocation of regional resources and targeted policy tools, the functional relationships can be adjusted and optimized to attain sustainable land use.

1. Introduction

Land use function (LUF) denotes the comprehensive ability of land systems to provide material products and non-material services through specific utilization methods [1,2], with its core feature manifested in the organic coupling of the three-dimensional “Production–Living–Ecological” (PLE) attributes. As a key carrier for assessing the effects of land use change and advancing sustainable development goals [3,4], the scientific allocation and efficient utilization of LUFs play an irreplaceable role in alleviating human–land conflicts and coordinating human–land relationships [5]. In fact, the dynamic balance among PLE functions has become the core target of territorial space optimization and regulation in China [6,7]; clarifying the mechanism of interactions among the three and analyzing the dynamic trade-offs in temporal and spatial dimensions are prerequisites and keys to realizing the coordinated development of LUFs and regional sustainable development.
The idea of land use multifunctionality dates back to the SENSOR project, which was part of the EU’s Sixth Framework Programme in 2004 [8]. Its theory originated from research on agricultural multifunctionality [9] and gradually developed based on studies in related fields such as ecosystem services [10,11] and landscape functions [12,13], eventually forming a unique research paradigm. In terms of LUF classification, two mainstream perspectives exist in academia: one is the “Social–Economic–Environment” three-dimensional framework based on environmental elements [14], and the other is the PLE classification system based on system composition [15]. This difference reflects the diversity of research scales and application scenarios. With the deepening of research, scholars at home and abroad have shifted their focus from basic research—such as defining the connotation of LUFs [16], constructing research frameworks [17,18], and classifying and evaluating functions [19,20,21]—to more in-depth systematic explorations, including interactions among functions [22], spatio-temporal patterns [1,6], spatial heterogeneity characteristics [23], spatial interaction relationships [24,25,26] and driving mechanism analysis [24,27], accumulating fruitful results. For instance, studies by Lyu et al. [20] and Wei et al. [25] have confirmed that LUFs and their interactions exhibit significant spatial heterogeneity. Meanwhile, Zhou et al.’s [26] analysis on the interactive relationships among multiple functions of cultivated land across the Hexi Corridor revealed that the production function and social security function have a significant synergistic effect, while the trade-offs and synergies (TOSs) among other functions are complex and variable. Additionally, Ren et al.’s research on the Lanzhou-Xining Urban Agglomeration indicated that the driving forces of LUFs vary across scales [21].
The interrelationships among LUFs are directly related to regional sustainable development and the harmony of human–land relationships [28,29]. These interactive relationships are primarily categorized into two types: trade-offs or synergies. The trade-off refers to a potential conflict between different functions, where the enhancement of one function leads to the reduction in another. In contrast, the synergy is characterized by the simultaneous improvement or decline of different functions [22]. Against the backdrop of rapid urbanization and industrialization, the contradiction between the scarcity of land resources and the diversification of human needs has intensified, further amplifying the trade-off effects of LUFs [30,31]. Currently, the academic community has developed various methods to quantify TOS, including the root mean square error model [32], correlation analysis [33], coupling coordination degree model [34], and mechanical balance model [35]. However, due to differences in natural environments, socio-economic backgrounds, and dynamic changes in the intensity and processes of function utilization, interactions among LUFs not only involve simple linear correlations but also exhibit complex spatial heterogeneity and dynamic evolution characteristics [36]. Therefore, studying the interactions among different functions, their spatio-temporal dynamics, and the spatial non-stationarity of function changes is of great practical value for optimizing territorial space regulation and promoting sustainable development.
Despite the growing depth of current research on the interrelationships among LUFs, the existing studies still have the following limitations. Firstly, at the level of geographical spatio-temporal evolution, most studies focus on static analysis of single-time cross-sections, lacking long-term dynamic tracking of the TOS effects of LUFs and their changes [37], making it difficult to reveal the evolution laws of functional interactions. Secondly, in terms of spatial heterogeneity analysis, there is a lack of systematic classification of TOS types, and the mechanism explanation of spatial non-stationarity is weak [23], resulting in insufficient pertinence in policy making and limiting in-depth understanding of the spatial differentiation laws of functional interactions. Finally, in terms of study scale and regional selection, special ecological function zones—being highly sensitive areas for LUFs interactions—have relatively few comprehensive studies on multi-dimensional functions. Moreover, due to the availability of socio-economic data, comprehensive studies at the micro-scale of townships are significantly insufficient [20,21]. As China’s most fundamental administrative division unit, studying the spatio-temporal dynamics of LUFs trade-offs at the township scale has direct management and practical significance for optimizing resource allocation, improving spatial governance capabilities, and supporting the rural revitalization strategy.
In the context of urban–rural integrated development, special ecological function zones are weak areas in the economic and social development of human–land regional systems. They frequently confront intense tensions between ecological protection and economic growth, making them key and difficult areas for national spatial governance [38]. The Funiu Mountain area is located in China’s ecological ecotone between the northern subtropical and warm temperate climatic zones. It is not only an important barrier for maintaining regional ecological security but also a typical underdeveloped special ecological function zone. This region faces multiple contradictions between strict ecological protection, poverty alleviation, and urbanization advancement. The trade-off games and synergistic coupling of PLE functions show significant complexity and dynamics. Its unique geographic location has three key attributes: ecological sensitivity, economic backwardness, and urgent development needs. These traits render it an ideal natural laboratory for studying the spatial dynamics of TOSs between LUFs. This setting provides a highly representative platform for revealing how human–land systems couple and interact.
Based on the above understanding, this research selects China’s Funiu Mountain area as its case study, conducts a quantitative multi-dimensional comprehensive evaluation of LUFs at the township scale, analyzes the change characteristics of LUFs, identifies the TOS relationships between LUFs, and further explores the spatial non-stationarity laws of TOSs between LUF changes. Compared with existing studies, the marginal contributions of this paper are: (1) Different from previous static studies on LUFs and their interrelationships based on time points, this paper reveals the interactive relationships of LUFs and the TOSs of LUF dynamic changes in the Funiu Mountain area from 2000 to 2020 from the perspective of spatio-temporal evolution. (2) Methodologically, by coupling the Geographically Weighted Regression (GWR) model and bivariate local spatial autocorrelation, this study not only identifies the TOSs of LUF dynamic changes spatially but also in-depth analyzes their spatial non-stationarity characteristics. (3) Based on China’s most basic administrative unit, this study comparatively investigates the nature, types, intensity, and evolution trends of interactions among different LUFs at the township scale. The research results can provide decision-making basis for coordinating ecological protection and regional development in special ecological function zones and have important practical value for formulating differentiated ecological control strategies and optimizing the territorial space development and protection pattern.

2. Materials and Methods

2.1. Study Area

The Funiu Mountain area lies in western Henan Province, between 32.59°–34.55° N and 110.58°–113.41° E (Figure 1). It spans 185 townships in 12 counties of 4 cities, including Nanyang, Pingdingshan, Sanmenxia, and Luoyang, with an area of 29,519.32 km2. As the eastern extension of the Qinling Mountains and a climate transition zone, it features a west-high–east-low terrain (altitude 60–2200 m), with mean annual temperatures ranging from 13.31 to 14.60 °C and precipitation between 590 and 1170 mm. It is the watershed of the Yellow River, Huaihe River, and Yangtze River, and it is the core water source conservation area of the Middle Route of the South-to-North Water Diversion Project, known as the “Central Plains Water Tower”. Characterized by climate transition, hydrological division, and biodiversity, this region is a core area in the national main functional zones responsible for water conservation, biodiversity maintenance, and ecological security barrier functions. The “mountain-basin-transition zone” composite system provides a typical field for LUF research.

2.2. Data Sources and Processing

185 townships in the Funiu Mountain area were selected as the research units. The data involved mainly include land use data, meteorological and climate data, remote sensing image data, soil data, socio-economic data, and traffic vector data, as shown in Table 1. In the process of basic data processing, projection conversion and resampling to the township scale of the Funiu Mountain area were uniformly performed in ArcGIS 10.5, and, finally, the projection coordinates of all data were unified to WGS_1984_UTM_Zone_49N.

2.3. Methods

2.3.1. Research Framework

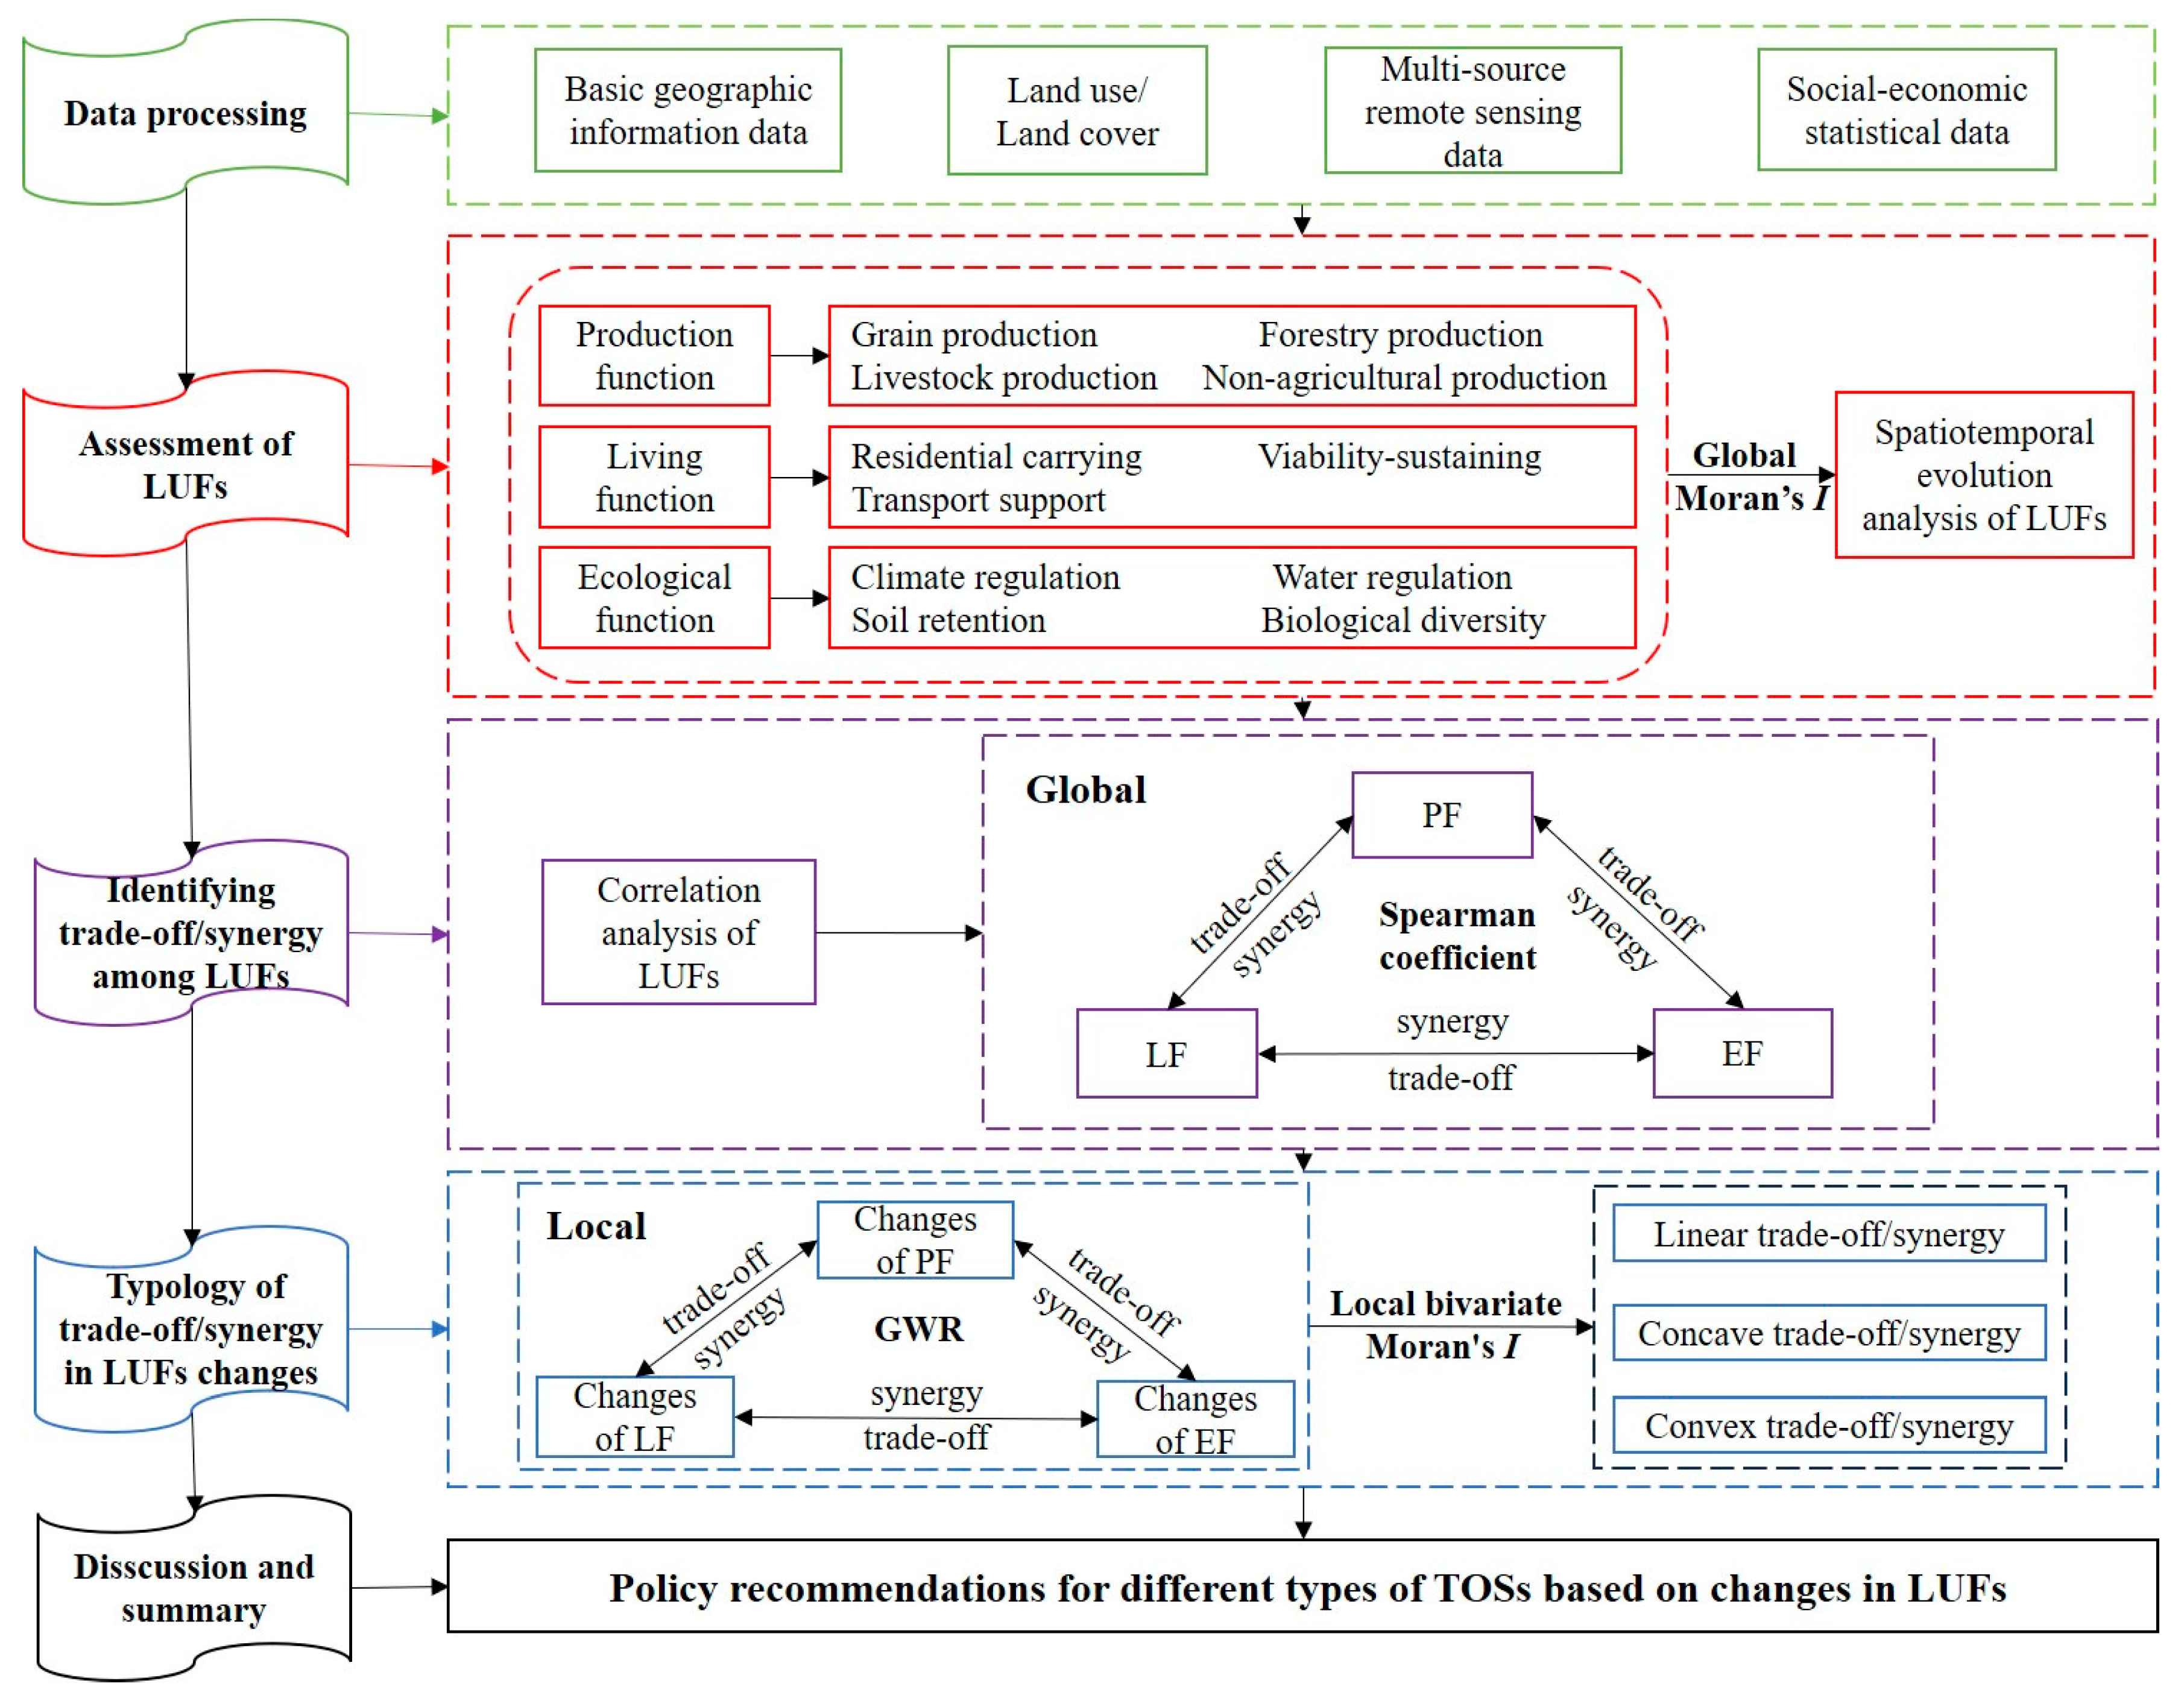
Based on a spatio-temporal dynamic evolution perspective and guided by the theoretical frameworks of PLE Spaces and LUFs, this research develops a stepwise research framework of “land function assessment—TOS identification—TOS type classification” at the township scale in the special ecological functional zones (Figure 2). First, based on the actual conditions of the Funiu Mountain area—a special ecological function zone—an evaluation index system for township-scale LUFs was established, with the entropy weight method used to calculate PF, LF, and EF. Second, global spatial autocorrelation and visualization methods were employed to examine the spatial differentiation features and spatio-temporal evolution patterns of different LUFs. On this basis, Spearman correlation analysis was employed to identify the TOSs among LUFs at the overall level. Subsequently, the GWR method was coupled with bivariate local spatial autocorrelation to reveal the spatial non-stationarity of TOSs between different function changes and further identify the types of such spatial non-stationarity. Through the above research, targeted and differentiated policy recommendations were proposed for the TOS types of different LUF changes, providing scientific support for regional sustainable development decision making.

2.3.2. LUFs Assessment

Constructing an evaluation index system for LUFs is the foundation for exploring the TOSs among LUFs. Considering the regional uniqueness of the Funiu Mountain area and the relative integrity of administrative boundaries, this study draws on relevant research [23,37,39,40], adhering to the principles of comprehensiveness, scientific validity, representativeness and practicability, and further subdivides into 11 sub-functions from the three dimensions of PF, LF, and EF of land use, and selects 11 corresponding characterization indicators to establish the LUFs evaluation index system for the Funiu Mountain area (Table 2). Among them, PF is the material basis of the three functions, supporting the improvement of living quality and ecological environment protection [39,40]. LF is the goal of production and EF optimization, which can promote the continuous improvement of PF and EF [7,41]. EF is the premise for the realization of production and LF, and its improvement or deterioration directly affects the development and changes in production and LF [42,43,44].
This study adopts an integration of subjective and objective methods to weight LUFs at the township scale in the Funiu Mountain area. Firstly, to eliminate the influence of different dimensions of various land functions, the range standardization method is used to unify each indicator value between 0 and 1 [5]. Secondly, indicator weights for secondary functions are computed using the entropy method [45,46]. Lastly, the comprehensive weighting approach is employed to compute values for PF, LF and EF. The computational formulas are listed below:
P r o d i = j = 1 4 I ( i , j ) × ω j ,
L i f e i = j = 1 3 I ( i , j ) × ω j ,
E c o l i = j = 1 4 I ( i , j ) × ω j ,
In the formulas, P r o d i , L i f e i , E c o l i represent the PF, LF and EF of township i, respectively. I ( i , j ) is the value of indicator j in township i. ω j is the weight of indicator j, which is the average weight from 2000, 2005, 2010, 2015, and 2020.
Table 2. LUFs, indicators, and quantification methods.
Target LayerGuidelines Layer (Weight)Metrics LayerCalculationFormula Description
PFGrain production (0.1455)Grain yield P c r o p ( i ) = P c r o p j C j · C ( i ) P c r o p ( i )   and   P c r o p j   denote   the   yield   ( kg )   of   grain   crops   in   grid   cell   i   and   county   j ,   respectively .   C ( i )   and   C j represent the sown area (km2) of grain crops in grid cell i and county j, respectively. The grain crop types include wheat, maize, and pulses.
Supply of forest products (0.2438)Garden fruit yield P f o r e ( i ) = P f o r e j F j · F ( i ) P f o r e ( i )   and   P f o r e j   denote   the   yield   ( kg )   of   forest   products   in   grid   cell   i   and   county   j ,   respectively .   F ( i )   and   F j represent the forest land area (km2) in grid cell i and county j, respectively. In this study, the yield of forest products is represented by orchard fruits.
Supply of Livestock products (0.2490)Meat production P a n i m ( i ) = P a n i m j R j · R ( i ) P a n i m i   and   P a n i m j   denote   the   yield   ( kg )   of   livestock   products   in   grid   cell   i   and   county   j ,   respectively .   R i   and   R j represent the land area (km2) allocated for livestock rearing in grid cell i and county j, respectively. In this study, the yield of livestock products is represented by the meat yield (including cattle, sheep, and swine), and the rearing land area is substituted with grassland area.
Non-agricultural production (0.3617)Secondary and tertiary
output value
P e c o n ( j ) = G D P 2 j + G D P 3 j D L j · D L ( i ) P e c o ( j )   denotes   the   output   value   of   sec ondary   and   tertiary   industries   for   grid   cell   i .   G D P 2 j   and   G D P 3 j   represent   the   gross   domestic   product   of   the   sec ondary   industry   and   tertiary   industry   in   county   j ,   respectively .   D L ( i )   and   D L j denote the nighttime light (NTL) data values in grid cell i and county j, respectively.
LFResidential Carrying capacity (0.3411)Urban and rural construction land density C D i = C ( i ) S ( i ) C D i   denotes   the   urban rural   construction   land   density   in   grid   cell   i .   C i   and   S i represent the urban–rural construction land area and grid cell area in grid cell i, respectively.
Life maintenance (0.3241)Population density P o p i = P o p ( j ) · Q ( i ) Q ( j ) P o p i   and   P o p j   denote   the   population   in   grid   cell   i   and   county   j ,   respectively .   Q i   and   Q j represent the composite weighting (integrating land use type, nighttime light data, and residential density) for grid cell i and county j, respectively.
Traffic guarantee (0.3349)Road density T i = k = 1 5 w k · r k G ( i ) w k   denotes   the   weight   assigned   to   the   k - th   road   type .   r k   represents   the   length   ( km )   of   the   k - th   road   type   within   grid   cell   i .   G i denotes the area (km2) of grid cell i. The weights for railway, expressway, national highway, provincial highway, and county highway are set to 0.35, 0.25, 0.20, 0.15, and 0.05, respectively.
EFClimate regulation (0.1393)Carbon sequestration C t o t a l = C a b o v e + C b e l o w + C s o i l + C d e a d InVEST [47]
Water conservation (0.2122)Annual water production Y i , j = 1 A E T i , j P i , j × P i , j InVEST [48]
Soil conservation (0.4382)Soil retention S R = R K L S U S L E
R K L S = R × K × L S
U S L E = R × K × L S × C × P
InVEST [49]
Habitat maintenance (0.2103)Habitat quality Q x j = H j 1 D x j z D x j z + k z InVEST [50]

2.3.3. Global Spatial Autocorrelation

Global spatial autocorrelation analysis enables measurement of the spatial clustering of LUFs. Global Moran’s I, a commonly applied metric for global spatial autocorrelation, is expressed as [51]:
I = n s 0 · z w i j z z ,
s 0 = i = 1 n j = 1 n w i j ,
In the formulas, n is the number of spatial observation units, z is the deviation vector of the observed value from the mean, z’ is the transpose vector of z, and w i j is a binary (0, 1) spatial adjacency matrix, where 1 indicates that regions i and j are neighboring, and 0 otherwise. At a specified significance level, a significantly positive Moran’s I signifies spatial clustering of regions with high (or low) LUF. Conversely, a significantly negative Moran’s I denotes marked spatial disparities in LUFs between a region and its surroundings.

2.3.4. Spearman Correlation Coefficient

The Spearman correlation coefficient serves to comprehensively measure the trade-off degrees of LUFs. As a non-parametric metric for assessing correlations between LUFs, the size of its coefficient indicates the intensity of the relationship among variables [52]. Given the non-linear and non-normal traits of geographical data, this study adopts this method to examine correlations among LUFs in the Funiu Mountain area at the overall level, with functional correlation degrees tested at the 0.05 level. The formula for calculation is listed below:
r s ( i , j ) = 6 k = 1 n x i k x i x j k x j 2 n n 2 1 ,
In the formula, r s ( i , j ) represents the rank correlation coefficient between function i and function j, n stands for the sample size, x i k and x j k respectively indicate the ranks of i and j in sample k. When r s ( i , j ) > 0 , the two variables exhibit a synergistic relationship; when r s ( i , j ) < 0 , they show a trade-off relationship.

2.3.5. GWR and Bivariate Local Spatial Autocorrelation

GWR and bivariate local spatial autocorrelation are employed to identify the spatial heterogeneity and non-stationarity of TOS among LUFs. GWR is a modified form of traditional regression analysis, functioning as a method to detect spatial heterogeneity. It can illustrate the nature of TOSs among different LUFs, thus facilitating further study on the spatial interaction correlations of LUFs. This model allows the strength and direction of associations between the dependent variable and its predictors to change with local factors [53,54]. Meanwhile, variables representing different LUFs are treated as independent and dependent variables, with no consideration of multicollinearity among independent variables. The corresponding equation reads:
y i = β 0 u i , v i + k = 1 p β k u i , v i x i j + ε i ,
In the formula, y i denotes the dependent variable, x i j the independent variable, and p the total number of spatial units in this analysis. ε i represents the random error term, u i , v i indicates the spatial location of sample i. β 0 u i , v i is the intercept at location i, with β k u i , v i as the regression coefficient. All the aforementioned procedures were executed via the “GWmodel” package in R4.4.2 software.
Building on the above work, local spatial autocorrelation focuses on analyzing spatial distribution patterns, aggregation traits, and anomalies of TOS among LUFs across different geographical units [55,56]. Through such analysis, it can uncover local spatial association patterns and their changes in research objects. This study employs local bivariate spatial autocorrelation analysis. Its aim is to explore the spatial non-stationarity of TOSs across different LUFs. This analysis is calculated via the local bivariate Moran’s I index [57], with the expression:
I A , B = x i A j = 1 n W i j x j B ,
In the formula, I A , B is the local bivariate Moran’s I index. x i A is the standardized change value of LUF-A in the i-th spatial unit. x j B is the standardized change value of LUF-B in the j-th spatial unit. W i j is the spatial weight matrix generated by Euclidean distance weights. And n is the number of spatial units. Four types of spatial correlations are identified at the township level. High-high agglomeration refers to high changes in LUF-A that are surrounded by high changes in LUF-B, whereas low-low agglomeration is the reverse. High-low agglomeration indicates that LUF-A changes greatly and LUF-B changes little, whereas low-high agglomeration is the reverse. All procedures were processed using GeoDa 1.12 software.
Building on this, trade-off agglomeration and synergy agglomeration are processed separately based on spatial interaction correlation results. Local bivariate spatial autocorrelation analysis is then conducted. This helps identify varied forms of spatial non-stationarity across different agglomerations (Table 3) [23].

3. Results

3.1. Spatio-Temporal Evolution Characteristics of LUFs

3.1.1. Overall Characteristics and Temporal Changes

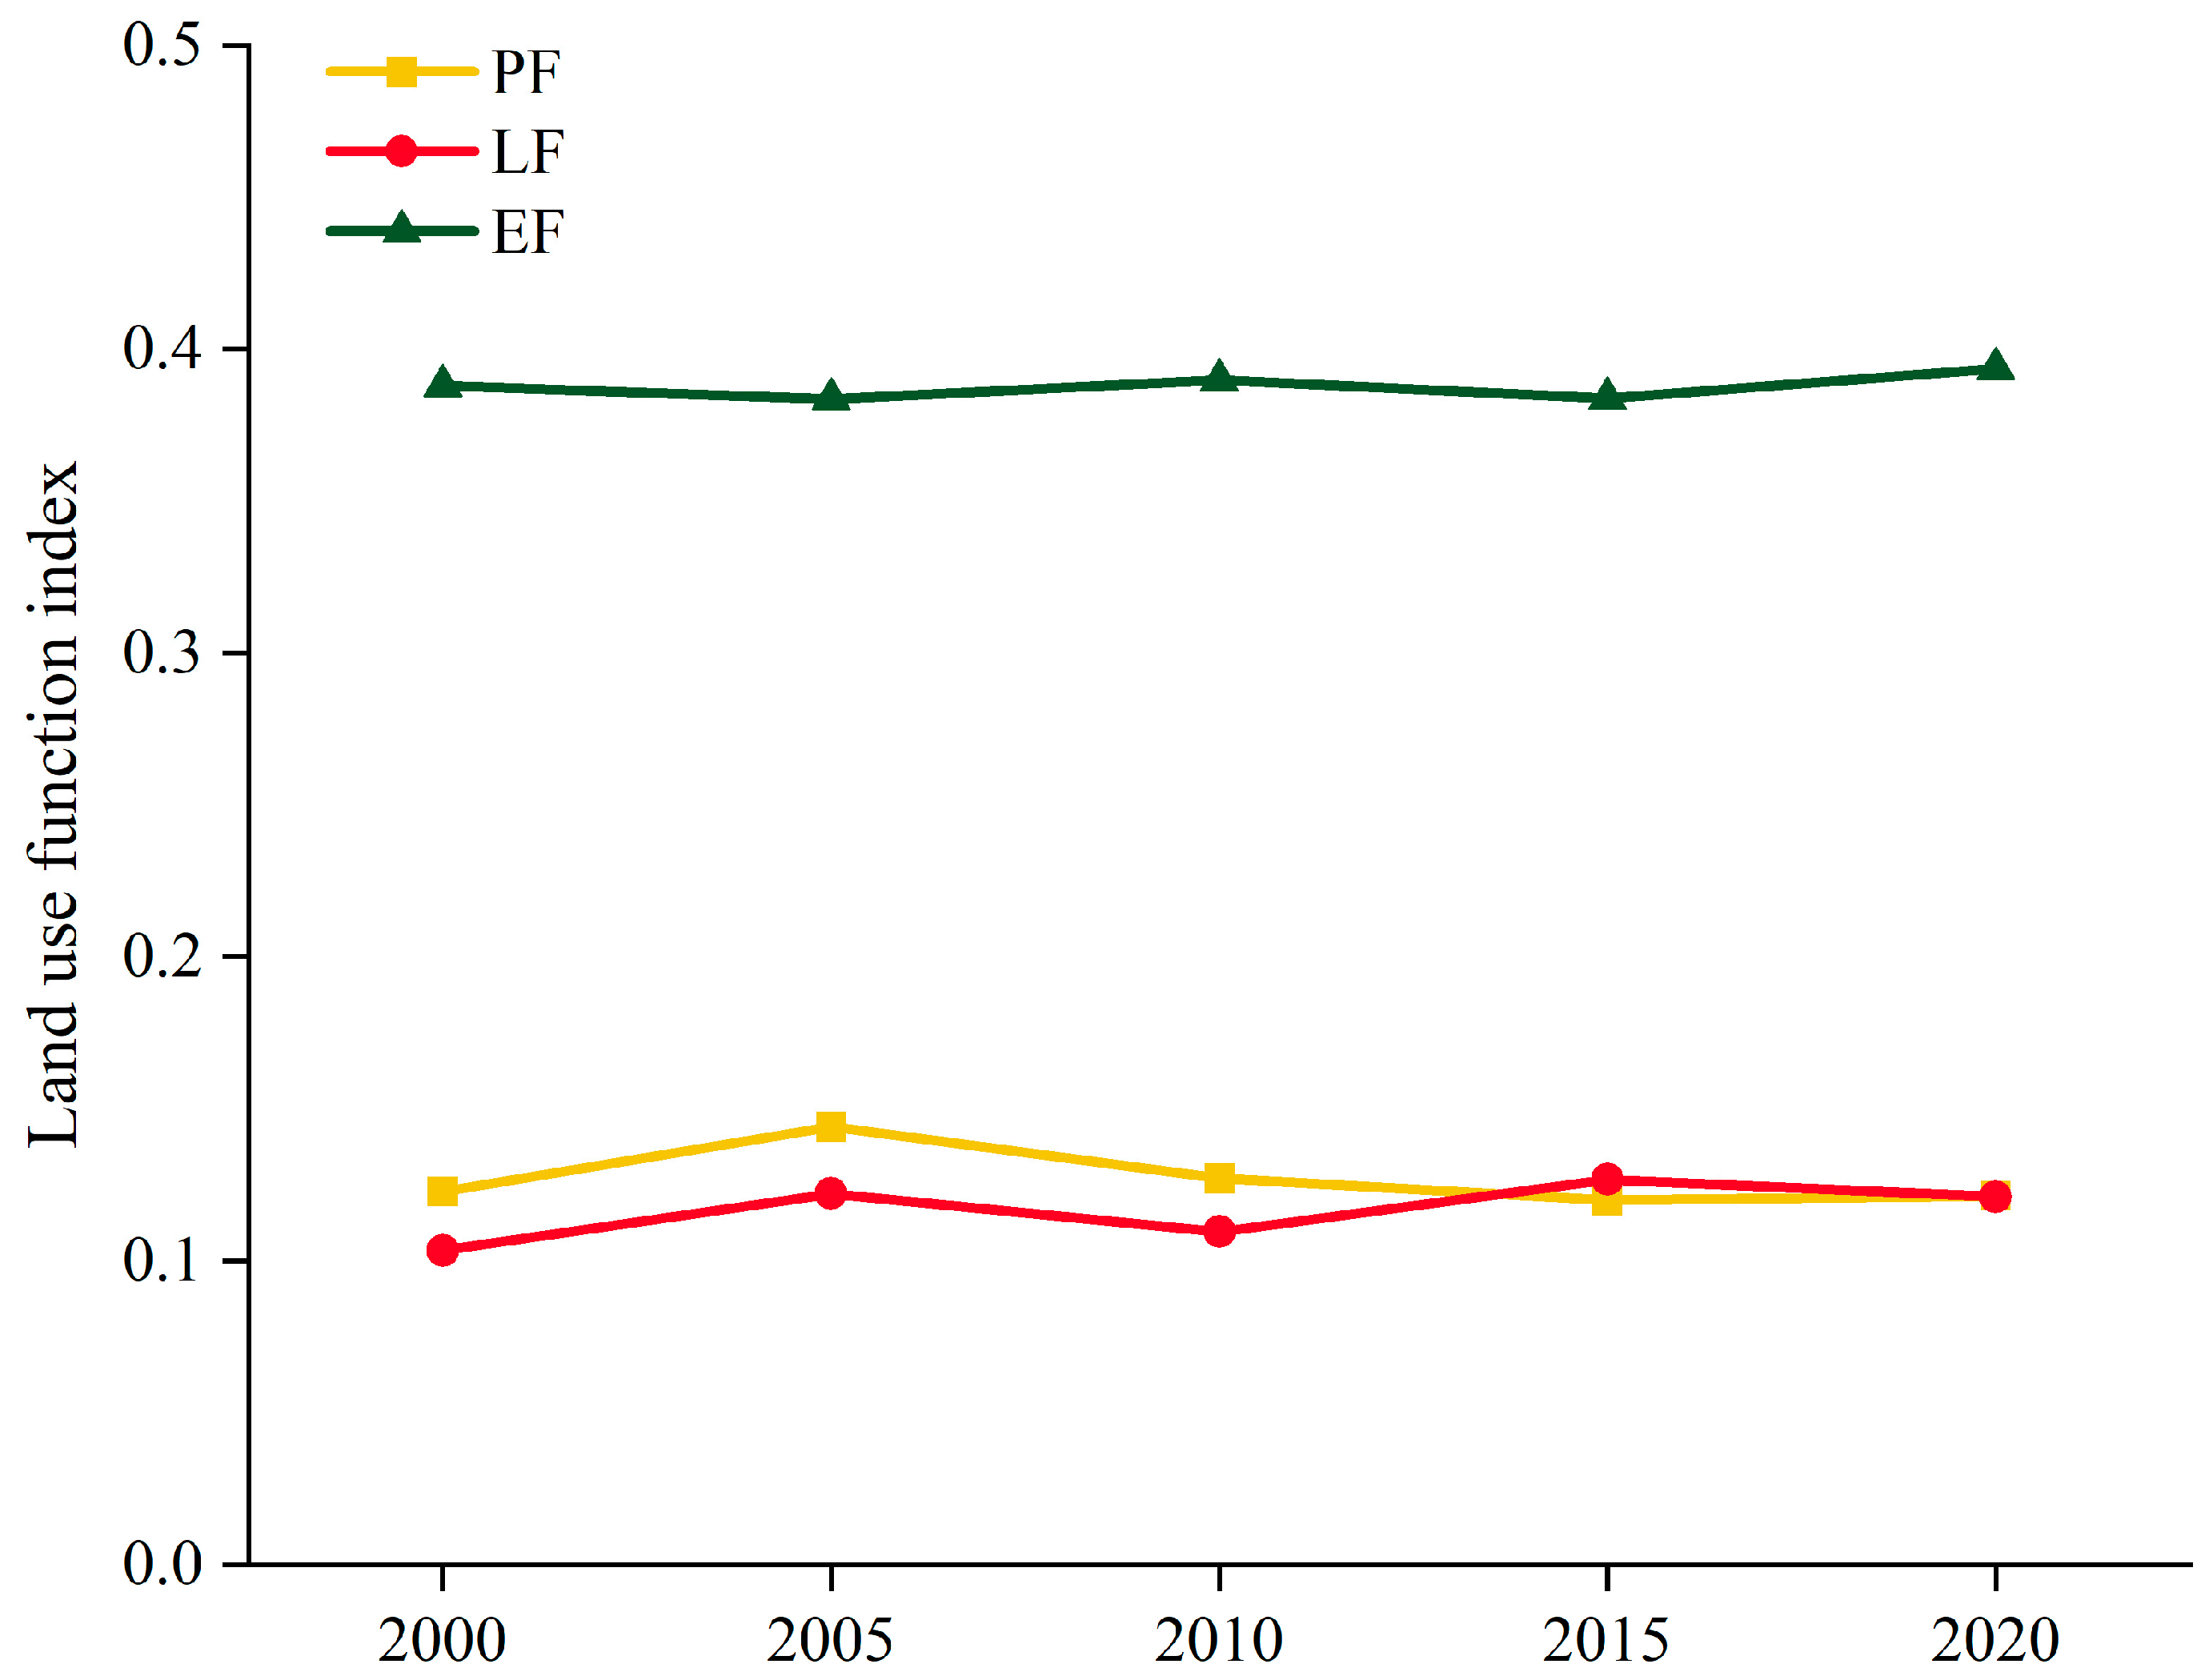
For townships in the Funiu Mountain area, LUFs showed a “one high, two low” characteristic during the study period, i.e., high EF but low PF and LF. Meanwhile, it can be clearly seen that, in the overall composition of LUFs, the ecological function is in an absolutely dominant position, which is consistent with the positioning of the Funiu Mountain area as a special ecological function zone. In terms of temporal changes, PF displayed a downward fluctuating trend, whereas LF and EF demonstrated an upward fluctuating trend (Figure 3). This shifting trend is primarily driven by the coordinated rollout of multiple ecology-focused policies at both national and local levels. These policies include the ongoing execution of ecological restoration measures—such as the Grain for Green Project and the Natural Forest Protection Project. They also encompass the in-depth implementation of targeted poverty alleviation and rural revitalization initiative as part of regional development efforts. Objectively, this trend mirrors China’s sustained investment in ecological conservation over the past two decades, as well as the effectiveness of rural economic development strategies. It further validates the positive results of advancing ecological protection and regional development in a coordinated manner. Among them, PF and LF changed significantly. From 0.1228 in 2000, PF increased to 0.1440 in 2005 and subsequently declined to 0.1214 in 2020, exhibiting an overall decreasing trend. LF increased from 0.1034 in 2000 to 0.1210 in 2020, with an increase of 17.02%. Over the study period, EF increased slightly, from 0.3879 in 2000 to 0.3935 in 2020. When considering growth rates, LF in the Funiu Mountain area increased the most during this period, EF increased slightly, while PF showed a downward trend.

3.1.2. Spatial Pattern and Evolution Characteristics of PF

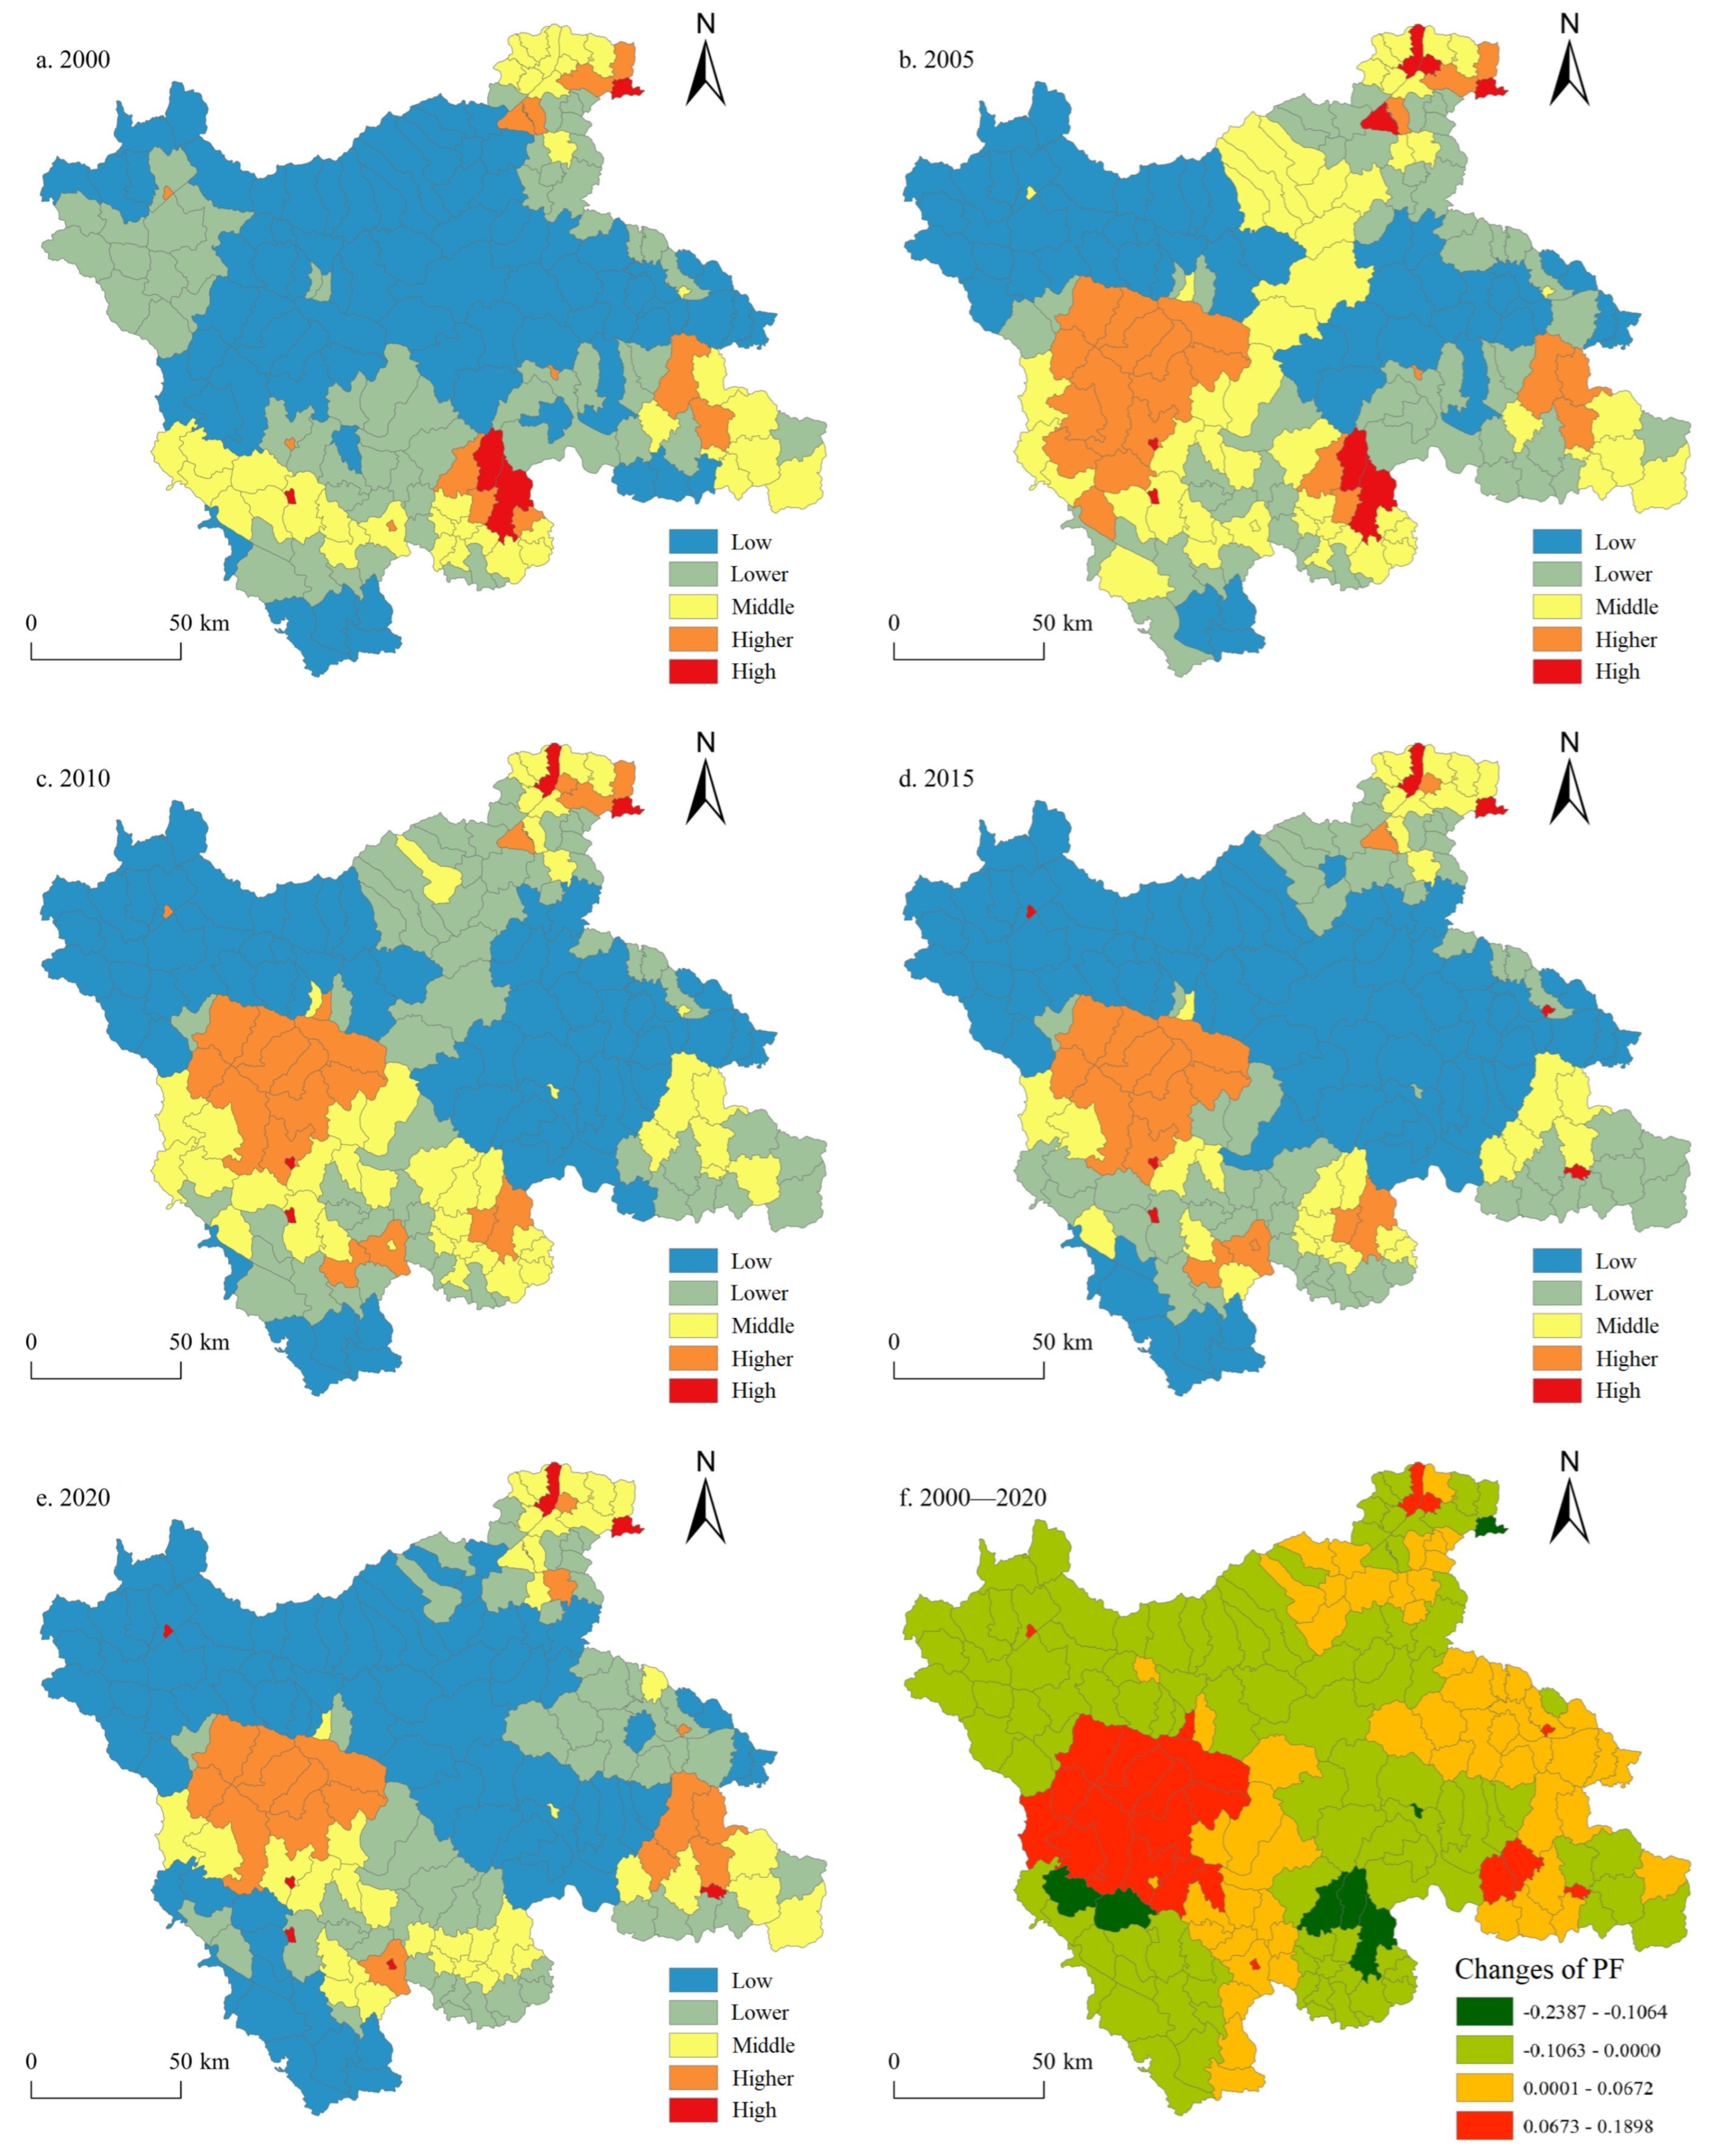
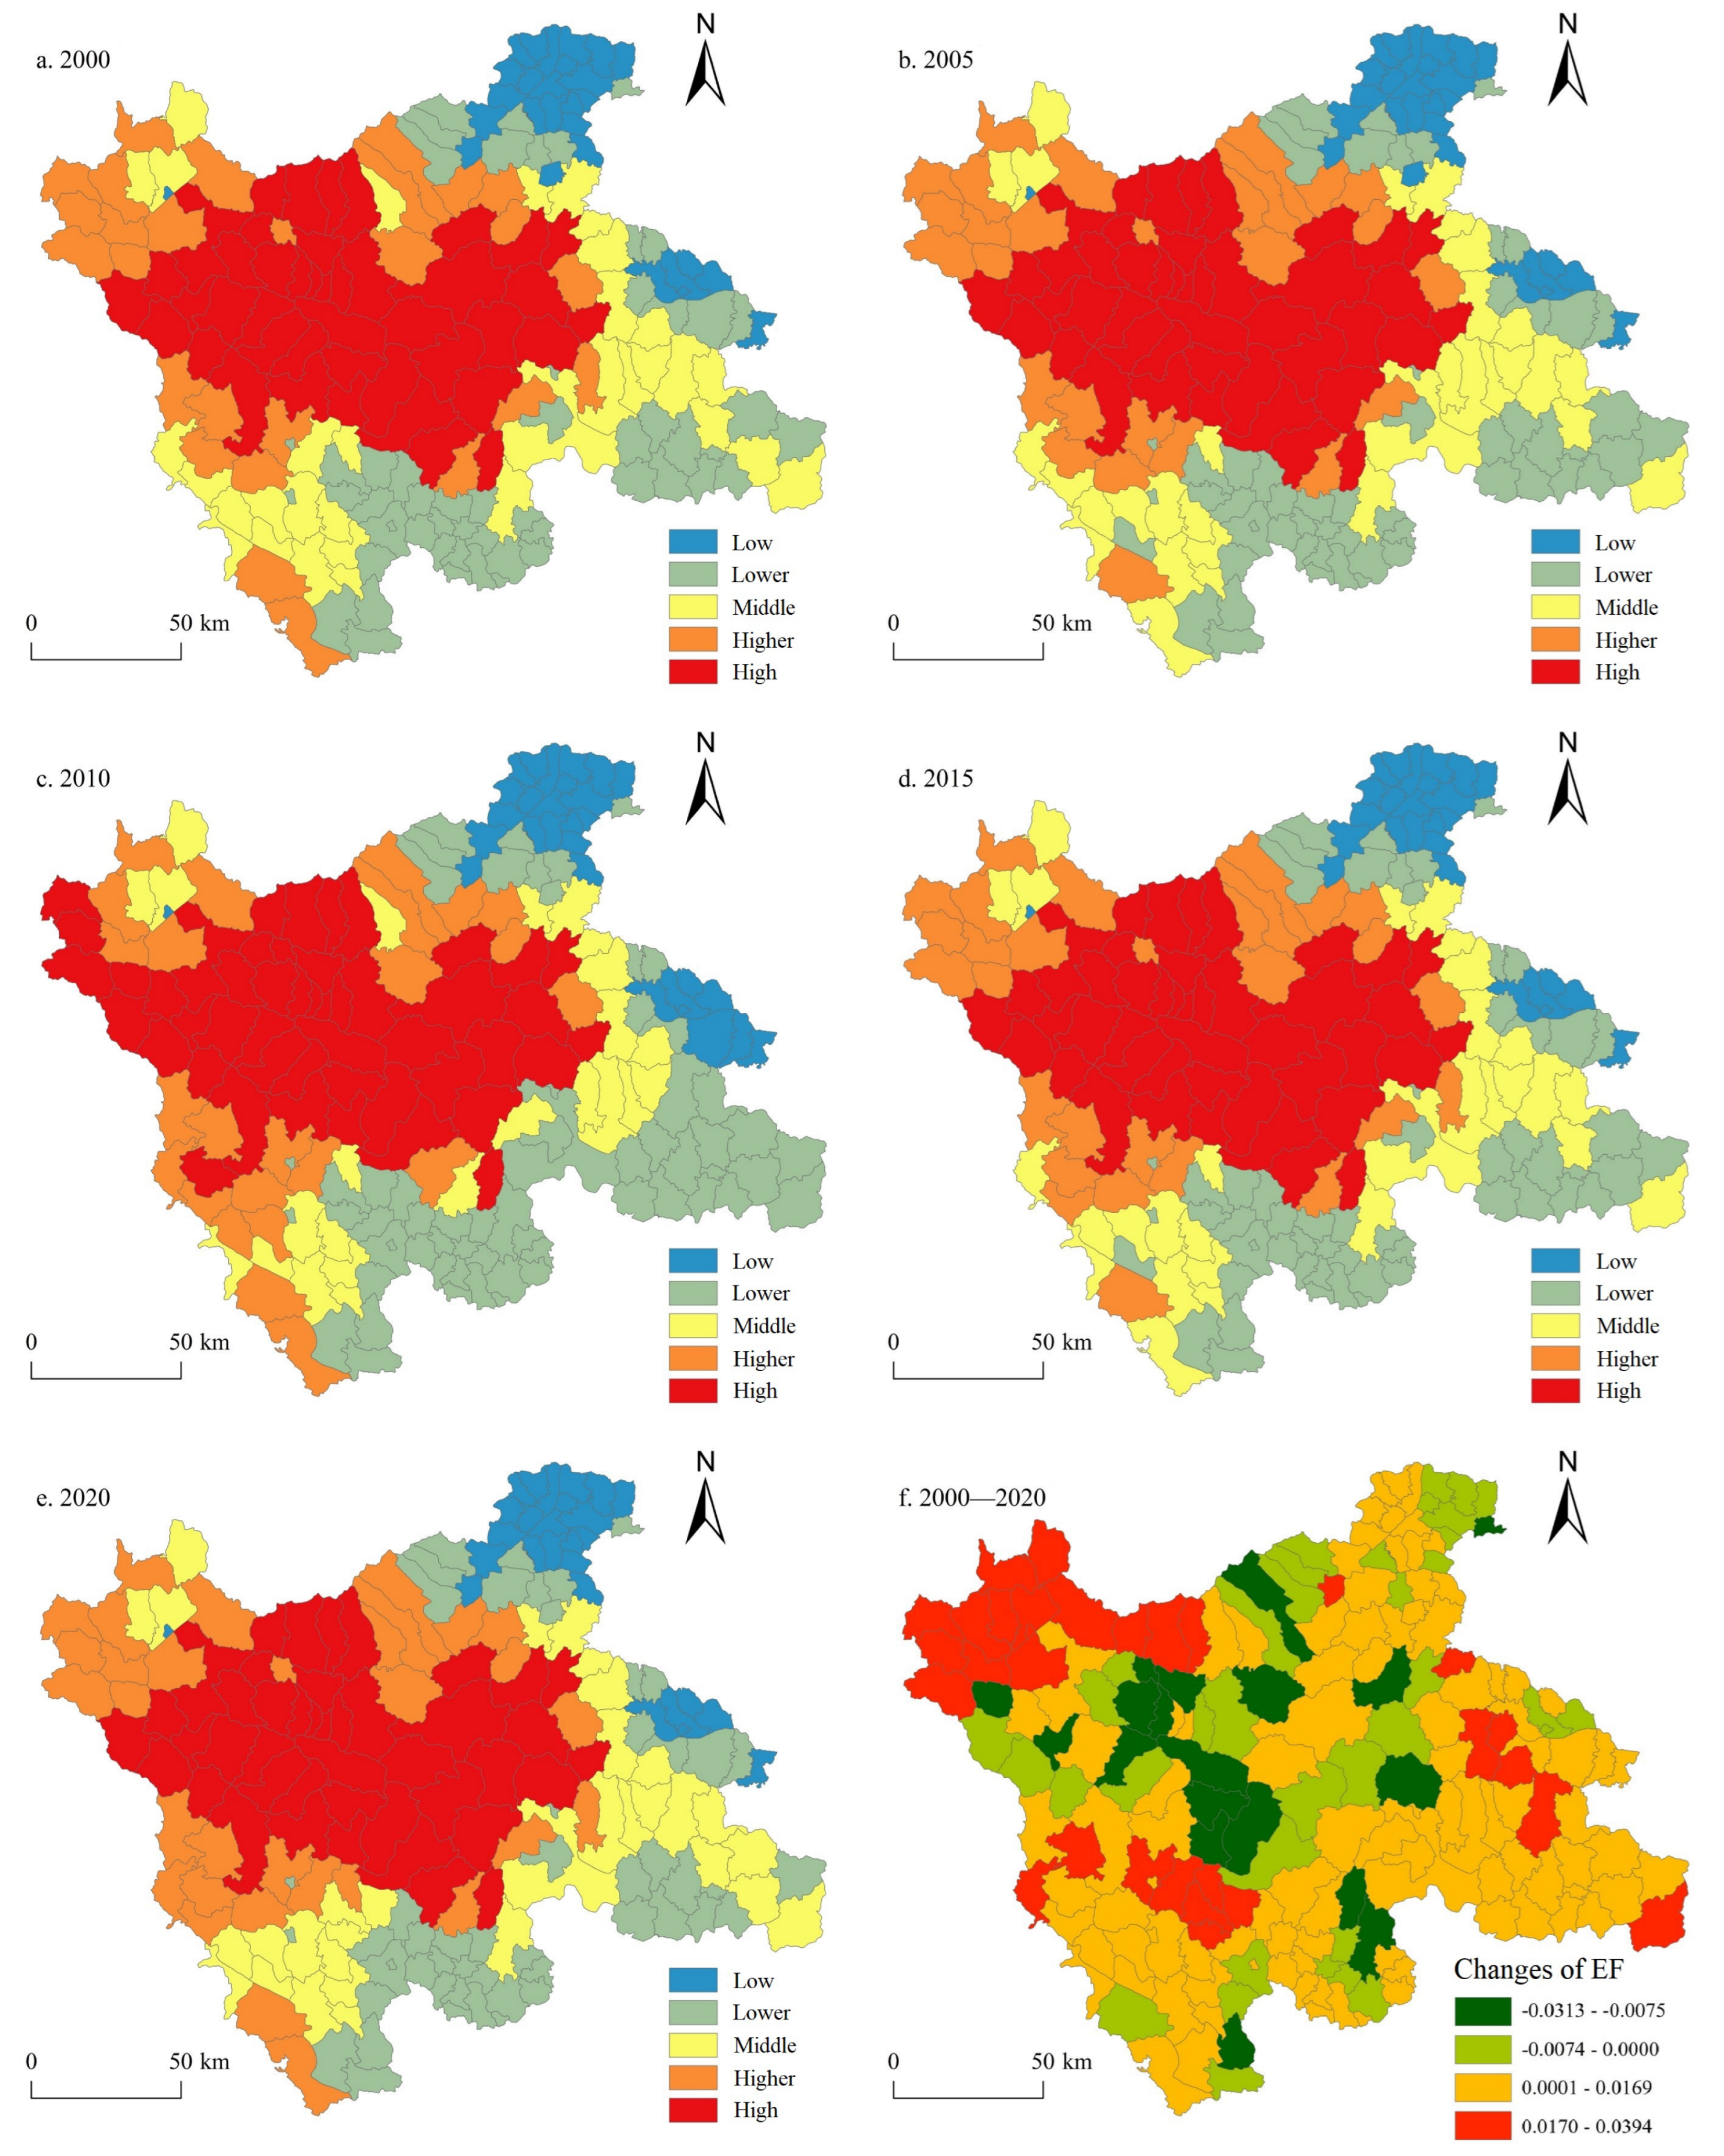
To make data from multiple years comparable, this study divided PF, LF, and EF into 5 grades (low, relatively low, medium, relatively high, and high) using the natural break method in ArcGIS 10.5 with 2000 as the standard.
Spatially, PF in the Funiu Mountain area showed an overall “three high, two low” spatial distribution characteristic (high in the east, south, and north, low in the central and western parts) (Figure 4). The high-value areas are scattered in Yichuan County in the north, Neixiang County and Xichuan County in the south, and Fangcheng County in the east of the Funiu Mountain area; the low-value areas are concentrated in contiguous townships in the central and western parts of the Funiu Mountain area and townships around the Danjiangkou area in the south of the Funiu Mountain area. 2000–2020, PF in the Funiu Mountain area showed a fluctuating upward trend, with significant polarization and increased spatial heterogeneity. This phenomenon is mainly derived from the low altitude and gentle terrain in the eastern and southern parts of the region, coupled with abundant cultivated land resources, favorable transportation conditions, and high population density. These factors together provide sound basic conditions for agricultural production, industrialization, and urbanization. Meanwhile, the western and northern parts have higher terrain, mostly mountainous and hilly areas, unsuitable for crop production and human economic activities. During the study period, PF changes in the Funiu Mountain area were mainly downward, with townships with significant declines mainly in Zhenping County and Xichuan County, while townships with significant increases in PF were mainly distributed in Xixia County. In terms of spatial correlation, during 2000–2020, the global Moran’s I index of PF displayed a fluctuating downward trend (Table 4), decreasing from 0.4658 in 2000 to 0.4202 in 2020, indicating that PF at the township scale had significant positive spatial correlation characteristics.

3.1.3. Spatial Pattern and Evolution Characteristics of LF

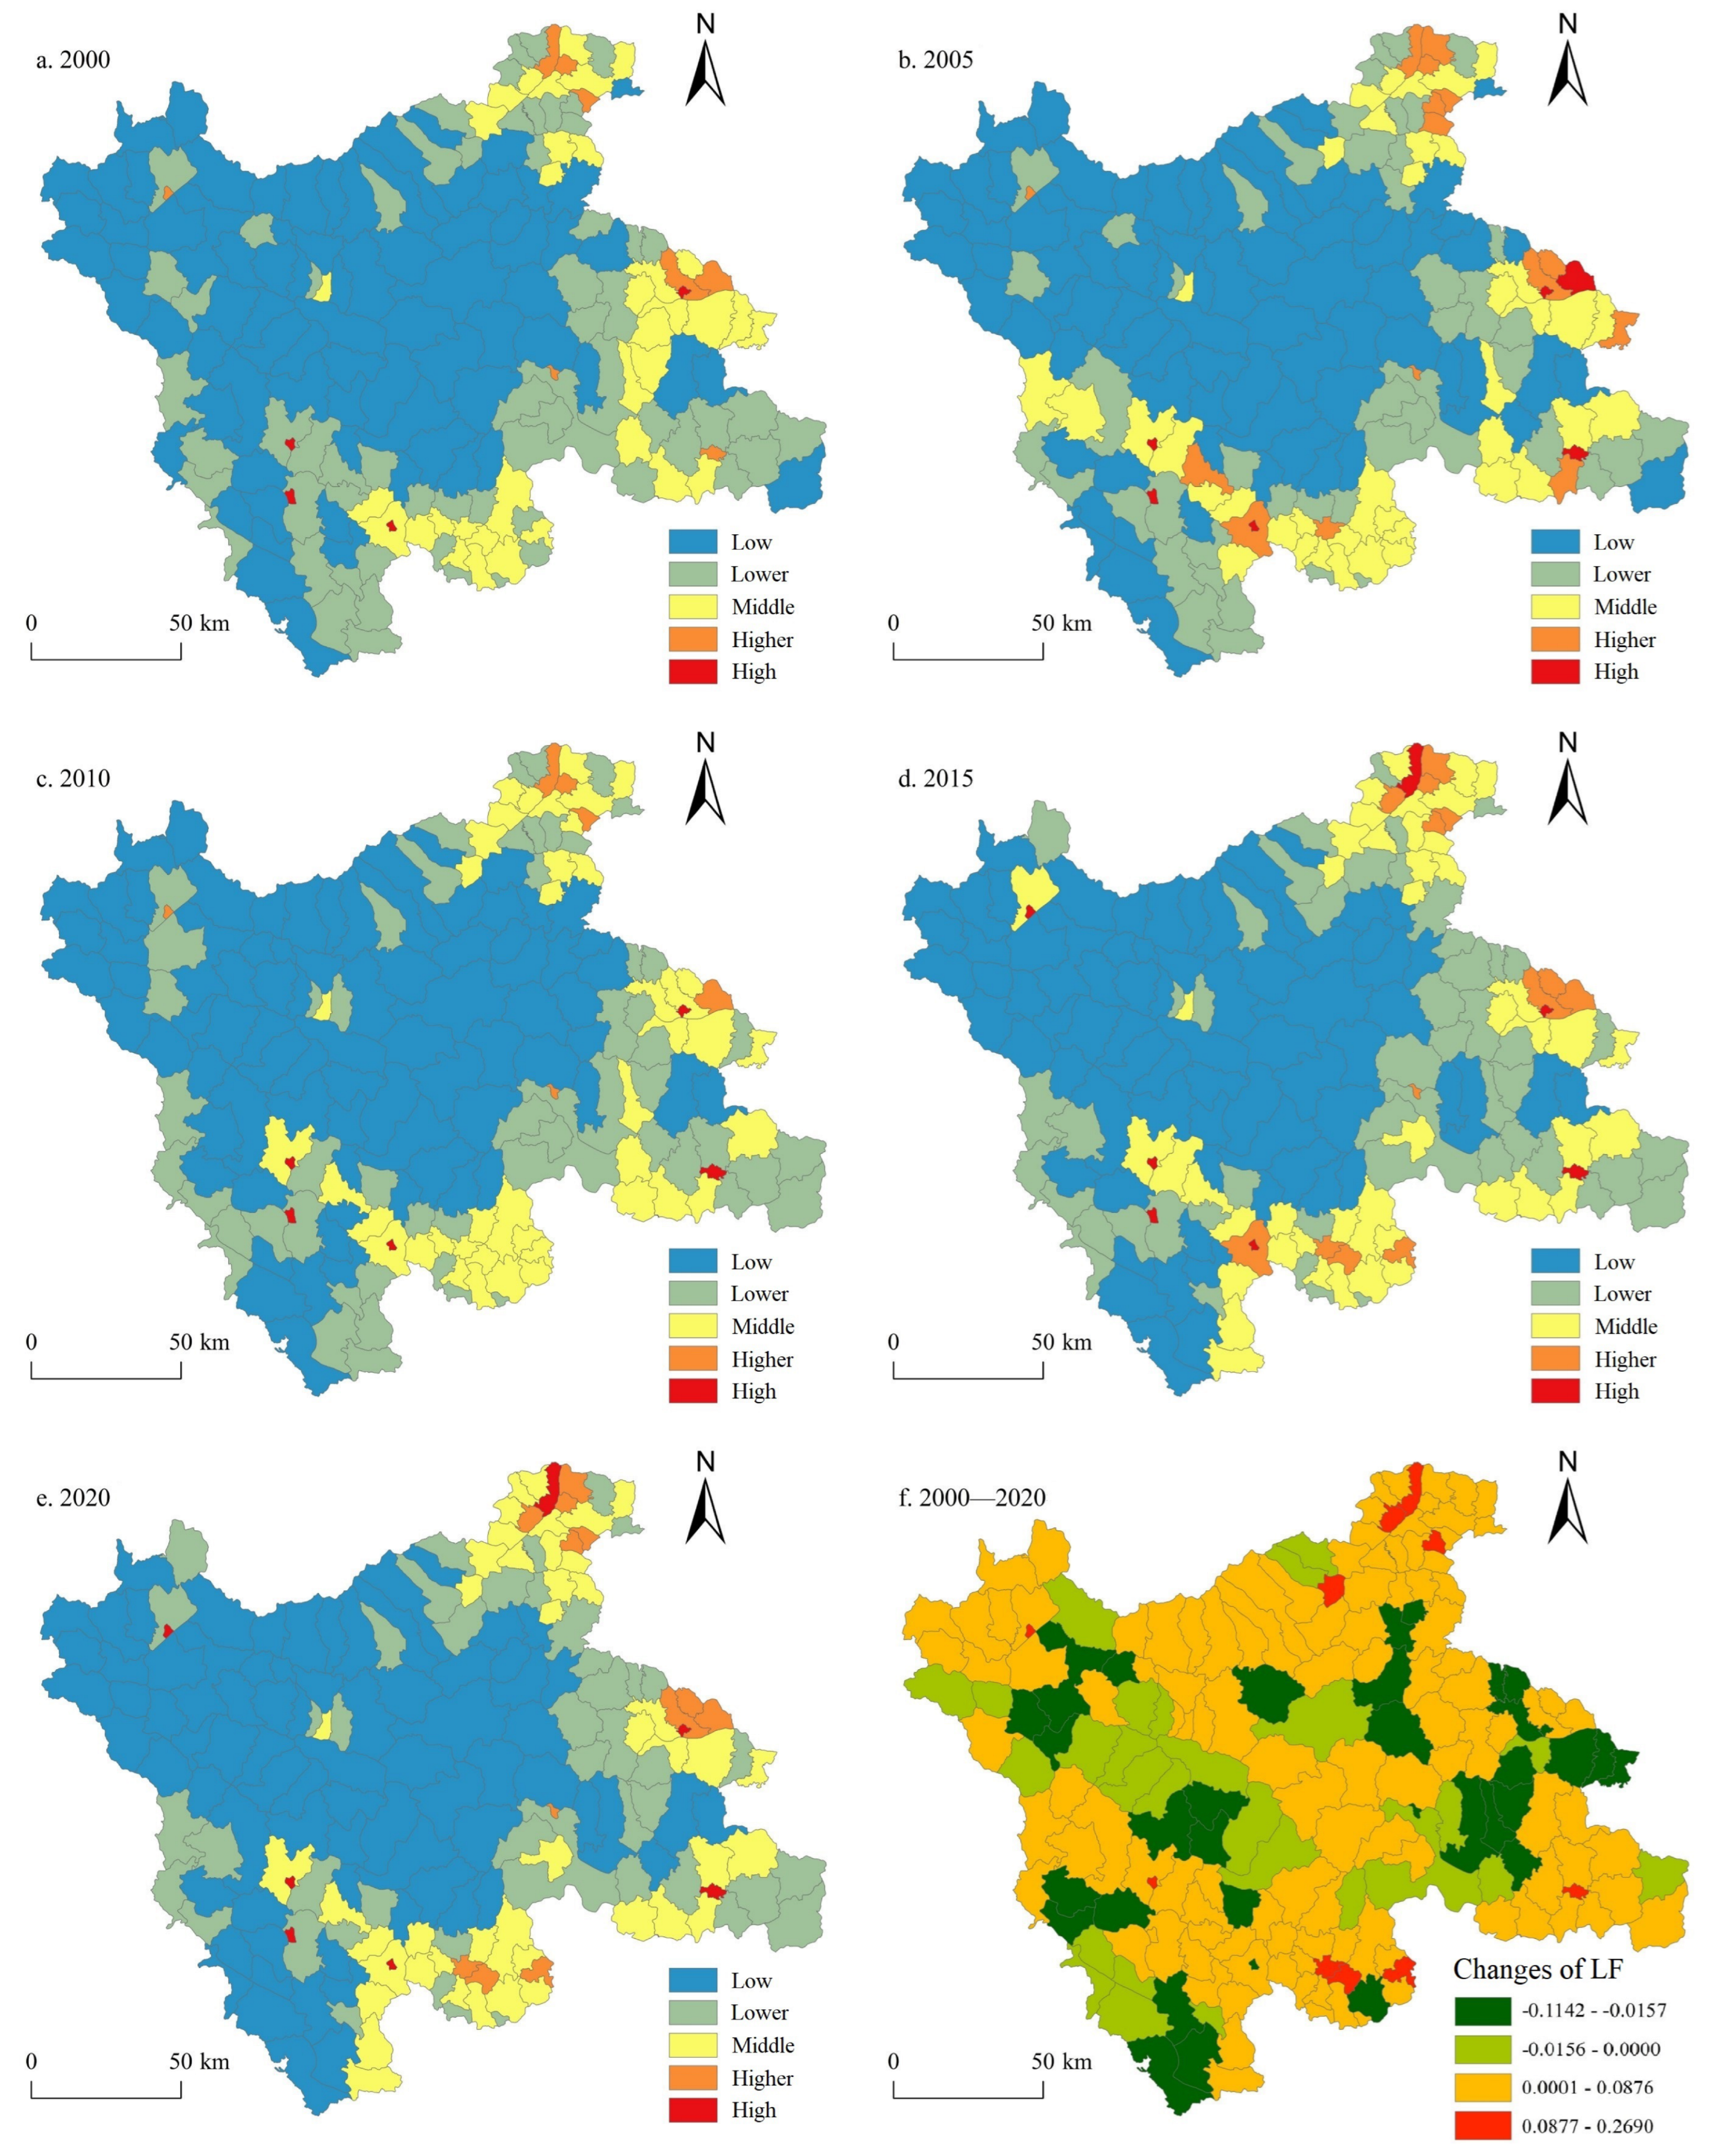
As illustrated in Figure 5, regarding spatial distribution, townships with high LF were consistently concentrated in the central urban areas of counties but in small numbers. Most townships had low LF, widely distributed in the central and western regions of the Funiu Mountain area. This is mainly because the population in the Funiu Mountain area is mainly concentrated in the central urban areas of counties and their vicinity, with complete infrastructure and relatively high LF, while the central and western mountainous and hilly areas have sparse population and backward infrastructure due to topographic constraints, resulting in low LF. In terms of spatio-temporal evolution, although LF increased overall, the increase was low. Townships with significant increases in LF include Baiyu Street in Xixia County, Zheshan Town in Zhenping County, Neibu Township in Ruyang County, and Chengguan Town in Fangcheng County; townships with significant decreases in LF include Chengguan Town in Neixiang County, Yunyang Town in Nanzhao County, Chengguan Town in Lushan County, and Xionbei Township. Notably, over the study period, LF in Chengguan Towns of most counties increased, but only those in Neixiang County, Nanzhao County, and Lushan County decreased significantly. The reason may be related to the large number of villagers going out to work in this region, resulting in a continuous decrease in population density. The global Moran’s I index of LF experienced a fluctuating rise (Table 4), increasing from the minimum value of 0.3232 in 2000 to the maximum value of 0.5412 in 2005, and finally decreasing to 0.3629 in 2020. This indicates that LF in township units in the Funiu Mountain area showed notable positive spatial dependence and spatial agglomeration characteristics.

3.1.4. Spatial Pattern and Evolution Characteristics of EF

In terms of spatial distribution, as can be seen from Figure 6, EF showed an overall gradient from low to high from northwest to southeast, with high-value and relatively high-value zones aggregated in the central and western regions. Low-value and relatively low-value areas were distributed in the northeast and east. In terms of spatio-temporal evolution, EF displayed a general upward trend with localized declines over the study period. Regarding quantity, EF increased in 130 townships and decreased in 55 townships. Among them, townships with significant increases include Fanli Town, Guandaokou Township, and Shahe Township in Lushi County, as well as Baitu Township in Luanchuan County and Danshui Town in Xixia County; townships with significant decreases include Taowan Town and Lengshui Town in Luanchuan County, Erlangping Township and Taiping Town in Xixia County, and Fudian Town in Ruyang County. It is particularly pointed out that these townships with significant decreases in EF are all located in townships with high altitude and core ecological function areas in the Funiu Mountain area. Table 4 indicates that the global Moran’s I index for EF in the Funiu Mountain area trended upward with fluctuations from 2000 to 2020. It rose from 0.8627 in 2000 to 0.8783 in 2020. This indicates that the land use EF of township units in the region exhibited marked positive spatial correlation, with spatial clustering gradually strengthening.

3.2. Overall TOSs Among LUFs

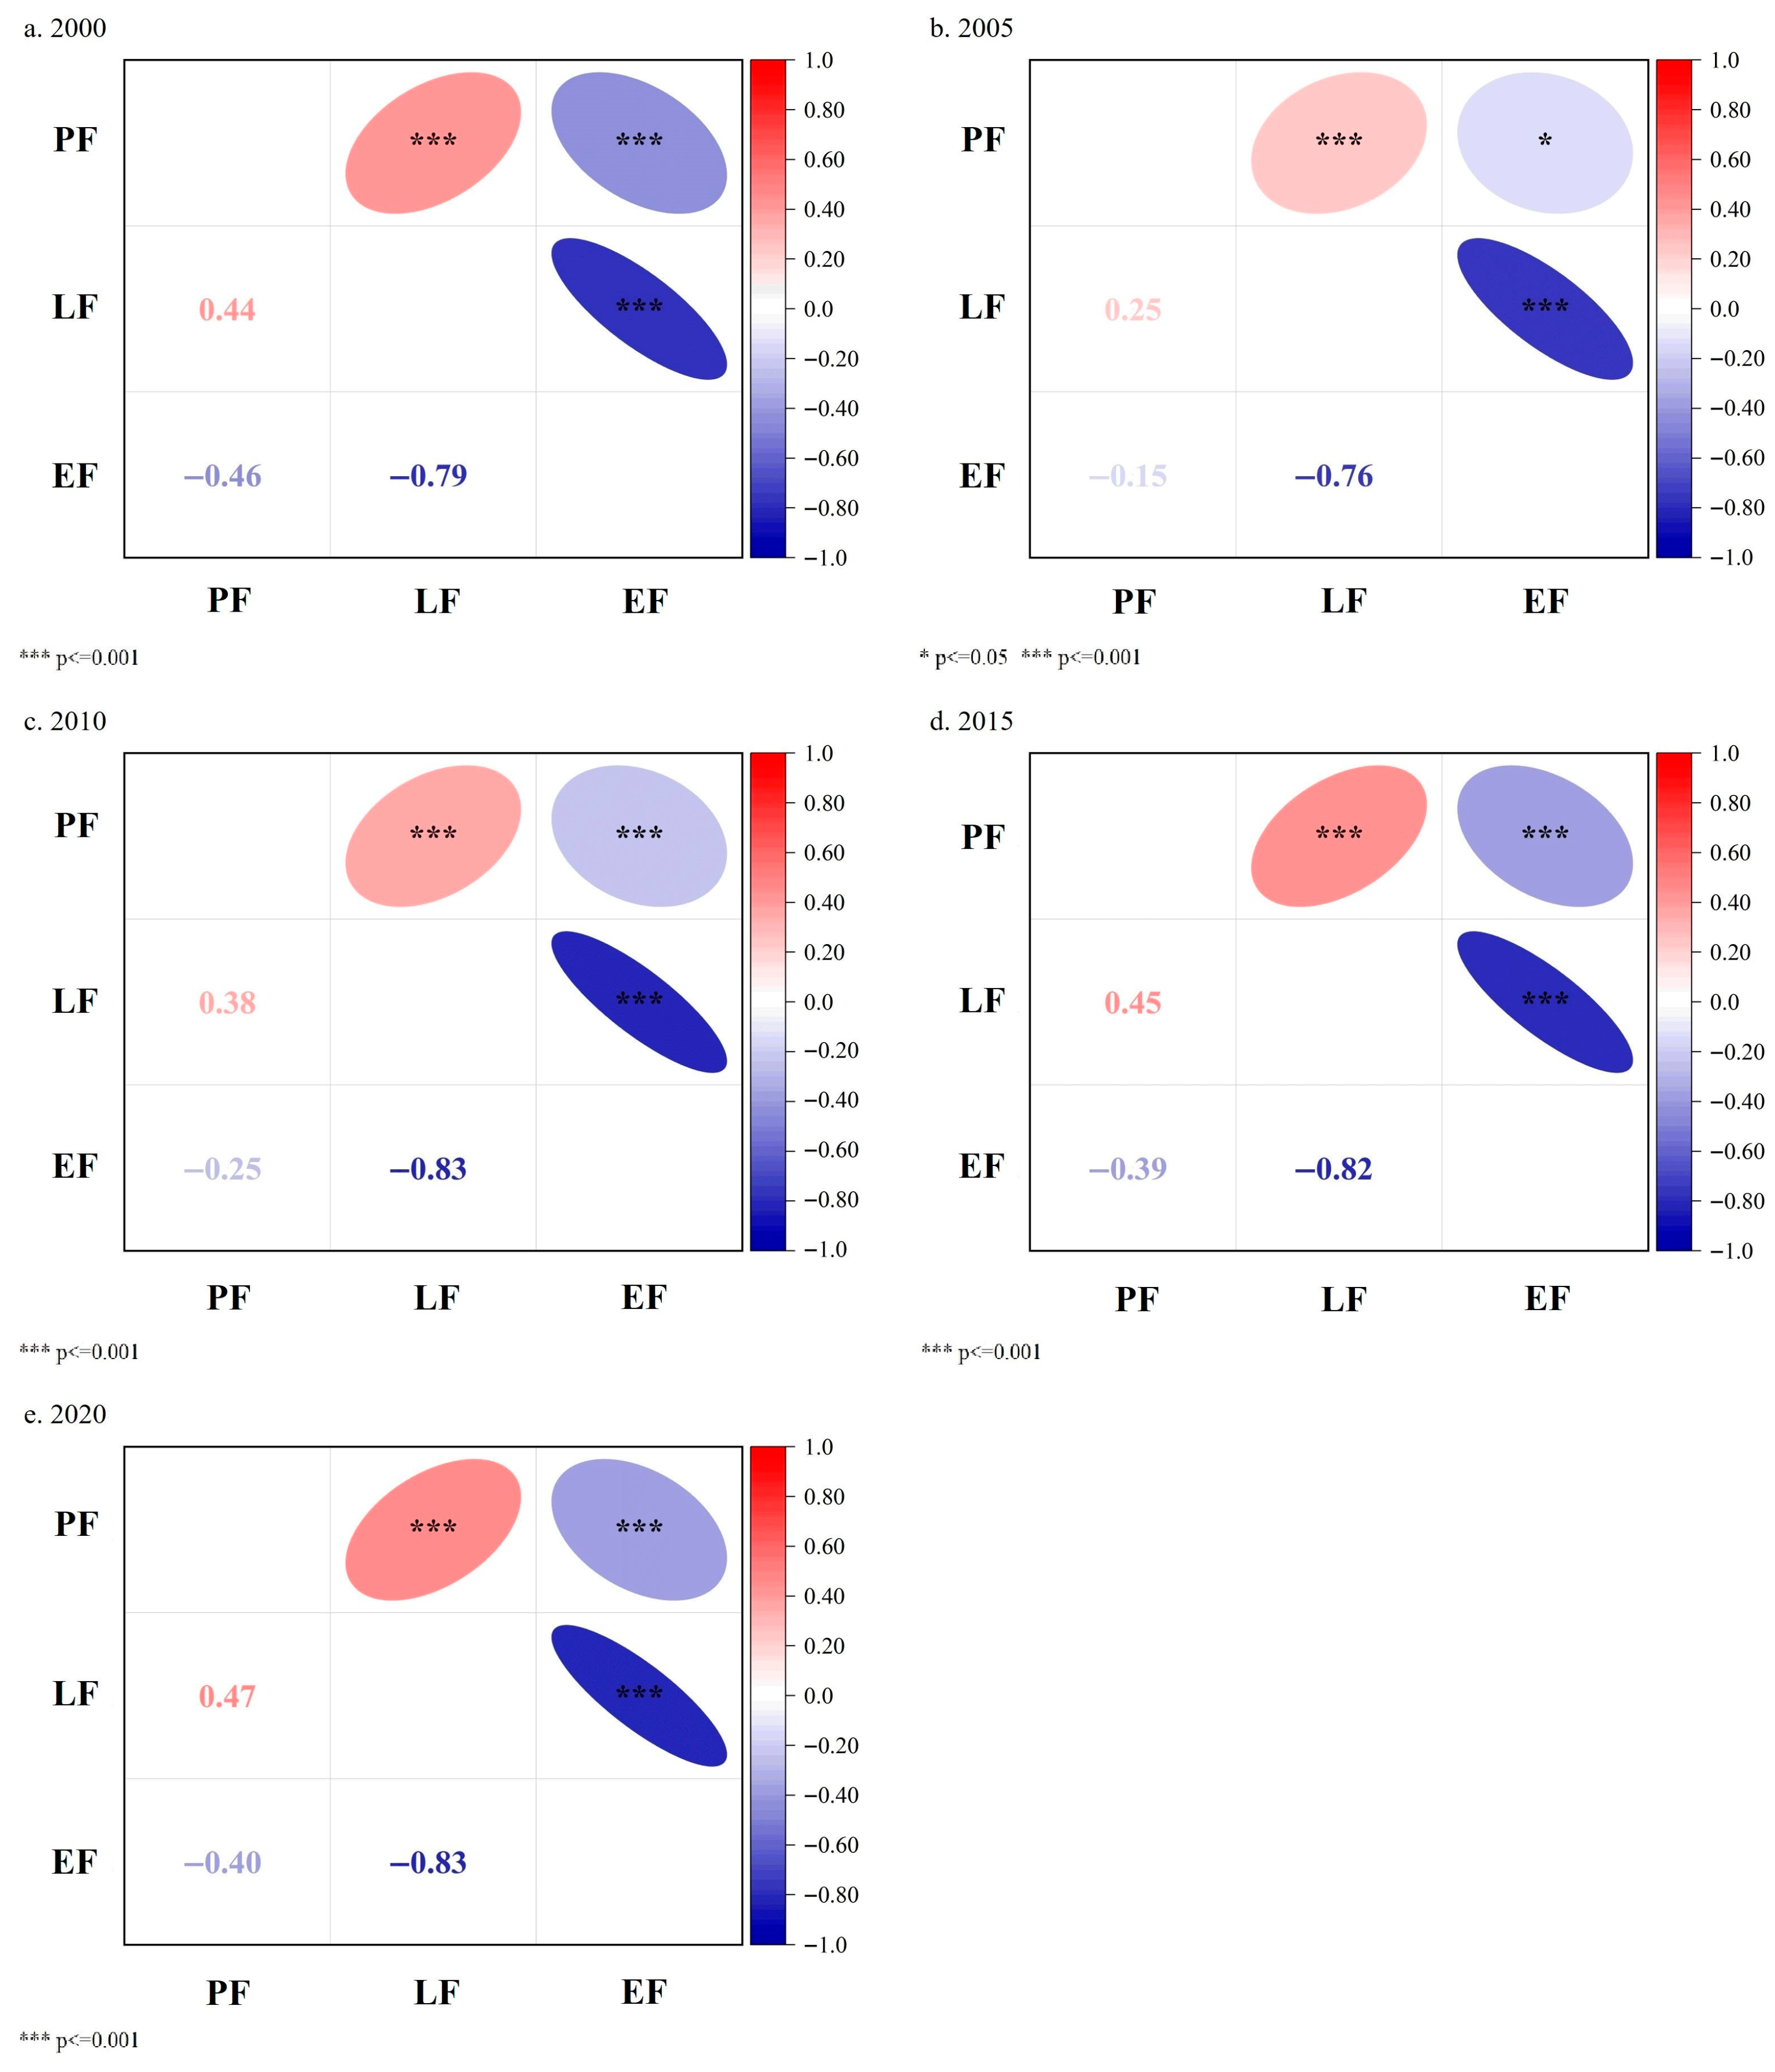
According to the calculation results of spearman correlation among LUFs at the township level in the Funiu Mountain area (Figure 7), there were significant trade-offs or synergies among these LUFs. However, the degree of TOSs between LUFs changed over the study period. Among them, PF-LF maintained a strong positive correlation, with the correlation coefficient decreasing from 0.44 in 2000 to 0.25 in 2005 and then increasing to 0.47 in 2020, indicating that PF-LF had always been a synergy relationship, but the degree of synergy first decreased and then increased over the study period. PF-EF and LF-EF maintained significant negative correlations, indicating that EF had a stable trade-off relationship with PF and LF. The correlation coefficient between PF-EF varied significantly. It rose from −0.46 in 2000 to −0.15 in 2005 and then dropped to −0.40 in 2020. In contrast, the correlation coefficient between LF-EF stayed stable at approximately −0.83 throughout the study period. This suggests that the trade-off degree between PF-EF fluctuated, first declining and then rising during the period. Meanwhile, the trade-off degree between LF-EF remained strong and stable.

3.3. Spatial Non-Stationarity Characteristics of TOSs Between Different Function Changes

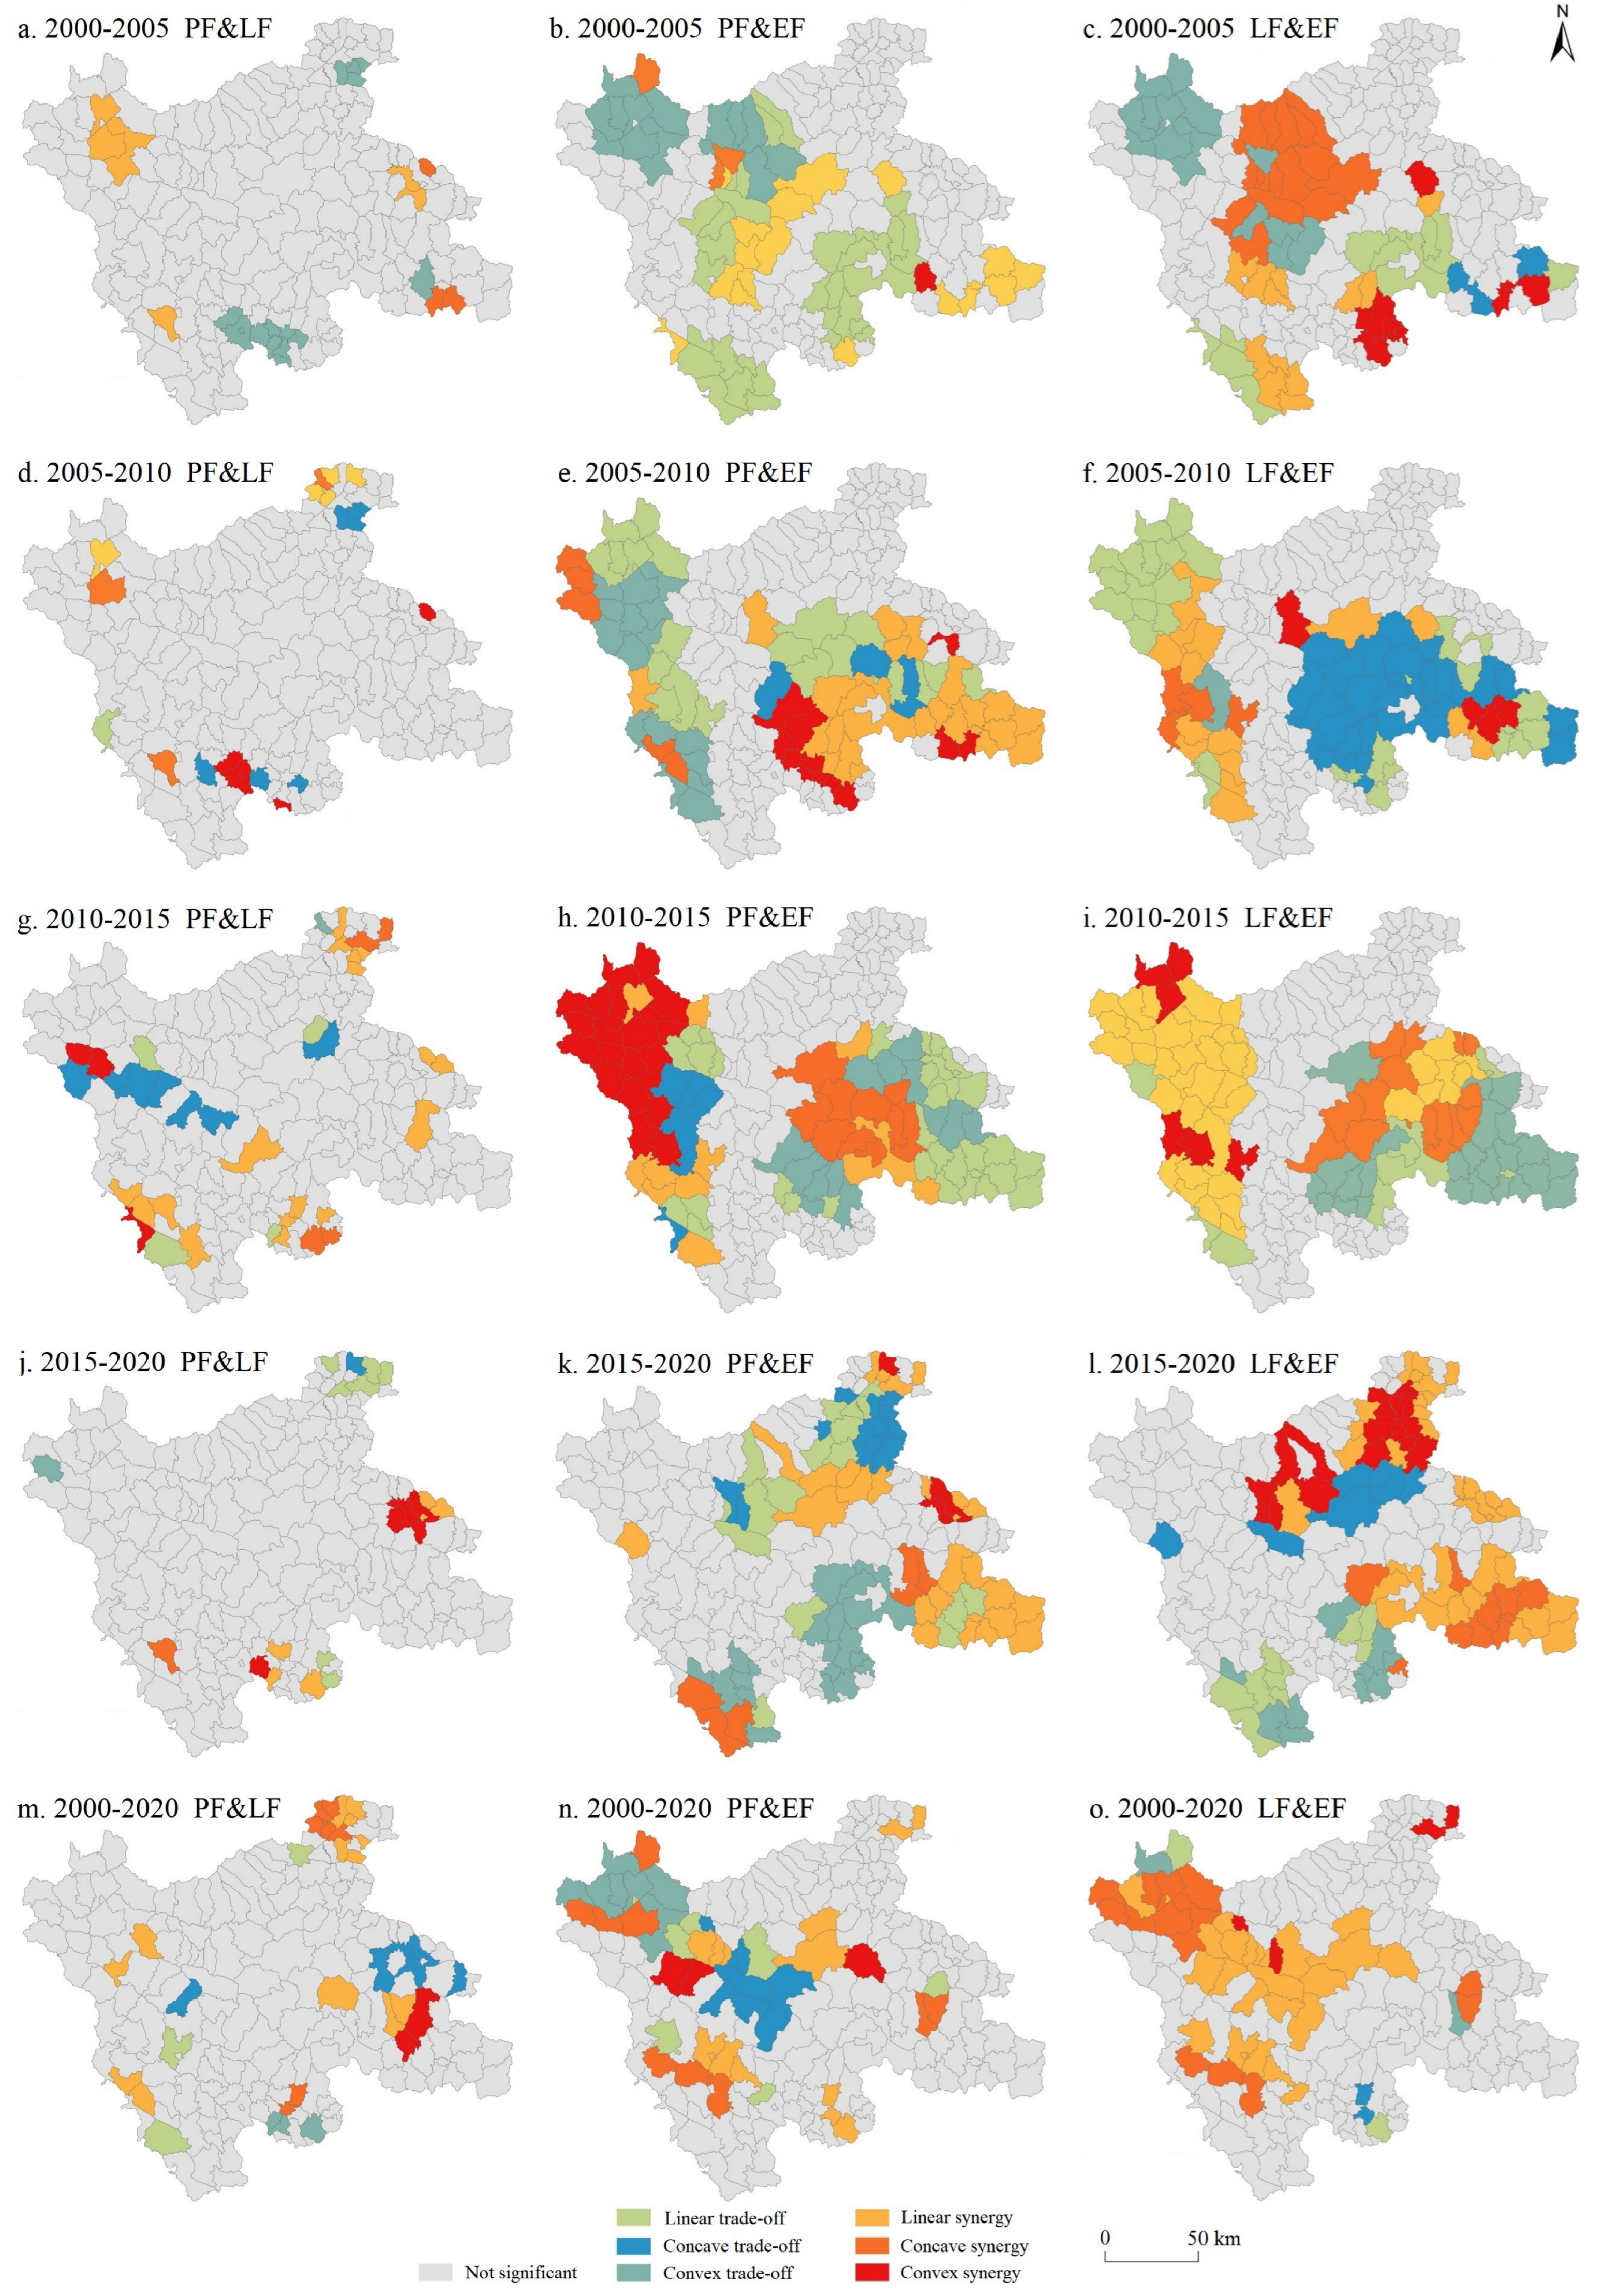
Combined results of GWR and bivariate local spatial autocorrelation for different LUF changes reveal the following. The spatial non-stationarity of TOSs in LUF changes across the Funiu Mountain area exhibited distinct spatial heterogeneity and spatial correlation (Figure 8).

3.3.1. Spatial Non-Stationarity and Type Spatial Pattern of TOSs Between PF and LF

In terms of PF and LF, more than 80% of townships showed no significant relationship. Among townships with significant relationships, there were different types of TOSs, with different types in different time periods, but the number of townships of different types varied greatly. Among them, there were 3 types of TOSs from 2000 to 2005. In terms of trade-off types, only convex trade-offs existed (100%); in terms of synergy types, there were linear synergies (66.67%) and concave synergies (33.33%). There were 5 types of TOSs from 2005 to 2010, with the largest number of townships with concave trade-offs (33.33%) overall. Among them, in terms of trade-offs, there were two types: concave trade-offs and convex trade-offs, with concave trade-offs accounting for the highest proportion (87.5%); in terms of synergies, there were three forms, with linear synergies and convex synergies accounting for 38.46% each. There were 6 types of TOSs from 2010 to 2015, with the largest number of townships with linear synergies (48.57%) overall; concave trade-offs were dominant in trade-offs (58.33%), and linear synergies were dominant in synergies (73.91%). There were 6 types of TOSs from 2015 to 2020, with the largest number of linear trade-offs and linear synergies (30% each) overall; linear trade-offs were dominant in trade-offs (75%), and linear synergies were dominant in synergies (50%). Overall, there were 6 types of TOSs from 2000 to 2020, with the largest number of townships with linear synergies (38.24%) overall. Concave trade-offs were dominant in trade-offs (50%), and linear synergies were dominant in synergies (59.09%).
The above analysis shows that: (1) During the study period, overall, the TOSs of LUFs in the Funiu Mountain area were relatively moderate. However, considering the special importance of the ecological function in this area, among the 20% of townships with trade-offs and synergies, attention should be paid to townships with low-low agglomeration linear synergy types and townships with different trade-offs. (2) In the spatial relationship of trade-off changes, high-low agglomeration concave trade-offs were dominant, indicating that the trade-off of LUFs was dominated by the heterogeneity of high-low agglomeration. In the spatial relationship of synergy changes, linear synergies, including high-high agglomeration and low-low agglomeration, were dominant, indicating that the synergy of LUFs was dominated by homogeneity.

3.3.2. Spatial Non-Stationarity and Type Spatial Pattern of TOSs Between PF and EF

In terms of PF and EF, 35–50% of townships showed significant TOS relationships in different time periods, with various types of TOSs. Among them, there were 5 types of TOSs from 2000 to 2005, with the largest number of linear trade-offs (46.27%) overall; in terms of trade-off types, linear trade-offs were dominant (68.89%); in terms of synergy types, linear synergies were dominant (81.82%). There were 6 types of TOSs from 2005 to 2010, with linear synergies accounting for the highest proportion (29.63%) overall; in terms of trade-off types, linear trade-offs were dominant (55%); in terms of synergy types, linear synergies were dominant (58.54%). There were 6 types of TOSs from 2010 to 2015, with linear trade-offs accounting for the highest proportion (36.17%) overall; in terms of trade-off types, linear trade-offs were dominant (65.38%); in terms of synergy types, convex synergies accounted for the highest proportion (47.62%). There were 6 types of TOSs from 2015 to 2020, with linear synergies accounting for the highest proportion (30.59%) overall. Convex trade-offs were dominant in trade-off types (36%), and linear synergies were dominant in synergy types (74.29%). There were 6 types of TOSs from 2000 to 2020, with linear synergies accounting for the highest proportion (27.66%) overall; concave trade-offs accounted for the highest proportion in trade-off types (36.36%), and linear synergies were dominant in synergy types (52%).
Overall, compared with the spatial relationship between PF and LF, the number of townships with significant TOS relationships between PF and EF increased significantly. Among townships with significant relationships, synergies accounted for 53.19% and trade-offs accounted for 46.81%. This indicates that the interaction between PF and EF in the Funiu Mountain area is generally improving, but trade-offs remain prominent. Especially for the Funiu Mountain area—a special ecological function zone—balancing production development and ecological protection is a long-term task.

3.3.3. Spatial Non-Stationarity and Type Spatial Pattern of TOSs Between LF and EF

Regarding LF and EF, TOSs of LUF changes in the Funiu Mountain area also showed significant relationships in 35–50% of townships in different time periods. The number and distribution of these significant townships were basically consistent with those between PF and EF, but the TOS types were different. There were 6 types of TOSs from 2000 to 2005, with concave synergies accounting for the highest proportion (25.37%) overall, and convex trade-offs accounting for the highest proportion in trade-off types (50%). There were 6 types of TOSs from 2005 to 2010, with linear trade-offs accounting for the highest proportion (38.27%) overall, and linear synergies accounting for the highest proportion in synergy types (65.22%). There were 5 types of TOSs from 2010 to 2015, with linear synergies accounting for the highest proportion (40.43%) overall, and convex trade-offs accounting for the highest proportion in trade-off types (73.53%). There were 6 types of TOSs from 2015 to 2020, with linear synergies accounting for the highest proportion (36.47%) overall, and convex trade-offs accounting for the highest proportion in trade-off types (38.46%). From 2000 to 2020, linear synergies accounted for the highest proportion (53.19%) overall; in trade-off types, linear trade-offs, convex trade-offs, and concave trade-offs each accounted for 33.33%.
Overall, compared with other LUF combinations, the interaction between LF and EF is more moderate (synergy dominates). But, in terms of the type characteristics of spatial non-stationarity, except for linear synergies, the trade-off types of LF and EF were more complex.

4. Discussion

4.1. Potential Mechanisms of Spatial Distribution and Dynamic Evolution of LUFs

The Funiu Mountain area, a core ecological function zone in China’s transition between the northern subtropical and southern temperate zones, exhibits distinct spatial differentiation and dynamic evolution of LUFs. These changes deeply reflect the complex feedback among natural gradients, human activities, and policy interventions. The spatial pattern of LUFs in the Funiu Mountain area showed notable “topographic gradient differentiation” characteristics. On the one hand, this is consistent with the general law of “altitude—function” correlation in mountain ecosystems [58,59]; on the other hand, it shows uniqueness due to the special ecological location and ecological function positioning.
Spatially, the high- and low-value zones of EF, PF, and LF display marked differentiation and complementarity (Figure 4, Figure 5 and Figure 6). This essentially reflects the spatial manifestation of the protection–development conflict in special ecological function zones. Regarding the spatial distribution, EF high-value zones cluster in mid-to-high altitude areas like Luanchuan County and Xixia County (western Funiu Mountain area). This distribution is directly related to the dense forest cover and low human activity intensity in these regions, confirming the basic geographical law that mountain vertical zonality determines the ecological function base [60]. In sharp contrast, high-value areas of PF and LF are mainly concentrated in low-altitude plain areas such as Yichuan County (north) and Fangcheng County (east). These regions have flat terrain, high proportions of cultivated land and construction land, dense transportation lines, and relatively high population density—reflecting the typical economic geographical characteristic that production and living functions agglomerate in areas with superior resource endowments [61]. In the Funiu Mountain area, this differentiation is manifested as the spatial separation between “ecological core areas” and “intensive human activity areas”: counties with higher altitudes (e.g., Luanchuan County)—as the core carriers of the Funiu Mountain National Nature Reserve—maintain high EF for a long time but have relatively low PF; in contrast, counties with lower altitudes (e.g., Yichuan County)—driven by agricultural intensification and industrial expansion—have high PF and LF but low EF. This spatial pattern is similar to the “production–living–ecological” function differentiation model in the ecologically fragile areas of the Loess Plateau [62], but the Funiu Mountain area exhibits a more significant degree of functional differentiation due to its core demand for biodiversity conservation.
In terms of dynamic evolution, different LUFs show distinct evolutionary directions and spatial patterns. Over the study period, the dynamic evolution of LUFs in the Funiu Mountain area exhibited an overall trend of “EF expansion, PF transformation, and LF agglomeration.” This trend was driven by the joint influence of endogenous factors (natural environment base, historical socio-economic foundation) and exogenous factors (human activities, policy guidance) [63,64]. The expansion of EF high-value areas mainly benefits from the continuous advancement of ecological protection policies. Since 2000, ecological construction projects such as the “Grain for Green” program have been implemented in this region; coupled with the official implementation of the Regulations on the Management of the Funiu Mountain National Nature Reserve, the strict enforcement of logging bans in core areas and the systematic promotion of ecological restoration projects have increased the forest coverage rate by 12 percentage points, directly driving the EF index to grow at an average annual rate of 0.015. The transformation of PF reflects the rigid constraints between the ecological protection red line and agricultural production space in the Funiu Mountain area. Taking Xixia County—a major producer of mountainous specialty cash crops (e.g., kiwifruit, Chinese medicinal materials, and edible fungi)—as an example, the long-term maintenance and dynamic growth of its PF high-value areas depend on the multi-dimensional driving forces of intensive development of characteristic agriculture, transformation of characteristic forestry, and coordinated development of non-agricultural industries. The dynamic evolution of LF reflects the dual driving role of urbanization and infrastructure. During the study period, LF low-value areas showed an evolutionary characteristic of “first expansion and then contraction,” which is highly consistent with the regional population redistribution trend guided by the implementation of the Central Plains Urban Agglomeration Development Plan: the expansion of low-value areas from 2000 to 2010 was mainly due to rural population outflow; the contraction of low-value areas from 2010 to 2020 was closely related to population re-agglomeration under the background of accelerated county-level urbanization.

4.2. Potential Mechanisms of TOS and Spatial Non-Stationarity Between LUF Changes

The spatio-temporal dynamics of LUF trade-offs/synergies are strongly linked to interactions between the natural environment and human activities [22,45], with marked spatio-temporal heterogeneity. During the study period, PF and LF mainly exhibited a synergistic relationship with a degree that first decreased and then increased. This dynamic is strongly linked to the evolution of regional urbanization, policy intervention intensity, and ecological protection awareness [22]. These results are consistent with findings in the hilly mountainous areas of northwestern Hubei [5], the middle reaches of the Heihe River [4], and the Three Gorges Reservoir Area [65]. Between 2000 and 2005, China’s early phase of rapid industrialization and urbanization saw extensive land development trigger unregulated expansion of construction land (which encroached on production space). Combined with the short-term adverse impacts of the “Grain for Green” policy (shrinking cultivated land area), the synergy between PF and LF weakened. From 2005 to 2020, China entered the transition stage of “coordinating urban–rural development” and “ecological civilization construction.” Guided by policy, industrial advancement, and upgraded people’s livelihood demands, PF and LF in the Funiu Mountain area gradually developed a positive “mutual promotion” cycle.
The TOSs of LUF changes in the Funiu Mountain area exhibit complex spatial non-stationarity, essentially resulting from the long-term coupling interaction between the unique “social–ecological” system (as a special ecological function zone) and the land system. Throughout the entire study period, the synergistic effect of PF and LF was mainly characterized by linear synergy in townships of counties such as Yichuan County (northeast of the study area) (Figure 8m), reflecting the synchronous improvement of production activities and living space during the urbanization process. This is because this region has flat terrain and superior natural conditions (cultivated land accounts for 38.6% of the area), and it is adjacent to Luoyang urban area—possessing both the dual advantages of plain agriculture and suburban location. Combined with the factor agglomeration effect of urbanization and the synergy-oriented policy intervention, the coordinated improvement of PF and LF is promoted.
The trade-off effect of PF and LF was mainly characterized by concave trade-offs in townships of counties such as Lushan County (east of the study area) (Figure 8n), reflecting the transitional characteristic of production-living functions from significant conflicts in the early stage to alleviated contradictions in the later stage. This transitional trend is the result of the combined action of endogenous factors (natural condition constraints) and exogenous factors (policy adjustments). This region is a transition zone from mountains to plains with large topographic relief, leading to the early expansion of production relying heavily on mountain reclamation and sloping farmland use (intensifying conflicts with living functions). In the later stage, exogenous policy intervention and development model transformation promoted the mitigation of production-living relationships, and the region is currently in the transition stage from trade-off to synergy.
Regarding the spatial non-stationarity of PF-EF changes, two typical patterns of agglomeration areas were observed: convex trade-off agglomeration areas and concave trade-off agglomeration areas. Townships of counties such as Lushi County (northwest of the study area) belong to convex trade-off agglomeration areas, while townships of counties such as Xixia County (central study area) belong to concave trade-off agglomeration areas (Figure 8o). The formation mechanism of this spatial agglomeration characteristic may be closely related to the intensity of regional production activities and the response threshold of ecosystems. Convex trade-offs in townships in the northwest mainly result from the superposition of gradual damage and sudden degradation of ecosystems caused by extensive production activities. In the early stage of the study, this region developed production through unordered mountain reclamation and open-pit mineral mining to pursue short-term economic growth; due to the certain resilience of the ecosystem, the trade-off remained stable. However, in the later stage of the study, the further expansion of PF exceeded the ecological threshold, leading to a sharp degradation of EF and showing the characteristic of convex trade-offs (intensified trade-offs). Concave trade-offs in townships in the central region reflect the mitigation effect of intensive production and ecological regulation on functional conflicts. As the core area of biodiversity in the Funiu Mountain area, this region expanded PF through an intensive path of characteristic agriculture combined with ecotourism; although it occupied part of the ecological space, the simultaneous implementation of ecological restoration projects and industrial upgrading significantly enhanced the anti-interference ability of the ecosystem, showing the characteristic of concave trade-offs (alleviated trade-offs). In townships in the central study area, the spatial non-stationarity of LF-EF changes was characterized by significant linear synergy. As the core ecological area of the Funiu Mountain area, strict ecological protection policies have maintained a high-quality ecological base; coupled with the development of ecotourism and under-forest economy, a positive cycle of “ecological protection—industrial value-added—livelihood improvement” has been formed: on the one hand, the sustainable use of ecological resources supports the steady improvement of EF; on the other hand, industrial benefits feed back to the upgrading of living facilities, promoting the synchronous growth of LF. Ultimately, a typical linear synergy model is presented.

4.3. Policy Recommendations Based on Interactive Relationships of Different LUFs

Based on the levels, spatial patterns, and spatial non-stationarity laws of PF, LF, and EF in the Funiu Mountain area, differentiated regulation should be implemented for regions with different function combinations. By matching regional resource endowments with policy tools to optimize functional relationships and establishing a cross-regional coordination mechanism, operable paths can be provided for territorial space optimization in special ecological function zones. The TOS of LUFs in the Funiu Mountain area shows distinct spatial variation. The spatial interactions among PF, LF, and EF fall into categories like linear synergy zones, concave trade-off zones, and convex trade-off zones. Differentiated policy measures should be adopted for different types of areas:
(1)
Areas of TOS types between PF-LF. In linear synergy areas (e.g., townships in counties such as Yichuan County in the northeast of the Funiu Mountain area), relying on the advantages of plains and suburban locations, we should optimize the spatial coupling layout of industrial parks and new communities, improve facilities such as cold chain logistics and vocational education, strengthen the driving role of PF on LF, and consolidate the stability of synergy. In concave trade-off areas (e.g., townships in counties such as Lushan County in the east of the Funiu Mountain area), aiming at the phased breakthrough of functions, it is necessary to strictly demarcate the red line for returning sloping farmland to forests, promote ecological agriculture such as chestnuts and Chinese medicinal materials, and improve the density of rural road networks to enhance the connectivity of production-living spaces, promoting the transition from trade-off to synergy.
(2)
Areas of TOS types between PF-EF. In convex trade-off areas (e.g., townships in counties such as Lushi County in the northwest of the Funiu Mountain area), addressing the strong negative correlation between production expansion and ecological degradation, strictly adhere to ecological thresholds, implement mine restoration and ecological migration, establish a mechanism for ecological feedback from mineral proceeds, and curb the vicious cycle. In concave trade-off areas (e.g., townships in counties such as Xixia County), focusing on the trend of conflict mitigation, we could deepen the intensive development of characteristic agriculture and ecotourism, establish a mechanism for premium sharing of ecological products, and reduce the rate of ecological loss.
(3)
Areas of TOS types between LF-EF. In linear synergy areas (e.g., townships in counties such as Luanchuan County), addressing the synergetic characteristics of LF and EF, we need to strengthen the management and control of core ecological areas, expand the integrated model of under-forest economy and carbon sink trading, establish a mechanism linking ecological compensation with biodiversity, and consolidate the win-win pattern.
(4)
Construct a multi-dimensional coordination system to promote the sustainable development of regional LUFs. To establish a dynamic monitoring platform for LUFs in the Funiu Mountain area to track the evolution trend of functional interactions in real time; in the context of urban development shifting from incremental expansion to stock optimization, effectively reduce the impact of urban expansion on land, especially cultivated land; provide incentive indicators for synergy areas and implement restrictive indicator management for trade-off areas, and optimize the regional land use structure through differentiated territorial space planning indicator allocation; and promote the spatial connection between ecological protection red lines and rural revitalization plans to realize the sustainable development of ecological protection and regional economy.

4.4. Limitations and Prospects

This study explored the spatial non-stationarity of TOSs of LUF changes in the Funiu Mountain area by coupling GWR and bivariate local spatial autocorrelation, but there are still limitations: Firstly, when evaluating LUFs, due to the availability of historical township-level data, cultural service functions—an important component of LF under the background of urban–rural integration—could not be included in the LUF research framework. Secondly, due to the potential uncertainty of multi-source raster data [66,67] and the scale effect in geography [68], the TOSs of regional LUFs may exhibit different spatio-temporal laws at different spatial scales. However, due to space constraints, this study only explored the TOS effects of LUFs at the township scale and did not involve quantitative research on the driving mechanisms of TOS among LUFs. In the future, a multi-scale research framework can be established to reveal the scale effect of TOS among LUFs, and quantitative research on the driving factors of TOS among LUFs from the perspective of “social-ecological” coupling and analysis of potential threshold effects can be conducted.

5. Conclusions

Taking townships as units and based on the perspective of PLE functions, this study constructed a multi-dimensional integrated evaluation index system for LUFs in the Funiu Mountain area. It also analyzed the spatio-temporal evolution traits of LUFs and their inter-functional interactions. A notable innovation of this research is the coupling of the GWR model and the bivariate local spatial autocorrelation model. This coupled model was applied to identify the spatial non-stationarity and spatial differentiation of TOSs during LUF changes. The key conclusions are as follows:
Throughout the study period, in the overall composition of LUFs, the EF in the Funiu Mountain area was absolutely dominant, which was consistent with the positioning of this area as a special ecological function zone and also reflected the results of continuous ecological construction in this area in the past 20 years.
LUFs of different dimensions showed significant spatio-temporal differences. PF in the Funiu Mountain area revealed a “three high, two low” spatial pattern, with a fluctuating upward trend over the study period. The southern slope of the Funiu Mountain presented notable polarization, and spatial heterogeneity increased. Restricted by living functions, townships with high LF were basically concentrated in county-level central urban areas, and their distribution stayed relatively stable. Aligned with the EF orientation of the Funiu Mountain area, EF displayed an overall upward trend over the study period. High and relatively high EF value zones clustered in the central and western high-altitude regions, while only a few townships saw a decline in EF. It is particularly pointed out that these townships with significant decreases in EF are all located in townships with high altitude and core ecological function areas in the Funiu Mountain area, which should be given special attention, and targeted measures should be taken to gradually improve the EF level of these townships.
Overall, the interaction between PF and LF was dominated by synergy, while the interactions between PF-EF and LF-EF were mainly characterized by trade-offs. From the perspective of the spatial non-stationarity of TOS of LUF changes, over the study period, the interaction between PF and LF was not significant in most townships of the Funiu Mountain area; among townships with significant interactions, linear synergy dominated synergies, and concave trade-off dominated trade-offs. The TOS types of PF-EF were mainly linear, and the interaction generally tended to improve, but trade-off remained prominent (with concave trade-off as the main type). The interaction between LF and EF was relatively moderate: synergy dominated the entire region, and convex trade-off dominated trade-off types. Special attention should be paid to townships with low-low agglomerated linear synergy of different LUFs—especially those with different types of trade-off relationships—in the formulation of targeted spatial governance and optimization policies.

Author Contributions

Conceptualization, J.Y.; methodology, J.Y. and J.Z.; software, J.Y. and J.Z.; validation J.Y. and J.Z.; formal analysis, J.Y. and C.L.; investigation, J.Y.; resources, J.Y.; data curation, C.L.; writing—original draft preparation, J.Y.; writing—review & editing, J.Y., J.Z. and J.G.; visualization, J.Y.; supervision, J.G.; project administration, J.G.; funding acquisition, J.G. All authors have read and agreed to the published version of the manuscript.

Funding

This research was funded by National Natural Science Foundation of China (NSFC) grant number 41771142.

Data Availability Statement

The original contributions presented in the study are included in the article, further inquiries can be directed to the corresponding authors.

Conflicts of Interest

Author Chenyang Li was employed by the company Henan Urban and Rural Planning and Design Institute Co., Ltd. The remaining authors declare that the research was conducted in the absence of any commercial or financial relationships that could be construed as a potential conflict of interest.

References

  1. Meng, J.; Cheng, H.; Li, F.; Han, Z.; Wei, C.; Wu, Y.; You, N.; Zhu, L. Spatial-temporal trade-offs of land multi-functionality and function zoning at finer township scale in the middle reaches of the Heihe River. Land Use Policy 2022, 115, 106019. [Google Scholar] [CrossRef]
  2. Peng, R.; Liu, T.; Cao, G. Valuating Multifunctionality of Land Use for Sustainable Development: Framework, Method, and Application. Land 2023, 12, 222. [Google Scholar] [CrossRef]
  3. Paracchini, M.; Pacini, C.; Jones, M.; Pérez-Soba, M. An aggregation framework to link indicators associated with multifunctional land use to the stakeholder evaluation of policy options. Ecol. Indic. 2011, 11, 71–80. [Google Scholar] [CrossRef]
  4. Schößer, B.; Helming, K.; Wiggering, H. Assessing land use change impacts—A comparison of the sensor land use function approach with other frameworks. J. Land Use Sci. 2010, 5, 159–178. [Google Scholar] [CrossRef]
  5. Liu, C.; Cheng, L.; Li, J.; Lu, X.; Xu, Y.; Yang, Q. Trade-offs analysis of land use functions in a hilly-mountainous city of northwest Hubei Province: The interactive effects of urbanization and ecological construction. Habitat Int. 2023, 131, 102705. [Google Scholar] [CrossRef]
  6. Fan, Y.; Jin, X.; Gan, L.; Jessup, H.; Pijanowski, C.; Yang, X.; Xiang, X.; Zhou, Y. Spatial identification and dynamic analysis of land use functions reveals distinct zones of multiple functions in eastern China. Sci. Total Environ. 2018, 642, 33–44. [Google Scholar] [CrossRef]
  7. Zou, L.; Liu, Y.; Wang, J.; Yang, Y. An analysis of land use conflict potentials based on ecological-production-living function in the southeast coastal area of China. Ecol. Indic. 2021, 122, 107297. [Google Scholar] [CrossRef]
  8. Pérez-Soba, M.; Petit, S.; Jones, L.; Bertrand, N.; Briquel, V.; Omodei-Zorini, L.; Contini, C.; Helming, K.; Farrington, J.; Mossello, M.; et al. Land use functions: A multifunctionality approach to assess the impact of land use changes on land use sustainability. In Sustainability Impact Assessment of Land Use Changes; Helming, K., Pérez-Soba, M., Tabbush, P., Eds.; Springer: Berlin/Heidelberg, Germany, 2008; pp. 375–404. [Google Scholar]
  9. Organization for Economic Cooperation and Development (OECD). Multifunctionality: Towards an Analytical Framework; Organization for Economic Cooperation and Development: Paris, France, 2001. [Google Scholar]
  10. Millennium Ecosystem Assessment (MEA). Ecosystems and Human Well-Being; Island Press: Washington, DC, USA, 2005. [Google Scholar]
  11. Costanza, R. Valuing natural capital and ecosystem services toward the goals of efficiency, fairness, and sustainability. Ecosyst. Serv. 2020, 43, 101096. [Google Scholar] [CrossRef]
  12. Willemen, L.; Verburg, P.; Hein, L.; Mensvoort, M. Spatial characterization of landscape functions. Landsc. Urban Plan. 2008, 88, 34–43. [Google Scholar] [CrossRef]
  13. Peng, J.; Lv, H.; Liu, Y.; Chen, X.; Hu, X. International research progress and perspectives on multi-functional landscape. Adv. Earth Sci. 2015, 30, 465–476. [Google Scholar]
  14. Kienast, F.; Bolliger, J.; Potschin, M.; Groot, R.; Vervurg, P.; Heller, I.; Wascher, D.; Haines-Young, R. Assessing land-scape functions with broad-scale environmental data: Insights gained from a prototype development for Europe. Environ. Manag. 2009, 44, 1099–1120. [Google Scholar] [CrossRef]
  15. Sun, P.; Xu, Y.; Liu, Q.; Liu, C.; Huang, A. Spatiotemporal differentiation and driving factors of multi-functionality of land use in county scale in poverty belt around Beijing and Tianjin. Trans. Chin. Soc. Agric. Eng. 2017, 33, 283–292. [Google Scholar]
  16. Liu, C.; Xu, Y.; Sun, P.; Liu, J. Progress and prospects of multi-functionality of land use research. Prog. Geogr. 2016, 35, 1087–1099. [Google Scholar]
  17. Cao, S.; Li, F.; Wei, Y.; Xie, G.; Yang, L.; Zhen, L. Land Use Functions: Conceptual Framework and Application for China. Resour. Sci. 2009, 31, 544–551. [Google Scholar]
  18. Chen, J.; Shi, P. Discussion on functional and use classification system. J. Beijing Norm. Univ. Nat. Sci. 2005, 41, 536–540. [Google Scholar]
  19. Zhang, X.; Zhu, D.; Xu, Z. Assessment on multi-functionality of land use in Tibet. Trans. Chin. Soc. Agric. Eng. 2014, 30, 185–194. [Google Scholar]
  20. Lyu, Y.; Wang, M.; Zou, Y.; Wu, C. Mapping trade-offs among urban fringe land use functions to accurately support spatial planning. Sci. Total Environ. 2022, 802, 149915. [Google Scholar] [CrossRef]
  21. Ren, J.; Ma, R.; Huang, Y.; Wang, Q.; Guo, J.; Li, C.; Zhou, W. Identifying the trade-offs and synergies of land use functions and their influencing factors of Lanzhou-Xining urban agglomeration in the upper reaches of Yellow River Basin, China. Ecol. Indic. 2024, 158, 11279. [Google Scholar] [CrossRef]
  22. Zhang, J.; Li, S.; Lin, N.; Lin, Y.; Yuan, S.; Zhang, L.; Zhu, J.; Wang, K.; Gan, M.; Zhu, C. Spatial identification and trade-off analysis of land use functions improve spatial zoning management in rapid urbanized areas, China. Land Use Policy 2022, 116, 106058. [Google Scholar] [CrossRef]
  23. Li, S.; An, W.; Zhang, J.; Gan, M.; Wang, K.; Ding, L.; Li, W. Optimizing limit lines in urban-rural transitional areas: Unveiling the spatial dynamics of trade-offs and synergies among land use functions. Habitat Int. 2023, 140, 102907. [Google Scholar] [CrossRef]
  24. Zhu, C.; Dong, B.; Li, S.; Lin, Y.; Shahtahmassebi, A.; You, S.; Zhang, J.; Gan, M.; Yang, L.; Wang, K. Identifying the trade-offs and synergies among land use functions and their influencing factors from a geospatial perspective: A case study in Hangzhou China. J. Clean. Prod. 2021, 314, 128026. [Google Scholar] [CrossRef]
  25. Wei, C.; Wu, Z.; Xing, J.; Jin, G. Trade-off or synergy? Dynamic analysis and policy insights on land use functions in China. Environ. Impact Assess. Rev. 2024, 105, 107399. [Google Scholar] [CrossRef]
  26. Zhou, K.; Sun, Z.; Ma, T.; Li, Y.; Xie, B. Spatiotemporal Heterogeneity and Zoning Strategies of Multifunctional Trade-Offs and Synergies in Cultivated Land in the Hexi Corridor. Land 2025, 14, 335. [Google Scholar] [CrossRef]
  27. Li, K.; Zhao, J.; Li, Y.; Lin, Y. Identifying trade-offs and synergies among land use functions using an XGBoost-SHAP model: A case study of Kunming, China. Ecol. Indic. 2025, 172, 113330. [Google Scholar] [CrossRef]
  28. Li, X.; Lu, Z. Exploring the Balance Between Ecosystem Services and Economic Benefits via Multi-Objective Land Use Optimization. Land 2025, 14, 920. [Google Scholar] [CrossRef]
  29. Verburg, P.; Steeg, J.; Veldkamp, A.; Willemen, L. From land cover change to land function dynamics: A major challenge to improve land characterization. J. Environ. Manag. 2009, 90, 1327–1335. [Google Scholar] [CrossRef]
  30. Kim, I.; Arnhold, S. Mapping environmental land use conflict potentials and ecosystem services in agricultural watersheds. Sci. Total Environ. 2018, 630, 827–838. [Google Scholar] [CrossRef]
  31. Chen, Z.; Li, Y.; Liu, Y.; Liu, X. Does rural residential land expansion pattern lead to different impacts on eco-environment? A case study of loess hilly and gully region China. Habitat Int. 2021, 117, 102436. [Google Scholar] [CrossRef]
  32. Bradford, J.; D’Amato, A. Recognizing trade-offs in multi-objective land management. Front. Ecol. Environ. 2012, 10, 210–216. [Google Scholar] [CrossRef]
  33. Turkelboom, F.; Leone, M.; Jacobs, S.; Kelemen, E.; García-Llorente, M.; Baró, F.; Termansen, M.; Barton, D.; Berry, P.; Stange, E.; et al. When we cannot have it all: Ecosystem services trade-offs in the context of spatial planning. Ecosyst. Serv. 2018, 29, 566–578. [Google Scholar] [CrossRef]
  34. Cheng, L.; Cui, H.; Liang, T.; Huang, D.; Su, Y.; Zhang, Z.; Wen, C. Study on the Trade-Off Synergy Relationship of “Production-Living-Ecological” Functions in Chinese Counties: A Case Study of Chongqing Municipality. Land 2023, 12, 1010. [Google Scholar] [CrossRef]
  35. Li, X.; Lu, Z. Spatiotemporal Evolution of Land Use Structure and Function in Rapid Urbanization: The Case of the Beijing–Tianjin–Hebei Region. Land 2024, 13, 1651. [Google Scholar] [CrossRef]
  36. Tran, D.; Pearson, D.; Palmer, A.; Lowry, J.; Gray, D.; Dominati, E. Quantifying spatial non-stationarity in the relationship between landscape structure and the provision of ecosystem services: An example in the New Zealand hill country. Sci. Total Environ. 2022, 808, 152126. [Google Scholar] [CrossRef] [PubMed]
  37. Fan, Y.; Gan, L.; Hong, C.; Jessup, L.; Jin, X.; Pijanowski, B.; Lyu, L. Spatial identification and determinants of trade-offs among multiple land use functions in Jiangsu Province, China. Sci. Total Environ. 2021, 772, 145022. [Google Scholar] [CrossRef] [PubMed]
  38. Deng, W.; Zhang, S.; Zhang, H.; Peng, L.; Liu, Y. Transitional geospace from the perspective of human-nature coupling: Concept, connotations, attributes, and the research framework. Geogr. Res. 2020, 39, 761–771. [Google Scholar]
  39. Yang, Y.; Ren, X.; Yan, J. Trade-offs or synergies? Identifying dynamic land use functions and their interrelations at the grid scale in urban agglomeration. Cities 2023, 140, 104384. [Google Scholar] [CrossRef]
  40. Zou, L.; Liu, Y.; Yang, J.; Yang, S.; Wang, Y.; Cao, Z.; Hu, X. Quantitative identification and spatial analysis of land use ecological-production-living functions in rural areas on China’s southeast coast. Habitat Int. 2020, 100, 102182. [Google Scholar] [CrossRef]
  41. Long, H.; Li, M.; Zhang, Y.; Qu, L. Multifunctional rural development in China: Pattern, process and mechanism. Habitat Int. 2022, 121, 102530. [Google Scholar] [CrossRef]
  42. Li, J.; Sun, R.; Xiong, M.; Yang, G. Estimation of soil erosion based on the RUSLE model in China. Acta Ecol. Sin. 2020, 40, 3473–3485. [Google Scholar] [CrossRef]
  43. Liu, Q.; Qiao, J.; Li, M.; Huang, M. Spatiotemporal heterogeneity of ecosystem service interactions and their drivers at different spatial scales in the Yellow River basin. Sci. Total Environ. 2024, 908, 168486. [Google Scholar] [CrossRef]
  44. Liu, Y.; Liu, X.; Zhao, C.; Wang, H.; Zang, F. The trade-offs and synergies of the ecological-production-living functions of grassland in the Qilian mountains by ecological priority. J. Environ. Manag. 2023, 327, 116883. [Google Scholar] [CrossRef]
  45. Fan, Y.; Jin, X.; Gan, L.; Jessup, L.; Pijanowski, B.; Lin, J.; Yang, Q.; Lyu, L. Dynamics of spatial associations among multiple land use functions and their driving mechanisms: A case study of the Yangtze River Delta region, China. Environ. Impact Assess. Rev. 2022, 97, 106858. [Google Scholar] [CrossRef]
  46. Wang, M.; Jiang, Z.; Li, T.; Yang, Y.; Jia, Z. Analysis on absolute conflict and relative conflict of land use in Xining metropolitan area under different scenarios in 2030 by PLUS and PFCI. Cities 2023, 137, 104314. [Google Scholar] [CrossRef]
  47. Peng, J.; Tian, L.; Liu, Y.; Zhao, M.; Hu, Y.; Wu, J. Ecosystem services response to urbanization in metropolitan areas: Thresholds identification. Sci. Total Environ. 2017, 607–608, 706–714. [Google Scholar] [CrossRef]
  48. Pei, S.; Zhang, C.; Liu, C.; Liu, X.; Xie, G. Forest ecological compensation standard based on spatial flowing of water services in the upper reaches of Miyun Reservoir, China. Ecosyst. Serv. 2019, 39, 100983. [Google Scholar] [CrossRef]
  49. Ouyang, Z.; Zheng, H.; Xiao, Y.; Polasky, S.; Xu, W.; Wang, Q.; Zhang, L.; Xiao, Y.; Ran, E.; Jiang, L.; et al. Improvements in ecosystem services from investments in natural capital. Science 2016, 352, 1455–1459. [Google Scholar] [CrossRef] [PubMed]
  50. Zhao, X.; Li, J.; Ruan, F.; Zou, Z.; He, X.; Zhou, C. Spatiotemporal Dynamics and Multi-Scenario Projections of the Land Use and Habitat Quality in the Yellow River Basin: A GeoDetector-PLUS-InVEST Integrated Framework for a Coupled Human-Natural System Analysis. Remote Sens. 2025, 17, 2181. [Google Scholar] [CrossRef]
  51. Cliff, A.; Ord, J. Spatial Processes, Models and Applications; Pion: London, UK, 1981. [Google Scholar]
  52. Lin, S.; Wu, R.; Yang, F.; Wang, J.; Wu, W. Spatial trade-offs and synergies among ecosystem services within a global biodiversity hotspot. Ecol. Indic. 2018, 84, 371–381. [Google Scholar] [CrossRef]
  53. Brunsdon, C.; Fotheringham, S.; Charlton, M. Geographically weighted regression. J. R. Stat. Soc. Ser. D Stat. 1998, 47, 431–443. [Google Scholar] [CrossRef]
  54. He, X.; Zhou, Y.; Yuan, Y. Exploring the relationship between urban polycentricity and consumer amenity development: An empirical study using Dianping Data in China. Cities 2025, 166, 106197. [Google Scholar] [CrossRef]
  55. Li, S.; Zhu, C.; Lin, Y.; Dong, B.; Chen, B.; Si, B.; Li, Y.; Deng, X.; Gan, M.; Zhang, J.; et al. Conflicts between agricultural and ecological functions and their driving mechanisms in agroforestry ecotone areas from the perspective of land use functions. J. Clean. Prod. 2021, 317, 128453. [Google Scholar] [CrossRef]
  56. He, X.; Zhang, R.; Yuan, X.; Cao, Y.; Zhou, C. The role of planning policy in the evolution of the spatial structure of the Guangzhou metropolitan area in China. Cities 2023, 137, 104284. [Google Scholar] [CrossRef]
  57. Anselin, L.; Syabri, I.; Smirnov, O. Visualizing Multivariate Spatial Correlation with Dynamically Linked Windows; University of California Santa Barbara Cd Rom: Santa Barbara, CA, USA, 2002. [Google Scholar]
  58. Guo, C.; Gao, S.; Zhou, B.; Gao, J. Effects of land use change on ecosystem service value in Funiu Mountain based upon a grid square. Acta Ecol. Sin. 2019, 39, 3482–3493. [Google Scholar] [CrossRef]
  59. Li, L.; Zhou, X.; Yang, L.; Duan, J.; Zeng, Z. Spatio-Temporal Characteristics and Influencing Factors of Ecological Risk in China’s North–South Transition Zone. Sustainability 2022, 14, 5464. [Google Scholar] [CrossRef]
  60. Körner, C. The use of ‘altitude’ in ecological research. Trends Ecol. Evol. 2007, 22, 569–574. [Google Scholar] [CrossRef] [PubMed]
  61. Berry, B.; Baskin, C.; Christaller, W. Central Places in Southern Germany. Econ. Geogr. 1967, 43, 275. [Google Scholar] [CrossRef]
  62. Liu, X.; Huang, M.; Lei, W. Spatiotemporal evolution of land use in ecologically fragile areas of the loess plateau in northern Shaanxi. Chin. J. Agric. Resour. Reg. Plan. 2023, 44, 47–57. [Google Scholar]
  63. Li, S.; Yang, R.; Long, H.; Lin, Y.; Ge, Y. Rural spatial restructuring in suburbs under capital intervention: Spatial construction based on nature. Habitat Int. 2024, 150, 103112. [Google Scholar] [CrossRef]
  64. Qiao, W.; Li, C.; Dai, L.; Jia, K.; Yang, C. Progress and prospects in the study of coupling rural multifunctional evolution and land use transitions. Geogr. Res. 2024, 43, 1556–1571. [Google Scholar]
  65. Zhang, H.; Tang, Q.; He, X.; Yang, Q. Land use function changes and trade-offs/synergies across topographic gradients in the Three Gorges Reservoir Area, China. J. Clean. Prod. 2024, 469, 143233. [Google Scholar] [CrossRef]
  66. Goodchild, F. How well do we really know the world? Uncertainty in GIScience. J. Spat. Inf. Sci. 2020, 20, 97–102. [Google Scholar] [CrossRef]
  67. Zhong, C.; Chen, J.; Yi, B.; Li, H. Examining the reliable trend of global urban land use efficiency from 1985 to 2020 using robust indicators and analysis tools. Habitat Int. 2025, 163, 103477. [Google Scholar] [CrossRef]
  68. Liu, Y.; Wang, K.; Xing, X.; Guo, H.; Zhang, W.; Luo, Q.; Gao, S.; Huang, Z.; Li, H.; Li, X.; et al. On spatial effects in geographical analysis. Acta Geogr. Sin. 2023, 78, 517–531. [Google Scholar]
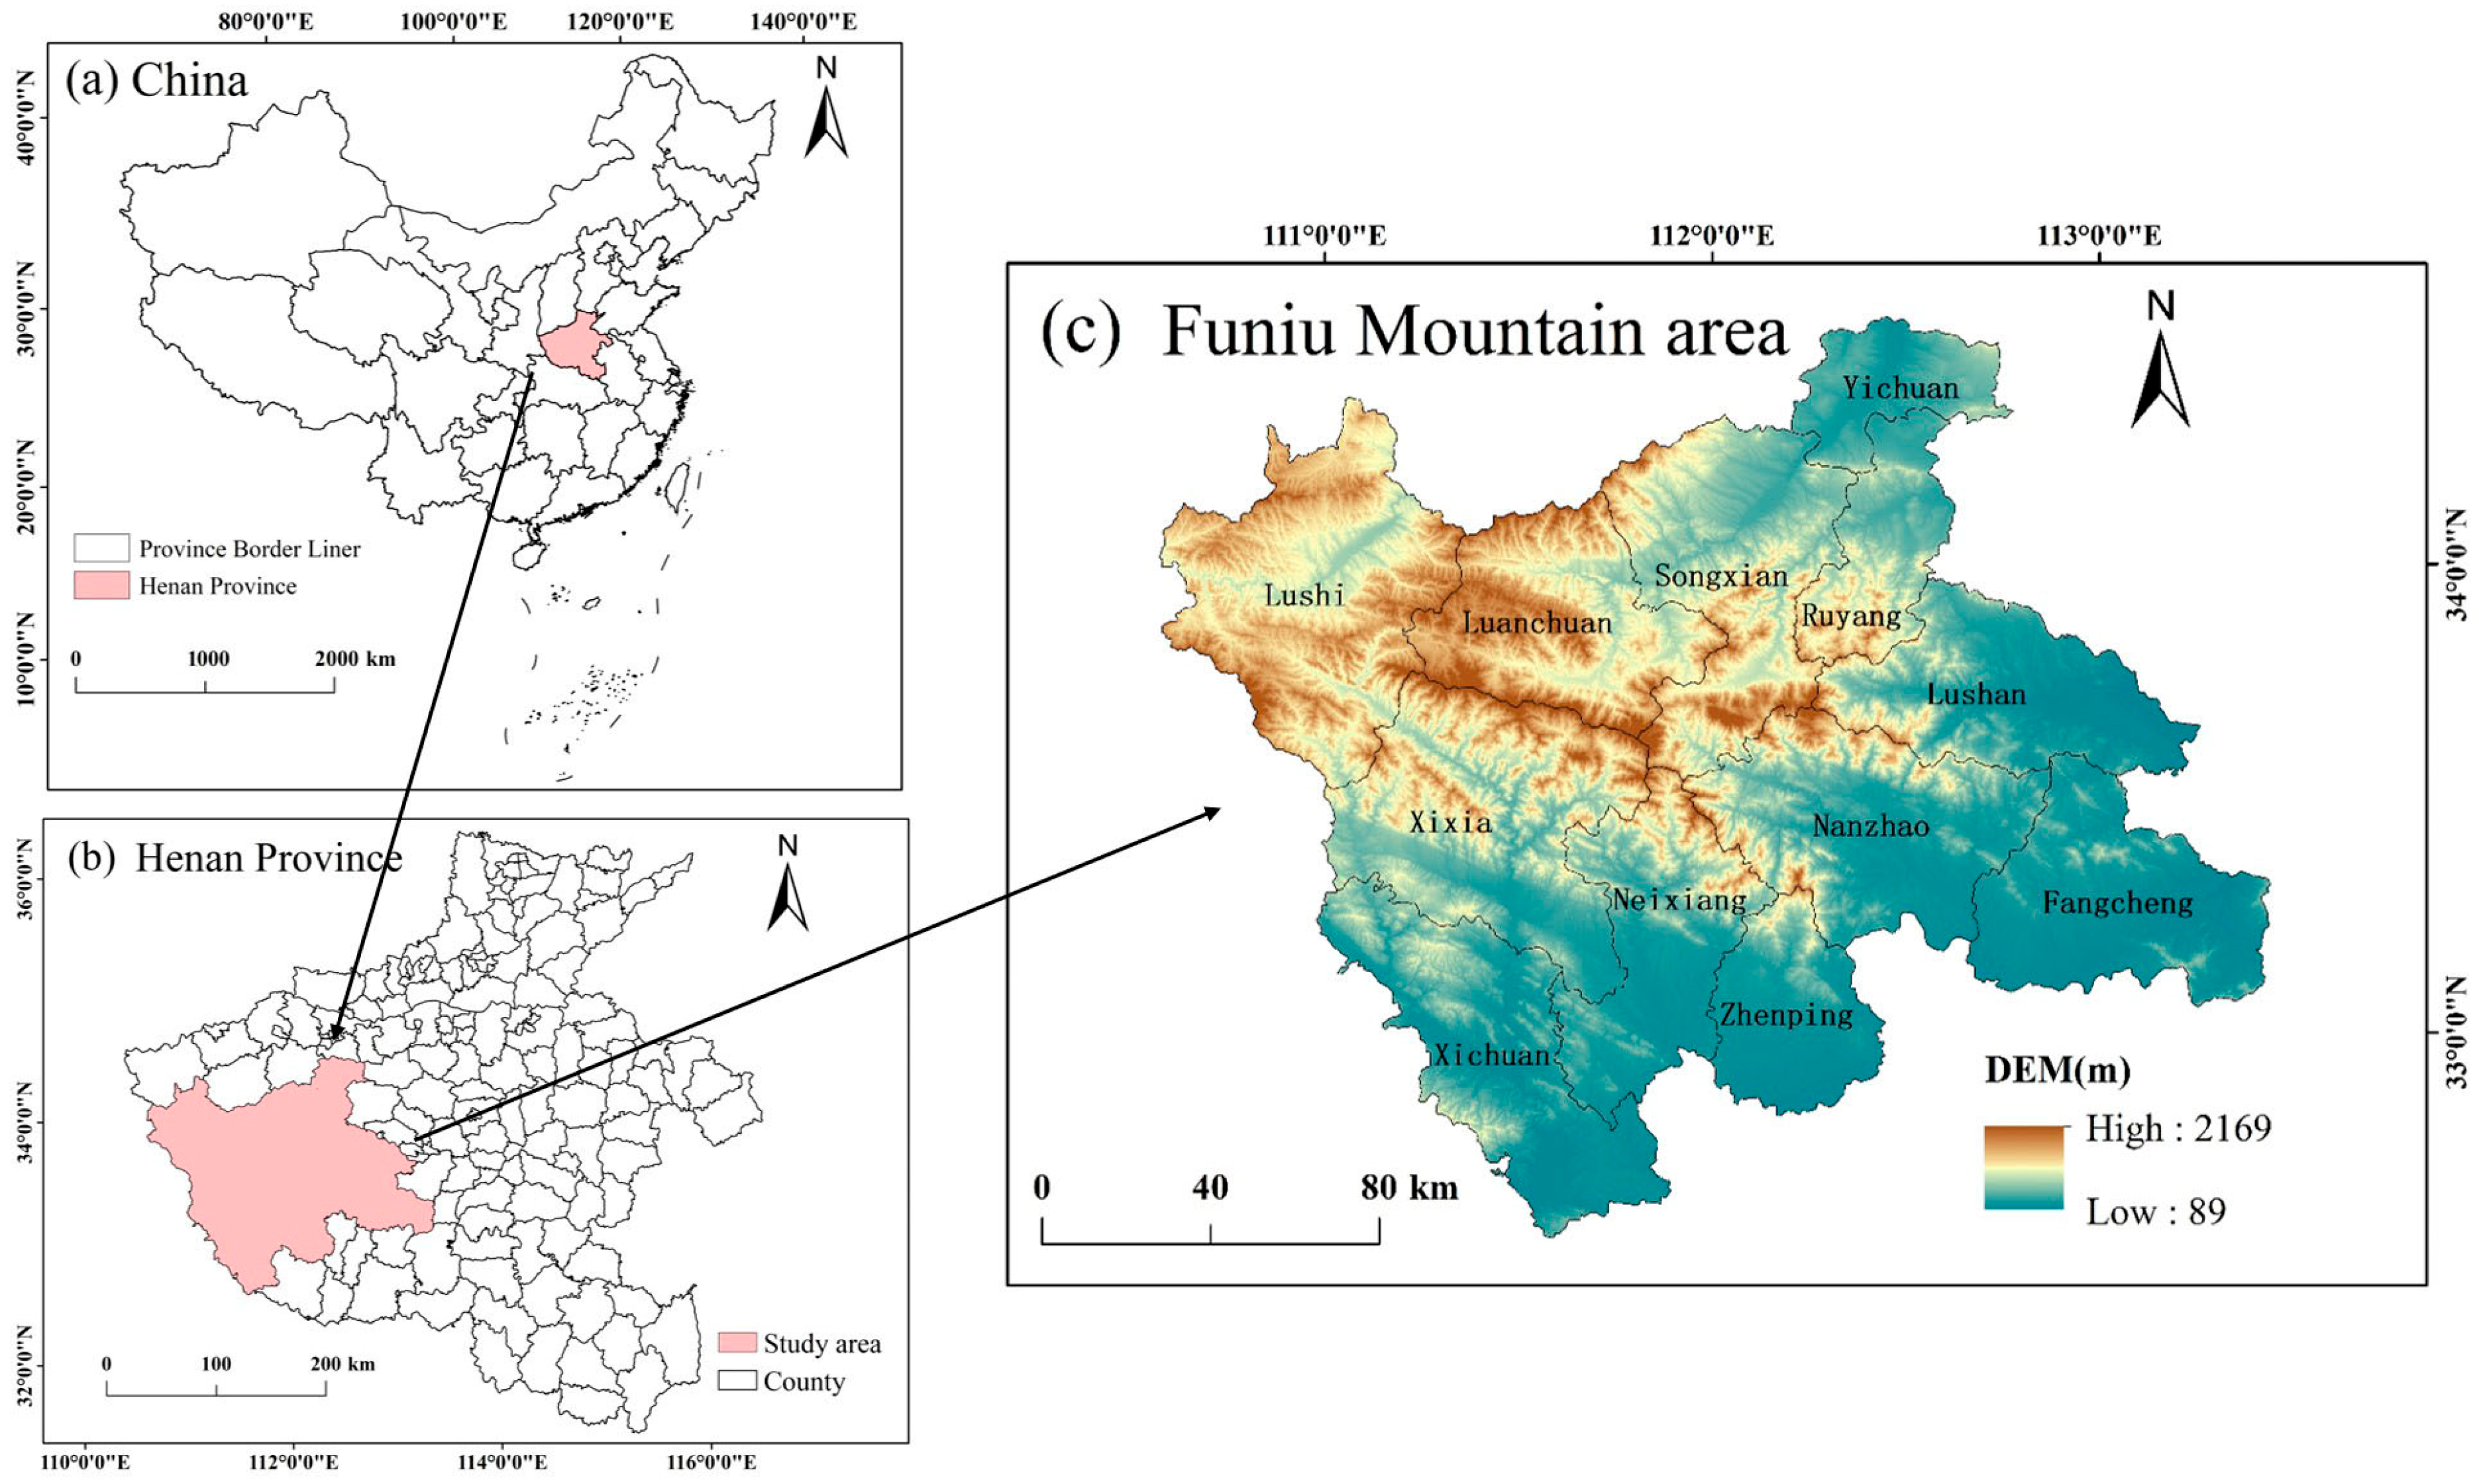
Figure 1. Location map of the study area.
Land 14 01812 g001
Figure 2. Research framework diagram.
Land 14 01812 g002
Figure 3. Temporal variation in LUFs in the Funiu Mountain area from 2000 to 2020.
Land 14 01812 g003
Figure 4. Spatio-temporal patterns and changes in PF from 2000 to 2020.
Land 14 01812 g004
Figure 5. Spatio-temporal patterns and changes in LF from 2000 to 2020.
Land 14 01812 g005
Figure 6. Spatio-temporal patterns and changes in EF from 2000 to 2020.
Land 14 01812 g006
Figure 7. Correlation of LUFs in the Funiu Mountain area from 2000 to 2020.
Land 14 01812 g007
Figure 8. Spatial non-stationarity of TOSs among different LUF changes in 2000–2020.
Land 14 01812 g008
Table 1. Data sources.
DataSourceNote
Land use dataThe 30 m annual land cover datasets and their dynamics in China from 1990 to 2021 [Data set] (https://zenodo.org/records/5816591) (accessed on 3 September 2025)Raster; 30 m × 30 m
Digital elevation model (DEM)Geographic Spatial Data Cloud (http://www.gscloud.cn) (accessed on 3 September 2025)Raster; 30 m × 30 m
Soil dataWorld Soil Information (https://data.isric.org) (accessed on 3 September 2025)Raster; 1 km × 1 km
PrecipitationChina Meteorological Data Website (https://data.cma.cn/site) (accessed on 3 September 2025)Station
Evapotranspiration, TemperatureNational Tibetan Plateau/Third Pole Environment Data Center (https://data.tpdc.ac.cn) (accessed on 3 September 2025)Raster; 1 km × 1 km
Road dataData Center for Resources and Environmental Sciences, Chinese Academy of Sciences (RESDC) (https://www.resdc.cn) (accessed on 3 September 2025)Vector (line)
Night light dataNational Earth System Science Data Sharing Platform in China (https://www.geodata.cn/) (accessed on 3 September 2025)Raster; 500 m × 500 m
PopulationWorldPop Global Project Population Data (https://www.worldpop.org/) (accessed on 3 September 2025)Raster; 100 m × 100 m
Socioeconomic statistics dataHenan Statistical Yearbook (https://tjj.henan.gov.cn/) (accessed on 3 September 2025)Statistics
Table 3. Types, spatial representation and meanings of spatial nonstationarity between LUF changes.
InterrelationshipTypeSpatial RepresentationSpecific Meaning
SynergyPositive linearHigh-high agglomeration or low-low agglomerationAn increase (decrease) in one function will cause another function to increase (decrease) proportionally.
NonlinearConvex synergyHigh-low agglomerationBoth functions increase simultaneously, but the growth of one function will slow down the growth of the other.
Concave synergyLow-high agglomerationBoth functions increase simultaneously, but the growth of one function will accelerate the growth of the other.
Trade-offNegative linearHigh-high agglomeration or low-low agglomerationAn increase (decrease) in one function will cause another function to decrease (increase) proportionally.
NonlinearConvex trade-offLow-high agglomerationOne function increases while another decreases, and the addition of one function will continuously accelerate the loss of the other.
Concave trade-offHigh-low agglomerationOne function increases while another decreases, and the increase in one function will continuously slow down the loss of the other.
Not significantNORandomAdding or reducing one function has no impact on another function.
Table 4. Global Moran’s I of PF, LF and EF in the Funiu Mountain area from 2000 to 2020.
20002005201020152020
PF0.46580.41850.42580.42200.4202
LF0.31320.54120.32630.39430.3629
EF0.86270.86950.86470.86550.8783
Disclaimer/Publisher’s Note: The statements, opinions and data contained in all publications are solely those of the individual author(s) and contributor(s) and not of MDPI and/or the editor(s). MDPI and/or the editor(s) disclaim responsibility for any injury to people or property resulting from any ideas, methods, instructions or products referred to in the content.