Village-Level Spatio-Temporal Patterns and Key Drivers of Social-Ecological Vulnerability in a Resource-Exhausted Mining City: A Case Study of Xintai, China
Abstract
1. Introduction
2. Materials and Methods
2.1. Study Area
2.2. Data Source
2.3. Framework
2.4. Study Methods
2.4.1. Establishing an Assessment Index System
2.4.2. Entropy Value Method
- Based on the normalized value , compute the proportion for each unit under index :
- Calculate the entropy ():
- Calculate the difference coefficient ():
- Normalize the divergence coefficient () to obtain the final weight ():where is the number of research units, and is the number of indicators.
2.4.3. Vulnerability Functional Model
2.4.4. Spatial Autocorrelation Analysis
2.4.5. Geographic Detector
2.4.6. Ordered Weighted Averaging (OWA)
2.4.7. Theil Index
3. Results
3.1. Spatio-Temporal Patterns of Social-Ecological Vulnerability
3.1.1. Spatio-Temporal Patterns
3.1.2. Change Trends of Social-Ecological Vulnerability
3.1.3. Spatial Aggregation of Social-Ecological Vulnerability
3.1.4. Inequality of Social-Ecological Vulnerability
3.2. Analysis of Driving Mechanisms for Rural Social-Ecological Vulnerability
3.2.1. Factor Detection
3.2.2. Interaction Detection
3.3. Scenario Simulation of Social-Ecological Vulnerability
3.3.1. Scenario Settings
3.3.2. Scenario Simulation Results Analysis
4. Discussion
4.1. Fine Assessment at the Village Level
4.2. Multiple Decision-Making Attitude Scenario Analysis
4.3. Social-Ecological Vulnerability of Resource-Based Cities
4.4. International Case Comparisons
5. Conclusions
- (1)
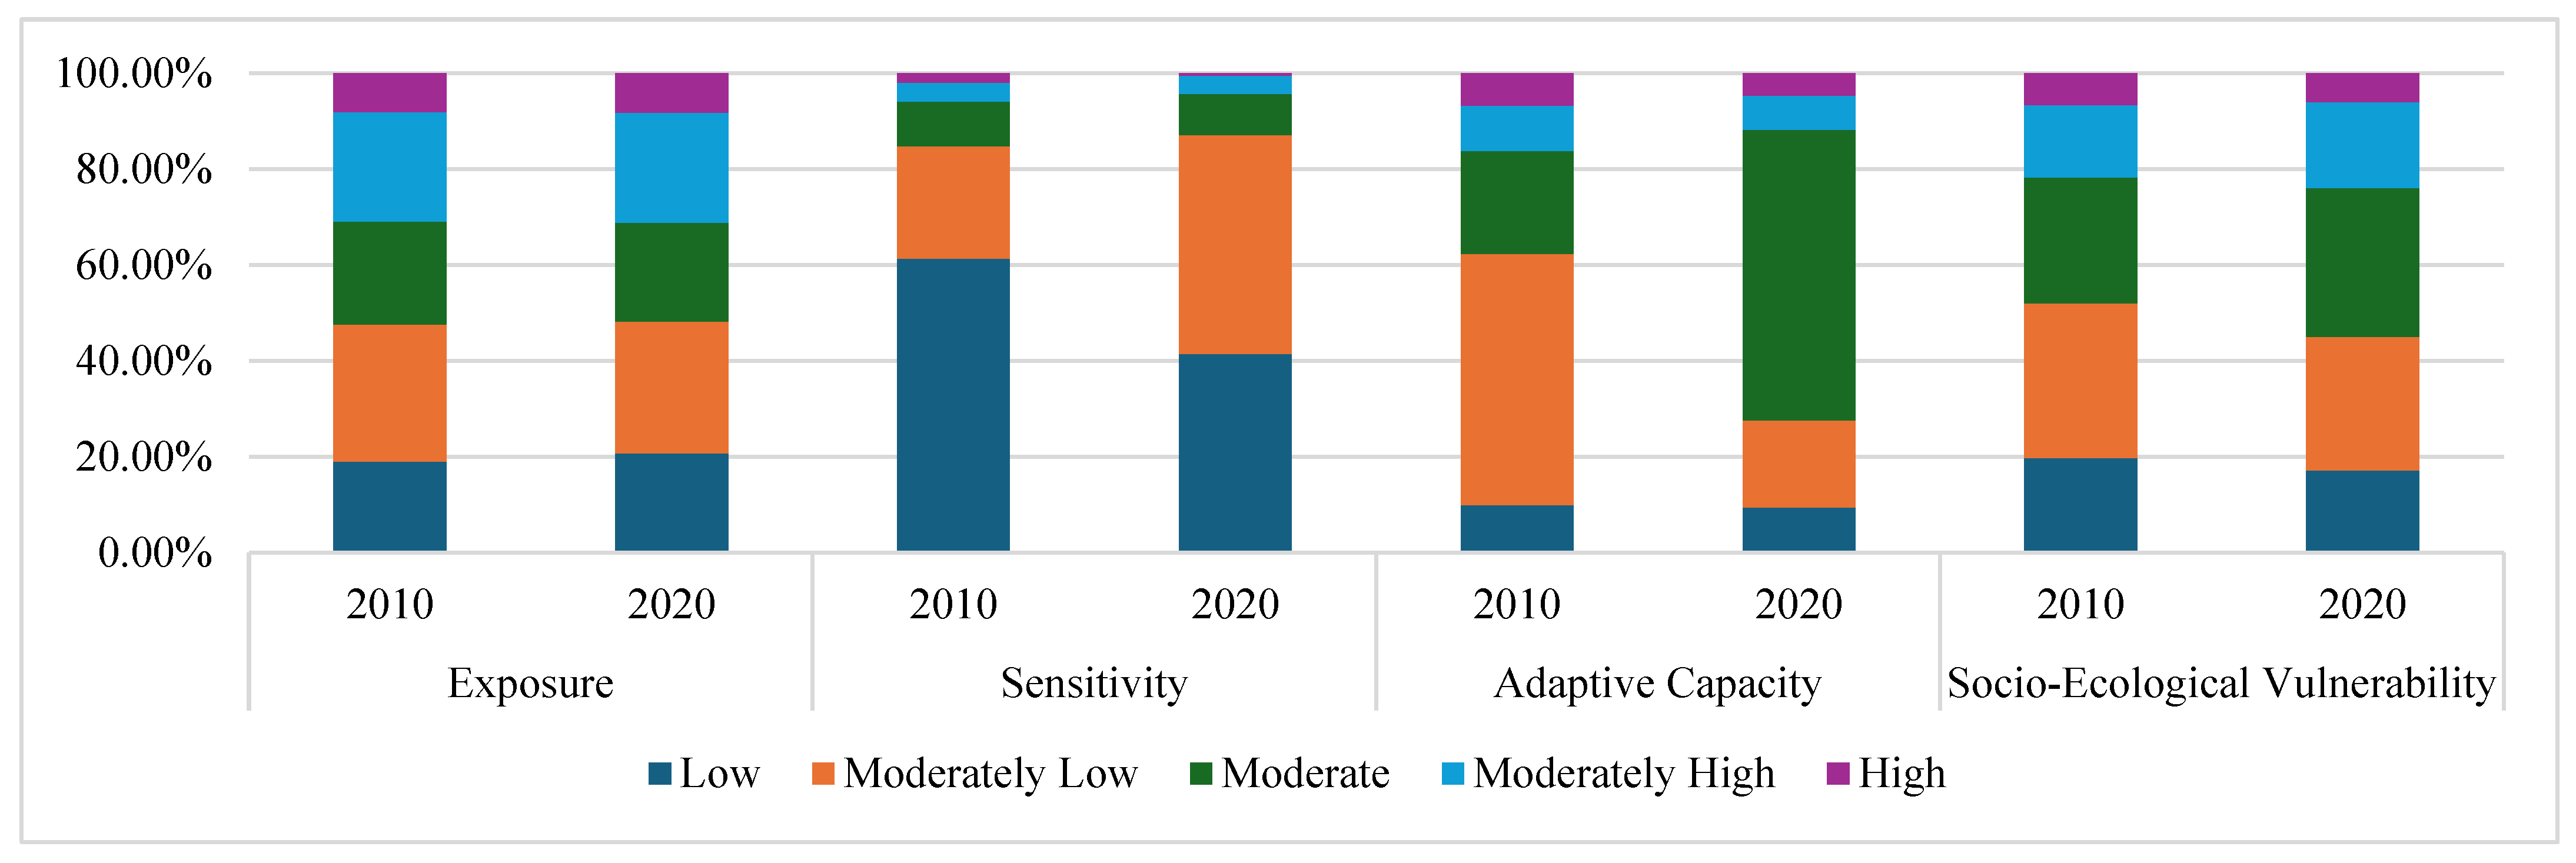
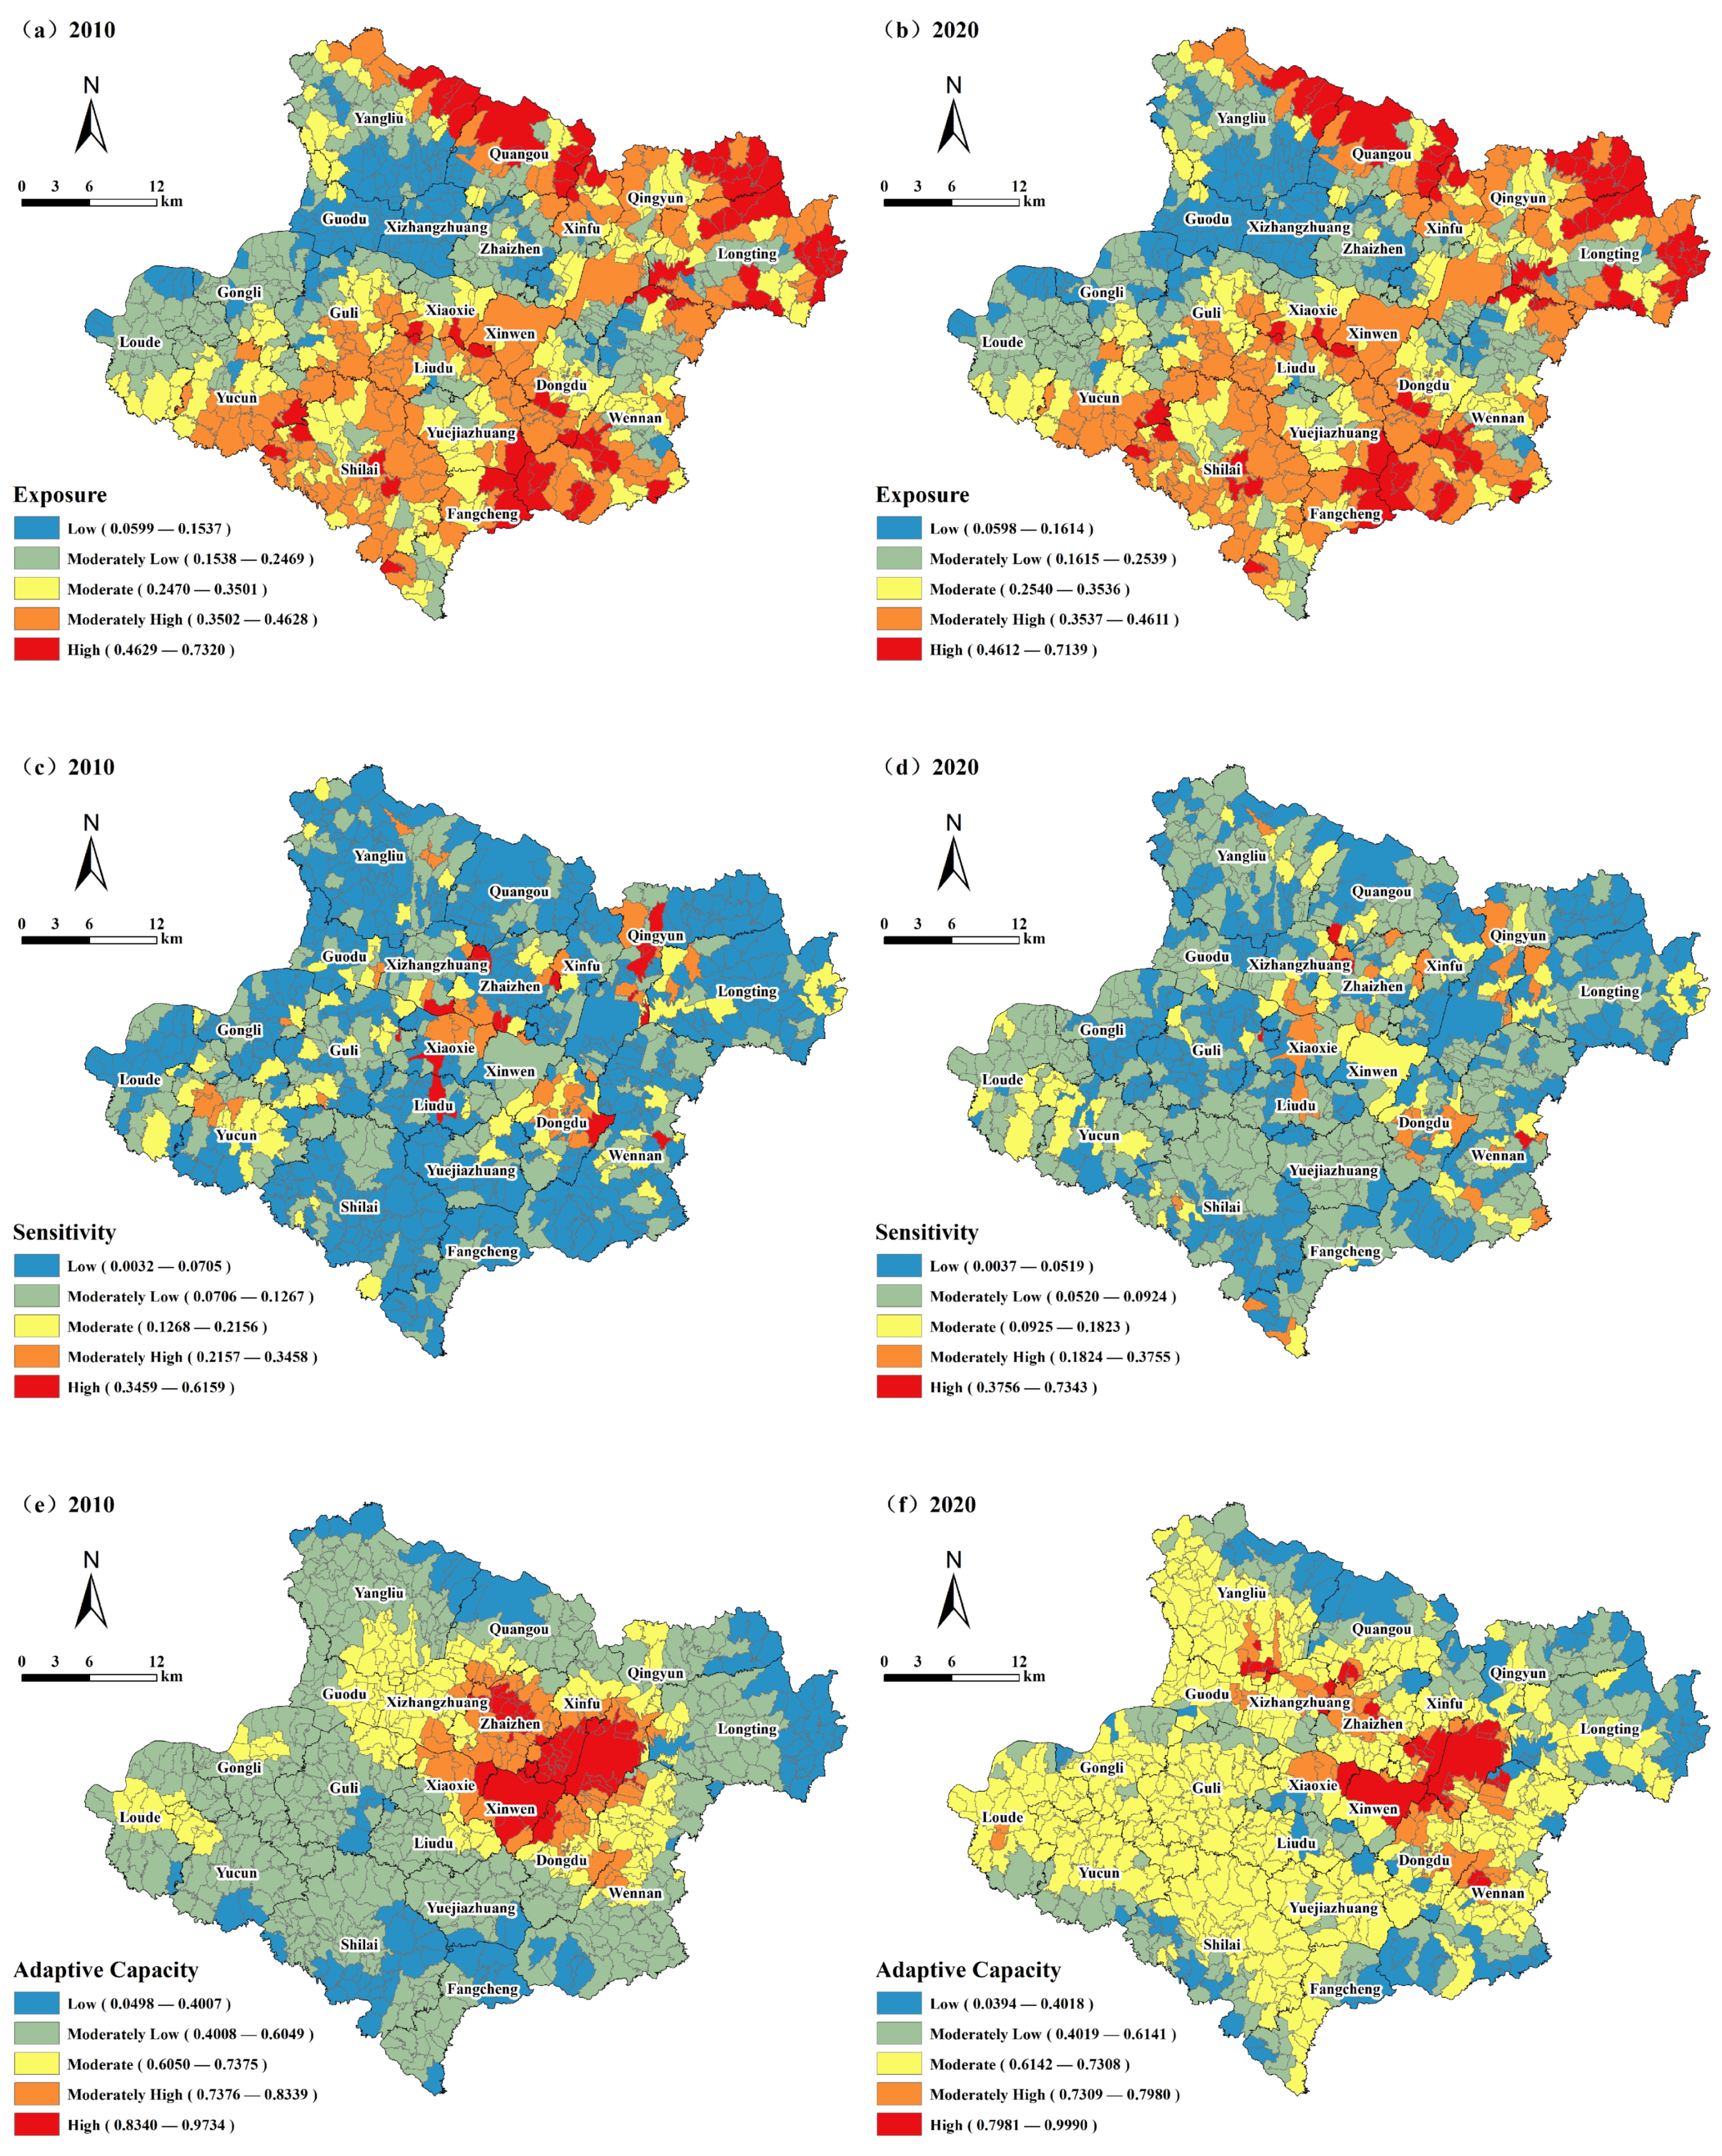
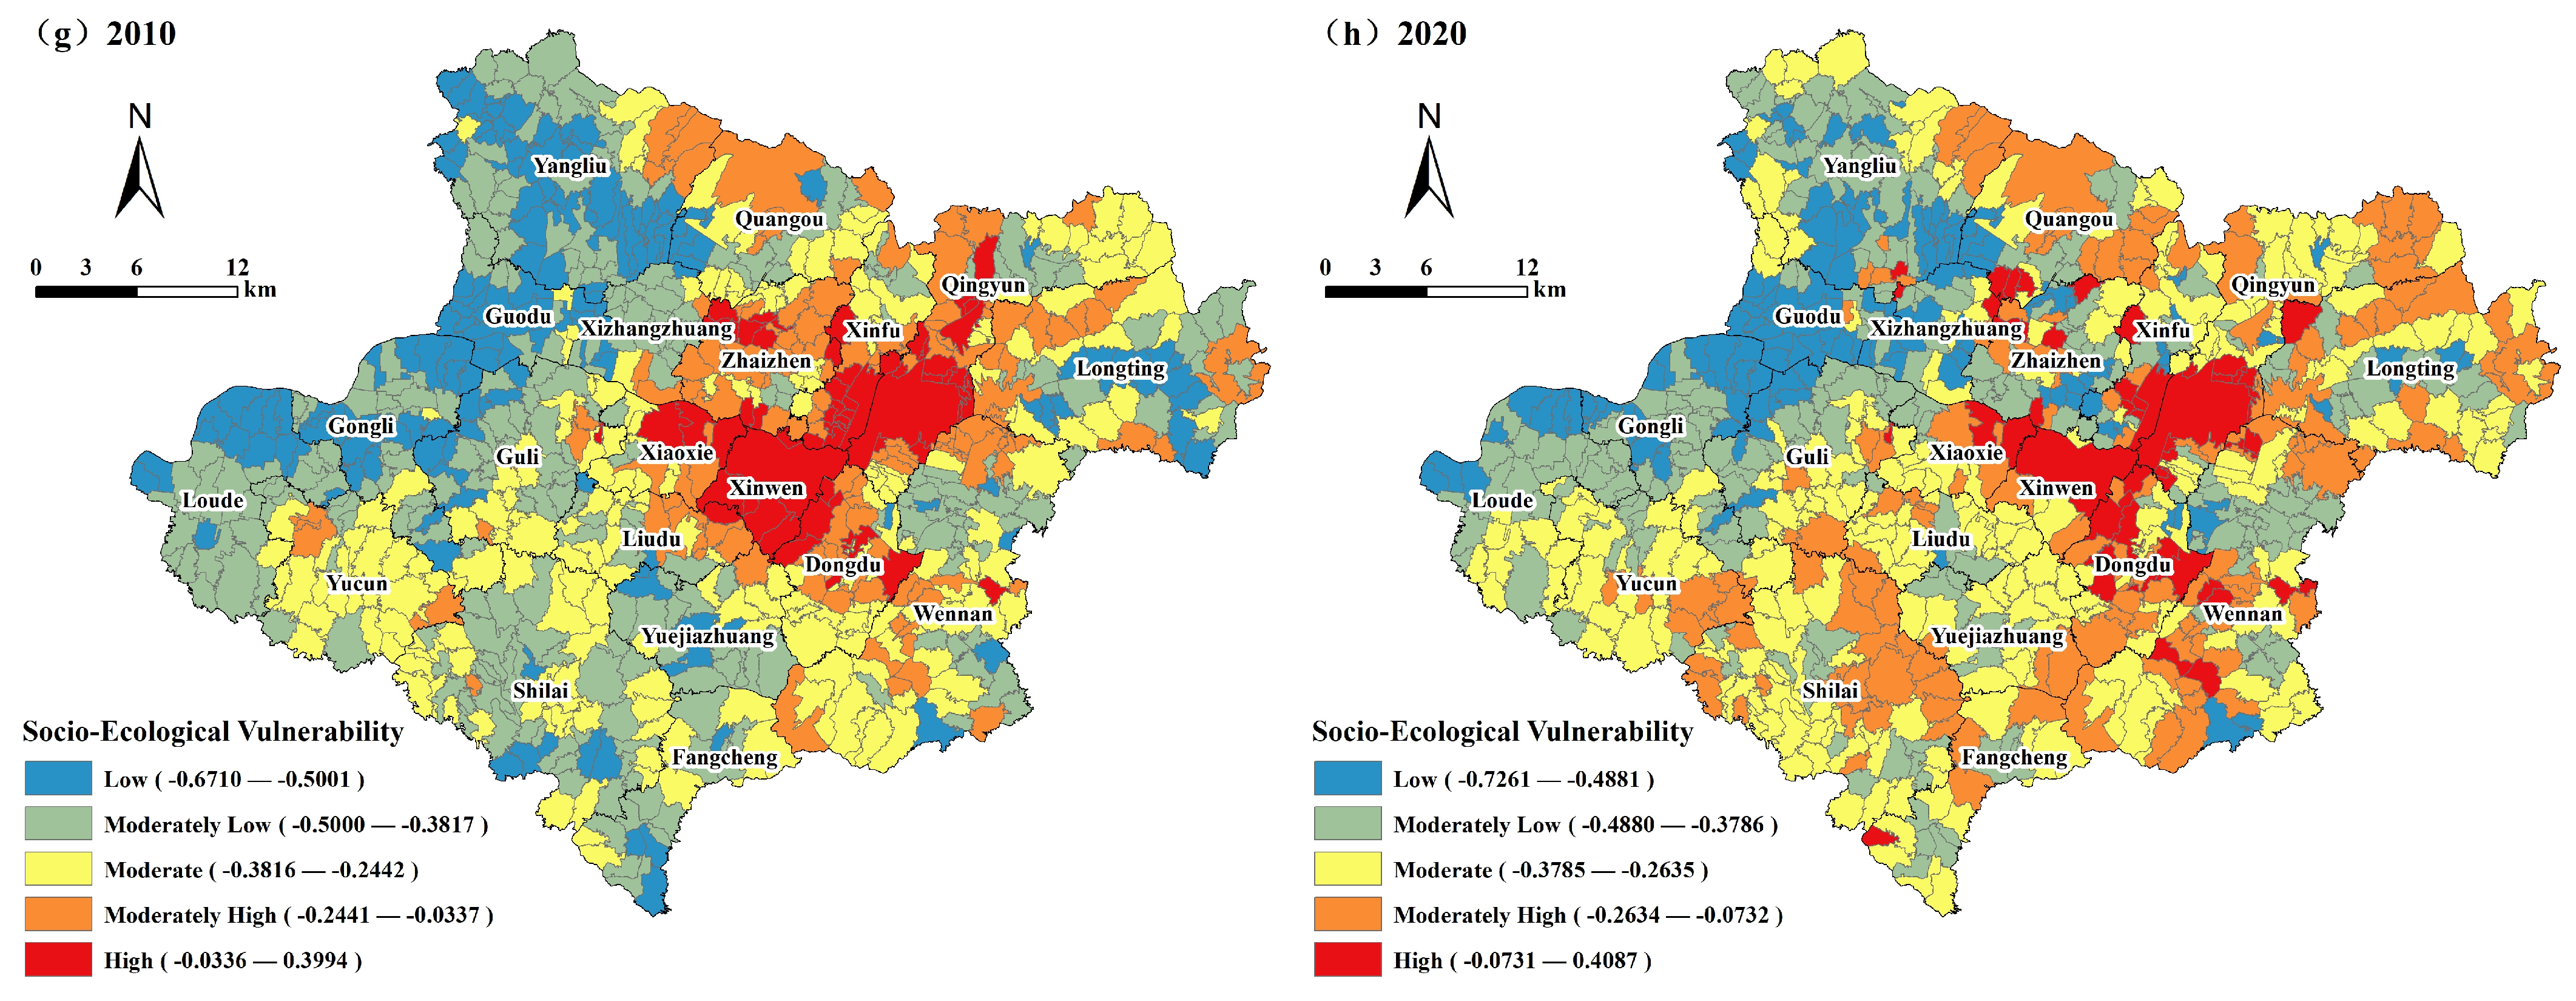
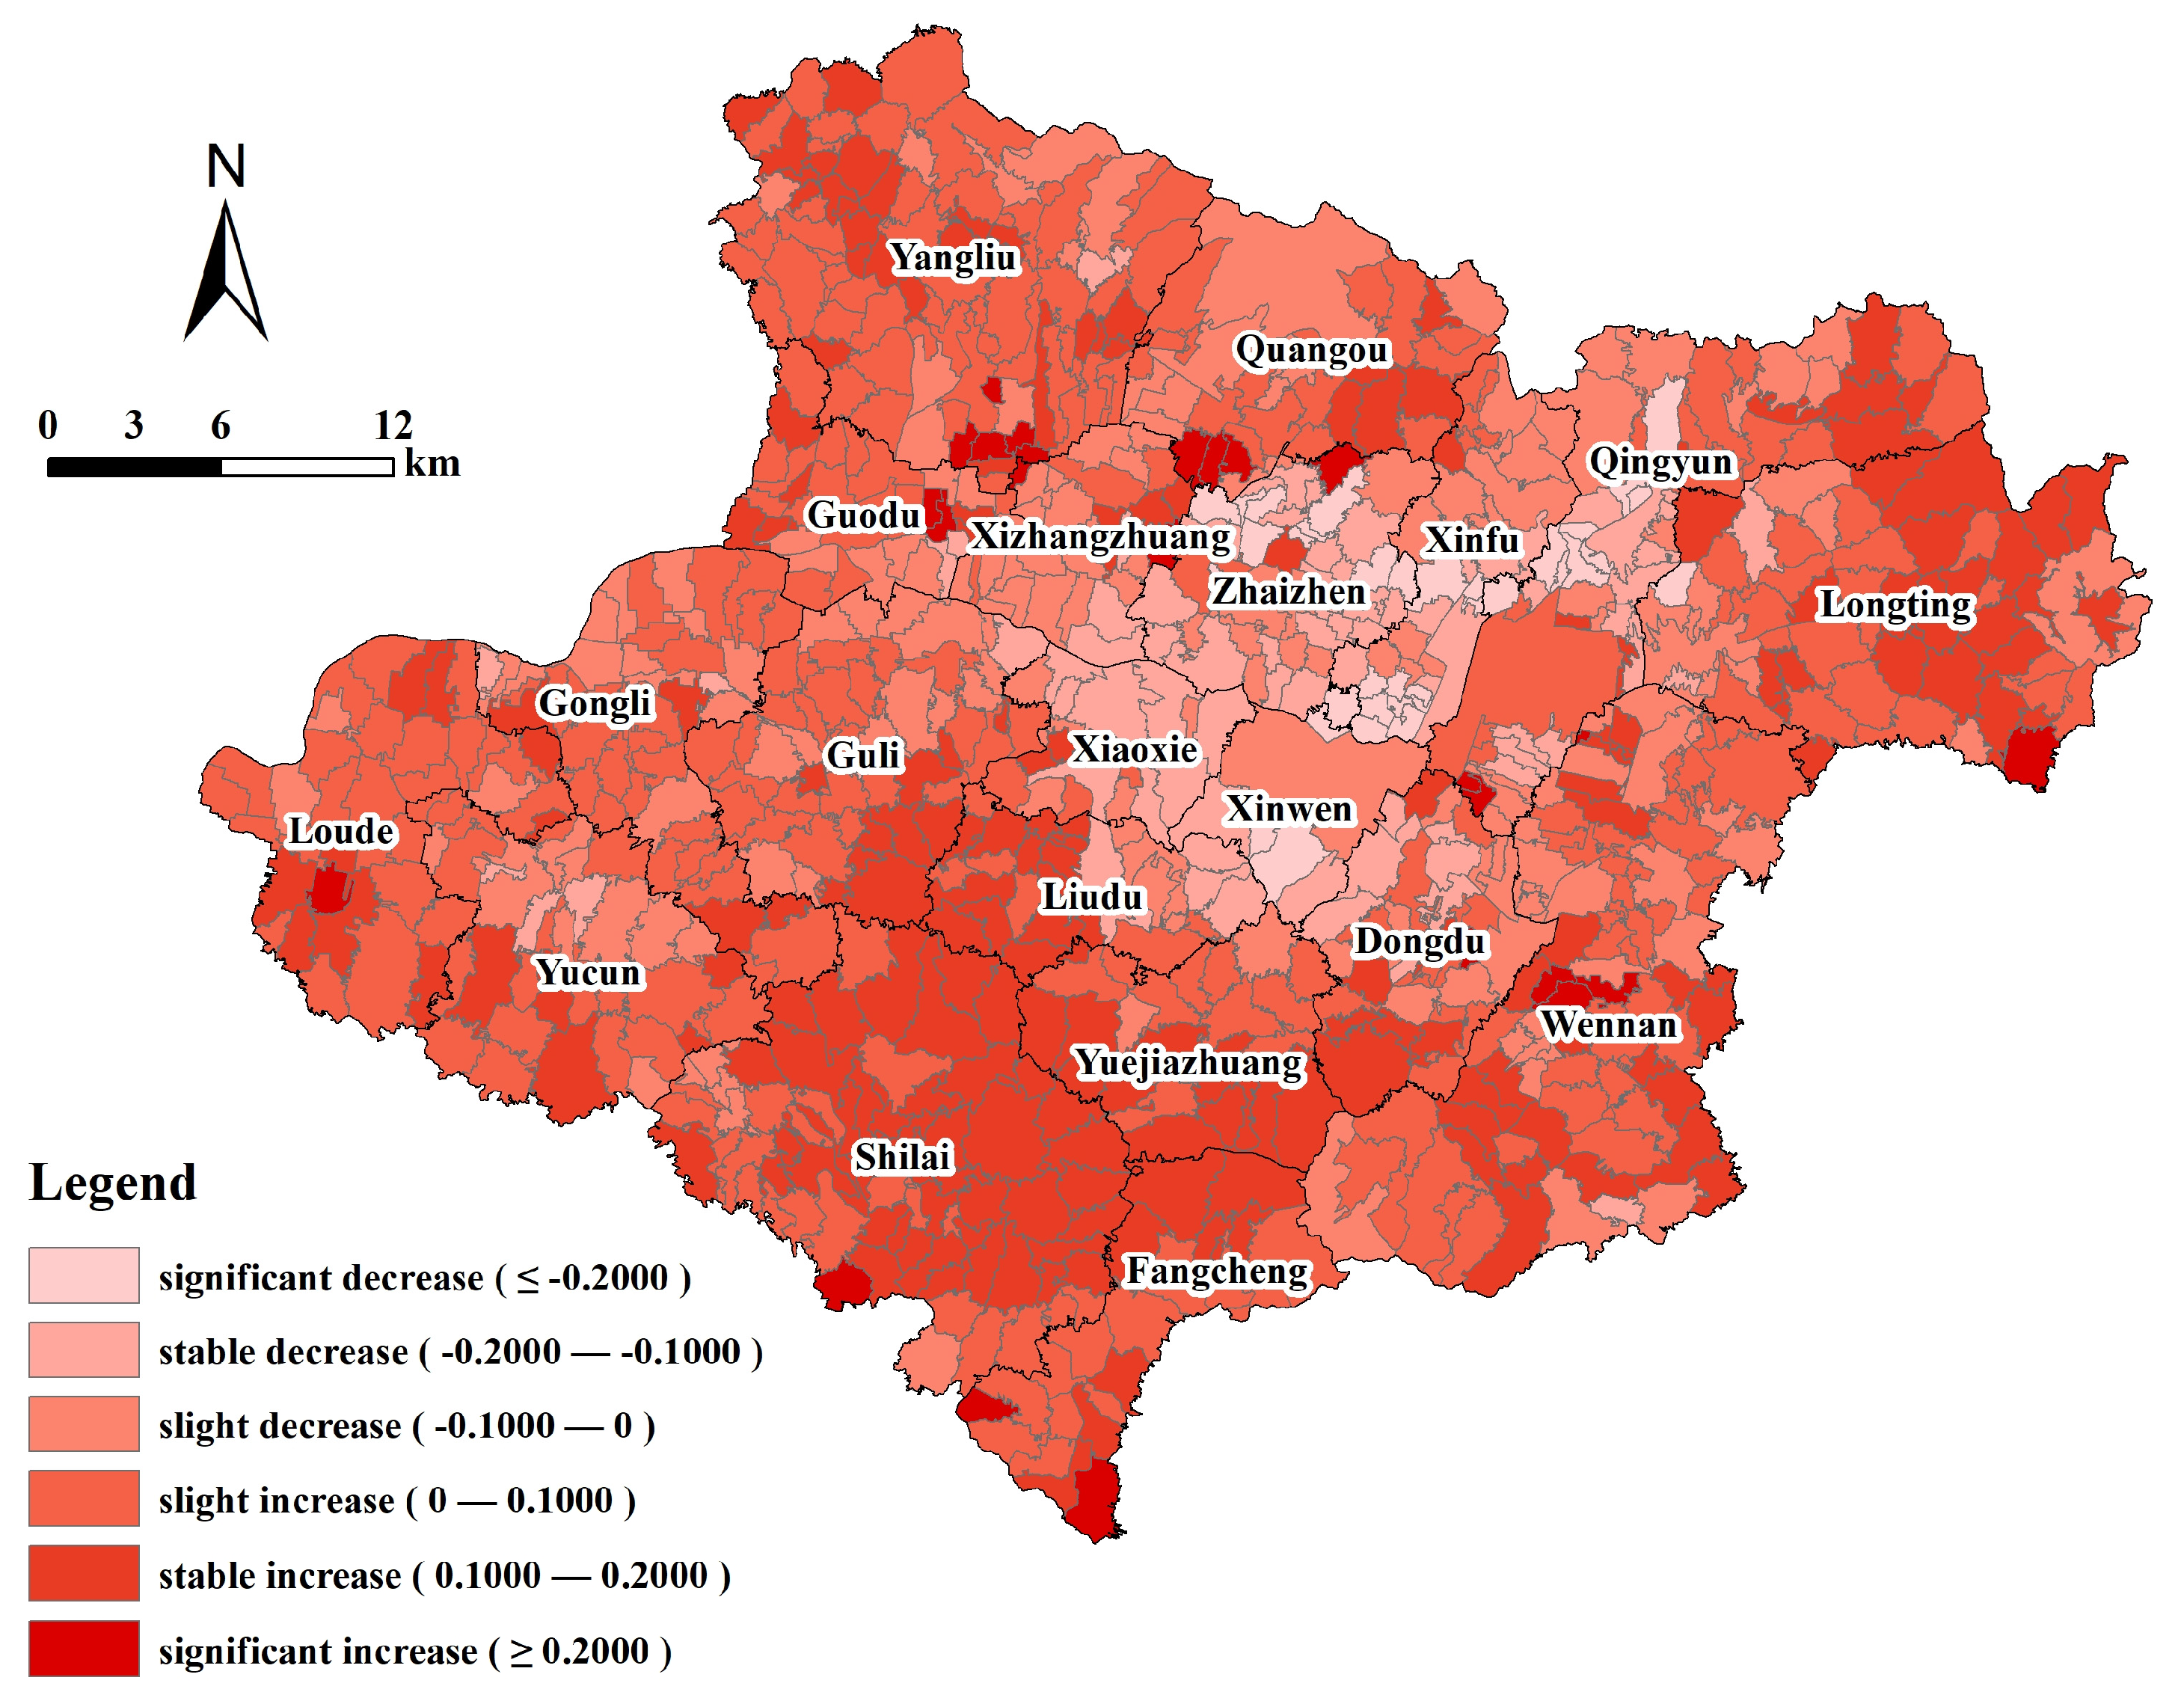
- Temporal trends in social-ecological vulnerability: By analyzing the social-ecological vulnerability index (VI) from 2010 to 2020 shows that high-vulnerability areas have decreased over the past decade, with particularly notable improvements in the urban center and former coal mining zones. Exposure changes were minor, indicating no substantial increase in external threats. Adaptability has generally improved, showcasing the positive outcomes achieved by Xintai in strengthening the resilience of its social-ecological system. This trend highlights the effectiveness of traditional industry upgrades and the development of emerging industries in reducing social-ecological vulnerability.
- (2)
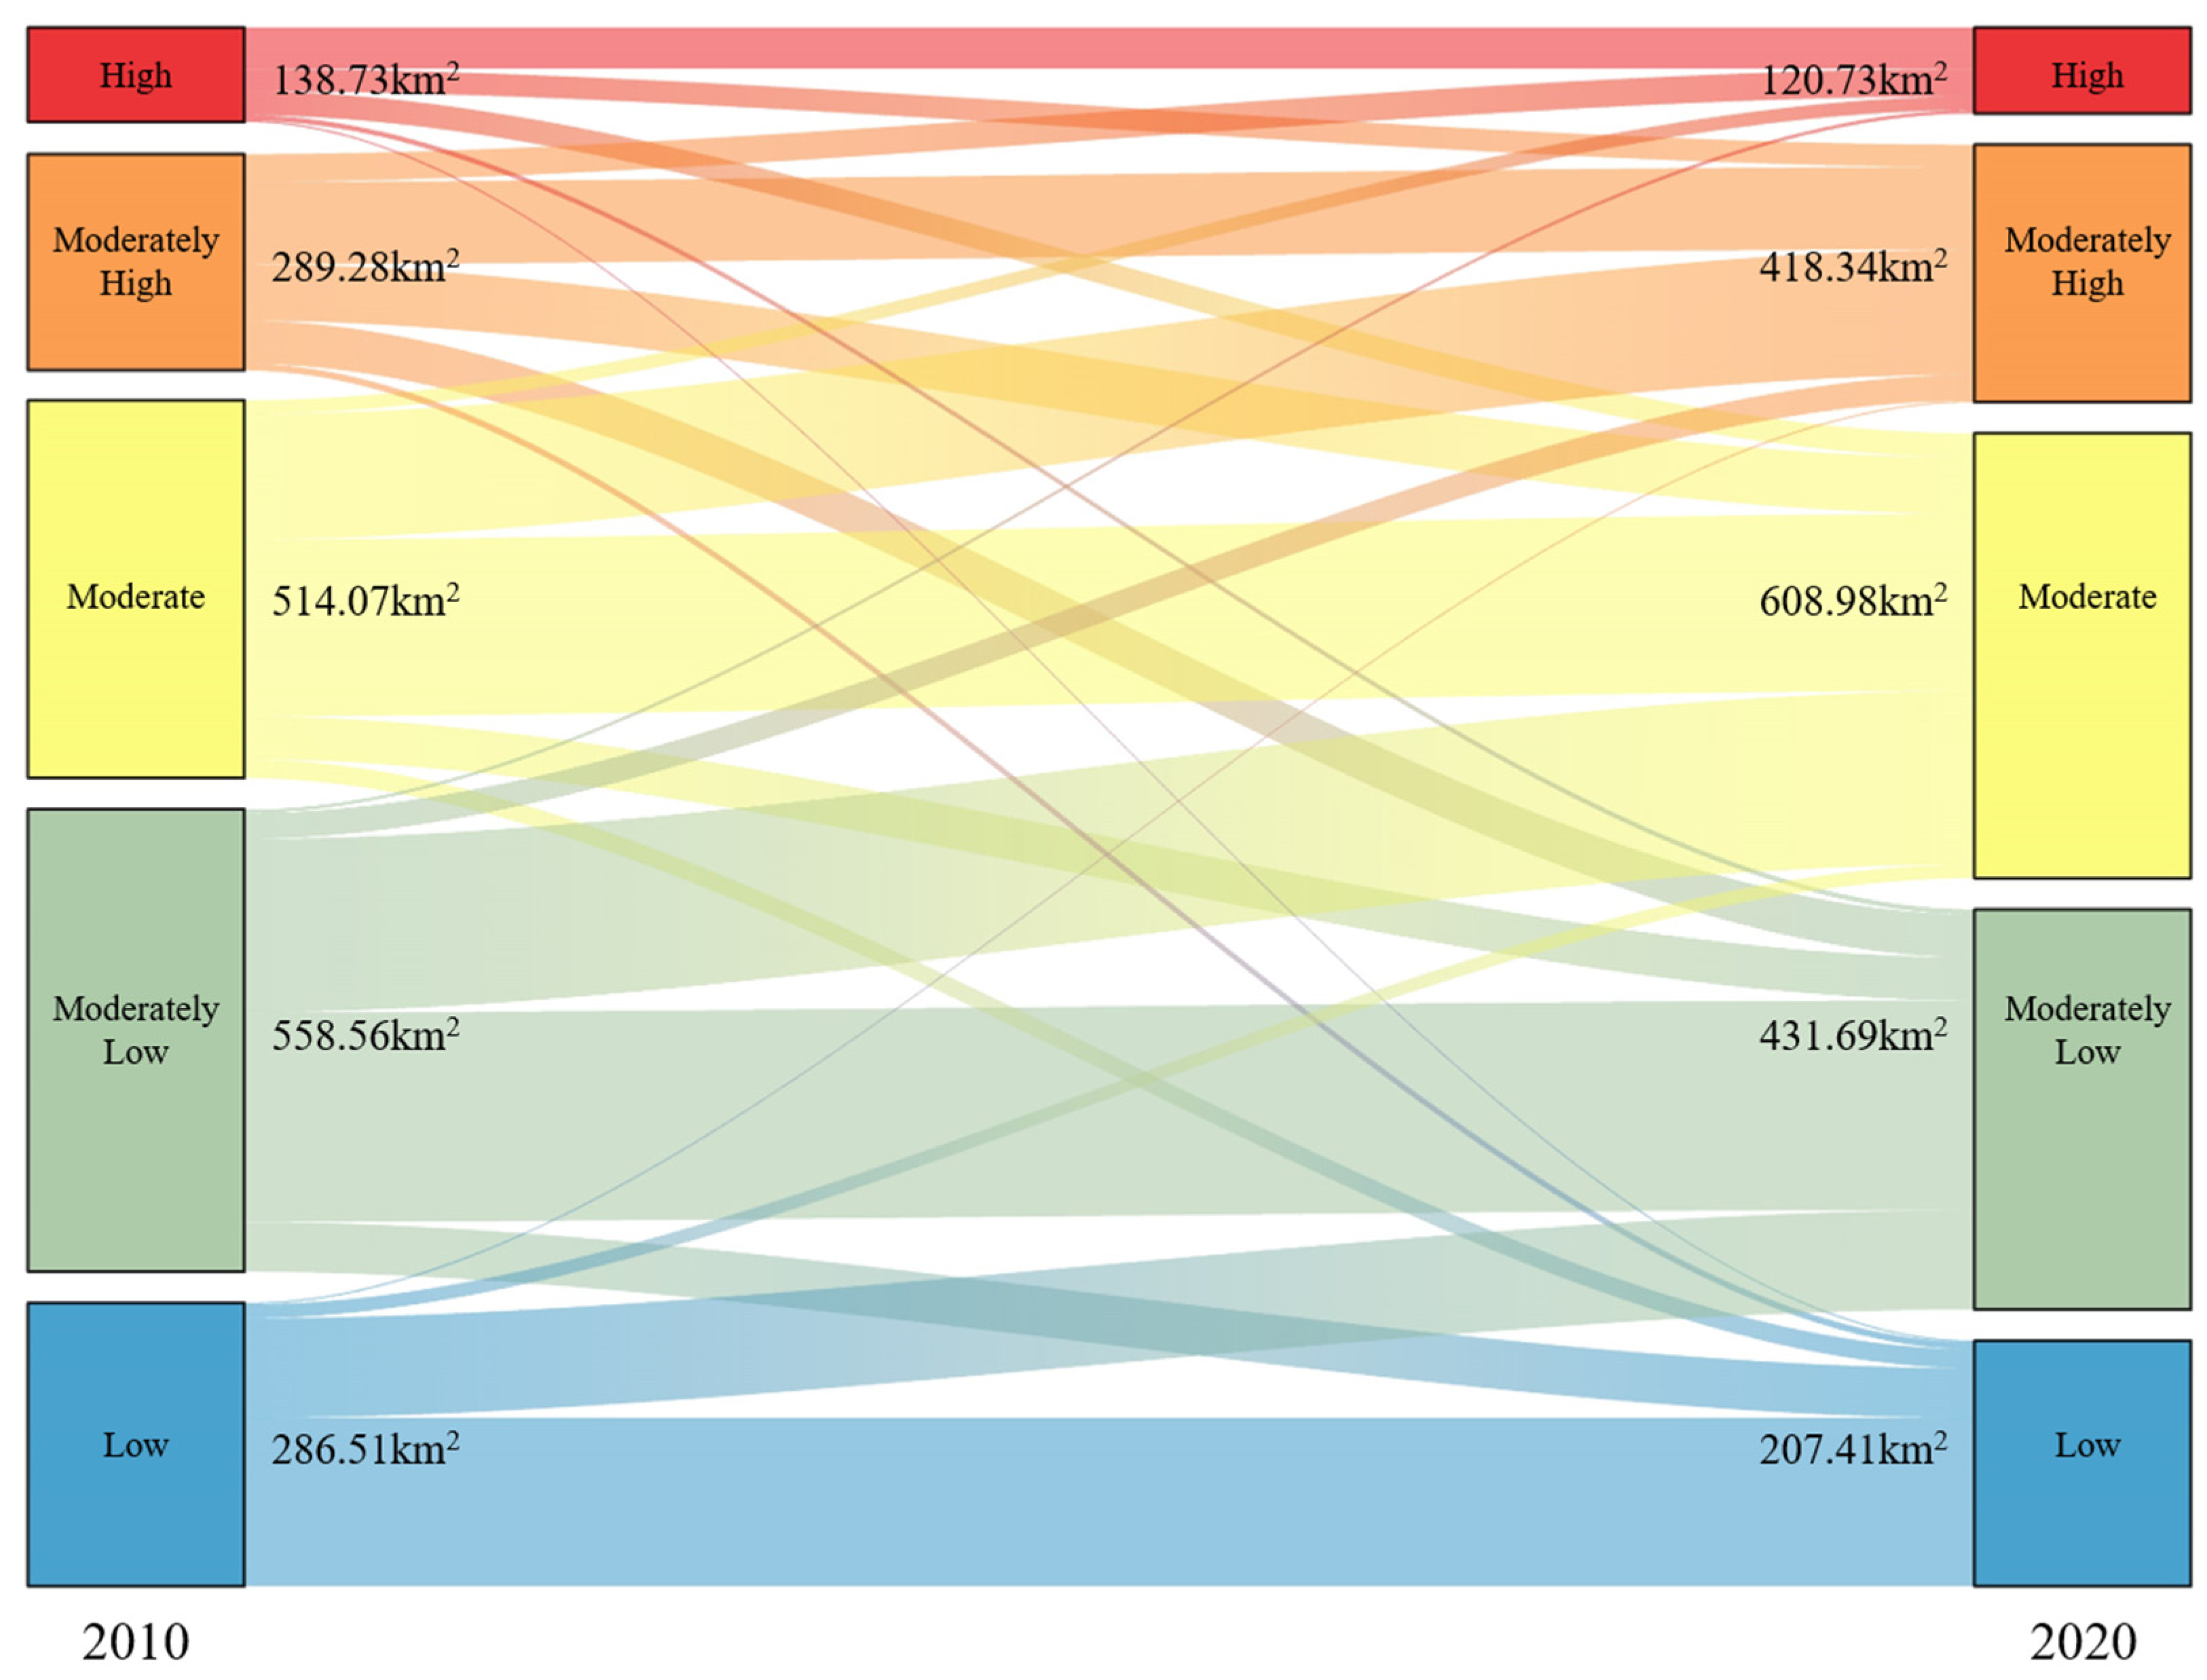
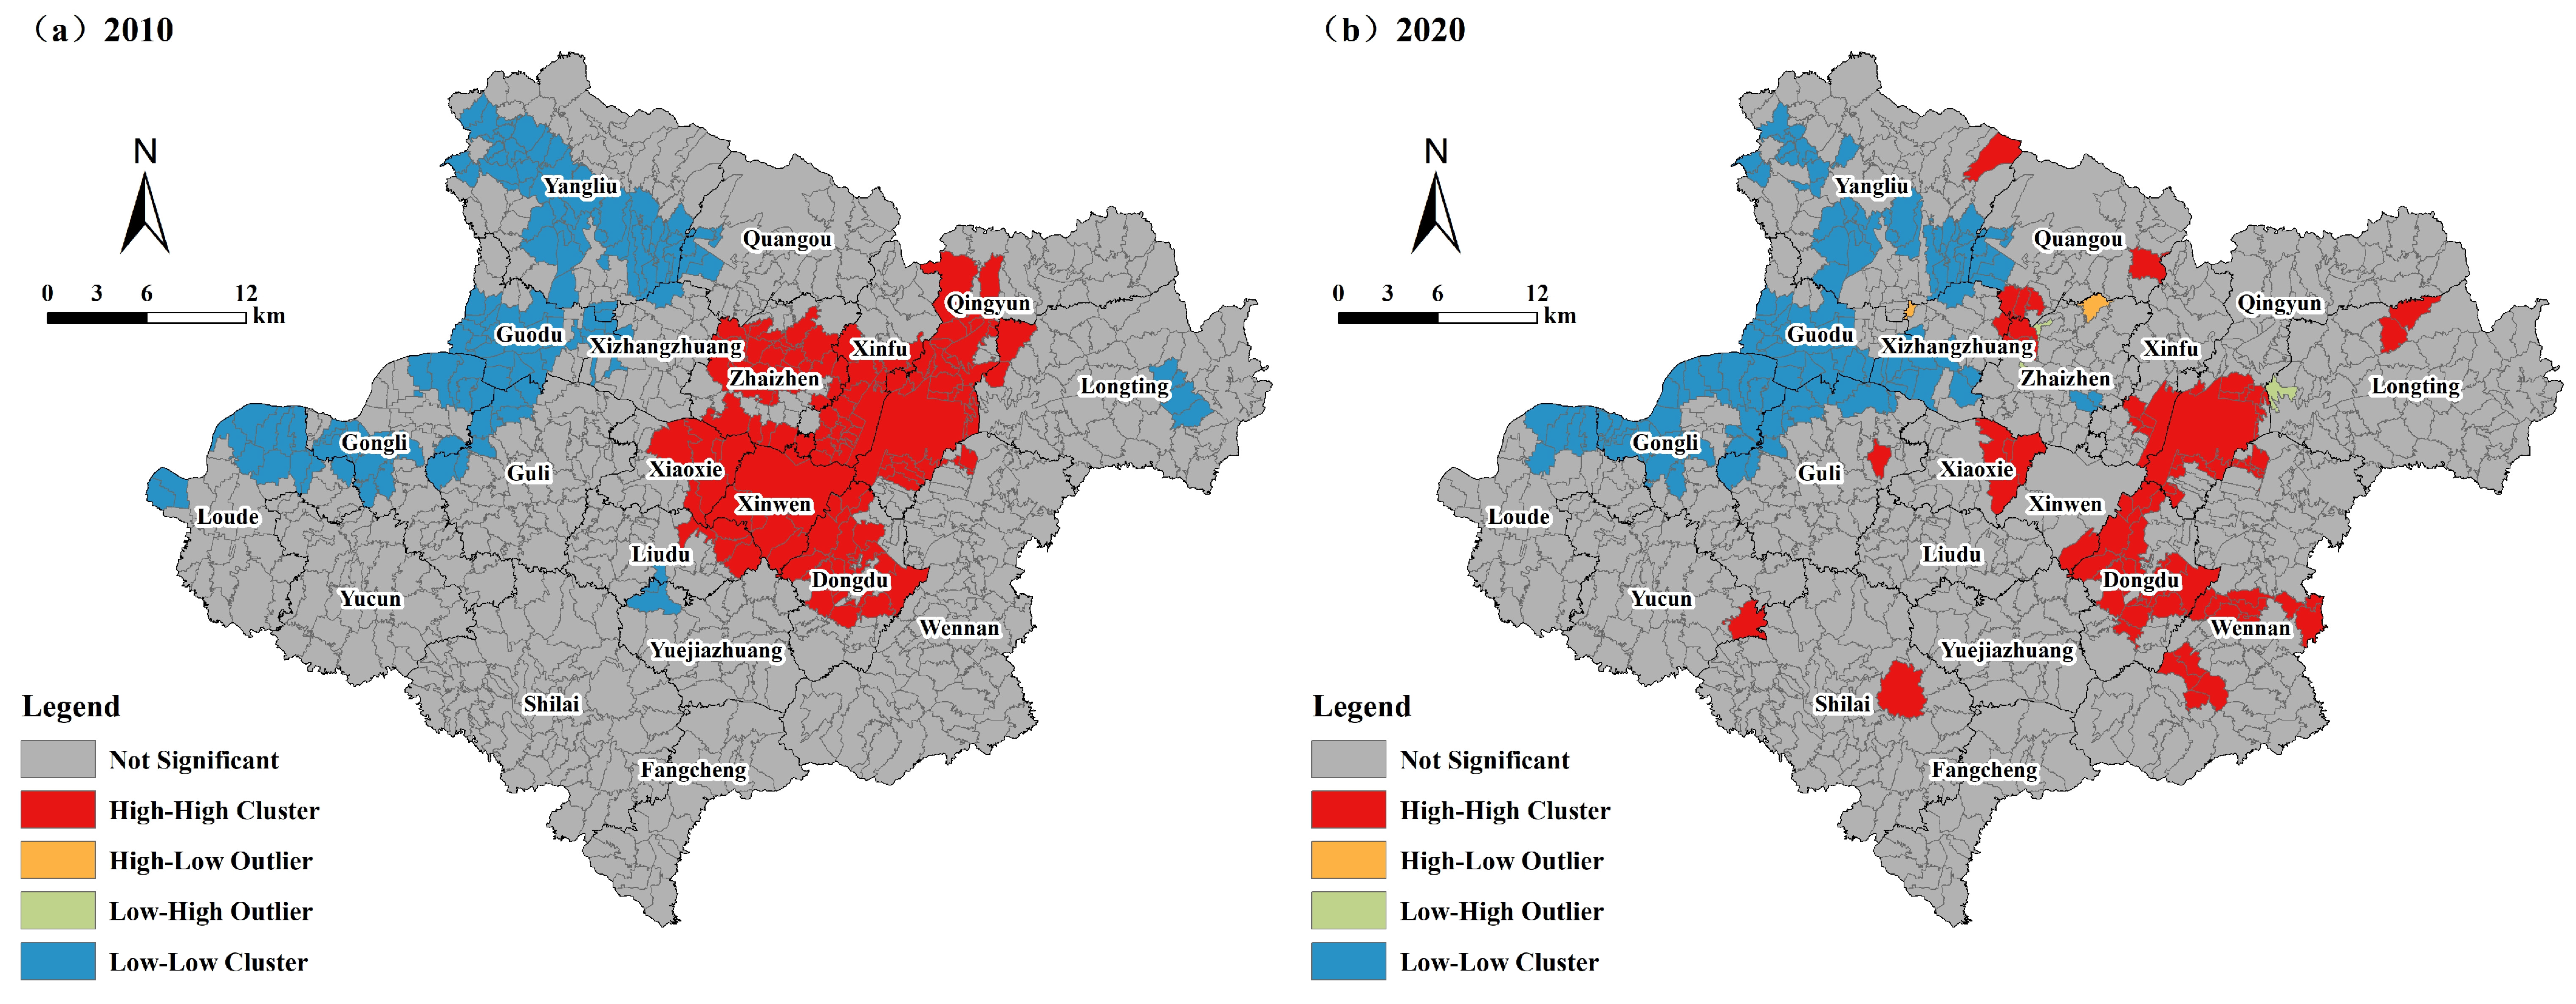
- Spatial heterogeneity of social-ecological vulnerability: From 2010 to 2020, urban center of Xintai experienced a general decline in social-ecological vulnerability, whereas peripheral regions exhibited an increase in vulnerability. This phenomenon is primarily attributed to the peripheral areas being predominantly farmland and low mountains, where recent conversions of farmland into forests and population outflows have contributed to heightened vulnerability. Over the last decade, approximately 917.41 km2 of the region underwent changes in vulnerability levels, representing 51.33% of the overall study area. Among these, 36.7% showed increased vulnerability, while 14.63% demonstrated reduced vulnerability. The global Moran’s I index declined from 0.7798 to 0.4645 between 2010 and 2020, showing a statistically significant (p < 0.01) positive spatial autocorrelation in vulnerability, but with diminishing clustering intensity. The spatial association pattern of social-ecological vulnerability is mainly manifested as high-high and low-low clusters.
- (3)
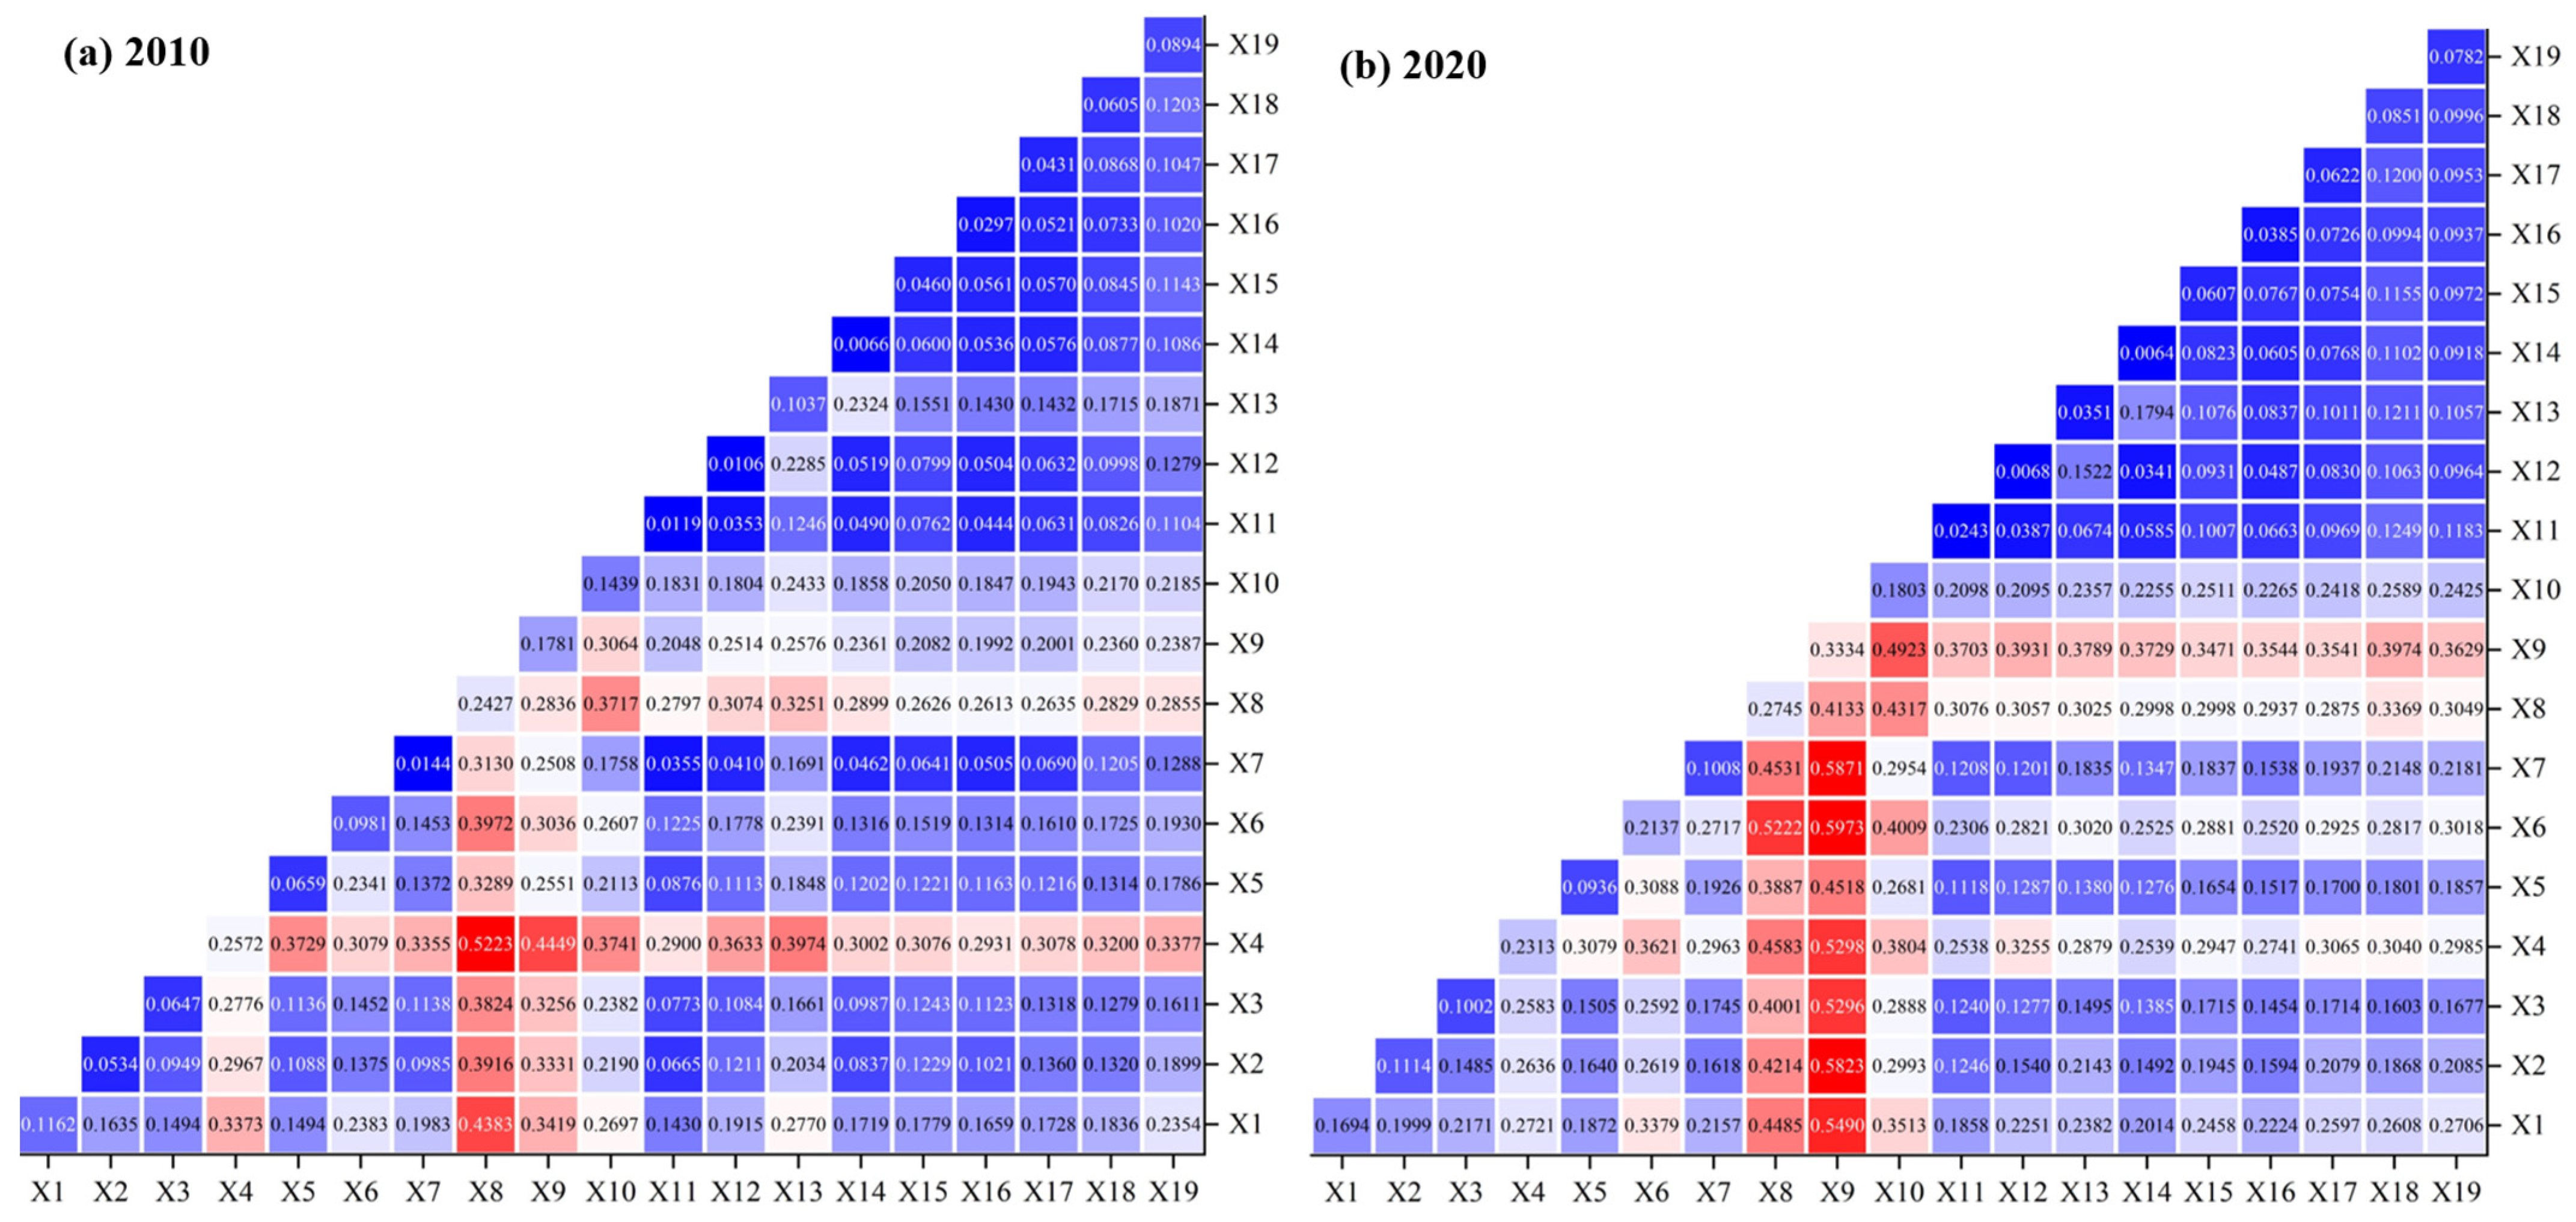
- Driving mechanisms of social-ecological vulnerability: The proportion of construction land (0.2586), population density (0.2558), annual average rainfall (0.2443), soil texture (0.2137), and the proportion of mining land (0.1621) act as key determinants contributing to spatial heterogeneity in vulnerability. Social factors contribute significantly more than natural factors. Double-factor interaction detection further reveals that the interaction between the proportion of construction land and population density with other factors is most pronounced. The combined influence of paired variables exceeds the impact of an individual driver, indicating that the spatial variation in social-ecological vulnerability in Xintai results from the interplay of multiple driving forces rather than being determined by a single factor. This underscores the combined influence of natural and human drivers on vulnerability differentiation.
- (4)
- Simulation of social-ecological vulnerability: As the decision-making risk coefficient α increases, decision-making attitudes shift from optimism to pessimism, leading to a gradual rise in social-ecological vulnerability in Xintai. In the ecological priority scenario (α = 0.8), low vulnerability dominates, followed by low-medium vulnerability, with relatively small patches of high vulnerability. In the maintain-the-status quo scenario (α = 1), medium vulnerability occupies the largest area, followed by high and low-medium vulnerability, with medium-sized patches of high vulnerability. Under the economic priority scenario (α = 1.2), high vulnerability covers the largest area. In this scenario, decision-makers prioritize economic benefits over ecological protection, emphasizing the importance of regional policies that harmonize economic and social development, and ecological preservation. Decision-makers should flexibly adjust strategies within a reasonable range based on actual conditions, goals, and regional policies, implementing tailored management measures at different development stages.
Author Contributions
Funding
Data Availability Statement
Conflicts of Interest
References
- Polsky, C.; Neff, R.; Yarnal, B. Building comparable global change vulnerability assessments: The vulnerability scoping diagram. Glob. Environ. Change 2007, 17, 472–485. [Google Scholar]
- Frazier, T.G.; Thompson, C.M.; Dezzani, R.J. A framework for the development of the SERV model: A Spatially Explicit Resilience-Vulnerability model. Appl. Geogr. 2014, 51, 158–172. [Google Scholar] [CrossRef]
- Cumming, G.S.; Cumming, D.H.; Redman, C.L. Scale mismatches in social-ecological systems: Causes, consequences, and solutions. Ecol. Soc. 2006, 11. [Google Scholar] [CrossRef]
- Walker, B.; Meyers, J.A. Thresholds in ecological and social–ecological systems: A developing database. Ecol. Soc. 2004, 9. [Google Scholar] [CrossRef]
- Bodin, Ö.; Tengö, M. Disentangling intangible social–ecological systems. Glob. Environ. Change 2012, 22, 430–439. [Google Scholar]
- Ostrom, E. A general framework for analyzing sustainability of social-ecological systems. Science 2009, 325, 419–422. [Google Scholar] [CrossRef]
- Berrouet, L.M.; Machado, J.; Villegas-Palacio, C. Vulnerability of socio—Ecological systems: A conceptual Framework. Ecol. Indic. 2018, 84, 632–647. [Google Scholar] [CrossRef]
- Afrin, R.; Sultana, R.; Alam, M.S. A Comprehensive analysis of drought vulnerability in the Barind region of Bangladesh: A socio-ecological systems approach. Ecol. Indic. 2024, 160, 111863. [Google Scholar] [CrossRef]
- Niu, P.; Jiang, Y.; Yang, Y.; Wang, L. The characteristics and influencing factors of change in farmland system vulnerability: A case study of Sanmenxia City, China. Front. Environ. Sci. 2022, 10, 887570. [Google Scholar] [CrossRef]
- Weng, C.; Bai, Y.; Chen, B.; Hu, Y.; Shu, J.; Chen, Q.; Wang, P. Assessing the vulnerability to climate change of a semi-arid pastoral social–ecological system: A case study in Hulunbuir, China. Ecol. Inform. 2023, 76, 102139. [Google Scholar] [CrossRef]
- Hu, X.; Ma, C.; Huang, P.; Guo, X. Ecological vulnerability assessment based on AHP-PSR method and analysis of its single parameter sensitivity and spatial autocorrelation for ecological protection—A case of Weifang City, China. Ecol. Indic. 2021, 125, 107464. [Google Scholar] [CrossRef]
- Wang, T.; Yang, Z.; Han, F.; Yu, J.; Ma, X.; Han, J. Assessment of tourism socio-ecological system resilience in arid areas: A case study of Xinjiang, China. Ecol. Indic. 2024, 159, 111748. [Google Scholar] [CrossRef]
- Chen, M.; Xu, X.; Tan, Y.; Lin, Y. Assessing ecological vulnerability and resilience-sensitivity under rapid urbanization in China’s Jiangsu province. Ecol. Indic. 2024, 167, 112607. [Google Scholar]
- Dai, X.; Gao, Y.; He, X.; Liu, T.; Jiang, B.; Shao, H.; Yao, Y. Spatial-temporal pattern evolution and driving force analysis of ecological environment vulnerability in Panzhihua City. Environ. Sci. Pollut. Res. 2021, 28, 7151–7166. [Google Scholar] [CrossRef]
- Li, Q.; Shi, X.; Wu, Q. Effects of protection and restoration on reducing ecological vulnerability. Sci. Total Environ. 2021, 761, 143180. [Google Scholar] [CrossRef] [PubMed]
- Zhang, X.; Wang, L.; Fu, X.; Li, H.; Xu, C. Ecological vulnerability assessment based on PSSR in Yellow River Delta. J. Clean. Prod. 2017, 167, 1106–1111. [Google Scholar] [CrossRef]
- Wu, X.; Tang, S. Comprehensive evaluation of ecological vulnerability based on the AHP-CV method and SOM model: A case study of Badong County, China. Ecol. Indic. 2022, 137, 108758. [Google Scholar] [CrossRef]
- Ikhumhen, H.O.; Fang, Q.; Lu, S.; Meilana, L.; Lopes, N.D.R. Investigating socio-ecological vulnerability to climate change via remote sensing and a data-driven ranking algorithm. J. Environ. Manag. 2023, 347, 119254. [Google Scholar] [CrossRef]
- Wang, X.; Duan, L.; Zhang, T.; Cheng, W.; Jia, Q.; Li, J.; Li, M. Ecological vulnerability of China’s Yellow River Basin: Evaluation and socioeconomic driving factors. Environ. Sci. Pollut. Res. 2023, 30, 115915–115928. [Google Scholar] [CrossRef] [PubMed]
- Feng, Z.; Yang, X.; Li, S. New insights of eco-environmental vulnerability in China’s Yellow River Basin: Spatio-temporal pattern and contributor identification. Ecol. Indic. 2024, 167, 112655. [Google Scholar]
- Qi, S.; Hu, S.; Cao, S. Spatial and temporal changes of social vulnerability of cities to natural hazards in Zhejiang province, China. Heliyon 2024, 10, e27120. [Google Scholar] [CrossRef]
- Zhong, J.; Hao, L.; Sajinkumar, K.S.; Yan, D. Changes of ecological vulnerability in areas with different urban expansion patterns—A case study in the Yanhe river basin, China. J. Environ. Manag. 2024, 370, 122607. [Google Scholar] [CrossRef]
- Yu, T.; Leng, H.; Yuan, Q.; Jiang, C. Vulnerability Evaluation of Villages Based on Social–Ecological Indicators and Strategies for Improvement: Case Study of Villages in the Northeast China Plain. J. Urban Plan. Dev. 2022, 148, 04021059. [Google Scholar] [CrossRef]
- Biswas, S.; Nautiyal, S. An assessment of socio-economic vulnerability at the household level: A study on villages of the Indian Sundarbans. Environ. Dev. Sustain. 2021, 23, 11120–11137. [Google Scholar] [CrossRef]
- Pirasteh, S.; Fang, Y.; Mafi-Gholami, D.; Abulibdeh, A.; Nouri-Kamari, A.; Khonsari, N. Enhancing vulnerability assessment through spatially explicit modeling of mountain social-ecological systems exposed to multiple environmental hazards. Sci. Total Environ. 2024, 930, 172744. [Google Scholar] [CrossRef]
- Roshani Sajjad, H.; Rahaman, M.H.; Masroor, M.; Sharma, Y.; Sharma, A.; Saha, T.K. Vulnerability assessment of forest ecosystem based on exposure, sensitivity and adaptive capacity in the Valmiki Tiger Reserve, India: A geospatial analysis. Ecol. Inform. 2024, 80, 102494. [Google Scholar] [CrossRef]
- Tai, C.V.; Chung, E.S.; Kim, D. A socio-economic vulnerability assessment framework against natural disasters: A case study in Seoul, South Korea. Urban Clim. 2024, 58, 102139. [Google Scholar] [CrossRef]
- Zhang, X.; Zheng, Y.; Yang, Y.; Ren, H.; Liu, J. Spatiotemporal evolution of ecological vulnerability on the Loess Plateau. Ecol. Indic. 2025, 170, 113060. [Google Scholar] [CrossRef]
- Shukla, R.; Sachdeva, K.; Joshi, P.K. An indicator-based approach to assess village-level social and biophysical vulnerability of agriculture communities in Uttarakhand, India. J. Mt. Sci. 2016, 13, 2260–2271. [Google Scholar] [CrossRef]
- Chen, J.; Yang, X.; Yin, S.; Wu, K.; Deng, M.; Wen, X. The vulnerability evolution and simulation of social-ecological systems in a semi-arid area: A case study of Yulin City, China. J. Geogr. Sci. 2018, 28, 152–174. [Google Scholar] [CrossRef]
- Zhang, Z.; Hu, B.; Qiu, H. Comprehensive assessment of ecological risk in southwest Guangxi-Beibu bay based on DPSIR model and OWA-GIS. Ecol. Indic. 2021, 132, 108334. [Google Scholar] [CrossRef]
- Dasgupta, S.; Badola, R.; Ali, S.Z.; Jiju, J.S.; Tariyal, P. Adaptive capacity and vulnerability of the socio-ecological system of Indian Himalayan villages under present and predicted future scenarios. J. Environ. Manag. 2022, 302, 113946. [Google Scholar] [CrossRef]
- Asadi, Y.; Argany, M.; Ezimand, K. GIS-based multi-criteria decision-making for seismic vulnerability modeling using OWA conceptual quantifiers. J. Nat. Environ. Hazards 2025, 14, 1–16. [Google Scholar]
- Berkes, F.; Colding, J.; Folke, C. Navigating Social-Ecological Systems: Building Resilience for Complexity and Change; Cambridge University Press: Cambridge, UK, 2008. [Google Scholar]
- Yu, T.; Leng, H.; Yuan, Q.; Yuan, Z. Spatial-temporal patterns and driving mechanism of rural vulnerability at county level: A case study of 117 counties in Heilongjiang Province, China. J. Rural Stud. 2025, 113, 103475. [Google Scholar] [CrossRef]
- Chen, J.; Xiong, K.; Luo, L.; Zhang, W.; Chen, Y. Social-ecological system vulnerability in the core area of desertification control in South China Karst: Spatial—temporal feature, driver factors and scenario simulation. Environ. Dev. Sustain. 2025, 1–26. [Google Scholar] [CrossRef]
- Zhang, J.; Li, J.; Yang, X.; Yin, S.; Chen, J. Rural social-ecological systems vulnerability evolution and spatial-temporal heterogeneity in arid environmental change region: A case study of Minqin Oasis, northwestern China. Appl. Geogr. 2022, 145, 102747. [Google Scholar] [CrossRef]
- Yang, Z.; Li, B.; Nan, B.; Dai, X.; Peng, C.; Bi, X. A methodological framework for assessing pastoral socio-ecological system vulnerability: A case study of Altay Prefecture in Central Asia. Sci. Total Environ. 2023, 862, 160828. [Google Scholar] [CrossRef]
- Gong, J.; Jin, T.; Cao, E.; Wang, S.; Yan, L. Is ecological vulnerability assessment based on the VSD model and AHP-Entropy method useful for loessial forest landscape protection and adaptative management? A case study of Ziwuling Mountain Region, China. Ecol. Indic. 2022, 143, 109379. [Google Scholar] [CrossRef]
- Xia, M.; Jia, K.; Zhao, W.; Liu, S.; Wei, X.; Wang, B. Spatio-temporal changes of ecological vulnerability across the Qinghai-Tibetan Plateau. Ecol. Indic. 2021, 123, 107274. [Google Scholar] [CrossRef]
- Bernstein, L.; Bosch, P.; Canziani, O.; Chen, Z.; Christ, R.; Riahi, K. IPCC, 2007: Climate Change 2007: Synthesis Report; IPCC: Geneva, Switzerland, 2008. [Google Scholar]
- He, S.; Nong, L.; Wang, J.; Zhong, X.; Ma, J. Revealing various change characteristics and drivers of ecological vulnerability in the mountains of southwest China. Ecol. Indic. 2024, 167, 112680. [Google Scholar] [CrossRef]
- Xiao, H.; Shao, H.; Long, J.; Zhang, S.; He, S.; Wang, D. Spatial-temporal pattern evolution and geological influence factors analysis of ecological vulnerability in Western Sichuan mountain region. Ecol. Indic. 2023, 155, 110980. [Google Scholar] [CrossRef]
- Yager, R.R. Quantifier guided aggregation using OWA operators. Int. J. Intell. Syst. 1996, 11, 49–73. [Google Scholar] [CrossRef]
- Malczewski, J. Ordered weighted averaging with fuzzy quantifiers: GIS-based multicriteria evaluation for land-use suitability analysis. Int. J. Appl. Earth Obs. Geoinf. 2006, 8, 270–277. [Google Scholar] [CrossRef]
- Huang, B.; Zha, R.; Chen, S.; Zha, X.; Jiang, X. Fuzzy evaluation of ecological vulnerability based on the SRP-SES method and analysis of multiple decision-making attitudes based on OWA operators: A case of Fujian Province, China. Ecol. Indic. 2023, 153, 110432. [Google Scholar] [CrossRef]
- Shukla, R.; Sachdeva, K.; Joshi, P.K. Inherent vulnerability of agricultural communities in Himalaya: A village-level hotspot analysis in the Uttarakhand state of India. Appl. Geogr. 2016, 74, 182–198. [Google Scholar] [CrossRef]
- Gathongo, N.; Tran, L. Assessing social vulnerability of villages in Mt. Kasigau area, Kenya, using the analytical hierarchy process. GeoJournal 2020, 85, 995–1007. [Google Scholar] [CrossRef]
- Cao, M.; Xu, D.; Xie, F.; Liu, E.; Liu, S. The influence factors analysis of households’ poverty vulnerability in southwest ethnic areas of China based on the hierarchical linear model: A case study of Liangshan Yi autonomous prefecture. Appl. Geogr. 2016, 66, 144–152. [Google Scholar] [CrossRef]
- Wang, Y.; Chen, Y.; Chi, Y.; Zhao, W.; Hu, Z.; Duan, F. Village-level multidimensional poverty measurement in China: Where and how. J. Geogr. Sci. 2018, 28, 1444–1466. [Google Scholar] [CrossRef]
- Shi, B.; Liu, H.; Huang, L.; Zhang, Y.; Xiang, Z. Increasing Vulnerability of Village Heritage: Evidence from 123 Villages in Aba Prefecture, Sichuan, China. Land 2023, 12, 2048. [Google Scholar] [CrossRef]
- Ur Rahman, I.; Jian, D.; Junrong, L.; Shafi, M. Socio-economic status, resilience, and vulnerability of households under COVID-19: Case of village-level data in Sichuan province. PLoS ONE 2021, 16, e0249270. [Google Scholar] [CrossRef]
- Wang, Y.; Liang, C.; Li, J. Detecting village-level regional development differences: A GIS and HLM method. Growth Change 2019, 50, 222–246. [Google Scholar] [CrossRef]
- Zhang, Y.; Li, X.; Song, W. Determinants of cropland abandonment at the parcel, household and village levels in mountain areas of China: A multi-level analysis. Land Use Policy 2014, 41, 186–192. [Google Scholar] [CrossRef]
- Sun, F.; Zheng, Q.; Ye, C.; Lin, J. A rural resilience development indicator system oriented to common prosperity: The case of a coastal village in Zhejiang Province. Ecol. Indic. 2023, 156, 111126. [Google Scholar] [CrossRef]
- Gupta, A.K.; Negi, M.; Nandy, S.; Kumar, M.; Singh, V.; Valente, D.; Petrosillo, I.; Pandey, R. Mapping socio-environmental vulnerability to climate change in different altitude zones in the Indian Himalayas. Ecol. Indic. 2020, 109, 105787. [Google Scholar] [CrossRef]
- He, Y.; Zhou, C.; Ahmed, T. Vulnerability assessment of rural social-ecological system to climate change: A case study of Yunnan Province, China. Int. J. Clim. Change Strateg. Manag. 2021, 13, 162–180. [Google Scholar] [CrossRef]
- Wei, Z.; Liang, X.; Chen, H.; Yang, M.; Shi, J.; Li, H.; Lui, R. Ecosystem vulnerability assessment based on ecosystem services and analysis of its drivers: A case of the Guanzhong region, China. Environ. Dev. Sustain. 2024, 1–24. [Google Scholar] [CrossRef]
- Tao, Y.; Dai, L.; Hu, Z.; Witlox, F. Exploring the Spatial Morphological Evolution of Mineral Resource-Based Cities. Appl. Spat. Anal. Policy 2025, 18, 39. [Google Scholar] [CrossRef]
- Knapp, W. The Rhine-Ruhr area in transformation: Towards a European metropolitan region? Eur. Plan. Stud. 1998, 6, 379–393. [Google Scholar] [CrossRef]
- Goess, S.; de Jong, M.; Meijers, E. City branding in polycentric urban regions: Identification, profiling and transformation in the Randstad and Rhine-Ruhr. Eur. Plan. Stud. 2016, 24, 2036–2056. [Google Scholar] [CrossRef]
- Armstrong, B. Industrial policy and local economic transformation: Evidence from the US Rust Belt. Econ. Dev. Q. 2021, 35, 181–196. [Google Scholar] [CrossRef]
- Pottie-Sherman, Y. Rust and reinvention: Im/migration and urban change in the American Rust Belt. Geogr. Compass 2020, 14, e12482. [Google Scholar] [CrossRef]
- Pieterse, E. Urban governance and spatial transformation ambitions in Johannesburg. J. Urban Aff. 2019, 41, 20–38. [Google Scholar]

| Data Type | Data Source | Key Parameters/Description | |
|---|---|---|---|
| Remote sensing data | DEM | Geospatial Data Cloud (http://www.gscloud.cn/, accessed on 18 March 2024) | Elevation, 30 m resolution |
| NDVI | NASA LAADS DAAC (https://ladsweb.modaps.eosdis.nasa.gov/, accessed on 18 March 2024) | MOD13Q1 product (NASA LP DAAC, Sioux Falls, SD, USA), 250 m resolution | |
| Meteorological data | Precipitation/Temperature | National Earth System Science Data Center (https://www.geodata.cn/, accessed on 18 March 2024) | 1 km resolution annual precipitation and mean annual temperature data |
| Soil data | Soil properties | Resource and Environmental Sciences Data Center of the Chinese Academy of Sciences (https://www.resdc.cn/, accessed on 19 March 2024) | Soil texture (sand, silt, clay content); soil erosion intensity (light, moderate, severe) |
| Land use data | Land use data | Resource and Environmental Sciences Data Center of the Chinese Academy of Sciences (https://www.resdc.cn/, accessed on 20 March 2024) | 30 m resolution Land use types include built-up (construction) land, grassland, cropland, forestland, water area, unused land |
| Land survey data | Ministry of Natural Resources | Extracts change information for forest, grassland, garden land, and mining land areas | |
| Socio-economic data | Nighttime light | Resource and Environmental Sciences Data Center of the Chinese Academy of Sciences (https://www.resdc.cn/, accessed on 20 March 2024) | DMSP/OLS (2010) (NOAA, Washington, DC, USA), NPP/VIIRS (2020) (NASA EOSDIS, Greenbelt, MD, USA), 500 m resolution |
| GDP/Population density data | Resource and Environmental Sciences Data Center of the Chinese Academy of Sciences (https://www.resdc.cn/, accessed on 20 March 2024) | GDP and population density, 1 km resolution | |
| Statistical Yearbooks | Tai’an Municipal Statistics Bureau | GDP, industrial structure, urbanization rate | |
| POI data | Amap API (2012; 2020) | Locations of industrial enterprises and public services | |
| Census Data | Xintai Municipal Bureau of Statistics | Administrative village population density, age structure |
| Criterion Layer | Element Layer | Indicator Layer | Indicator Properties | 2010 Weight | 2020 Weight |
|---|---|---|---|---|---|
| Exposure | Natural systems | Average elevation | + | 0.0740 | 0.0731 |
| Average slope | + | 0.1705 | 0.1683 | ||
| Terrain relief | + | 0.1290 | 0.1274 | ||
| Annual precipitation | + | 0.0428 | 0.0483 | ||
| Annual temperature | + | 0.0158 | 0.0138 | ||
| Soil texture | − | 0.2543 | 0.1542 | ||
| Soil erosion intensity | + | 0.1293 | 0.2510 | ||
| Human Activities | Proportion of construction land area | + | 0.0280 | 0.1336 | |
| Population density | + | 0.1563 | 0.0304 | ||
| Sensitivity | Land Use | Proportion of mining land area | + | 0.5715 | 0.6834 |
| Proportion of river area | + | 0.3641 | 0.2433 | ||
| Proportion of cultivated land area | + | 0.0300 | 0.0359 | ||
| Ecological | NDVI | − | 0.0234 | 0.0219 | |
| Proportion of forest, grassland, and garden land area | − | 0.0110 | 0.0155 | ||
| Adaptive Capacity | Economic | Kindergarten density | − | 0.0184 | 0.0322 |
| Primary and secondary school density | − | 0.0190 | 0.0390 | ||
| Hospital density | − | 0.0201 | 0.0351 | ||
| Social | GDP | − | 0.3477 | 0.8085 | |
| Nighttime light intensity | − | 0.5948 | 0.0851 |
| Criteria | Interaction Type |
|---|---|
| Nonlinear attenuation | |
| Single-factor nonlinear attenuation | |
| Bifactorial enhancement | |
| Mutual independence | |
| Nonlinear enhancement |
| Exposure | Sensitivity | Adaptive Capacity | Vulnerability | ||||||
|---|---|---|---|---|---|---|---|---|---|
| 2010 | 2020 | 2010 | 2020 | 2010 | 2020 | 2010 | 2020 | ||
| Low | Number | 158 | 173 | 512 | 346 | 82 | 78 | 165 | 143 |
| Proportion | 18.92% | 20.72% | 61.32% | 41.44% | 9.82% | 9.34% | 19.76% | 17.13% | |
| Moderately low | Number | 239 | 229 | 196 | 382 | 438 | 152 | 269 | 233 |
| Proportion | 28.62% | 27.43% | 23.47% | 45.75% | 52.46% | 18.20% | 32.22% | 27.90% | |
| Medium | Number | 180 | 173 | 78 | 71 | 180 | 507 | 220 | 259 |
| Proportion | 21.56% | 20.72% | 9.34% | 8.50% | 21.56% | 60.72% | 26.35% | 31.02% | |
| Moderately high | Number | 191 | 191 | 33 | 32 | 79 | 59 | 126 | 150 |
| Proportion | 22.87% | 22.87% | 3.95% | 3.83% | 9.46% | 7.07% | 15.09% | 17.96% | |
| High | Number | 67 | 69 | 16 | 4 | 56 | 39 | 55 | 50 |
| Proportion | 8.02% | 8.26% | 1.92% | 0.48% | 6.71% | 4.67% | 6.59% | 5.99% | |
| 2020 | Low | Moderately Low | Medium | Moderately High | High | |||||
|---|---|---|---|---|---|---|---|---|---|---|
| 2010 | Area (km2) | Proportion (%) | Area (km2) | Proportion (%) | Area (km2) | Proportion (%) | Area (km2) | Proportion (%) | Area (km2) | Proportion (%) |
| low | 152.48 | 8.53 | 113.15 | 6.33 | 20.36 | 1.14 | 0.52 | 0.03 | 0.00 | 0.00 |
| moderately low | 43.18 | 2.42 | 237.82 | 13.31 | 240.38 | 13.45 | 35.99 | 2.01 | 1.20 | 0.07 |
| medium | 9.24 | 0.52 | 35.62 | 1.99 | 252.52 | 14.13 | 207.16 | 11.59 | 9.54 | 0.53 |
| moderately high | 2.11 | 0.12 | 43.30 | 2.42 | 71.66 | 4.01 | 144.56 | 8.09 | 27.63 | 1.55 |
| high | 0.39 | 0.02 | 1.81 | 0.10 | 24.07 | 1.35 | 30.11 | 1.68 | 82.36 | 4.61 |
| Town/Street | 2010 Tw | 2020 Tw |
|---|---|---|
| Theil index | 0.3639 | 0.2777 |
| Between Towns/Streets (contribution) | 0.0676 (18.58%) | 0.0264 (9.51%) |
| Within Towns/Streets (contribution) | 0.2963 (81.42%) | 0.2513 (90.49%) |
| Qingyun Street | 0.0729 | 0.0516 |
| Xinwen Street | 0.0118 | 0.0047 |
| Xinfu Street | 0.0226 | 0.0123 |
| Dongdu Town | 0.0082 | 0.0093 |
| Xiaoxie Town | 0.0050 | 0.0049 |
| Zhai Town | 0.0169 | 0.0094 |
| Quangou Town | 0.0116 | 0.0127 |
| Yangliu Town | 0.0167 | 0.0187 |
| Guodu Town | 0.0054 | 0.0045 |
| Xizhangzhuang Town | 0.0033 | 0.0050 |
| Loude Town | 0.0040 | 0.0042 |
| Yucun Town | 0.0089 | 0.0088 |
| Gongli Town | 0.0069 | 0.0054 |
| Guli Town | 0.0202 | 0.0181 |
| Shila Town | 0.0148 | 0.0158 |
| Fangcheng Town | 0.0042 | 0.0048 |
| Liudu Town | 0.0086 | 0.0078 |
| Wen’nan Town | 0.0356 | 0.0385 |
| Longting Town | 0.0164 | 0.0126 |
| Yuejiazhuang Town | 0.0021 | 0.0024 |
| Indicator Factor | 2010 | 2020 | ||||
|---|---|---|---|---|---|---|
| q-Value | p-Value | q Rank | q-Value | p-Value | q Rank | |
| Average elevation (X1) | 0.1162 | 0.000 | 5 | 0.1694 | 0.000 | 6 |
| Average slope (X2) | 0.0534 | 0.000 | 12 | 0.1114 | 0.000 | 7 |
| Terrain relief (X3) | 0.0647 | 0.000 | 10 | 0.1002 | 0.000 | 9 |
| Annual precipitation (X4) | 0.2572 | 0.000 | 1 | 0.2313 | 0.000 | 3 |
| Annual temperature (X5) | 0.0659 | 0.000 | 9 | 0.0936 | 0.000 | 10 |
| Soil texture (X6) | 0.0981 | 0.000 | 7 | 0.2137 | 0.000 | 4 |
| Soil erosion intensity (X7) | 0.0144 | 0.058 | 16 | 0.1008 | 0.000 | 8 |
| Proportion of construction land area (X8) | 0.2427 | 0.000 | 2 | 0.2745 | 0.000 | 2 |
| Population density (X9) | 0.1781 | 0.000 | 3 | 0.3334 | 0.000 | 1 |
| Proportion of mining land area (X10) | 0.1439 | 0.000 | 4 | 0.1803 | 0.000 | 5 |
| Proportion of river area (X11) | 0.0119 | 0.364 | 17 | 0.0243 | 0.179 | 17 |
| NDVI (X12) | 0.0106 | 0.098 | 18 | 0.0068 | 0.273 | 18 |
| Proportion of cultivated land area (X13) | 0.1037 | 0.000 | 6 | 0.0351 | 0.000 | 16 |
| Proportion of forest, grassland, and garden land area (X14) | 0.0066 | 0.274 | 19 | 0.0064 | 0.327 | 19 |
| Kindergarten density (X15) | 0.0460 | 0.005 | 13 | 0.0607 | 0.000 | 14 |
| Primary and secondary school density (X16) | 0.0297 | 0.054 | 15 | 0.0385 | 0.031 | 15 |
| Hospital density (X17) | 0.0431 | 0.014 | 14 | 0.0622 | 0.000 | 13 |
| GDP (X18) | 0.0605 | 0.000 | 11 | 0.0851 | 0.000 | 11 |
| Nighttime light intensity (X19) | 0.0894 | 0.000 | 8 | 0.0782 | 0.000 | 12 |
| Decision Risk Coefficient (α) | a = 0.001 | a = 0.5 | a = 0.8 | a = 1 | a = 1.2 | a = 2 | a = 1000 | |
|---|---|---|---|---|---|---|---|---|
| Scenario | - | - | 1 | 2 | 3 | - | - | |
| criterion weights | X5 | 0.9977 | 0.3162 | 0.1585 | 0.0526 | 0.0631 | 0.0100 | 0.0000 |
| X14 | 0.0007 | 0.1251 | 0.1116 | 0.0526 | 0.0773 | 0.0279 | 0.0000 | |
| X13 | 0.0004 | 0.0918 | 0.0954 | 0.0526 | 0.0806 | 0.0429 | 0.0000 | |
| X9 | 0.0003 | 0.0739 | 0.0843 | 0.0526 | 0.0807 | 0.0550 | 0.0000 | |
| X15 | 0.0002 | 0.0619 | 0.0756 | 0.0526 | 0.0792 | 0.0644 | 0.0000 | |
| X17 | 0.0002 | 0.0530 | 0.0682 | 0.0526 | 0.0765 | 0.0714 | 0.0000 | |
| X12 | 0.0001 | 0.0459 | 0.0616 | 0.0526 | 0.0730 | 0.0760 | 0.0000 | |
| X16 | 0.0001 | 0.0401 | 0.0556 | 0.0526 | 0.0689 | 0.0784 | 0.0000 | |
| X4 | 0.0001 | 0.0351 | 0.0500 | 0.0526 | 0.0643 | 0.0789 | 0.0000 | |
| X1 | 0.0001 | 0.0307 | 0.0448 | 0.0526 | 0.0594 | 0.0776 | 0.0000 | |
| X19 | 0.0001 | 0.0267 | 0.0398 | 0.0526 | 0.0542 | 0.0745 | 0.0000 | |
| X3 | 0.0001 | 0.0231 | 0.0350 | 0.0526 | 0.0487 | 0.0700 | 0.0000 | |
| X8 | 0.0000 | 0.0197 | 0.0303 | 0.0526 | 0.0430 | 0.0642 | 0.0000 | |
| X6 | 0.0000 | 0.0166 | 0.0258 | 0.0526 | 0.0371 | 0.0572 | 0.0000 | |
| X2 | 0.0000 | 0.0136 | 0.0213 | 0.0526 | 0.0312 | 0.0492 | 0.0000 | |
| X11 | 0.0000 | 0.0108 | 0.0170 | 0.0526 | 0.0250 | 0.0403 | 0.0000 | |
| X7 | 0.0000 | 0.0080 | 0.0127 | 0.0526 | 0.0189 | 0.0308 | 0.0000 | |
| X10 | 0.0000 | 0.0053 | 0.0084 | 0.0526 | 0.0126 | 0.0208 | 0.0051 | |
| X18 | 0.0000 | 0.0026 | 0.0042 | 0.0526 | 0.0063 | 0.0105 | 0.9949 |
Disclaimer/Publisher’s Note: The statements, opinions and data contained in all publications are solely those of the individual author(s) and contributor(s) and not of MDPI and/or the editor(s). MDPI and/or the editor(s) disclaim responsibility for any injury to people or property resulting from any ideas, methods, instructions or products referred to in the content. |
© 2025 by the authors. Licensee MDPI, Basel, Switzerland. This article is an open access article distributed under the terms and conditions of the Creative Commons Attribution (CC BY) license (https://creativecommons.org/licenses/by/4.0/).
Share and Cite
Chen, Y.; Li, Y.; Liu, T.; Lei, Y.; Meng, Y. Village-Level Spatio-Temporal Patterns and Key Drivers of Social-Ecological Vulnerability in a Resource-Exhausted Mining City: A Case Study of Xintai, China. Land 2025, 14, 1810. https://doi.org/10.3390/land14091810
Chen Y, Li Y, Liu T, Lei Y, Meng Y. Village-Level Spatio-Temporal Patterns and Key Drivers of Social-Ecological Vulnerability in a Resource-Exhausted Mining City: A Case Study of Xintai, China. Land. 2025; 14(9):1810. https://doi.org/10.3390/land14091810
Chicago/Turabian StyleChen, Yi, Yuan Li, Tao Liu, Yong Lei, and Yao Meng. 2025. "Village-Level Spatio-Temporal Patterns and Key Drivers of Social-Ecological Vulnerability in a Resource-Exhausted Mining City: A Case Study of Xintai, China" Land 14, no. 9: 1810. https://doi.org/10.3390/land14091810
APA StyleChen, Y., Li, Y., Liu, T., Lei, Y., & Meng, Y. (2025). Village-Level Spatio-Temporal Patterns and Key Drivers of Social-Ecological Vulnerability in a Resource-Exhausted Mining City: A Case Study of Xintai, China. Land, 14(9), 1810. https://doi.org/10.3390/land14091810


