Article

Protected Areas Under Threat: Unravelling the Protected Areas Downgrading, Downsizing, and Degazettement (PADDD) Events in Myanmar in a Global Context: 1989–2020

1
Department of Biology, Norwegian University of Science and Technology, Realfagbygget, 7491 Trondheim, Norway
2
Centre for Development and Environment, University of Bern, 3012 Bern, Switzerland
3
Independent Researcher, Yangon 11011, Myanmar
4
Independent Researcher, Wetlet 02281, Myanmar
*
Author to whom correspondence should be addressed.
Land 2025, 14(9), 1800; https://doi.org/10.3390/land14091800
Submission received: 30 July 2025 / Revised: 29 August 2025 / Accepted: 1 September 2025 / Published: 3 September 2025
(This article belongs to the Section Land, Biodiversity, and Human Wellbeing)

Abstract

Though global efforts are increasingly being urged to expand Protected Areas (PAs), PA Downgrading, Downsizing, and Degazettement (PADDD) events have been widespread worldwide to date. However, such events may often be poorly understood, as is the case in Myanmar, due to limited awareness of PADDD’s role and inadequate reporting. To fill this information gap, this study aimed to examine the enacted PADDD events and their impacts. A comprehensive dataset was developed for the enacted Myanmar PADDD events by compiling relevant PA documents. We identified 73 enacted PADDD events in 20 PAs (in Myanmar), affecting 1231.4 km2 between 1989 and 2020, with downsizing as the sole type of PADDD in Myanmar. While rural settlements, other proximate causes, and infrastructure were highly associated with PADDD events, degradation contributed to the highest reduction in PA extent. Case studies demonstrated that PA habitats were more fragmented and deforested in the post-PADDD era. Land cover changes were more severe in PADDDed areas than in unPADDDed areas, while ranges of threatened species remained unprotected in PADDDed areas. Our results underscore the importance of comprehensive evaluations of the proposed PADDD and firm PADDD policy in safeguarding the PA estate and mitigating future potential PADDD events.

1. Introduction

Protected Areas (PAs) are the backbone of biodiversity conservation and ecological balance and contribute to enhancing climate change resilience [1,2]. A minimum of 303,313 PAs currently cover approximately 25% of the earth’s terrestrial, inland water, and marine areas worldwide [3]. However, global biodiversity is still at risk due to anthropogenic disturbances and climate change. To halt the ongoing and unprecedented loss of global biodiversity and to safeguard nature, the Kunming–Montreal Global Biodiversity Framework (GBF) was adopted in 2022, with a target of “30 × 30”, aiming to conserve 30% of global terrestrial and marine areas under legal protection by 2030 [4].
However, the extent and coverage of PAs are threatened by the widespread occurrence of PA Downgrading, Downsizing, and Degazettement (PADDD) worldwide [5,6]. PA downgrading refers to the legal permit for increased human access to PAs; downsizing involves the removal or reduction to some extent of PA estate; and degazettement refers to the event of wiping out the entire conservation area [5]. PADDD events are historical phenomena, with the first observations in Hot Springs and Yosemite National Parks in the United States in 1892 [7]. Between 1892 and 2021, 4962 instances of global PADDD events have been documented across 78 countries worldwide. These figures underscore the dynamic nature of PA governance and the fact that lands designated for PAs may not remain in place forever.
The underlying causes of PADDD events are diverse. However, industrial-level resource extraction and development are mainly responsible for such events [6,8]. PADDD have affected the ecological consequences of conservation areas such as habitat fragmentation [9,10], land cover changes [11], and deforestation [12,13,14]. However, not all PADDD events have negative connotations causing detrimental effects on biodiversity and communities. Sometimes, PADDD events may attempt to transform ineffective PAs into more effective conservation outcomes [15,16] and to address historical injustices and inequities incurred by eviction from fortress conservation [17]. On all accounts, the increased frequencies and extent of PADDD events undermine the GBF’s “30 × 30” target.
PADDD is best seen as the outcome of bargaining between development and conservation coalitions, with results shaped by institutions, tenure, participation, and spatial opportunity, and ultimately decided through legal and policy venues. Several studies in South America (nine, including Amazonian cases), Asia (two), Africa (two), North America (two), the Middle East (one, Oman), and two global analyses show that economic motives recur most consistently (nine studies), followed by legal–institutional (eight), social (six), political (five), and spatial (two) drivers. Mechanistically, rising expected rents from extraction or agriculture shift actors’ reservation points and increase pressure to relax rules or alter boundaries; outcomes then hinge on power asymmetries and on whether decision-making is routed through rule-bound venues [11]. Governance conditions act as filters: participatory decision-making, clear and secure resource rights, and adaptive management reduce PADDD risk [5,13], whereas weak consultation, insecure tenure, and institutional deficiencies increase it [18,19]. Legal clarity and accessible judicial review discipline or block the translation of pressure into PADDD; ambiguity and low capacity do the opposite [18,19]. Secure Indigenous and local tenure raises the political–legal cost of PADDD and tends to steer outcomes toward narrower downgrades rather than downsizing or degazettement [13,20]. Social–ecological perspectives add feedback, rule or boundary changes reshape ecosystems and livelihoods, which then recalibrate conflict and governance capacity [8]. Risk concentrates where access and endowments raise conservation opportunity costs [21,22]. Justice cuts across these accounts: legal/policy analyses and case studies foreground procedural and distributional justice (consultation quality, access to remedy, inequitable impacts), while bargaining and adaptive governance often treat justice implicitly via power and participation; justice deficits amplify contestation and litigation and can trigger institutional change [5,8,11,13,18,23].
This paper focuses on PADDD in Myanmar, because the country sits at the nexus of rich biodiversity, complex governance systems, and rapid political and economic transitions, offering a unique lens into how PADDD unfolds in fragile and contested contexts. Studying PADDD here helps illuminate the interplay between local land rights, natural resource governance, and global conservation priorities, providing critical insights into how implementation mechanisms function where governance is weak, contested, or shifting. This makes Myanmar a key case for refining global understanding of PADDD drivers, processes, and governance responses.
Myanmar is endowed with diverse ecosystems, species, and endemism, sharing the most significant portion in the Indo–Burma biodiversity hotspot, one of the top ten significant global biodiversity hotspots [24]. The country shares an extensive border with Bangladesh, China, India, Laos, and Thailand, and plays a crucial role in the ecological connectivity of diverse species across South and Southeast Asia. It has a long conservation history, and the first game sanctuary was established in 1911 to protect game species [25,26]. However, Myanmar presents a complex context for PADDD due to its legacy of centralised PA governance, diverse ethnic communities, and evolving land tenure systems. Historically, the establishment of conservation areas often excluded local communities, creating tenure insecurity and conflicts over resource use. Land use policy and legislation reforms between 2011 and 2016 reshaped conservation governance through the legal recognition of rural settlements and croplands within PAs. Between the early 20th century and 2020, 46 PAs were established, covering 6.07% of the total country area. Several studies have been conducted on PA policy and practices [27,28], PA status and challenges [29], expansion requirement of the PA network for better representation of species and habitats [30], the climate change effects on PAs [31,32], and natural resource use and community attitudes towards PAs in Myanmar [33,34,35]. Yet, PADDD events in Myanmar remain under-documented and poorly understood. The way PADDD events undermine the durability of PA existence also remains overlooked.
While one PADDD event in Myanmar is documented in the global PADDD database (PADDDTracker (Version 2.1)) [7], this study comprehensively examines Myanmar PADDD events from 1989 to 2020 and reveals a significantly higher occurrence of PADDD than previously recognised. Unlike previous PADDD studies, the present study compares Myanmar PADDD events with global trends from 1989 to 2020 to highlight the unique characteristics of this phenomenon. This study also incorporates spatial and temporal analysis of PADDD across 20 individual Myanmar PAs, identifying which PAs and periods experienced the highest frequency and affected areas of PADDD to indicate the instability of PA policy and ecological consequences of PADDD decision. Furthermore, the study assessed changes in land cover and threatened species range shifts for three significantly PADDD-affected PAs to understand its ecological impacts.
Given the awareness of such a knowledge gap, the present study aims to examine the patterns, trends, proximate causes, and impacts of PADDD events in Myanmar. We assessed three research questions: (1) What are the main characteristics of enacted PADDD events in Myanmar compared to global trends? (2) What drives the PADDD events in Myanmar? and (3) How do the PADDD events impact PA habitats and threatened species? Our study provides new insights into PADDD’s role in Myanmar’s conservation challenges and policy status. A better understanding of the patterns, trends, causes, and impacts of PADDD events will contribute to firm PADDD policy and the legal durability of PAs.

2. Materials and Methods

2.1. Data Sources

We developed a comprehensive dataset of enacted PADDD events in Myanmar from 1989 to 2020, as existing global PADDD data lack information on the majority of PADDD events in Myanmar. Additionally, we retrieved the global PADDD data [7], land cover data [36], and threatened species data [37] from publicly available sources.

2.2. Data Collection

We retrieved the global PADDD data from PADDDTracker (Version 2.1) [7] where 4962 instances of global PADDD events were recorded from 1892 to 2021 across 78 countries worldwide. We extracted enacted global PADDD events during 1989–2020, where events were removed (1) if the events were reversed, (2) if the extent of PAs before enactment was unknown, and (3) if affected areas after enactment were unknown. Only one PADDD case from Myanmar was recorded in the global dataset (Version 2.1). Therefore, due to incomplete information, the Myanmar event in the global dataset was excluded from the final data in this study. We extracted enacted global PADDD data from 1989 to 2020 to compare with Myanmar PADDD events between 1989 and 2020. The final global data, therefore, cover 39 countries between 1989 and 2020 after we added the Myanmar PADDD events into the global dataset. The proximate causes for PADDD events were identified into 13 principal categories by Mascia et al. [6] and the Conservation International and World Wildlife Fund [7] in which the “multiple causes” category was specified if proximate causes included more than one; when a proximate cause did not include any one of 13 main categories, it was categorised as “other”; and when the proximate cause was not clearly mentioned or specified, it was categorised as “unknown”.
To address the absence of comprehensive Myanmar PADDD data and to develop such data on enacted Myanmar PADDD events from 1989 to 2020, we compiled the best available datasets from all available and reliable resources, such as notifications of reported PADDD events from relevant records and documents of Myanmar national archives, Myanmar Gazette (https://www.moi.gov.mm/ppd/pyantan, accessed on 10 April 2022), (https://data.opendevelopmentmyanmar.net/my/library_record/, accessed on 10 April 2022), district forest management plans (https://forestdepartment.gov.mm/dfmp_data, accessed on 26 January 2025), and other departmental reports. PADDD events, which mentioned the name of PA, notification number, year, extent, and reason for downsizing, were considered to be included. We validated them by cross-checking information across different sources. We retrieved 46 PA boundaries from the World Database on Protected Areas (WDPA) as baseline reference, representing areas officially designated up to the year 2020. To ensure accuracy, the boundaries of PAs were cross-checked and revised by comparing the official notification with the topographic context visible in Google Earth imagery. This process allowed us to align the spatial delineation precisely with the demarcation and remarks specified in the notification. The finalised PA boundaries were standardised in the WGS84 coordinate system. Subsequently, we developed the corresponding boundaries of PADDD events individually, where relevant data were accessible, using the aforementioned archival sources as references. Then, we created the new PA boundaries (PADDDed and unPADDDed areas) after extracting the PADDD events.
We followed the global PADDD guidelines mentioned in Mascia and Pailler [5], Mascia et al. [6], and the Conservation International and World Wildlife Fund [7], including the classification of proximate causes for the Myanmar PADDD events. We created enacted PADDD events with 18 variables following the global guidelines. All Myanmar PADDD instances were enacted for downsizing. Proximate causes were listed from the respective documents in which reasons for enacted PADDD were mentioned. Rural residential areas, cultivation land, and village communal land (such as schools, religious compounds, and others) in villages were categorised under the rural settlement category. Since 1990, certain PA estates in Myanmar have been allocated for military and religious use. In our analysis, these areas were categorised under the “other” category. We selected the three most significant and considerable enacted PADDDed sites, as a limitation of reliable locations and robust extent for some PADDD events hinders performing country-level analysis. The extent of enacted PADDDed areas from three PAs, such as Pidaung Wildlife Sanctuary, Pyin-Oo-Lwin Bird Sanctuary, and Shwe-U-Daung Wildlife Sanctuary, represented altogether about 60.7% of all Myanmar PADDDed areas. The remaining 39.3% represents 17 PAs (Appendix A Table A1).
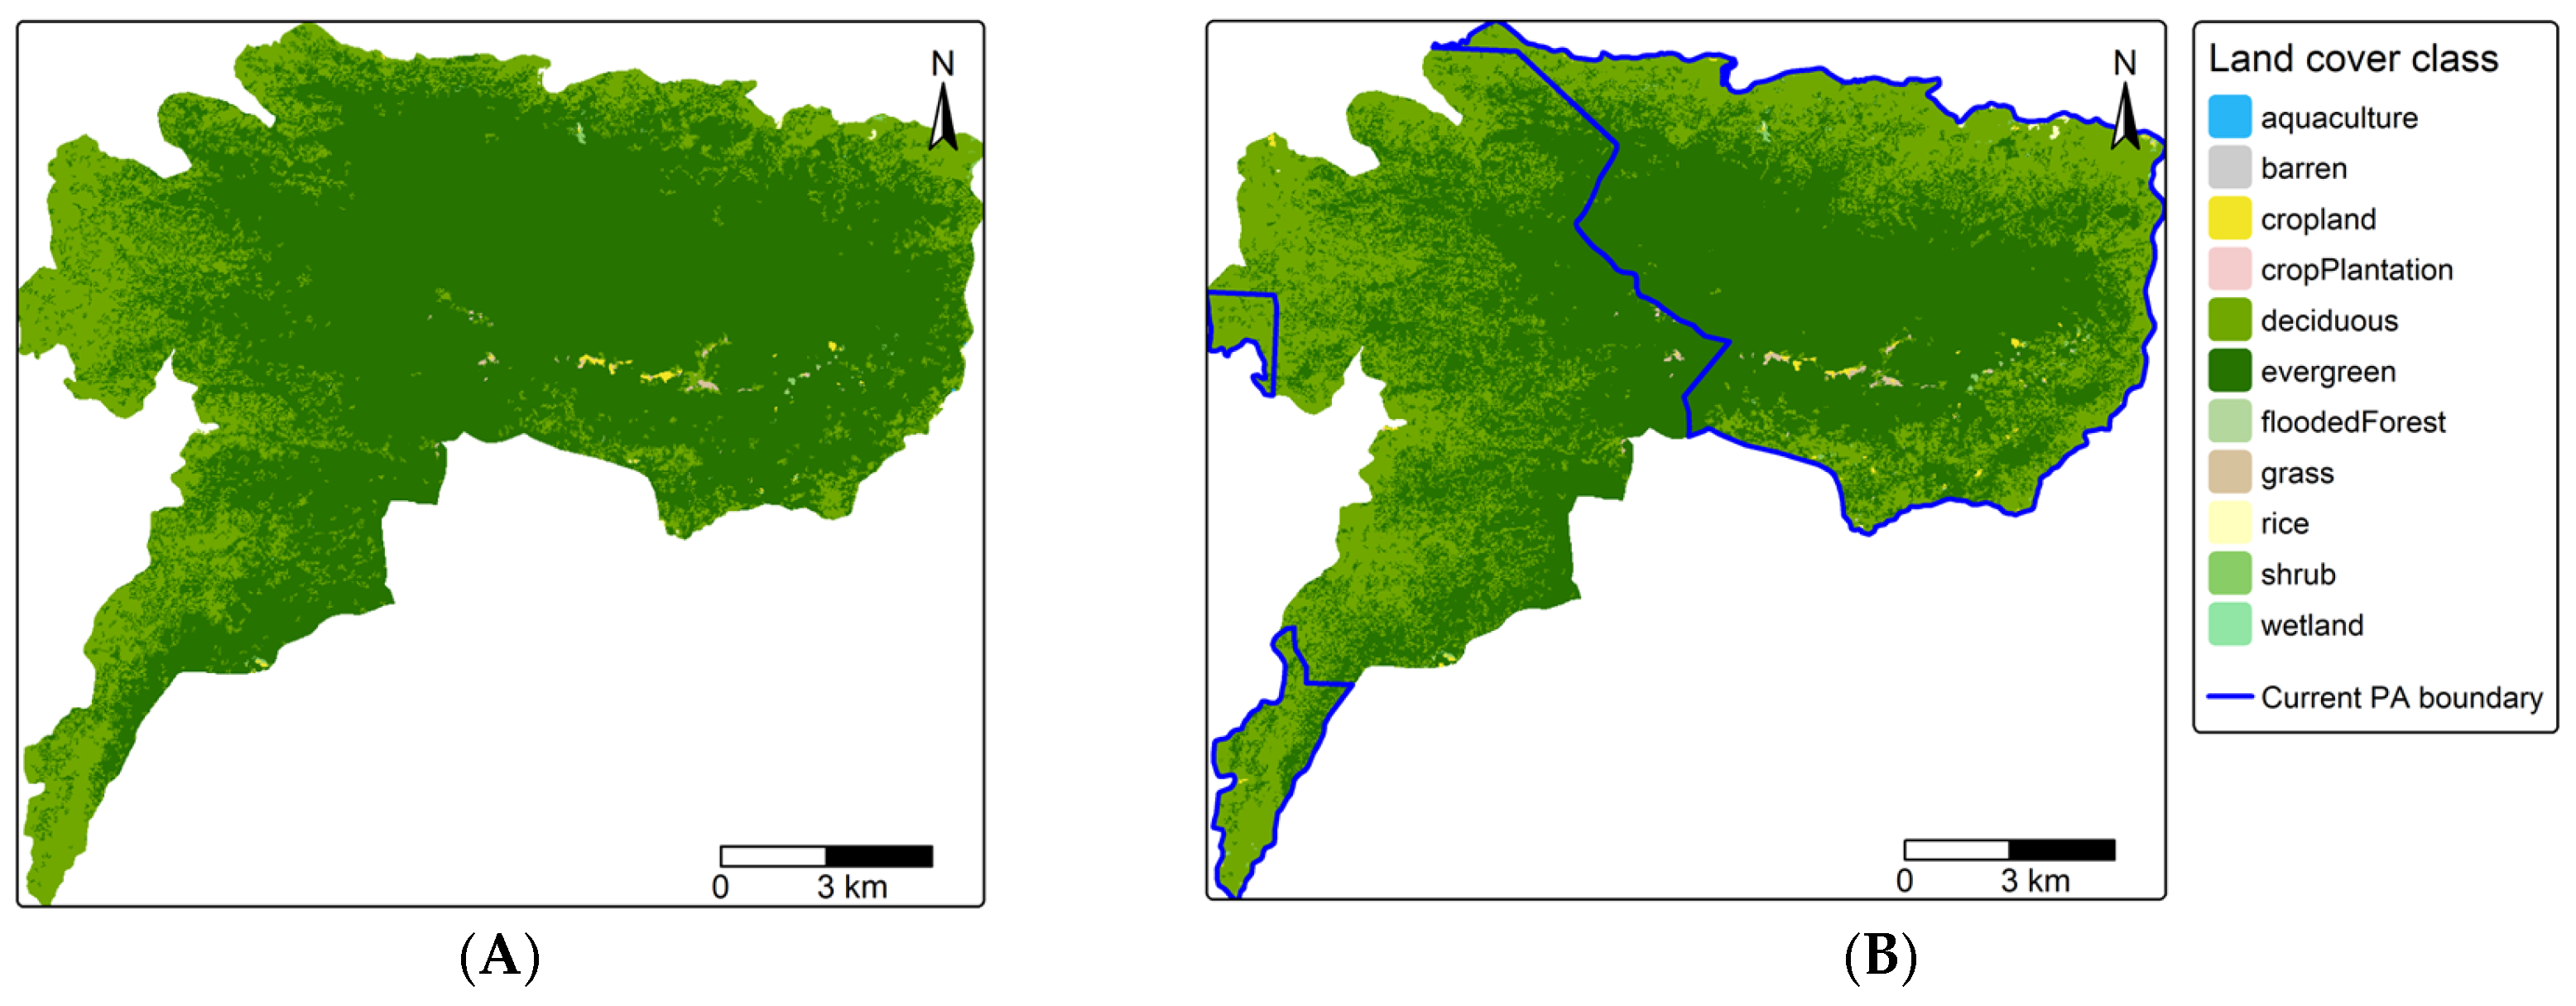
Pidaung Wildlife Sanctuary is situated in Kachin State and was established as a wildlife sanctuary in 1927 with a coverage of 703.95 km2 (Figure 1A). PA habitats mainly comprise deciduous and evergreen forests, agricultural areas, shrublands, and grasslands [36]. It enriches the fauna and flora, which includes 107 tree species, seven bamboo species, 65 medicinal plants, and 17 orchid species. Likewise, 28 mammals, 14 reptiles, and 140 bird species inhabit the PA [38]. PADDD events were enacted in 5.96 km2 from 1993 to 1997 and 575.92 km2 for 2001 and 2006, totalling 581.88 km2 of affected extent (losing 82.7% of its area). The current PA estate spans approximately 122.08 km2.
Pyin-Oo-Lwin Bird Sanctuary is located near Pyin-Oo-Lwin City in the Mandalay Region. It was designated in 1927 as a bird sanctuary spanning 126.91 km2 (Figure 1B). Its habitat was characterised by deciduous forest, hill, or evergreen forest, as well as cropland, grassland, and shrubland [36]. This PA experienced PADDD events from 1989 to 1992, accounting for 11.24 km2. However, an additional extent of 4.65 km2 was enacted between 2009 and 2020, with a total extent of PADDD being 15.89 km2 (a reduction of 12.5% of PA estate). The current extent of PA covers approximately 111.02 km2.
Shwe-U-Daung Wildlife Sanctuary was also established in 1927, encompassing 325.97 km2 in the Mandalay Region and Shan State (Figure 1C). It is dominated by evergreen and deciduous forests, as well as mountain grasslands [36]. Diverse species of 35 mammals, 60 birds, 20 reptiles, nine tortoises and/or turtles, and 75 butterflies have been recorded in this PA. In addition, 68 tree species, eight bamboo, four rattans, and 15 orchid species have been observed in the PA [31]. The extent of 149.94 km2 was enacted for PADDD in 2011, and an additional 0.05 km2 was subsequently enacted in 2015, totalling 149.99 km2 (a loss of 46.01% of the PA estate). Currently, this PA covers 175.98 km2.

2.3. Land Cover and Threatened Species Data

Land cover data were retrieved from the SERVIR-Mekong regional land cover portal from https://www.landcovermapping.org/en/landcover/, accessed on 10 January 2025 [36] in which 19 different classifications of land cover were provided with a 30 m spatial resolution of time series data from 2000 to 2023. The land cover maps were created through the agreed regional land cover typologies and definitions by multiple stakeholders and experts from the countries in the Mekong region. The reference data to train the primitive land cover layers were also collected from national partners [39]. Therefore, the land cover datasets accurately reflected the country’s land cover status and categories. We downloaded land cover data for the years 2000 and 2020 for Myanmar.
We reprojected and resampled both raster files to obtain the same extent (WGS84) and resolution (30 m) using the nearest neighbour method in ArcGIS Pro (Version 3.2.0). The most considerable extent of PADDD was enacted for Pidaung Wildlife Sanctuary in 2006 and for Shwe-U-Daung Wildlife Sanctuary in 2011, but before 2000 in Pyin-Oo-Lwin Bird Sanctuary. Due to the availability of land cover data starting from 2000, we used 2000 as the baseline year and 2020 as the period after the PADDD.
We retrieved the distribution ranges of threatened species from the Myanmar National Red List of Threatened Species, published by MONREC [37]. Among 1886 known species of mammals, birds, and reptiles in Myanmar, 185 species were assessed for the National Red List of Threatened Species. The species listed in the National Red List of Threatened Species, corresponding to the IUCN Red List categories of Critically Endangered (CR), Endangered (EN), and Vulnerable (VU), were considered in the analysis. We selected 14 threatened species distribution ranges based on their national Red List status and data availability. The shapefiles of species distribution ranges and the three studied PAs (including PADDD-affected and unaffected areas) were imported into ArcGIS Pro. All spatial data were projected to a common coordinate reference system (WGS84, EPSG:4326) to ensure the consistency of the analysis. The portions of species ranges were then extracted for each species, overlaid with shapefiles of PADDDed and unPADDDed areas using the Clip tool.
We calculated the proportion of the remaining range for threatened species in PADDDed areas compared to unPADDDed areas to estimate the status of threatened species in PADDDed areas for three PAs.

2.4. Analysis of Land Cover and Fragmentation

All shapefiles (original PA, PADDDed area, and unPADDDed area) and raster files were imported and clipped with shapefiles to analyse land cover and landscape pattern changes in RStudio (R version 4.3.1) [40]. Before landscape analysis, land cover raster data were reprojected to UTM zone 46N (EPSG: 32646) using the nearest neighbour method in the terra package [41]. We defined a patch as a cluster of connected cells classified with the same land cover and used “queen’s” rule (an eight-cell neighbourhood parameter) [42]. We used an edge depth of 30 m to calculate the core area by considering the distance from the edge. We assessed landscape metrics at both patch and class levels to calculate the number of patches, area of patches, mean patch area, and mean core area to quantify the level of fragmentation in each land cover class for three PAs [43,44,45]. Sankey plots were created using the “OpenLand” package in R to identify the changes in land cover class and composition between 2000 and 2020 [46]. Landscape metrics were evaluated with the “landscapemetrics” package in RStudio [43,47]. We compared land cover changes between 2000 and 2020 for the entire PAs using the non-parametric Wilcoxon signed-rank test, as the land cover data were categorical and of the same extent and resolution.
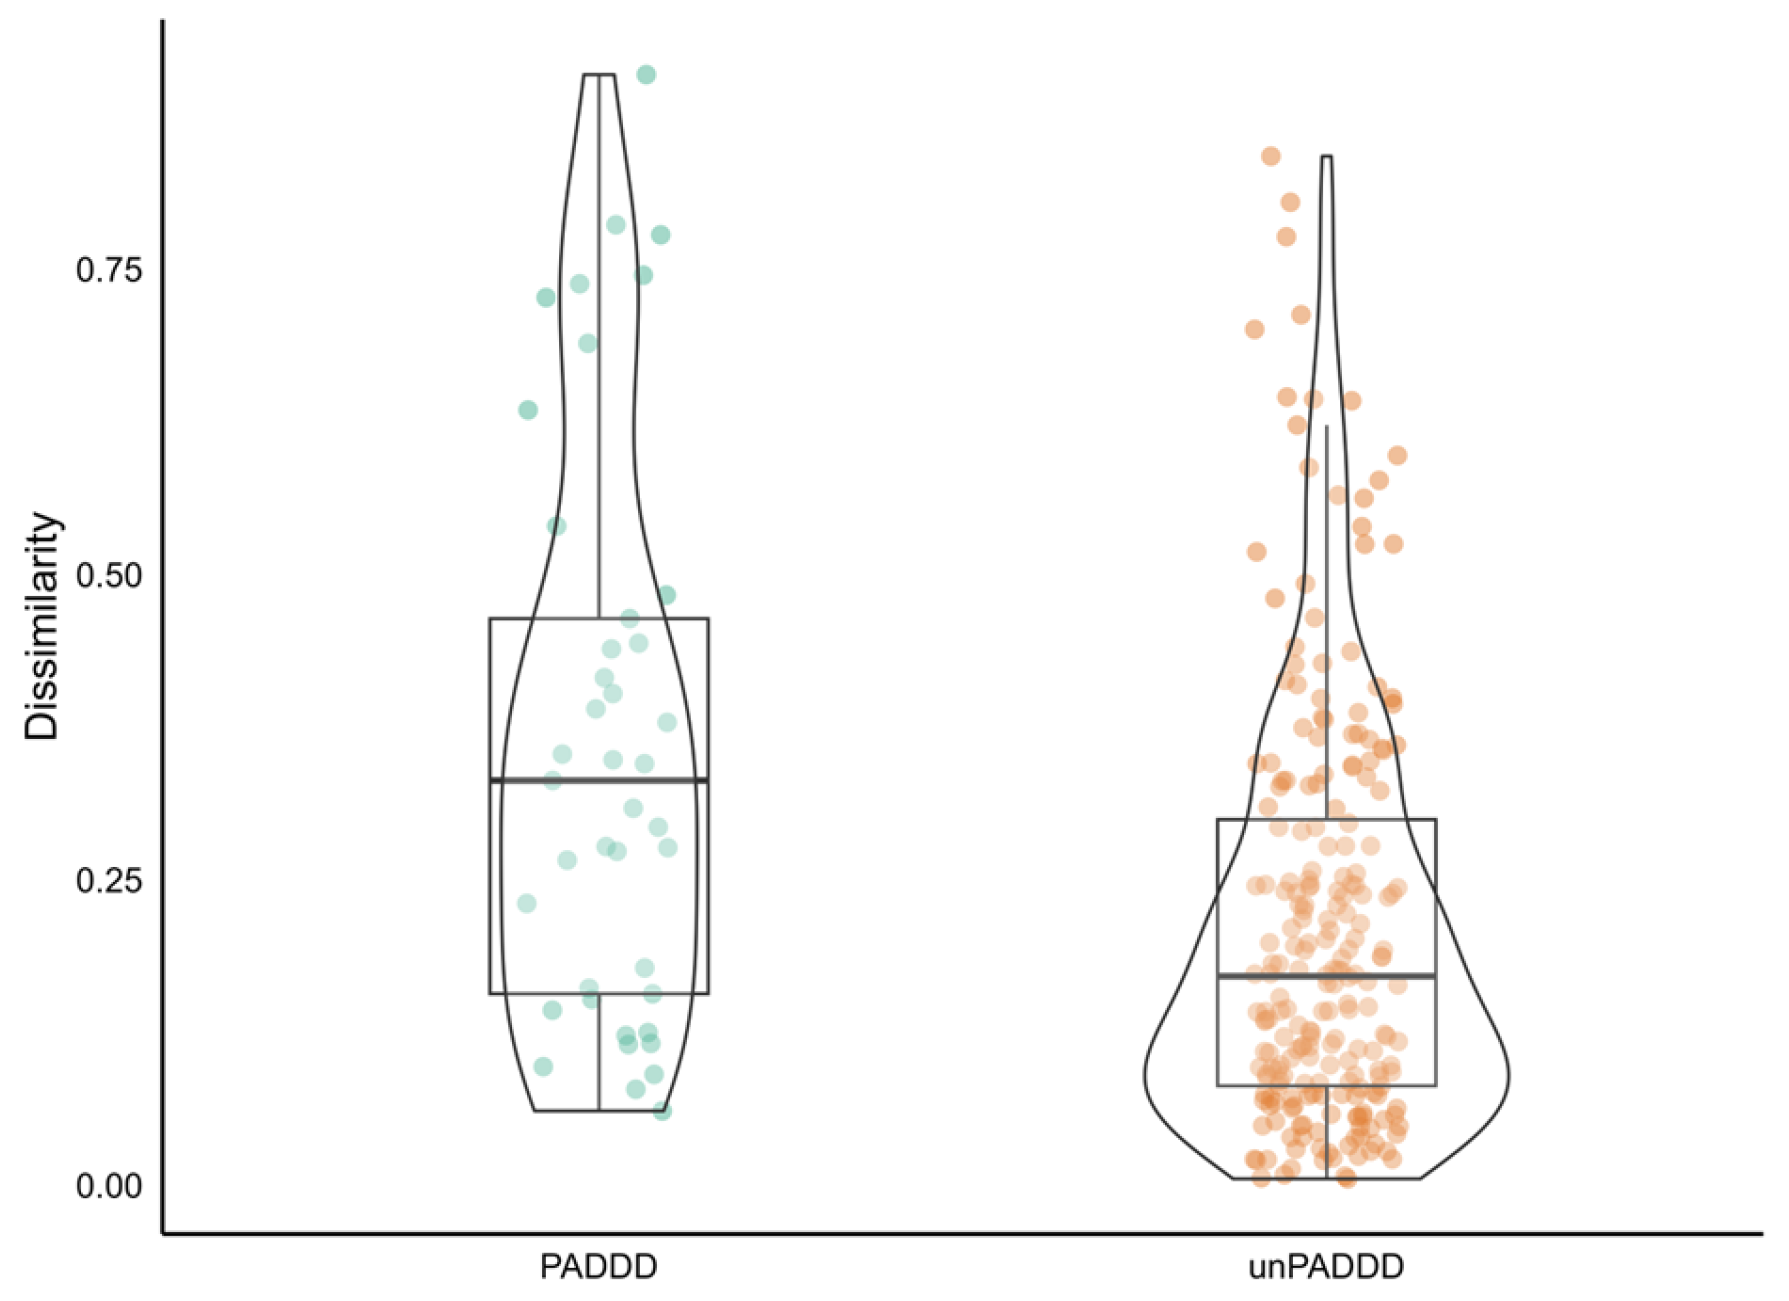
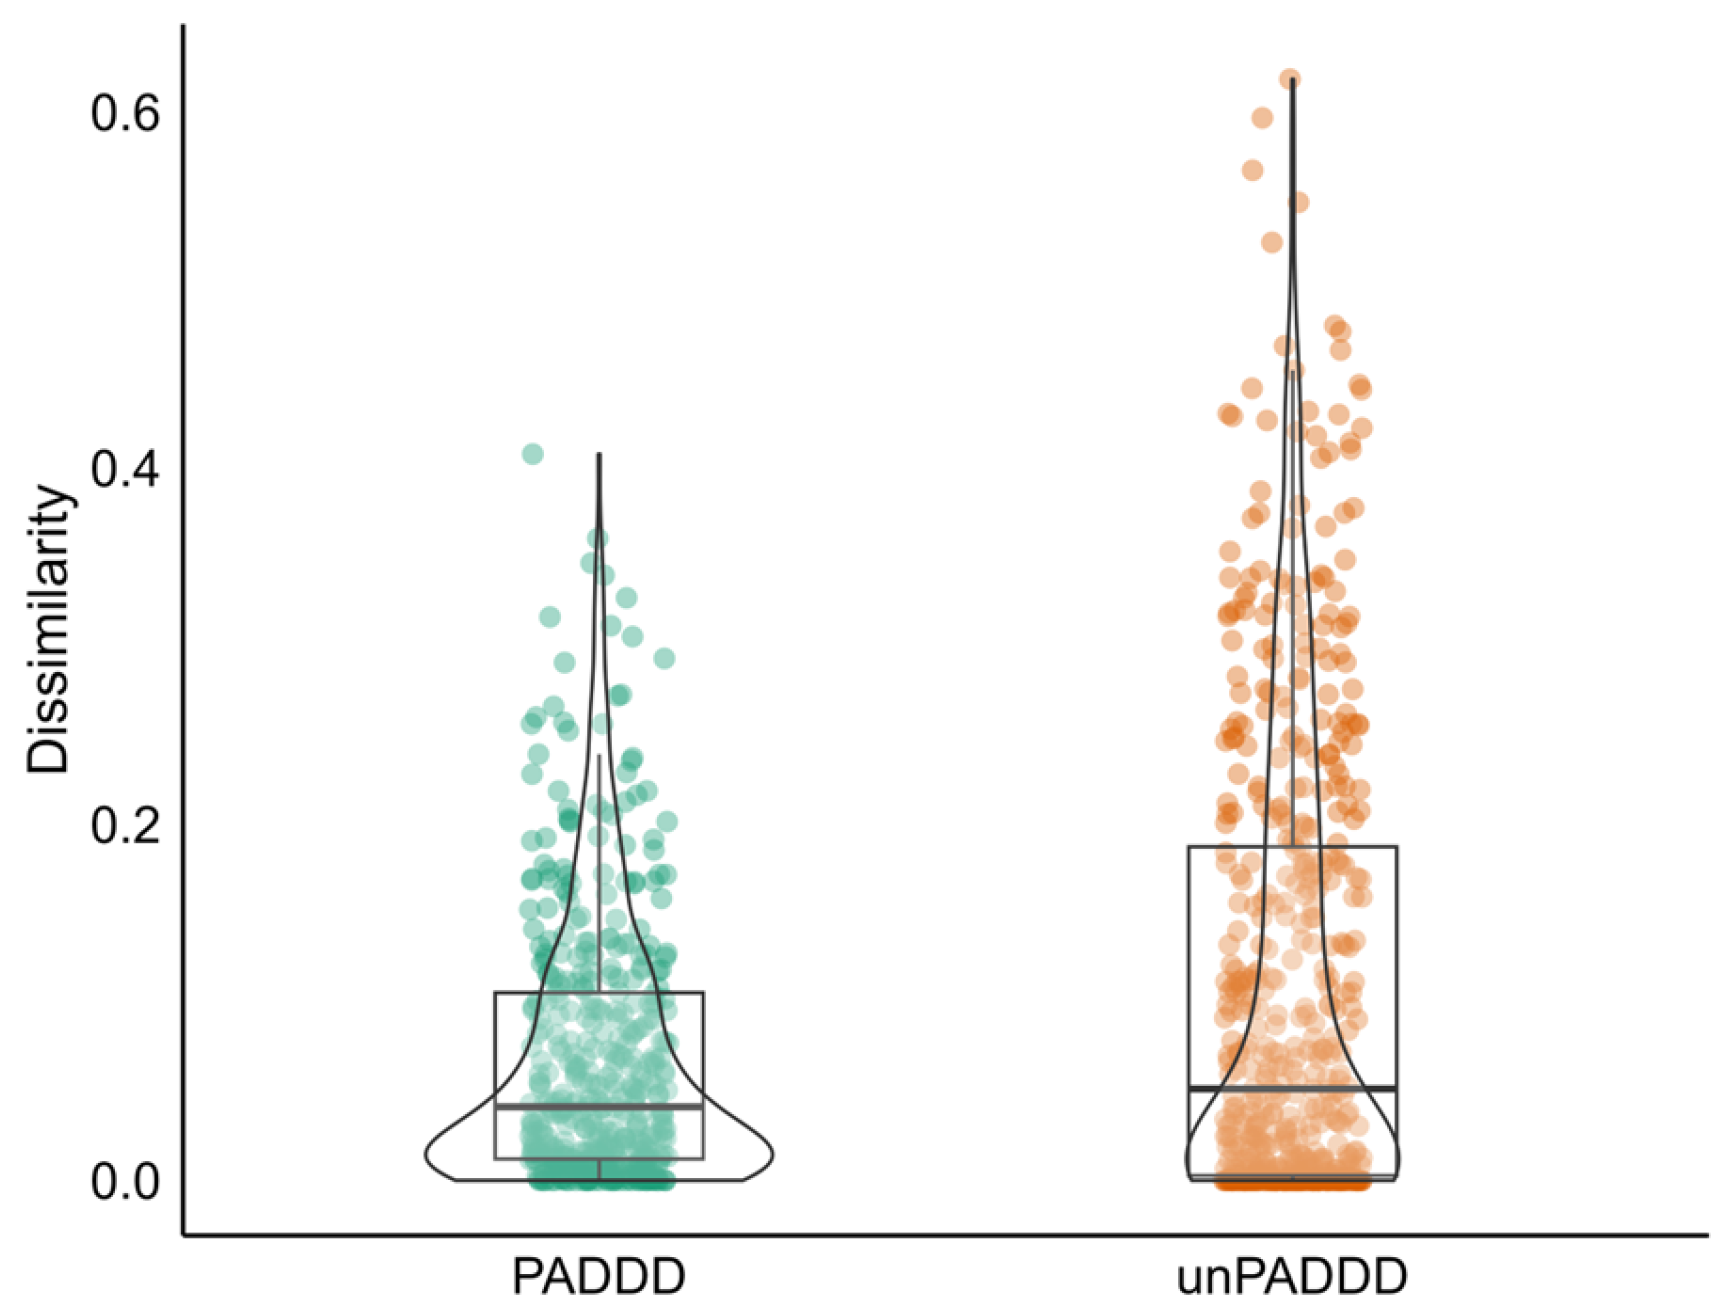
To identify the effect of PADDD events, we compared landscape pattern changes in PADDDed and unPADDDed areas between 2000 and 2020 using the lsp_compare() function from the “motif” package in R, in which the Jensen–Shannon distance was calculated to compare the landscape pattern changes [48]. The value of dissimilarity ranges from 0 to 1, with 1 indicating the highest change in landscape during the studied period. However, this dissimilarity value relies on the window argument (co-occurrence vector for square subareas). If the cell size for the window argument is too small, there will be a higher mean and variability of dissimilarity and vice versa. We therefore tested multiple window arguments (3, 5, 10, 20, and 50) to assess the effect of scale on dissimilarity estimates. We selected a 20 × 20 cell window as it may minimise variability (SD) while maintaining the local heterogeneity of land cover dissimilarity (Appendix A Figure A4). To assess the changes in landscape pattern between PADDDed and unPADDDed areas for two study periods, we calculated the Wilcoxon rank-sum test, as the dissimilarity values in each group are independent. RStudio was used to perform statistical analyses (R version 4.3.1) [40].

3. Results

3.1. Myanmar PADDD Events in the Global Context Between 1989 and 2020

Results reveal that 2186 instances of enacted global PADDD were found in 39 countries between 1989 and 2020. Of these, the number and affected areas of enacted events were highest for downgrades, accounting for 88.9% of affected areas (n = 1644), followed by downsizes (9.7%; n = 361) and degazettements (1.4%; n = 181) (Table 1). Globally, enacted PADDD events range from 0.1 to 740,275 km2, spanning 2,499,803 km2 worldwide (mean = 1143 ± 16,654.79). The Oceania region experienced the highest number and extent of enacted PADDD events, with Australia accounting for 94.01% of these instances. North America experienced the highest extent of the average area affected per PADDD event (Table 1). In contrast, Europe experienced the fewest reported PADDD events, which occurred only in the United Kingdom. The majority (74.8%) of global PADDD events occurred between 2010 and 2019, accounting for 87.9% of the total affected areas. Proximate causes for enacted global PADDD events varied across the countries. Three proximate causes contributed to 78.5% of the affected areas, with “multiple proximate causes” accounting for 40.4% (n = 62), followed by “subsistence” at 21.02% (n = 260) and “infrastructure” at 17.1% (n = 1156), respectively.

3.2. Spatiotemporal Patterns and Causes of Enacted PADDD Events in Myanmar

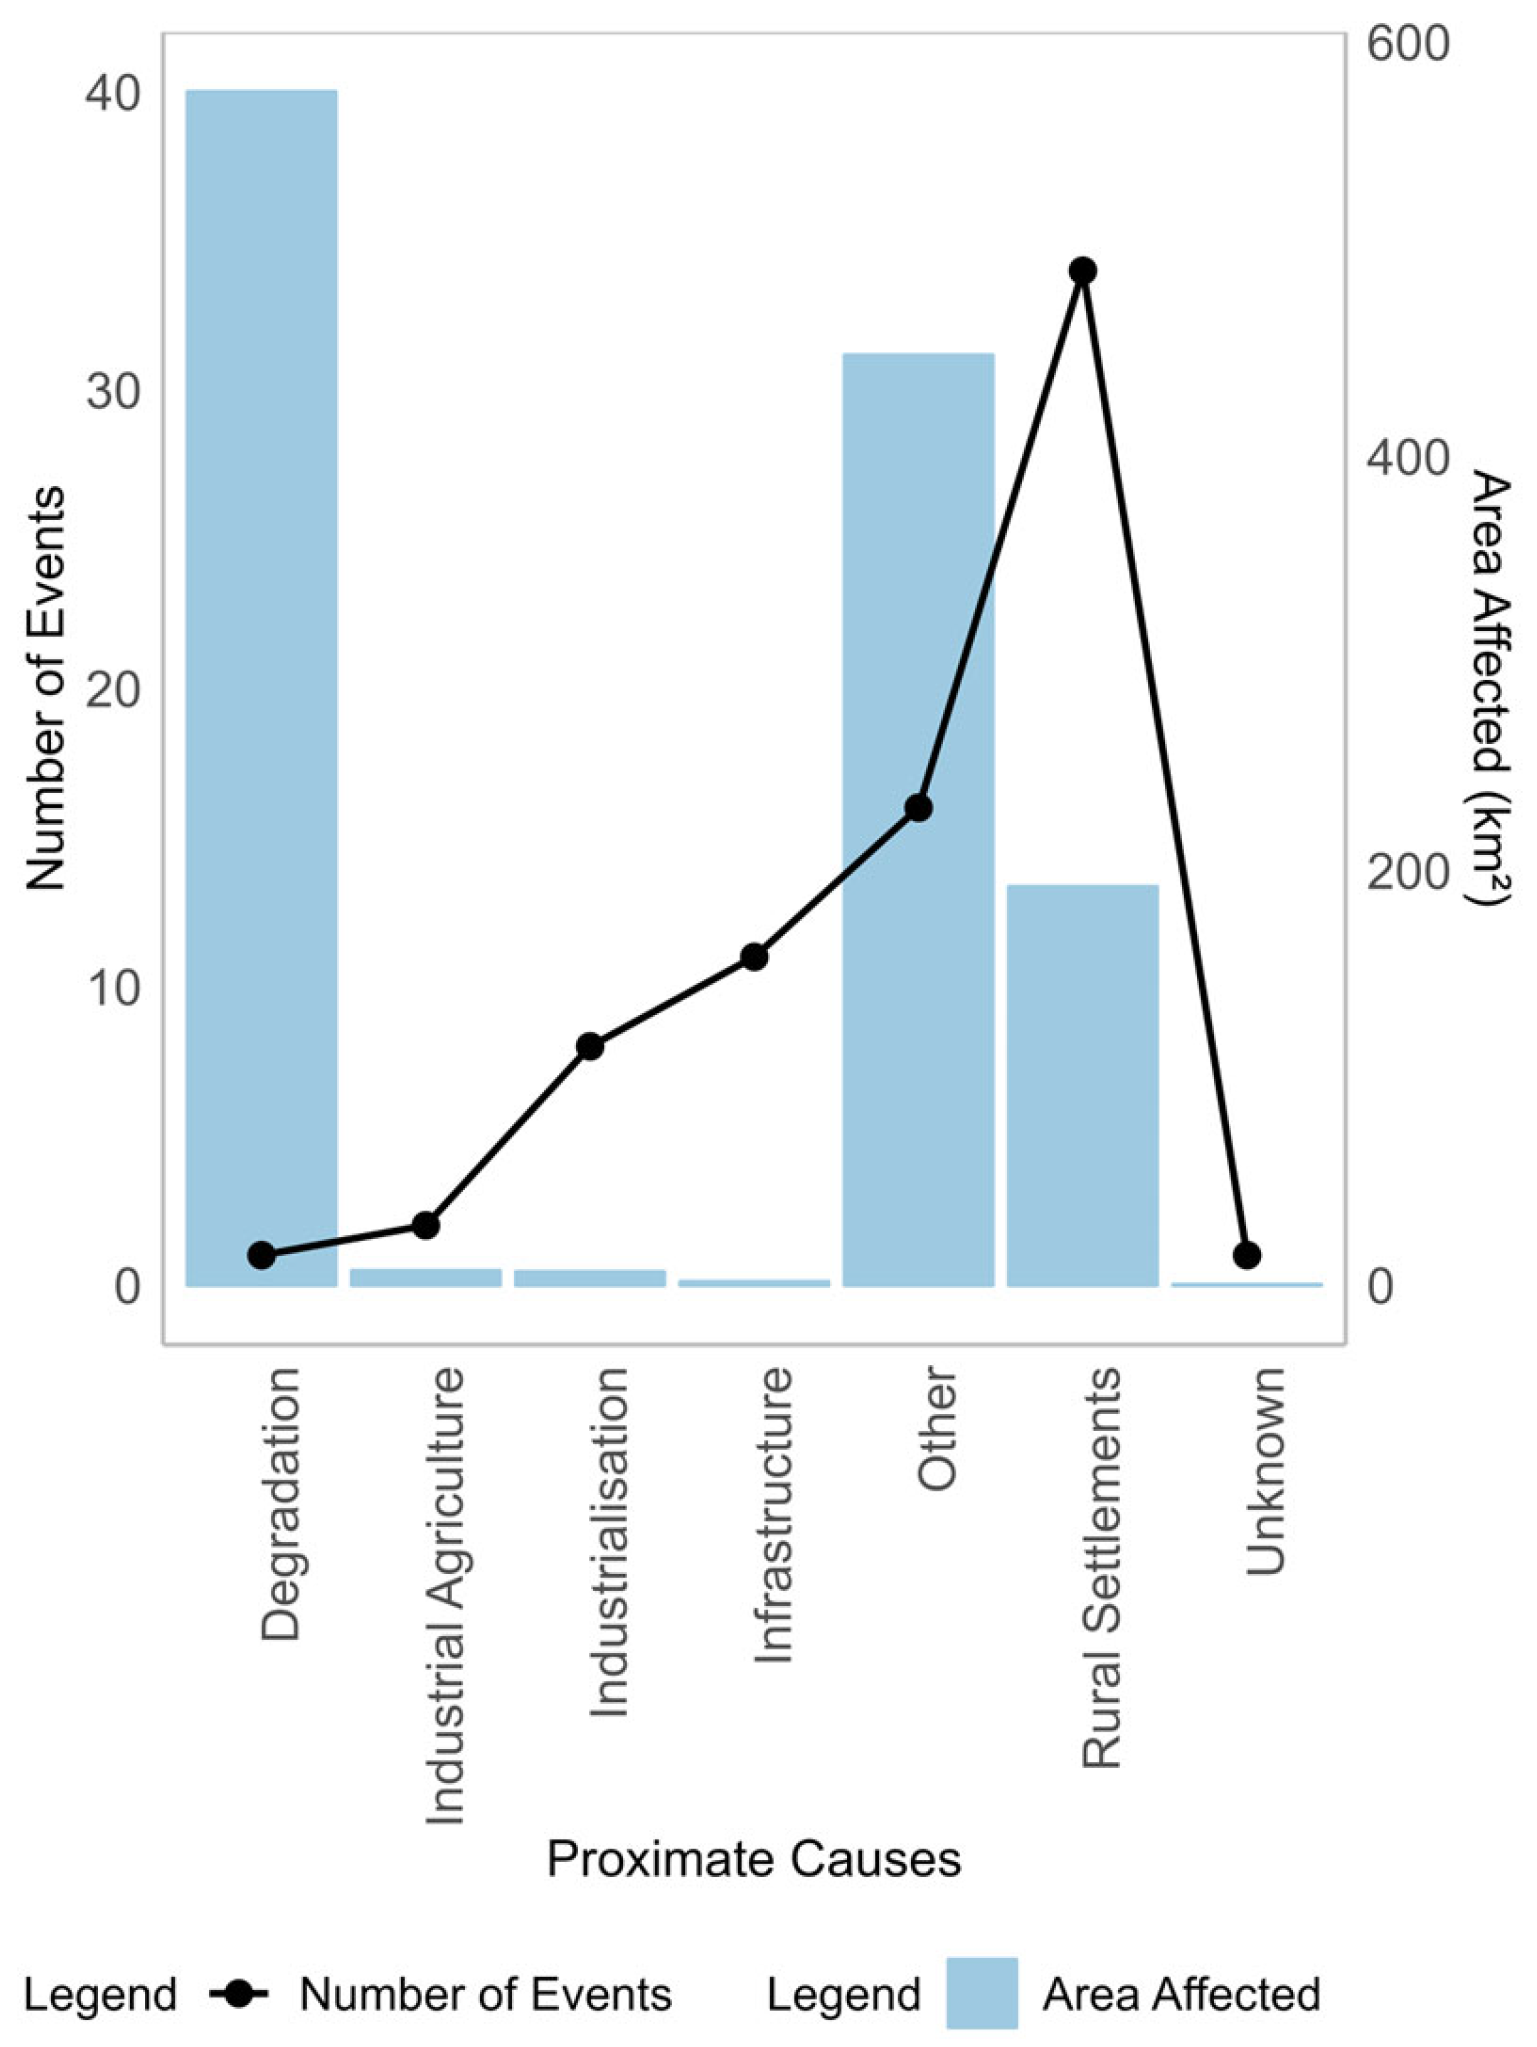
From 1989 to 2020, 73 events were enacted in 20 Myanmar PAs for downsizing, responsible for 1231.4 km2 (losing approximately 3% of the total area of Myanmar PAs). The affected areas in Myanmar represented 1.5% of documented enacted PADDDed areas in Asia. The extent of enacted PADDDed areas ranged from 0.0015 to 575.83 km2 (mean = 16.78 ± 73.12). The number of enacted PADDD events was highest in Inlay Lake Wildlife Sanctuary, followed by Pyin-Oo-Lwin and Taunggyi Bird Sanctuaries, accounting for n = 12, n = 11, and n = 7 events, respectively (Figure 2A). However, Pidaung Wildlife Sanctuary experienced the most extensive loss, with 82.7% of its area being PADDDed, equivalent to 575.83 km2. Alaungdawkathapa National Park and Shwe-U-Daung Wildlife Sanctuary had the second- and third-most-reduced PA extent, at 198.82 km2 (12.2% of its area) and 149.99 km2 (46% of its area), respectively. Periodically, the number of enacted PADDD events was highest in 2015, 2013, and 2011 (n = 18, n = 11, and n = 8 events, respectively). However, the extent peaked in 2006, accounting for 575.83 km2, followed by 284.13 km2 in 2010 and 151.41 km2 in 2011 (Figure 2B). Proximate causes were highest in number for rural settlement (n = 34), followed by other proximate cause (n = 16) and infrastructure (n = 11) (Figure 3). However, degradation of PA ecosystems accounted for the highest affected area (46.8%), followed by other (36.5%) and rural settlements (15.6%).

3.3. Comparison of Land Cover and Landscape Pattern Between 2000 and 2020 for Three PAs

Between 2000 and 2020, the total number of patches increased from 3821 to 7158 patches in Pidaung and from 2272 to 3673 patches in Shwe-U-Daung wildlife sanctuaries. In contrast, the patch number did not significantly change in Pyin-Oo-Lwin Bird Sanctuary (from 2435 to 2412) (Table 2).
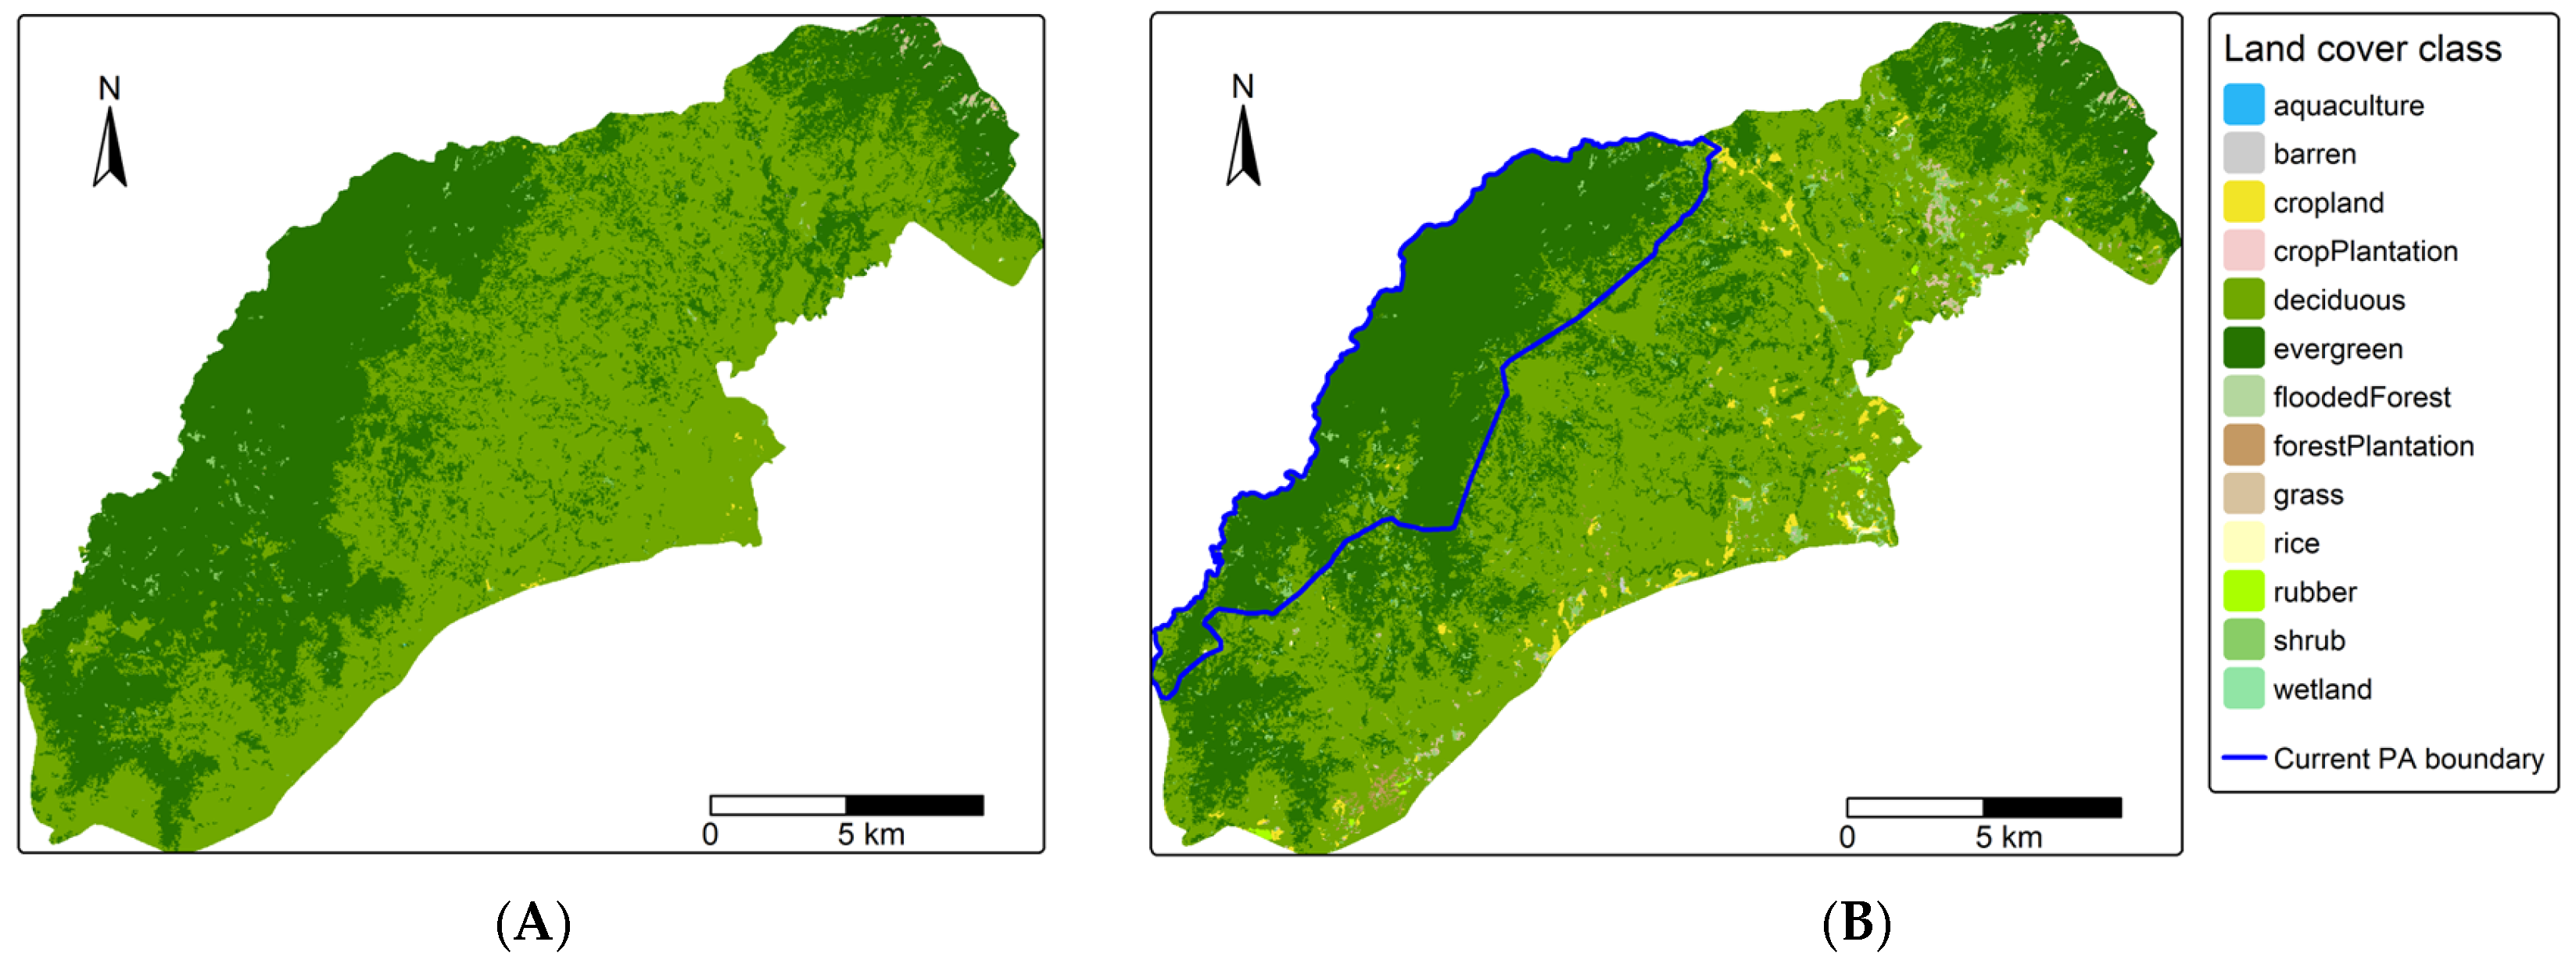
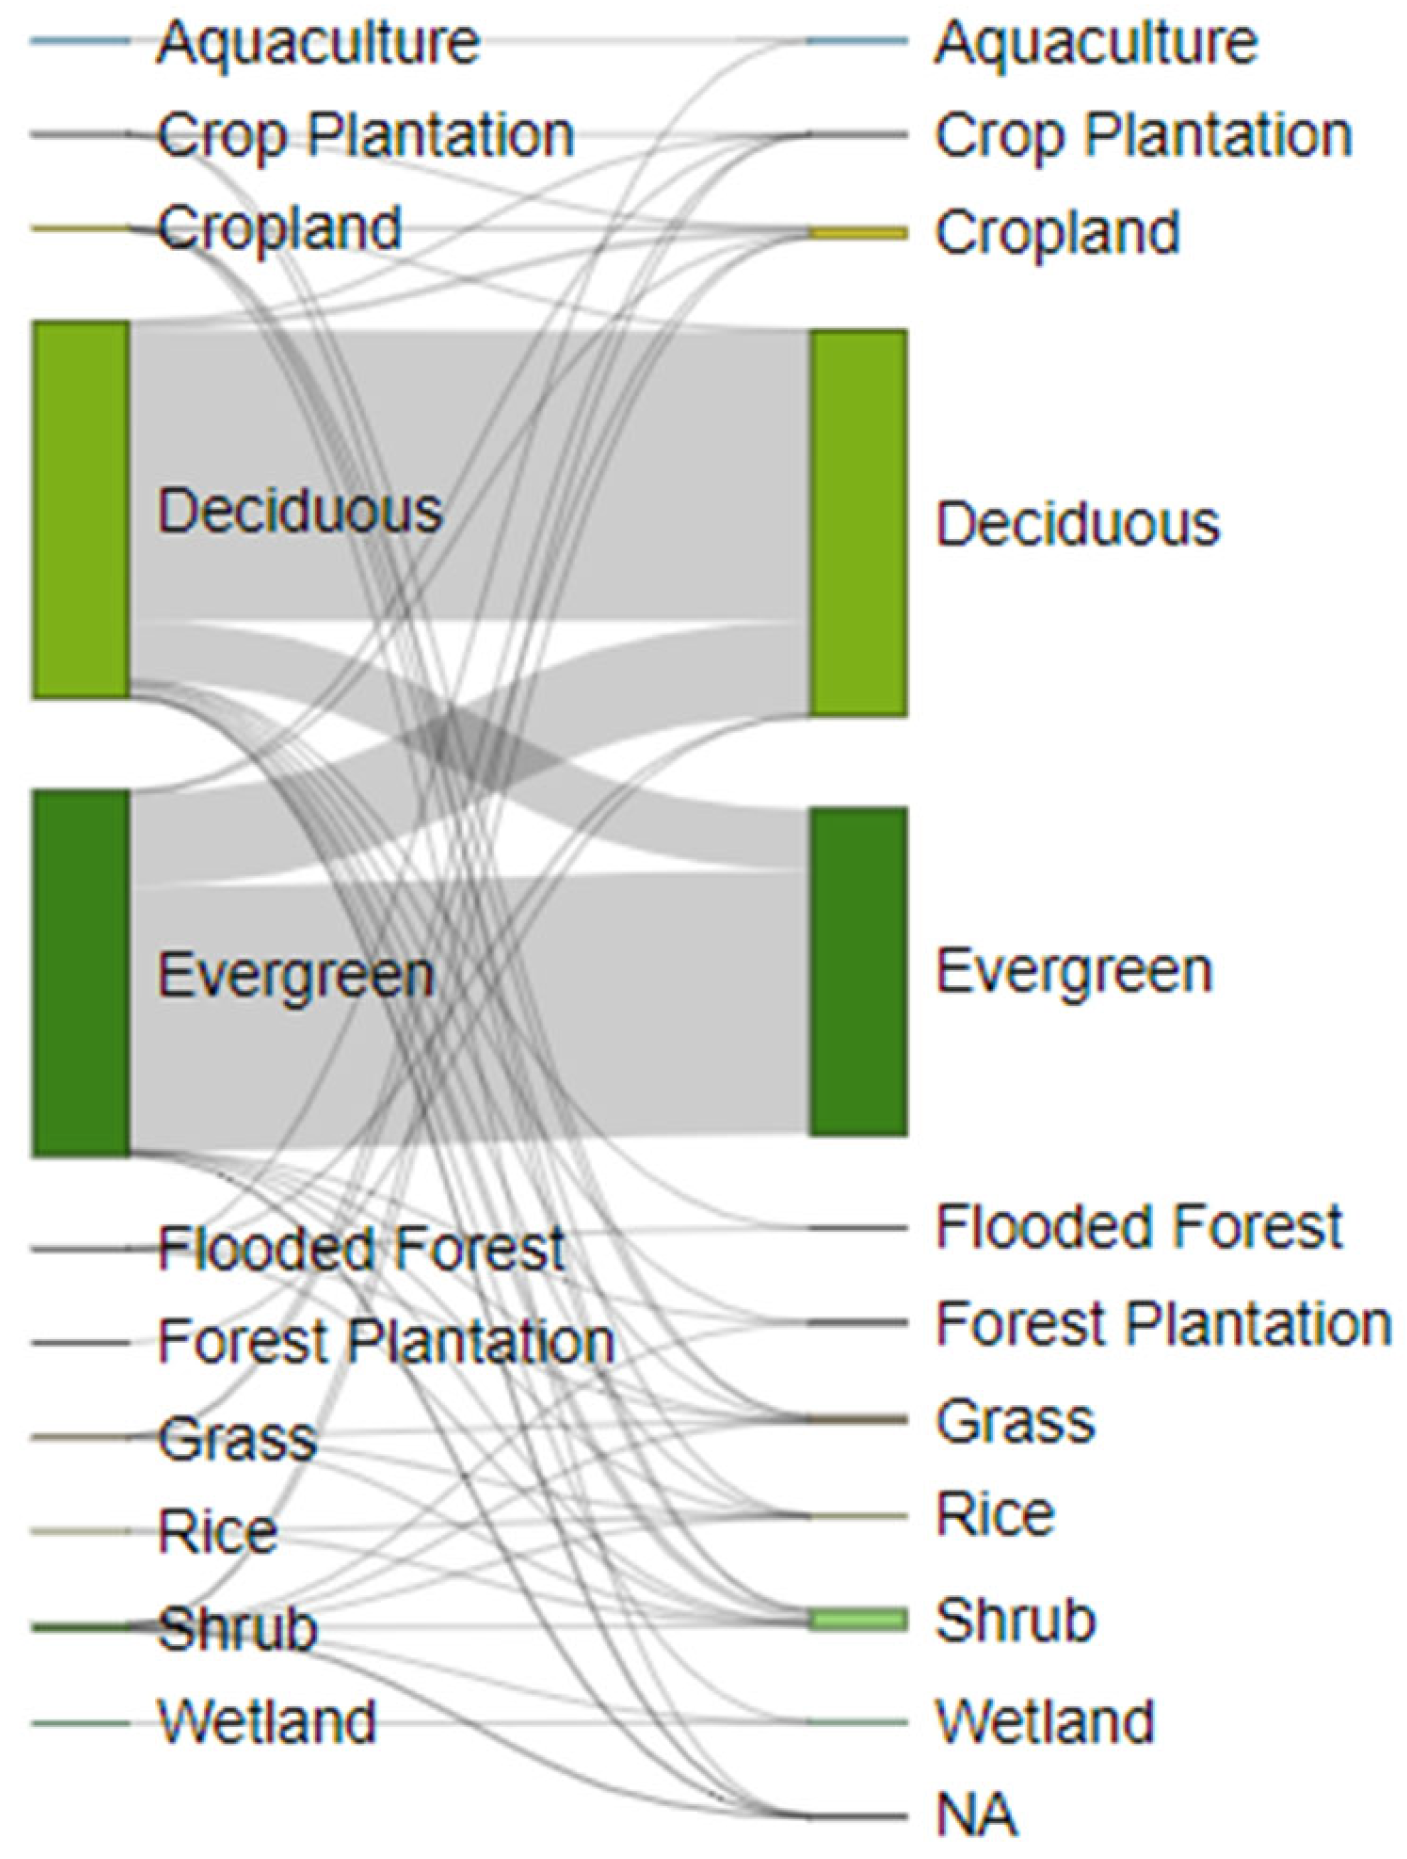
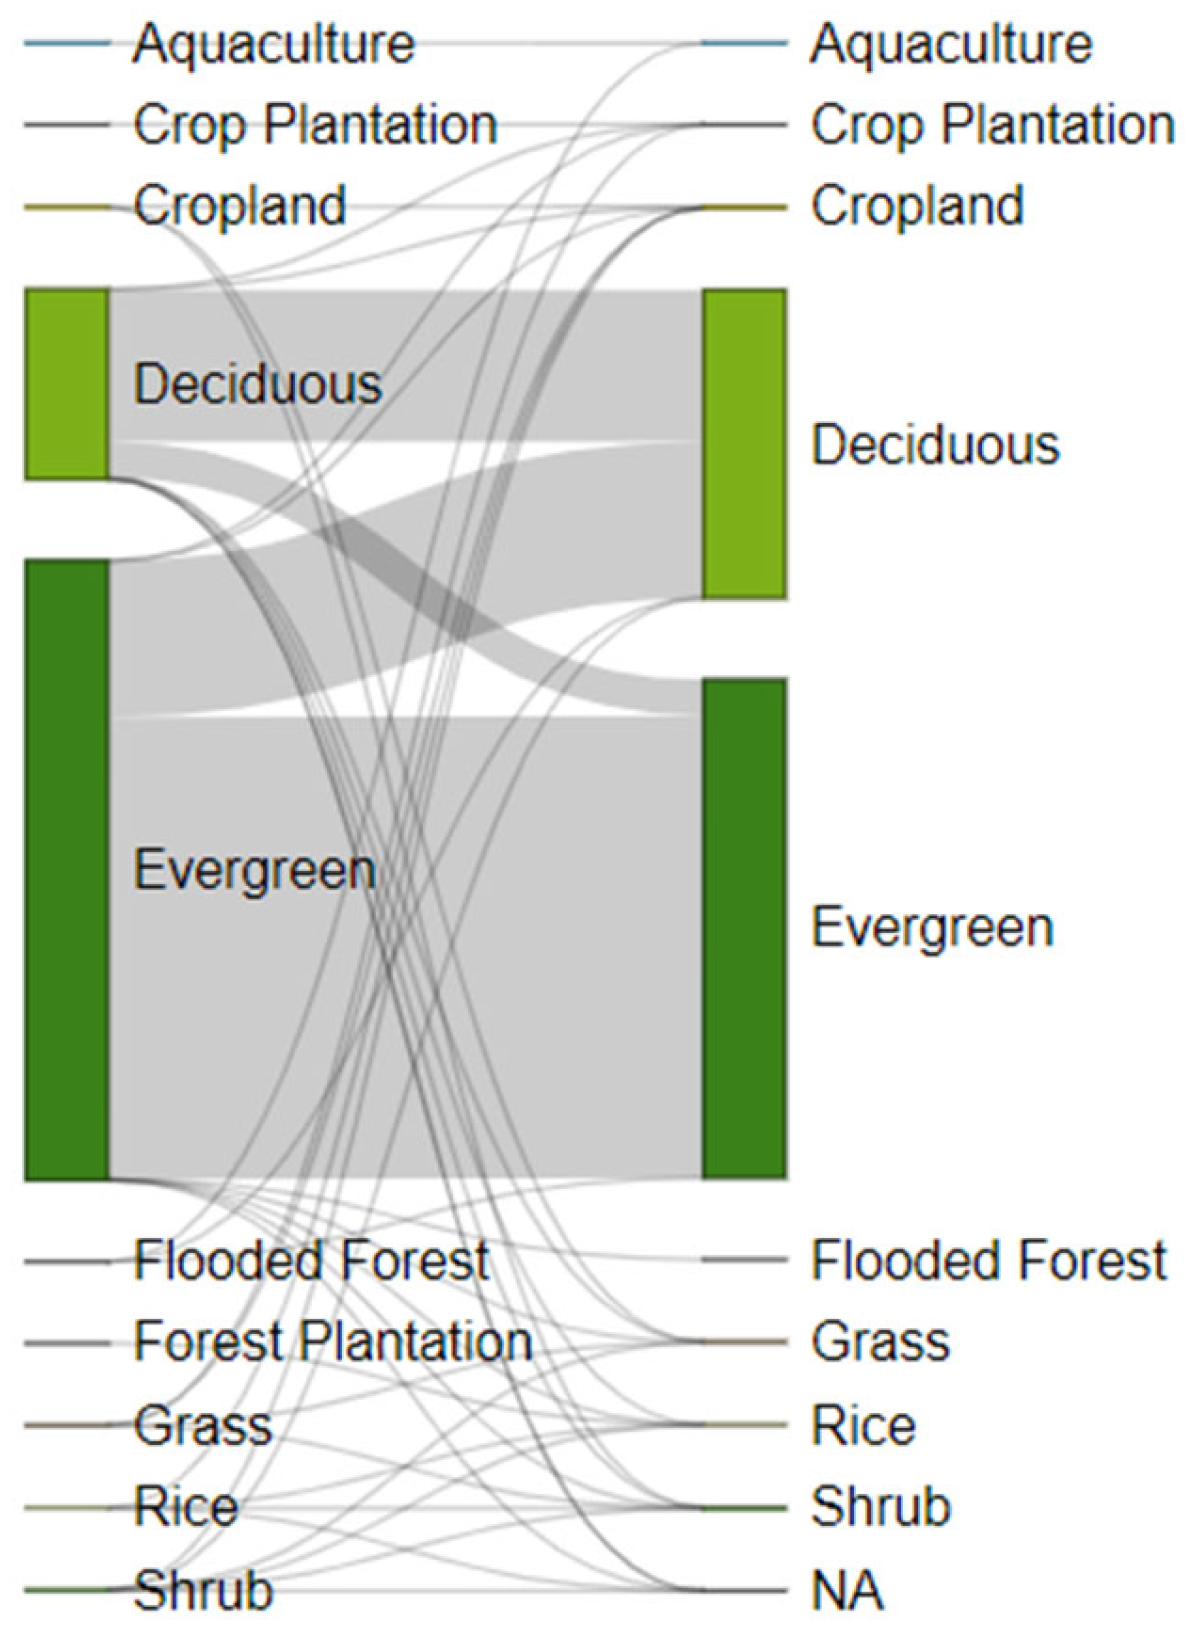
Between 2000 and 2020, land cover changes differed significantly in Pidaung Wildlife Sanctuary (W = 2.12 × 10¹¹, p < 0.001). Both deciduous and evergreen forests dominated the entire area of PA in 2000 (Figure 4A). However, the deciduous forest was dominant, while the evergreen forest degraded into other land covers, indicating an overall decline rate of 4% in both forests in 2020 (Figure 4B and Figure 5). Agricultural areas (cropland, crop plantation, and rice) rose from 42.41 ha in 2000 to 694.03 ha in 2020, and degraded land (barren, grass, and shrub) also increased from 399.64 ha to 1652.47 ha (Table 2). Despite the forest covering most of Pidaung, the mean patch area and core area show that deciduous and evergreen forests were highly fragmented between 2000 and 2020. The comparison of land cover landscape pattern changes for the two periods shows that there were significant changes (W = 3.63 × 10⁵, p < 0.001, effect size r = 0.52, 95% CI [0.47–0.57]) between PADDDed and unPADDDed areas (Figure 6).
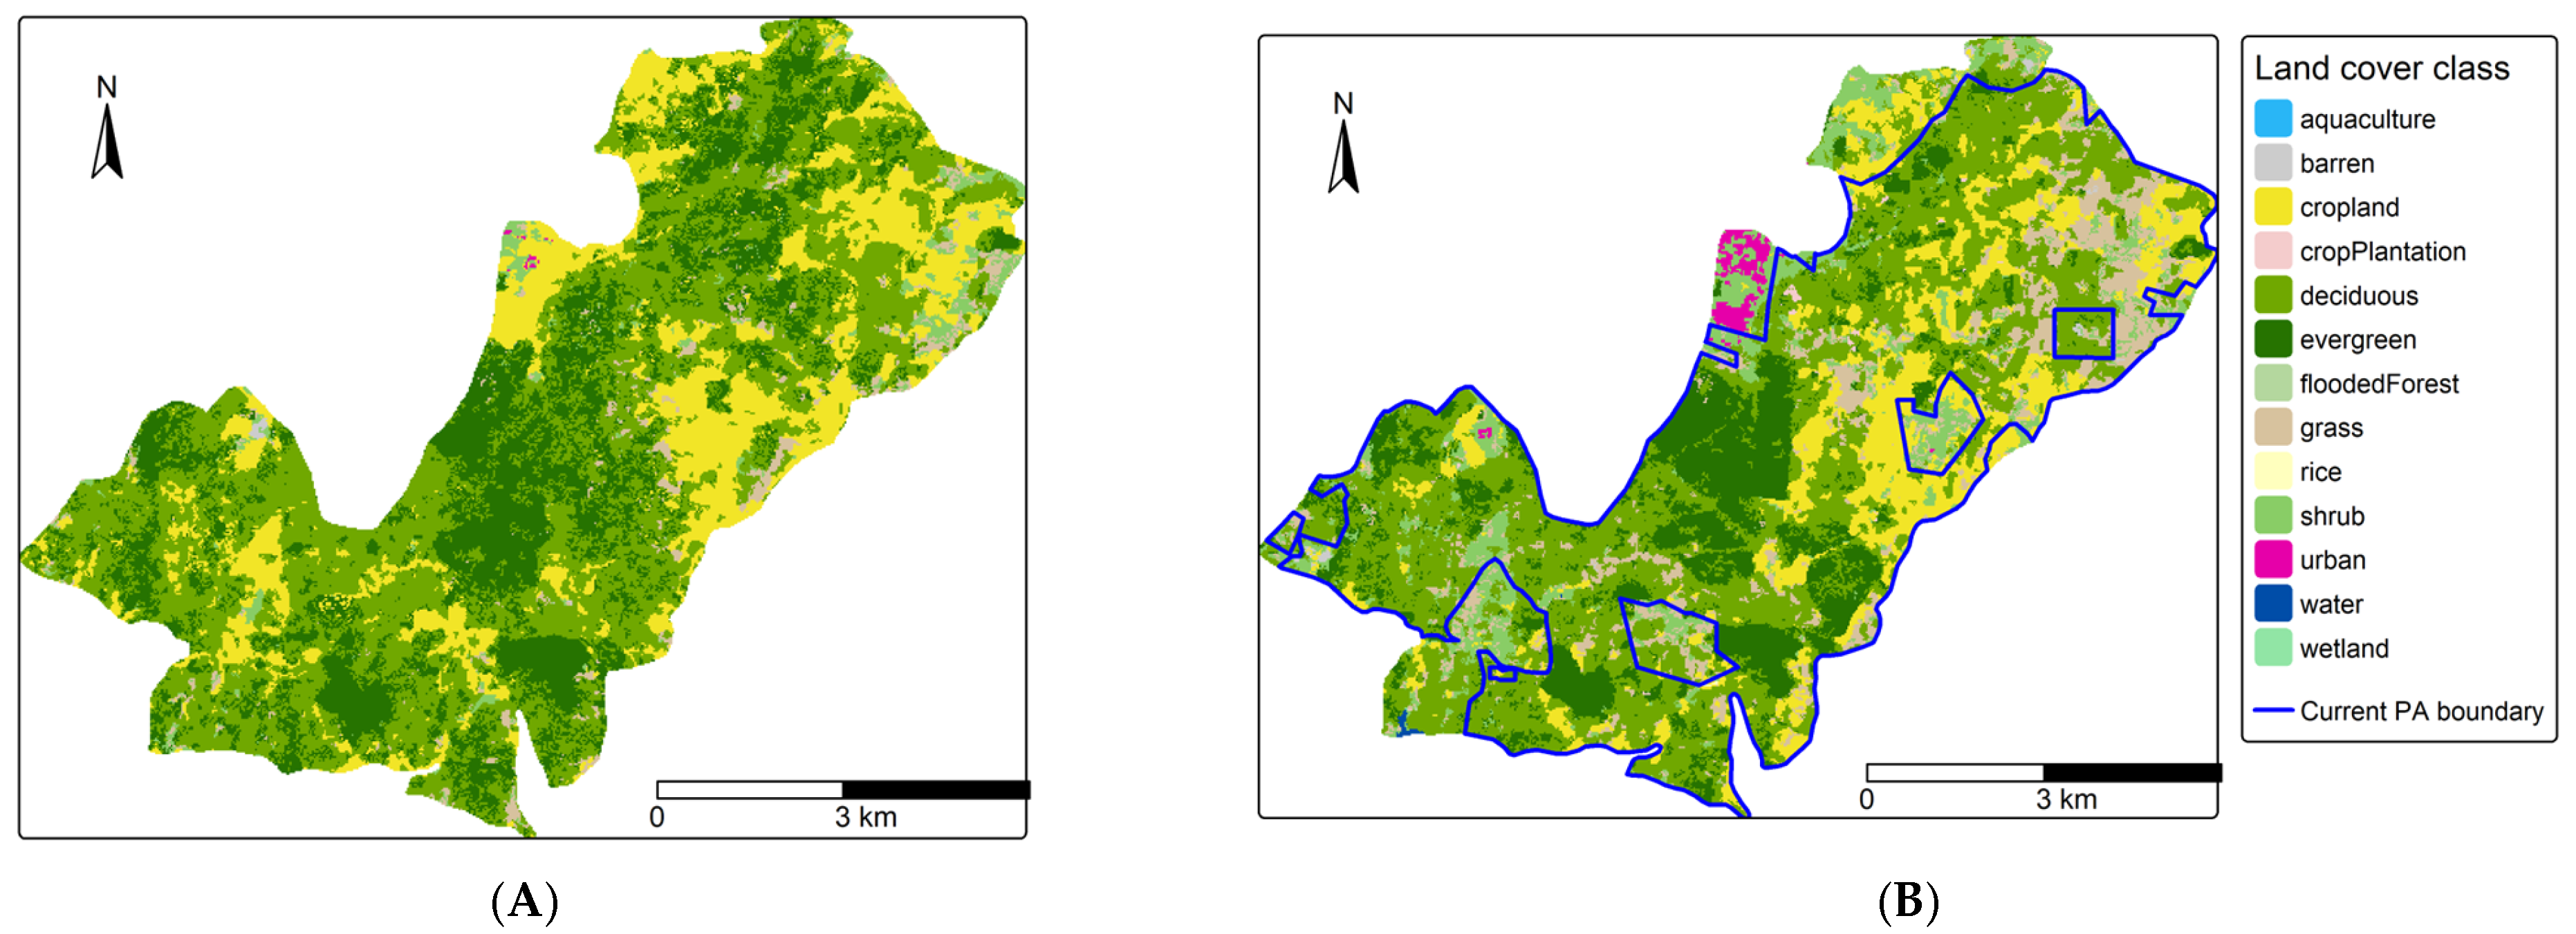
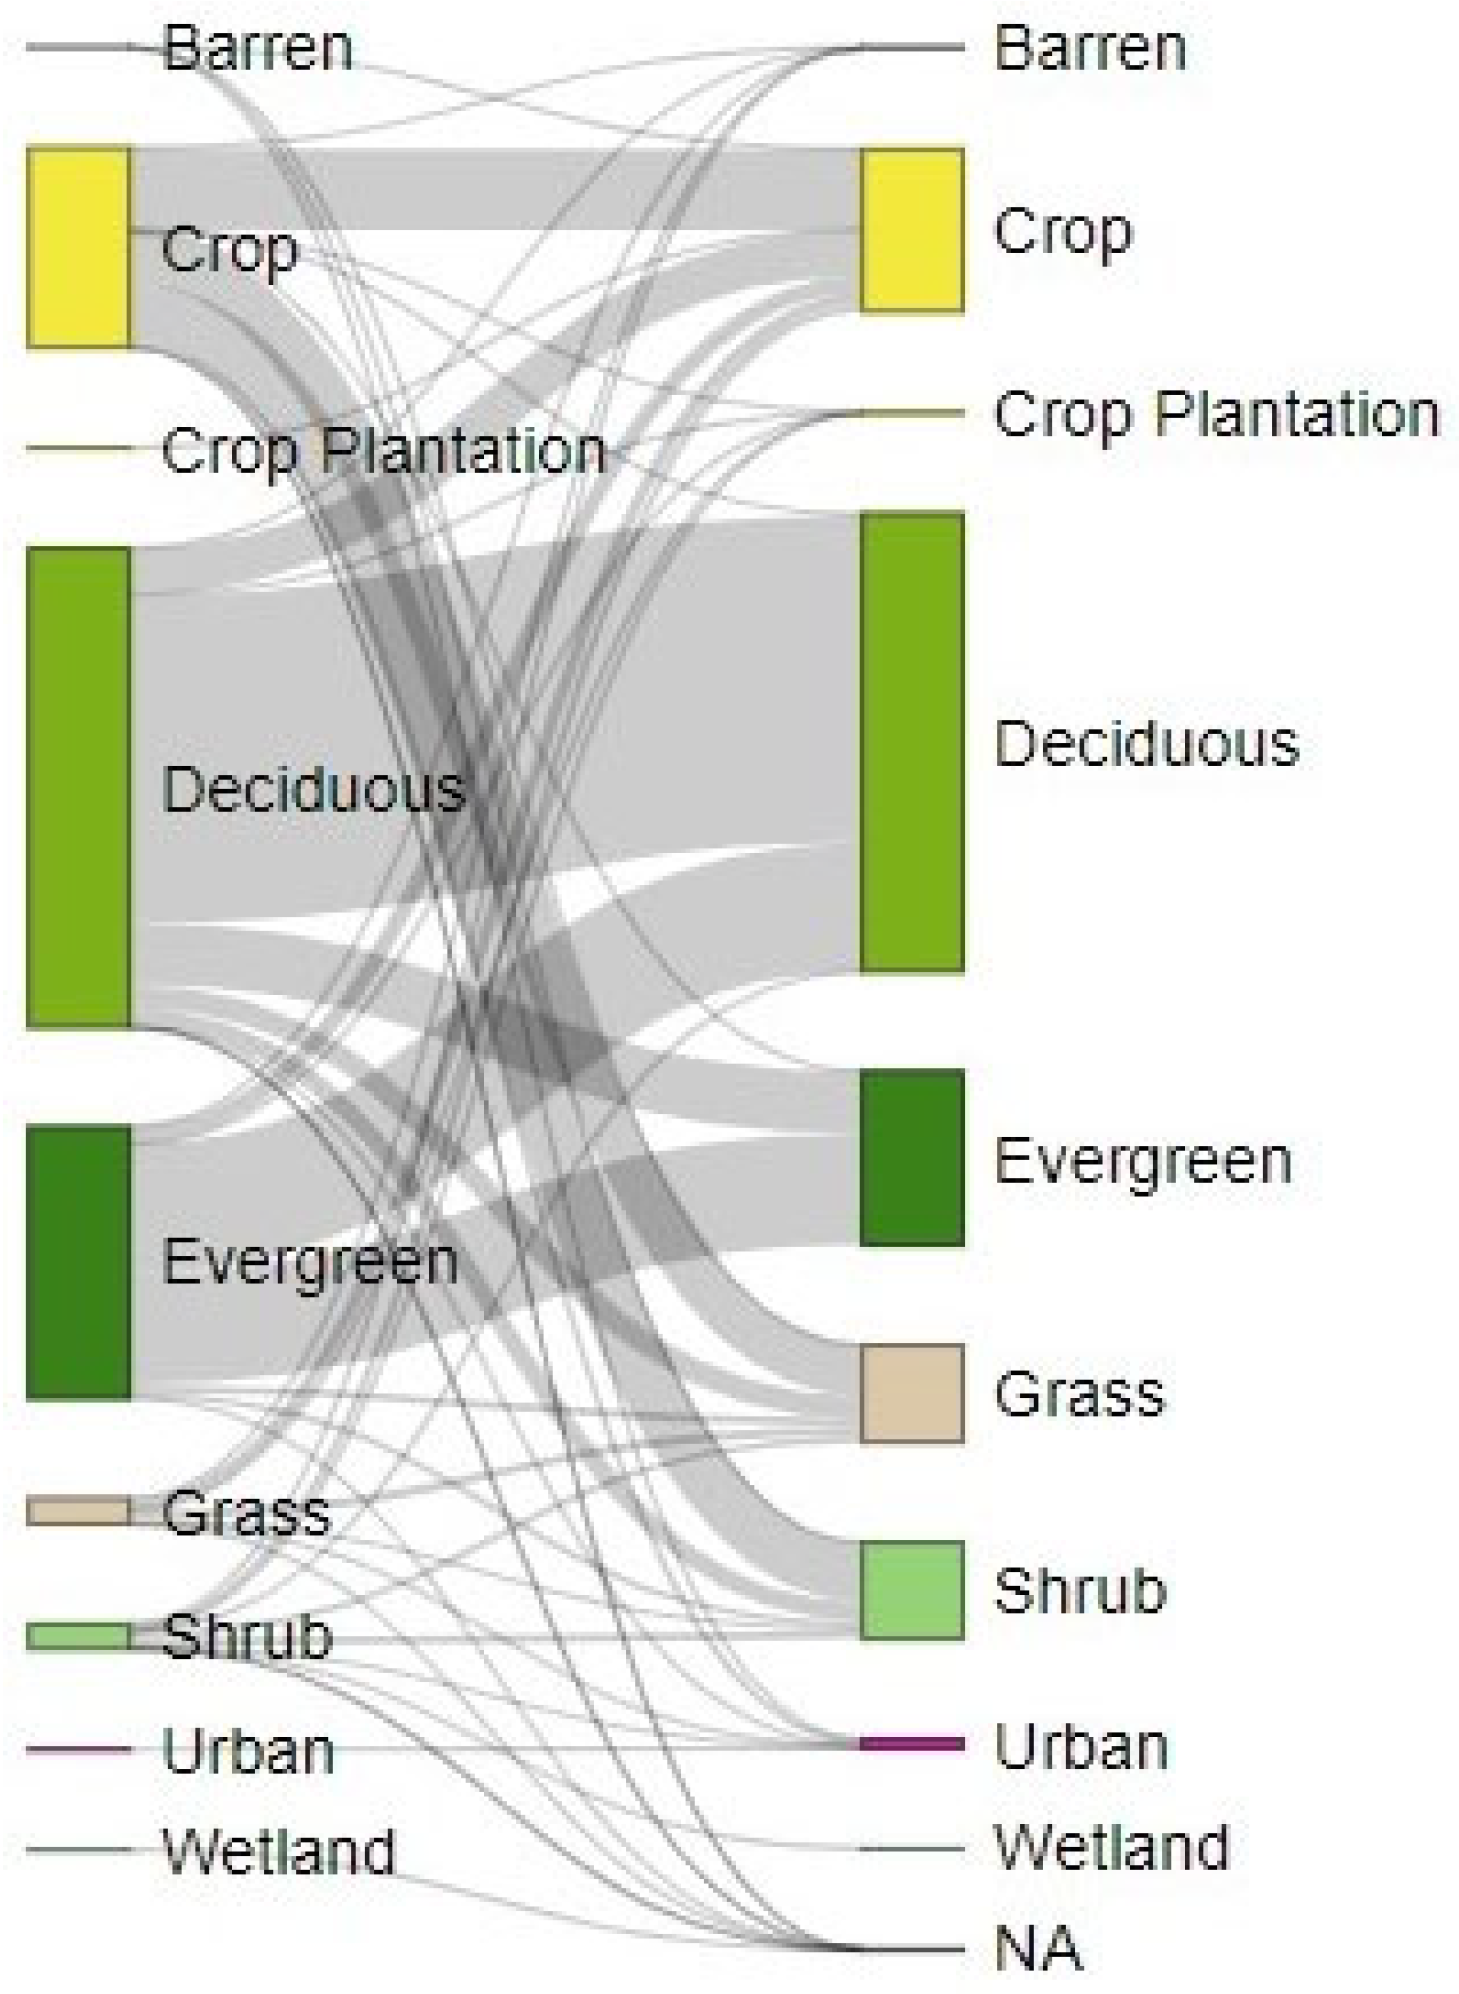
In Pyin-Oo-Lwin Bird Sanctuary, there were significant differences in land cover changes between 2000 and 2020 (W = 5.19 × 10⁹, p < 0.001) (Figure 7A,B). Urban areas rose from 3.68 ha in 2000 to 81.62 ha in 2020. Subsequently, degraded land (barren, grass, and shrub) increased from 455.27 ha to 1760.35 ha (Figure 8; Table 2). Agricultural areas (cropland, crop plantation, and rice) declined from 1800.31 ha to 1479.14 ha. Likewise, forests (both deciduous and evergreen) decreased in size from 6758.89 ha to 5688.28 ha. The mean patch and core areas, except for the barren areas, showed more contiguous land cover classes (Table 2). The analysis of landscape pattern changes revealed significant changes in land cover between PADDDed and unPADDDed areas (W = 6.66 × 10³, p < 0.001, effect size r = 0.42, 95% CI [0.25–0.57]) between the two study periods (Figure 9).
The land cover status significantly changed in Shwe-U-Daung Wildlife Sanctuary between 2000 and 2020 (W = 8.96 × 10¹⁰, p < 0.001) (Figure 10). Agricultural areas (cropland, crop plantation, and rice) increased from 64.94 ha in 2000 to 125.15 ha in 2020 (Table 2). Degraded land (barren, grass, and shrub) expanded from 87.77 ha to 145.52 ha. Generally, forests (both deciduous and evergreen) lost 121.63 ha, and the evergreen forests shrank and transformed their extent into deciduous forests (Figure 11; Table 2). The patch area and core area analysis showed that evergreen forests were highly fragmented, followed by croplands during the study period (Table 2). Between 2000 and 2020, landscape pattern changes were not significant between PADDDed and unPADDDed areas (W = 1.17 × 10⁵, p = 0.20, effect size r = −0.05, 95% CI [−0.12–0.02]) (Figure 12).

3.4. Impacts of PADDD Events on Threatened Species

The estimated ranges of nine threatened mammal and five threatened reptile species were found in the unPADDDed and PADDDed areas (Table 3). The PADDDed area in Pidaung Wildlife Sanctuary showed a higher potential estimated range for the most recorded threatened species compared to the remaining PA. Likewise, three significant mammal species, such as Asian elephant (Elephas maximus), Asiatic black bear (Ursus thibetanus), and Malayan sun bear (Helarctos malayanus), were more likely to roam in the PADDDed areas than in the unPADDDed areas of Shwe-U-Daung Wildlife Sanctuary.

4. Discussion

This study provides the first comprehensive analysis of PADDD events in Myanmar, exploring the spatiotemporal patterns, proximate causes, and ecological consequences of enacted PADDD events. We found that the principal instances of enacted PADDD events differ between Myanmar and the global trends. Downsizing is Myanmar’s sole type of enactment, while the global phenomenon was more associated with the downgrading events between 1989 and 2020. A high frequency of PADDD events was enacted for rural settlements, while a more considerable extent of PA estate was affected due to degradation in Myanmar. The case studies demonstrate how changes in land cover landscape pattern and PA habitats are affected by PADDD decisions, which directly impact the ranges of threatened species.
While earlier studies addressed global trends, patterns, and impacts of PADDD events, evidence of Myanmar PADDD events was underrepresented and underreported [5,6,49,50]. Although PADDDtracker.org compiled global instances of enacted and proposed PADDD records worldwide, Mascia et al. [6] acknowledged that the dataset still needs to include PADDD events from some countries. The current global PADDD events are believed to underestimate the actual frequency of PADDD events. For example, though Forrest et al. [12] reported that Malaysia experienced 121 enacted PADDD events from 1910 to 2010, those data were not included in the global PADDD dataset.
Myanmar is attempting towards its national target, which is to set ten percent of its area under the PA system by 2030 [26]. However, our findings suggest that a reduction of three percent of the total PA estate by PADDD events undermines the fulfilment of its target. In addition, PADDD events were overlooked and underestimated by policy- and decision-makers. The results indicate that downsizing events in Myanmar drove legal changes in protection for PAs. Of these events, downsizing frequency predominantly occurred in PAs close to human-dominated areas. This finding is supported by previous research, which shows that PAs bordering higher densities of human populations are increasingly vulnerable to enacted downsizing rather than downgrading and degazettement [50]. Furthermore, a higher frequency of the PADDD events between 2011 and 2015 indicates a dynamic period and significant changes in land use policy in Myanmar. This period lies with the land use policy reform era implemented by the quasi-civilian government of Myanmar [51].
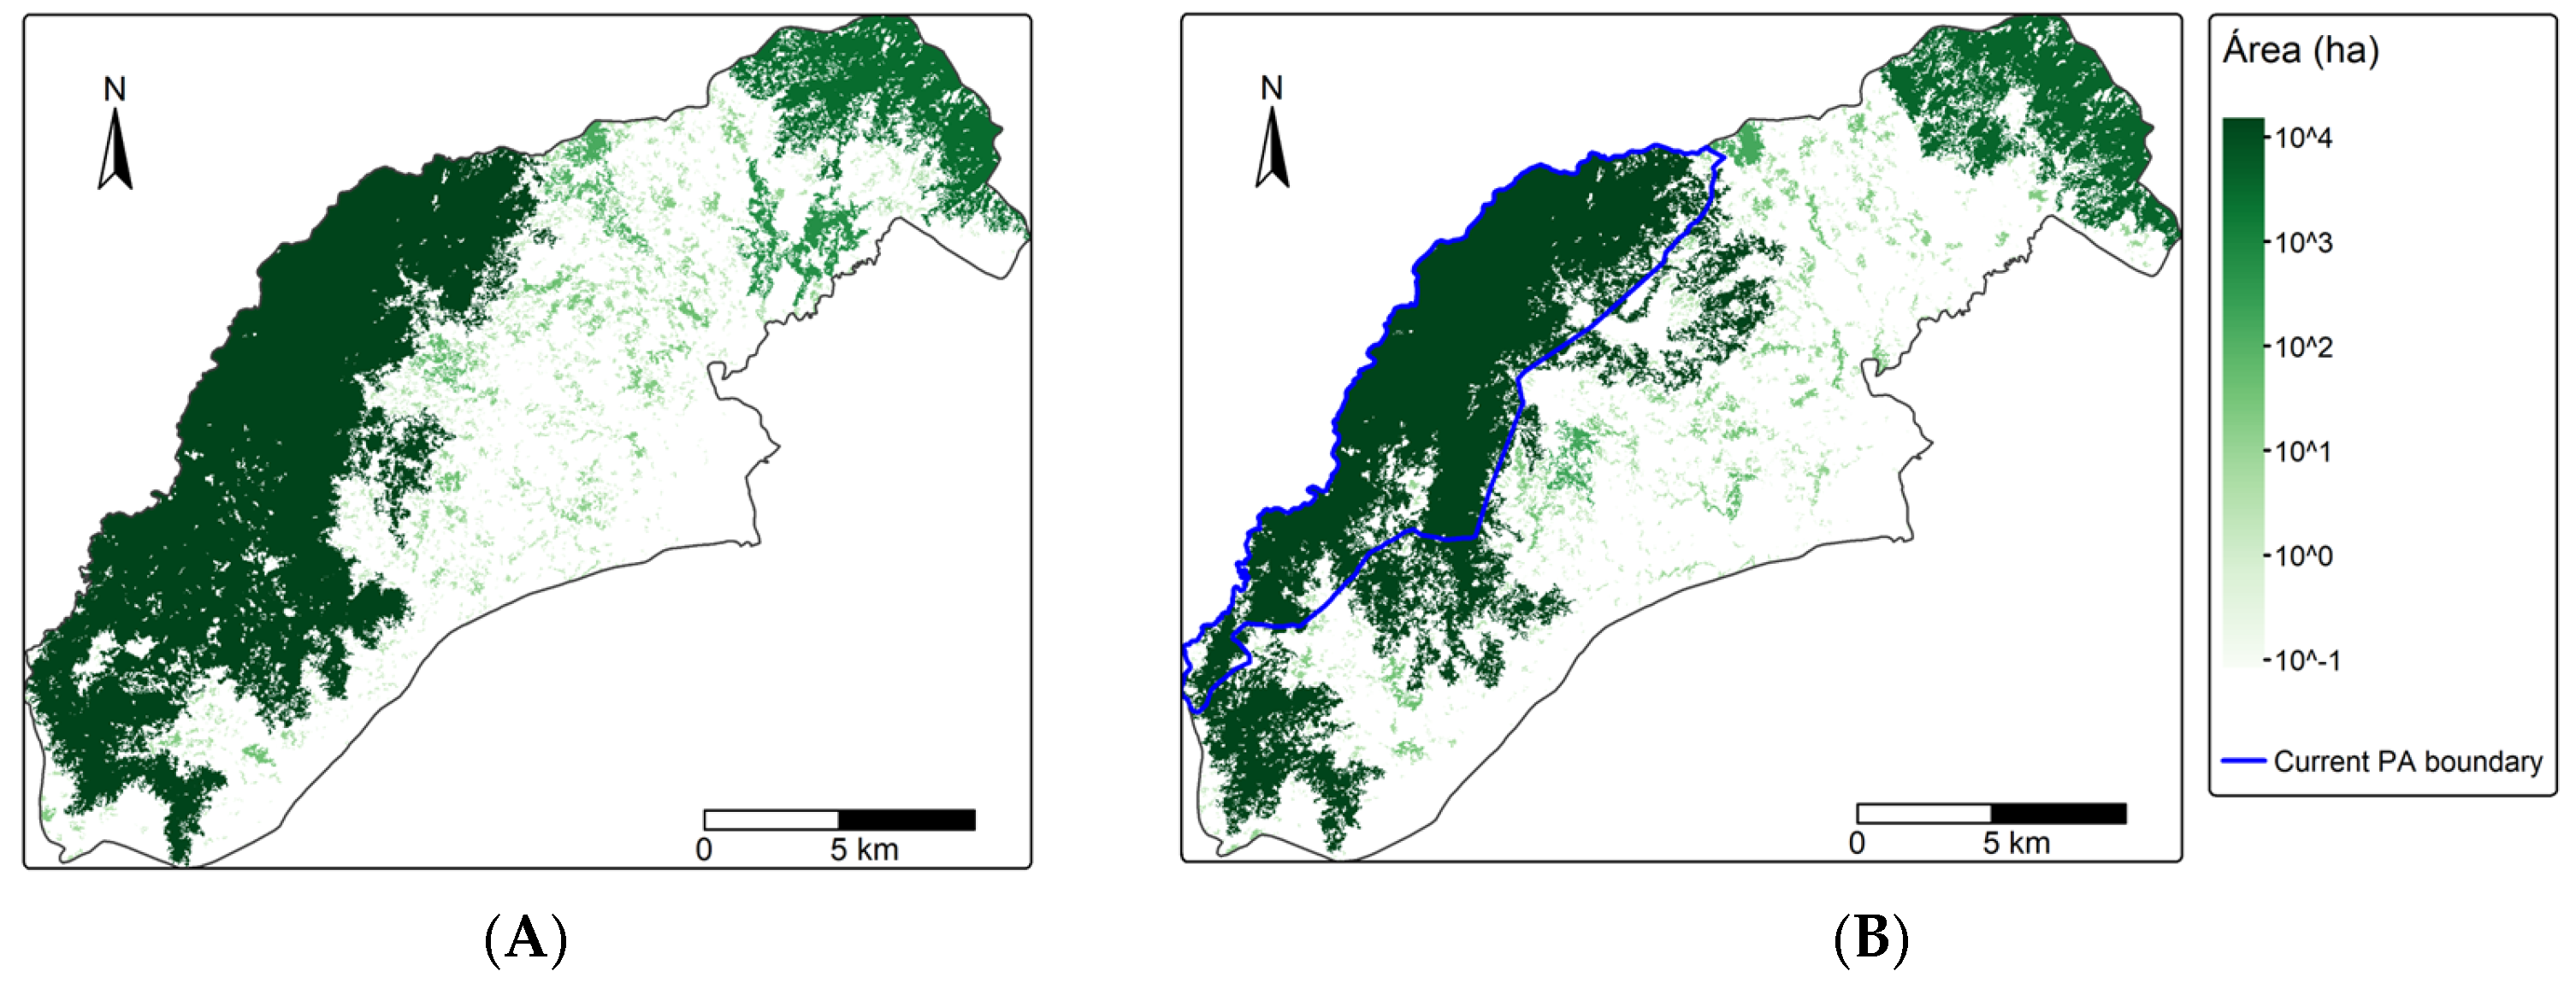
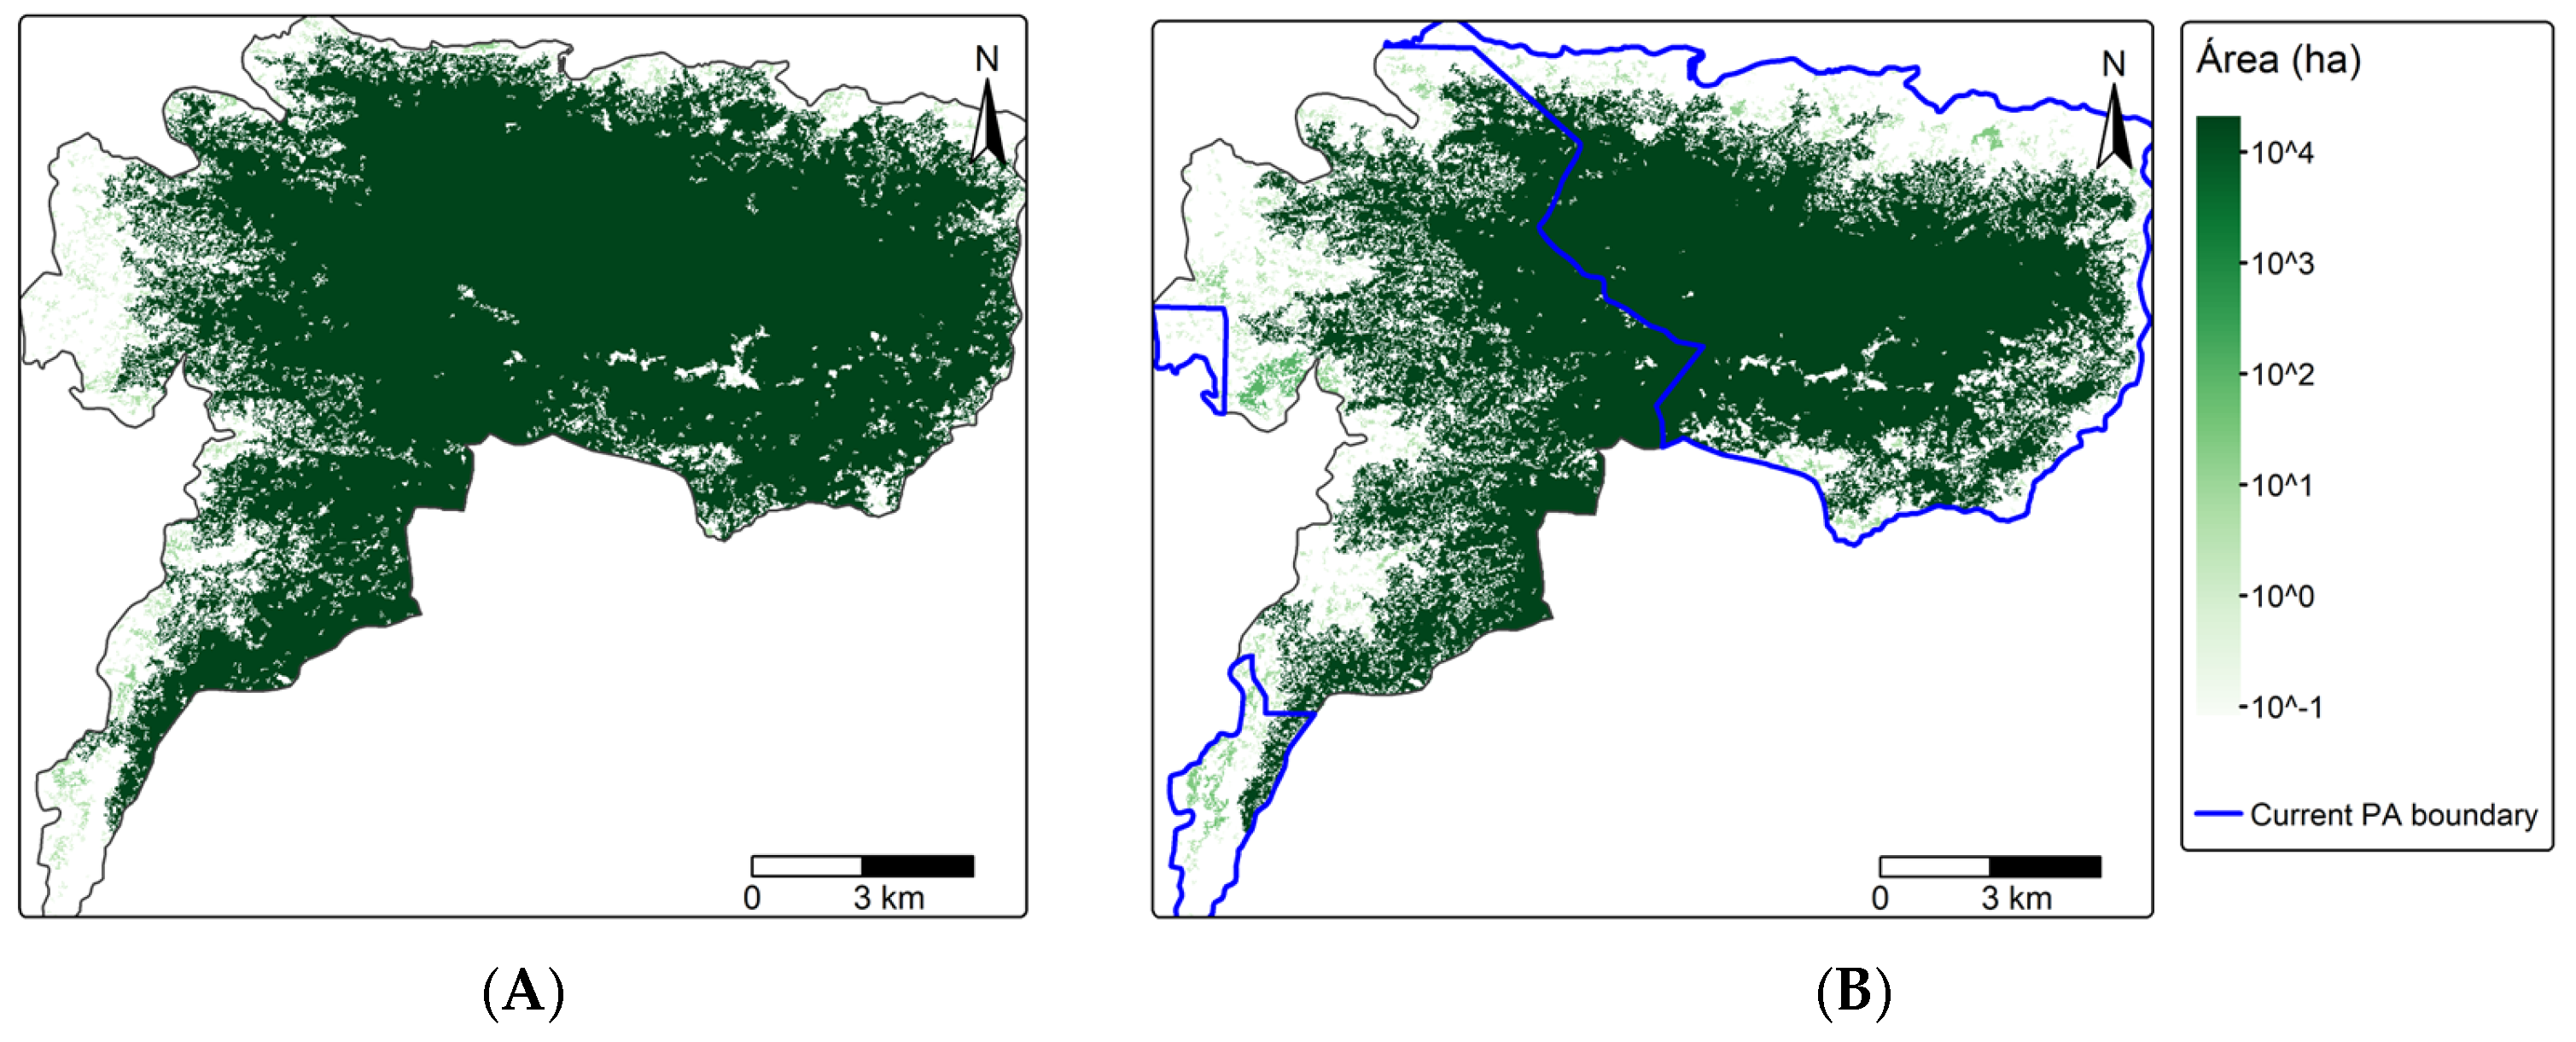
The more extensive extent of losing PAs’ estate affected by enacted PADDD events was associated with biodiversity-rich PAs in which the proximate causes of degradation and other significantly drove ecological consequences. Degradation was a leading cause of the enactment of PADDD in Pidaung Wildlife Sanctuary. However, our study revealed the pre-PADDD status of this PA’s forest ecosystems and land cover, highlighting the weakness of the PADDD policy, which inaccurately claims the degradation of PA ecosystems. The technical evaluation of PA ecosystems would benefit biodiversity conservation before enacting PADDD, particularly in cases of PA ecosystem degradation. Additionally, PADDDed areas still retained ranges of some evergreen forests and threatened species in Pidaung and Shwe-U-Daung wildlife sanctuaries, indicating a further necessity to re-evaluate the potential reversal of some portions of the previous PADDD (Appendix A Figure A1 and Figure A3).
The study reveals that rural settlements were among the highest proximate causes for reducing PA estates. Owing to the legacy of centralised PA governance, the PA system in Myanmar historically practised a top-down, centralised, and exclusionary approach, resulting in limited local participation in the conservation and management of PAs. In 2020, approximately 69% of the population resided in rural areas [52], where most of them, who were adjacent to forests, relied on forest resources and land for their subsistence. Due to an insecure land tenure system [53,54], local communities were often restricted from accessing PA resources, which may lead to encroachment or conflict in conservation areas. Istituto Oikos and BANCA [29] stated that 11 out of 30 PAs surveyed encountered shifting cultivation and permanent agriculture in Myanmar. Those rural communities living inside PAs did not hold any legal permits. Generally, current gazettement procedures for PA establishment recognise the rights of local communities who stayed there before the PA establishment. However, land disputes might still exist between authorities and local communities. Before the 1970s, global conservation communities often overlooked the rights of local communities who had traditionally inhabited the land before conservation areas were designated [55]. In Myanmar, PADDD events for the rural settlement initiated in 2013 were potentially influenced by the land reform initiatives to grant legal land use access for local communities who stayed many years inside PAs without any official land tenure permits. It may reflect the legitimate trade-offs between the well-being of local communities and biodiversity conservation. Some PADDD events may attempt to address the claims and concerns of local communities and Indigenous peoples [5,55] and remedy past inequities resulting from fortress conservation practices [17]. However, piecemeal allocations of PADDD may increase the likelihood of landscape fragmentation and loss of habitat connectivity within conservation areas. We recommend adopting a holistic approach that balances community benefits with conservation efforts.
Our case studies demonstrate that the post-PADDDed era experienced a higher habitat fragmentation and deforestation, significantly negatively affecting the evergreen forests. A study on the effect of downsizing PAs stated that the likelihood of habitat fragmentation in PADDDed areas is more exacerbated than in unPADDDed areas [10]. Our findings are also consistent with previous research, which indicates that PADDD events accelerate the expansion of deforestation areas [12,13]. In addition, PADDDed areas encountered significant changes in land cover compared to unPADDDed sites, indicating that the reduction in legal protection accelerated the deterioration of the PA ecosystems and habitats, significantly in Pidaung and Pyin-Oo-Lwin wildlife sanctuaries. However, the changes in land cover landscape patterns in Shwe-U-Daung Wildlife Sanctuary revealed that unPADDDed (remaining PA) areas encountered more changes than PADDDed areas, although the difference in change was not statistically significant. The existence of this PA spans nearly one hundred years, making it one of the oldest PAs in Myanmar. The surrounding 31 villages depended on the PA for resource extraction, including timber, fuelwood, hunting, gold mining, and agriculture. However, since 2011, a total of 149.94 km2 of PA estate has been reallocated to a military purpose (99.97% of its total downsized areas), with local people’s access strongly restricted, resulting in increased pressure on the remaining parts of the PA. The reduction in the spatial extent of the PA estate raises a particular concern that threatened species, such as plants, mammals, reptiles, and birds, are under threat. For example, the Asian elephant (Elephas maximus), Asiatic black bear (Ursus thibetanus), and Malayan sun bear (Helarctos malayanus) were more likely to roam in the PADDDed area of Shwe-U-Daung Wildlife Sanctuary. Most significantly, the piecemeal remnant of the PA estate after the PADDD enactment in Shwe-U-Daung Wildlife Sanctuary disrupted connectivity, negatively affecting wildlife movements and resulting in increased local extinction risk for threatened species, as well as leading to increased incidents of human–wildlife conflict.
While this study focuses on the ecological and legal dimensions of PADDD events, it is crucial to recognise that many PAs in Myanmar have historically been established through centralised top-down processes with a limited engagement of local communities. This has often led to tensions and overlapping claims between state-recognised PA boundaries and customary tenure systems practised by Indigenous peoples. In some cases, PADDD events—especially those driven by rural settlement considerations—may reflect efforts to retroactively accommodate longstanding community presence and land use rather than new incursions. Recognition of customary tenure and community-based resource management remains a critical and under-addressed dimension of conservation policy in Myanmar. Although this paper does not explore these governance aspects in detail, future research could investigate how PADDD interacts with community-state conflicts over PA governance and assess whether more inclusive approaches—such as Indigenous and Community Conserved Areas (ICCAs)—might offer viable alternatives that align conservation objectives with the rights of local communities.

5. Conclusions

The study emphasises the importance of systematic reporting and archiving of PADDD events in Myanmar to monitor changes in PA boundaries and the drivers of PADDD, which will ensure effective biodiversity conservation and informed decision-making. Our findings also suggest that extensive research and technical evaluation are required to investigate the status of ecosystems and biodiversity in proposed PADDDed areas before final enactment. Searching for new places for newly established PAs is challenging, and it suggests that reversals of previous PADDD into PA estates might be an option if PADDDed areas still retain biodiversity and ecosystems (for example, Pidaung and Shwe-U-Daung wildlife sanctuaries). Brockington and Wilkie [56] suggested that the sustainable existence of PAs needs strong political support from the local to the international level. Myanmar promulgated the Conservation of Biodiversity and Protected Area Law in 2018, which legal provisions allow for promoting the participation of local communities by establishing Community Conserved Protected Areas (CCPAs) and Payment for Ecosystem Services (PES) within PAs and community-based tourism, community forests (CF), and locally managed marine areas in the buffer zone of PAs. However, the practical implementation remains unclear and unproductive. Conservation schemes, such as community-based natural resource management, PES, and ICCAs or CCPAs, may help reduce the risk of some PADDD events by operationalising the 2018 conservation law effectively. As PADDD events are more likely to accelerate the rate of deforestation [12,13], forest loss in the existing PAs will likely increase the risk of future PADDD [11,21]. Studies of land rights across East Asia and the Pacific regions have demonstrated that strengthening and securing communal tenure may contribute to the reduction in forest loss and illegal encroachment into forest lands [57]. PADDD-related studies in Cambodia have highlighted that political economy, economic land concessions, and centralised top-down PA governance have led to PADDD events, accelerating deforestation, while secure Indigenous land tenures have contributed to sustainable governance of conservation [13,14]. Increasing land tenure security in the Cuyabeno Forest Reserve in Ecuador resulted in a 34% reduction in deforestation [58]. These findings suggest that the integrating community participation and increasing recognition of tenure rights can reduce future PADDD events while conserving biodiversity resources. The regional and global best practices can apply to Myanmar PAs that encounter severe internal and external pressure for future potential PADDD; for example, the Shwe-U-Daung Wildlife Sanctuary. For PAs near human-dominated areas, it is essential to designate buffer zones that allow people to access PA land and resources. Enhancing ecological integrity may significantly enhance PAs’ conservation and legal durability.
We identified that the study has some limitations regarding data constraints for the locations and the robust extent of PADDD events, especially for rural settlements, which limits the ability to perform country-level analysis. As such, overcoming the data constraints in the future may bring an opportunity to conduct a more comprehensive analysis of PADDD impacts at the country level. We acknowledged that the representation of the current three case studies (19 enacted PADDD events and 60.7% of the total affected areas) may indicate the potential bias in focusing only on areas with sufficient documentation. However, the current study will provide a meaningful representation of PADDD impacts in Myanmar. Future research on the socioeconomic impacts of PADDD on local communities should be carried out.

Author Contributions

Conceptualisation, Z.M.T., E.R. and P.O.; methodology, Z.M.T.; software, Z.M.T.; formal analysis, Z.M.T.; data curation, Z.M.T. and P.O.; writing—original draft preparation, Z.M.T.; writing—review and editing, Z.M.T., E.R., G.H., H.R., P.O., M.S.M. and T.Z.T.; visualisation, Z.M.T.; project administration, G.H., P.O. and H.R.; funding acquisition, G.H. and H.R. All authors have read and agreed to the published version of the manuscript.

Funding

This research was funded by the Swiss Agency for Development and Cooperation (SDC) and the University of Bern (Contract number 81074441, Project number 7F-09174.03.53). The APC was funded by the Norwegian University of Science and Technology—NTNU.

Data Availability Statement

Global PADDD data is available from https://www.padddtracker.org/, accessed on 9 December 2024; and land cover data from https://www.landcovermapping.org/en/landcover/, accessed on 10 January 2025. Data on Myanmar PADDD events may be shared upon request on a case-by-case basis.

Acknowledgments

We are grateful for the financial support from the Swiss Agency for Development and Cooperation (SDC) and the University of Bern. We highly acknowledge those who contributed valuable data about the global PADDD data, regional land cover data, and Myanmar National Red List of Threatened Species for this research. We also thank anonymous reviewers who suggested improving the paper’s quality. The academic AI tool Elicit was used for parts of the literature review.

Conflicts of Interest

The authors declare no conflicts of interest.

Abbreviations

The following abbreviations are used in this manuscript:
GBFGlobal Biodiversity Framework
IUCNInternational Union for Conservation of Nature
PADDDPA Downgrading, Downsizing, and Degazettement
PAsProtected Areas

Appendix A

Figure A1. The status of evergreen forest in Pidaung Wildlife Sanctuary. (A) The area of evergreen forest in 2000 (darker green area with larger core area). (B) The area of evergreen forest after the enacted PADDD events in 2020 (darker green area with larger core area).
Land 14 01800 g0a1
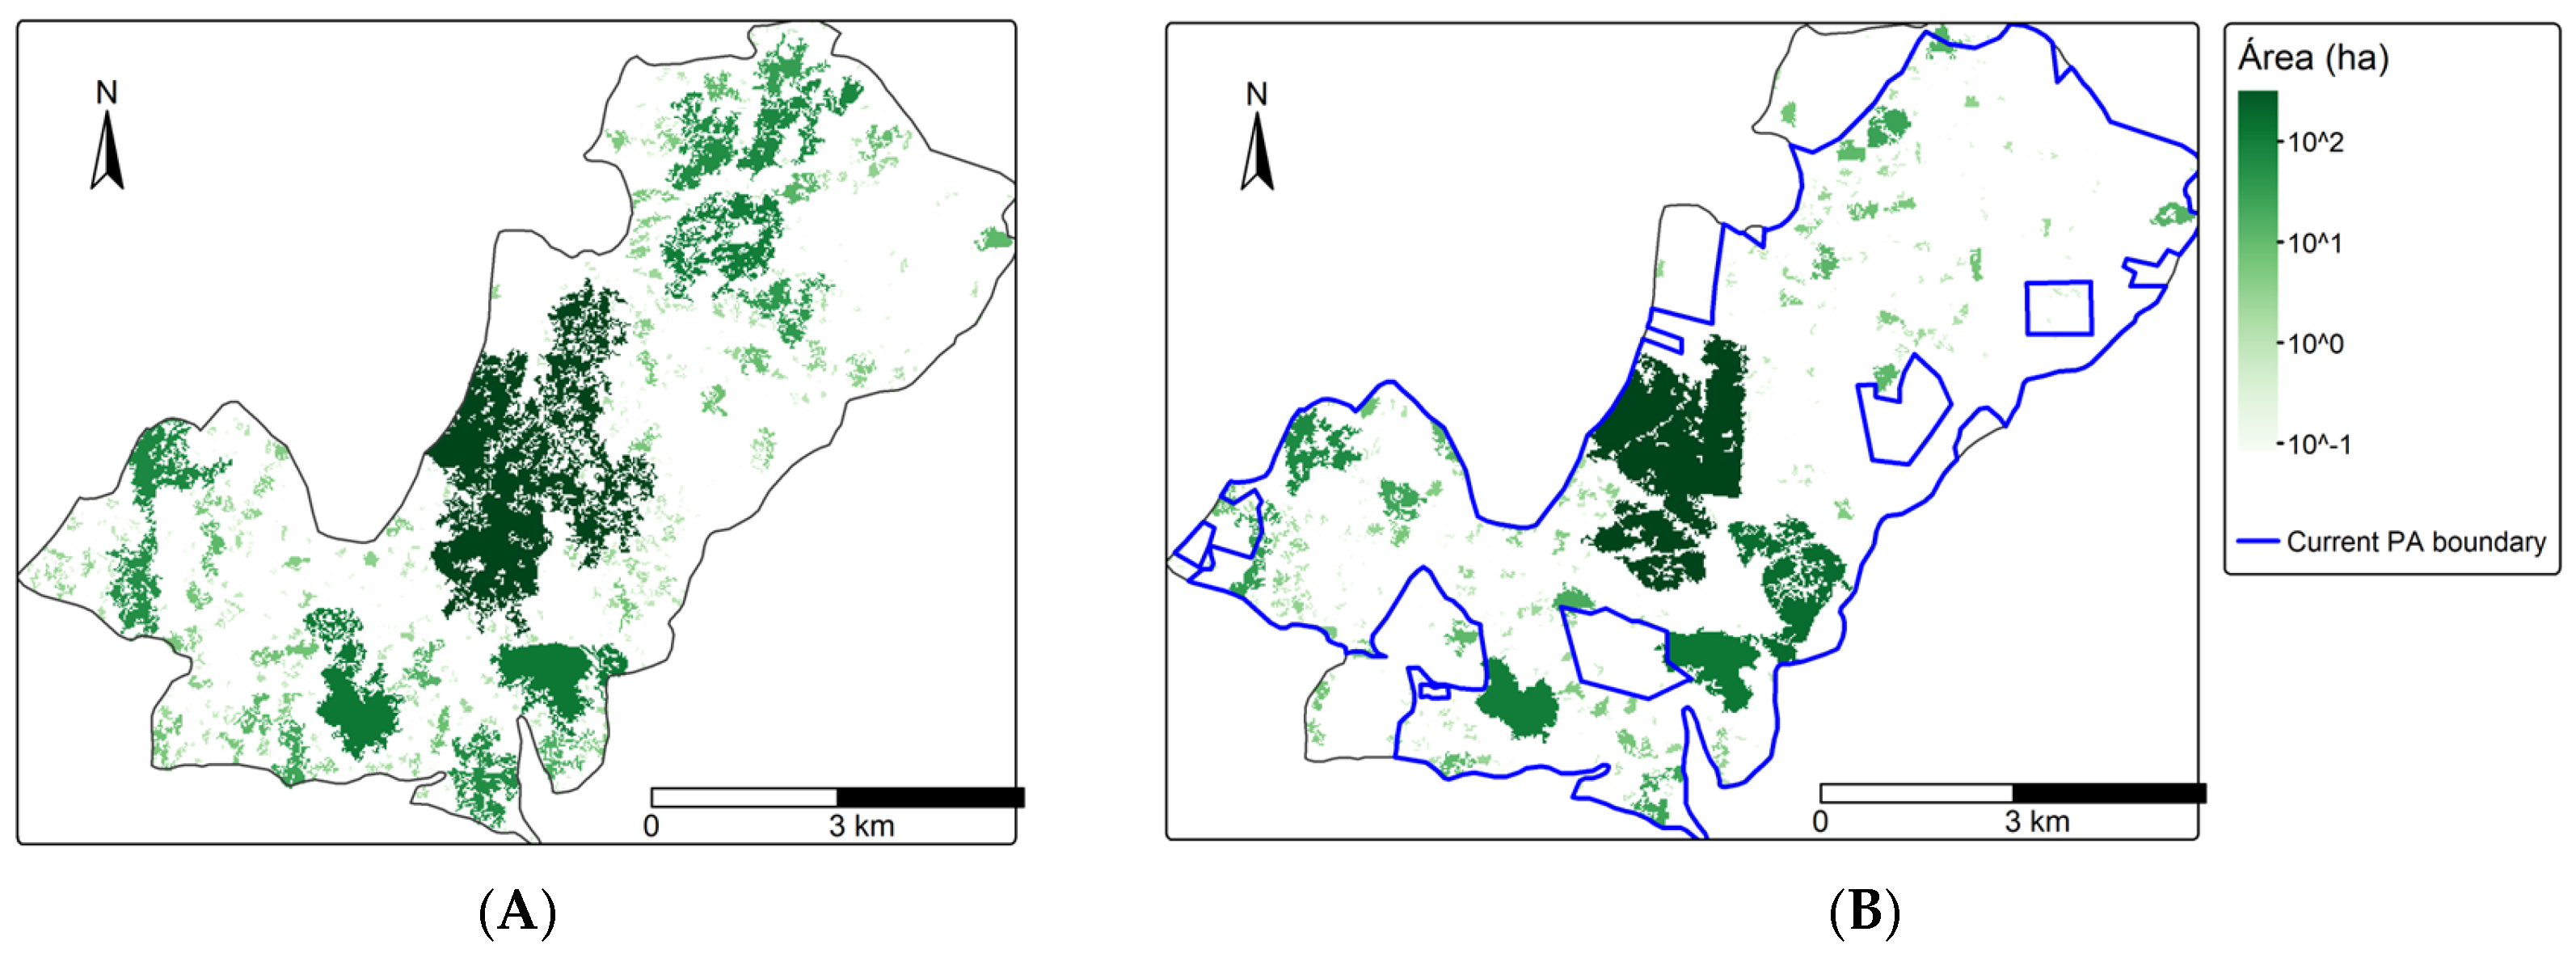
Figure A2. The status of evergreen forest in Pyin-Oo-Lwin Bird Sanctuary. (A) The area of evergreen forest in 2000 (darker green area with larger core area). (B) The area of evergreen forest after the enacted PADDD events in 2020 (darker green area with larger core area).
Land 14 01800 g0a2
Figure A3. The status of evergreen forest in Shwe-U-Daung Wildlife Sanctuary. (A) The area of evergreen forest in 2000 (darker green area with larger core area). (B) The area of evergreen forest after the enacted PADDD events in 2020 (darker green area with larger core area).
Land 14 01800 g0a3
Figure A4. A sensitivity analysis for an analysis of landscape pattern changes using the candidate window sizes (3, 5, 10, 20, and 50), in which landscape pattern changes were evaluated by the dissimilarity values (the higher the dissimilarity value, the more changes). Smaller window sizes showed higher means, but higher SD of dissimilarity.
Land 14 01800 g0a4
Table A1. Summary of PADDD events in 20 Myanmar PAs.
Sr.Name of PAPA categoryState/
Region
Established YearCurrent Area (ha)Downsizing
Number%
1Alaungdawkathapa National ParkSagaing1989140,283112.19
2Chatthin Wildlife SanctuarySagaing194126,00713.45
3Hlawga ParkNature ParkYangon1989560510.13
4Hukaung Valley ExtensionWildlife SanctuarySagaing20101,089,93210.94
5IndawgyiWildlife SanctuaryKachin200474,79168.23
6Inlay LakeWildlife SanctuaryShan198553,3741216.91
7Kaylathataung Wildlife SanctuaryMon1942224548.26
8KyaiktiyoWildlife SanctuaryMon200115,60240.14
9Lampi Marine National ParkTaninthayi199620,44920.18
10LoimweNature ReserveShan1996413523.47
11Minsontaung Wildlife SanctuaryMandalay2001225610.15
12Natmataung National ParkChin201071,30810.06
13Parsar National ParkShan1996765310.64
14Pidaung Wildlife SanctuaryKachin192712,208682.66
15Pyin-Oo-Lwin Bird SanctuaryWildlife SanctuaryMandalay192711,1021112.52
16Shwesettaw Wildlife SanctuaryMagway194046,410316.03
17Shwe-U-DaungWildlife SanctuaryMandalay/Shan192717,598246.01
18Taninthayi Nature ReserveTaninthayi2005169,99610.004
19Taunggyi Bird SanctuaryWildlife SanctuaryShan1920728754.69
20Wetthigan Wildlife SanctuaryMagway1939372215.51

References

  1. Dudley, N. Guidelines for Applying Protected Area Management Categories; IUCN: Gland, Switzerland, 2008; p. x + 86. Available online: https://portals.iucn.org/library/sites/library/files/documents/pag-021.pdf (accessed on 29 August 2025).
  2. Watson, J.E.M.; Dudley, N.; Segan, D.B.; Hockings, M. The performance and potential of protected areas. Nature 2014, 515, 67–73. [Google Scholar] [CrossRef]
  3. UNEP-WCMC. Map of Protected Areas and OECMs, February 2025. 2025. Available online: www.protectedplanet.net (accessed on 5 February 2025).
  4. CBD COP. Kunming-Montreal Global Biodiversity Framework (GBF). In Proceedings of the Fifteenth Meeting of the Conference of the Parties to the Convention on Biological Diversity (Part Two) Decision 15/4, Montreal, QC, Canada, 7–19 December 2022. [Google Scholar]
  5. Mascia, M.B.; Pailler, S. Protected area downgrading, downsizing, and degazettement (PADDD) and its conservation implications. Conserv. Lett. 2011, 4, 9–20. [Google Scholar] [CrossRef]
  6. Mascia, M.B.; Pailler, S.; Krithivasan, R.; Roshchanka, V.; Burns, D.; Mlotha, M.J.; Murray, D.R.; Peng, N. Protected area downgrading, downsizing, and degazettement (PADDD) in Africa, Asia, and Latin America and the Caribbean, 1900–2010. Biol. Conserv. 2014, 169, 355–361. [Google Scholar] [CrossRef]
  7. Conservation International; World Wildlife Fund. PADDDtracker.org Data Release, version 2.1; Conservation International: Arlington, VA, USA; World Wildlife Fund: Washington, DC, USA, 2021. Available online: https://zenodo.org/records/4974336 (accessed on 9 December 2024).
  8. Golden Kroner, R.E.; Qin, S.; Cook, C.N.; Krithivasan, R.; Pack, S.M.; Bonilla, O.D.; Cort-Kansinally, K.A.; Coutinho, B.; Feng, M.; Martínez Garcia, M.I. The uncertain future of protected lands and waters. Science 2019, 364, 881–886. [Google Scholar] [CrossRef]
  9. Conceição, E.O.; Garcia, J.M.; Alves, G.H.Z.; Delanira-Santos, D.; de Fátima Corbetta, D.; Betiol, T.C.C.; Pacifico, R.; Romagnolo, M.B.; Batista-Silva, V.F.; Bailly, D. The impact of downsizing protected areas: How a misguided policy may enhance landscape fragmentation and biodiversity loss. Land Use Policy 2022, 112, 105835. [Google Scholar] [CrossRef]
  10. Golden Kroner, R.E.; Krithivasan, R.; Mascia, M.B. Effects of protected area downsizing on habitat fragmentation in Yosemite National Park (USA), 1864–2014. Ecol. Soc. 2016, 21, 22. [Google Scholar] [CrossRef]
  11. Tesfaw, A.T.; Pfaff, A.; Golden Kroner, R.E.; Qin, S.; Medeiros, R.; Mascia, M.B. Land-use and land-cover change shape the sustainability and impacts of protected areas. Proc. Natl. Acad. Sci. USA 2018, 115, 2084–2089. [Google Scholar] [CrossRef]
  12. Forrest, J.L.; Mascia, M.B.; Pailler, S.; Abidin, S.Z.; Araujo, M.D.; Krithivasan, R.; Riveros, J.C. Tropical Deforestation and Carbon Emissions from Protected Area Downgrading, Downsizing, and Degazettement (PADDD). Conserv. Lett. 2015, 8, 153–161. [Google Scholar] [CrossRef]
  13. Nuttall, M.; Olsson, E.; Washington, H.; Ung, V.; Bunnefeld, N.; Merriman, J.; Griffin, O.; Hobson, K.; Diment, A.; Kroner, R.G. Protected area downgrading, downsizing, and degazettement in Cambodia: Enabling conditions and opportunities for intervention. Conserv. Sci. Pract. 2023, 5, e12912. [Google Scholar] [CrossRef]
  14. Ford, S.A.; Persson, J.; Jepsen, M.R.; Mertz, O. Sociopolitical drivers and environmental outcomes of protected area downgrading and degazettement in Cambodia. Reg. Environ. Change 2022, 22, 114. [Google Scholar] [CrossRef]
  15. Fuller, R.A.; McDonald-Madden, E.; Wilson, K.A.; Carwardine, J.; Grantham, H.S.; Watson, J.E.; Klein, C.J.; Green, D.C.; Possingham, H.P. Replacing underperforming protected areas achieves better conservation outcomes. Nature 2010, 466, 365–367. [Google Scholar] [CrossRef] [PubMed]
  16. Kareiva, P. Trade-in to trade-up. Nature 2010, 466, 322–323. [Google Scholar] [CrossRef] [PubMed]
  17. Dowie, M. Conservation Refugees: The Hundred Year Conflict Between Global Conservation and Native Peoples; The MIT Press: Cambridge, MA, USA, 2009. [Google Scholar]
  18. Bernard, E.; Penna, L.A.; Araújo, E. Downgrading, downsizing, degazettement, and reclassification of protected areas in Brazil. Conserv. Biol. 2014, 28, 939–950. [Google Scholar] [CrossRef] [PubMed]
  19. Paterson, A. The Judiciary’s Contribution to Preventing Protected Area Downgrading, Downsizing, and Degazettement: Mining and Environmental Justice Community of South Africa v MEC for Agriculture, Rural Development Land and Environmental Affairs (1322/2021)[2024] ZAMPMBHC 48 (18 July 2024). Potchefstroom Electron. Law J. PELJ 2025, 28, 1–28. [Google Scholar] [CrossRef]
  20. Lopez Sandoval, M.F.; Gerique, A.; Pohle, P. What Is Behind Land Claims? Downsizing of a Conservation Area in Southeastern Ecuador. Sustainability 2017, 9, 1519. [Google Scholar] [CrossRef]
  21. Keles, D.; Delacote, P.; Pfaff, A.; Qin, S.; Mascia, M.B. What drives the erasure of protected areas? Evidence from across the Brazilian Amazon. Ecol. Econ. 2020, 176, 106733. [Google Scholar] [CrossRef]
  22. Herziger, A.; Claborn, K.A.; Brooks, J.S. Is there hope for the double dividend? How social context can shape synergies and tradeoffs between sustainable consumption and well-being. Ecol. Econ. 2020, 176, 106736. [Google Scholar] [CrossRef]
  23. Peterson, M.N.; Birckhead, J.L.; Leong, K.; Peterson, M.J.; Peterson, T.R. Rearticulating the myth of human–wildlife conflict. Conserv. Lett. 2010, 3, 74–82. [Google Scholar] [CrossRef]
  24. Tordoff, A.W.; Duckworth, J.W.; Macfarlane, C.; Ravn, M.; Tallant, J. Indo-Burma Biodiversity Hotspot 2020 Update; Critical Ecosystem Partnership Fund: Arlington, VA, USA, 2020. [Google Scholar]
  25. IUCN. Indomalaya, Oceania, Australia and Antarctic. In Protected Areas of the World: A Review of National Systems; IUCN: Gland, Switzerland; Cambridge, UK, 1992; Volume 1. [Google Scholar]
  26. Forest Department. National Biodiversity Strategy and Action Plan (2015–2020); Forest Department, Ministry of Natural Resources and Environmental Conservation: Nay Pyi Taw, Myanmar, 2015; Consulted by IUCN; p. 137. [Google Scholar]
  27. Aung, U.M. Policy and practice in Myanmar’s protected area system. J. Environ. Manag. 2007, 84, 188–203. [Google Scholar] [CrossRef]
  28. Rao, M.; Rabinowitz, A.; Khaing, S.T. Status Review of the Protected-Area System in Myanmar, with Recommendations for Conservation Planning. Conserv. Biol. 2002, 16, 360–368. [Google Scholar] [CrossRef]
  29. Istituto Oikos; BANCA. Myanmar Protected Areas: Context, Current Status and Challenges; Ancora Libri: Milano, Italy, 2011. [Google Scholar]
  30. De Alban, J.D.T.; Leong, B.P.I.; Venegas-Li, R.; Connette, G.M.; Jamaludin, J.; Latt, K.T.; Oswald, P.; Reeder, C.; Webb, E.L. Conservation beyond the existing protected area network is required to improve species and habitat representation in a global biodiversity hotspot. Biol. Conserv. 2021, 257, 109105. [Google Scholar] [CrossRef]
  31. Rao, M.; Saw, H.; Platt, S.G.; Tizard, R.; Poole, C.; Than, M.; Watson, J.E. Biodiversity conservation in a changing climate: A review of threats and implications for conservation planning in Myanmar. Ambio 2013, 42, 789–804. [Google Scholar] [CrossRef]
  32. Nwe, T.; Zomer, R.J.; Corlett, R.T. Projected Impacts of Climate Change on the Protected Areas of Myanmar. Climate 2020, 8, 99. [Google Scholar] [CrossRef]
  33. Phyoe, S.S.S.; Htay, T.; Thant, Z.M.; Kyaw, H.Y.; San, K.N.; Tun, Z.P.H.; Ranke, P.S.; Røskaft, E. Exploring Community Perceptions and Attitudes toward Protected Areas in Myanmar: The Role of Socio-Spatial Factors in Conservation Support. Hum. Ecol. 2023, 51, 1189–1203. [Google Scholar] [CrossRef]
  34. Thant, Z.M. Costs and Benefits Associated with Natural Resource Exploitation in Chatthin Wildlife Sanctuary in Myanmar, and Its Impact on Thamin (Rucervus eldii thamin) Conservation. Master’s Thesis, Department of Biology, Norwegian University of Science and Technology (NTNU), Trondheim, Norway, 2017. [Google Scholar]
  35. Allendorf, T.; Swe, K.K.; Oo, T.; Htut, Y.; Aung, M.; Allendorf, K.; Hayek, L.-A.; Leimgruber, P.; Wemmer, C. Community attitudes toward three protected areas in Upper Myanmar (Burma). Environ. Conserv. 2006, 33, 344–352. [Google Scholar] [CrossRef]
  36. SERVIR-Mekong. Regional Land Cover Monitoring System. 2023. Available online: https://www.landcovermapping.org/en/landcover/ (accessed on 10 January 2025).
  37. MONREC. National Red List of Threatened Species in Myanmar; Ministry of Natural Resources and Environmental Conservation: Nay Pyi Taw, Myanmar, 2020. [Google Scholar]
  38. Forest Department. Information About Pidaung Wildlife Sanctuary and Shwe-U-Daung Wildlife Sanctuary; Nature and Wildlife Conservation Division: Nay Pyi Taw, Myanmar, 2018. [Google Scholar]
  39. Saah, D.; Tennesona, K.; Poortinga, A.; Nguyen, Q.; Chishtie, F.; San Aung, K.; Markert, K.N.; Clinton, N.; Anderson, E.R.; Cutter, P.; et al. Primitives as building blocks for constructing land cover maps. Int. J. Appl. Earth Obs. Geoinf. 2020, 85, 101979. [Google Scholar] [CrossRef]
  40. R Core Team. R: A Language and Environment for Statistical Computing, version 4.3.1; R Foundation for Statistical Computing: Vienna, Austria, 2023.
  41. Hijmans, R.J. Raster: Geographic Data Analysis and Modeling; Scientific Research Publishing: Irvine, CA, USA, 2021. [Google Scholar]
  42. Van Bemmelen, J.; Quak, W.; Van Hekken, M.; Van Oosterom, P. Vector vs. raster-based algorithms for cross country movement planning. In Proceedings of the Eleventh International Symposium on Computer-Assisted Cartography (Auto-Carto-11), Minneapolis, MN, USA, 30 October–1 November 1993; p. 304. [Google Scholar]
  43. Hesselbarth, M.H.; Sciaini, M.; With, K.A.; Wiegand, K.; Nowosad, J. landscapemetrics: An open--source R tool to calculate landscape metrics. Ecography 2019, 42, 1648–1657. [Google Scholar] [CrossRef]
  44. McGarigal, K. FRAGSTATS: Spatial Pattern Analysis Program for Quantifying Landscape Structure; USDA Forest Service, General Technical Report PNW-GTR-351: Portland, OR, USA, 1995; Volume 122.
  45. McGarigal, K.; Cushman, S.; Ene, E. FRAGSTATS v4: Spatial Pattern Analysis Program for Categorical Maps; University of Massachusetts: Amherst, MA, USA, 2023. [Google Scholar]
  46. Exavier, R.; Zeilhofer, P. OpenLand: Software for quantitative analysis and visualization of land use and cover change. R J. 2020, 12, 359–371. [Google Scholar] [CrossRef]
  47. Hesselbarth, M.H.K.; Sciaini, M.; Nowosad, J.; Hanss, S.; Graham, L.J.; Hollister, J.; With, K.A.; Privé, F.; Nayuki, P.; Strimas-Mackey, M. Landscape Metrics for Categorical Map Patterns. 2024. Available online: https://CRAN.R-project.org/package=landscapemetrics (accessed on 28 August 2025).
  48. Nowosad, J.; Hesselbarth, M.H. The landscapemetrics and motif packages for measuring landscape patterns and processes. arXiv 2024, arXiv:2405.06559. [Google Scholar] [CrossRef]
  49. Kuempel, C.D.; Chauvenet, A.L.; Symes, W.S.; Possingham, H.P. Predicted protected area downsizing impedes conservation progress across terrestrial ecoregions in the tropics and subtropics. Conserv. Sci. Pract. 2021, 3, e529. [Google Scholar] [CrossRef]
  50. Symes, W.S.; Rao, M.; Mascia, M.B.; Carrasco, L.R. Why do we lose protected areas? Factors influencing protected area downgrading, downsizing and degazettement in the tropics and subtropics. Glob. Change Biol. 2016, 22, 656–665. [Google Scholar] [CrossRef]
  51. Kenney-Lazar, M.; Suhardiman, D.; Hunt, G. The spatial politics of land policy reform in Myanmar and Laos. J. Peasant. Stud. 2023, 50, 1529–1548. [Google Scholar] [CrossRef]
  52. World Bank. Rural Population (% of Total Population)—Myanmar. Available online: https://data.worldbank.org/indicator/SP.RUR.TOTL.ZS?locations=MM (accessed on 26 August 2025).
  53. Andersen, K.E. The Recognition of Customary Tenure in Myanmar; Mekhong Region Land Governance: Vientiane, Laos, 2016. [Google Scholar]
  54. Hudson-Rodd, N.; Htay, S. Arbitrary Confiscation of Farmers’ Land by the State Peace and Development Council (SPDC) Military Regime in Burma; Burma Fund: Washington, DC, USA, 2008. [Google Scholar]
  55. Agrawal, A. Environmentality: Technologies of Government and the Making of Subjects; Duke University Press: Durham, NC, USA, 2005. [Google Scholar]
  56. Brockington, D.; Wilkie, D. Protected areas and poverty. Philos. Trans. R. Soc. B Biol. Sci. 2015, 370, 20140271. [Google Scholar] [CrossRef]
  57. Childress, M.; Kukkonen, M.; Berning, C.; Huntington, H.; Lisher, J.; Lindsay, J.; Setyowati, A. Good Practices for Strengthening Land Rights Recognition in Forestlands of the East Asia and Pacific Region; The World Bank: Washington, DC, USA, 2025. [Google Scholar]
  58. Holland, M.B.; Jones, K.W.; Naughton-Treves, L.; Freire, J.-L.; Morales, M.; Suárez, L. Titling land to conserve forests: The case of Cuyabeno Reserve in Ecuador. Glob. Environ. Change 2017, 44, 27–38. [Google Scholar] [CrossRef]
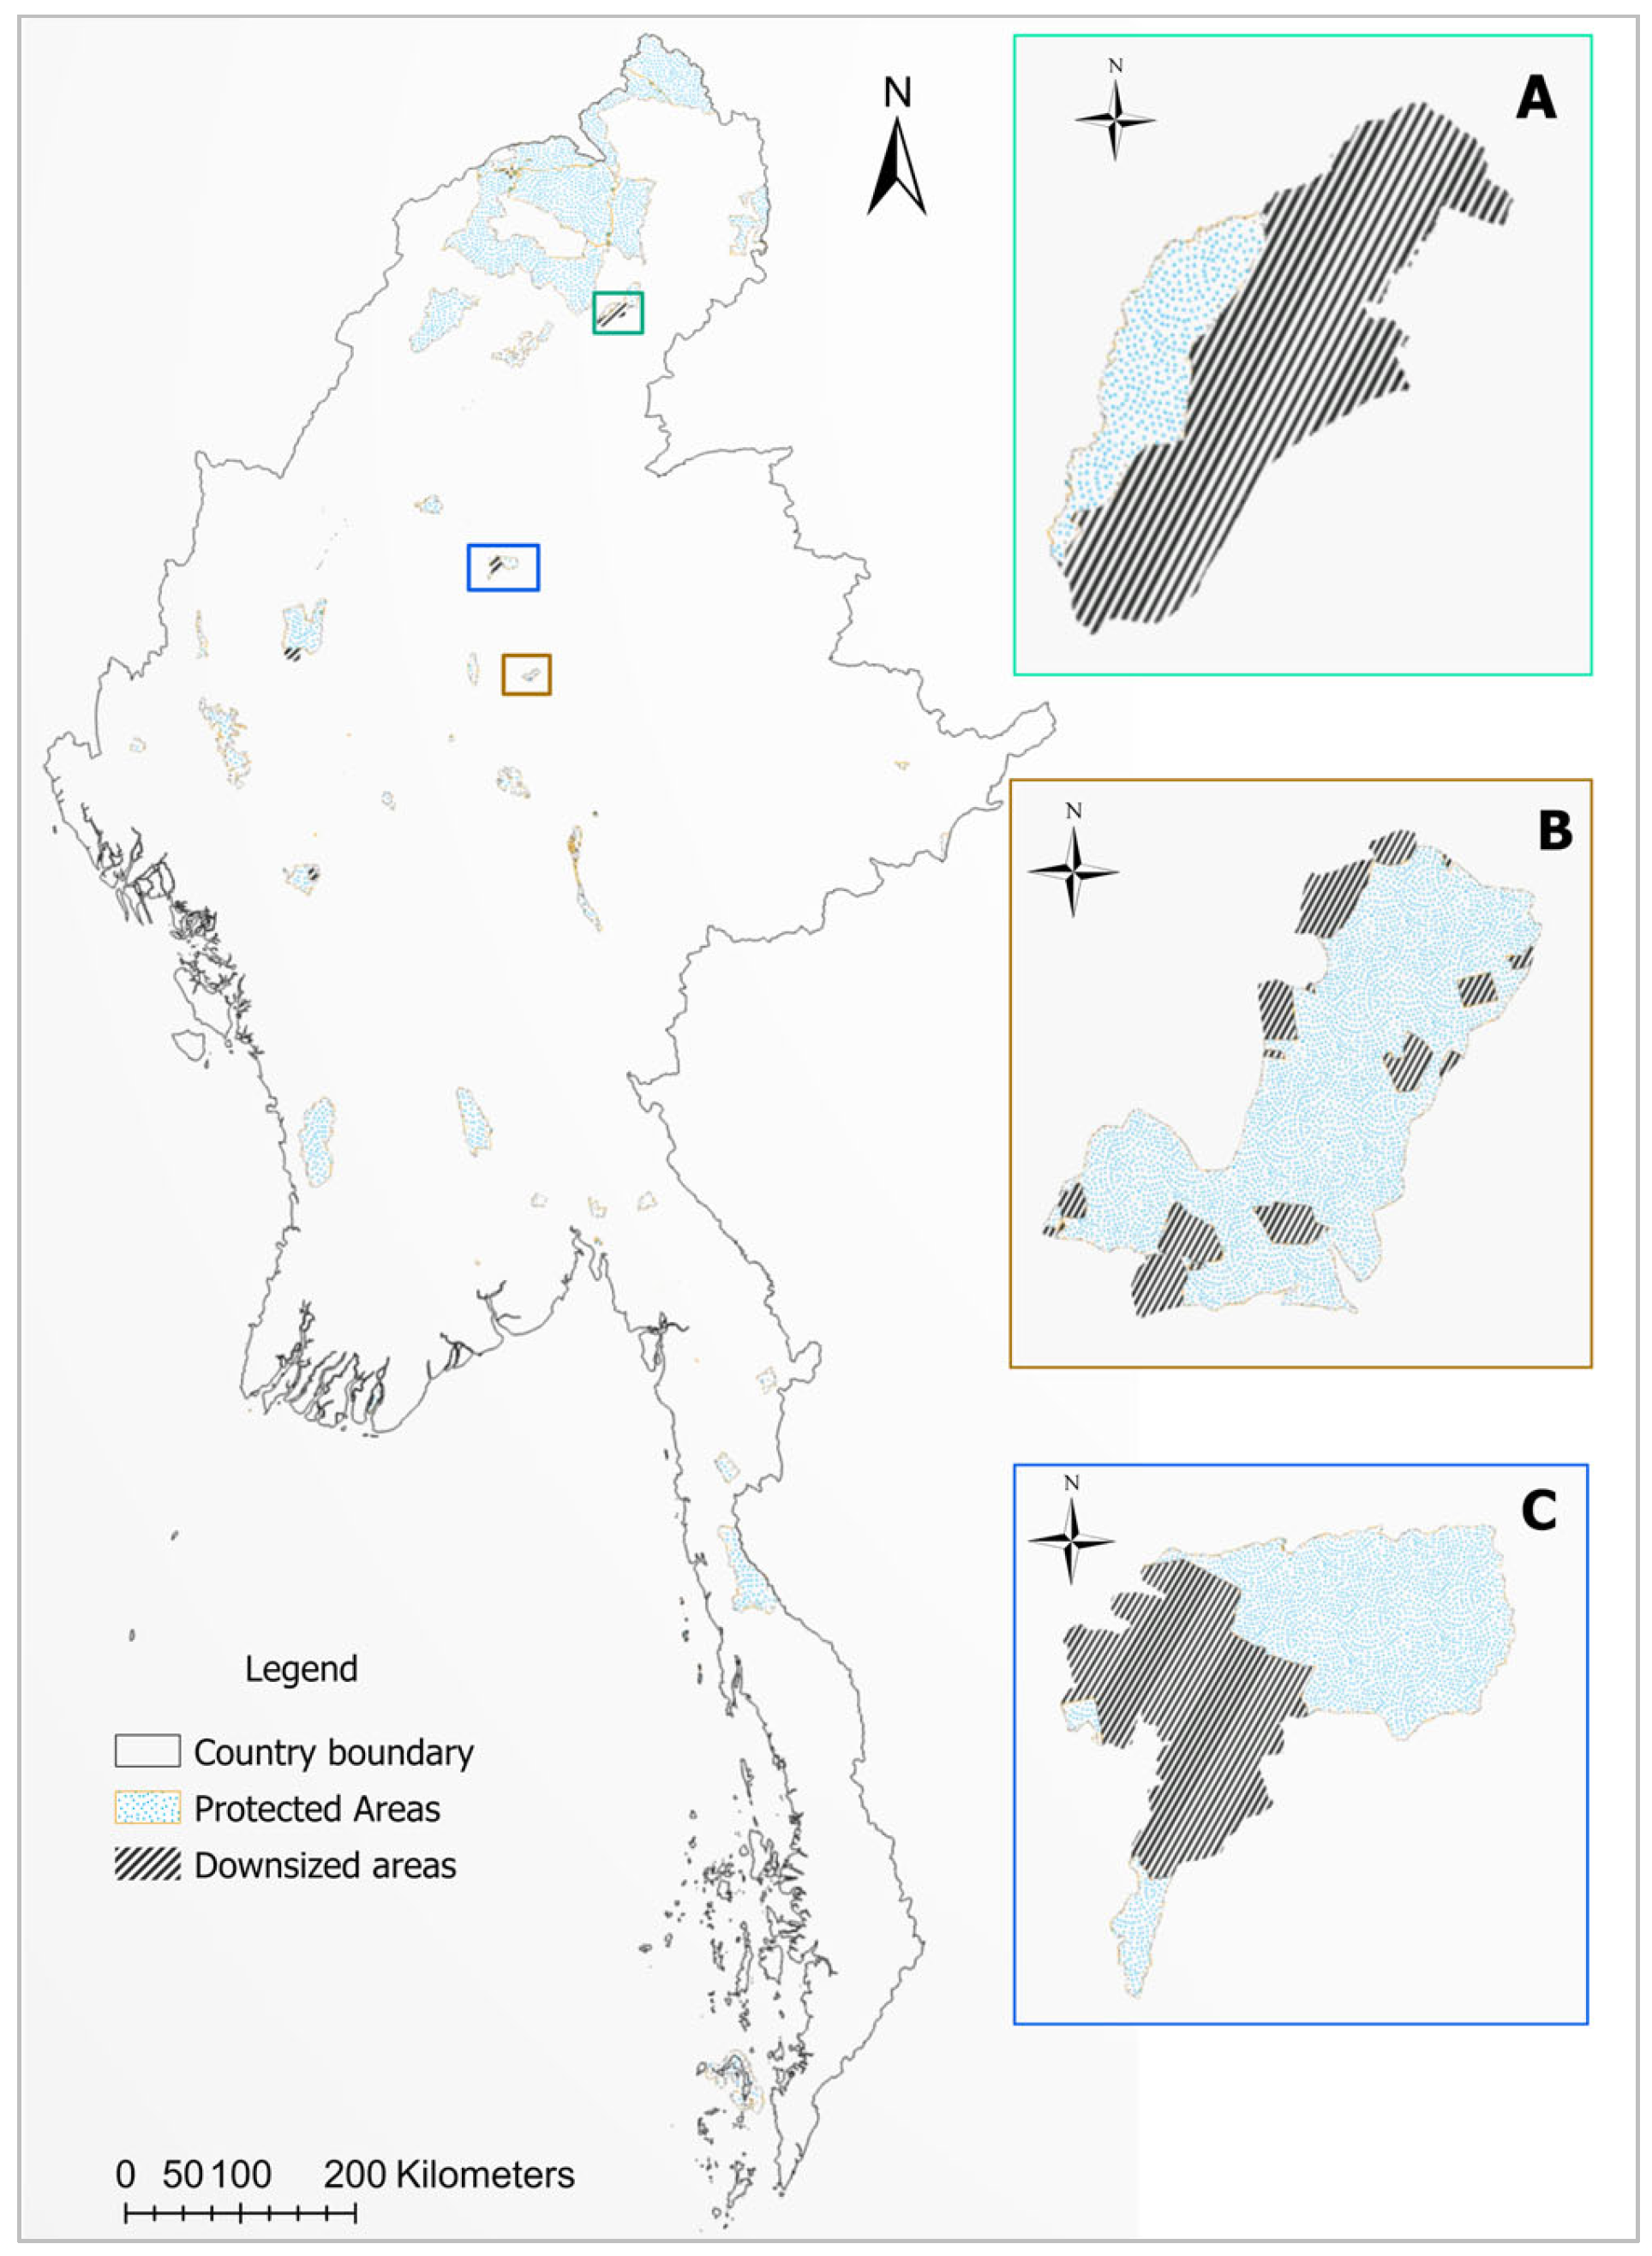
Figure 1. Locations of protected and downsized areas in Myanmar. Map of three case study areas: (A) Pidaung Wildlife Sanctuary, (B) Pyin-Oo-Lwin Bird Sanctuary, and (C) Shwe-U-Daung Wildlife Sanctuary.
Land 14 01800 g001
Figure 2. The number and affected areas of enacted PADDD events (A) in 20 Myanmar PAs and (B) yearly events between 1989 and 2020.
Land 14 01800 g002
Figure 3. The proximate causes of enacted PADDD events in Myanmar between 1989 and 2020.
Land 14 01800 g003
Figure 4. The status of land cover in Pidaung Wildlife Sanctuary. (A) Land cover status in 2000. (B) Land cover status after the enacted PADDD events in 2020.
Land 14 01800 g004
Figure 5. A Sankey plot showing the transition of land cover classes from 2000 (left) to 2020 (right) in Pidaung Wildlife Sanctuary.
Land 14 01800 g005
Figure 6. The changes in land cover landscape patterns from 2000 to 2020 in Pidaung Wildlife Sanctuary (PADDDed and unPADDD areas). The higher values represent the area being encountered with higher changes.
Land 14 01800 g006
Figure 7. The status of land cover in Pyin-Oo-Lwin Bird Sanctuary. (A) Land cover status in 2000. (B) Land cover status after the enacted PADDD events in 2020.
Land 14 01800 g007
Figure 8. A Sankey plot showing the transition of land cover classes from 2000 (left) to 2020 (right) in Pyin-Oo-Lwin Bird Sanctuary.
Land 14 01800 g008
Figure 9. The changes in land cover classes from 2000 to 2020 in Pyin-Oo-Lwin Bird Sanctuary (PADDDed and unPADDD areas). The higher values represent the area being encountered higher changes.
Land 14 01800 g009
Figure 10. The status of land cover in Shwe-U-Daung Wildlife Sanctuary. (A) Land cover status in 2000. (B) Land cover status after the enacted PADDD events in 2020.
Land 14 01800 g010
Figure 11. A Sankey plot showing the transition of land cover classes from 2000 (left) to 2020 (right) in Shwe-U-Daung Wildlife Sanctuary.
Land 14 01800 g011
Figure 12. The changes in land cover classes from 2000 to 2020 in Shwe-U-Daung Wildlife Sanctuary (PADDDed and unPADDD areas). The higher values represent the area being encountered with higher changes.
Land 14 01800 g012
Table 1. The number of enacted PADDD events and affected areas in different regions of the world and Myanmar from 1989 to 2020.
RegionNumber of Enacted PADDD EventsArea Affected (km2)Average Area Affected per Event (km2)
DowngradeDownsizeDegazetteTotalDowngradeDownsizeDegazetteTotal
Africa28235110268,631.3018,034.8211,676.4898,342.60964.14
Asia11954718027,330.1053,454.60534.7581,319.45451.77
Europe60--6046,090.06--46,090.06768.17
Latin America47761413773,758.0560,558.4719,158.93153,475.451120.26
North America240131254526,198.768993.860.29535,192.912107.06
Oceania115012210813801,479,494.00100,559.904097.401,584,151.301147.94
Myanmar-73-73-1231.40-1231.4016.87
Grand Total164436118121862,221,502.27242,833.0535,467.852,499,803.171143.55
Table 2. Temporal changes in land cover between 2000 and 2020 in three Protected Areas.
PA NameLand Cover ClassLand Cover AreaPatch Area (Mean ± SD)Core Area (Mean ± SD)
200020202000202020002020
Patch NumberArea (ha)Area (%)Patch NumberArea (ha)Area (%)Area (ha)Area (ha)Area (ha)Area (ha)
Pidaungaquaculture31.190.00231.430.0030.40 ± 0.290.48 ± 0.210.05 ± 0.090.05 ± 0.09
barren---813.550.026-1.69 ± 2.20-0.58 ± 1.17
cropland6431.550.060383611.671.1660.49 ± 0.841.60 ± 3.880.06 ± 0.240.65 ± 2.29
crop plantation175.150.0103217.750.0340.30 ± 0.380.55 ± 0.610.03 ± 0.080.08 ± 0.17
deciduous79126,432.3750.370154227,093.3451.63033.42 ± 900.0017.57 ± 641.0025.16 ± 696.0012.46 ± 477.00
evergreen207725,595.8348.776243122,851.6643.54712.32 ± 402.009.40 ± 332.009.34 ± 354.00 6.65 ± 263.00
flooded forest93.800.00740.320.0010.42 ± 0.380.08--
forest plantation10.16-178103.520.1970.160.58 ± 1.29-0.05 ± 0.31
grass9365.150.124566358.740.6840.70 ± 1.320.63 ± 1.630.11 ± 0.390.10 ± 0.60
rice185.710.0115264.610.1230.32 ± 0.321.24 ± 2.400.02 ± 0.080.43 ± 1.20
rubber---4675.140.143-1.63 ± 3.33-0.72 ± 2.05
shrub743334.490.63719071280.182.4400.45 ± 0.770.67 ± 1.850.05 ± 0.240.11 ± 0.68
wetland50.790.00264.280.0080.16 ± 0.100.71 ± 1.29-0.11 ± 0.26
Pyin-Oo-Lwinaquaculture---10.080.001-0.08--
barren66.300.0701818.090.2011.05 ± 2.251.01 ± 0.950.42 ± 1.040.19 ± 0.45
cropland4941800.2319.9622911463.5016.2283.64 ± 24.305.03 ± 25.10 2.16 ± 17.702.79 ± 17.30
crop plantation10.080.0013013.920.1540.080.46 ± 0.76-0.07 ± 0.31
deciduous3874316.0747.8593064125.4845.74611.15 ± 132.0013.48 ± 140.005.46 ± 69.608.00 ± 88.20
evergreen9152442.8227.0886561562.8017.3292.67 ± 28.002.38 ± 22.80 1.09 ± 15.301.32 ± 17.40
flooded forest---10.330.004-0.33--
grass333228.742.536610873.309.6840.69 ± 1.861.43 ± 10.10 0.13 ± 0.710.48 ± 5.21
rice---21.720.019-0.86 ± 0.29--
shrub289220.232.442477868.969.6360.76 ± 2.291.82 ± 8.800.18 ± 0.940.66 ± 4.58
urban93.680.0411581.620.9050.41 ± 0.445.44 ± 13.10 -2.81 ± 7.29
water---48.270.092-2.07 ± 3.44-0.61 ± 1.23
wetland10.080.00110.160.0020.080.16--
Shwe-U-Daungaquaculture41.230.00441.310.0040.31 ± 0.260.33 ± 0.290.02 ± 0.040.02 ± 0.04
barren---41.800.006-0.45 ± 0.17--
cropland4245.560.1398977.460.2371.08 ± 1.980.87 ± 1.110.32 ± 1.000.17 ± 0.46
crop plantation31.060.00331.800.0060.35 ± 0.290.60 ± 0.21-0.03 ± 0.05
deciduous12787640.3623.362173812,391.3137.8885.98 ± 79.907.13 ± 166.002.80 ± 46.80 3.72 ± 102.00
evergreen74124,909.8976.166155820,037.3161.26733.62 ± 890.0012.86 ± 475.0027.79 ± 755.009.05 ± 354.00
flooded forest50.490.00160.650.0020.10 ± 0.040.11 ± 0.07--
forest plantation10.08----0.08---
grass5639.100.1205059.140.1810.70 ± 1.471.18 ± 2.260.16 ± 0.760.31 ± 0.95
rice1918.320.0562445.890.1400.96 ± 0.981.91 ± 2.410.18 ± 0.330.64 ± 1.18
shrub12348.670.14919584.580.2590.40 ± 0.900.43 ± 0.860.06 ± 0.320.05 ± 0.30
wetland---23.520.011-1.76 ± 1.45--
Table 3. Estimated range of Red List species in enacted PADDD areas compared to remaining part of PAs (unPADDD areas).
Scientific Name IUCN Red List StatusPercent of Range in Pidaung (%)Percent of Range in Pyin-Oo-Lwin (%)Percent of Range in Shwe-U-Daung (%)
MyanmarGlobalUnPADDDPADDDUnPADDDPADDDUnPADDDPADDD
Hoolock leuconedysVUVU3.7671.27--95.7782.97
Trachypithecus shortridgeiENEN100.00100.00----
Coelops frithiiENNT100.00100.00--66.90-
Cynopterus brachyotisVULC100.00100.00100.00100.0033.10100.00
Hipposideros lyleiENLC100.00100.00100.00100.00100.00100.00
Panthera pardusENVU----87.240.42
Ursus thibetanusVUVU100.00100.00--100.00100.00
Elephas maximusENEN-0.8414.409.7827.18100.00
Helarctos malayanusVUVU100.00100.00--97.44100.00
Amyda ornate phayreiCRNA100.00100.00100.00100.00100.00100.00
Cuora mouhotiiCREN100.00100.00--66.90-
Heosemys grandisCRVU100.00100.00----
Manouria impressaCRVU100.00100.00--66.90-
Platystenon megacephalumCREN----66.89-
Under the threatened list of IUCN Red List categories, CR refers to Critically Endangered, EN as Endangered, VU as Vulnerable; under the lower-risk category, NT refers to Near Threatened, LC as Least Concern; and NA refers to Not Assessed.
Disclaimer/Publisher’s Note: The statements, opinions and data contained in all publications are solely those of the individual author(s) and contributor(s) and not of MDPI and/or the editor(s). MDPI and/or the editor(s) disclaim responsibility for any injury to people or property resulting from any ideas, methods, instructions or products referred to in the content.