Spatio-Temporal Evolution Characteristics of Land Consolidation in the Coastal Regions: A Typical Case Study of Lianyungang, China
Abstract
1. Introduction
2. Materials and Methods
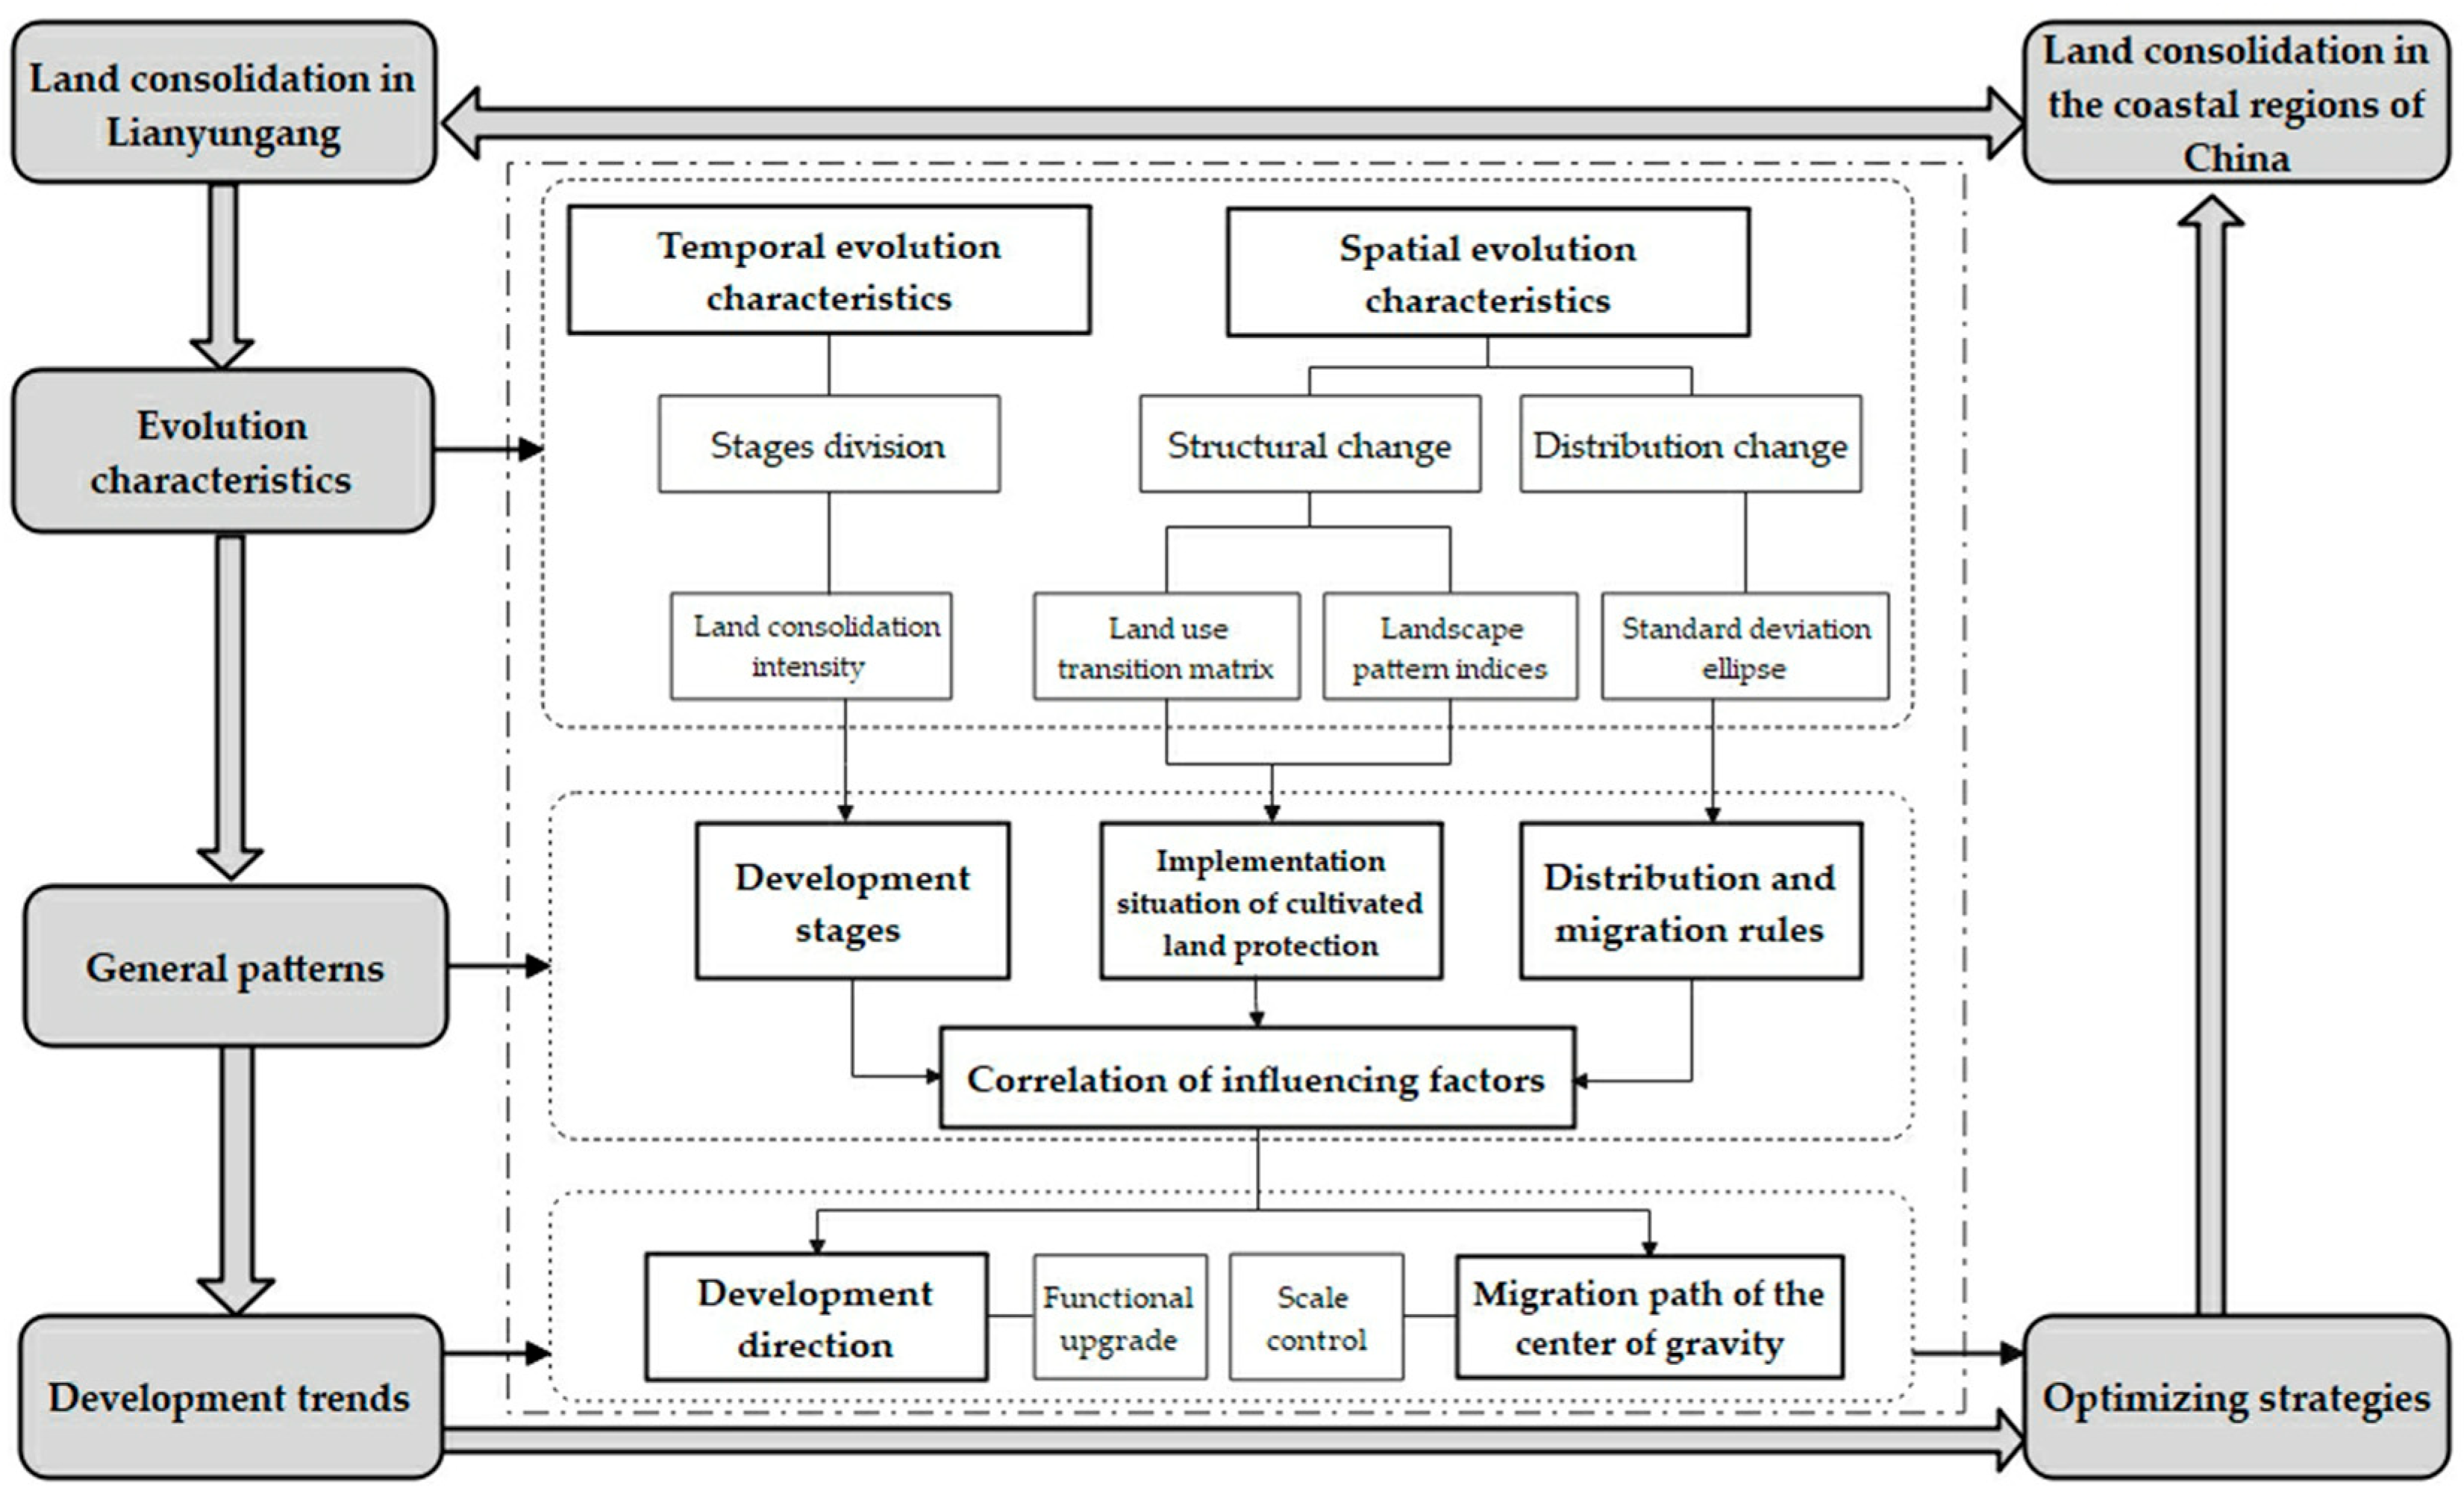
2.1. Research Framework
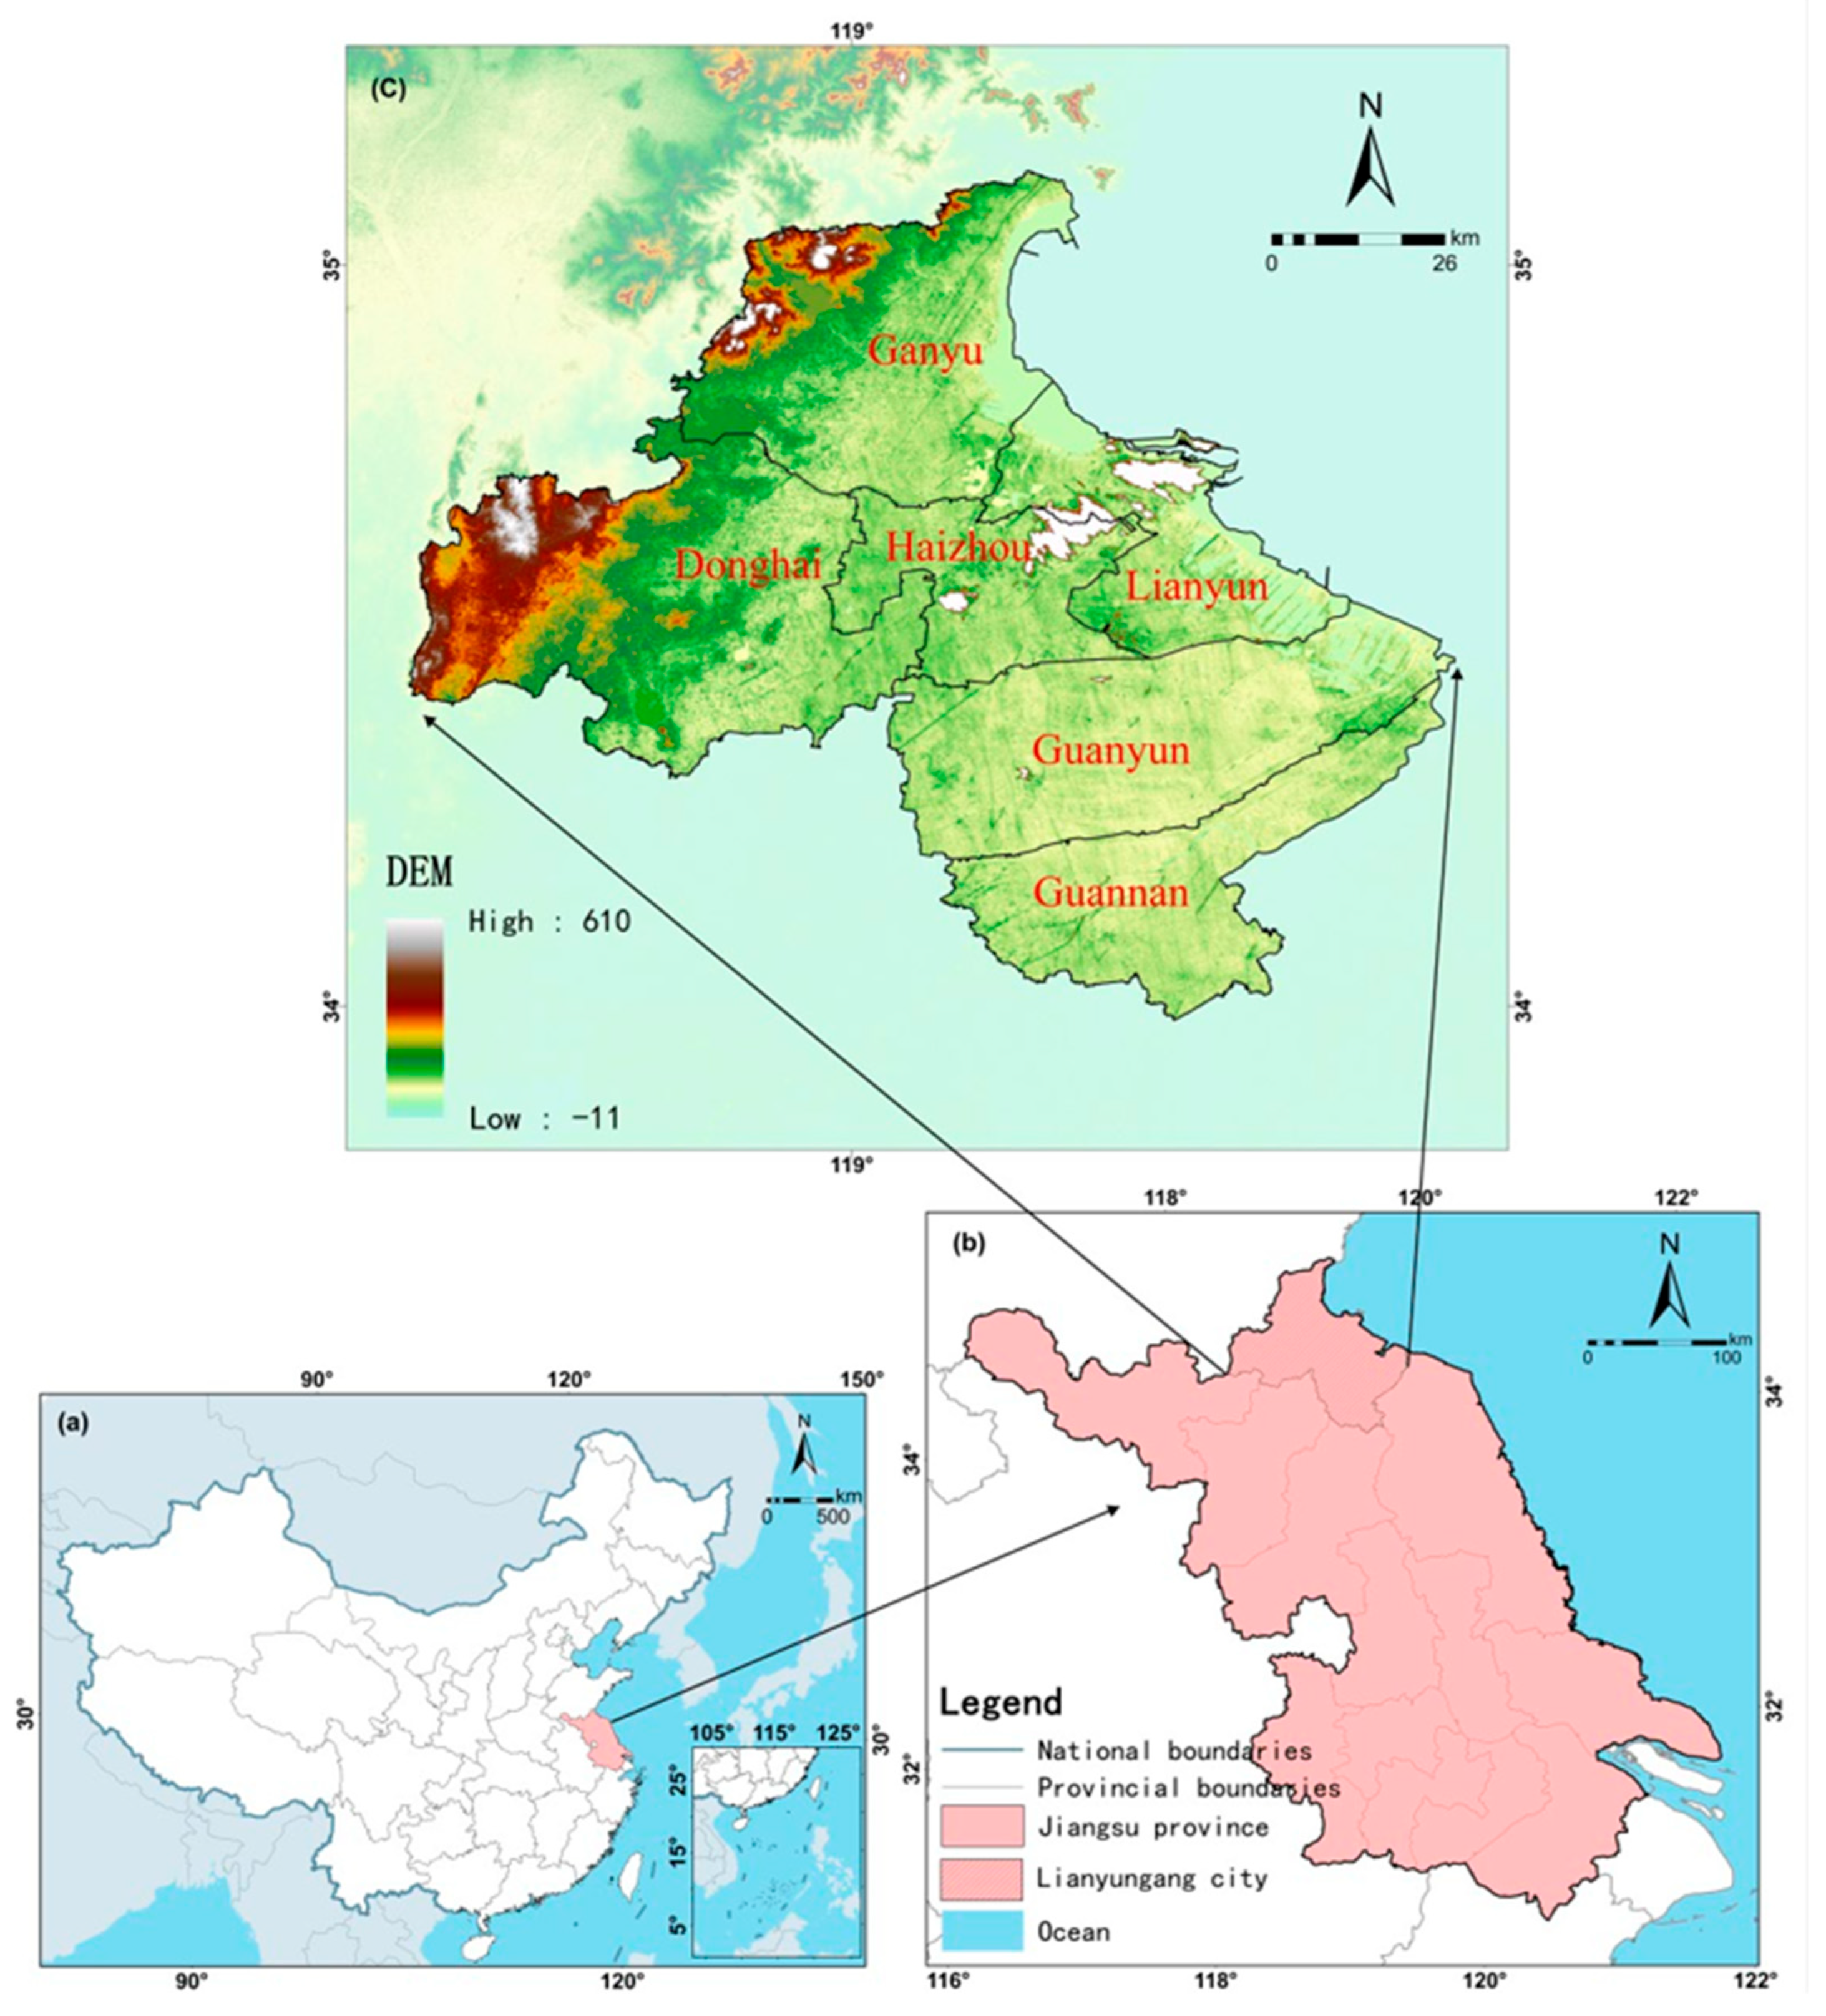
2.2. Study Area
- (1)
- Geographically central position within China’s coastal belt;
- (2)
- Transitional physiography bridging northern and southern landforms;
- (3)
- Median economic status among peer coastal cities;
- (4)
- Role as a national policy testing ground.
2.3. Data Sources
- (1)
- Land use and cover data are from the China Land Cover Dataset (CLCD) from 2002 to 2022, with a 30 m spatial resolution; the database was developed by Professors Jie Yang and Xin Huang of Wuhan University in China. The overall accuracy of CLCD reached 79.31% based on 5463 visually interpreted samples [27] (http://doi.org/10.5281/zenodo.4417809, accessed on 20 July 2025).
- (2)
- Digital Elevation Model (DEM) Data were generated using ASTER GDEM V2 data, with a 30 m spatial resolution; from the Geospatial Data Cloud platform (http://www.gscloud.cn/ accessed on 29 June 2024).
- (3)
- Land consolidation project data for 2002–2022 are from the Lianyungang Natural Resources and Planning Department; data are from provincial, prefectural, and county-level funded land reclamation, development, and consolidation projects. Vector data processing was performed to aggregate vector boundaries of all projects into a single layer.
- (4)
- Socioeconomic Data, including data on cultivated land area, permanent population, regional GDP, fixed asset investment, and related statistics are from the Lianyungang Statistical Yearbook, annual economic and social development bulletins, the Lianyungang Overall Land Use Plan (2006–2020), and the Lianyungang Territorial Space Master Plan (2021–2035).
2.4. Research Methods
2.4.1. Land Consolidation Intensity
2.4.2. Land Use Transition Matrix
2.4.3. Landscape Pattern Indices
2.4.4. Standard Deviation Ellipse
2.4.5. Gray Correlation Analysis
3. Results
3.1. Evolution Characteristics of Land Consolidation Development Stages in Lianyungang
3.1.1. Initial Development Stage (2002–2007)
3.1.2. Gradual Growth Stage (2007–2012)
3.1.3. Rapid Growth Stage (2012–2017)
3.1.4. Stabilization and Decline Stage (2017–2022)
3.2. Analysis of Land Use Patterns and Landscape Changes in Land Consolidation
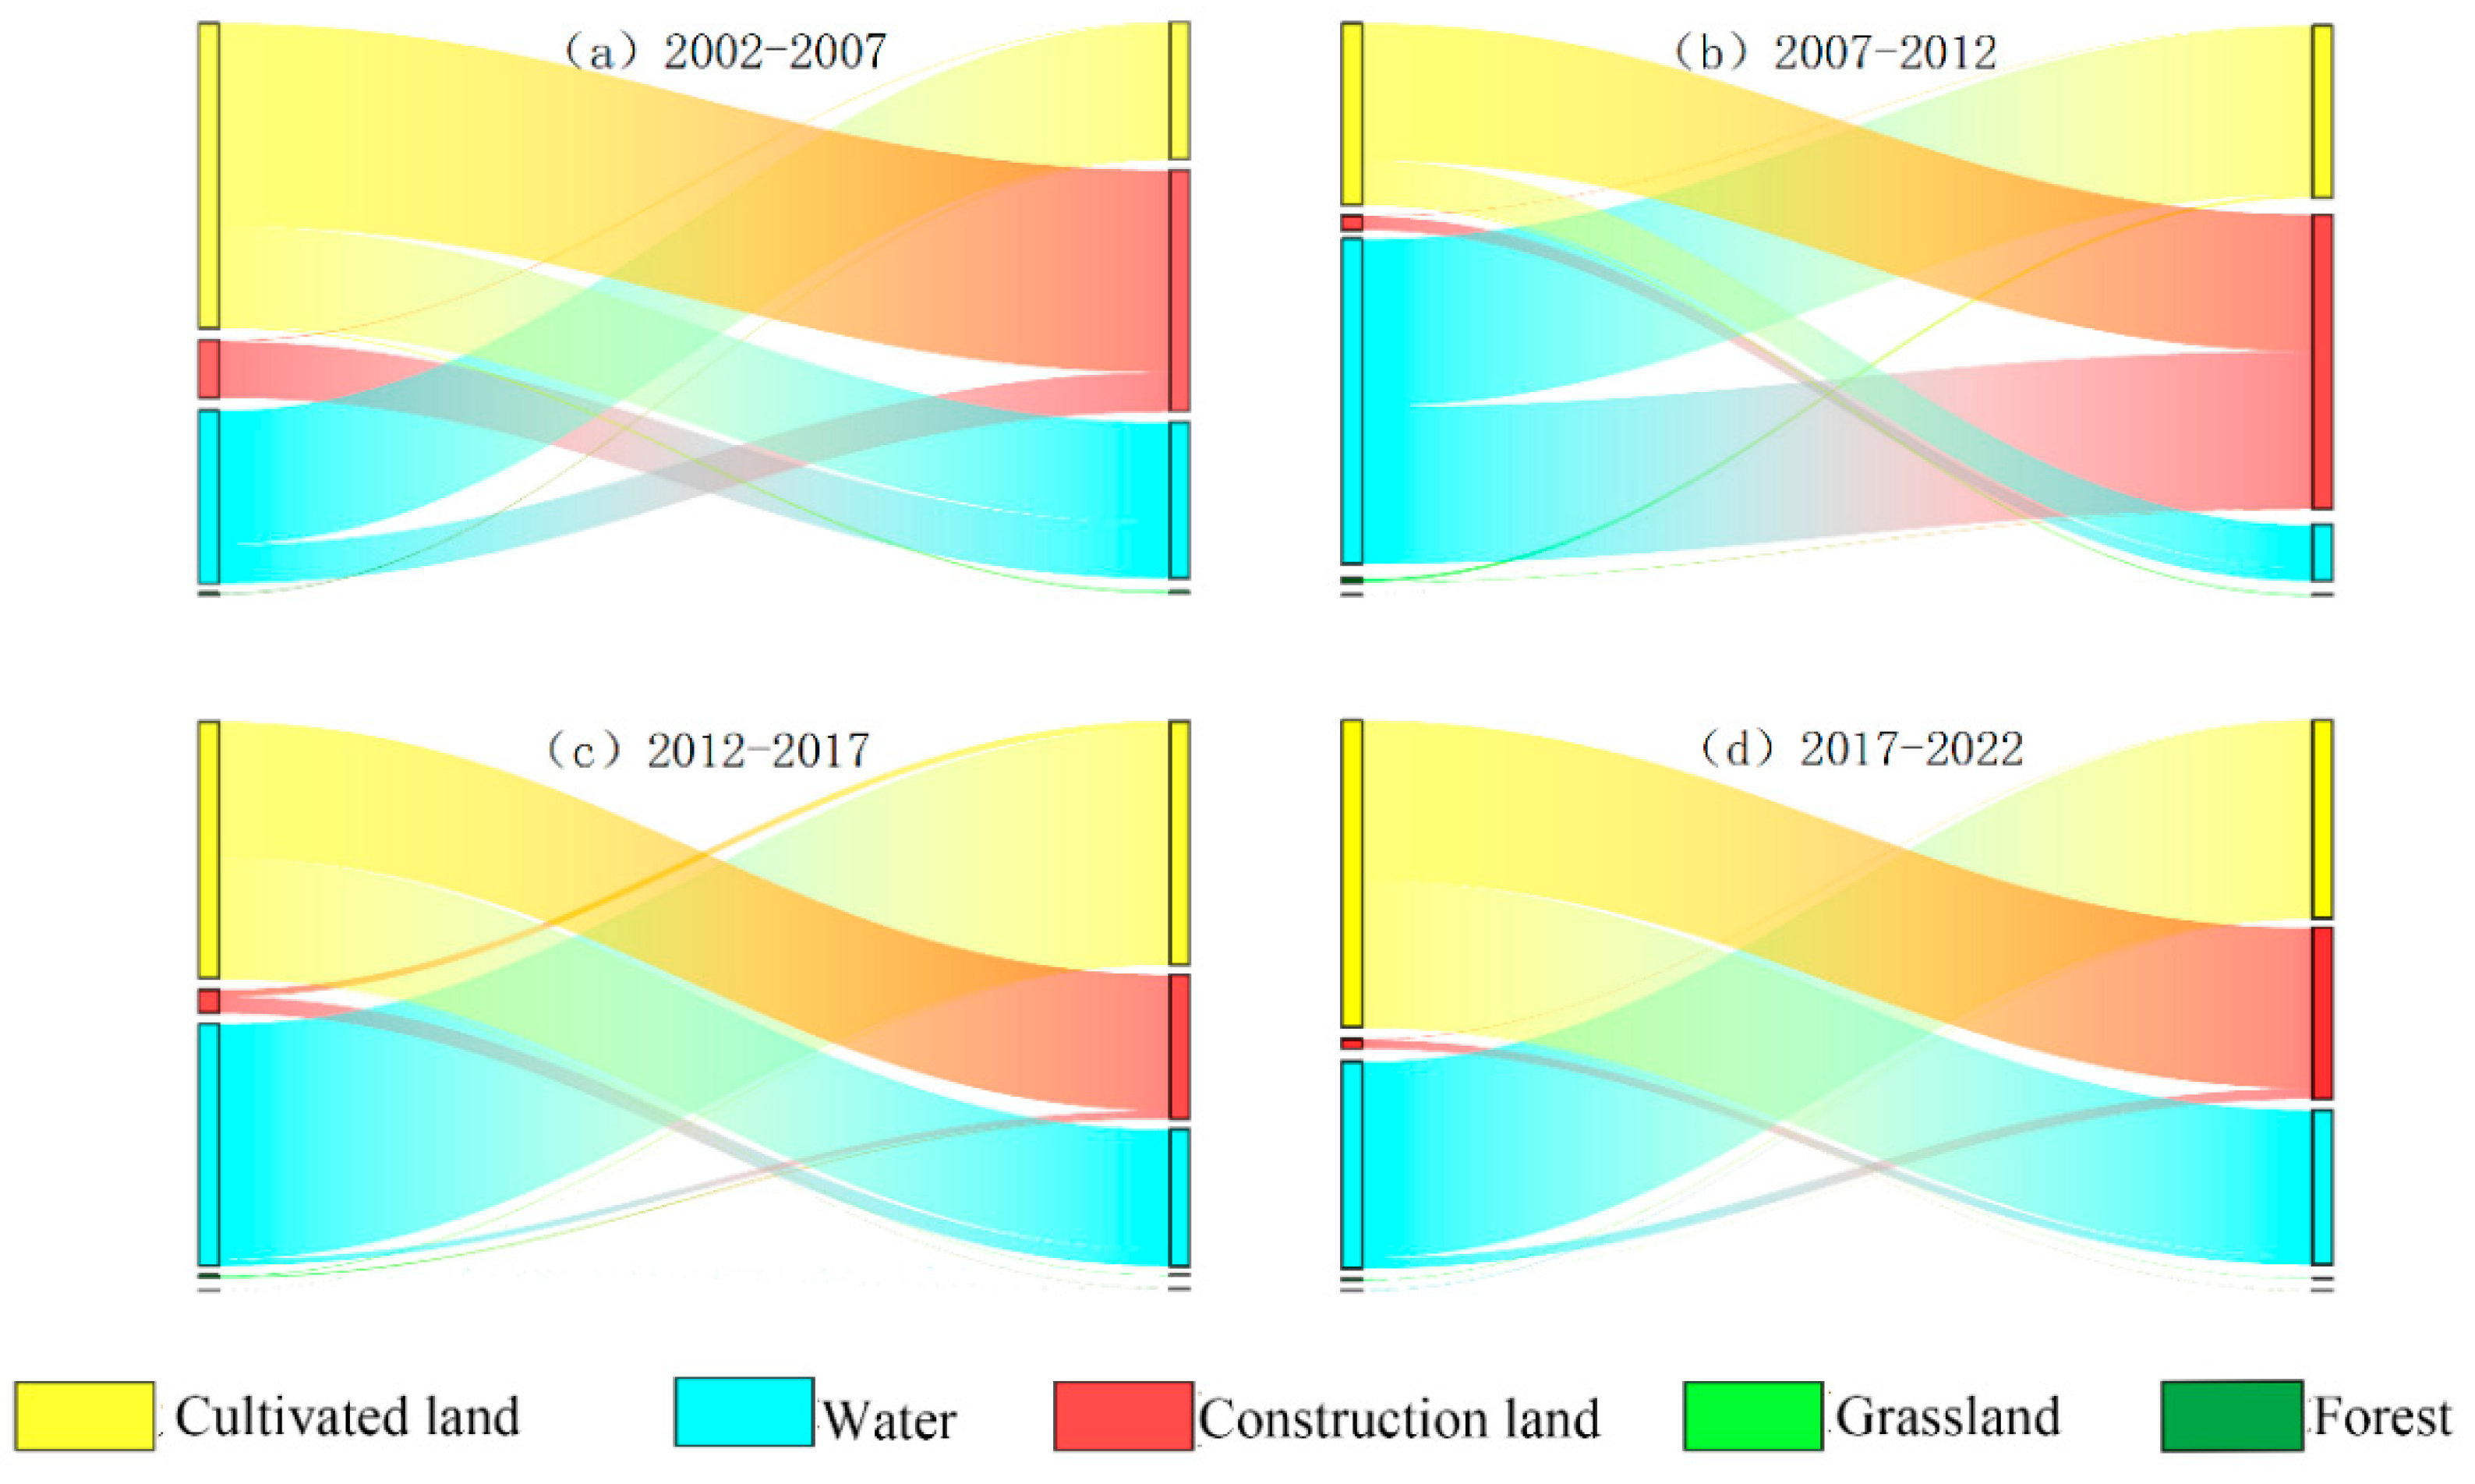
3.2.1. Analysis of Land Use Pattern Changes
3.2.2. Analysis of Landscape Pattern Changes
3.3. Analysis of the Center of Gravity Migration in the Spatial Distribution of Land Consolidation
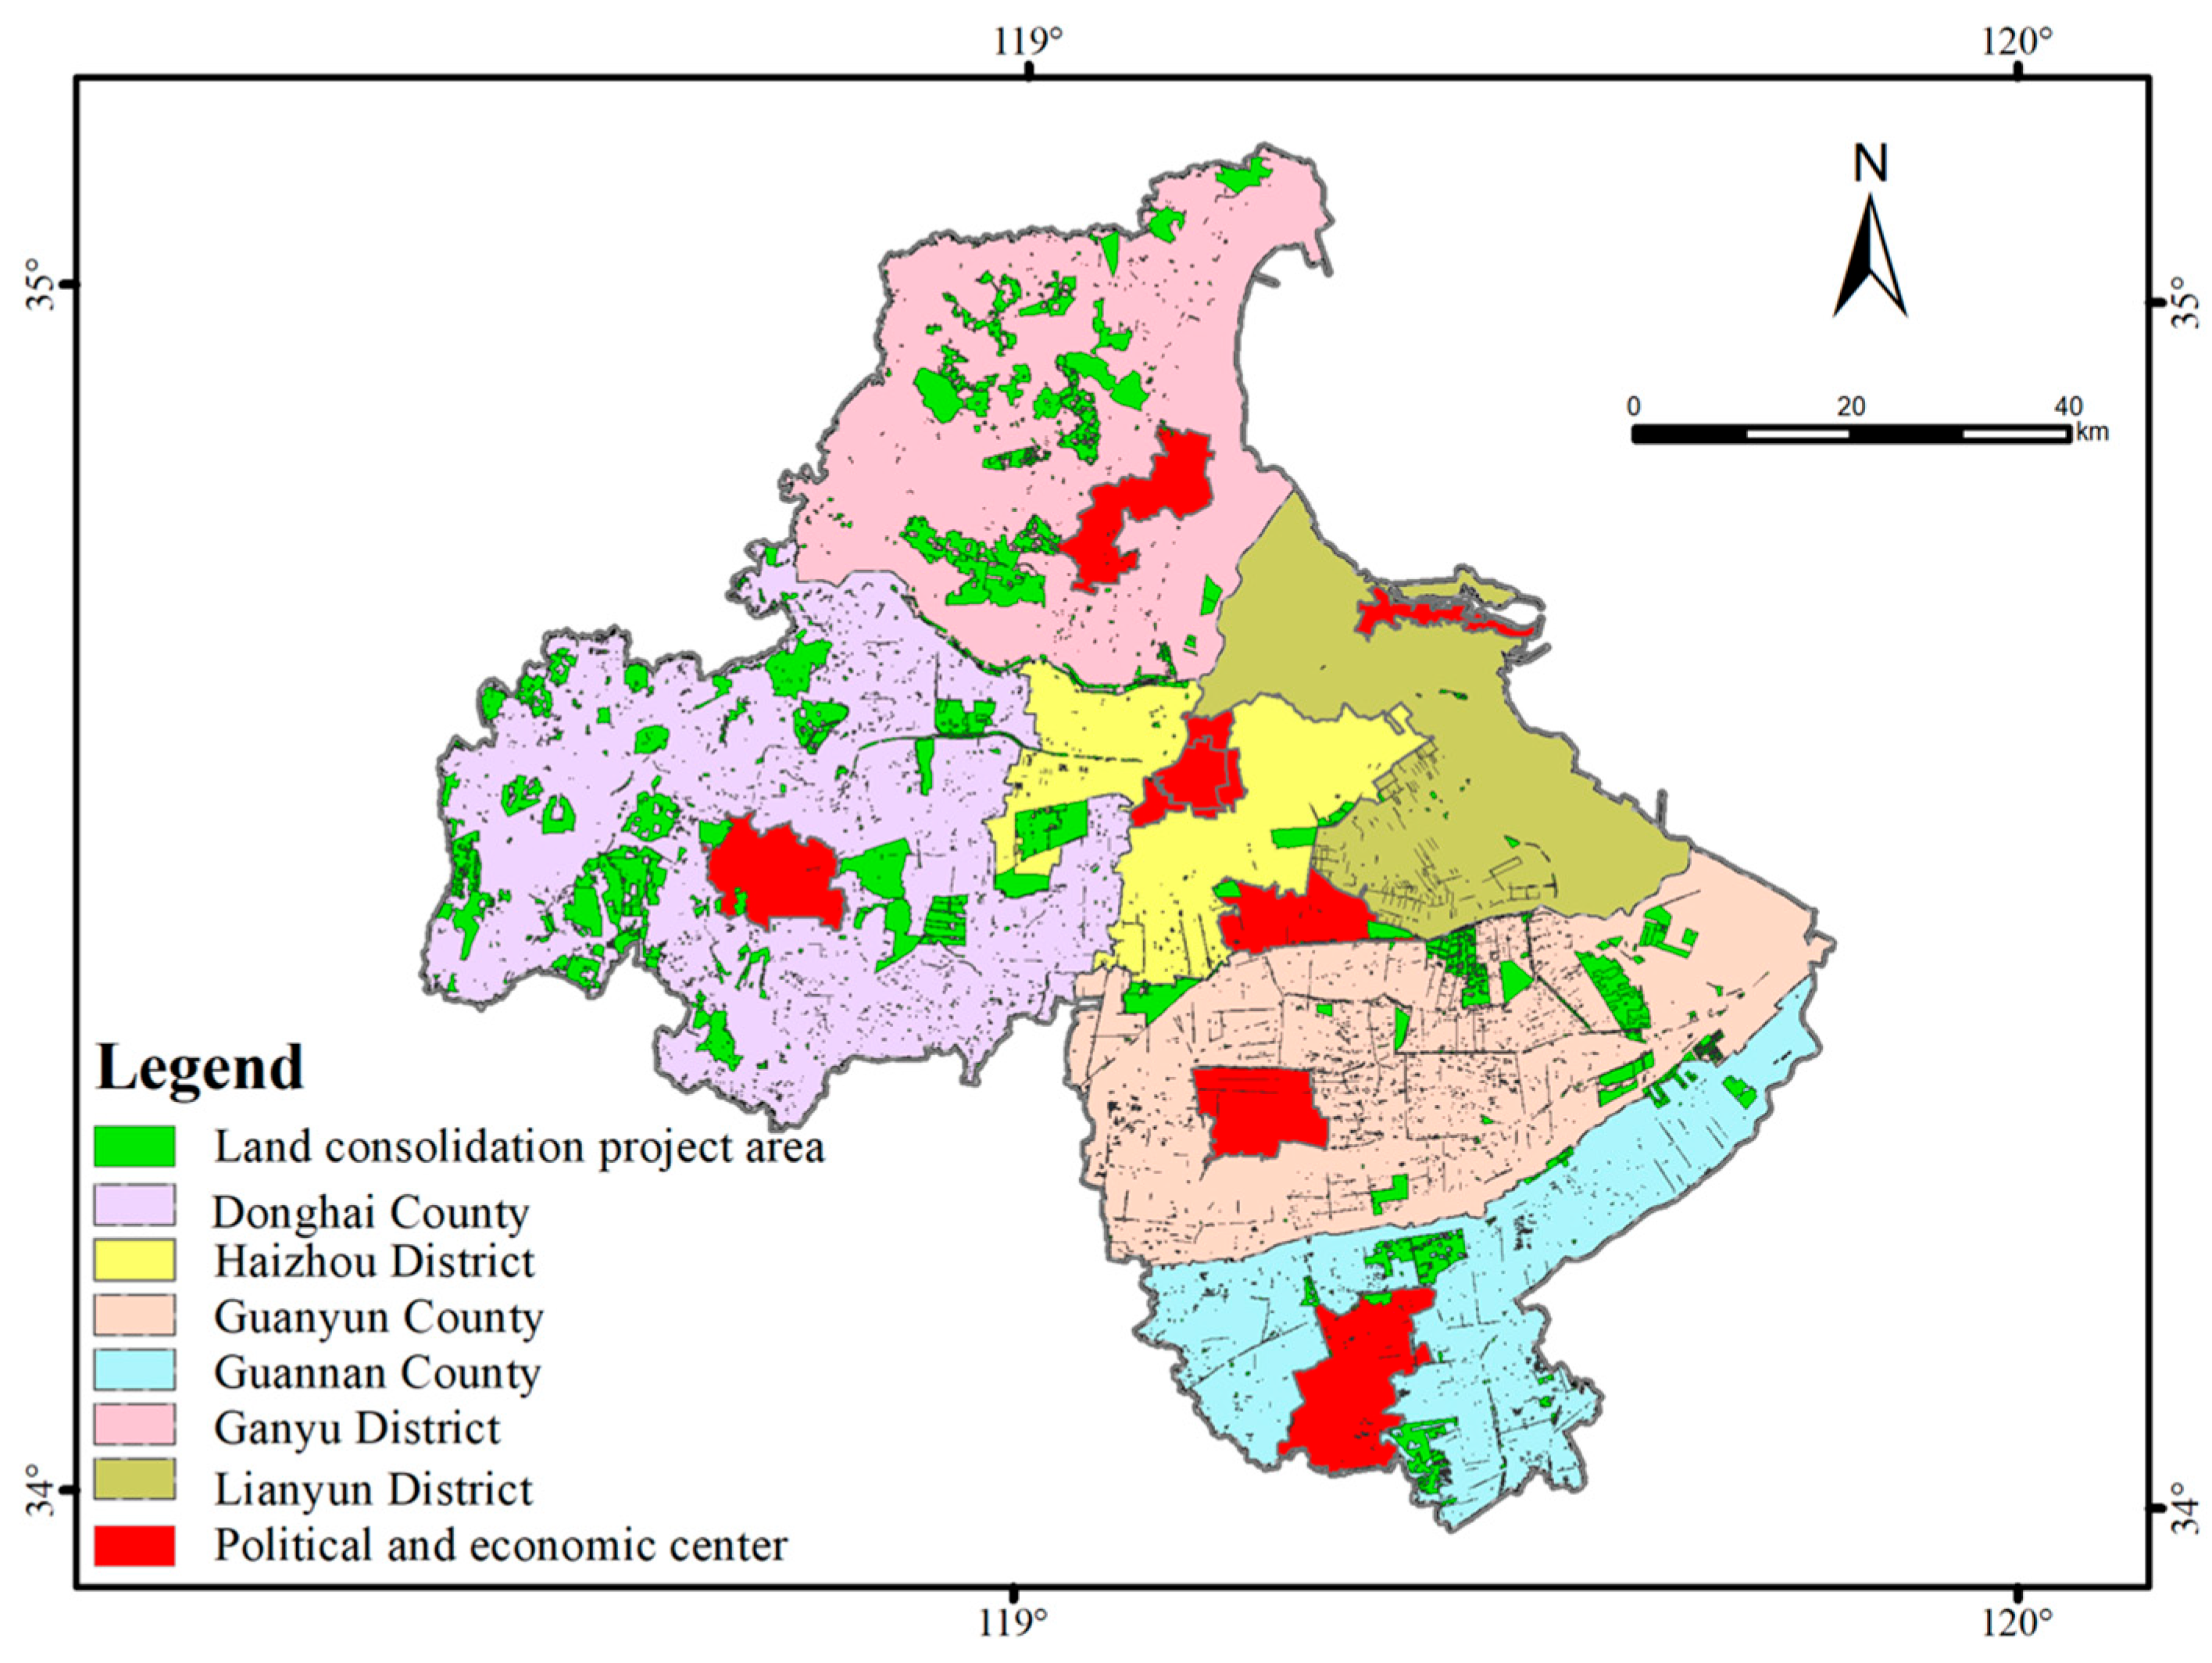
3.3.1. Spatial Distribution Characteristics
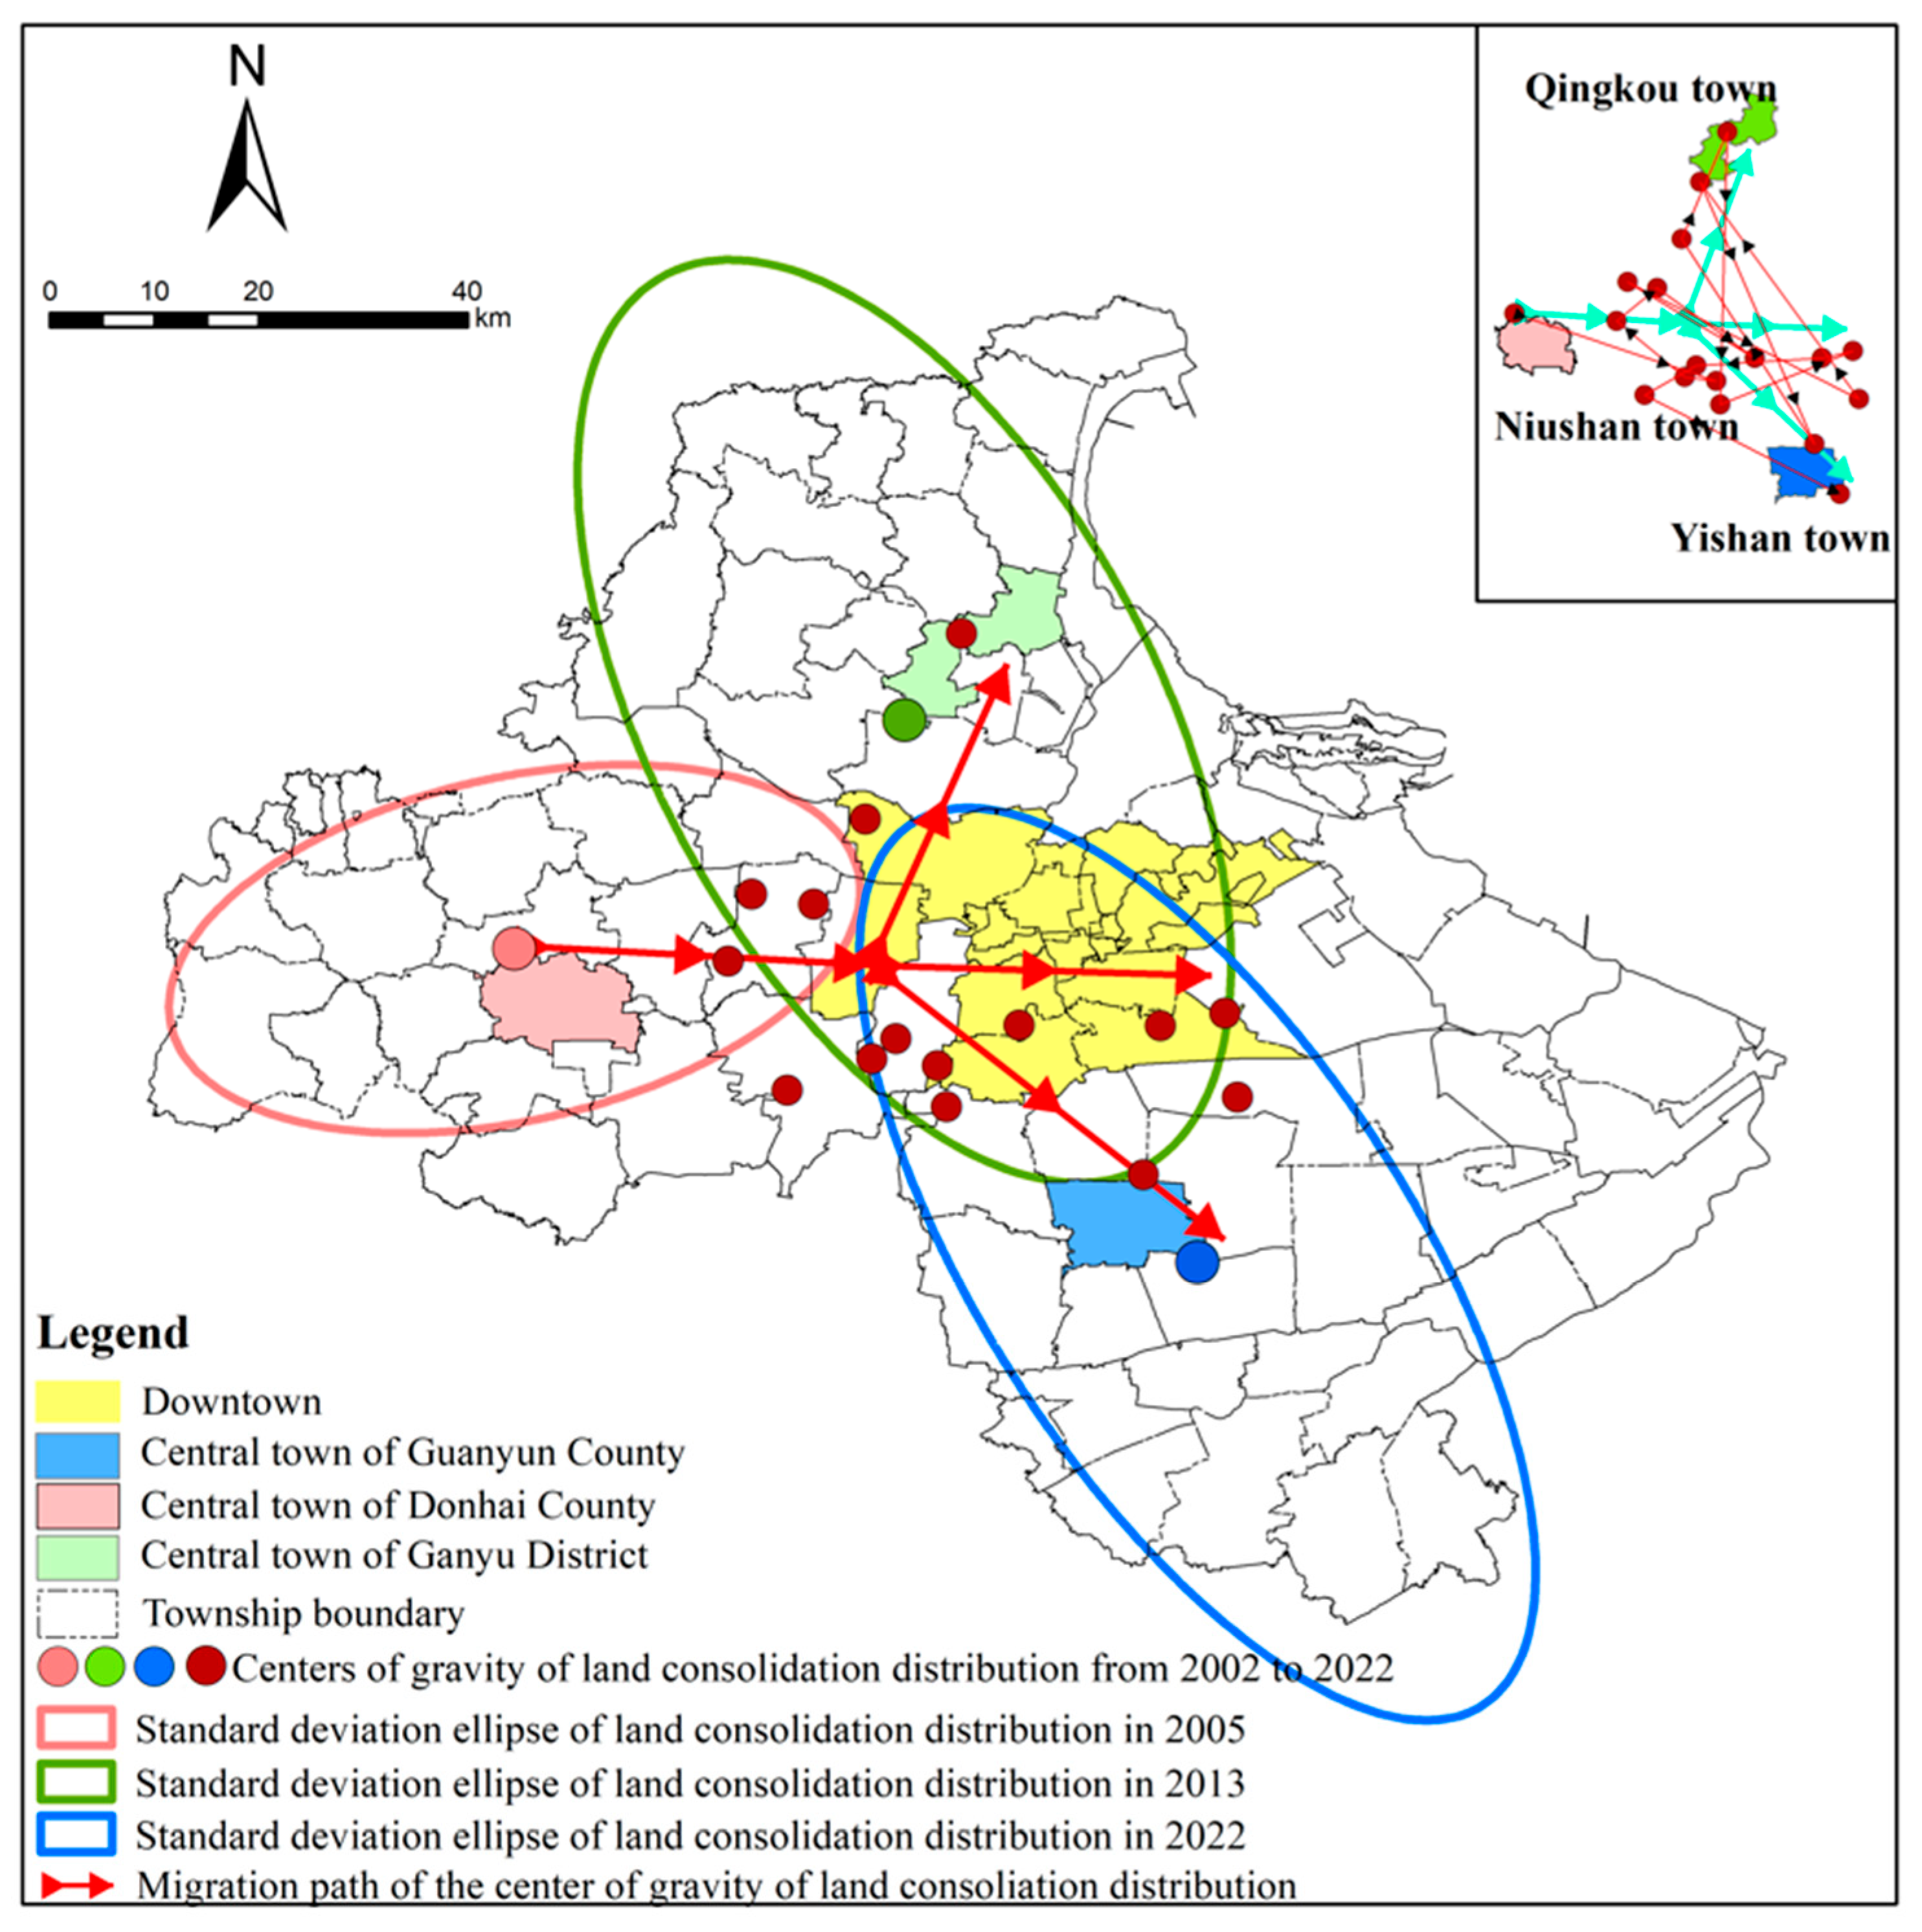
3.3.2. Distribution Center of Gravity Migration Trajectory
3.3.3. Changes in Spatial Distribution Shape
3.4. Gray Correlation Degree Between Land Consolidation and Its Factors
3.4.1. Indicator Selection
- (1)
- Economic Indicators (Material Foundation). Economic variables reflect the fiscal and productive capacities essential for implementing land consolidation. The combined output of the primary, secondary, and tertiary sectors shapes overall productivity, which in turn affects resource allocation in land consolidation initiatives. Macroeconomic strength—measured through fiscal revenue and GDP—governs the financial feasibility of land improvement projects, while fixed asset investment serves as a critical indicator of capital formation capacity for the infrastructure development required in land consolidation. These economic variables collectively establish the necessary material conditions for effective planning, financing, and implementation of land consolidation programs.
- (2)
- Social Indicators (Demand & Infrastructure). Social Indicators (Demand & Infrastructure). The social indicators cover two aspects: the supply-demand drive of food security and the support from infrastructure. The permanent resident population serves as the benchmark indicator for land development and land use policy formulation, and also acts as a driving factor for land improvement needs. The effective cropland irrigation area and the total power of agricultural machinery are directly related to the infrastructure support needed by land improvement. The total grain output indirectly reflects the demand for land supply by the population.
- (3)
- Policy Indicators (Regulatory Constraints). Policy variables quantify institutional governance over land use. Cultivated land protection tasks are mandatory conservation targets from government planning. Area of cultivated land occupied by government-approved construction is trade-offs between development and preservation. These are the frequently mentioned policies in the Chinese government documents. The key way to implement these two policies is through land consolidation.
3.4.2. Calculation Results
4. Discussion
4.1. Feasibility and Applicability of the Research Framework
4.2. The Spatio-Temporal Evolution Characteristics of Land Consolidation in the Coastal Regions of China and the General Patterns in China
- (1)
- Developmental stages division: Land consolidation in the coastal regions of China corresponded to changes in national policy orientation over different periods showing a development trajectory characterized by initial development (2002–2007), gradual growth (2007–2012), and rapid growth (2012–2017). After a period of rapid growth, it reaches a relatively stable state (2017–2022). The development phases identified in this study align closely with the classification by Jian Zhou et al., which defines three periods in China’s land consolidation: the cultivated land expansion period (1986–2007), the multi-type consolidation period (2008–2012), and the comprehensive consolidation period (2013–present). Establishing scientifically defined stages provides a vital basis for policymakers to forecast consolidation trajectories and design rational deployment strategies. Under stable macroeconomic conditions and consistent agricultural land preservation policies, China’s land consolidation sector is likely to remain in a phase of moderate stability.
- (2)
- Spatial evolution characteristics: From the perspective of distribution characteristics and migration trajectory, the center of gravity of land consolidation distribution was generally concentrated in the regional economic and political centers of Lianyungang. The spatial gravity center of land consolidation activities in Lianyungang migrated from interior western regions to coastal eastern territories during the study period. The findings of this study were consistent with those reported by Guoxin Xu, whose research indicated that land consolidation projects in China were predominantly located in the economically developed eastern regions. Moreover, the spatial gravity center of these projects was observed to have shifted northeastward from the initial benchmark in Hunan Province toward coastal provinces such as Shandong, Jiangsu, and Zhejiang [41]. This spatial shift is in line with China’s national strategic reorientation from land-based agricultural development to ocean-oriented economic growth. It indicates that the changes in the center of migration of land consolidation were significantly influenced by national development strategies and industrial policy orientations.
- (3)
- Driving factors: Through gray correlation analysis, the research using human factors indicated that the economic development level significantly influenced land consolidation implementation, making it the primary factor. This finding aligns with the research outcomes of most geo-economics scholars. However, diverging from existing studies, this research further reveals that policy and social factors played a secondary, but important, guiding role in land consolidation. The 12-indicator system balances theoretical relevance (covering economic-social-policy trilemma) and empirical feasibility (data availability across coastal regions).
4.3. Future Development Trends and Optimizing Strategies of Land Consolidation in China
- (1)
- Functional transition from economic to multi-dimensional governance is underway, with land consolidation projected to become an integral part of local development planning. In China, its role has expanded beyond cropland protection and food security to serve as a key social instrument for ecological restoration, rural revitalization, and urban-rural integration. Under the “Coastal Zone Protection and Restoration Project”, forthcoming policies for coastal land protection will follow the ecological restoration principle of “protection first, natural restoration as the priority” while balancing socio-economic needs. Multi-functional land consolidation is likely to play a pivotal role in territorial spatial planning, urban-rural benefit distribution, and social security enhancement. Examples include Beihai City’s improvement of farmland ecosystem services through systematic consolidation, Qingdao City’s slope stabilization at 21 coastal sites, and Hainan Province’s rehabilitation of existing construction land, restoring 127 km of coastline in four years. Optimizing spatial functions will require improving agricultural production conditions, guiding rural development, safeguarding farmers’ interests, adjusting urban industrial structures, planning regional spatial layouts, and fostering urban cultural development.
- (2)
- Spatial realignment driven by industrial relocation is reshaping China’s land consolidation geography. During the study period, the consolidation distribution center shifted coastward, aligning with national strategies along rivers, coastlines, and borders. Now, shifting international dynamics and domestic demands are driving the relocation of capital-, technology-, and labor-intensive industries from eastern coasts to central and western hinterlands, positioning inland regions as new strategic growth frontiers. This westward industrial migration is expected to fundamentally reconfigure consolidation patterns, with inland areas projected to replace coastal zones as primary hotspots. To support this transition, inland and western cities should expand consolidation to accommodate industrial relocation and development, while eastern coastal cities should scale back deployment due to declining industrial advantages, land development saturation, and reduced future demand.
4.4. Limitations and Uncertainties
5. Conclusions
Author Contributions
Funding
Data Availability Statement
Conflicts of Interest
References
- Xu, M.; Niu, L.; Wang, X.; Zhang, Z. Evolution of Farmland Landscape Fragmentation and its Driving Factors in the Beijing-Tianjin-Hebei Region. J. Clean. Prod. 2023, 418, 138031. [Google Scholar] [CrossRef]
- Gupta, P.; Bharat, A.; Mccullen, N.; Kershaw, T. Promoting Sustainable Land Management: An Innovative Approach to Land-Take Decision-Making. Land Use Policy 2025, 149, 107419. [Google Scholar] [CrossRef]
- Liu, H.; Qin, L.; Xing, M.; Yan, H.; Shang, G.; Yuan, Y. Effects of Production-Living-Ecological Space Patterns Changes On Land Surface Temperature. Remote Sens. 2023, 15, 3683. [Google Scholar] [CrossRef]
- Qi, X.; Dang, H. Addressing the Dual Challenges of Food Security and Environmental Sustainability During Rural Livelihood Transitions in China. Land Use Policy 2018, 77, 199–208. [Google Scholar] [CrossRef]
- Sun, Y.; Miao, Y.; Xie, Z.; Jiang, X. Address the Challenge of Cultivated Land Abandonment by Cultivated Land Adoption: An Evolutionary Game Perspective. Land Use Policy 2025, 149, 107412. [Google Scholar] [CrossRef]
- Li, Y.; Wu, W.; Liu, Y. Land Consolidation for Rural Sustainability in China: Practical Reflections and Policy Implications. Land Use Policy 2018, 74, 137–141. [Google Scholar] [CrossRef]
- Zhou, J.; Cao, X. What is the Policy Improvement of China’S Land Consolidation? Evidence From Completed Land Consolidation Projects in Shaanxi Province. Land Use Policy 2020, 99, 104847. [Google Scholar] [CrossRef]
- Chen, L.; Song, G.; Meadows, M.E.; Zou, C. Spatio-Temporal Evolution of the Early-Warning Status of Cultivated Land and its Driving Factors: A Case Study of Heilongjiang Province, China. Land Use Policy 2018, 72, 280–292. [Google Scholar] [CrossRef]
- Zhou, Y.; Li, Y.; Xu, C. Land Consolidation and Rural Revitalization in China: Mechanisms and Paths. Land Use Policy 2020, 91, 104379. [Google Scholar] [CrossRef]
- Lisec, A.; Primožič, T.; Ferlan, M.; Aumrada, R.; Drobne, S. Land Owners’ Perception of Land Consolidation and their Satisfaction with the Results—Slovenian Experiences. Land Use Policy 2014, 38, 550–563. [Google Scholar] [CrossRef]
- Grčman, H.; Zupanc, V. Compensation for Soil Degradation After Easement of Agricultural Land for a Fixed Period. Geod. Vestn. 2018, 62, 235–248. [Google Scholar] [CrossRef]
- Zhao, Q.; Jiang, G.; Wang, M. The Allocation Change of Rural Land Consolidation Type Structure Under the Influence Factors of Different Geographical and Economic Development of China. Int. J. Environ. Res. Public Health 2023, 20, 5194. [Google Scholar] [CrossRef]
- Guo, B.; Fang, Y.; Jin, X.; Zhou, Y. Monitoring the Effects of Land Consolidation On the Ecological Environmental Quality Based On Remote Sensing: A Case Study of Chaohu Lake Basin, China. Land Use Policy 2020, 95, 104569. [Google Scholar] [CrossRef]
- Jiang, G.; Wang, X.; Yun, W.; Zhang, R. A New System Will Lead to an Optimal Path of Land Consolidation Spatial Management in China. Land Use Policy 2015, 42, 27–37. [Google Scholar] [CrossRef]
- Jiang, G.; Zhang, R.; Ma, W.; Zhou, D.; Wang, X.; He, X. Cultivated Land Productivity Potential Improvement in Land Consolidation Schemes in Shenyang, China: Assessment and Policy Implications. Land Use Policy 2017, 68, 80–88. [Google Scholar] [CrossRef]
- Jiang, Y.; Long, H.; Tang, Y.; Deng, W. Measuring the Role of Land Consolidation to Community Revitalization in Rapidly Urbanizing Rural China: A Perspective of Functional Supply-Demand. Habitat Int. 2025, 155, 103237. [Google Scholar] [CrossRef]
- Chen, L.; Zhou, G.; Feng, B.; Wang, C.; Luo, Y.; Li, F.; Shen, C.; Ma, D.; Zhang, C.; Zhang, J. Saline-Alkali Land Reclamation Boosts Topsoil Carbon Storage by Preferentially Accumulating Plant-Derived Carbon. Sci. Bull. 2024, 69, 2948–2958. [Google Scholar] [CrossRef] [PubMed]
- Kocur-Bera, K.; Małek, A. Assessing the Feasibility of Using Remote Sensing Data and Vegetation Indices in the Estimation of Land Subject to Consolidation. Sensors 2024, 24, 7736. [Google Scholar] [CrossRef] [PubMed]
- Li, B.; Zhao, S.; Zhang, W.; Liu, N.; Xu, H.; Wei, X.; Wang, Z.; Wang, T.; Li, X. Reclamation History and Land Use Types Across Multiple Spatial Scales Shape Anuran Communities in the Coastal Land Reclamation Region. J. Environ. Manag. 2024, 353, 120262. [Google Scholar] [CrossRef] [PubMed]
- Wang, J.; Yan, S.; Guo, Y.; Li, J.; Sun, G. The Effects of Land Consolidation On the Ecological Connectivity Based On Ecosystem Service Value: A Case Study of Da’an Land Consolidation Project in Jilin Province. J. Geogr. Sci. 2015, 25, 603–616. [Google Scholar] [CrossRef]
- Xia, M.; Wang, L.; Wen, B.; Zou, W.; Ou, W.; Qu, Z. Land Consolidation Zoning in Coastal Tidal Areas Based On Landscape Security Pattern: A Case Study of Dafeng District, Yancheng, Jiangsu Province, China. Land 2021, 10, 145. [Google Scholar] [CrossRef]
- Xu, Y.; Pu, L.; Zhang, R.; Zhu, M.; Zhang, M.; Bu, X.; Xie, X.; Wang, Y. Effects of Agricultural Reclamation On Soil Physicochemical Properties in the Mid-Eastern Coastal Area of China. Land 2021, 10, 142. [Google Scholar] [CrossRef]
- Luo, W.; Timothy, D.J. An Assessment of Farmers’ Satisfaction with Land Consolidation Performance in China. Land Use Policy 2017, 61, 501–510. [Google Scholar] [CrossRef]
- Zhou, Y.; Li, X.; Liu, Y. Cultivated Land Protection and Rational Use in China. Land Use Policy 2021, 106, 105454. [Google Scholar] [CrossRef]
- Cui, Y.; Wang, W.; Wang, Q.; Li, Q. Characteristics and Optimization Strategies of Multi-Subject Governance Network Structure for Land Consolidation. J. Rural Stud. 2024, 112, 103470. [Google Scholar] [CrossRef]
- Xijiri; Zhou, R.; Bao, B.; Burenjirigala. Spatiotemporal Patterns and Drivers of Cultivated Land Conversion in Inner Mongolia Autonomous Region, Northern China. J. Arid Land 2024, 16, 1197–1213. [Google Scholar] [CrossRef]
- Yang, J.; Huang, X. The 30 M Annual Land Cover Dataset and its Dynamics in China from 1990 to 2019. Earth Syst. Sci. Data 2021, 13, 3907–3925. [Google Scholar] [CrossRef]
- Zhai, D.; Zhang, X.; Zhuo, J.; Mao, Y. Driving the Evolution of Land Use Patterns: The Impact of Urban Agglomeration Construction Land in the Yangtze River Delta, China. Land 2024, 13, 1514. [Google Scholar] [CrossRef]
- Cheng, Y.; Chen, Y. Spatial and Temporal Characteristics of Land Use Changes in the Yellow River Basin from 1990 to 2021 and Future Predictions. Land 2024, 13, 1510. [Google Scholar] [CrossRef]
- Zhang, P.; Xia, L.; Sun, Z.; Zhang, T. Analysis of Spatial and Temporal Changes and Driving Forces of Arable Land in the Weibei Dry Plateau Region in China. Sci. Rep. 2023, 13, 20618. [Google Scholar] [CrossRef]
- Chen, Z.; Li, X.; Xia, X. Temporal-Spatial Pattern and Driving Factors of Cultivated Land Use Transition at Country Level in Shaanxi Province, China. Environ. Monit. Assess. 2022, 194, 365. [Google Scholar] [CrossRef]
- Li, S.; Feng, C.; Yang, L. Spatiotemporal Patterns of Evapotranspiration in the Xiangjiang River Basin From 2000 to 2020. Hydrol. Res. 2023, 54, 924–944. [Google Scholar] [CrossRef]
- Ying, K.; Ha, L.; Kuang, Y.; Ding, J. Population Distribution in Guizhou’s Mountainous Cities: Evolution of Spatial Pattern and Driving Factors. Land 2024, 13, 1469. [Google Scholar] [CrossRef]
- Zhang, Y.; Jiang, P.; Cui, L.; Yang, Y.; Ma, Z.; Wang, Y.; Miao, D. Study On the Spatial Variation of China’S Territorial Ecological Space Based On the Standard Deviation Ellipse. Front. Environ. Sci. 2022, 10, 982734. [Google Scholar] [CrossRef]
- Zhong, Y.; Lin, A.; He, L.; Zhou, Z.; Yuan, M. Spatiotemporal Dynamics and Driving Forces of Urban Land-Use Expansion: A Case Study of the Yangtze River Economic Belt, China. Remote Sens. 2020, 12, 287. [Google Scholar] [CrossRef]
- Hu, X.; Tan, T. Gray Correlation Degree Study On Changsha-Zhuzhou-Xiangtan Urban Construction Land Structure and Economic Development. In Proceedings of the 20th International Symposium on Advancement of Construction Management and Real Estate; Shan, L., Luo, J., Zheng, S., Wang, W., Wu, Y., Mo, Z., Eds.; Springer Singapore Pte. Limited: Singapore, 2016; Volume 1, pp. 159–168. [Google Scholar] [CrossRef]
- Chen, Q.; Wu, M.; Xie, H. Tillage Conditions Or Social Economy? An Analysis of the Dominant Driving Force of Farmland Marginalization From the Farmers’ Perspective. Land Use Policy 2023, 133, 106870. [Google Scholar] [CrossRef]
- Schürmann, A.; Kleemann, J.; Fürst, C.; Teucher, M. Assessing the Relationship Between Land Tenure Issues and Land Cover Changes Around the Arabuko Sokoke Forest in Kenya. Land Use Policy 2020, 95, 104625. [Google Scholar] [CrossRef]
- Wang, W.; Shen, Y.; Qiao, J.; Wang, Y.; Batala, L.K.; Xiao, J. The Impact of Urban-Rural Residents’ Life Quality Gap On the Cultivated Land Transfer. Land Use Policy 2025, 148, 107402. [Google Scholar] [CrossRef]
- Xue, J.; Gui, D.; Zeng, F.; Yu, X.; Sun, H.; Zhang, J.; Liu, Y.; Xue, D. Assessing Landscape Fragmentation in a Desert-Oasis Region of Northwest China: Patterns, Driving Forces, and Policy Implications for Future Land Consolidation. Environ. Monit. Assess. 2022, 194, 394. [Google Scholar] [CrossRef]
- Xu, G. Research of Implementation Analysis and Investment Efficiency Evaluation on China’s Land Remediation Projects. Master’s Thesis, Nanjing University, Nanjing, China, 2013. [Google Scholar]



| Land Use | Year | 2002 | 2007 | 2012 | 2017 | 2022 |
|---|---|---|---|---|---|---|
| Cultivated land | Area | 70,203.6 | 69,995.25 | 69,969.24 | 69,929.19 | 69,671.79 |
| Percentage | 88.76 | 88.5 | 88.47 | 88.42 | 88.09 | |
| Forest | Area | 3.15 | 1.62 | 1.44 | 2.16 | 1.35 |
| Percentage | 0.004 | 0.002 | 0.0018 | 0.0027 | 0.0017 | |
| Grassland | Area | 36 | 21.6 | 14.4 | 7.65 | 6.84 |
| Percentage | 0.05 | 0.03 | 0.02 | 0.01 | 0.01 | |
| Water | Area | 2335.23 | 2313.36 | 1585.8 | 1268.19 | 1145.97 |
| Percentage | 2.95 | 2.92 | 2.01 | 1.6 | 1.45 | |
| Construction land | Area | 6512.76 | 6758.91 | 7519.86 | 7883.55 | 8264.79 |
| Percentage | 8.23 | 8.55 | 9.51 | 9.97 | 10.45 | |
| Total | 79,090.74 | 79,090.74 | 79,090.74 | 79,090.74 | 79,090.74 |
| Year | Land Use | Grassland | Construction Land | Water | Forest | Cultivated Land | Total |
|---|---|---|---|---|---|---|---|
| 2002–2007 | Grassland | 19.17 | 5.22 | 0.09 | 11.52 | 36 | |
| Construction land | 6438.15 | 73.17 | 1.44 | 6512.76 | |||
| Water | 51.03 | 2108.61 | 175.59 | 2335.23 | |||
| Forest | 1.62 | 1.53 | 3.15 | ||||
| Cultivated land | 2.43 | 264.51 | 131.49 | 69,805.17 | 70,203.6 | ||
| Total | 21.6 | 6758.91 | 2313.36 | 1.62 | 69,995.25 | 79,090.74 | |
| 2007–2012 | Grassland | 10.08 | 2.25 | 9.27 | 21.6 | ||
| Construction land | 6720.48 | 36.45 | 1.98 | 6758.91 | |||
| Water | 426.24 | 1431.72 | 455.4 | 2313.36 | |||
| Forest | 1.44 | 0.18 | 1.62 | ||||
| Cultivated land | 4.32 | 370.89 | 117.63 | 69,502.41 | 69,995.25 | ||
| Total | 14.4 | 7519.86 | 1585.8 | 1.44 | 69,969.24 | 79,090.74 | |
| 2012–2017 | Grassland | 6.3 | 5.13 | 0.09 | 2.88 | 14.4 | |
| Construction land | 7449.12 | 49.86 | 20.88 | 7519.86 | |||
| Water | 18.81 | 854.19 | 0.09 | 712.71 | 1585.8 | ||
| Forest | 1.17 | 0.27 | 1.44 | ||||
| Cultivated land | 1.35 | 410.49 | 364.05 | 0.9 | 69,192.45 | 69,969.24 | |
| Total | 7.65 | 7883.55 | 1268.19 | 2.16 | 69,929.19 | 79,090.74 | |
| 2017–2022 | Grassland | 5.94 | 0.27 | 1.44 | 7.65 | ||
| Construction land | 7861.05 | 20.97 | 1.53 | 7883.55 | |||
| Water | 24.75 | 779.4 | 464.04 | 1268.19 | |||
| Forest | 0.81 | 1.35 | 2.16 | ||||
| Cultivated land | 0.9 | 378.72 | 345.6 | 0.54 | 69,203.43 | 69,929.19 | |
| Total | 6.84 | 8264.79 | 1145.97 | 1.35 | 69,671.79 | 79,090.74 |
| Year | Landscape | CA (hm2) | PLAND | LPI | LSI | AI | PD | ED |
|---|---|---|---|---|---|---|---|---|
| 2002 | Cultivated land | 70,203.60 | 88.7634 | 6.0941 | 75.8331 | 91.5145 | 11.6461 | 27.2998 |
| Construction land | 6512.76 | 8.2345 | 0.1033 | 102.5399 | 62.0429 | 11.8383 | 26.5468 | |
| Water | 2335.23 | 2.9526 | 0.6859 | 21.5201 | 87.1478 | 0.8256 | 3.4627 | |
| Grassland | 36.00 | 0.0455 | 0.0035 | 9.4750 | 55.3947 | 0.0961 | 0.2401 | |
| Forest | 3.15 | 0.0040 | 0.0006 | 4.2500 | 32.7586 | 0.0202 | 0.0322 | |
| 2007 | Cultivated land | 69,995.25 | 88.4999 | 6.0746 | 76.0368 | 91.4806 | 11.7169 | 27.9499 |
| Construction land | 6758.91 | 8.5458 | 0.1086 | 103.0219 | 62.5724 | 12.0065 | 27.0210 | |
| Water | 2313.36 | 2.9249 | 0.6894 | 22.9502 | 86.2078 | 0.9344 | 3.7135 | |
| Grassland | 21.60 | 0.0273 | 0.0026 | 8.3548 | 49.2205 | 0.0733 | 0.1650 | |
| Forest | 1.62 | 0.0020 | 0.0006 | 3.4444 | 18.5185 | 0.0152 | 0.0205 | |
| 2012 | Cultivated land | 69,969.24 | 88.4670 | 5.4956 | 76.7029 | 91.4018 | 11.7296 | 29.5134 |
| Construction land | 7519.86 | 9.5079 | 0.2659 | 102.9499 | 64.5533 | 12.1519 | 28.3607 | |
| Water | 1585.80 | 2.0050 | 0.1886 | 28.8571 | 78.8128 | 1.1657 | 4.2316 | |
| Grassland | 14.40 | 0.0182 | 0.0030 | 5.6923 | 58.5034 | 0.0303 | 0.0963 | |
| Forest | 1.44 | 0.0018 | 0.0006 | 3.3750 | 20.8333 | 0.0126 | 0.0193 | |
| 2017 | Cultivated land | 69,929.19 | 88.4164 | 5.4508 | 78.2904 | 91.2214 | 11.7549 | 32.0457 |
| Construction land | 7883.55 | 9.9677 | 0.2470 | 104.2500 | 64.9916 | 12.3820 | 29.2976 | |
| Water | 1268.19 | 1.6035 | 0.0692 | 31.9412 | 73.6473 | 1.1759 | 4.3628 | |
| Grassland | 2.16 | 0.0027 | 0.0007 | 3.5000 | 34.2105 | 0.0152 | 0.0239 | |
| Forest | 7.65 | 0.0097 | 0.0032 | 4.0526 | 61.5894 | 0.0164 | 0.0516 | |
| 2022 | Cultivated land | 69,671.79 | 88.0910 | 5.4318 | 79.3136 | 91.0875 | 11.6423 | 33.0786 |
| Construction land | 8264.79 | 10.4498 | 0.2375 | 104.8122 | 65.5765 | 12.5893 | 30.2338 | |
| Water | 1145.97 | 1.4489 | 0.0642 | 26.9823 | 76.7353 | 0.8636 | 3.8826 | |
| Grassland | 1.35 | 0.0017 | 0.0003 | 3.1250 | 22.7273 | 0.0114 | 0.0178 | |
| Forest | 6.84 | 0.0086 | 0.0032 | 3.6111 | 64.9254 | 0.0114 | 0.0444 |
| Ranking | Index | Degree of Gray Correlation |
|---|---|---|
| 1 | Primary industry output | 0.6968 |
| 2 | Fiscal and tax revenue | 0.6764 |
| 3 | Total fixed asset investments for all of society | 0.6563 |
| 4 | GDP | 0.6372 |
| 5 | Tertiary industry output | 0.6333 |
| 6 | Secondary industry output | 0.6225 |
| 7 | Cultivated land protection tasks | 0.5677 |
| 8 | Total power of agricultural machinery | 0.5366 |
| 9 | Effective irrigation area of cropland | 0.5288 |
| 10 | Total grain output | 0.5156 |
| 11 | Permanent resident population | 0.5037 |
| 12 | Area of cultivated land occupied by government-approved construction | 0.5013 |
Disclaimer/Publisher’s Note: The statements, opinions and data contained in all publications are solely those of the individual author(s) and contributor(s) and not of MDPI and/or the editor(s). MDPI and/or the editor(s) disclaim responsibility for any injury to people or property resulting from any ideas, methods, instructions or products referred to in the content. |
© 2025 by the authors. Licensee MDPI, Basel, Switzerland. This article is an open access article distributed under the terms and conditions of the Creative Commons Attribution (CC BY) license (https://creativecommons.org/licenses/by/4.0/).
Share and Cite
Liu, Q.; Fu, Y.; Teng, G.; Ma, J.; Yao, Y.; Chen, L. Spatio-Temporal Evolution Characteristics of Land Consolidation in the Coastal Regions: A Typical Case Study of Lianyungang, China. Land 2025, 14, 1776. https://doi.org/10.3390/land14091776
Liu Q, Fu Y, Teng G, Ma J, Yao Y, Chen L. Spatio-Temporal Evolution Characteristics of Land Consolidation in the Coastal Regions: A Typical Case Study of Lianyungang, China. Land. 2025; 14(9):1776. https://doi.org/10.3390/land14091776
Chicago/Turabian StyleLiu, Qiaochu, Yonghu Fu, Gan Teng, Jianyuan Ma, Yu Yao, and Longqian Chen. 2025. "Spatio-Temporal Evolution Characteristics of Land Consolidation in the Coastal Regions: A Typical Case Study of Lianyungang, China" Land 14, no. 9: 1776. https://doi.org/10.3390/land14091776
APA StyleLiu, Q., Fu, Y., Teng, G., Ma, J., Yao, Y., & Chen, L. (2025). Spatio-Temporal Evolution Characteristics of Land Consolidation in the Coastal Regions: A Typical Case Study of Lianyungang, China. Land, 14(9), 1776. https://doi.org/10.3390/land14091776


