1. Introduction
Global environmental change is accelerating, with climate instability, biodiversity decline, and ongoing ecosystem degradation posing serious risks to sustainable development and human well-being (HWB) [
1]. One of the most prominent drivers of these issues is land use and land cover change (LUCC), which is mainly fueled by urban expansion, intensified agriculture, and large-scale infrastructure development [
2,
3]. These changes often disrupt critical ecological functions—such as carbon sequestration, water retention, and soil stability—weakening the ability of ecosystems to provide the services people rely on for their livelihoods and quality of life [
4,
5]. In response to these growing concerns, major global strategies, including the Sustainable Development Goals (SDGs), the Paris Agreement, and China’s ecological civilization agenda, have increasingly emphasized the importance of ecosystem services (ESs) in promoting biodiversity, climate action, and sustainable land use [
6]. However, despite these efforts, many ecologically sensitive regions, particularly mountainous and karst areas, still face ongoing ecological degradation and service loss [
7].
Ecosystem services represent the benefits that people obtain from nature and provide a useful lens for linking ecological processes with social outcomes. The commonly used cascade model—moving from ecosystem functions to services to human well-being—illustrates how ecological processes like nutrient cycling and biomass production eventually influence various aspects of well-being, from material needs and health to social relationships and cultural value [
8,
9,
10,
11] As a result, maintaining the stable delivery of ESs is not just an environmental goal—it also underpins economic performance, public health, and broader development priorities [
12,
13]. To make informed decisions about land and resource management, we need a deeper understanding of how land changes affect ESs and how those changes, in turn, influence human well-being.
Although many studies have explored how LUCC affects ecosystem services, the pathways through which these impacts are transmitted to HWB remain inadequately quantified. These relationships are often non-linear, context-dependent, and methodologically challenging to measure [
14,
15,
16]. Tools like participatory GIS, household surveys, and scenario simulations have provided helpful insights [
17,
18,
19], but they also have limitations. For instance, index-based approaches often rely on subjective weighting, economic valuations of ESs can be contentious and inconsistent, and most frameworks struggle to reflect the dynamic, evolving nature of LUCC–ESs–HWB interactions over time and across space. This highlights the need for an integrated and quantifiable method to trace these complex feedback loops.
This study addresses that gap by proposing and applying a carbon flow-based framework as a unifying analytical lens. Carbon, as the fundamental building block of life and a primary currency of energy transfer in ecosystems, serves as an ideal proxy to track material and energy flows within the coupled human–natural system [
20,
21,
22,
23,
24,
25,
26] Compared with traditional ESs assessment methods, which often rely on disparate biophysical units (e.g., cubic meters for water, tons for soil) or contested economic valuations, the carbon flow approach offers several distinct advantages. First, it provides a unified, biophysically grounded metric (i.e., tons of carbon) that allows for consistent quantification and comparison of diverse ESs, from provisioning (e.g., food biomass) to regulating services (e.g., carbon sequestration). Second, it offers a spatially explicit and temporally dynamic way to track ecological shifts, as carbon stocks and fluxes are highly sensitive to LUCC [
27,
28]. Third, it directly links ecosystem processes to socio-economic consumption and well-being, as human activities (e.g., energy use, industrial production) are fundamentally tied to carbon cycles. While existing carbon accounting has been widely used in climate change research, its application as an integrative mediator within the full LUCC–ESs–HWB cascade remains a significant research gap that this study aims to fill.
To account for the human dimension more directly, this study also develops a Human Satisfaction Index (HSI). Drawing on the Millennium Ecosystem Assessment’s well-being framework, the HSI includes three essential components—basic materials, security, and health—and integrates local indicators such as access to industrial products, organic fertilizer use, and healthcare infrastructure. Designed specifically for the socio-ecological conditions of Guizhou’s karst region, this index helps translate environmental changes into a clearer picture of how people’s lives are affected.
Guizhou Province, located in southwest China, offers a valuable case for exploring these issues. It is one of the country’s most ecologically fragile regions due to its extensive karst terrain and is also among the less economically developed areas [
27]. Between 2000 and 2020, Guizhou experienced dramatic land use changes under the influence of major policies, including ecological restoration (e.g., the Grain-for-Green program), urbanization, and targeted poverty reduction programs. These shifts have significantly altered local carbon cycles and service flows, creating uneven and sometimes unexpected outcomes for both ecosystems and communities. Compared with conventional ecosystem service frameworks, the carbon flow approach provides a process-based, dynamic mediator that quantifies biogeochemical linkages in LUCC–ESs–HWB systems, which is particularly important in fragile karst regions. However, we acknowledge that further empirical comparison with traditional ESs metrics could strengthen the framework’s generalizability. For this reason, Guizhou serves as a compelling setting to test a carbon-flow-based framework that aims to clarify the relationships between land use change, ecosystem service dynamics, and human satisfaction.
This research builds a quantitative framework that combines carbon flow analysis with the Human Satisfaction Index to examine the spatiotemporal patterns and interactions in the LUCC–ESs–HWB system in Guizhou from 2000 to 2020. Recent empirical studies (e.g., [
29,
30]) have demonstrated that carbon flow can effectively capture biophysical–socioeconomic linkages, providing stronger explanatory power than conventional ESs metrics alone. It seeks to address three key questions, formulated to align with our analytical approach:
- (1)
How can carbon flow serve as a quantitative mediator to reveal the causal mechanisms and feedback loops connecting LUCC, ESs, and HWB in a karst environment?
- (2)
What are the spatiotemporal patterns of trade-offs and synergies between key ecosystem services and distinct dimensions of human well-being, as measured through the carbon-based framework?
- (3)
What targeted, spatially explicit policy recommendations can be derived from these findings to optimize land management for both ecological sustainability and enhanced human well-being in Guizhou and similar karst regions?
The findings are expected to advance the theoretical understanding of human–environment systems by offering a novel, integrative approach to assess sustainability. Practically, this research aims to provide robust scientific evidence to inform land management policies, refine carbon governance strategies, and guide sustainable development pathways in ecologically vulnerable mountainous regions globally.
3. Materials and Methods
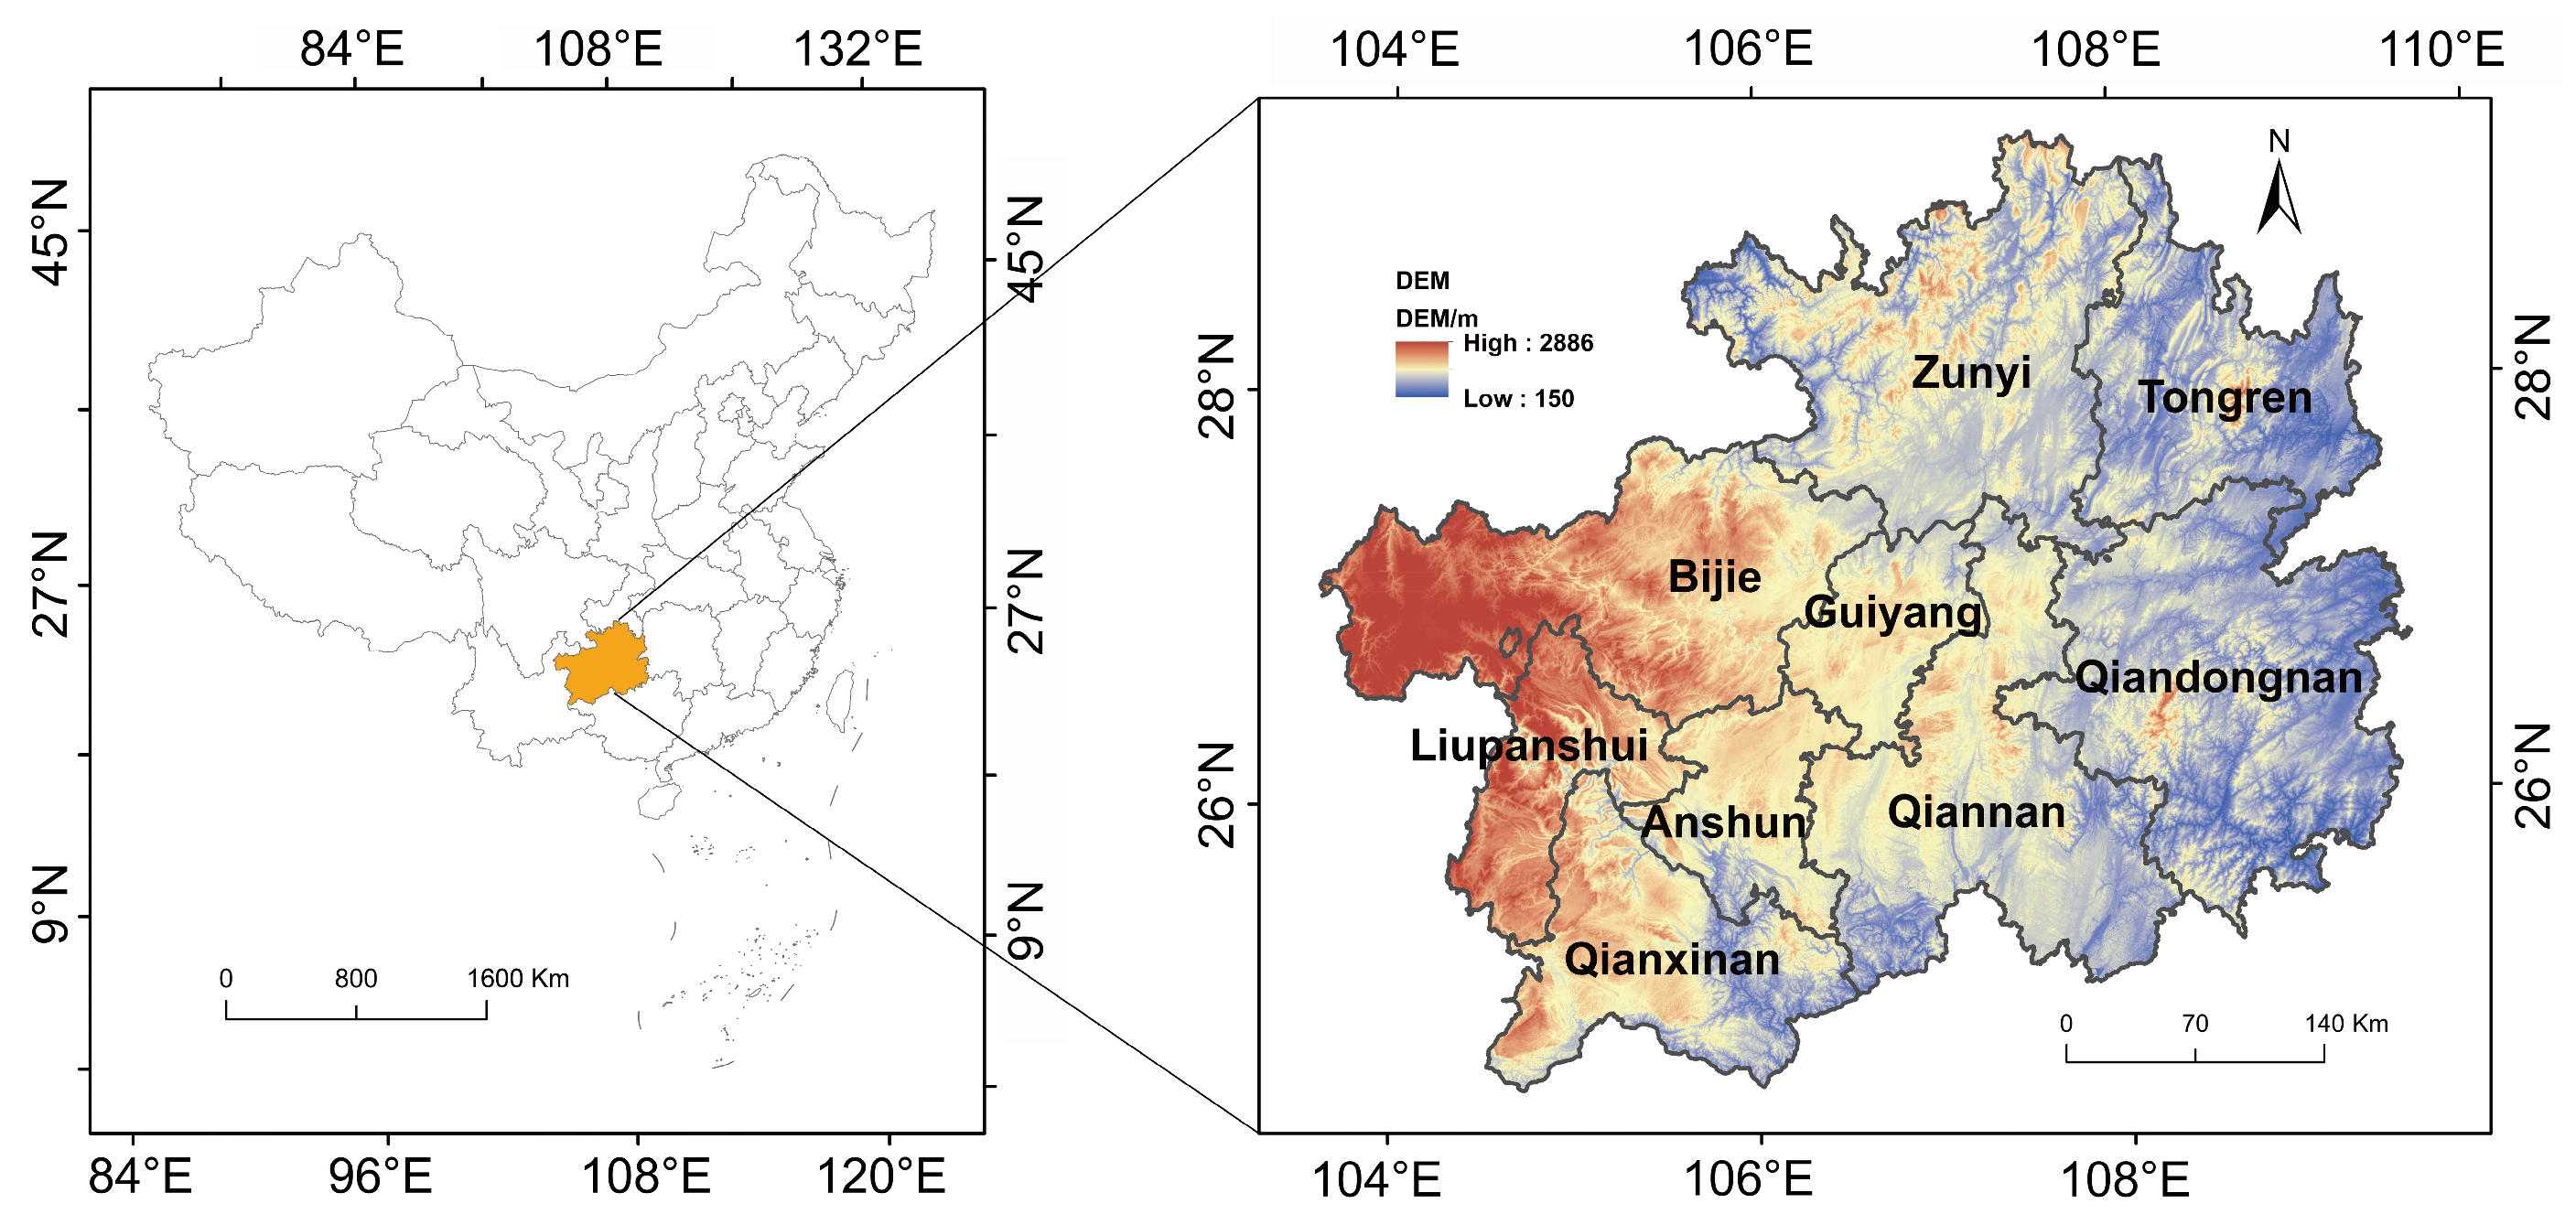
3.1. Study Area
Guizhou is located in the southwest of China, covering a total area of 1.76 × 10⁵ km
2 (
Figure 2). It comprises nine municipal administrative regions: Guiyang and Anshun in the central part, Zunyi and Tongren in the north, Qiannan and Qiandongnan in the south, and Bijie, Liupanshui, and Qianxinan in the west. With an average altitude of approximately 1100 m, it has a subtropical monsoon climate, the annual average temperature is 15.3 °C and the annual average precipitation is approximately 1200 mm. The study period of 2000–2020 was selected because it encompasses several critical phases of socio-economic and environmental policy shifts in China. This period covers the full implementation cycle of the first phase of the Grain-for-Green Program (launched in 1999), the rapid acceleration of urbanization under the Western Development Strategy (since 2000), and the rollout of the Targeted Poverty Alleviation policy (post-2013), all of which have profoundly reshaped Guizhou’s landscape and socio-economic fabric.
As the province with the largest area of karst landforms and land area of rocky desertification in China, Guizhou was also considered to be the most unsuitable region for urbanization in China, with mountainous and hilly areas accounting for 61.7% and 31.1% of the province’s total area, respectively. In addition, along with the environmental pressure brought by encroachment on grassland and cultivated land, the structure and function of the ecosystem have been further weakened, which has led to more frequent desertification and soil erosion. Guizhou is particularly relevant for this study due to its ecological fragility, characterized by vulnerable ecosystems susceptible to land degradation, and its complex socio-economic conditions, marked by disparities in development levels and access to resources across its communities. These factors make Guizhou an ideal case study to examine how targeted land use policies, such as the Grain-for-Green Program (GFGP) and urbanization strategies, can reshape carbon stocks, ecosystem service flows, and ultimately, regional well-being patterns. The study provides empirical evidence on the effectiveness of these policies in achieving both ecological and socio-economic objectives. As a typical karst ecological region, The results of this study, based on a typical karst ecological region, can provide a valuable reference for the sustainable development of similarly fragile regions around the world.
3.2. Data Sources and Preprocessing
This study uses land use data (2000, 2005, 2010, 2015, 2020) from the Resource and Environmental Data Centre of the Chinese Academy of Sciences (
http://www.resdc.cn/). The resolution of land use data is 1 km × 1 km. DEM are 30 m ASTER GDEM data derived from the Geospatial data cloud (
http://www.gscloud.cn/), which can reflect the topographic features of the research area. The socioeconomic and meteorological data are derived from the Statistics yearbook of the Bureau of Statistics of the 9 municipal-level cities in Guizhou (
Table 1).
To ensure methodological rigor, all datasets underwent standardized preprocessing. All spatial raster data, including land use and DEM, were re-projected to a unified coordinate system (WGS 1984 Albers Equal Area Conic) to eliminate geometric distortions and ensure accurate area calculations. To address the scale mismatch between the 1 km resolution land use data and the 30 m DEM, the DEM data were resampled to a 1 km resolution using the bilinear interpolation method, which averages the values of neighboring pixels, providing a smoother and more representative surface at the coarser scale. Socio-economic data from statistical yearbooks were carefully cross-checked for consistency across years and administrative boundary changes. Any missing data points were interpolated using linear regression based on the trend of adjacent years. All spatial analyses and data preprocessing steps were conducted using ArcGIS 10.8.2 (Esri Inc., Redlands, CA, USA).
3.3. Methods
This research evaluated ecosystem services and human well-being in Guizhou from 2000 to 2020 by carbon flow, explored the relationship between them, discussed their changes in the context of LUCC (
Figure 3) and proposed differentiated land use policy recommendations based on these results. The specific steps are included in the following sections: (1) Ecosystem services related to ecological factors are computed using a biomass-based model; using a carbon-based model, we compute indicators that are not related to ecological factors; (2) Using both carbon-based and biomass models to assess human well-being, we then conduct a contribution degree analysis based on these results and evaluate the Human Satisfaction Index; (3) We conduct a correlation analysis between ES and HW; (4) We propose region-specific land use policy recommendations for different areas.
Previous studies have categorized ecosystem services into supporting services, provision services, regulation services and cultural services [
49,
50,
54,
55]. Guizhou is a karst region, with fragile ecosystems and soil desertification, and the economy relies on the primary and secondary industries. The selected indicators represent the soil and water conservation status, as well as the agricultural and industrial product outputs. The specific indicators are as follow: supporting services (soil conservation and habitat provision), provision services (beans, dairy products and aquatic products consumption, crop yield and livestock products), regulation services (hydrological regulation and climate regulation) and cultural services (landscape recreation).
Human well-being is composed of both objective and subjective well-being; this research focuses on objective well-being. Objective human well-being is influenced by both ecological and non-ecological factors. Ecological factors are primarily associated with biomass variations, while the non-ecological components are influenced by the carbon content, which means biomass and carbon can affect human well-being. Human well-being is quantitatively assessed using a biomass-based model and a carbon-based model in this study.
The specific indicators are as follow: basic material for a good life (industrial products, organic fertilizer supply, and energy consumption), security (beans, dairy products and aquatic products consumption, and books, newspapers and magazines supply) and health (residence).
3.3.1. Biomass-Based Model (Ecosystem Services/Ecological Human Well-Being)
- (1)
Crop yields (S
CRY)
where:
is the crop yield supply capacity of the ecosystem,
is the output of the
th crop yields,
is the carbon content of the
th crop.
- (2)
Livestock products supply (S
LIP)
where:
is the livestock product supply capacity for the ecosystem,
is the output of the
th livestock products,
is the carbon content of the
th livestock products.
- (3)
Soil conservation (S
SOC)
where:
is the soil conservation of the ecosystem,
is the biomass of the
th ecosystem,
is the average slope of the
th ecosystem,
is min-max normalized average precipitation of the
ith ecosystem.
- (4)
Habitat provision (S
HAP)
where:
is the habitat provision of the ecosystem,
is the biomass of the
th ecosystem,
is min-max normalized average altitude of the
th ecosystem,
is the average precipitation,
is the average temperature.
- (5)
Climate regulation (S
CLR)
where:
is the climate regulation of the ecosystem,
is the biomass of the
th ecosystem,
is the light intensity,
is the average precipitation,
is the average temperature.
- (6)
Landscape recreation (S
LAR)
where:
is the landscape recreation of the ecosystem,
is the biomass of the forest, ecosystems,
is the biomass of the garden greenery ecosystem,
is the biomass of the
th ecosystem,
is the vegetation carbon stock of the
th ecosystem,
is the vegetation carbon content of the
th ecosystem,
is the total area of the ith ecosystem,
is the vegetation carbon density of the ith ecosystem.
- (7)
Hydrological regulation (S
HYR)
where:
is the hydrological regulation of the ecosystem,
is the biomass of the
th ecosystem,
is the average slope of the ith ecosystem,
is the soil infiltration capacity of the
ith ecosystem,
is the average precipitation. All parameter values used in the biomass-based model, including carbon content, precipitation, light intensity, and vegetation data, are listed in
Table 2.
3.3.2. Carbon-Based Model (Non-Ecological Human Well-Being)
- (1)
Basic material for a good life
Industrial products (C
IPC)
where:
is the carbon content of industrial products,
is the output of the
th industrial product,
is the carbon content of the
th industrial product,
is the population,
is the national average of the furniture inventory,
is the average carbon content of wooden furniture.
Organic fertilizer supply (C
OFF)
where:
is the carbon content of organic fertilizer,
is the number of
th animals,
is the amount of organic fertilizer produced by the
th animals each year, and
is the average carbon content of organic fertilizer.
Energy consumption (C
ENC)
where:
is the carbon content of energy,
is the amount of the
th energy source,
is the carbon content of the
th energy source.
- (2)
Security
Residence (C
RES)
where:
is the carbon content of a resident,
is the carbon stock of building,
is the carbon stock of decoration timber,
is the population,
is the per capita building area,
is the total building area,
is the consumption of wood for construction per unit of building area,
is the density of wood products,
is the amount of wood used for decoration of the unit construction area,
is the carbon content of the wood.
- (3)
Health
Beans, dairy products and aquatic products (C
BDA)
where:
is the carbon content of beans, dairy and aquatic products,
is the population,
is the annual per capita bean product consumption in Guizhou,
is the carbon content of bean products,
is the annual per capita dairy product consumption in Guizhou,
is the carbon content of dairy products,
is the annual per capita aquatic product consumption in Guizhou,
is the carbon content of aquatic products.
Books, newspapers and magazines supply (C
BNM)
where:
is the carbon content of books, newspapers and magazines,
is the number of books,
is the number of newspapers,
is the number of magazines,
is the average carbon content of paper products.
3.3.3. Combination of Carbon-Based and Biomass-Based Model (Human Well-Being)
where:
is the indicator of the basic materials for a good life,
is the carbon content of the crop yield,
is equivalent to
,
is the weight of the crop yield indicator,
is the carbon content of the livestock products,
is the weight of the livestock product indicator,
is the carbon content of industrial products,
is the weight of the industrial product indicator,
is the carbon content of organic fertilizer and fodder,
is the weight of the organic fertilizer and fodder indicator,
is the carbon intensity of energy use, and
is the weight of the energy indicator.
where:
is the security indicator,
is the habitat provision of the ecosystem,
is the weight of the habitat provision,
is the soil conservation of the ecosystem,
is the weight of soil conservation,
is the climate regulation of the ecosystem,
is the weight of climate regulation,
is the carbon content of a resident, and
is the index weight of a resident.
where:
is the health indicator
is the hydrological regulation of the ecosystem,
is the weight of hydrological regulation,
SLAR is the landscape recreation of the ecosystem,
is the weight of landscape recreation,
is the carbon content of beans, dairy products and aquatic products,
is the weight of beans, dairy products and aquatic products,
is the carbon content of books, newspapers and magazines, and
is the weight of books and newspapers and magazines.
and
are calculated using a biomass-based ecosystem services estimation model.
3.3.4. Human Satisfaction Index (HSI)
The Human Satisfaction Index (HSI) is a composite indicator, developed to quantitatively assess multidimensional human well-being (HWB) in the context of ecosystem services and land use change. It consists of three core sub-indicators: HBML (Basic Materials for a Good Life), HSEC (Security), and HHEA (Health), which correspond to the material, ecological, and physical well-being dimensions, respectively. These three dimensions were selected based on the Millennium Ecosystem Assessment (MEA, 2005) and follow established HWB frameworks [
11], ensuring broad international comparability and ecological relevance. Accordingly, equal weights were assigned to the three sub-indicators. To verify the robustness of the equal-weight assumption, we acknowledge that applying a sensitivity analysis using alternative weighting methods (e.g., AHP or entropy weighting) would be a meaningful extension for future studies.
To ensure consistency and comparability across indicators with different units and value ranges, all sub-indicator values were normalized using the minimax principle method, a widely adopted approach in composite index construction [
61]. The equation is expressed as:
where:
represents the raw value,
and
are the minimum and maximum values of the indicator across all spatial and temporal units, and
is the normalized value constrained between 0 and 1.
The assignment of equal weights to the three sub-components (HBML, HSEC, HHEA) is based on the normative principle derived from the Millennium Ecosystem Assessment (MEA) framework, which posits that basic materials, security, and health are equally fundamental and non-substitutable pillars of human well-being. To verify the robustness of the equal-weight assumption, we acknowledge that applying a sensitivity analysis using alternative weighting methods (e.g., AHP or entropy weighting) would be a meaningful extension for future studies. This approach avoids the subjectivity inherent in expert-based weighting schemes. However, we acknowledge that this is a simplifying assumption. The sensitivity of the HSI results to different weighting schemes (e.g., using analytic hierarchy process or entropy-based methods) was not tested in this study but presents a valuable direction for future research. This additive aggregation follows the approach of similar well-being indices [
62,
63].
For classification, the normalized HSI values were divided into five ordinal levels using equal-interval grading (
Table 3), namely: Potential (0–0.2), Below expected (0.2–0.4), Expected (0.4–0.6), Generic (0.6–0.8), Good (0.8–1.0). This five-tiered system is a common practice in environmental and socio-economic assessments as it provides a clear and intuitive scale for comparing relative performance across space and time [
64,
65]. While the equal-interval approach is transparent and simple, its thresholds are inherently relative to the dataset’s range. Future validation could involve calibrating these thresholds against external well-being measures or local expert knowledge. The thresholds aim to capture meaningful differences in well-being while avoiding over-fragmentation in classification. This framework enables spatial and temporal comparison of human satisfaction in response to ecological changes and supports integrative policy evaluation. The HSI thus serves as a bridge linking environmental processes with social outcomes, in line with sustainability science objectives.
3.3.5. Correlation Analysis
The Pearson correlation coefficient was used to analyze the correlation between ecosystem services and human well-being in Guizhou from 2000 to 2020 by Excel and R studio, and the correlation was tested for significance to reflect the linear relationship between ecosystem services and human well-being.
3.3.6. Contribution Degree
Assessing the contribution degree (CD) of each indicator helps to reveal its relative impact on the overall change. Since human well-being is affected by multiple factors with varying directions and intensities, calculating the contributions of individual indicators across different periods between 2000 and 2020 allows for the identification of dominant drivers of well-being change in each historical stage. The equation is expressed as:
where:
is the indicator contribution of human well-being,
and
are the total amounts of human well-being before and after the change,
and
are the amounts of human welfare in the years before and after the change of the kth indicator, and
is the indicator weight of the
kth indicator.
4. Results
4.1. Land Use Transitions from 2000 to 2020
Guizhou Province experienced significant land use and land cover change (LUCC) between 2000 and 2020, primarily involving transitions among forest land, grassland, and cropland, which constitute the largest land use types in the region. Overall, the land use change rate was approximately 11.19%. The dominant transitions involved conversions to forest land (35.10%), followed by conversions to grassland (28.83%) and cropland (24.90%). Conversions to built-up land and water bodies accounted for smaller proportions, at 7.88% and 3.27%, respectively (
Figure 4).
While the overall trajectory from 2000 to 2020 showed a net decrease in cropland due to large-scale afforestation under the GFGP, a notable counter-trend emerged in the 2015–2020 period. During these five years, cropland area experienced a significant rebound, expanding by 48,266 km2, primarily through conversion from forest land and grassland. This apparent contradiction highlights the complex and sometimes conflicting pressures on land resources in Guizhou. The recent cropland expansion is likely driven by national food security policies and agricultural modernization programs that encourage the consolidation and development of high-quality farmland, sometimes at the expense of recently afforested or marginal lands. These dynamic underscores a critical policy tension between ecological restoration goals and food production targets.
Between 2015 and 2020, a period of rapid urbanization, Guizhou witnessed a substantial expansion of cropland, totaling 48,266 km2. This increase was primarily driven by conversions from forest land (16,737 km2), grassland (5959 km2), and built-up land (344 km2). This seemingly contradictory trend needs further explanation and contextualization within the overall narrative of decreasing cropland between 2000 and 2020.
Since 2000, the Grain-for-Green Program (GFGP) has significantly influenced land use patterns in Guizhou. A total of 92,905 km2 across various land types were converted to forest land under the GFGP, representing 20.87% of the program’s national coverage. This reforestation effort primarily targeted western Guizhou, specifically the Bijie, Liupanshui, and Qianxinan regions within the Wumeng Mountains, an area characterized by high elevation, fragmented terrain, and historically low land utilization.
Urban expansion resulted in a total conversion of 2377 km2 to built-up land, primarily from cropland (739 km2), forest land (462 km2), and grassland (328 km2). This urbanization was concentrated in economically developed areas such as Guiyang and Zunyi. Conversions to water bodies totaled 1175 km2, mainly from forest land (485 km2) and cropland (272 km2). This distinction is important for interpreting the ecological implications.
While the overall trend from 2000 to 2020 indicated a decrease in cropland and an increase in both forest and grassland areas, resulting in a current forest area approximately three times that of cropland, the expansion of cropland between 2015 and 2020 requires further clarification to ensure a coherent and accurate representation of LUCC dynamics in Guizhou.
4.2. Changes in Ecosystem Services from 2000 to 2020
Between 2000 and 2020, Guizhou Province experienced notable shifts in ecosystem services (ESs). Per capita supporting services exhibited a general trend of initial decline followed by an increase (
Figure 5a). In 2000, all cities exhibited supporting service levels within a relatively narrow range of 92.5 to 107.5 kg C/person. From 2005 onwards, supporting services began to recover, with Qiandongnan and Guiyang reaching peak values of 130.2 kg C/person and 103.7 kg C/person, respectively, in 2015. However, both cities experienced a sharp decline to 106.0 kg C/person and 88.9 kg C/person, respectively, by 2020. Given data limitations, this study focuses on descriptive trends; future work could incorporate statistical significance tests and cross-validation with external socio-economic indicators.
Regulating services followed a similar trend to supporting services (
Figure 5b). Zunyi and Qiannan experienced declines from their peak values in 2000 and 2005, respectively, followed by gradual increases. Bijie, after reaching its lowest point in 2005, maintained a relatively stable level. Again, further analysis of the drivers behind these trends is needed.
Provisioning services demonstrated an overall increasing trend between 2000 and 2020 (
Figure 5c). Zunyi consistently maintained the highest provisioning service levels, exceeding 34 g C/person and continuing to rise. In contrast, Tongren experienced a persistent decline. By 2020, both Guiyang and Tongren exhibited significantly lower provisioning services compared to other cities, at 23.95 g C/person and 22.64 g C/person, respectively. The contrasting trends between Zunyi and Tongren warrant further investigation.
Cultural services remained relatively stable throughout the study period (
Figure 5d), although significant inter-city variation was observed. Cities could be broadly categorized into three tiers based on cultural service levels: Zunyi and Qiandongnan occupied the highest tier; Anshun, Guiyang, and Liupanshui comprised the lowest, and the remaining cities fell within an intermediate level.
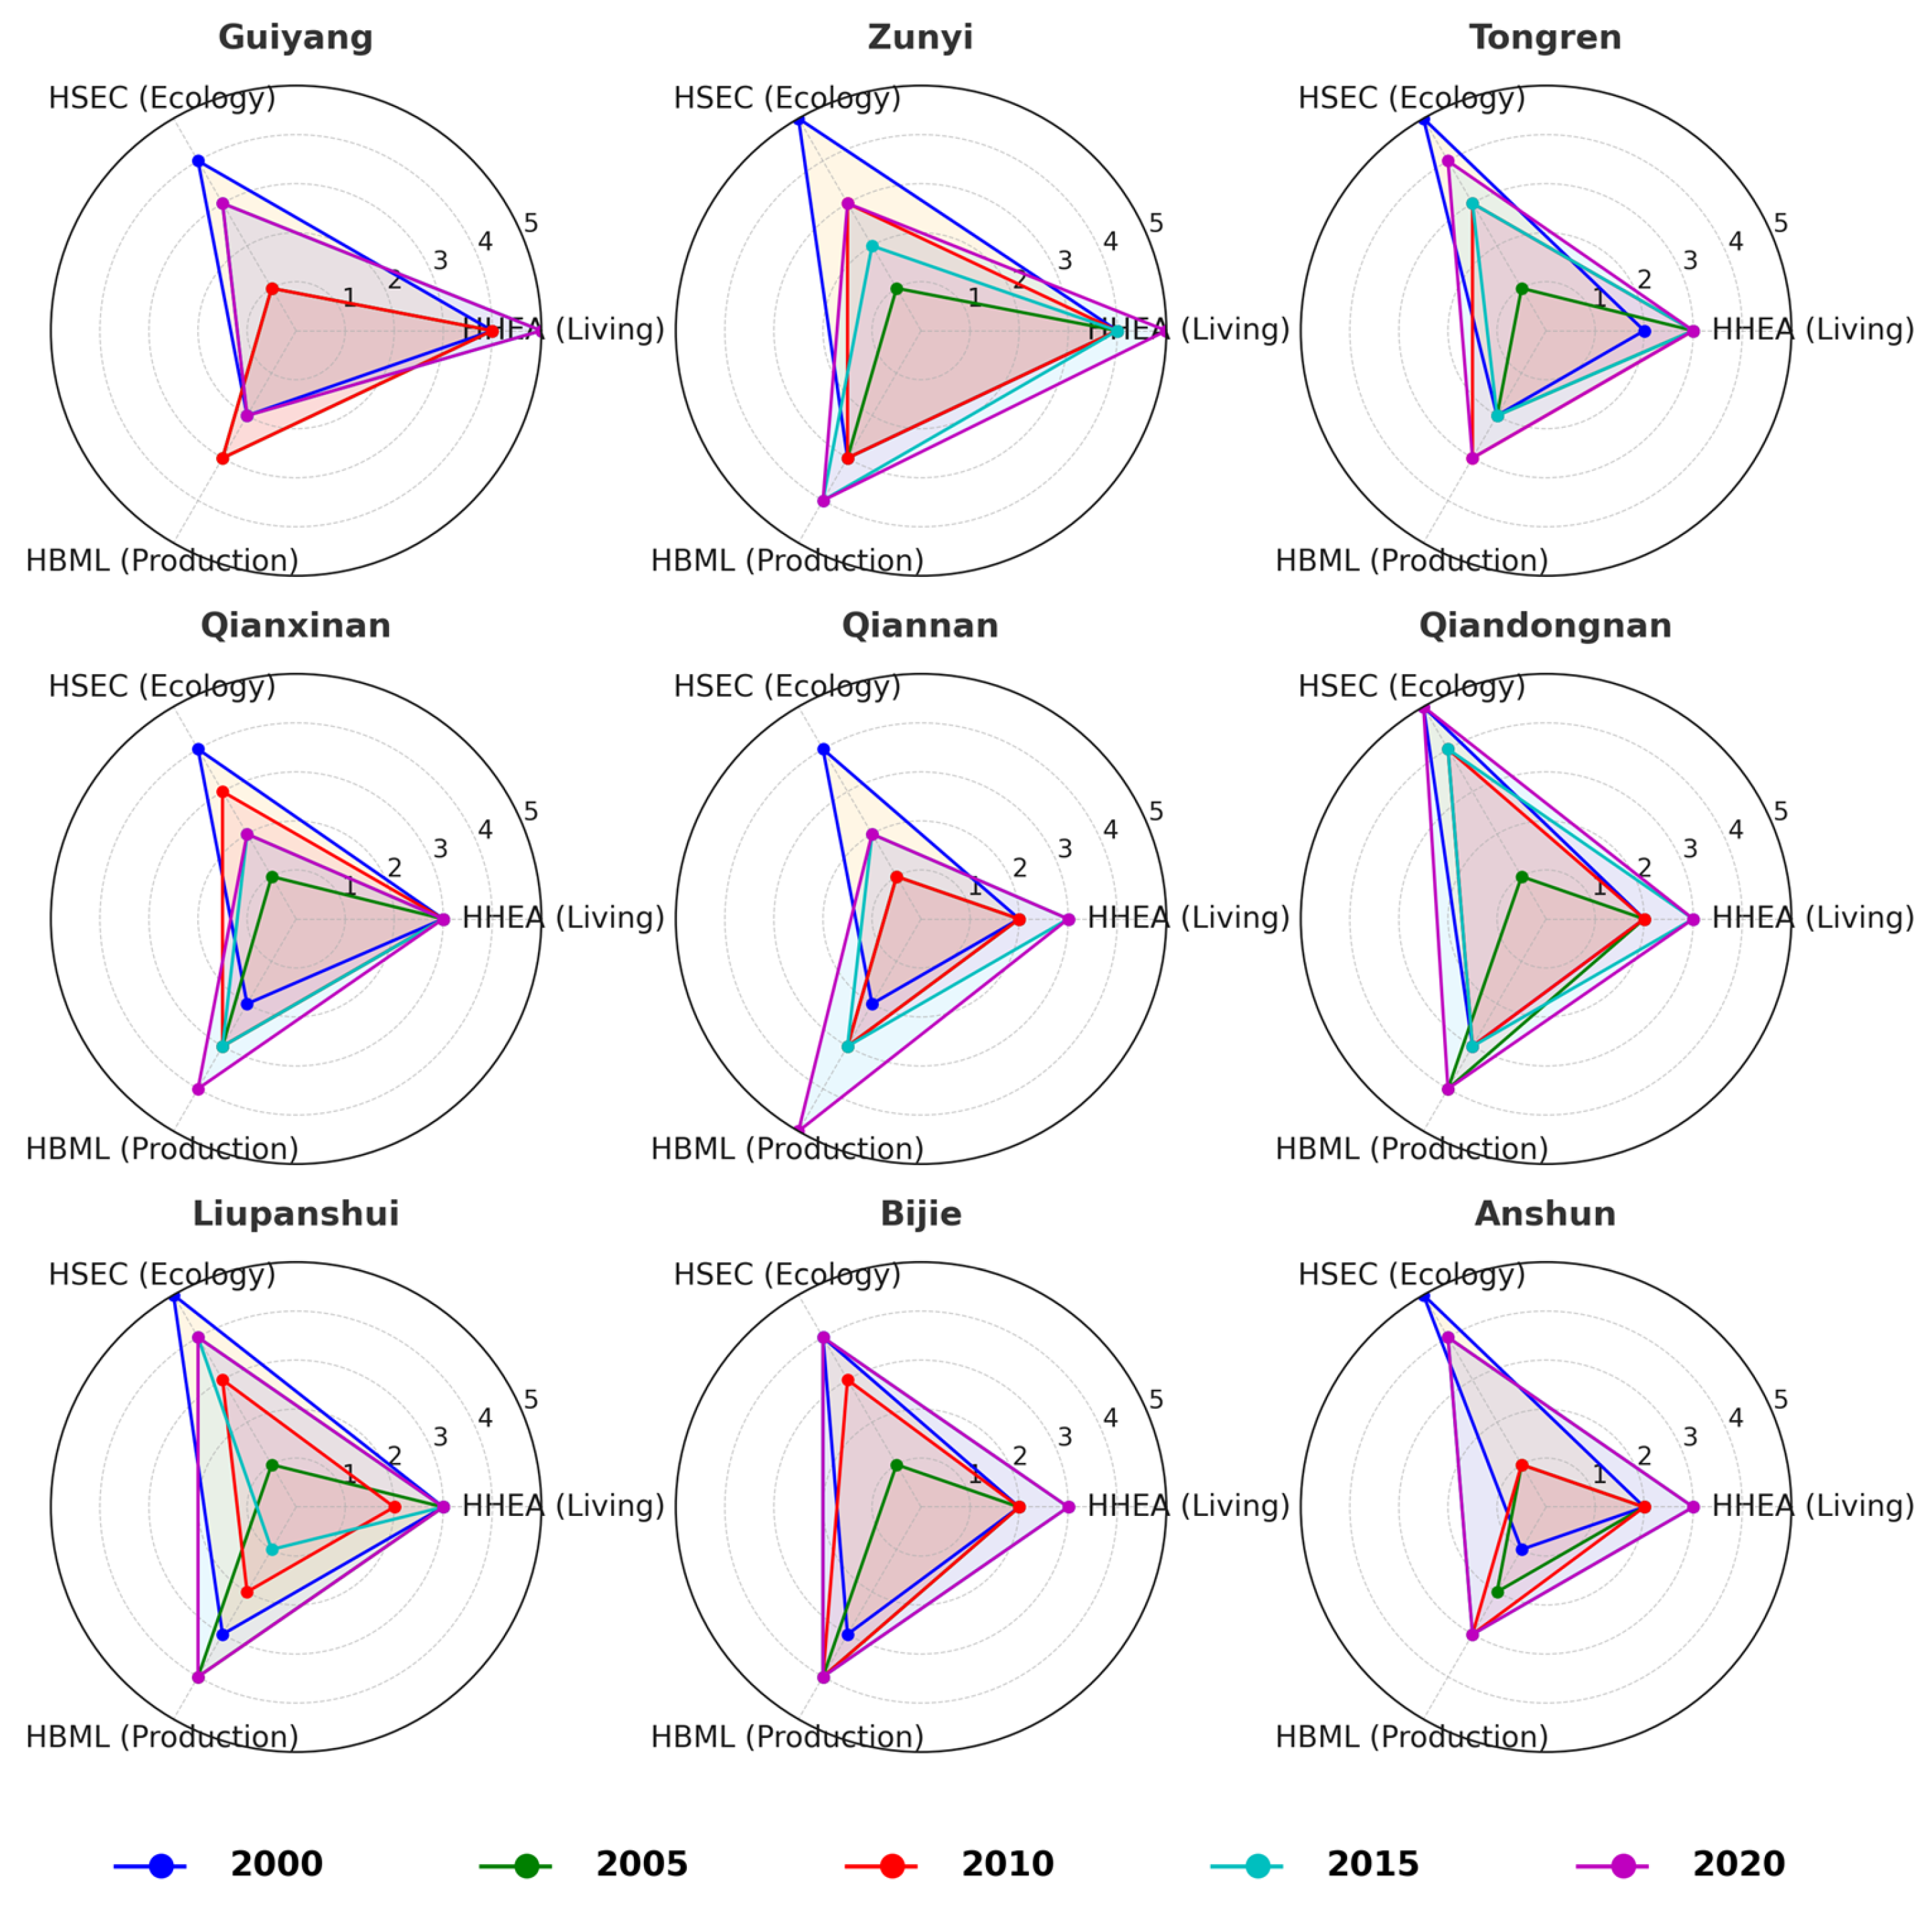
4.3. Changes in Human Satisfaction Index (HSI) Evaluation from 2000 to 2020
During 2000–2020, human well-being in Guizhou showed an increased trend (
Figure 6). Basic materials and security exhibited irregular developmental trends, while health demonstrated relatively stable growth. Basic material for a good life displayed a minor fluctuating upward trend, resulting in an overall increase of 13.10%. Along with the overall increase of 13.10%, Qiandongnan, Liupanshui, and Anshun had the largest fluctuation, while other cities had smaller fluctuation amplitudes. Security exhibited significant changes, with a noticeable decrease from 2000 to 2005. Except for Guiyang, the security levels of all cities reached their minimum values during this period and gradually increased thereafter. Guiyang continued to decline until 2010, while Qiannan maintained a declining trend after 2005.
The Human Satisfaction Index (HSI) represents the overall normalized level of development based on the assessment results of HW. The HSI index enables the evaluation of developmental levels at localized time nodes from a global standpoint, thereby illustrating the developmental status and trends of various human well-being indicators at each time node over the past two decades. In 2000, the majority of cities exhibited a relatively high level of HSEC (scores ranging from IV to V), whereas the developmental levels of both HBML and HHEA were relatively similar, falling within the upper-mid range (scores ranging from III to IV). Anshun had the lowest HBML level (score of I) in 2000. By 2005, the developmental level of HSEC significantly declined, reaching the lowest level across all cities (score of I). In the same year, the levels of HBML and HHEA remained unchanged from 2000, resulting in them being much higher than HSEC. By 2010, HSEC started to rebound to the upper-middle level (scores ranging from IV to V) in some cities. The HSEC levels of Qiannan, Guiyang, and Anshun remained at the lowest level, and were the same as in 2005. The three indicators in Tongren and Qianxinan remained consistent and were situated at the mid-range (score of III) across the province. In 2015, HBML decreased further from 2010, with the indicator reaching the lowest provincial level in Liupanshui (score of I). The HSEC indicator experienced slight decreases in Zunyi, Tongren, Qiannan, and Qiannan West compared to 2010, while it exhibited an upward trend in Liupanshui, Guiyang, Bijie, and Anshun. HHEA showed only minor fluctuations compared to 2010, without significant changes. In 2020, the gaps between the three human well-being indicators in various cities began to narrow, all reaching relatively high levels (scores ranging from IV to V) historically. Notably, the most distinct differences in the three indicators were observed in Qiannan and Guiyang. In Qiannan, HBML reached its highest level, while the other two indicators remained in the mid-range. On the other hand, in Guiyang, HHEA achieved its highest level, while the other two indicators were situated in the mid-lower range (scores of II to III). Overall, the variations in the three indicators across cities began to stabilize after the year 2015. Given data limitations, this study focuses on descriptive trends; future work could incorporate statistical significance tests and cross-validation with external socio-economic indicators.
4.4. The Contribution Degree of Human Well-Being
From 2000 to 2020, the contribution degrees of five key ecosystem service indicators—landscape recreation (Scry), organic fertilizer supply (Coff), industrial product consumption (Cipc), energy consumption (Cenc), and habitat provision (Shap)—to human well-being showed distinct temporal changes and spatial differentiation across Guizhou Province, with notable variations among the four major subregions: central, northern, southern, and western. The temporal trends in the contribution degrees of key indicators are shown in
Figure 7.
In the central region (Guiyang and Anshun), the contribution degrees of most indicators remained low during 2000–2005. Between 2010 and 2015, Guiyang exhibited peaks in Scry (0.88) and Cipc (0.72), followed by sharp declines in 2015–2020, with Scry falling to 0.20 and Cipc to 0.25. Coff and Cenc also dropped significantly during this period. Shap remained relatively stable in Anshun, fluctuating slightly around the mid-level range.
In the northern region (Zunyi and Tongren), Scry and Coff increased steadily from 2005 to 2015, with Zunyi reaching its highest Scry value (0.88) and Cipc value (0.78) in 2010–2015. However, 2015–2020 saw a notable reversal, with Scry and Coff dropping substantially. Tongren’s indicators fluctuated mildly, with Shap remaining around mid-level values across all periods.
In the southern region (Qiannan and Qiandongnan), gradual upward trends were observed across most indicators. Between 2010 and 2020, Coff and Cenc in Qiannan increased continuously, reaching peak values of 0.85 and 0.74 respectively. Scry also rose steadily in Qiandongnan until 2015, after which it declined. Notably, Shap in Qiandongnan remained high and stable across the entire study period, consistently above 0.80.
In the western region (Bijie, Liupanshui, and Qianxinan), multiple indicators peaked during 2010–2015. Bijie showed a rapid rise in Coff (0.92), Cenc (0.77), and Scry (0.83), followed by a slight decline in Shap from 0.82 to 0.37 in the final period. Liupanshui experienced a peak in Cipc and Coff during 2010–2015, while Qianxinan exhibited relatively stable trends across all indicators.
The period from 2010 to 2015 marked a peak phase for ecosystem services’ contributions to human well-being in most regions. Subsequent changes between 2015 and 2020 showed divergence: while southern and western regions largely maintained or improved indicator levels, central and northern regions experienced notable declines in several ESs contributions.
4.5. Correlation Analysis of Ecosystem Service and Human Well-Being
Correlation analysis was performed at a significance level of 0.05 to explore relationships between ecosystem services (ESs) and components of human well-being (HWB). Supporting and regulating services exhibited significant positive correlations with HWB security across most cities. A strong positive correlation was also observed between regulating and supporting services within each city. The overall correlation patterns between ESs and HWB across cities are illustrated in
Figure 8.
In Guiyang, Tongren, Qianxinan, Bijie, and Qiannan, only supporting, regulating, and security showed statistically significant correlations. While other ESs indicators demonstrated positive or negative correlations with HWB indicators, these relationships were not statistically significant. In Zunyi, both regulating and supporting services were negatively correlated with cultural services. Furthermore, cultural services were strongly negatively correlated with HWB security. A positive correlation was found between basic materials for a good life and health.
In Qiandongnan, provisioning and regulating services were strongly positively correlated with supporting services. Significant positive correlations were also observed between provisioning services and security, as well as between cultural services and health.
In Liupanshui, strong positive correlations were found between provisioning services and basic materials for a good life, between cultural services and health, and between regulating services and security. Similarly, in Anshun, a positive correlation was observed between cultural services and health.
Beyond the general trends observed across all cities, Liupanshui and Qiandongnan exhibited interdependence between the four ESs indicators. A strong positive correlation between cultural services and health was consistently observed in Liupanshui, Qiandongnan, and Anshun.
5. Discussion
5.1. Methodological Innovation and Comparison with Existing Studies
This study introduces an integrated analytical framework that quantitatively links ecosystem services (ESs) and human well-being (HWB) by employing carbon flow as a dynamic mediator and a newly established Human Satisfaction Index (HSI). Conventional studies often examine LUCC–ES [
66,
67] and ES–HWB [
68,
69] relationships in isolation, potentially overlooking critical feedback loops and indirect effects that are crucial for understanding the full consequences of land use decisions. This integrated framework addresses this limitation by merging ecological and socio-economic processes into a unified model, enabling a more comprehensive assessment of the cascading impacts of LUCC on HWB.
A key innovation of this framework is the use of carbon flow as a dynamic mediator. Unlike static, snapshot-based assessments, our approach captures the process through which LUCC impacts HWB, offering a more mechanistic understanding. Carbon, central to terrestrial biogeochemical cycles, plays a crucial role in regulating climate, supporting biomass production, and facilitating nutrient cycling, thereby influencing a wide array of ESs [
70]. By tracing carbon flows from LUCC to ESs variations, and further to HWB outcomes, this study constructs a comprehensive process-based understanding of the interconnectedness of natural and human systems. While some studies [
62,
71] focus on individual ESs (provisioning, regulating, supporting) in isolation, our carbon-centric approach provides a more holistic perspective, acknowledging the complex interplay between these services and their combined influence on HWB.
Furthermore, this study pioneers the application of the HSI, a novel composite indicator to evaluate HWB across multiple spatial and temporal scales. These data are then normalized using the min-max scaling method, which rescales each indicator to a value between 0 and 1 based on its observed minimum and maximum across all units. The normalized values are then aggregated using equal weighting and arithmetic mean, assuming that each component of well-being—basic materials, health, and security—contributes equally to overall human satisfaction. The resulting scores are classified into five levels (I to V) using equal-interval grading, allowing for standardized comparison across space and time. While the HSI provides a standardized and spatially explicit representation of HWB directly linked to ES supply and carbon dynamics, it acknowledges the limitations of focusing solely on these three dimensions. The exclusion of cultural and spiritual aspects of well-being, which are challenging to quantify and compare across different cultural contexts, may introduce some bias, unlike fragmented or survey-based well-being metrics [
72], which often lack comparability and spatial resolution. Compared to traditional composite indicators such as the Human Development Index (HDI), which emphasize socio-economic outcomes but often overlook ecological dynamics, the HSI primarily focuses on economic, health, and education outcomes, the HSI is more ecologically grounded, directly linking well-being to the underlying ecosystem services that support it. For example, while HDI might capture an increase in income, our HSI can reveal if this came at the cost of declining ecological security, providing a more holistic picture of sustainability. While a direct quantitative comparison is beyond this paper’s scope, the HSI’s ability to diagnose such trade-offs represents a significant advantage for sustainable land management. By establishing a tiered classification system, the HSI transforms abstract notions of human well-being into a measurable and interpretable scale, enabling a more intuitive understanding of satisfaction levels across regions and time periods. This quantification not only facilitates the spatial and temporal tracking of well-being but also enhances the explanatory power of ecosystem service assessments. Thus, the HSI serves as a valuable decision-support tool, providing robust scientific evidence for sustainable land use planning and high-quality development, particularly in ecologically fragile regions.
Previous research has demonstrated the utility of carbon flow as a mediating mechanism within coupled human–environment systems, linking ecological functions with socio-economic processes [
73]. Building upon this foundation, our study introduces the novel HSI, which directly measures human well-being outcomes alongside carbon dynamics, offering a more comprehensive assessment of the impacts of land use change. In contrast to prior research on cropland abandonment and ecosystem degradation in mountainous regions [
74], which primarily focused on land use drivers and their ecological consequences, our study integrates both ecological processes and human development outcomes within a unified framework, allowing us to analyze the complex feedbacks between human actions and ecosystem health.
By combining carbon flow analysis with the novel HSI, this study offers a valuable methodological contribution for bridging LUCC, ESs, and HWB. Specifically, our findings demonstrate how changes in land use, mediated by carbon sequestration dynamics, impact multiple dimensions of human well-being in a vulnerable karst landscape. This comprehensive framework offers a valuable reference for advancing research on ecosystem–human interactions and can inform the development of more effective and integrated sustainable land management and carbon neutrality policies in ecologically vulnerable areas. The study’s findings regarding the impacts of the GFGP and urbanization strategies in Guizhou can inform policy decisions aimed at balancing economic development with ecological protection in similar regions. While the proposed methodological framework demonstrates clear advantages, future improvements could include quantitative comparisons with established indices such as HDI to demonstrate the added value of the HSI.
5.2. Drivers of Change in Ecosystem Services and Human Well-Being
Our analysis reveals that the observed changes are driven by a complex interplay of policy interventions and socio-economic transformations. Specifically, the implementation of the Grain-for-Green Program (GFGP) is clearly linked to the significant increase in forest cover and the corresponding rise in supporting and regulating services, particularly in the western and southern regions (e.g., Bijie, Qiandongnan). Conversely, rapid urbanization, concentrated in the central and northern regions (Guiyang, Zunyi), is the primary driver behind the expansion of built-up land and the associated decline in regulating services and increase in provisioning services from industrial sources.
Our analysis further reveals that the conversion of land to built-up areas was most pronounced in Guiyang and Zunyi. In these cities, provisioning services related to industrial products and energy consumption became increasingly dominant contributors to the basic materials for a good life dimension of HWB. Concurrently, climate regulation and access to landscape recreation declined significantly, particularly in surrounding rural and suburban areas. Guiyang and Qiannan experienced a marked reduction (43.44% and 40.77%) in regulating services after 2015, which coincided with a sharp decline (44.00% and 39.24%) in the human security dimension of HWB in these areas. The reduction in regulating services is likely associated with intensified urban expansion and large-scale land conversion for infrastructure and industrial parks during the implementation of western development and targeted poverty alleviation strategies. In Guizhou’s rapidly growing urban core, such as Guiyang, forest and grassland ecosystems were increasingly transformed into built-up land, significantly weakening the landscape’s carbon sequestration capacity, water retention function, and microclimate stability. In parallel, Qiannan, once a major beneficiary of ecological protection policies, faced land fragmentation and ecosystem stress as poverty alleviation projects prioritized economic outputs over ecological sustainability. These transformations increased local populations’ exposure to climate extremes, surface runoff, and air pollution, all of which undermine ecological security. Moreover, the retreat of green infrastructure in peri-urban zones reduced opportunities for recreation and mental restoration, further exacerbating the perceived sense of insecurity and environmental stress.
In contrast to Guiyang and Zunyi, regions like Qiandongnan and Bijie, which experienced more moderate urbanization coupled with robust implementation of reforestation programs, demonstrated notable improvements in regulating and supporting services during the same period. This can be attributed to large-scale ecological restoration efforts, including the Grain-for-Green Program and the establishment of ecological protection zones, which significantly enhanced vegetation cover, soil stability, and carbon sequestration capacity in these mountainous areas. Moreover, Qiandongnan consistently maintained relatively stable and high levels of cultural services, especially those rooted in the region’s unique ethnic traditions, terraced agricultural landscapes, and eco-tourism development based on natural and cultural heritage. These services not only generate economic benefits through sustainable tourism but also foster stronger social cohesion and psychological well-being. The availability of accessible natural spaces and cultural identity contributes to improved public health outcomes through enhanced mental health, physical activity, and reduced stress levels. At the same time, strong place attachment and preservation of cultural landscapes can reinforce local social security and reduce vulnerability to displacement or ecological shocks.
Beyond LUCC, targeted poverty alleviation programs and the adoption of the dual-carbon strategy have also influenced regional ESs and HWB patterns. Poverty alleviation efforts, particularly in ecologically fragile and economically disadvantaged areas, have promoted the restoration of marginal lands—such as degraded slopes and abandoned croplands—with Guizhou implementing over 9290 km
2 of reforestation under the Grain-for-Green Program by 2020 [
75]. Simultaneously, investments in rural infrastructure, including hillside irrigation systems, ecological resettlement housing, and rural road networks, have significantly improved local accessibility and agricultural productivity.
These interventions have indirectly enhanced regulating services by improving water quality through reduced agricultural runoff and increasing vegetation cover, which has led to a reduction in soil erosion rates in critical areas such as the Wumeng Mountains. Supporting services have also benefited, as evidenced by increased biodiversity in reforested zones and the resurgence of pollinators critical to crop yields. These ecological improvements have, in turn, contributed to better health outcomes. However, the implementation of carbon neutrality policies still faces significant challenges in Guizhou due to its unique karst terrain. Despite visible gains in forest coverage, the thin and discontinuous soils, high rock exposure, and limited water retention capacity inherent to karst geology constrain long-term carbon sequestration potential.
Carbon flow dynamics further mediate the relationship between LUCC and socio-ecological outcomes. The conversion of cropland to forest land under the GFGP led to increased carbon sequestration, contributing to a 12–15% improvement in climate regulation and over 10% enhancement in water retention in regions like Qiandongnan and Bijie. These ecological improvements positively impacted HWB, especially environmental security and health. In contrast, built-up land expansion in Guiyang and Qiannan caused a 40–43% decline in regulating services from 2015 to 2020, accompanied by a 39–44% drop in the HWB security dimension, indicating ecosystem degradation’s negative feedback on well-being. Contribution analysis further reveals spatial variation: in Zunyi, industrial production dominated provisioning services, while in Guiyang and Liupanshui, organic fertilizer supply and energy use became more influential in recent years.
Overall, the observed changes in ESs and HWB in Guizhou are the result of a complex interplay between ecological restoration efforts (like the GFGP), rapid urbanization, and targeted socio-economic interventions. In China’s karst regions, multi-scale policies and LUCC are key factors shaping carbon flows, influencing the provision of ESs, and ultimately impacting human well-being.
5.3. Trade-Offs and Synergies Between Ecosystem Services and Human Well-Being
The relationship between ecosystem services (ESs) and human well-being (HWB) in Guizhou Province presents a complex tapestry of trade-offs and synergies, shaped by socio-ecological feedbacks under the dual pressures of ecological restoration policies and rapid urbanization.
5.3.1. Urbanization-Induced Trade-Offs: Economic Growth vs. Ecological Stability
In Guizhou’s central and northern regions, rapid urbanization and industrial expansion have led to pronounced trade-offs between economic growth and ecological stability. Cities such as Guiyang (central) and Zunyi (north) saw notable increases in provisioning services—particularly industrial product consumption (CIPC) and energy consumption (CENC)—which substantially contributed to improvements in the basic materials for a good life (HBML) dimension of human well-being. Between 2010 and 2015, Zunyi’s CIPC contribution peaked at 1.0, while Guiyang’s CIPC rose to 0.6.
However, this economic progress was accompanied by a sharp decline in regulating services, particularly landscape recreation (Scry). In Guiyang and Qiannan, Scry dropped into the bottom in 2015–2020. These ecological losses were mirrored by corresponding declines in the human security index (HSEC), which fell by 44% in Guiyang and 39.2% in Qiannan.
The pattern observed in the central and northern regions exemplifies a broader trade-off commonly found in mountainous areas undergoing rapid urban development. Urban expansion tends to prioritize infrastructure and industrial output, often at the cost of forested and agricultural land, leading to reductions in regulating services such as climate control, flood mitigation, and soil stability. LUCC driven by urbanization undermines essential ecological functions and increases the vulnerability of local populations [
76]. The synchronized decline of Scry and HSEC in both urban cores and transitional rural zones underscores the cascading impacts of unbalanced land use policies.
5.3.2. Ecological Restoration Policies: Mitigating Trade-Offs Through Nature-Based Solutions
In contrast to the central and northern urban centers, the southern and western regions of Guizhou—particularly Qiandongnan and Bijie—have benefited significantly from ecological restoration efforts under the Grain-for-Green Program (GFGP) and complementary poverty alleviation initiatives. These areas experienced widespread conversion of degraded cropland and grassland into forest, promoting carbon sequestration, biodiversity conservation, and hydrological regulation.
Between 2005 and 2020, Bijie witnessed a 179% increase in supporting services and a remarkable 674.4% surge in regulating services. Similarly, Qiandongnan saw supporting and regulating services grow by 73.1% and 110.1%, respectively. These ecological gains translated into steady improvements in the health (HHEA) and security (HSEC) dimensions of human well-being in both regions.
This indicates that GFGP significantly enhances ecological functions in mountainous regions of southwestern China. The incorporation of nature-based solutions (NbS)—such as afforestation and grassland rehabilitation—not only mitigates ecosystem degradation but also helps rebalance the trade-offs between provisioning and regulating services. Notably, synergies have emerged in areas like Qiandongnan, where the preservation of traditional cultural landscapes has concurrently enhanced biodiversity, water regulation, and local cultural identity, thereby strengthening both ecological resilience and community well-being.
5.3.3. Cultural Services and Social Disparities: An Overlooked Trade-Off
Our study also identifies a notable trade-off between cultural services and socio-ecological equity. In cities like Zunyi, cultural services were found to be negatively correlated with the human security dimension of HWB, indicating that increased investment in recreational or aesthetic infrastructure does not necessarily lead to broad-based well-being improvements. This pattern may be attributed to the unequal spatial distribution of cultural services, where high-end amenities such as urban parks, exhibition centers, or tourism districts are concentrated in central areas, while peri-urban and rural populations—who are often more vulnerable—remain underserved.
Moreover, the increased emphasis on cultural services in city centers, often associated with urban beautification and tourism-driven land use planning, can result in the conversion of ecologically valuable areas such as wetlands, riparian zones, and secondary forests into ornamental or recreational spaces. These transformations reduce regulating services like climate moderation and flood control, and undermine supporting services including habitat connectivity and pollination. Poorly aligned cultural service investments can intensify urban–rural disparities in ESs provision and human benefits.
However, cultural services also present opportunities for synergies when appropriately planned and equitably distributed. In Qiandongnan, for instance, community-based cultural tourism that integrates traditional practices with ecological conservation—such as ethnic festivals held in forested villages or eco-agriculture combined with cultural heritage zones—has contributed positively to both health and security dimensions of HWB. This demonstrate that, when cultural services are embedded in local ecological and social contexts, they can generate co-benefits across multiple ESs categories and reduce inequalities in access and well-being.
5.4. Strategies for Sustainable Development in Guizhou’s Karst Region
Maintaining a balance between ecosystem services (ESs) and human well-being (HWB) is crucial for sustainable development in Guizhou’s ecologically fragile karst region. While programs like the Grain-for-Green Program (GFGP) and targeted poverty alleviation have yielded improvements in certain ESs and HWB dimensions, rapid urbanization and land use/cover change (LUCC) have intensified trade-offs between ecological integrity and socio-economic development across the province. Therefore, a geographically differentiated management strategy is essential.
Based on our findings, we propose a spatially explicit strategy for regional sustainable development: Ecological Restoration Zone (western), Coordinated Development Zone (central–northern), Ecological Conservation Zone (eastern and southern) and Eco-Agriculture Demonstration Zone (northern transitional areas). For the Ecological Restoration Zone (western), we recommend specific reforestation targets (e.g., increasing forest cover by 5% over the next decade) coupled with performance-based subsidies for local households. For the Coordinated Development Zone (central–northern), urban planning should enforce a mandatory “green space ratio” of at least 30% for all new developments and provide tax incentives for industries adopting circular economy models, with an implementation timeline of the next five years. These recommendations are designed to be more specific, actionable, and consider implementation mechanisms.
The Ecological Restoration Zone (western) encompasses Bijie, Liupanshui, and Qianxinan prefectures, located on the western edge of the Wumeng Mountains and the karst plateau, and characterized by severe land degradation and rocky desertification. To address these challenges, efforts should prioritize large-scale ecological restoration through reforestation using native species, grassland recovery, and soil erosion control measures. Additionally, nature-based solutions such as restoring ecological corridors and reintroducing native species are needed to enhance biodiversity and improve carbon sequestration. These interventions should be integrated with targeted poverty alleviation programs to ensure that local communities benefit from improved ecosystem services and enhanced livelihood opportunities. Together, these actions will improve carbon sequestration, reduce ecological vulnerability, and directly enhance the health and safety dimensions of human well-being.
The Coordinated Development Zone (central–northern Guizhou) includes Guiyang, Zunyi, Anshun, is experiencing rapid urban expansion and is characterized by high ecological sensitivity; it requires integrated planning approaches to mitigate the impacts of urbanization on ecosystem services. A key strategy is the incorporation of green infrastructure into territorial spatial planning, including interventions such as urban green spaces, permeable pavements, and green roofs. In parallel, the development of low-carbon industry clusters should be promoted through the establishment of eco-industrial parks and the adoption of circular economy models that enhance resource efficiency and reduce environmental impacts. Suitable industries may include renewable energy, green building materials, and waste recycling. Furthermore, sustainable urban design principles such as mixed-use zoning, transit-oriented development, and energy-efficient buildings should be implemented to reduce carbon emissions, improve air and water quality, and enhance the overall quality of life for urban residents. These strategies collectively aim to balance material security with ecological safety, mitigate urban–rural inequalities, and prevent further degradation of regulating services.
The Ecological Conservation Zone (eastern and southern) encompasses Qiandongnan, Tongren, and most of Qiannan prefectures, characterized by relatively intact forests and grasslands that provide essential regulating and supporting services. Here, ecological compensation mechanisms should be enhanced to incentivize local communities to engage in conservation and sustainable ecosystem management, including payments for ecosystem services (PES), forest protection subsidies, and community-based conservation rewards. In addition, the development of sustainable tourism should be promoted to minimize environmental impacts while generating economic benefits for local residents. Practices such as eco-tourism, carrying capacity-based visitor management, and community-run cultural heritage tours can help align conservation with development.
In the Eco-Agriculture Demonstration Zone (northern transitional areas), including northern Zunyi and northern Tongren, where farmland, woodland, and hilly mosaics coexist, the establishment of eco-agriculture demonstration zones is recommended. These zones should adopt integrated landscape management approaches that blend ecological restoration with sustainable agricultural practices, ensuring the coordinated use of land for both production and conservation. By implementing eco-agriculture and agroforestry techniques—such as intercropping trees with crops, using organic fertilizers, and maintaining vegetative buffers—these areas can enhance agricultural productivity while simultaneously improving soil health, increasing biodiversity, and boosting carbon sequestration. Such strategies support multifunctional land use that balances ecological and economic objectives.
5.5. Limitations
Although this study provides a comprehensive framework integrating ecosystem services (ESs) and human well-being (HWB) in the context of Guizhou’s karst region, challenges remain in the following areas.
First, while the proposed framework links ecosystem services and human well-being, it could be enhanced by incorporating socio-cultural factors, such as local perceptions and behavioral responses, to better capture human feedback in the system.
Second, the current approach is based on spatial analysis and carbon accounting; integrating methods like agent-based models (ABM) or system dynamics models (SDM) could help simulate complex human–land interactions and enrich the understanding of dynamic feedbacks.
Moreover, using Guizhou Province as a case study provides valuable insights into karst ecological systems, but the findings may not fully represent other regions. Future research could explore other typical areas, such as coastal zones or urban agglomerations, to validate and improve the general applicability of the framework.
6. Conclusions
This study proposed a carbon flow-based framework to quantitatively assess the dynamic linkages between LUCC, ESs, and HWB in Guizhou Province, a typical ecologically fragile karst region in southwest China. By integrating carbon storage, socio-economic indicators, and ESs assessment models, we analyzed temporal changes in ESs and HWB from 2000 to 2020, and further explored their trade-offs, synergies, and contribution patterns through the Human Satisfaction Index (HSI) and contribution degree analysis.
This study’s primary contribution to scientific knowledge lies in its demonstration of carbon flow as an effective, integrative mediator in the LUCC–ESs–HWB cascade. It moves beyond existing carbon accounting, which largely focuses on climate mitigation, by operationalizing carbon as a common currency to track the flow of multiple ecosystem benefits and their ultimate impact on human satisfaction. The development and application of the Human Satisfaction Index (HSI) further advances the field by providing a replicable, ecologically-grounded tool for assessing well-being that is sensitive to environmental change.
The results revealed divergent spatial and temporal patterns: provisioning services increased in urban centers, but at the cost of declining regulating services and rising HWB inequality. In contrast, areas with stronger ecological restoration efforts exhibited improvements in supporting and regulating services, leading to more balanced and sustained gains in HWB. Carbon flow proved to be a valuable analytical vector, highlighting the shifting balance between natural and social systems as carbon transitions from ecosystem sinks to human consumption.
To promote sustainable development and improve well-being in mountainous regions, proper land use and development policies should be implemented based on regional characteristics to enhance human well-being in ecologically fragile karst areas. This study offers a framework and perspective for coordinating human development and ecological sustainability, which can be extended to other vulnerable karst regions globally. We recommend that policymakers in Guizhou implement differentiated land use zoning based on our four proposed zones, with immediate priorities being the establishment of strict ecological protection redlines in the Ecological Conservation Zone and the initiation of green infrastructure pilot projects in the Coordinated Development Zone. The expected impact would be a reversal of the decline in regulating services in urbanizing areas within 5–10 years and a measurable improvement in the HWB security index for local residents.


