Article

Research on the Spatio-Temporal Differentiation of Environmental Heat Exposure in the Main Urban Area of Zhengzhou Based on LCZ and the Cooling Potential of Green Infrastructure

1
College of Landscape Architecture and Art, Henan Agricultural University, Zhengzhou 450002, China
2
Institute of Landscape Architecture, Urban Planning and Garden Art, Hungarian University of Agriculture and Life Sciences (MATE), 1118 Budapest, Hungary
*
Author to whom correspondence should be addressed.
Land 2025, 14(9), 1717; https://doi.org/10.3390/land14091717 (registering DOI)
Submission received: 29 June 2025 / Revised: 13 August 2025 / Accepted: 15 August 2025 / Published: 25 August 2025

Abstract

Urban heat exposure has become an increasingly critical environmental issue under the dual pressures of global climate warming and rapid urbanization, posing significant threats to public health and urban sustainability. However, conventional linear regression models often fail to capture the complex, nonlinear interactions among multiple environmental factors, and studies confined to single LCZ types lack a comprehensive understanding of urban thermal mechanisms. This study takes the central urban area of Zhengzhou as a case and proposes an integrated “Local Climate Zone (LCZ) framework + random forest-based multi-factor contribution analysis” approach. By incorporating multi-temporal Landsat imagery, this method effectively identifies nonlinear drivers of heat exposure across different urban morphological units. Compared to traditional approaches, the proposed model retains spatial heterogeneity while uncovering intricate regulatory pathways among contributing factors, demonstrating superior adaptability and explanatory power. Results indicate that (1) high-density built-up zones (LCZ1 and E) constitute the core of heat exposure, with land surface temperatures (LSTs) 6–12 °C higher than those of natural surfaces and LCZ3 reaching a peak LST of 49.15 °C during extreme heat events; (2) NDVI plays a dominant cooling role, contributing 50.5% to LST mitigation in LCZ3, with the expansion of low-NDVI areas significantly enhancing cooling potential (up to 185.39 °C·km2); (3) LCZ5 exhibits an anomalous spatial pattern with low-temperature patches embedded within high-temperature surroundings, reflecting the nonlinear impacts of urban form and anthropogenic heat sources. The findings demonstrate that the LCZ framework, combined with random forest modeling, effectively overcomes the limitations of traditional linear models, offering a robust analytical tool for decoding urban heat exposure mechanisms and informing targeted climate adaptation strategies.

1. Introduction

In recent years, the global warming trend has continued to intensify, with extreme heat events occurring frequently in many regions around the world. The problem of environmental heat exposure in cities has become increasingly severe and has emerged as one of the key climate risk factors that constrain the health of urban residents and the safety and sustainable development of urban systems. According to the Sixth Assessment Report of the Intergovernmental Panel on Climate Change (IPCC, 2021) [1], since the middle of the 20th century, human activities have significantly accelerated the trend of the global temperature rise. Urban areas, due to anthropogenic heat emissions, increased building density, and changes in surface cover, have shown a much higher rate of temperature increase than the global average. Extreme heat events (EHEs) have shown a significant upward trend in terms of spatial extent, duration, and intensity.
Global cities are expanding at an unprecedented rate. The United Nations’ World Cities Report 2022 indicates that as of 2022, the global urban population has exceeded 4.4 billion, accounting for 56% of the total population and is expected to reach nearly 70% by 2050 (UN-Habitat, 2022) [2]. At the same time, the intensity of urban land use has continued to increase, with green spaces being occupied by high-density buildings and road infrastructure, urban ventilation environments being restricted, and the proportion of impervious surfaces rapidly rising, significantly altering the surface energy balance process of cities. This change is particularly evident in the urban heat island (UHI) phenomenon, thereby amplifying the heat exposure risk for urban populations.
In recent years, a series of extreme heat events have exposed the vulnerability of global cities in responding to climate extremes: in 2021, the small town of Lytton in British Columbia, Canada, experienced a temperature of 49.6 °C under the influence of a “heat dome,” setting the record for the highest temperature in North America (Zhang et al., 2021) [3]; in 2022, southern European countries such as Italy, Spain, and Greece endured prolonged heat above 40 °C, triggering wildfires, energy supply disruptions, and public health crises (European Environment Agency, 2022) [4]; in the same year, temperatures in many parts of India and Pakistan approached 50 °C, with some regions experiencing a 30% reduction in crop yields, leading to food price volatility and water shortages (WMO, 2022) [5]. In China, the Yangtze River Basin suffered the strongest heatwave–drought event in 60 years, with land surface temperatures in major cities exceeding 50 °C, becoming a typical example of climate risks impacting socio-economic systems (Han Jianwei et al., 2023) [6].
Although some major cities have conducted systematic research on heat exposure identification and mitigation—Beijing’s refined UHI mapping and green space intervention (Zhang Lin et al., 2019) [7], Tokyo’s multi-source remote sensing study of heat-form relationships (Zhao et al., 2021) [8], and Shanghai’s multi-scale microclimate control strategies in dense areas (Ding Jianli et al., 2020) [9]—in many high-density cities of developing countries, spatial identification frameworks and mechanism diagnostic methods remain underdeveloped [10,11].
Taking Delhi, India, as an example—one of the world’s most populous cities—heat exposure risks are highly concentrated in informal settlements (slums) and peripheral zones. About one-third of Delhi’s residents live in green-deficient, poorly ventilated informal communities, where land surface temperatures significantly exceed city averages and overlap with elderly and low-income populations, forming a “high exposure–high vulnerability” pattern (Mundoli et al., 2020 [12]; Chakraborty et al., 2019 [13]). However, governance still focuses on the core city, neglecting peripheral vulnerable zones and creating spatial blind spots (Das et al., 2022) [14]. Similarly, São Paulo, Brazil, shows highly fragmented heat risk due to uneven green space and social inequality [15]; Lagos, Nigeria, relies on heuristic decisions amid data paucity and limited governance capacity [16]; and Bangkok, Thailand, despite awareness of heat risk, is constrained by dense built-up areas and poor ventilation corridors, limiting mitigation options [17]. These Global South cities commonly face rapid urbanization outpacing infrastructure, scarce green resources, missing ventilation channels, and accumulating heat risks—underscoring the urgent need for scientific spatial identification and multi-factor mechanism analysis.
In this context, Zhengzhou, a typical inland high-density Chinese city, exemplifies rapid urbanization, intensified heat exposure, and limited adaptability. The “LCZ framework + nonlinear modeling” approach proposed in this study is not only applicable to identifying heat exposure mechanisms in the main urban area of Zhengzhou but also demonstrates high transferability. It can be extended to urban environments worldwide across different climate zones, urban forms, and stages of development. In regions with limited data availability, this method can be applied using medium- to low-resolution remote sensing imagery or alternative socioeconomic data sources (such as nighttime lights or population gridded data) to conduct analyses, thereby providing a reference for heat risk assessment and green infrastructure planning on a global scale. Its thermal evolution process offers representative insights. Using the LCZ framework and nonlinear multi-factor modeling can fill gaps in understanding urban heat exposure mechanisms and zoning governance strategies in developing-city contexts, providing replicable paradigms for adaptive heat governance.
Most current studies employ linear regression or correlation analyses with single factors (e.g., NDVI, surface reflectance, building density) to reveal statistical relationships with land surface temperature (LST). While insightful, these methods struggle to capture the complex, multi-scale, and multi-variable coupling in urban heat formation (Lin et al., 2021) [18]. Heat exposure arises from the combined effects of exposure (high-temperature intensity/frequency), sensitivity (green coverage, ventilation), and adaptability (building form, microclimate regulation).
Meanwhile, the Local Climate Zone (LCZ) method has been widely adopted in urban heat island research. It integrates land cover, building morphology, and topographic information to characterize thermal heterogeneity (Stewart & Oke, 2012) [19]. The LCZ framework offers greater comparability and universality than traditional land-use classes and has been endorsed by UN-Habitat for global heat-risk comparisons. However, fine-scale LCZ applications and green-infrastructure mechanism assessments remain scarce in developing terrains (Ma et al., 2022) [20].
Based on the above background, this study adopts the “exposure–sensitivity–adaptability” three-dimensional framework as the theoretical foundation. It leverages representative environmental parameters from the Local Climate Zone (LCZ) classification system—such as building density, NDVI, SVF, and surface reflectance—to mechanistically characterize the spatial response patterns of heat exposure. Furthermore, it links these with residents’ health risk thermal thresholds, thereby enhancing the practical relevance of the indicator system and its policy adaptability.
Although methods such as random forest (RF), Moran’s I spatial autocorrelation, and Principal Component Analysis (PCA) have been employed in some studies for urban heat environment modeling and structural identification, most have focused on single built-up areas. They have not systematically deconstructed mechanisms within the LCZ classification framework, nor have they deeply analyzed spatial heterogeneity and substitution relationships among factors.
Therefore, this paper innovatively combines the LCZ framework with the random forest model to strengthen the spatial structure representation and nonlinear factor contribution identification capabilities. It also incorporates Moran’s I spatial clustering analysis to overcome the shortcomings of traditional studies, which often emphasize modeling over explanation and correlation over mechanistic identification.
On this basis, this study focuses on the practical problem of high-density urban heat exposure in the main urban area of Zhengzhou, aiming to address the following three key scientific questions:
  • What spatial differentiation characteristics do different LCZ types present in urban heat exposure risks? Do their heat exposure patterns exhibit structural and stability regularities?
  • Within the LCZ classification framework, do environmental factors such as NDVI, surface reflectance, road density, and SVF show type-specific influence mechanisms on land surface temperature (LST)? Are there spatial substitution relationships among the primary driving factors?
  • How can scientific and reasonable green infrastructure intervention paths be proposed based on the spatial attributes and dominant factors of high-heat-exposure areas to realize precise governance and zonal optimization of heat exposure risks?
The systematic answers to these questions will help fill the structural gaps in the research on heat exposure mechanisms in high-density urban development and provide more universal empirical paradigms and spatial strategy support for heat environment governance.

2. Research Area Overview and Data Methods

2.1. Research Area Overview

Zhengzhou City (geographical coordinates ranging from 34°16′ to 35°01′ N, 112°42′ to 114°14′ E) is located in the southern part of the North China Plain, in the central–northern part of Henan Province, with the Yellow River to its south (Figure 1). The terrain slopes gradually from the southwest to the northeast, with the western part being the hilly area of the Songshan Mountain range and the eastern part being the Huang–Huai Plain. It has a typical temperate continental monsoon climate, with four distinct seasons, hot and rainy summers and cold and dry winters. In recent years, along with the rapid urbanization process, the built-up area of Zhengzhou City has continued to expand, significantly intensifying the urban heat island effect and triggering related environmental pressure. As the provincial capital of Henan Province, Zhengzhou is an important central city in central China, a key national comprehensive transportation hub, and a regional economic, financial, and cultural center. It has a high concentration of population. According to the seventh national population census bulletin of Zhengzhou City, at the end of 2020, the permanent resident population of the main urban area (Jinshui District, Erji District, Zhongyuan District, Guancheng Hui Ethnic District, Huijie District, five administrative districts) was 5,022,000 people (Zhengzhou Statistics Bureau, 2021) [21], which is a typical high-density compact city (Chen An et al., 2024) [22].

2.2. Data Sources

2.2.1. Local Climate Zone (LCZ) Data

This study constructed the Local Climate Zone (LCZ) classification system for the main urban area of Zhengzhou following the WUDAPT standard procedure (Bechtel et al., 2019) [23]. A total of 851 training samples covering typical urban landscape types—including compact high-rise (LCZ 1), compact low-rise (LCZ 3), and hardened surface (LCZ E)—were collected via the Google Earth platform in KML format.
To improve classification accuracy, the 2020 GlobeLand30 land use data (30 m resolution) and block-scale building height data were incorporated to extract key three-dimensional urban morphological parameters, including Building Surface Fraction (BSF), Impervious Surface Fraction (ISF), Pervious Surface Fraction (PSF), Sky View Factor (SVF), and Building Height. Detailed parameters are shown in Table 1. This classification system provides a structured spatial basis for subsequent thermal environment modeling.

2.2.2. Remote Sensing and Auxiliary Data

To systematically identify the characteristics of the urban thermal environment and analyze its multifactorial driving mechanisms, this study integrates Landsat series remote sensing imagery with multiple spatial auxiliary datasets. Key variables include land surface temperature (LST), Normalized Difference Vegetation Index (NDVI), surface reflectance, Sky View Factor (SVF), and road density. All datasets were projected and resampled to ensure spatial consistency, using a 30 m resolution and the WGS_1984_UTM_Zone_49N coordinate system.
Land Surface Temperature Data
Landsat 8 OLI/TIRS satellite images provided by the U.S. Geological Survey (USGS) (Path/Row: 123/36) were selected, with five summer scenes from June to September during 2019–2023 that had less than 10% cloud cover (see Table 2). The overpass time was between 10:00 and 11:00 AM. These images were used for subsequent LST retrieval and surface urban heat island (SUHI) intensity calculation.
Auxiliary Environmental Factors
In addition to LST data, this study incorporates various auxiliary environmental factors to reveal the mechanisms driving heat exposure. These include NDVI, surface reflectance, SVF, and road density. NDVI was derived from the red and near-infrared bands of Landsat 8/9 images at 30 m resolution. Surface reflectance data were obtained from Landsat surface reflectance products (SR_BandX), corrected for radiometric errors and normalized to analyze surface energy absorption. SVF was calculated using a digital elevation model (DEM) and vectorized building height data, utilizing the “Sky View Factor” plugin in QGIS. Road density was derived from OpenStreetMap road data through kernel density analysis in ArcGIS, generating a spatial density map at 500 m resolution. All datasets were resampled to a 30 m resolution and standardized in the WGS_1984_UTM_Zone_49N coordinate system. Spatial registration and data formatting were completed using ArcGIS to support the analysis of multi-scale thermal environment drivers.

2.3. Methods

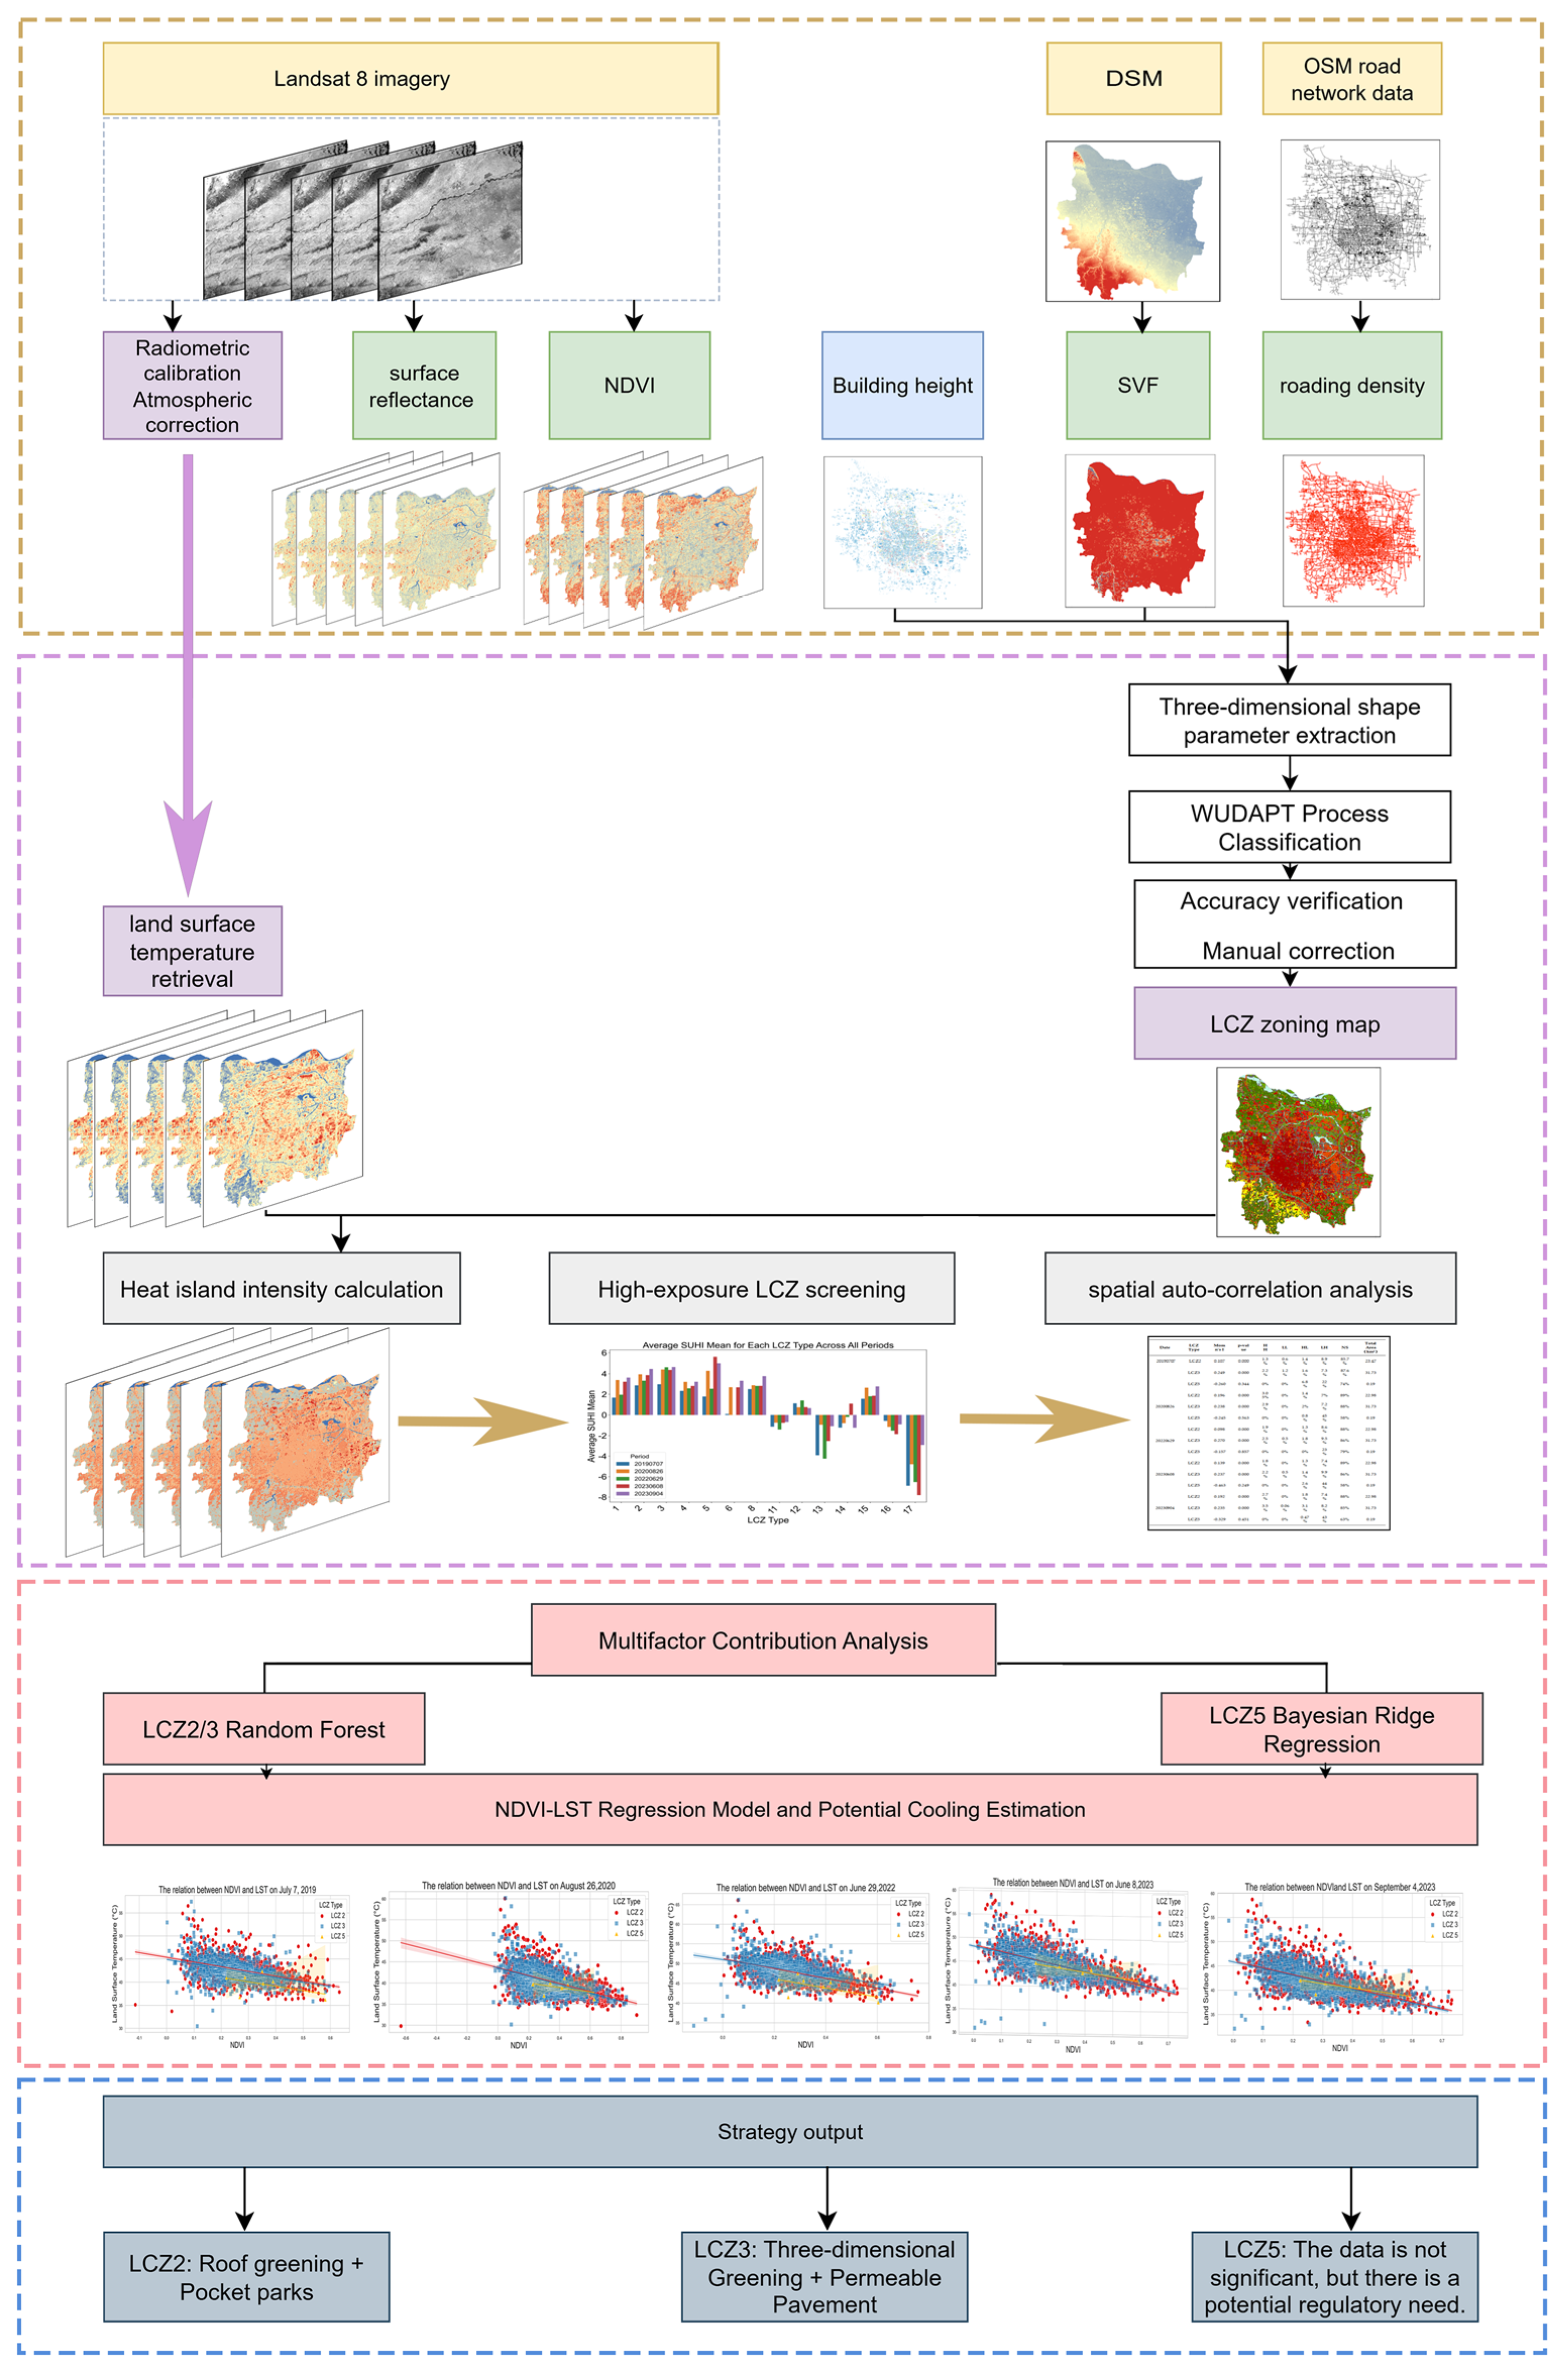
To systematically illustrate the structure and analytical logic of this study, a technical workflow is shown in Figure 2, which outlines the full methodological sequence from data acquisition to spatial analysis and final output.

2.3.1. Local Climate Zone (LCZ) Classification Method

This study used the random forest (RF) classification algorithm to delineate Local Climate Zone (LCZ) types in the main urban area of Zhengzhou, following the standard WUDAPT workflow. Based on 851 stratified training samples manually labeled in Google Earth, the key 3D morphological parameters corresponding to each LCZ category were extracted, including Building Surface Fraction (BSF), Impervious Surface Fraction (ISF), Pervious Surface Fraction (PSF), Sky View Factor (SVF), and Building Height (H, m). Additional land cover information was supplemented using GlobeLand30 land use data and block-scale vectorized building data.
Following the stratified classification strategies of Quan (2019) [24], the random forest algorithm was applied to perform object-based image classification of LCZs. The overall accuracy (OA) reached 0.64 (Ma et al., 2023) [25], surpassing the minimum quality threshold (OA ≥ 0.5) proposed by Bechtel et al. (2019). For LCZ types that were prone to misclassification, manual verification and correction were conducted based on the parameter threshold ranges defined in Table 1.

2.3.2. Land Surface Temperature Retrieval and Urban Heat Island Intensity Calculation

Land Surface Temperature Retrieval Method
Based on the thermal infrared band (Band 10) of Landsat 8 TIRS data, land surface temperature (LST) was retrieved using ENVI 5.6 software. The detailed procedure is as follows:
First, radiometric calibration was performed on the thermal infrared band (TIRS Band 10), where the digital number (DN) values were converted into top-of-atmosphere spectral radiance L using the gain coefficient M and offset A provided in the metadata (Equation (1)):
L λ = M L · Q c a l + A L
Next, the atmospheric transmittance τ was calculated using ENVI’s built-in Radiative Transfer Equation (RTE) model. Simultaneously, the land surface emissivity ε was estimated based on the Normalized Difference Vegetation Index (NDVI) derived from the OLI multispectral bands, following a threshold-based approach (Equation (2)).
  ε = 0.004 × N D V I + 0.986
The single-window algorithm proposed by Qin et al. (2001) [26] was then applied, incorporating L, τ, and ε to retrieve the land surface temperature (LST) as follows:
T s = K 2 l n K 1 L λ L λ τ 1 ε L λ τ ε + 1
The variables in this equation are defined as follows:
T s is the land surface temperature (K), later converted to °C by subtracting 273.15;
τ is the atmospheric transmittance (unitless);
ε is the land surface emissivity (unitless, 0–1);
L λ is the TOA spectral radiance;
L λ and L λ are the upwelling and downwelling radiance, respectively;
λ is the effective wavelength of the TIR band (m);
h is the Planck constant (6.626 × 10⁻³⁴ J·s);
c is the speed of light (2.998 × 10⁸ m/s);
K B is the Boltzmann constant (1.38 × 10⁻²³ J/K).
K 1 and K 2 are the thermal calibration constants provided in the image metadata.
When atmospheric parameters are unavailable, a simplified form correcting only for emissivity can be used:
T s T B 1 + λ T B ρ l n ε
where ρ = h c k B 1.4388 × 10 2   m · K . However, in this study, the complete single-window algorithm was adopted to incorporate both emissivity and atmospheric effects.
Urban Heat Island Intensity Calculation
To accurately define the thermal background of the central urban area of Zhengzhou, this study addresses the challenge of scale adaptation in representing the natural surface thermal characteristics. Within the ecological corridor extending from the northwest to the southeast of the study area, LCZ A (dense trees) demonstrates strong thermal stability but is limited by its small spatial extent. In contrast, LCZ B (scattered trees) covers a broader area but is more susceptible to anthropogenic disturbance and landscape fragmentation in its thermal response.
To balance both stability and representativeness, this study innovatively constructs a composite thermal background reference by averaging the land surface temperature (LST) values of all valid pixels within LCZ A and LCZ B. This composite baseline integrates the low-temperature characteristics of LCZ A and the transitional thermal responses of LCZ B along edge zones.
Based on this reference, the urban surface heat island intensity (SUHII) is calculated using land surface temperature data retrieved via the Landsat 8 single-window algorithm (with 30 m spatial resolution) to quantitatively assess the surface urban heat island effect within the study area. The calculation formula is as follows:
S U H I I i = L S T i L S T b a s e l i n e
where
S U H I I i : Surface Urban Heat Island Intensity of pixel i;
L S T i : Land surface temperature of pixel i;
L S T b a s e l i n e : Composite background temperature calculated as the average LST of pixels in LCZ A and LCZ B.
Preliminary validation results indicate that this method performs better than using a single LCZ type as the reference. It allows for a more balanced representation of the thermal background across the study area and enhances the spatial sensitivity and ecological rationality of the SUHII values.

2.3.3. Multi-Factor Contribution Analysis and Green Cooling Potential Assessment

Analysis of Driving Factor Contributions
To quantitatively evaluate the influence of various urban surface and morphological characteristics on land surface thermal environments, this study integrates multiple spatial variables, including Normalized Difference Vegetation Index (NDVI), surface reflectance (after normalization), Sky View Factor (SVF), and road density. Modeling analyses were conducted specifically for typical high-heat-risk LCZ types.
For LCZ 2 and LCZ 3 areas, where sufficient sample sizes were available, a Random Forest Regression (RFR) model was employed. Random forest is an ensemble learning algorithm that constructs prediction models based on multiple regression decision trees (set to 500 trees with a maximum depth of 10 in this study). Its core principle involves introducing randomness to build diverse decision trees and then averaging their results, thereby improving generalization. The model incorporates permutation importance to quantify the contribution of each independent variable to land surface temperature (LST), whereby the performance drop after permuting a variable reflects its importance. To ensure fair comparisons, all variables were standardized prior to modeling. Model performance was evaluated using the coefficient of determination (R2) and mean squared error (MSE), while variable importance was assessed based on the significance levels obtained through 1000 permutation tests.
For LCZ 5, where the sample size was relatively small, a Bayesian Ridge Regression (BRR) model was adopted to avoid overfitting and parameter instability. This method builds upon ridge regression by introducing a Bayesian framework, applying a normal prior to constrain coefficient fluctuations, and estimating the posterior distribution of parameters using the Markov Chain Monte Carlo (MCMC) method. In this model, land surface temperature y is represented as
y = X β + ε
Here, X represents the standardized variable matrix, β is the regression coefficient vector, and ε N 0 , σ 2 I . In Bayesian ridge regression, ε N 0 , λ 1 I , where λ controls the regularization strength. The relative contribution of each variable is weighted and normalized based on the absolute value of the standardized regression coefficient, and the significance judgment is based on the posterior distribution confidence interval.
This study comprehensively uses two methods, respectively, adapting to the differences in sample size, ensuring the stability and interpretability of the modeling results, and providing reliable support for revealing the driving mechanism of the thermal environment [27].
Evaluation Method for Vegetation Cooling Potential
This study employed a stratified modeling strategy (Breiman, 2001) [28] to quantify the contributions of road density, Sky View Factor (SVF), surface reflectivity, and NDVI to land surface temperature (LST) and to assess the cooling potential of vegetation. For different LCZ types, different regression models were applied. For LCZ2 and LCZ3 (sample size > 1000), a random forest regression model was used. Permutation importance was applied to calculate the contribution of each factor, while model parameters were optimized using grid search (number of trees = 500, maximum depth = 10). The significance of the results was validated through 1000 permutation tests. For LCZ5 (n = 7), a Bayesian ridge regression model was adopted. Markov Chain Monte Carlo (MCMC) sampling was used to estimate the posterior distribution of standardized regression coefficients, and contribution values were calculated by multiplying the absolute value of each coefficient. Significance was determined using a 95% confidence interval. Based on the contribution results, a linear regression model between NDVI and LST was further constructed.
L S T = α + β · N D V I
Among them, the regression coefficient β represents the amplitude of LST change corresponding to a unit increase in NDVI. Based on this, select the areas with low vegetation coverage (pixels with NDVI lower than the mean value of the corresponding LCZ type), assume that the NDVI of these pixels increases to the mean value of the area, and combine the above regression relationship to estimate the potential cooling value of each pixel. Sum up the potential values of each pixel by unit area to obtain the “greening cooling potential” (unit: °C/km2), which can provide a quantitative basis for urban microclimate regulation and the delineation of priority greening areas.

3. Results and Analysis

3.1. Analysis of LCZ Classification Characteristics

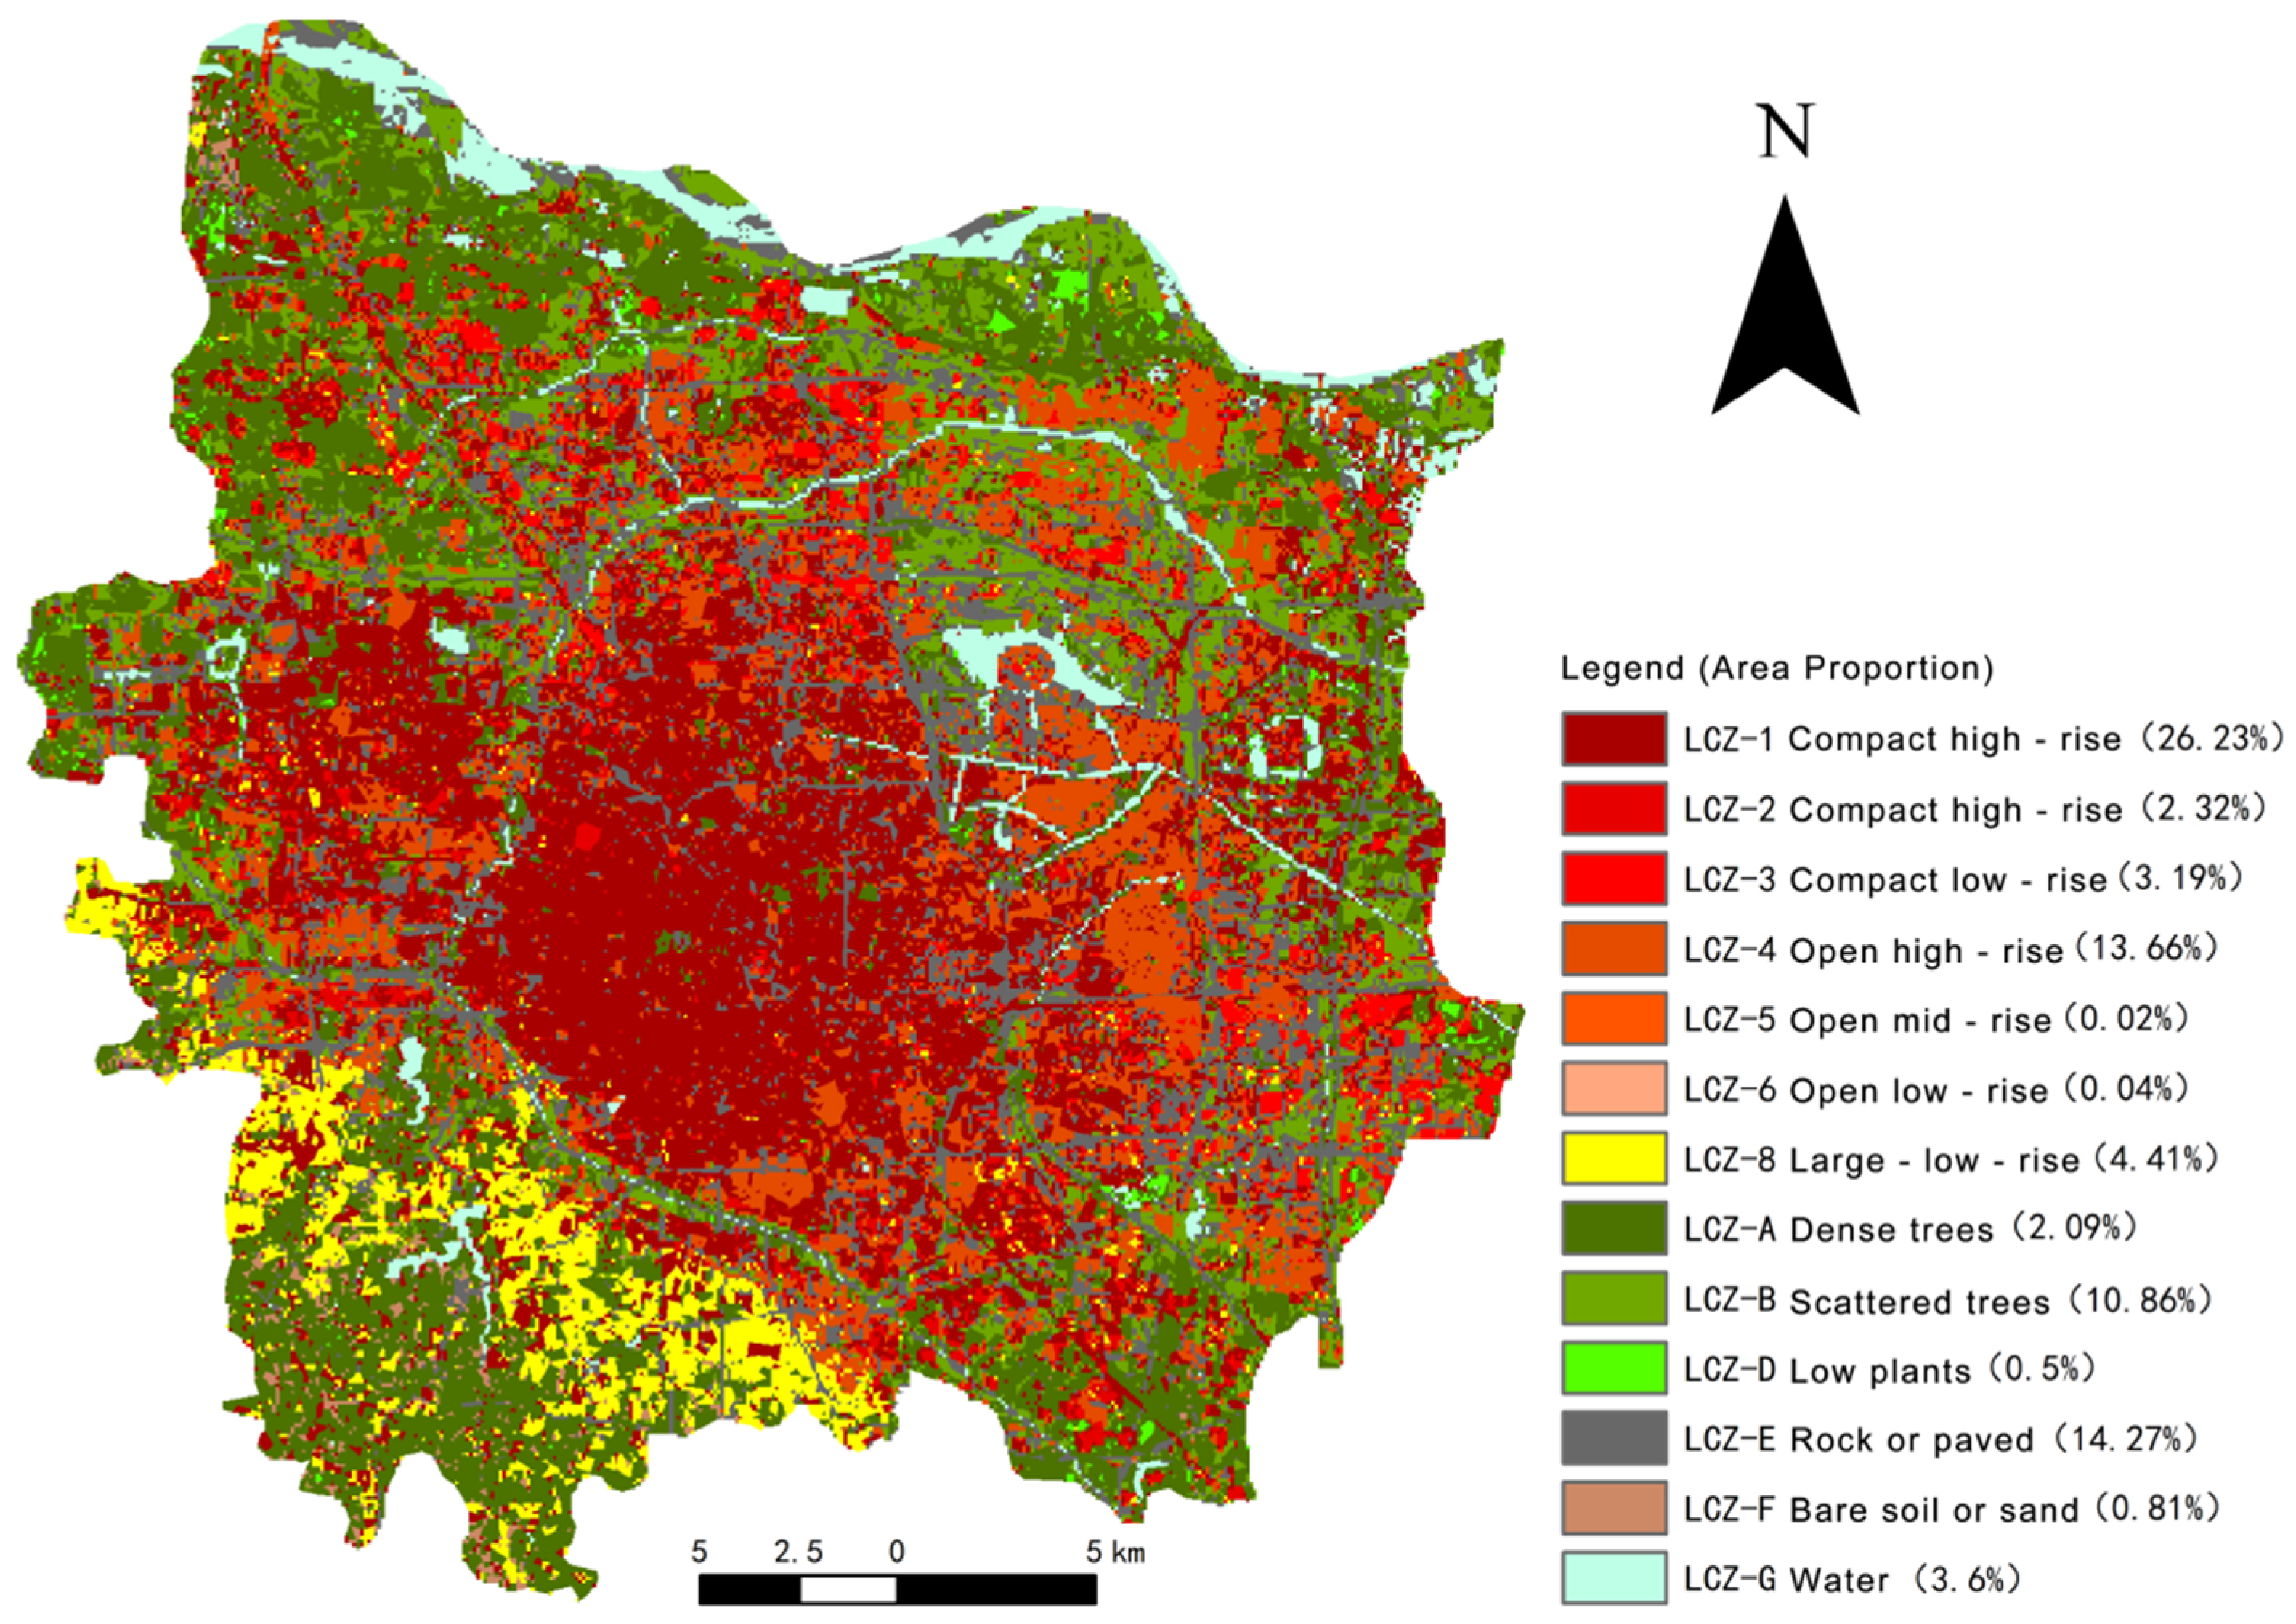
The local climate zoning in the study area reveals a clear dual structure characterized by “high-density construction” and an “ecological base,” which fundamentally shapes the urban thermal environment and heat risk distribution. This spatial heterogeneity significantly influences local microclimates and has important implications for urban planning and heat mitigation strategies. Understanding the distribution and interaction of different Local Climate Zones (LCZs) is crucial for targeted interventions aimed at reducing heat exposure and enhancing urban resilience.
Specifically, dense high-rise buildings (LCZ 1) dominate with 26.23%, mainly located in central business districts and around rail transit hubs. These clusters form continuous canopies at the 100 m scale, with surface hardening rates exceeding 80% [29,30]. Open building types display a layered spatial pattern: open high-rise (LCZ 4) constitutes 13.66%, often associated with large public building complexes like industrial parks and university towns [31]; the negligible presence of open mid-rise (LCZ 5, 0.02%) and low-rise (LCZ 6, 0.04%) buildings indicates marginalization of medium- and low-intensity development. Notably, large low-rise buildings (LCZ 8) cover 4.41%, clustering along main freight routes in a band-like pattern [32], where metal roofing may exacerbate local heat risks due to thermal capacity effects [33].
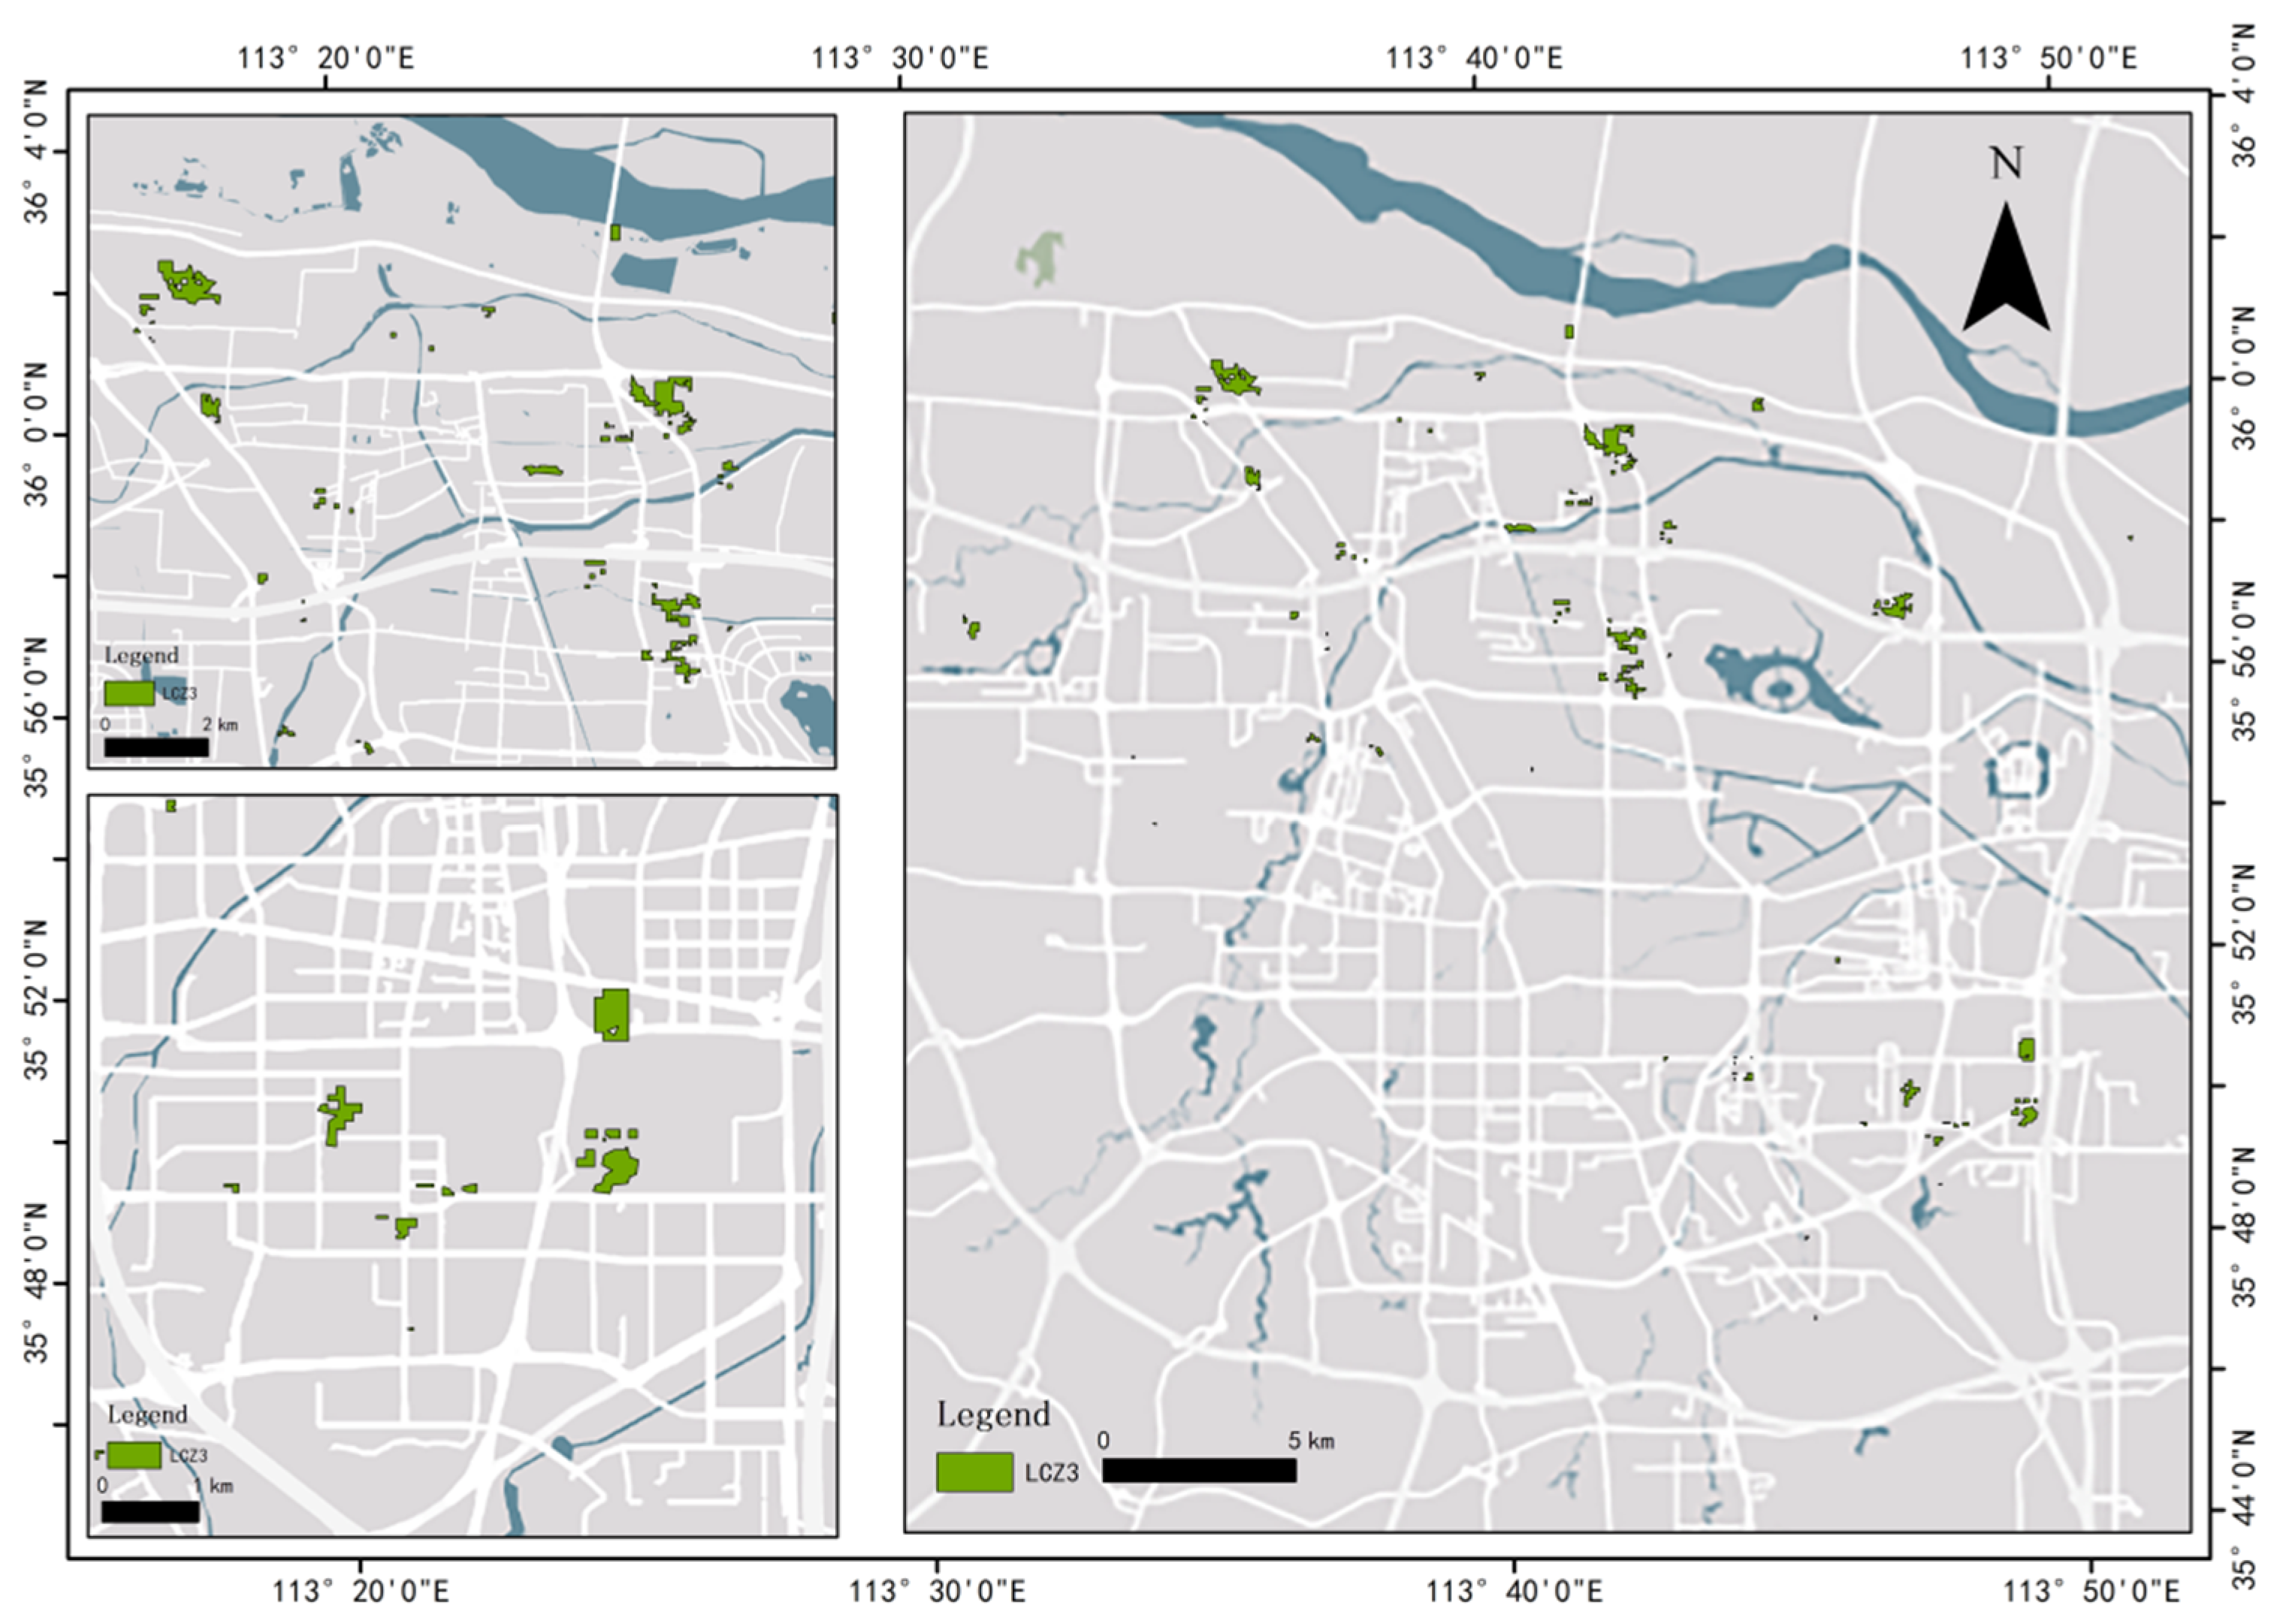
Among natural surfaces, dense forests (LCZ A) form the main ecological base, accounting for 21.09%, predominantly in hilly urban–rural fringe areas and serving as a green barrier around built-up zones [34]. Sparse forests (LCZ B) represent 11.86%, typically integrated as street trees and community green spaces within the urban fabric. Hardened ground (LCZ E) covers 14.6%, overlapping with high-rise areas in height, and exhibits summer daytime surface temperatures 5–8 °C higher than vegetated areas on average [35]. Water bodies (LCZ G), although only 3.6% of the area, create urban cold corridors through features like the Jinshui River and Dongfeng Canal, interacting with high-rise clusters in zones such as Zhengdong New District CBD (Figure 3).

3.2. Spatial Differentiation Pattern of Surface Thermal Environment

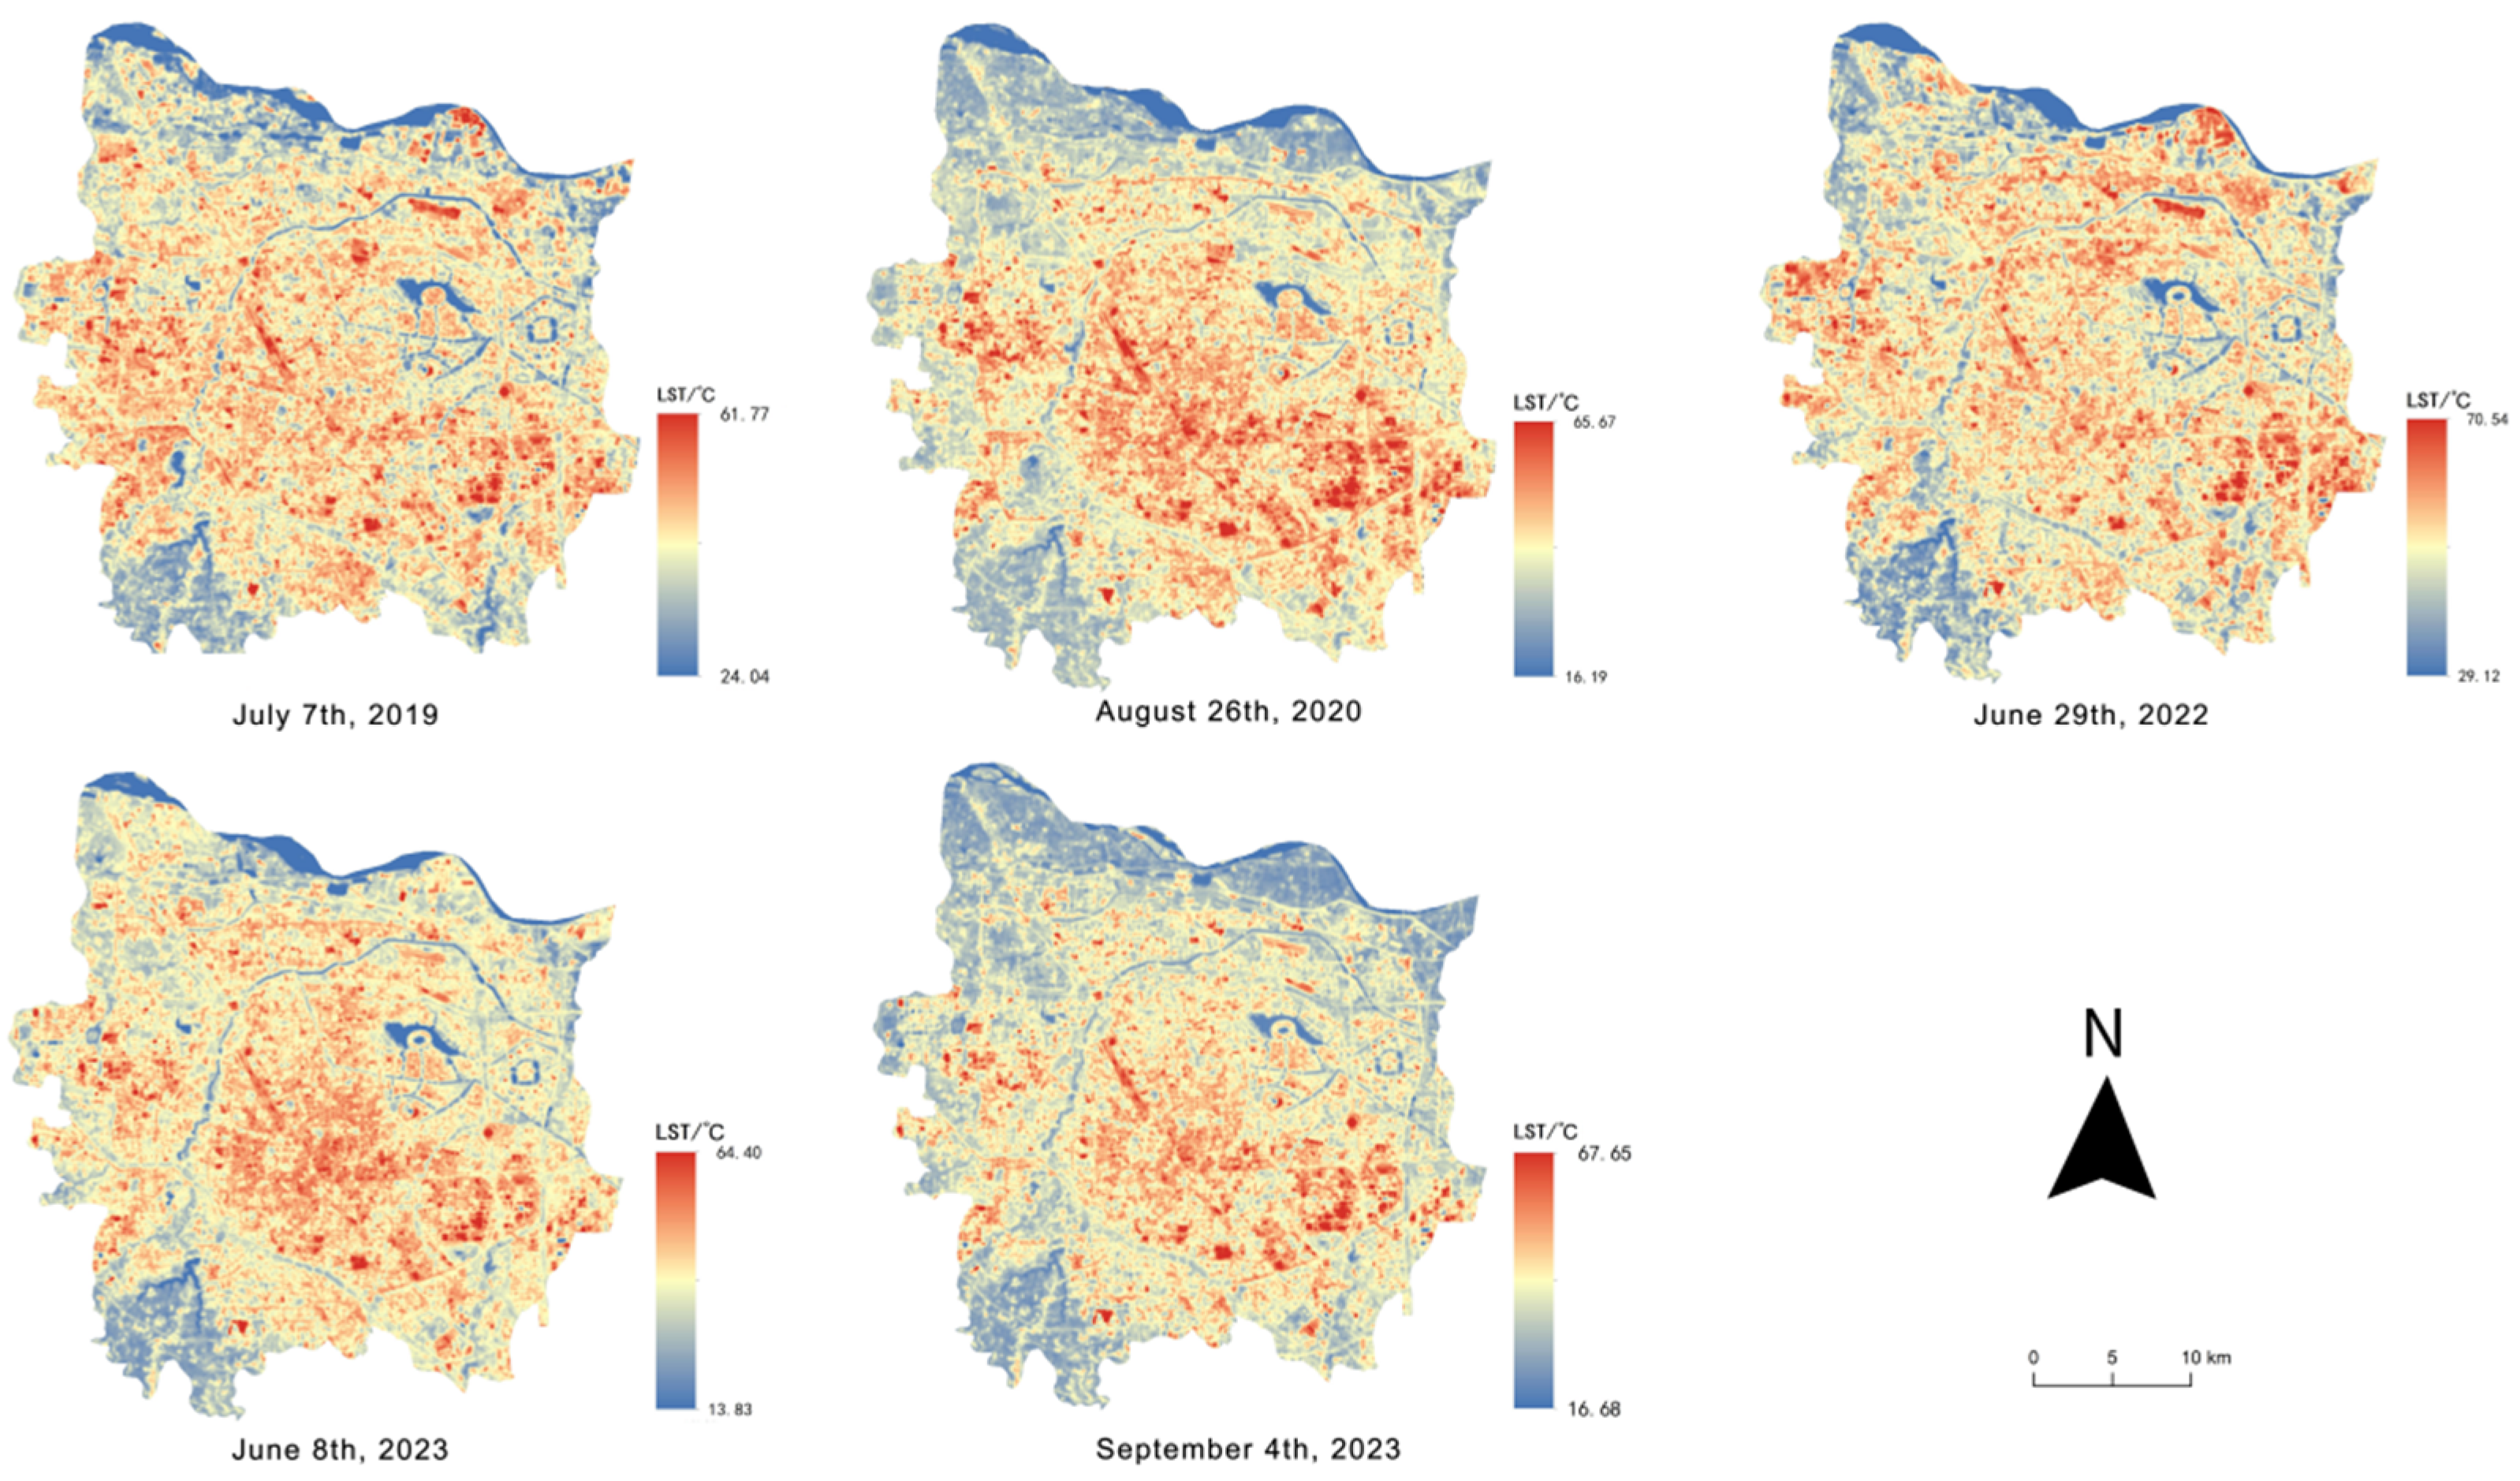
Based on the analysis of five periods of LST data from 2019 to 2023, there are significant and consistent spatial differentiation characteristics of surface temperature (LST) for different LCZ types [36], and the temperature difference between the high-temperature area and the low-temperature area fluctuates with seasons and weather conditions (Figure 4).
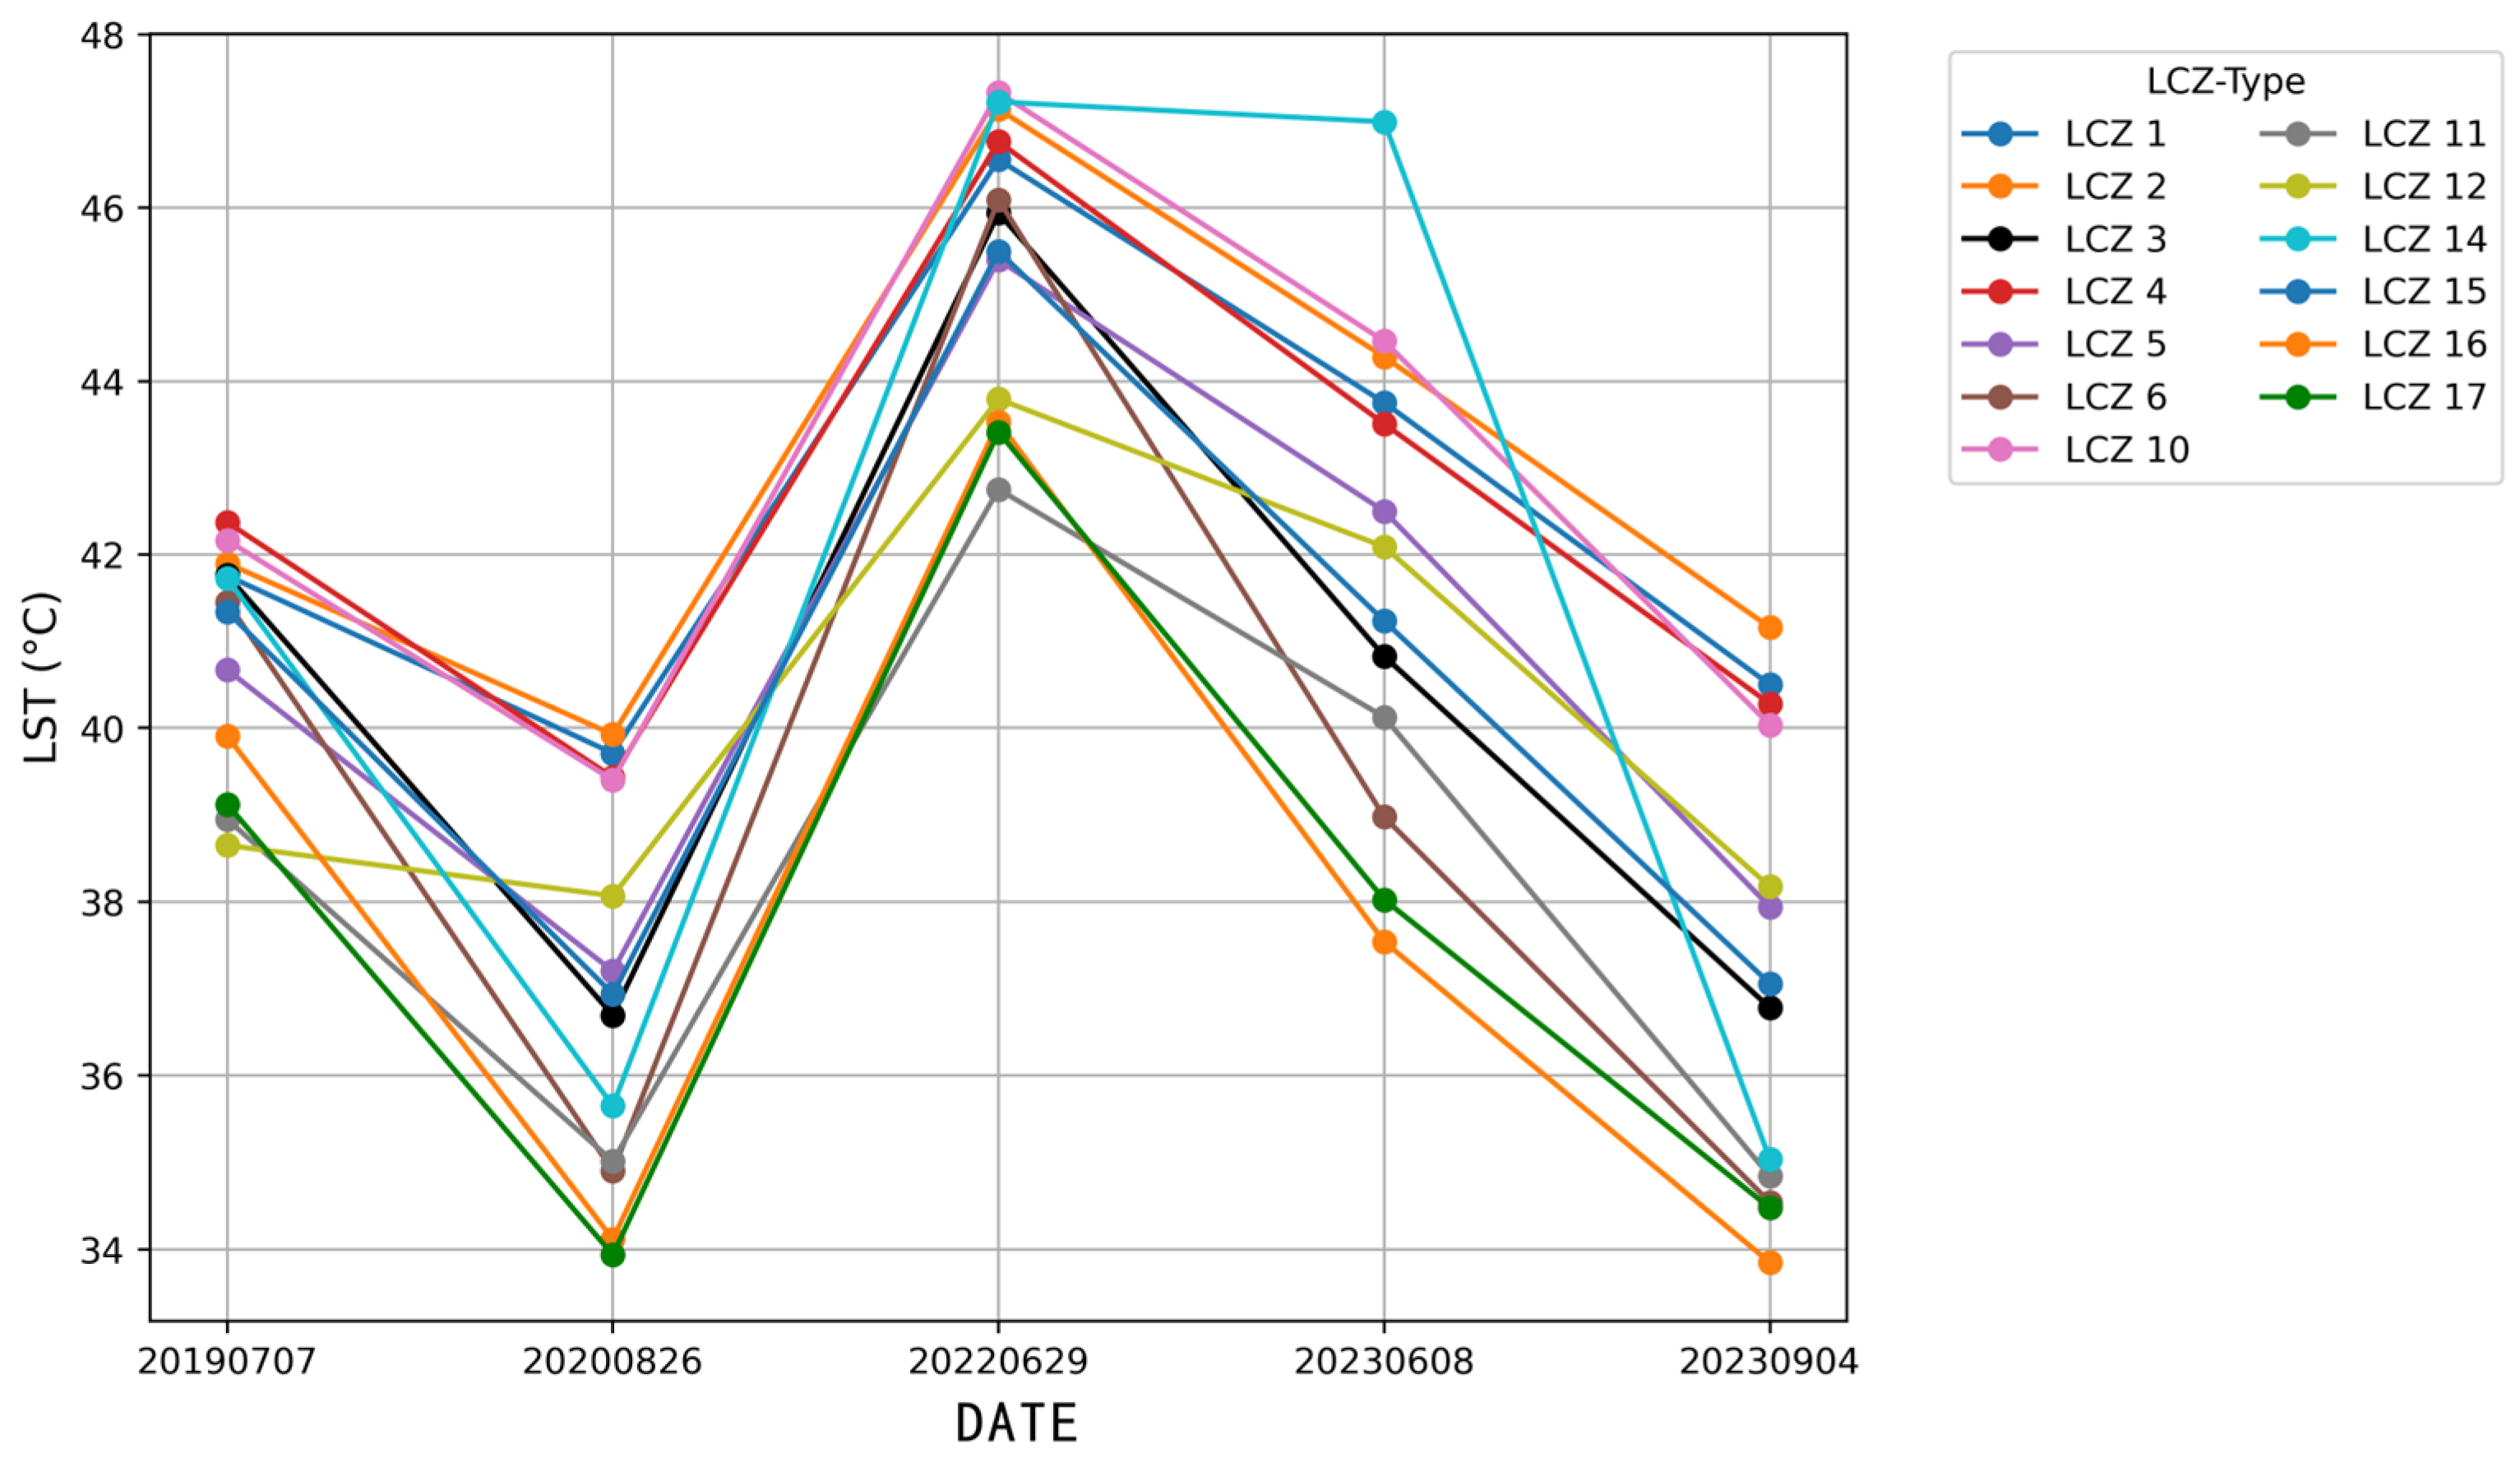
For instance, on 29 June 2022 (an extremely hot day), the average LST of the dense low-rise buildings (LCZ 3) reached 49.15 °C (Li Xin et al., 2017) [37], which was the peak value among all dates, and the temperature difference from the water body (LCZ G) was 11.16 °C. This clearly demonstrated the severity of the heat island effect in Zhengzhou, which ranks seventh in the country. On other dates, the average LST of the high-temperature areas (LCZ types, such as LCZ 2, 3, 6, 8) remained at a relatively high temperature. For example, on 8 June 2023, the average LST of LCZ 6 (open mid-rise buildings) was 46.35 °C, significantly higher than the water body (LCZ G, 32.94 °C) during the same period, while the low-temperature areas (LCZ types, such as LCZA, C, G) recorded 35.48 °C and 31.63 °C, respectively, on 26 August 2020, further verifying the stable cooling capacity of natural vegetation and water bodies [38,39]. The average LST of the industrial area (LCZ 8) reached 47.33 °C on 29 June 2022, approaching the temperature level of the dense buildings, indicating that its building materials have significant thermal retention characteristics [40] (Figure 5).
Further analysis shows that the average LST values in the densely built-up areas (LCZ 1-6, 8) are generally 6–12 °C higher than those on the natural surface (LCZ A-G), and the temperature difference is more significant during hot summer days. This phenomenon reveals the crucial influence of urban form and surface cover types on the local thermal environment (Table 3).

3.3. Spatial Differentiation of Environmental Heat Exposure Risk Based on LCZ Classification

3.3.1. High Exposure LCZ Types

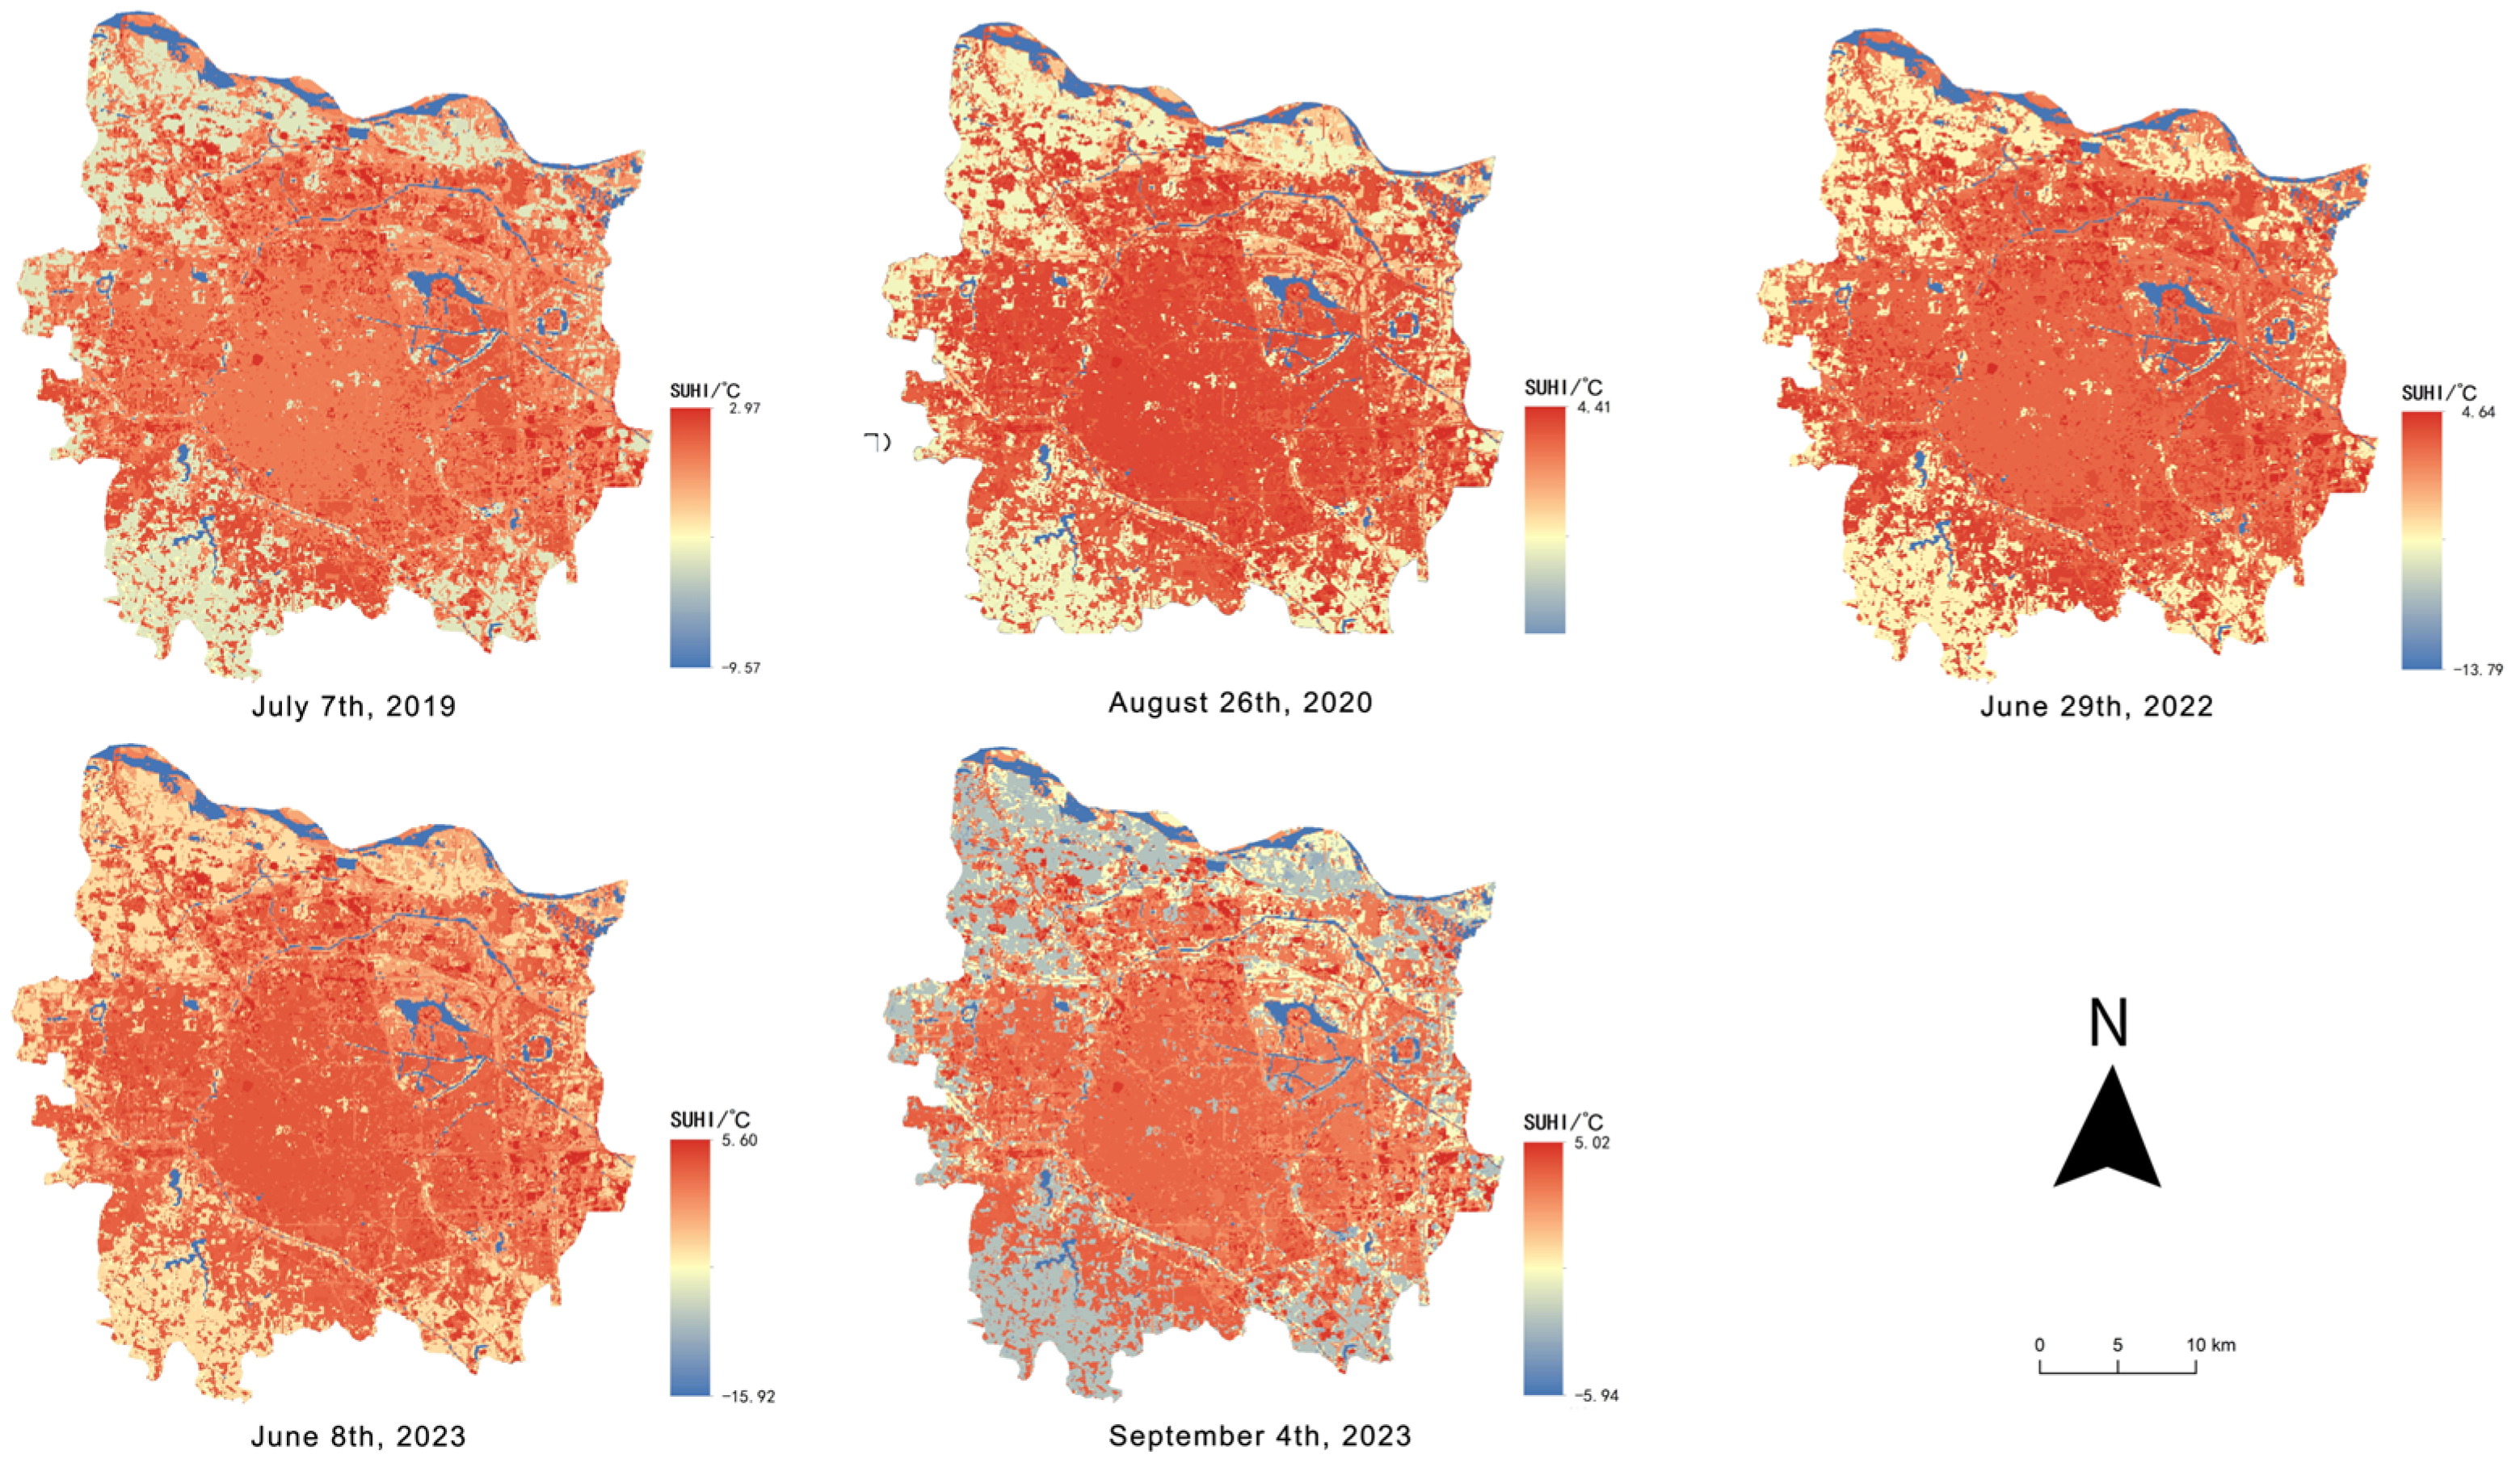
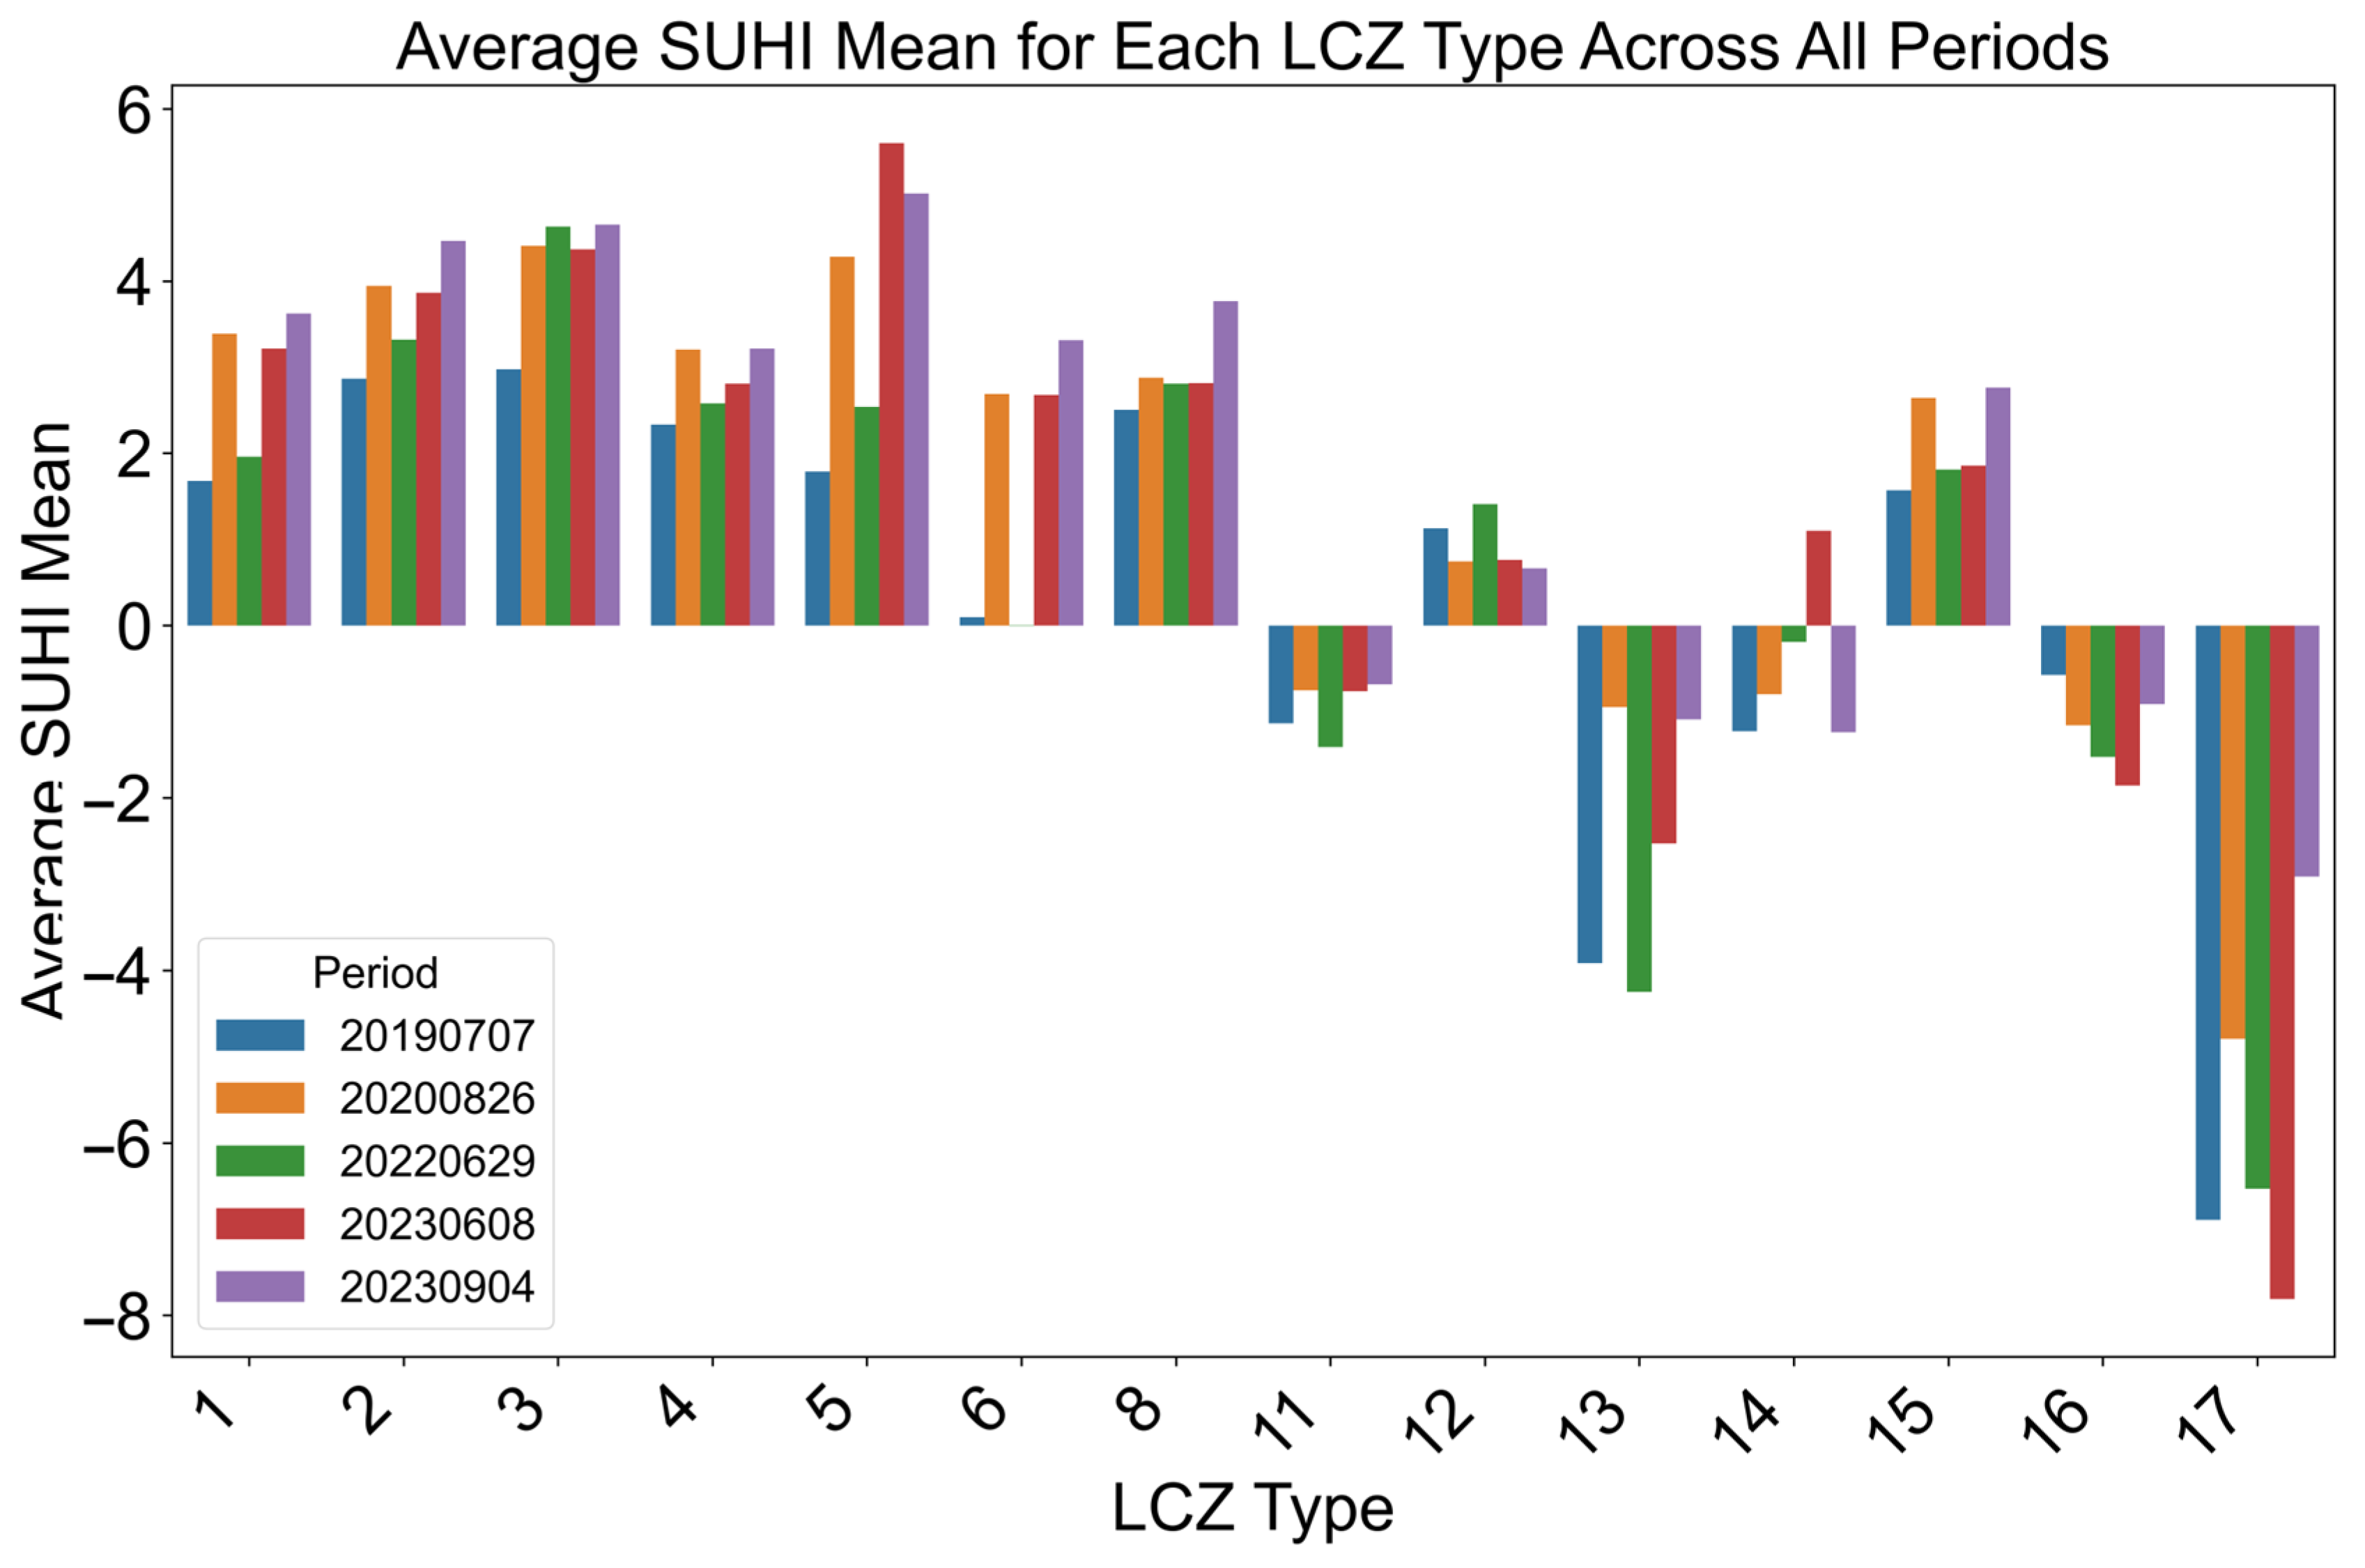
The analysis results of the mean urban heat island effect (SUHII) values for each LCZ area in five periods (7 July 2019, 26 August 2020, 29 June 2022, 8 June 2023, and 4 September 2023) show that LCZ types 2, 3, and 5 exhibit relatively higher mean SUHII values in multiple periods (Figure 6). Specifically, although the SUHII values of each LCZ fluctuate over time, LCZ 2 (dense middle layer), LCZ 3 (dense lower layer), and LCZ 5 (open middle layer) are all located in the rows with higher mean SUHII values in most of the analyzed periods.
The cross-period comparison shows that the dense built-up area types (LCZ 2 and LCZ 3) tend to have higher SUHII averages due to their higher proportion of impervious surfaces and heat capacity, while the higher heat island effect of LCZ 5, as an open middle-layer building area, may be influenced by architectural layout, green coverage rate, or other local environmental factors [41]. Its SUHII average also shows a relatively high level in some periods.
Based on the mean analysis of these five periods, the three land cover types, LCZ 2, LCZ 3, and LCZ 5, continue to exhibit higher surface urban heat island intensity (Figure 7). Therefore, this study determines LCZ 2, LCZ 3, and LCZ 5 as areas with higher heat exposure risks within the study region, for subsequent in-depth analysis of thermal environment characteristics and risk assessment.

3.3.2. Spatial Characteristics of High-Exposure LCZ Types

Based on the spatial autocorrelation analysis of five heat exposure events in the summer from 2019 to 2023, LCZ2 (dense lower layer) and LCZ3 (dense middle layer) showed significant spatial clustering (Moran’s I ranging from 0.098 to 0.270, p < 0.01), while the global correlation of LCZ5 (open middle layer) was always insignificant (with Moran’s I ranging from −0.463 to −0.156, p > 0.05). The proportion of hotspots (HH) in LCZ2 fluctuated between 1.3% and 3.05%, while coldspots (LL) only occurred sporadically (the highest 0.6%), and the heat exposure was dominated by non-significant areas (NS) (85.7–89%). The proportion of hotspots (HH) in LCZ3 increased with the years (2.2% in 2019 → 3.5% in 2023), and the abnormal area (LH) remained stable at 7.3–9.9% (Table 4), which was consistent with the spatial autocorrelation results of Zhengzhou LCZ3 by Wang Rui et al. (2022) [42], indicating that the heat retention effect has been increasing year by year. LCZ5 presented a unique outlier-dominated pattern: the proportion of LH (low values surrounded by high values) was as high as 22–45%, while the proportion of HL (high values surrounded by low values) fluctuated between 0.47% and 6.8%, and there were no significant hotspots or coldspots (HH/LL were both 0%). The small area of LCZ5 (0.19 km2) and the open layout may lead to its heat exposure distribution approaching spatial randomness. Although its overall mean was high, the local heterogeneity was mainly driven by fragmented anthropogenic heat sources and scattered green spaces (Table 4). This result confirms the key regulatory role of building density and form on the spatial pattern of the thermal environment.

3.4. Driving Mechanism of Environmental Heat Exposure Risk

3.4.1. Contribution Analysis of Driving Factors Based on LCZ Grouping

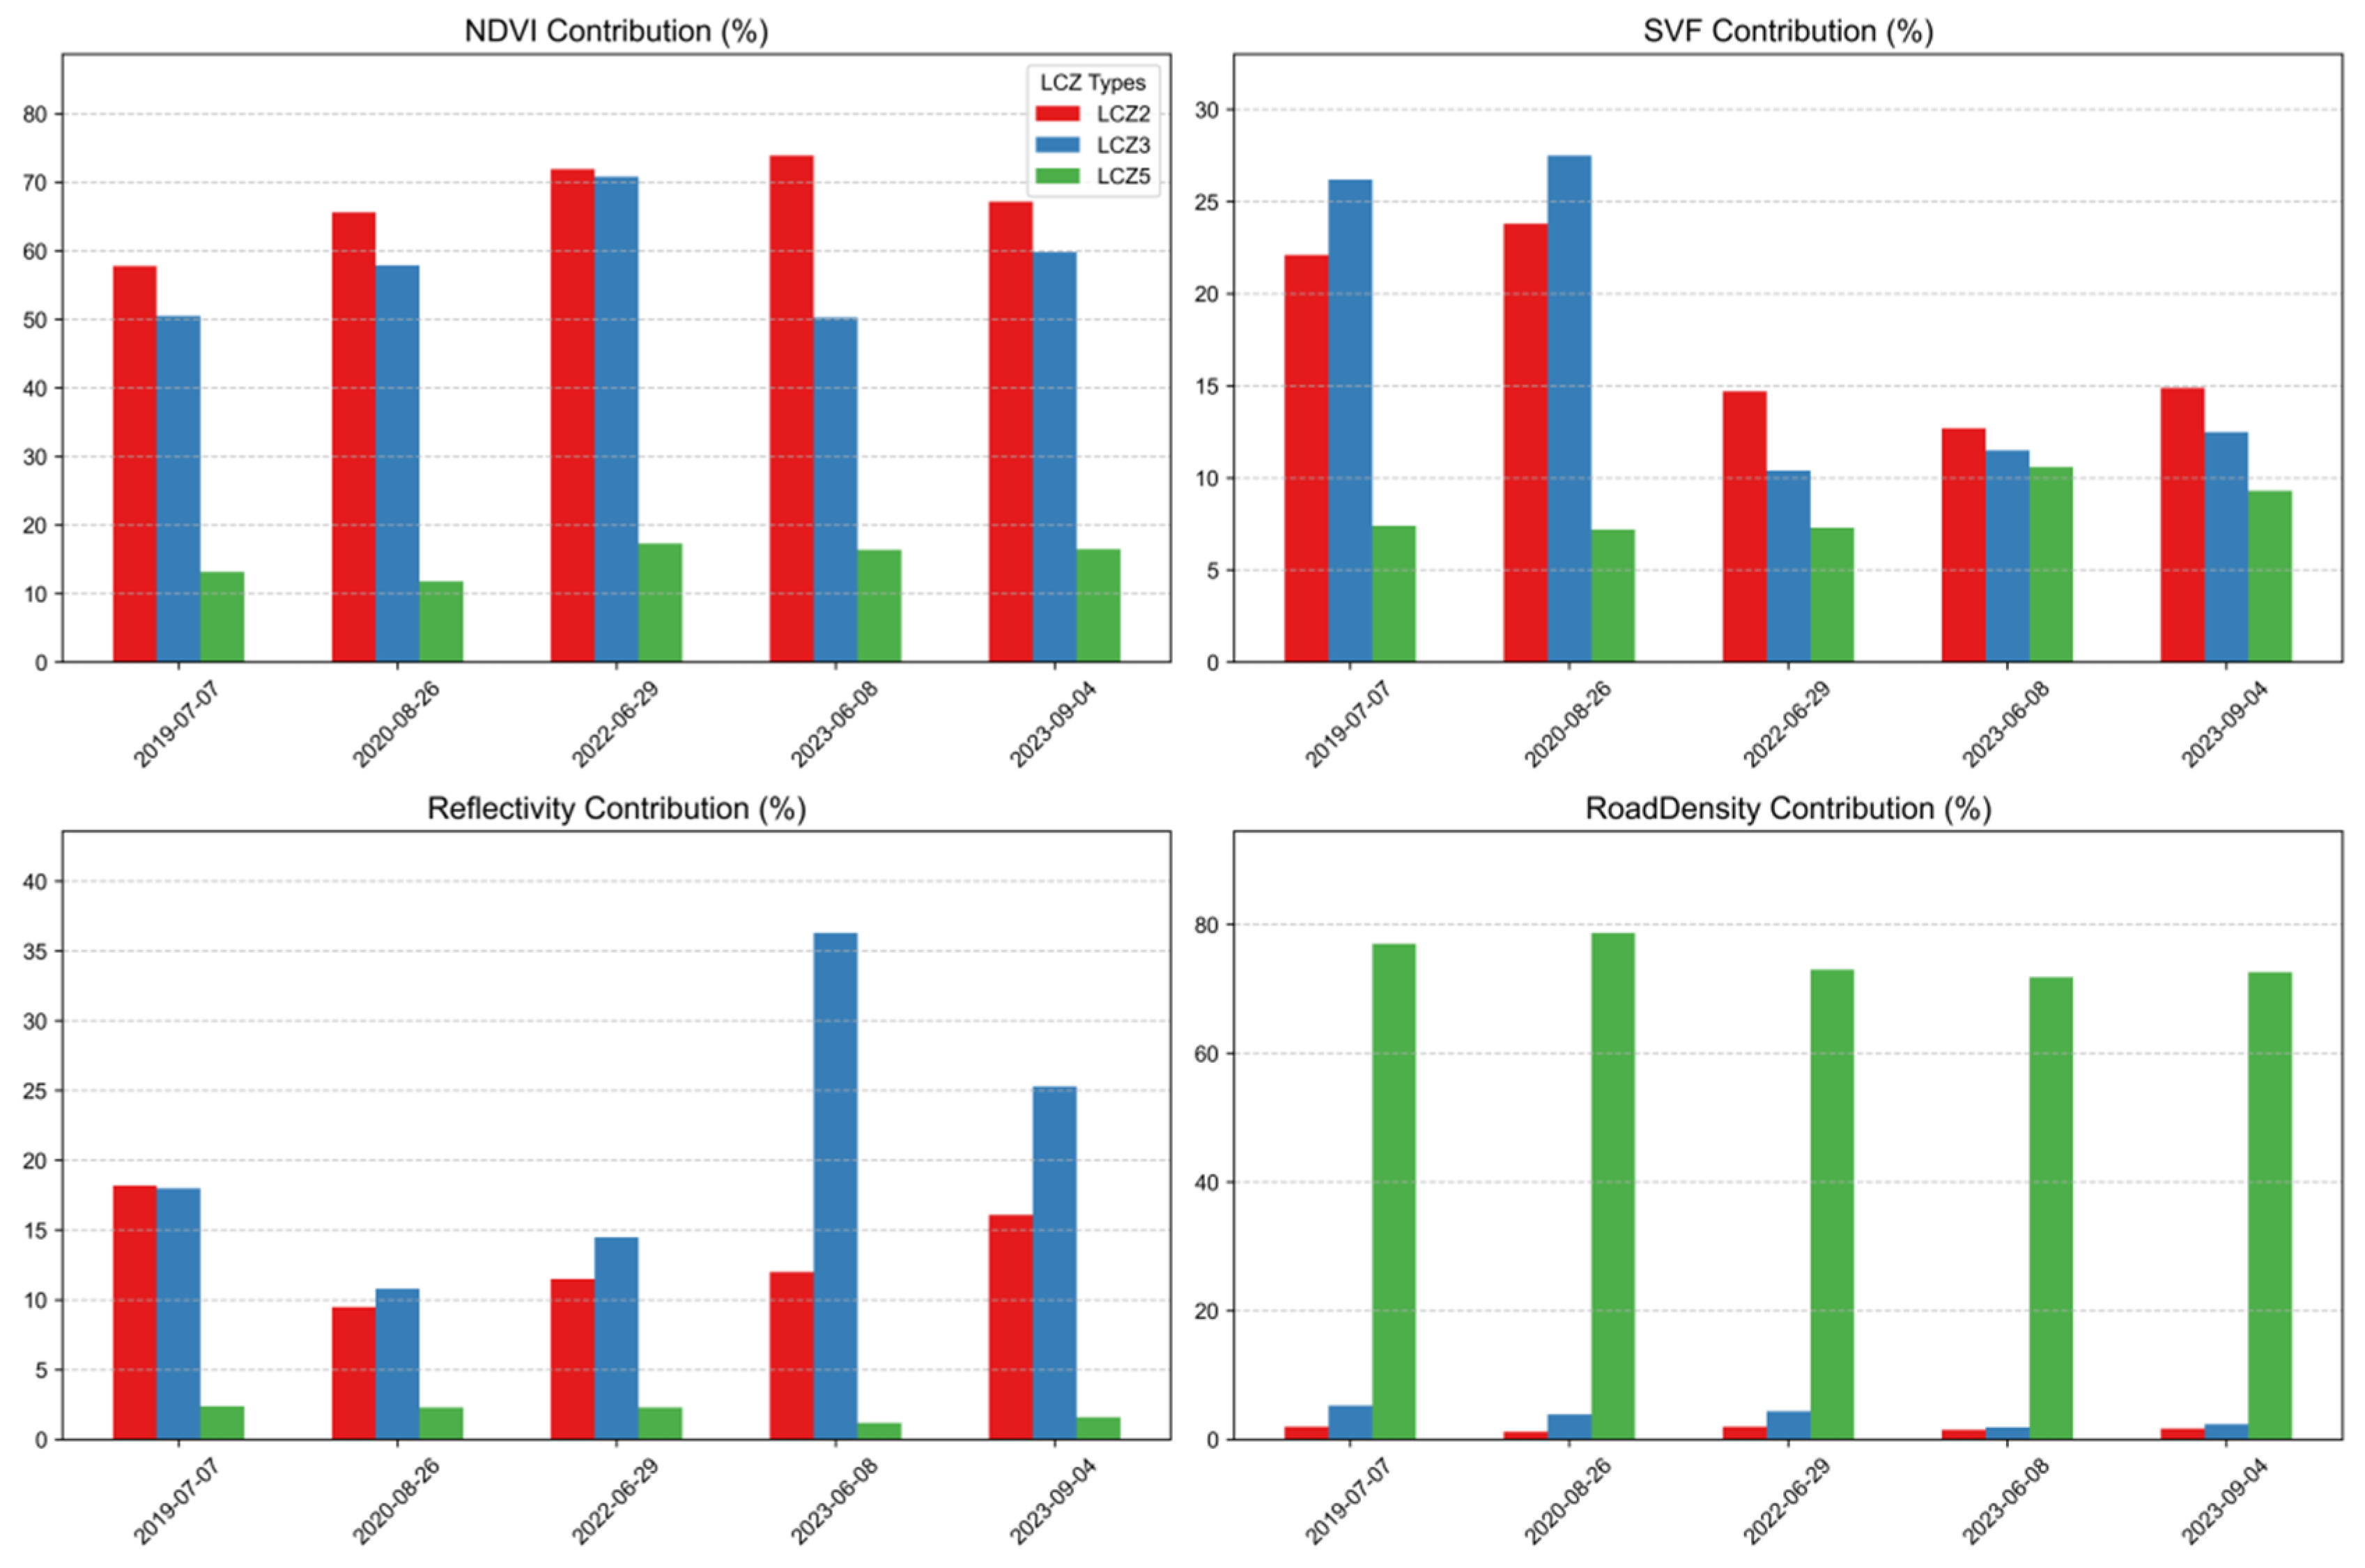
In the contribution analysis of heat exposure driving factors based on LCZ grouping, two models, random forest and Bayesian ridge regression, were used to evaluate the driving factors (Table 5). The random forest model is suitable for LCZ 2 and LCZ 3 types of regions, and it can better capture complex nonlinear relationships and quantify the contribution of each factor to LST. The analysis results (Figure 8) show that NDVI has always dominated the contribution to LST in LCZ 2 and LCZ 3 types of regions; its contribution rate fluctuates little at different time points, usually ranging from 44.7% to 69.8%; and the p-value is always 0.000, indicating that it has a significant impact on heat exposure in these two types of regions. The surface reflectance in LCZ 2 regions contributes relatively highly to LST, especially on 8 June 2023, with a contribution rate of 16.6%, while SVF contributes relatively less, usually ranging from 13% to 15%. For LCZ 3 regions, the contribution of surface reflectance to LST fluctuates greatly, with a contribution rate of 40.0% on 8 June 2023, indicating that this factor has a significant impact on heat exposure in a specific period. The Bayesian ridge regression model is mainly used for LCZ 5 regions. Although the sample size in this region is small, the model can provide robust regression estimates. The analysis results show that the contribution of NDVI to LST is much higher than that of surface reflectance and SVF, with a contribution rate ranging from 33.9% to 65.1%, and the p-value is 0.000, indicating that vegetation coverage has an important impact on heat exposure in this region. The contribution of surface reflectance and SVF is relatively small in LCZ 5, especially on 8 June 2023, when it was only 1.7%. Overall, NDVI has a more significant impact on LST in LCZ 2 and LCZ 3 regions, while surface reflectance and SVF have relatively weaker impacts on the heat exposure of these regions; in LCZ 5 regions, the role of green space and vegetation is more prominent, becoming the main driving factor for heat exposure in this region.

3.4.2. Spatial–Temporal Heterogeneity Analysis of Negative Correlation Between NDVI and LST

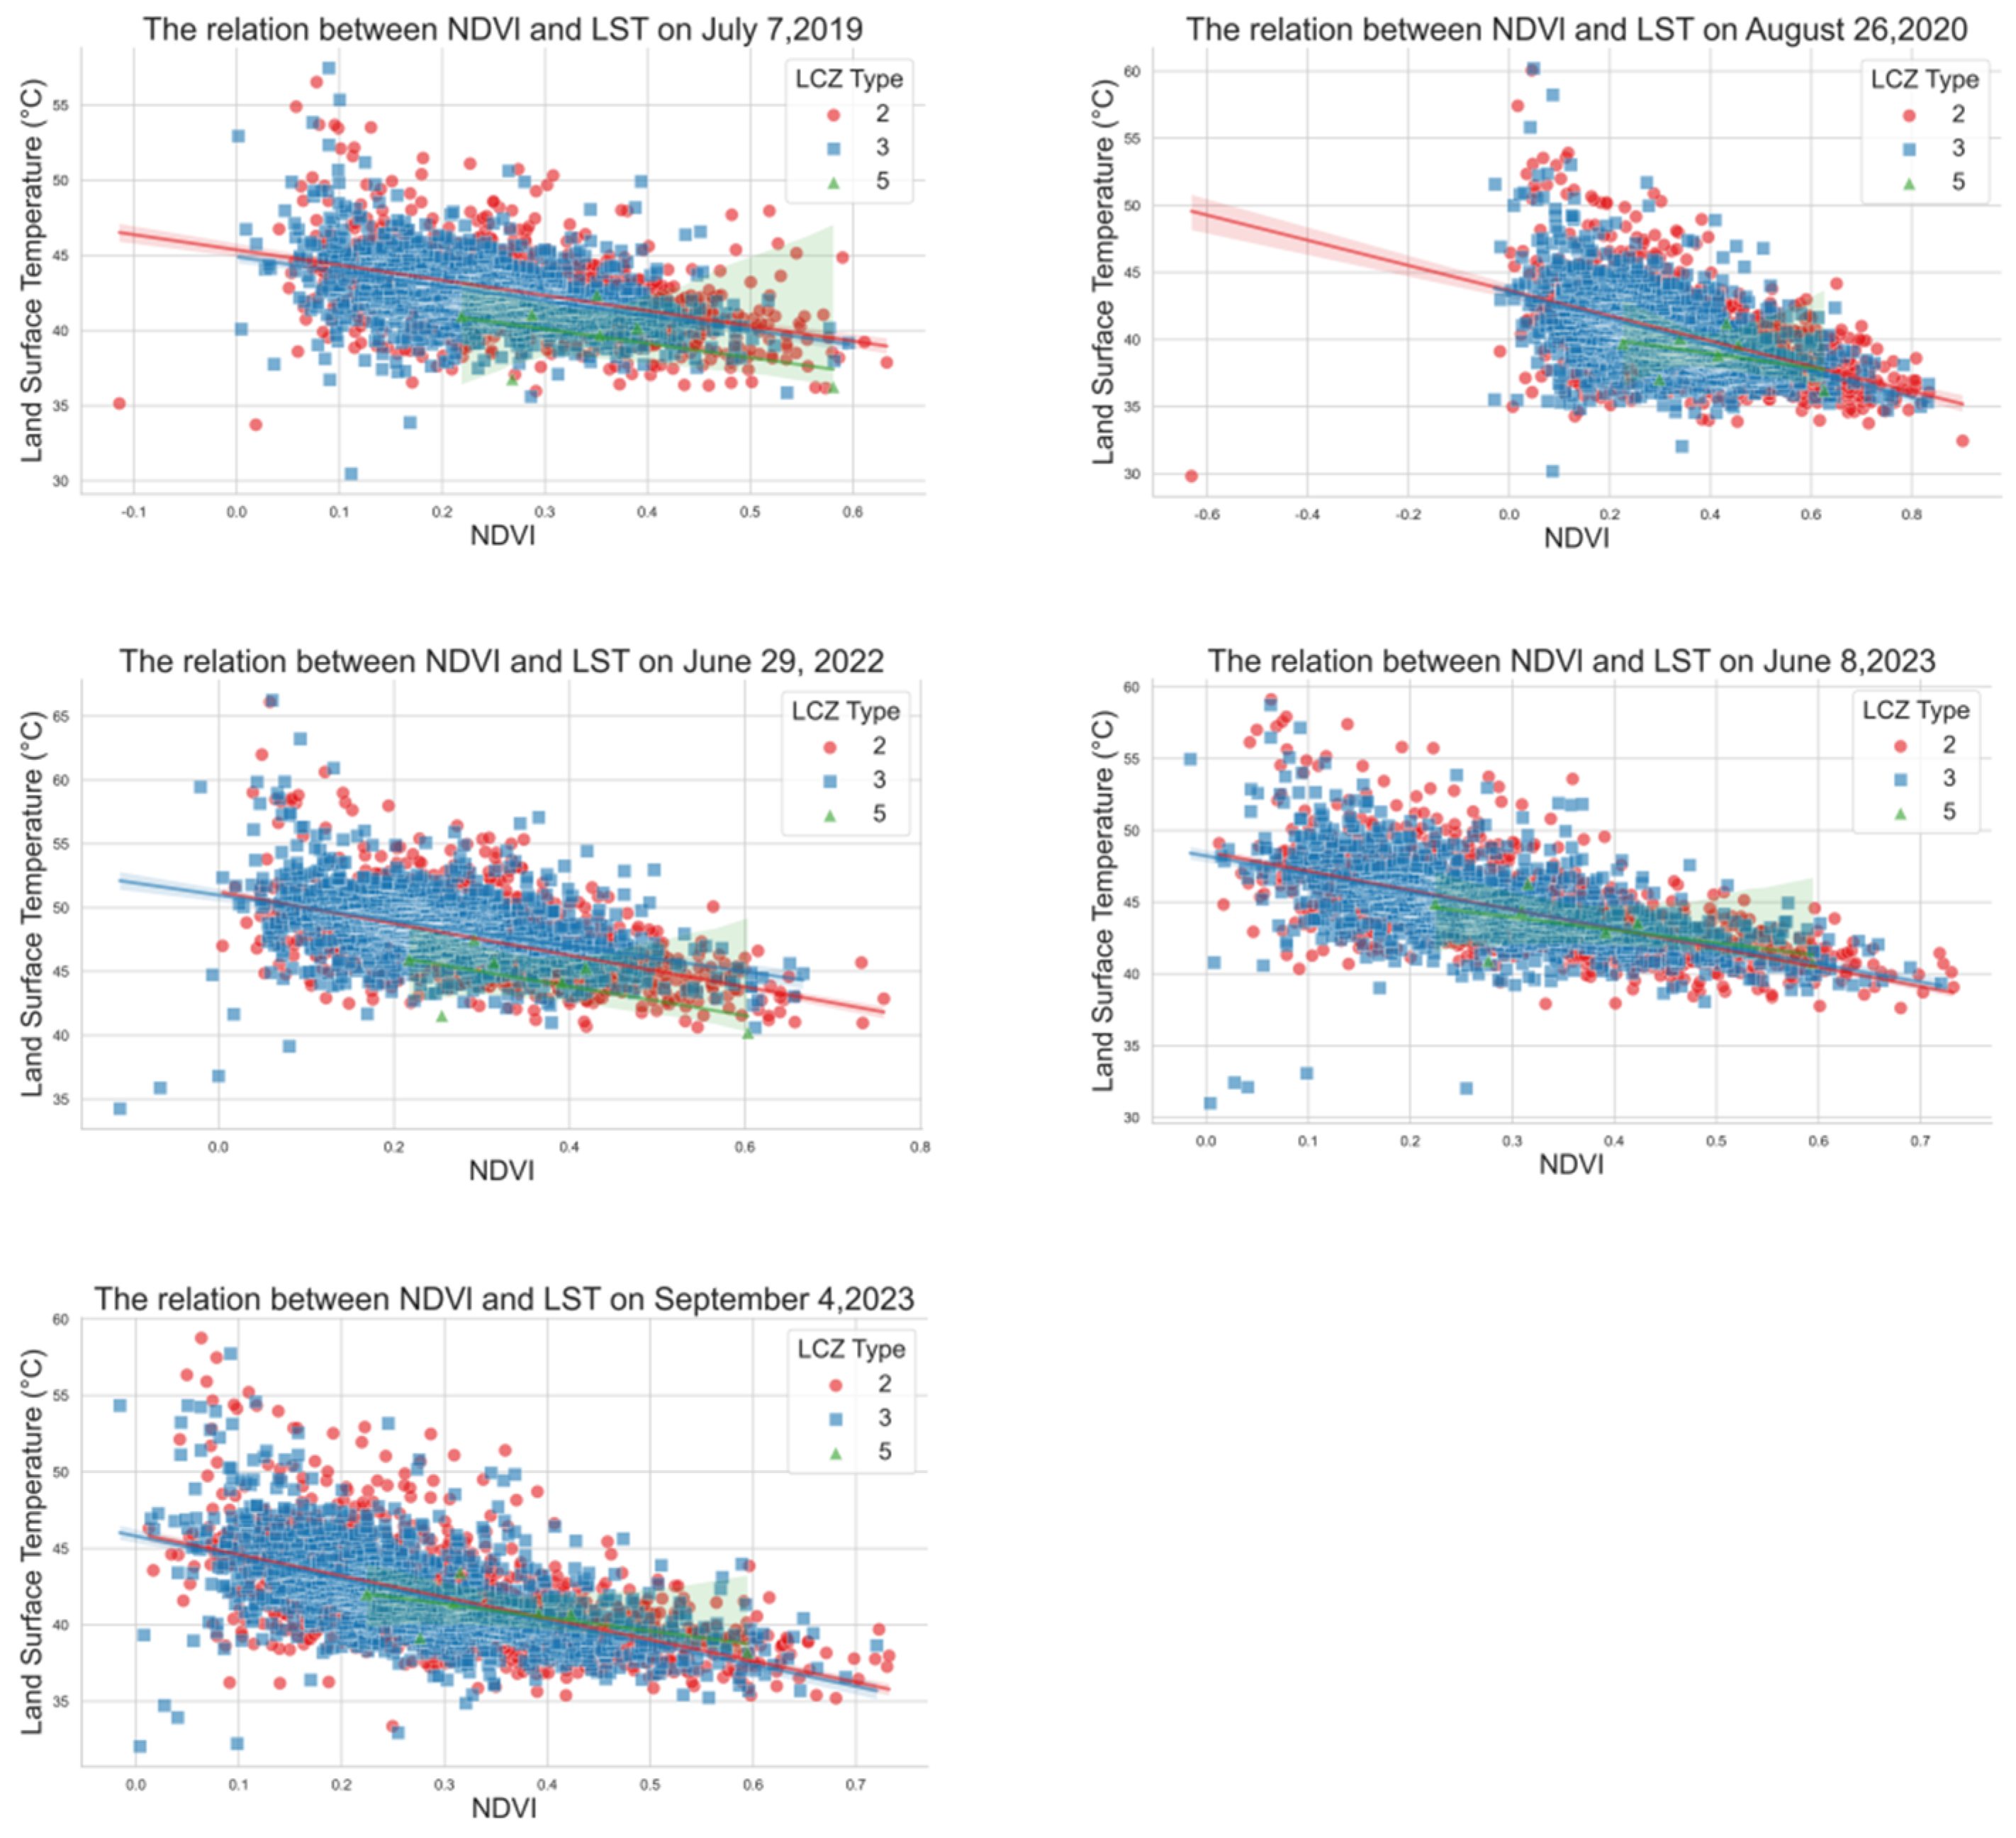
Based on the data analysis of five periods from 2019 to 2023, the negative correlation between NDVI and LST in different LCZ types shows significant spatial–temporal differences (Figure 9). The Pearson correlation coefficient of LCZ2 (high-density vegetation area) continuously increased from −0.454 (p < 0.01) in 2019 to −0.635 (p < 0.01) in June 2023, indicating that the regulatory effect of vegetation coverage on surface temperature has gradually enhanced year by year. The negative correlation in LCZ3 (medium-density building area) was also significant (p < 0.01), with the correlation coefficient rising from −0.403 in 2019 to −0.555 in September 2023, reflecting the gradually enhanced inhibitory effect of artificial greening measures on heat exposure. Although the correlation coefficient of LCZ5 (open mid-level building area) was relatively high in some periods (such as −0.620 in September 2023), due to the small sample size (n = 7), the statistical significance was insufficient (p > 0.1), and its cooling mechanism needs further verification. Overall, the negative correlation between NDVI and LST in LCZ2 and LCZ3 is robust and has been increasing year by year [43], confirming the core regulatory role of vegetation in urban heat exposure.

3.4.3. Evaluation of Greening Cooling Potential Based on NDVI-LST Regression

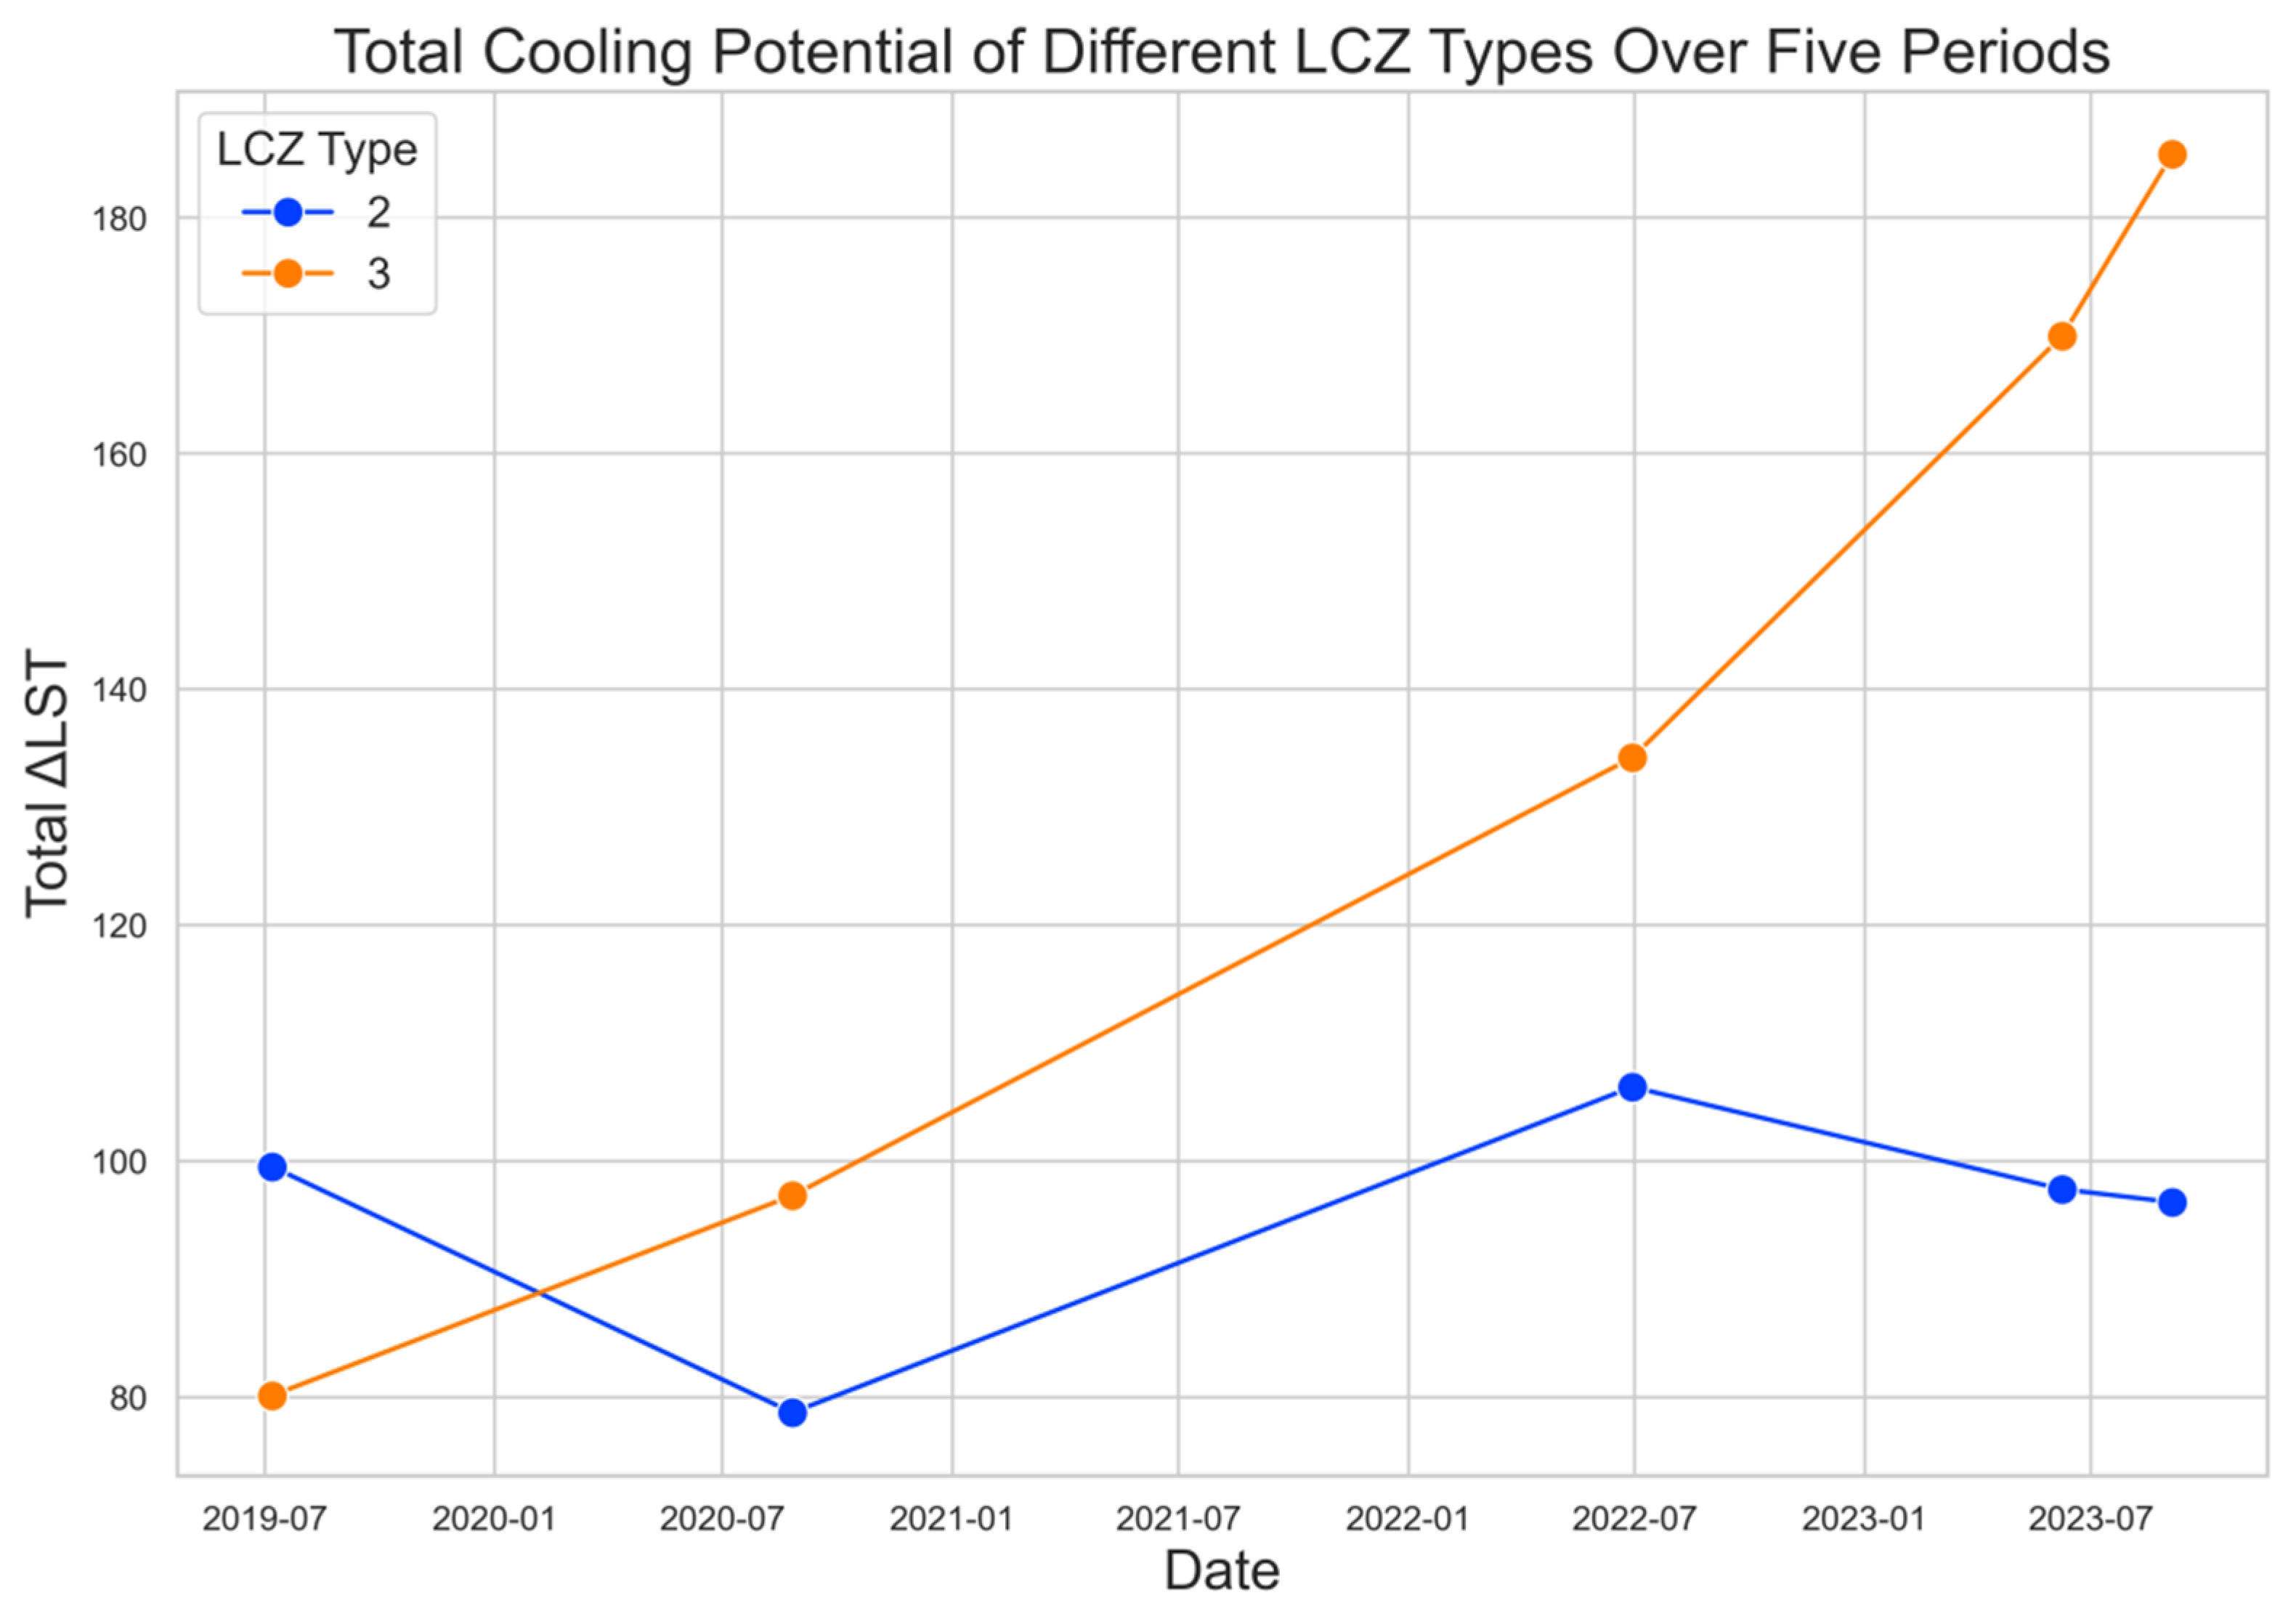
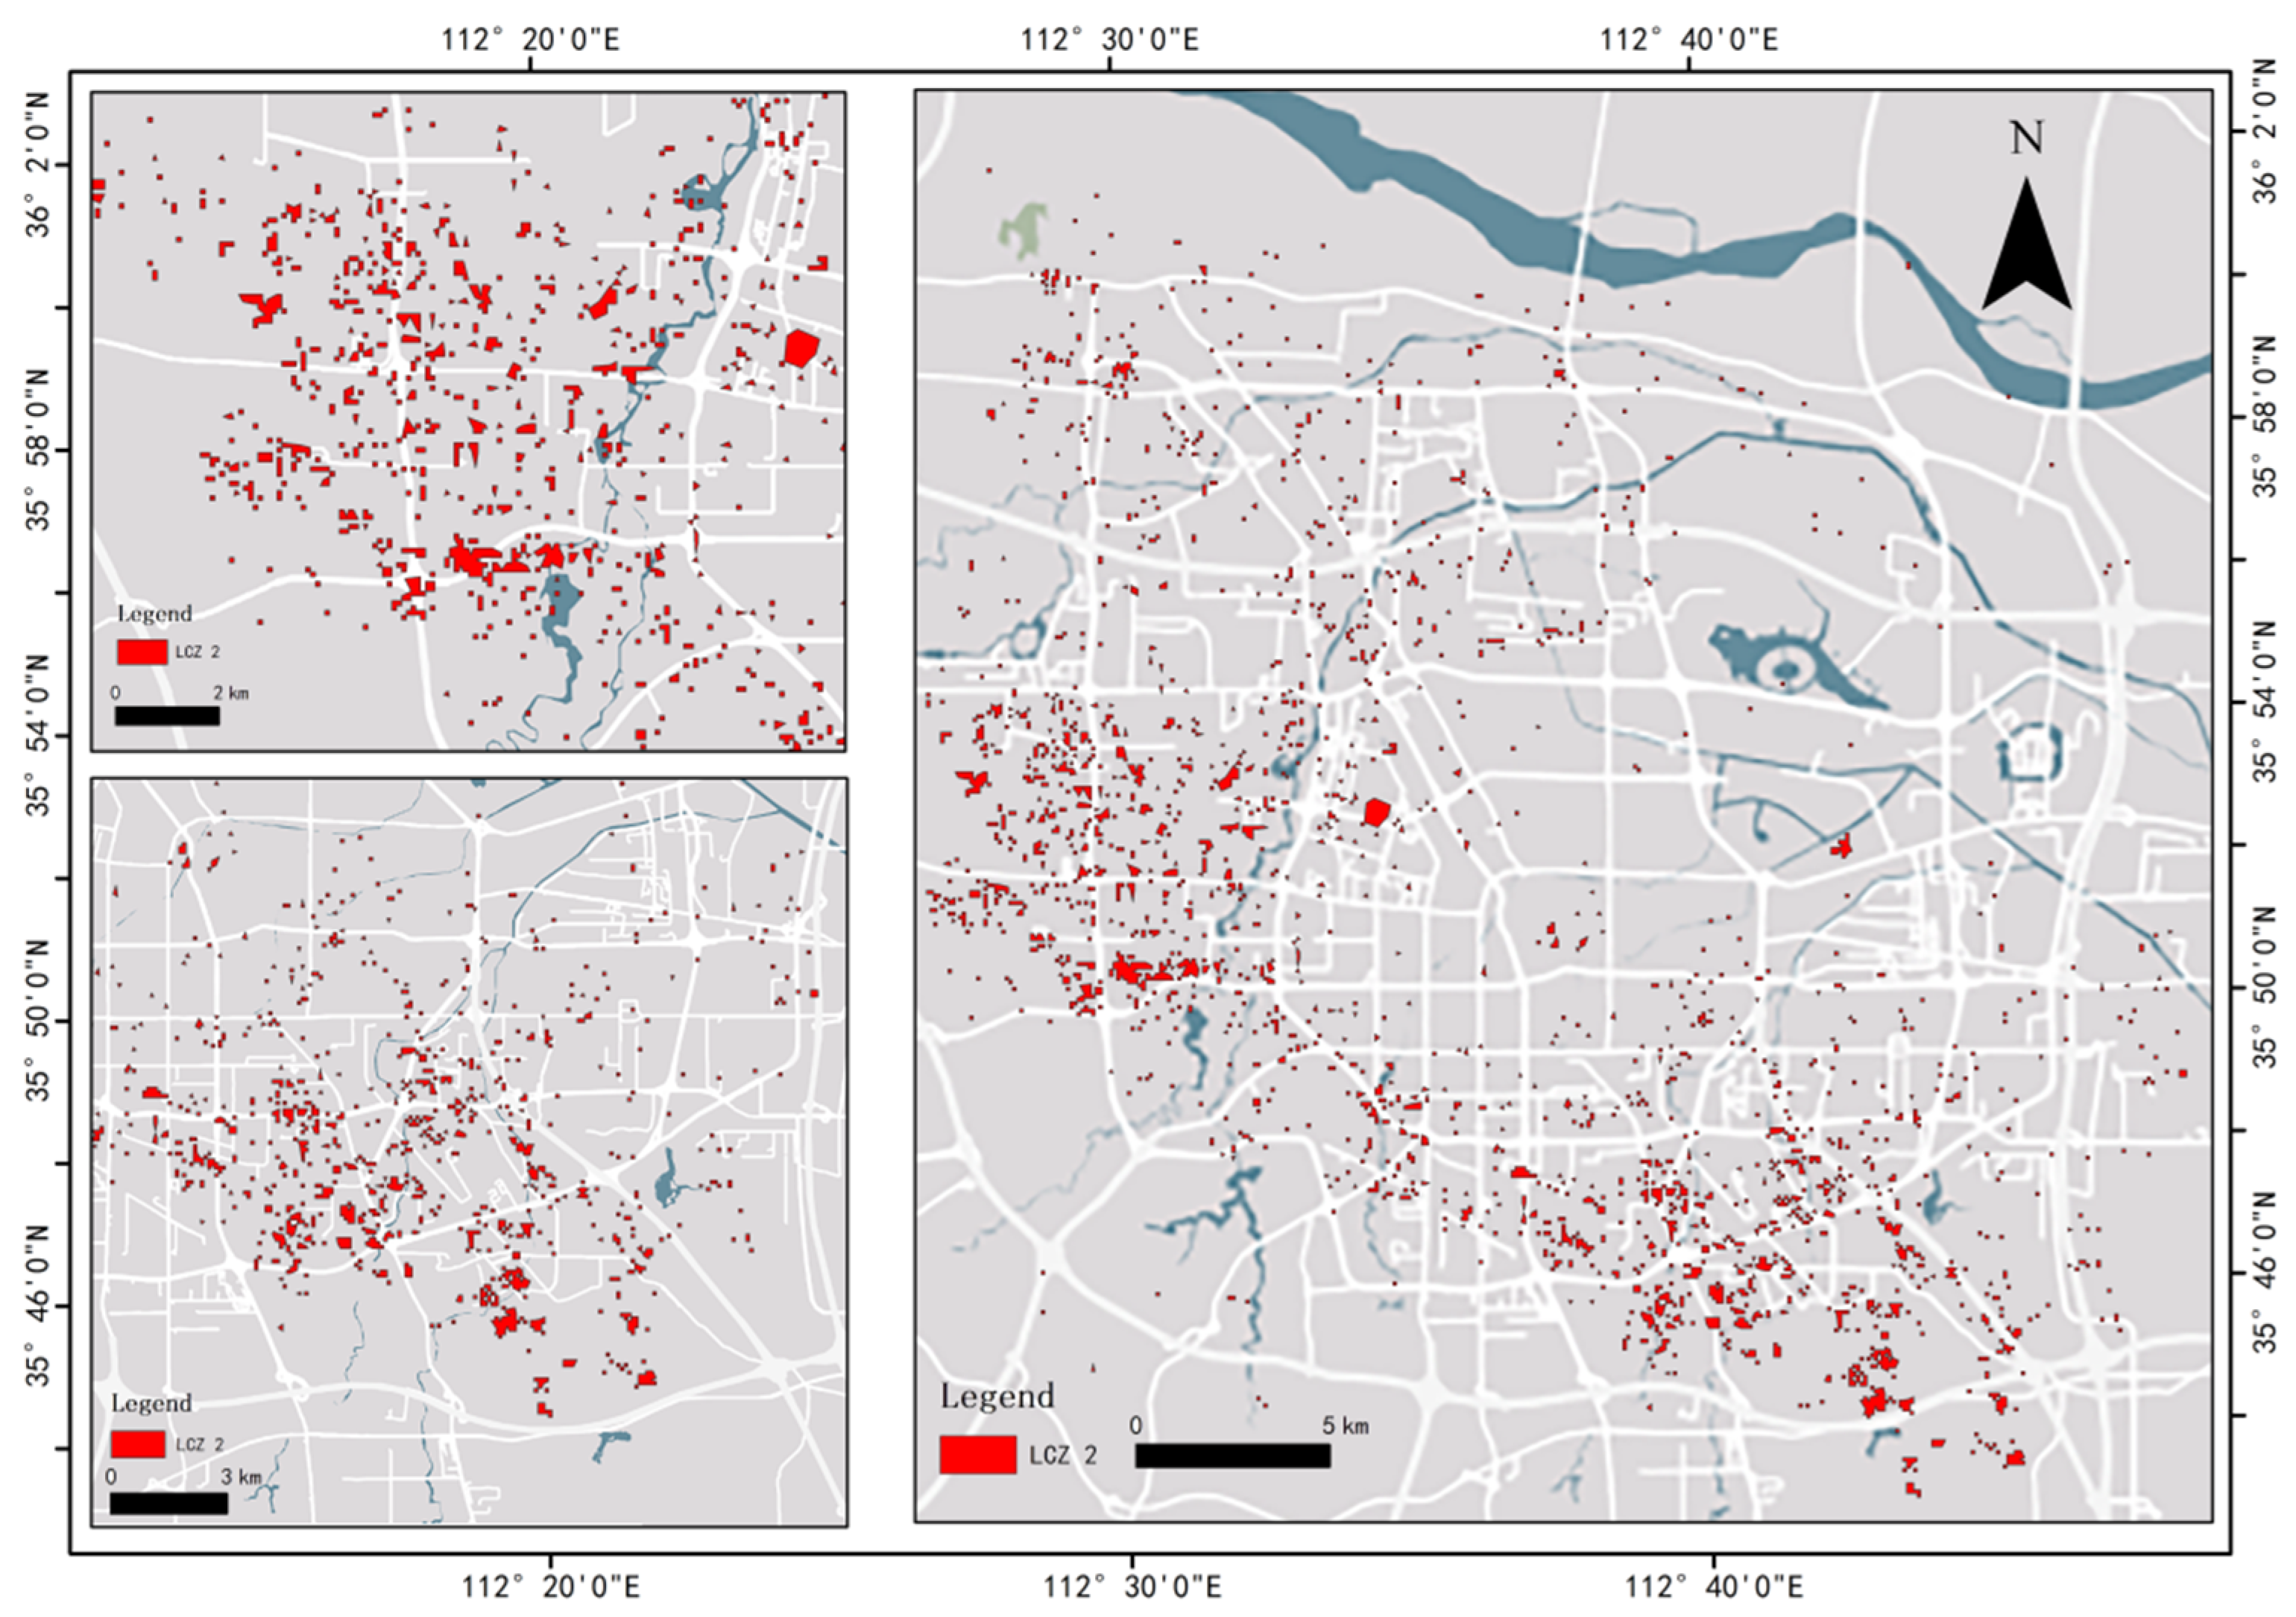
This study analyzed the cooling potential of LCZ2 (dense middle layer) and LCZ3 (dense lower layer) using the NDVI-LST regression model (Figure 10). The results showed that (Table 6) the mean NDVI of LCZ2 was 0.26~0.34, and the vegetation cooling sensitivity (slope −9.31~−11.10) was relatively stable. The area of low NDVI regions fluctuated between 12.79~13.22 km2, and the total cooling potential (average ΔLST × area) ranged from 78.72~106.29 °C/km2, with the highest potential in June 2022 (106.29 °C/km2). The mean NDVI of LCZ3 was lower (0.24~0.29), but its cooling sensitivity significantly increased (slope increased from −6.01 in 2019 to −13.59 in 2023, in line with the nonlinear response theory of vegetation coverage proposed by Jenerette et al. (2016) [44] (R2= 0.78)), and the area of low NDVI regions expanded (17.49~20.05 km2). The total cooling potential increased from 80.17 °C·km2 in 2019 to 185.39 °C·km2 in 2023, an increase of 131.4%, indicating a more urgent need for thermal exposure regulation. The comparison of the two regions showed that LCZ3, due to sparse vegetation, sensitive response, and continuous expansion of low NDVI areas, should prioritize the improvement of coverage through three-dimensional greening [45,46] and adopt an adaptive species selection strategy to maximize the cooling potential [47]; LCZ2 needs to precisely green the roofs and hardened plots with NDVI < 0.3. The total cooling potential (°C·km2) is a theoretical reference value, and in practical applications, it is necessary to optimize the layout by combining land use feasibility and vegetation ecological adaptability.

4. Discussion

This study analyzed the spatial response mechanisms of different LCZ types from the perspective of environmental heat exposure. The results indicated that LCZ3 (compact low-density built-up area) had the highest risk of environmental heat exposure. Its low NDVI mean (0.24–0.29), high proportion of hardened surfaces, and fragmented vegetation pattern jointly intensified local high-temperature stress. Considering that summer precipitation in Zhengzhou is concentrated (accounting for 50% of the annual total, Henan Provincial Climate Center, 2024) [48], it is recommended to prioritize the implementation of three-dimensional greening renovation projects in contiguous areas with NDVI below 0.25 in LCZ3 (hotspot areas of heat exposure) [49] (such as LH abnormal areas) (Zhang Yong et al., 2023) [50]. By planting high-transpiration trees and building vertical greening systems [51,52], the surface thermodynamic interface can be reconstructed to reduce regional heat exposure levels. Currently, such LH abnormal areas are mainly located around Niuzhuang Village, Damiao Village, Dongfeng Canal Riverside Park, and Tongle Park and should be prioritized as intervention areas for urban heat environment governance. LCZ2 (compact medium-density built-up area) has relatively low heat exposure intensity but significant spatial heterogeneity due to the combined effect of building shading and limited greenery [53]. For LCZ2 areas, efforts should be made to enhance roof greening and pocket park vegetation improvement projects to increase NDVI above the regional average (0.29) [54], thereby weakening the transmission effect of surface heat flux and heat exposure. Such high-heat-exposure areas are mainly concentrated between Xiliuhu Park and Tianjianhu Park, as well as between Xinzheng Park and Nanhuang Park, and have good greening potential and feasibility for transformation. Compared to LCZ2/3, although LCZ5 (open low-rise building area) was initially identified as a heat exposure area, due to the limited sample size (n = 7), its driving mechanism could not be fully analyzed. Further research needs to expand the sample size to verify the universality of the conclusion. Given the very small sample size of LCZ5 (n = 7), there is considerable uncertainty in the characterization of its heat exposure features and driving factor analysis. This study treats these findings as exploratory and recommends that future research increase the sample size, extend the time series, or incorporate similar data from neighboring cities for validation to enhance the reliability of the conclusions.
As shown in Figure 11, LCZ3 exhibits an unexpected localized cooling cluster within the LH (low heat) group, suggesting that micro-scale factors such as higher local SVF or proximity to water features may mitigate heat stress. The driving effect of environmental factors on heat exposure shows significant spatial hierarchy: in LCZ3, the contribution of NDVI (50.5%) and cooling sensitivity (slope −13.59) are both high, consistent with the results of the Zhengzhou green space study by Zhou Wei et al. (2022) [55], indicating that vegetation coverage is the core regulatory factor for mitigating heat exposure (Wang et al., 2022; Zhou et al., 2016; Yuan & Bauer, 2007) [56,57,58], while in LCZ2, the combined contribution of SVF and road density (24.1%) highlights the synergistic impact of building morphology on heat exposure. Figure 12 illustrates the recommended cooling intervention zones in LCZ2, derived from the random forest importance rankings and spatial vulnerability overlays, identifying priority areas for targeted greening and shading enhancements. Compared with existing studies, this work reveals the differentiated characteristics of heat exposure driving mechanisms under the LCZ classification framework, providing a quantitative basis for spatially targeted green infrastructure intervention strategies in high-density cities.
Furthermore, this study, taking LCZ classification as the spatial analysis basis, effectively identified the key driving factors of urban heat exposure by introducing nonlinear modeling methods, addressing the shortcomings of insufficient mechanism identification and weak expression of spatial heterogeneity in existing research. The study systematically characterized the heat exposure response characteristics of the main LCZ types in the main urban area of Zhengzhou for the first time, clearly identified LCZ3 as the area with the highest heat exposure risk, and accordingly proposed diversified greening improvement strategies such as three-dimensional greening, roof greening, and pocket parks (Gunawardena et al., 2017) [59], providing a technical path for spatially targeted governance. The introduction of the random forest model not only improved the accuracy of factor identification but also revealed the differences in dominant variables among different LCZ types, providing theoretical support for the classified policy-making and refined management of heat exposure response strategies in the future.
Despite this, it is necessary to recognize that this study has certain limitations in mechanism modeling and process cognition: First, this study employs a linear model to describe the relationship between the Normalized Difference Vegetation Index (NDVI) and land surface temperature (LST). This approach may underestimate the cooling potential in high-NDVI areas (NDVI > 0.6) due to saturation effects. Nevertheless, this limitation has a limited impact on the overall conclusions and the core areas of greening intervention strategies. Still, caution should be exercised when prioritizing greening interventions in regions with dense vegetation coverage. It is recommended that future research incorporate nonlinear models or alternative vegetation indices to improve the accuracy of cooling effect estimations. Second, this paper focuses on the driving contribution of environmental structural factors to surface temperature and has not yet incorporated the immediate impact of human-activity-related dynamic heat sources (such as heat emissions from air conditioners and traffic flow density) on heat exposure, which may underestimate the real heat risk in commercial core areas and high-density traffic corridors. Future research can combine high temporal resolution remote sensing products and urban heat flux observations [60], integrate human activity dynamics and microclimate simulation methods, and further deepen the understanding of urban heat exposure mechanisms and the construction of intervention strategies from a multi-source and multi-scale perspective.

5. Conclusions

This study is based on the Local Climate Zone (LCZ) framework specifically developed for the main urban area of Zhengzhou, combined with remote sensing interpretation and modeling methods such as random forest and Bayesian ridge regression. It systematically reveals the spatial differentiation patterns and driving mechanisms of environmental heat exposure in Zhengzhou’s central urban district. The results indicate significant spatial structural characteristics and mechanistic differences in urban heat exposure among different LCZ types. The study area exhibits a binary confrontation pattern of “construction intensity—ecological base,” where LCZ1 (compact high-rise building area) and LCZ E (hardened ground) form the core heat exposure zones, while natural base types such as LCZ B (sparse trees) and LCZ G (water bodies) act as cooling buffer corridors.
In identifying high heat exposure areas, the LCZ3 (compact low-rise building area) shows the highest heat exposure intensity, with surface temperatures reaching 49.15 °C on extreme hot days, and heat exposure hotspots distributed in concentrated contiguous clusters. The LCZ2 (compact mid-rise building area) has a lower overall mean but significant spatial heterogeneity. LCZ5 (open low-rise building area) is identified as a high heat exposure zone, but due to the limited sample size, its heat exposure pattern is unstable. Contribution analysis of driving factors by LCZ groups shows that NDVI consistently dominates in LCZ2 and LCZ3, with contribution rates ranging from 44.7% to 69.8% and p-values of 0.000, indicating highly significant vegetation effects on heat exposure in these areas. Surface reflectivity plays a secondary role in LCZ2, with contribution rates up to 16.6% at some time points (e.g., 8 June 2023). Sky View Factor (SVF) contributes relatively less, about 13% to 15%. In LCZ3, surface reflectivity’s contribution to land surface temperature fluctuates substantially, reaching 40.0% on 8 June 2023, suggesting it may intensify local heat exposure in specific periods.
For LCZ5, due to limited samples, Bayesian ridge regression was employed to identify driving factors. Results show that NDVI remains the main explanatory factor, with contribution rates between 33.9% and 65.1% (p = 0.000). Contributions of surface reflectivity and SVF are relatively minor, with surface reflectivity as low as 1.7% at certain times. Overall, NDVI plays a key regulatory role in surface temperature across all built-up types, especially in LCZ3. Surface reflectivity’s impact is time-sensitive, showing a pronounced reinforcing effect in some periods.
By introducing nonlinear modeling methods, this study effectively overcomes the limitations of traditional heat environment research, which assumes linear factor relationships. It quantitatively identifies the contribution structure and differences among environmental factors, enhancing explanatory power for urban heat exposure mechanisms. Based on this, spatially targeted and practically feasible green infrastructure interventions are proposed, such as three-dimensional greening in LCZ3 areas with NDVI < 0.25 and strengthening rooftop greening and small-scale green spaces in LCZ2, providing quantitative bases and planning references for urban heat environment management.
In summary, this paper addresses three core issues effectively: (1) clarifying the dominant LCZ types and spatial patterns of high heat exposure risk; (2) identifying dominant roles and mechanism differences of environmental factors across LCZ types; (3) proposing feasible and spatially targeted green intervention strategies. The study provides theoretical support for understanding the spatial response mechanisms of heat exposure in high-density cities and offers a methodological paradigm for constructing climate-adaptive urban landscapes. Amid global climate governance entering the “deep adaptation” phase, the analytical framework and methods developed here demonstrate strong transferability and replicability (Geletič et al., 2016) [61] and are expected to offer scalable technical support for heat exposure identification and response in similar developing cities. Additionally, the study draws on frameworks and findings from Norton et al. (2015) [62] on prioritizing green infrastructure, Stewart and Oke (2019) [63] regarding LCZ updates and applications, Middel et al. (2020) [64] and Santamouris (2021) [65] on urban heat island mitigation, and lessons from the COVID-19 pandemic’s impact on urban planning by Sharifi and Khavarian-Garmsir (2020) [66], enhancing both theoretical grounding and practical relevance of the proposed interventions.

Author Contributions

Conceptualization, H.L. (Huawei Li); methodology, X.H. and H.L. (Huawei Li); software, X.H.; resources, X.H. and H.L. (Huawei Li); writing—original draft preparation, X.H.; writing—review and editing, H.L. (Huawei Li) and F.K.K.; visualization, L.H., H.L. (Hongpan Li) and S.G.; language polishing and manuscript refinement, J.S. and F.A.; academic advice and content suggestions, F.K.K. All authors have read and agreed to the published version of the manuscript.

Funding

Henan Province International Science and Technology Cooperation Project (232102521015, 252102521030); Henan Province High-end Foreign Expert Introduction Project (HNGD2025023); Henan Province Science and Technology Tackling Project (232103810090); and Key Research Project of Henan Province Colleges and Universities (25A220003).

Data Availability Statement

The data presented in this study are available on request from the first author.

Acknowledgments

First and foremost, we would like to express our gratitude to the College of Landscape Architecture, Henan Agricultural University, for their support in our studies and research. Secondly, we are thankful to the organization of Land for hosting this Special Issue. Additionally, our sincere thanks go to the reviewers and editors for their valuable suggestions to improve this manuscript.

Conflicts of Interest

The authors declare no conflicts of interest.

References

  1. IPCC. Climate Change 2021: The Physical Science Basis. Contribution of Working Group I to the Sixth Assessment Report of the Intergovernmental Panel on Climate Change; Cambridge University Press: Cambridge, UK, 2021. [Google Scholar]
  2. UN-Habitat. World Cities Report 2022: Envisaging the Future of Cities; United Nations Human Settlements Programme: Nairobi, Kenya, 2022. [Google Scholar]
  3. Zhang, W.; Zwiers, F.W.; Zhang, X. The western North America heat wave of June 2021. Bull. Am. Meteorol. Soc. 2021, 102, S1–S6. [Google Scholar]
  4. European Environment Agency. Climate Change, Impacts and Vulnerability in Europe 2022: An Indicator-Based Report; Publications Office of the European Union: Luxembourg, 2022. [Google Scholar]
  5. World Meteorological Organization (WMO). State of the Global Climate 2022; WMO-No. 1308; WMO: Geneva, Switzerland, 2023. [Google Scholar]
  6. Han, J.; Liu, Z.; Zhou, J. Analysis on the causes and impacts of the 2022 extreme heat and drought event in the Yangtze River Basin. Meteorol. Mon. 2023, 49, 157–167. (In Chinese) [Google Scholar]
  7. Zhang, L.; Liu, J.; Gao, X. Spatial pattern and influencing factors of urban thermal environment in Beijing. Ecol. Environ. Sci. 2019, 28, 244–250. (In Chinese) [Google Scholar]
  8. Zhao, L.; Lee, X.; Smith, R.B.; Oleson, K.W. Strong contributions of local background climate to urban heat islands. Environ. Res. Lett. 2021, 16, 054003. [Google Scholar] [CrossRef] [PubMed]
  9. Ding, J.; Chen, M. Spatiotemporal evolution of urban heat island and cooling effect of green space in Shanghai. Acta Ecol. Sin. 2020, 40, 1689–1699. (In Chinese) [Google Scholar]
  10. Grimmond, C.S.B.; Blackett, M.; Best, M.J.; Barlow, J.; Baik, J.J.; Belcher, S.E.; Bohnenstengel, S.I.; Calmet, I.; Chen, F.; Dandou, A.; et al. The International Urban Energy Balance Models Comparison Project: First results from Phase 1. J. Appl. Meteorol. Climatol. 2010, 49, 1268–1292. [Google Scholar] [CrossRef]
  11. Seto, K.C.; Solecki, W.D.; Griffith, C.A. Human Settlements, Infrastructure, and Spatial Planning. In Climate Change 2014: Mitigation of Climate Change. Contribution of Working Group III to the Fifth Assessment Report of the Intergovernmental Panel on Climate Change; Edenhofer, O., Pichs-Madruga, R., Sokona, Y., Farahani, E., Kadner, S., Seyboth, K., Adler, A., Baum, I., Brunner, S., Eickemeier, P., et al., Eds.; Cambridge University Press: Cambridge, UK; New York, NY, USA, 2014. [Google Scholar]
  12. Mundoli, S.; Manjunath, R.; Nagendra, H. Heat stress and informal settlements: A case for climate justice in India. Environ. Justice 2020, 13, 92–97. [Google Scholar]
  13. Chakraborty, T.; Hsu, A.; Manya, D.; Sheriff, G. Disproportionately higher exposure to urban heat in lower-income neighborhoods: A multi-city perspective. Environ. Res. Lett. 2019, 14, 105003. [Google Scholar]
  14. Das, S.; Das, M.; Pal, S. Urban greenspace inequality and heat risk in Indian megacities: A case study of Delhi. Sustain. Cities Soc. 2022, 80, 103772. [Google Scholar]
  15. Santamouris, M. Cooling the cities—A review of reflective and green roof mitigation technologies to fight heat island and improve comfort in urban environments. Sol. Energy 2015, 115, 989–1014. [Google Scholar] [CrossRef]
  16. Mavrogianni, A.; Davies, M.; Chrysoulakis, N.; Leal, W.; Papanikolaou, N.; Mihalakakou, G.; Livada, I.; González, J.; Ortiz, M.; Wong, M.; et al. Urban environment and thermal comfort indoors and outdoors: The role of passive measures for improvement. Energy Build. 2011, 43, 1565–1576. [Google Scholar]
  17. Krayenhoff, E.S.; Moustaoui, M.; Broadbent, A.M.; Christen, A.; Martilli, A.; Georgescu, M.; Wong, M.S.; Oke, T.R.; Roth, M.; Grimmond, C.S.B.; et al. Reducing the Heat Island Magnitude in Northern Temperate Cities: A Radiative Approach. Build. Environ. 2018, 137, 167–177. [Google Scholar]
  18. Lin, W.; Zhou, L.; Yang, C. Identification of urban heat island driving factors based on random forest. J. Remote Sens. 2021, 25, 568–578. (In Chinese) [Google Scholar]
  19. Stewart, I.D.; Oke, T.R. Local climate zones for urban temperature studies. Bull. Am. Meteorol. Soc. 2012, 93, 1879–1900. [Google Scholar] [CrossRef]
  20. Ma, X.; Liu, Y.; Zhang, H. Spatiotemporal evolution and structural analysis of urban thermal environment based on LCZ: A case study of Wuhan. Sci. Geogr. Sin. 2022, 42, 33–41. (In Chinese) [Google Scholar]
  21. Zhengzhou Bureau of Statistics. Communiqué of the Seventh National Population Census of Zhengzhou, 2020; Zhengzhou Bureau of Statistics: Zhengzhou, China, 2021. (In Chinese)
  22. Chen, A.; Yao, L.; Sun, R.; Li, X.; Wang, Y.; Zhang, H.; Liu, J.; Zhao, Q.; Huang, X.; Gao, F.; et al. Spatial differentiation of urban heat exposure in high-density cities based on LCZ: A case study of Zhengzhou. Geogr. Res. 2024, 43, 789–802. (In Chinese) [Google Scholar]
  23. Bechtel, B.; Daneke, H.; Schwarz, N. WUDAPT: The World Urban Database and Access Portal Tools. Int. J. Digit. Earth 2019, 12, 641–657. [Google Scholar]
  24. Quan, W.; Li, Y.; Wang, X.; Zhang, H.; Liu, J.; Chen, A.; Zhao, Q.; Huang, X.; Gao, F.; Sun, R.; et al. Urban heat island mitigation strategies based on local climate zones in Zhengzhou, China. Sustainability 2021, 13, 10289. [Google Scholar]
  25. Ma, L.; Wang, Y.T.; Li, X.; Zhang, H.; Liu, J.; Chen, A.; Zhao, Q.; Huang, X.; Sun, R.; Gao, F.; et al. Object-oriented remote sensing image analysis for LCZ mapping. J. Remote Sens. 2023, 27, 1234–1248. (In Chinese) [Google Scholar]
  26. Qin, Z.; Karnieli, A.; Berliner, P. A mono-window algorithm for retrieving land surface temperature from Landsat TM data and its application to the Israel–Egypt border region. Int. J. Remote Sens. 2001, 22, 3719–3746. [Google Scholar]
  27. Du, X.H.; Han, Y.H.; Liu, C. Identification of urban thermal environment driving factors based on random forest: A case study of Beijing. Geogr. Sci. 2020, 40, 278–285. (In Chinese) [Google Scholar]
  28. Breiman, L. Random forests. Mach. Learn. 2001, 45, 5–32. [Google Scholar] [CrossRef]
  29. Liu, Y.; Mu, K.; Han, B.; Zhang, M.; Bao, J.; Yang, L. Surface heat island effect of urban local climate classification. J. Remote Sens. 2020, 24, 1123–1133. (In Chinese) [Google Scholar]
  30. Chen, Z.; Li, S. Study on urban thermal environment in Hangzhou central urban area based on local climate zones. Acta Ecol. Sin. 2024, 44, 4125–4134. (In Chinese) [Google Scholar]
  31. Shen, Z.; Ning, S.; Liu, J. Thermal environment effects of urban spatial morphology from the perspective of local climate zones: A case study of Quanzhou. Geogr. Res. 2023, 42, 1056–1070. (In Chinese) [Google Scholar]
  32. Xu, Y.; Hou, W.; Zhang, C. Spatial Association Rules and Thermal Environment Differentiation Evaluation of Local Climate Zone and Urban Functional Zone. Land 2023, 12, 1701. [Google Scholar] [CrossRef]
  33. Wang, C.; Zhang, H.; Ma, Z.; Yang, H.; Jia, W. Urban Morphology Influencing the Urban Heat Island in the High-Density City of Xi’an Based on the Local Climate Zone. Sustainability 2024, 16, 3946. [Google Scholar] [CrossRef]
  34. Yang, J.; Sun, D.; Xiao, X. Warming and cooling effects of local climate zones on urban thermal environment. Sci. Total Environ. 2022, 831, 154918. [Google Scholar]
  35. Qiao, Z.; Tian, G. Spatiotemporal diversity and regionalization of the urban thermal environment in Beijing. Acta Geogr. Sin. 2014, 69, 101–112. (In Chinese) [Google Scholar]
  36. Song, S.R.; Liu, H.B.; Zhang, B. Thermal environment characteristics of different land use types in Changsha. Remote Sens. Technol. Appl. 2021, 36, 672–681. (In Chinese) [Google Scholar]
  37. Li, X.; Zhou, Y.; Asrar, G.R.; Li, H.; Zhang, J.; Wang, Y.; Chen, A.; Liu, J.; Zhao, Q.; Huang, X.; et al. Spatiotemporal differentiation of urban heat island intensity in Chinese megacities. Environ. Res. Lett. 2017, 12, 034003. [Google Scholar]
  38. Schwarz, N.; Lautenbach, S.; Seppelt, R. Exploring indicators for quantifying surface urban heat islands of European cities. Remote Sens. Environ. 2011, 115, 3175–3186. [Google Scholar] [CrossRef]
  39. Weng, Q. Thermal infrared remote sensing for urban climate and environmental studies. ISPRS J. Photogramm. Remote Sens. 2009, 64, 335–344. [Google Scholar] [CrossRef]
  40. Li, X.; Zhou, Y.; Asrar, G.R.; Imhoff, M.; Li, X. The surface urban heat island response to urban expansion. Sci. Total Environ. 2017, 605–606, 426–435. [Google Scholar] [CrossRef] [PubMed]
  41. Tang, Y.; Xu, X.P.; Sun, W. Relationship between urban building spatial form and UHI effect. Build. Sci. 2021, 37, 74–80. (In Chinese) [Google Scholar]
  42. Wang, R.; Zhang, C.; Estoque, R.C.; Li, X.; Chen, A.; Liu, J.; Zhao, Q.; Huang, X.; Sun, R.; Gao, F.; et al. Spatial heterogeneity of UHI intensity in Zhengzhou based on LCZ. Prog. Geogr. 2022, 41, 893–903. (In Chinese) [Google Scholar]
  43. Xue, S.; Chao, X.; Wang, K.; Wang, J.; Xu, J.; Liu, M.; Ma, Y. Impact of Canopy Coverage and Morphological Characteristics of Trees in Urban Park on Summer Thermal Comfort Based on Orthogonal Experiment Design: A Case Study of Lvyin Park in Zhengzhou, China. Forests 2023, 14, 2098. [Google Scholar] [CrossRef]
  44. Jenerette, G.D.; Harlin, J.M.; Schlaepfer, D.R.; Smith, A.; Johnson, B.; Lee, C.; Martinez, D.; Chen, X.; Wang, Y.; Zhao, Q.; et al. Nonlinear responses of urban vegetation cover to heat mitigation. Environ. Res. Lett. 2016, 11, 044014. [Google Scholar]
  45. Connors, J.P.; Galletti, C.S.; Chow, W.T.L. Landscape configuration and urban heat island effects: A Phoenix case study. Landsc. Ecol. 2013, 28, 271–283. [Google Scholar] [CrossRef]
  46. Middel, A.; Häb, K.; Brazel, A.J.; Myint, S.W.; Guhathakurta, S.; Jones, E.; Chow, W.T.L.; Mills, G.; McPherson, E.G.; Gomez, J.D.; et al. Impact of urban form on microclimate in Phoenix local climate zones. Landsc. Urban Plan. 2014, 122, 16–28. [Google Scholar] [CrossRef]
  47. Ren, Q.; Zhang, L.; Yang, Z.; Zhang, M.; Wei, M.; Zhang, H.; Li, A.; Shi, R.; Song, P.; Ge, S. Multi-Criteria Plant Clustering for Carbon-Centric Urban Forestry: Enhancing Sequestration Potential Through Adaptive Species Selection in the Zhengzhou Metropolitan Area. China For. 2025, 16, 536. [Google Scholar] [CrossRef]
  48. Henan Climate Center. Climate Analysis Report of Zhengzhou; Henan Meteorological Bureau: Zhengzhou, China, 2024. (In Chinese)
  49. Zhang, C.; Liu, H.; Yang, W.J. Cooling effects and influencing factors of urban green spaces. Chin. Landsc. Archit. 2021, 37, 97–102. (In Chinese) [Google Scholar]
  50. Zhang, Y.; Wang, R.; Zhang, C.; Li, X.; Chen, A.; Liu, J.; Zhao, Q.; Huang, X.; Sun, R.; Gao, F.; et al. Optimization strategies for green space to mitigate UHI in Zhengzhou. Chin. Landsc. Archit. 2023, 39, 89–94. (In Chinese) [Google Scholar]
  51. Du, C.; Ge, S.; Song, P.; Jombach, S.; Fekete, A.; Valánszki, I. Optimizing Urban Green Spaces for Vegetation-Based Carbon Sequestration: The Role of Landscape Spatial Structure in Zhengzhou Parks, China. Forests 2025, 16, 679. [Google Scholar] [CrossRef]
  52. He, D.; Li, H.; Zhou, P.; Guo, J.; Yuan, J.; Wang, J.; Liu, Y.; Zhang, Z.; Lei, Y. Leaf Plasticity Responses of Four Urban Garden Plants to Low-Light Environments Under Viaducts. Forests 2025, 16, 651. [Google Scholar] [CrossRef]
  53. Liu, Y.; Dong, W.; Li, X. Spatial differentiation characteristics of urban thermal environment based on local climate zones: A case study of Nanjing City. Sci. Geogr. Sin. 2023, 43, 1083–1094. (In Chinese) [Google Scholar]
  54. Zhang, R.; Liu, G. Research on urban forest park management based on recreation concept. Chin. Landsc. Archit. 2022, 38, 109–113. [Google Scholar]
  55. Zhou, W.; Ouyang, Z.Y.; Li, X. Threshold effect of green space fragmentation on UHI mitigation: Case of Zhengzhou. Chin. J. Appl. Ecol. 2022, 33, 2211–2218. (In Chinese) [Google Scholar]
  56. Wang, S.Y.; Zhang, L.; Gao, X. Spatial heterogeneity effects of three-dimensional urban form parameters on the thermal environment: A case study of Beijing City. J. Geo-Inf. Sci. 2022, 24, 1345–1356. (In Chinese) [Google Scholar]
  57. Zhou, D.; Zhao, S.; Liu, S.; Zhang, L.; Zhu, C. Climate–vegetation control on the diurnal and seasonal variations of surface urban heat islands in China. Environ. Res. Lett. 2016, 11, 054009. [Google Scholar] [CrossRef]
  58. Yuan, F.; Bauer, M.E. Comparison of impervious surface area and normalized difference vegetation index as indicators of surface urban heat island effects in Landsat imagery. Remote Sens. Environ. 2007, 106, 375–386. [Google Scholar] [CrossRef]
  59. Gunawardena, K.R.; Wells, M.J.; Kershaw, T. Utilising green infrastructure for urban climate adaptation: A review. Sustain. Cities Soc. 2017, 25, 447–457. [Google Scholar]
  60. Zhao, H.B.; Huang, Z.G.; Yang, F. Review of multi-scale assessment models for urban heat exposure. Prog. Geogr. 2023, 42, 401–412. (In Chinese) [Google Scholar]
  61. Geletič, J.; Lehnert, M.; Dobrovolný, P. Land surface temperature differences within local climate zones, based on two central European cities. Remote Sens. 2016, 8, 788. [Google Scholar] [CrossRef]
  62. Norton, B.A.; Coutts, A.M.; Livesley, S.J.; Harris, R.J.; Hunter, A.M.; Williams, N.S.G. Planning for cooler cities: A framework to prioritize green infrastructure to mitigate high temperatures in urban landscapes. Landsc. Urban Plan. 2015, 134, 127–138. [Google Scholar] [CrossRef]
  63. Stewart, I.D.; Oke, T.R. Local Climate Zones for Urban Temperature Studies: An Update and Future Directions. Urban Clim. 2019, 27, 100508. [Google Scholar]
  64. Middel, A.; Roth, M.; Hagen, E. Urban heat island dynamics and green infrastructure in Phoenix, Arizona. Environ. Res. Lett. 2020, 15, 024018. [Google Scholar]
  65. Santamouris, M. Advances on urban overheating and heat island mitigation in cities. Sustain. Cities Soc. 2021, 71, 102980. [Google Scholar]
  66. Sharifi, A.; Khavarian-Garmsir, A.R. The COVID-19 pandemic: Impacts on cities and major lessons for urban planning, design, and management. Sci. Total Environ. 2020, 749, 142391. [Google Scholar] [CrossRef]
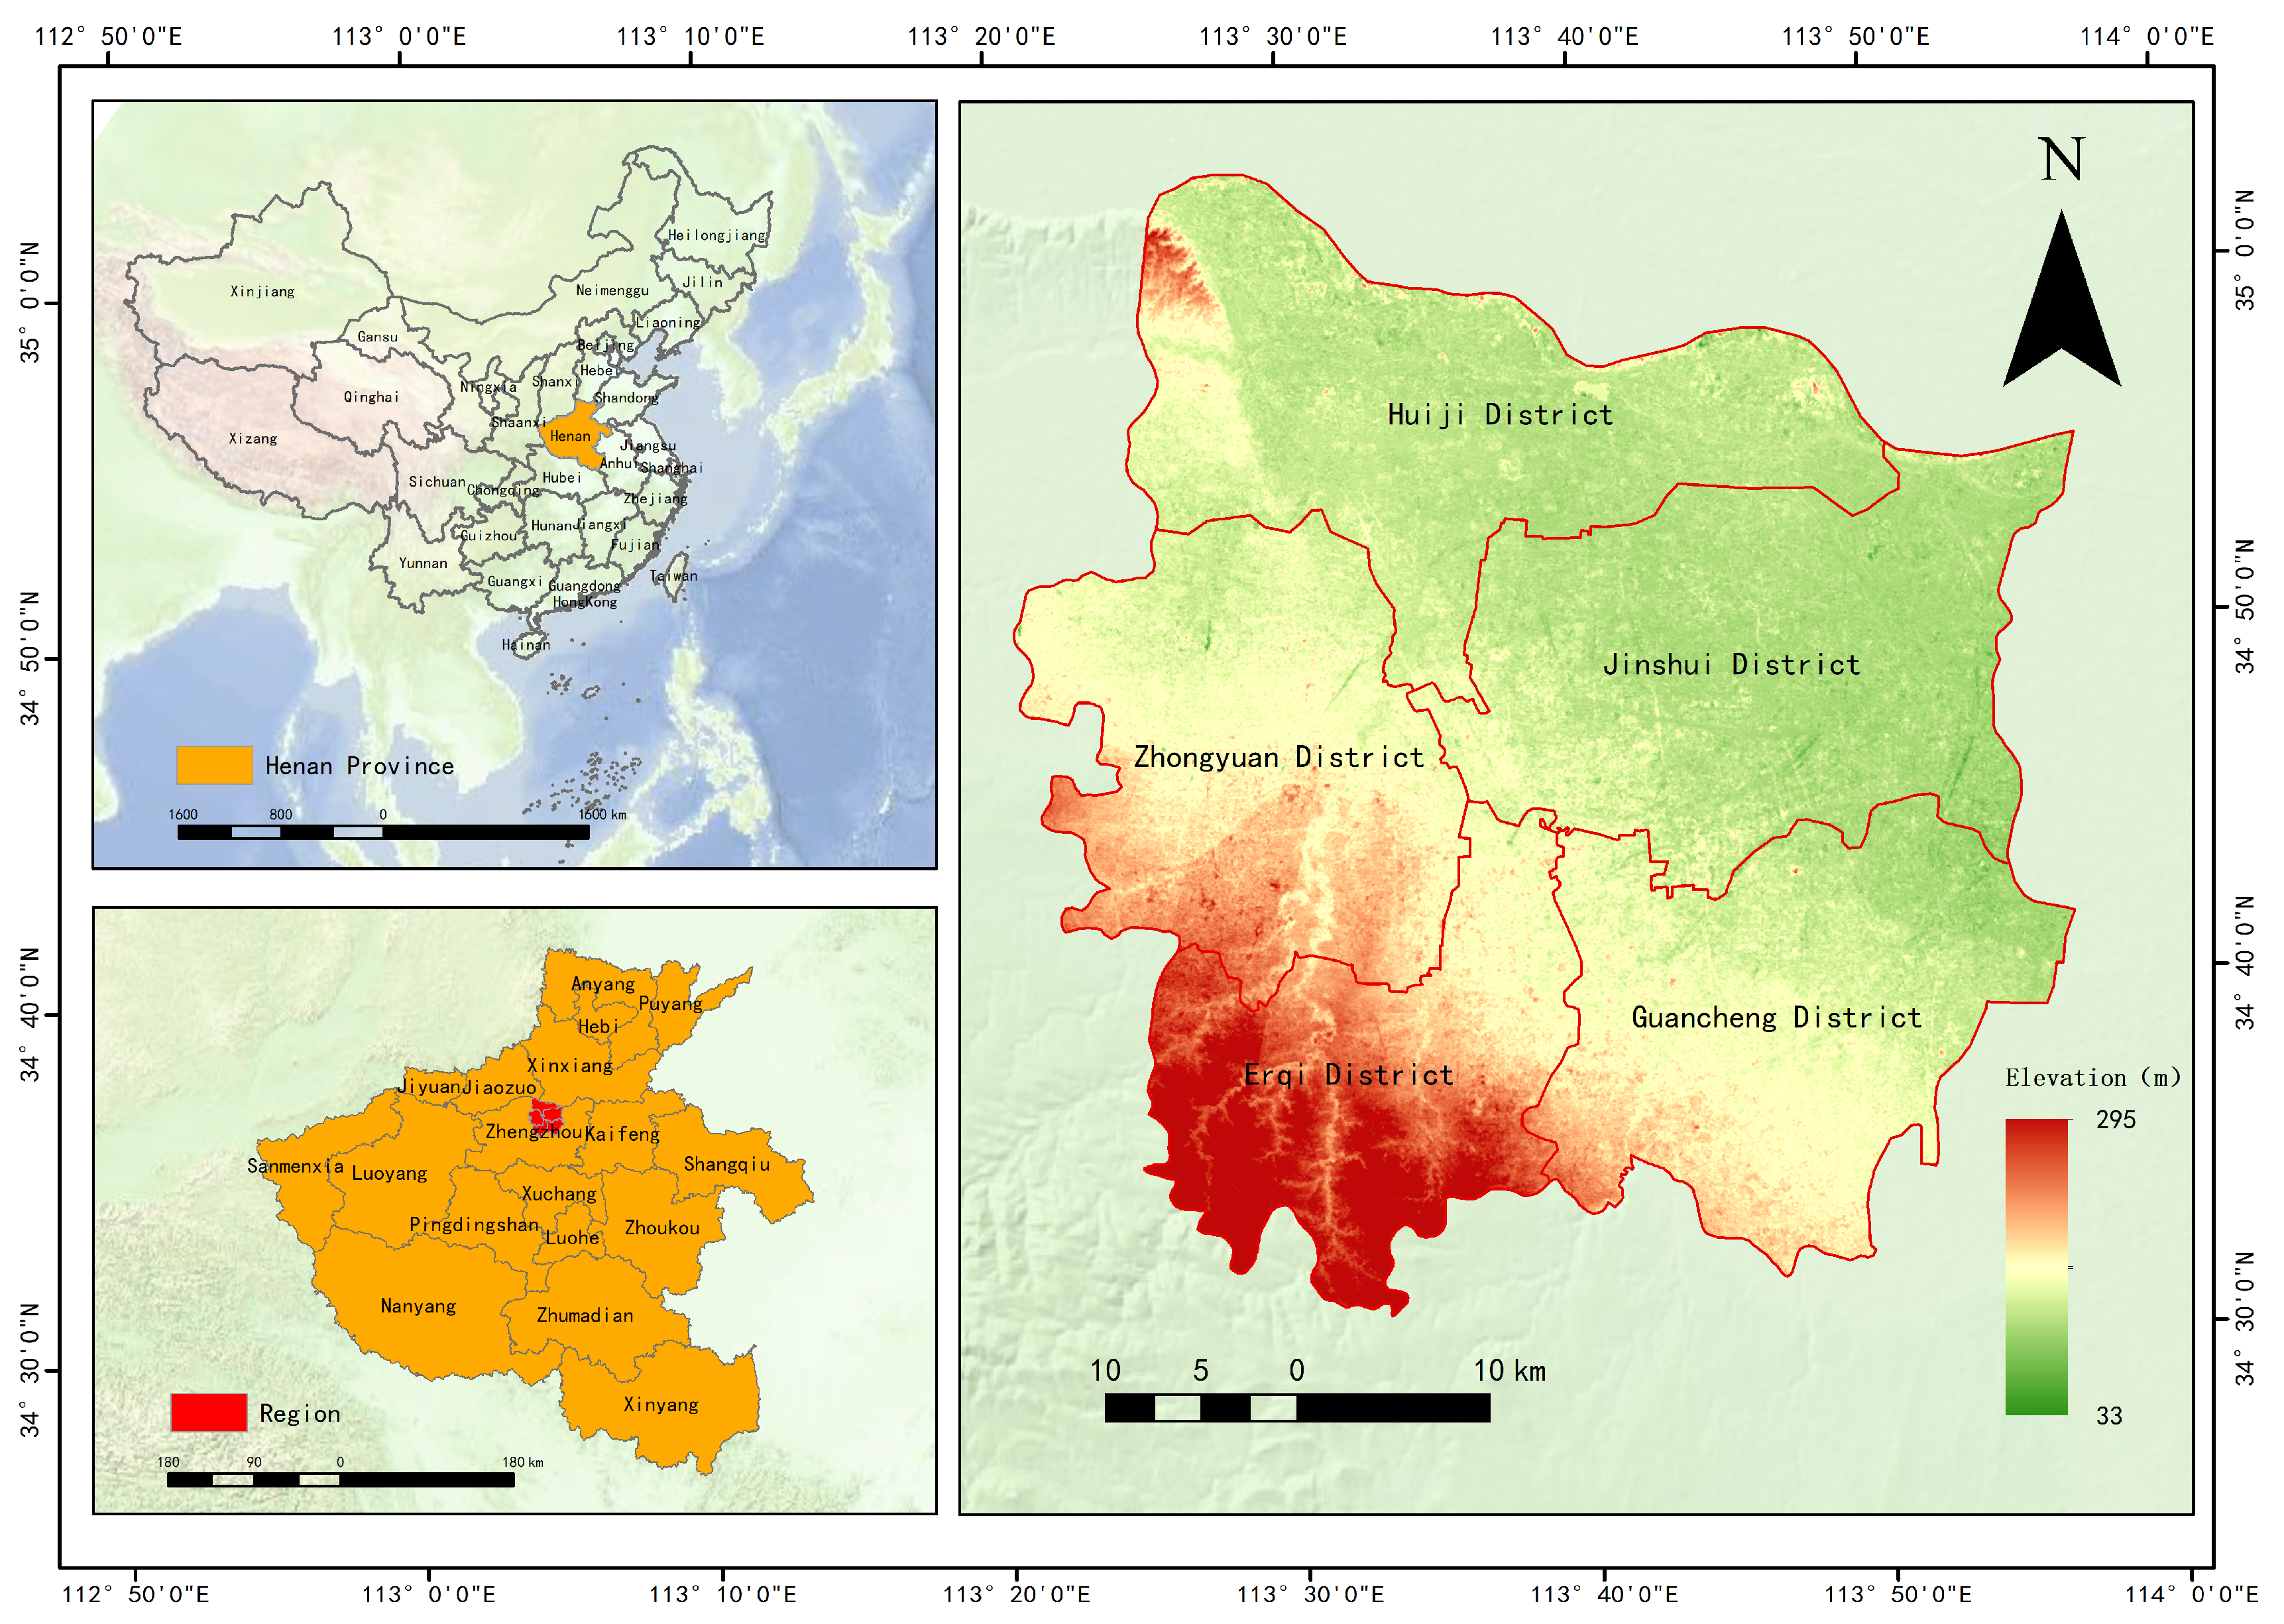
Figure 1. Overview map of the study area.
Land 14 01717 g001
Figure 2. Technical schematic diagram.
Land 14 01717 g002
Figure 3. Spatial distribution diagram of LCZs.
Land 14 01717 g003
Figure 4. Spatial distribution diagram of LST in different periods.
Land 14 01717 g004
Figure 5. Line graph showing the average LST (land surface temperature) change points for different LCZ (Land Cover Zone) types in the summer of different years.
Land 14 01717 g005
Figure 6. Schematic diagram of the spatial distribution of SUHII in different periods.
Land 14 01717 g006
Figure 7. Average SUHII maps of each LCZ type in Phase 5.
Land 14 01717 g007
Figure 8. Graph showing the ranking of contributions of each period’s thermal environment driving factors.
Land 14 01717 g008
Figure 9. Scatter plot distribution of NDVI and surface temperature (LST) correlation in the main urban area of Zhengzhou during summer (2019–2023).
Land 14 01717 g009
Figure 10. Trend chart of total cooling potential for different LCZ types.
Land 14 01717 g010
Figure 11. LCZ3 suggests an abnormal cooling area for LH.
Land 14 01717 g011
Figure 12. LCZ2 recommended cooling zone.
Land 14 01717 g012
Table 1. LCZ classification parameters.
Local Climatic ZoneType NameBuilding Surface Fraction/%Impervious Surface Fraction/%Pervious Surface Fraction/%Sky View FactorBuilding Height/m
LCZ 1Compact high-rise building40–6040–60<100.2–0.4>25
LCZ 2Compact mid-rise building40–7030–50<100.3–0.63–25
LCZ 3Compact low-rise building40–7020–40<100.6–0.83–10
LCZ 4Open high-rise building20–4030–50<100.4–0.7>25
LCZ 5Open mid-rise building20–4030–50<100.5–0.83–25
LCZ 6Open low-rise building20–4020–40<100.6–0.93–10
LCZ 7Simple low-rise building30–6020–40<100.5–0.93–5
LCZ 8Large low-rise building30–5040–70<100.3–0.63–10
LCZ 9Scattered low-rise building10–2020–40<100.6–0.93–5
LCZ 10Industrial factory building30–5020–40<100.5–0.95–15
LCZ AThick forest<10<10>900.1–0.3>15
LCZ BSparse forest<10<10>900.2–0.53–15
LCZ CShrubbery<10<10>900.2–0.5<2
LCZ DLow forest<10<10>900.2–0.5<2
LCZ ERock or artificial ground<10>90<10<0.2
LCZ FBare ground sand<10<10>90<0.25
LCZ GWater body<10<10>900.9
Table 2. Selection of Landsat 8 Data.
Imaging TimeTemperature/°CWeather
7 July 201922–34Sunny, northeast wind of 3 speed
26 August 202021–33Sunny, northeast wind of 2 speed
29 June 202223–34Sunny, east wind of 2 speed
8 June 202322–35Sunny, southeast wind of 3–4 speed
4 September 202320–32Sunny, southeast wind of 2 speed
Table 3. Statistical characteristics of surface temperature and thermal island intensity in the main urban area of Zhengzhou City during summer (2019–2023).
PhaseLST Mean (°C)LST Standard Deviation (°C)Extreme Range (°C)Heat Island Intensity Range (°C)
7 July 2019 40.613.3724.04–61.77−9.57–+2.97
26 August 2020 38.193.5816.19–65.67−8.71–+4.41
29 June 2022 45.584.0629.12–70.54−13.79–+4.64
8 June 2023 42.194.2513.83–64.40−15.92–+5.60
4 September 2023 39.553.5216.68–67.65−5.94–+5.02
Table 4. Spatial autocorrelation analysis results of high-exposure LCZ types (summer 2019–2023).
DateLCZ TypeMoran’s Ip-ValueHHLLHLLHNSTotal Area
(km2)
7 July 2019LCZ20.1070.0001.3%0.6%1.4%8.9%85.7%23.47
LCZ30.2490.0002.2%1.2%1.6%7.3%87.6%31.73
LCZ5−0.2600.3440%0%6.8%22%74%0.19
26 August 2020LCZ20.1960.0003.05%0%1.4%7%89%22.98
LCZ30.2380.0002.9%0%2%7.2%88%31.73
LCZ5−0.2450.5630%0%0.8%45%58%0.19
29 June 2022LCZ20.0980.0001.9%0%1.3%8.6%88%22.98
LCZ30.2700.0002.5%0.5%1.8%9.5%86%31.73
LCZ5−0.1570.8570%0%0%23%79%0.19
8 June 2023LCZ20.1390.0001.8%0%1.3%7.4%89%22.98
LCZ30.2370.0002.2%0.5%1.4%9.9%86%31.73
LCZ5−0.4630.2490%0%2.6%44%58%0.19
4 September 2023LCZ20.1920.0002.7%0%1.8%7.4%88%22.98
LCZ30.2350.0003.5%0.06%3.1%8.2%85%31.73
LCZ5−0.3290.4510%0%0.47%43%63%0.19
Table 5. Regression results table.
DateLCZ TypeSample SizeModel TypeRoad Density Contribution (p)SVF Contribution (p)Surface Reflectivity Contribution (p)NDVI Contribution (p)
7 July 201921453Random Forest2.0% (0.015)22.1% (0.000)18.2% (0.000)57.8% (0.000)
31252Random Forest5.3% (0.279)26.2% (0.000)18.0% (0.000)50.5% (0.000)
57Bayesian Ridge Random Forest77.0% (0.670)7.4% (0.215)2.4% (0.023)13.2% (0.383)
26 August 202021453Random Forest1.2% (0.000)23.8% (0.000)9.5% (0.000)65.6% (0.000)
31252Random Forest3.9% (0.075)27.5% (0.000)10.8% (0.000)57.9% (0.000)
57Bayesian Ridge Random Forest78.7% (0.670)7.2% (0.215)2.3% (0.023)11.8% (0.589)
29 June 202221453Random Forest2.0% (0.001)14.7% (0.000)11.5% (0.000)71.9% (0.000)
31252Random Forest4.4% (0.111)10.4% (0.000)14.5% (0.000)70.8% (0.000)
57Bayesian Ridge Random Forest73.0% (0.848)7.3% (0.180)2.3% (0.014)17.3% (0.215)
8 June 202321453Random Forest1.5% (0.000)12.7% (0.000)12.0% (0.000)73.9% (0.000)
31252Random Forest1.9% (0.000)11.5% (0.000)36.3% (0.000)50.3% (0.000)
57Bayesian Ridge Random Forest71.8% (0.848)10.6% (0.180)1.2% (0.383)16.4% (0.294)
4 September 202321453Random Forest1.7% (0.000)14.9% (0.000)16.1% (0.000)67.2% (0.000)
31252Random Forest2.4% (0.001)12.5% (0.000)25.3% (0.000)59.8% (0.000)
57Bayesian Ridge Random Forest72.6% (0.531)9.3% (0.148)1.6% (0.094)16.5% (0.253)
Table 6. Potential cooling effect and heat impact contribution of LCZ types based on NDVI-LST regression.
DataLCZ-TypeNDVI-MeanSlopeAverage ΔLSTArea (km2)Total ΔLST (°C·km2)
7 July 201920.26−10.387.7212.8999.54
26 August 202020.34−9.316.1512.7978.72
29 June 202220.27−11.108.1313.08106.29
8 June 202320.29−10.527.4813.0597.63
4 September 202320.28−10.367.3013.2296.54
7 July 201930.24−6.014.5817.4980.17
26 August 202030.29−7.525.3218.2397.09
29 June 202230.24−9.697.4018.15134.19
8 June 202330.26−11.438.4420.13169.97
4 September 202330.25−13.599.2520.05185.39
Disclaimer/Publisher’s Note: The statements, opinions and data contained in all publications are solely those of the individual author(s) and contributor(s) and not of MDPI and/or the editor(s). MDPI and/or the editor(s) disclaim responsibility for any injury to people or property resulting from any ideas, methods, instructions or products referred to in the content.