Local Land Use Simulation in Migrant-Receiving Xiamen Under National Population Decline: Integrating Cohort-Component and PLUS Models
Abstract
1. Introduction
2. Materials and Methods
2.1. Study Area
2.2. Data Sources
2.3. Methods
2.3.1. Cohort Component Model
2.3.2. Decoupling Model
2.3.3. PLUS Model
3. Results
3.1. The Change Process of Population and Land from 2000 to 2020
3.1.1. The Change in the Population and Land from 2000 to 2020
3.1.2. Spatial Transfer of Land Use
3.2. The Quantitative Relationship Between Population Growth and Urban Expansion
3.3. Integrated Simulation Results of Future Population and Land Use
3.3.1. Model Validation and Robustness Analysis
3.3.2. Population Forecast Results
3.3.3. Integrated Land Use Simulation Results
4. Discussion
5. Conclusions
Author Contributions
Funding
Data Availability Statement
Conflicts of Interest
Appendix A
| Land Use Type | Farmland | Woodland | Unused Land | Water Body | Construction Land |
|---|---|---|---|---|---|
| neighborhood weight | 0.63 | 0.74 | 1 | 0.68 | 0.1 |
| Time | Types | 2005 Area/km2 | |||||
|---|---|---|---|---|---|---|---|
| Farmland | Woodland | Unused Land | Water Body | Construction Land | Total | ||
| 2000 | Farmland | 421.36 | 28.65 | 0.11 | 2.15 | 70.02 | 522.30 |
| Woodland | 20.15 | 584.12 | 0.05 | 0.35 | 6.44 | 611.10 | |
| Unused Land | 0.03 | 0.04 | 0.76 | 0.17 | 0.05 | 1.06 | |
| Water Body | 1.52 | 0.28 | 0.79 | 103.84 | 10.54 | 116.98 | |
| Construction Land | 27.57 | 1.89 | 0.06 | 2.32 | 304.73 | 336.57 | |
| Total | 470.62 | 614.99 | 1.77 | 108.84 | 391.78 | 1588.01 | |
| Time | Types | 2010 Area/km2 | |||||
|---|---|---|---|---|---|---|---|
| Farmland | Woodland | Unused Land | Water Body | Construction Land | Total | ||
| 2005 | Farmland | 373.24 | 12.54 | 0.06 | 0.98 | 83.81 | 470.62 |
| Woodland | 26.85 | 579.80 | 0.05 | 0.35 | 7.94 | 614.99 | |
| Unused Land | 0.09 | 0.13 | 1.02 | 0.46 | 0.07 | 1.77 | |
| Water Body | 5.02 | 0.59 | 0.87 | 80.57 | 21.80 | 108.84 | |
| Construction Land | 23.93 | 0.90 | 0.14 | 2.30 | 364.51 | 391.78 | |
| Total | 429.13 | 593.96 | 2.14 | 84.65 | 478.13 | 1588.01 | |
| Time | Types | 2015 Area/km2 | |||||
|---|---|---|---|---|---|---|---|
| Farmland | Woodland | Unused Land | Water Body | Construction Land | Total | ||
| 2010 | Farmland | 357.32 | 18.11 | 0.91 | 2.25 | 50.54 | 429.13 |
| Woodland | 20.44 | 569.13 | 0.28 | 0.38 | 3.73 | 593.96 | |
| Unused Land | 0.04 | 0.10 | 1.54 | 0.30 | 0.16 | 2.14 | |
| Water Body | 2.42 | 0.33 | 1.64 | 64.34 | 15.92 | 84.65 | |
| Construction Land | 42.65 | 1.38 | 1.34 | 1.95 | 430.81 | 478.13 | |
| Total | 422.87 | 589.05 | 5.71 | 69.22 | 501.16 | 1588.01 | |
| Time | Types | 2020 Area/km2 | |||||
|---|---|---|---|---|---|---|---|
| Farmland | Woodland | Unused Land | Water Body | Construction Land | Total | ||
| 2015 | Farmland | 370.76 | 15.74 | 0.25 | 3.77 | 32.35 | 422.87 |
| Woodland | 30.41 | 556.26 | 0.07 | 0.76 | 1.55 | 589.05 | |
| Unused Land | 0.36 | 0.19 | 2.89 | 1.71 | 0.55 | 5.71 | |
| Water Body | 5.44 | 0.35 | 1.94 | 58.62 | 2.88 | 69.22 | |
| Construction Land | 64.23 | 1.07 | 2.05 | 7.24 | 426.56 | 501.16 | |
| Total | 471.20 | 573.61 | 7.20 | 72.10 | 463.90 | 1588.01 | |
| Type | NPP | NPP-30% | Absolute Difference | Relative Differences |
|---|---|---|---|---|
| Total population | 6439059 | 6140852 | 298207 | 0.0463 |
| Proportion of 60+ | 0.1539 | 0.1581 | −0.0042 | −0.0042 |
| Proportion of 65+ | 0.0992 | 0.1021 | −0.0028 | −0.0028 |
| Proportion of 15–64 | 0.7406 | 0.7417 | −0.0011 | −0.0015 |
| Farmland-High | 455.1907 | 450.5234 | 4.6673 | 0.0103 |
| Woodland-High | 596.9996 | 594.2186 | 2.7810 | 0.0047 |
| Unused Land-High | 6.3677 | 6.4427 | −0.0795 | −0.0125 |
| Water Body-High | 77.8696 | 73.2921 | 4.5774 | 0.0588 |
| Construction Land-High | 450.8662 | 462.8125 | −11.9463 | −0.0265 |
| Farmland-Medium | 486.1387 | 476.6621 | 9.4766 | 0.0195 |
| Woodland-Medium | 579.9069 | 580.8120 | −0.9051 | −0.0016 |
| Unused Land-Medium | 6.5618 | 6.5522 | 0.0096 | 0.0015 |
| Water Body-Medium | 77.6876 | 77.6317 | 0.0559 | 0.0007 |
| Construction Land- Medium | 436.9992 | 445.6317 | −8.6370 | −0.0198 |
| Farmland-Low | 566.0695 | 546.3283 | 19.7412 | 0.0349 |
| Woodland- Low | 540.1429 | 579.5899 | −39.4470 | −0.0730 |
| Unused Land- Low | 5.0416 | 6.5070 | −1.4654 | −0.2907 |
| Water Body- Low | 73.3469 | 77.9977 | −4.6508 | −0.0634 |
| Construction Land- Low | 402.7027 | 376.8722 | 25.8305 | 0.0641 |
| PLUSuse | Neighborhood Weight × 0.8 | Neighborhood Weight × 1.2 | NO DEM | NO Highways | NO Soil | Key Driversf | Key Driversw | Key Driversc | ||
|---|---|---|---|---|---|---|---|---|---|---|
| Kappa | 0.8108 | 0.7691 | 0.7684 | 0.7674 | 0.7701 | 0.7685 | 0.7681 | 0.7695 | 0.7676 | |
| OA | 0.8689 | 0.8399 | 0.8393 | 0.8387 | 0.8406 | 0.8396 | 0.8392 | 0.8402 | 0.8388 | |
| PA | Farmland | 0.7033 | 0.7164 | 0.7170 | 0.7149 | 0.7180 | 0.7171 | 0.7171 | 0.7172 | 0.7139 |
| Woodland | 0.9598 | 0.9588 | 0.9585 | 0.9580 | 0.9598 | 0.9580 | 0.9580 | 0.9590 | 0.9592 | |
| Unused Land | 0.3761 | 0.0903 | 0.0884 | 0.0864 | 0.0850 | 0.0536 | 0.0536 | 0.0440 | 0.0724 | |
| Water Body | 0.8155 | 0.8677 | 0.8651 | 0.8664 | 0.8653 | 0.8688 | 0.8688 | 0.8650 | 0.8661 | |
| Construction Land | 0.9395 | 0.8248 | 0.8238 | 0.8236 | 0.8256 | 0.8238 | 0.8238 | 0.8255 | 0.8243 | |
| UA | Farmland | 0.8829 | 0.8134 | 0.8135 | 0.8118 | 0.8144 | 0.8119 | 0.8119 | 0.8138 | 0.8124 |
| Woodland | 0.9480 | 0.8876 | 0.8881 | 0.8857 | 0.8876 | 0.8879 | 0.8879 | 0.8886 | 0.8864 | |
| Unused Land | 0.5119 | 0.3390 | 0.3326 | 0.3069 | 0.3348 | 0.2334 | 0.2334 | 0.2082 | 0.2975 | |
| Water Body | 0.8828 | 0.7097 | 0.7086 | 0.7285 | 0.7211 | 0.7084 | 0.7084 | 0.7148 | 0.7138 | |
| Construction Land | 0.7797 | 0.8263 | 0.8242 | 0.8225 | 0.8255 | 0.8255 | 0.8255 | 0.8246 | 0.8242 | |
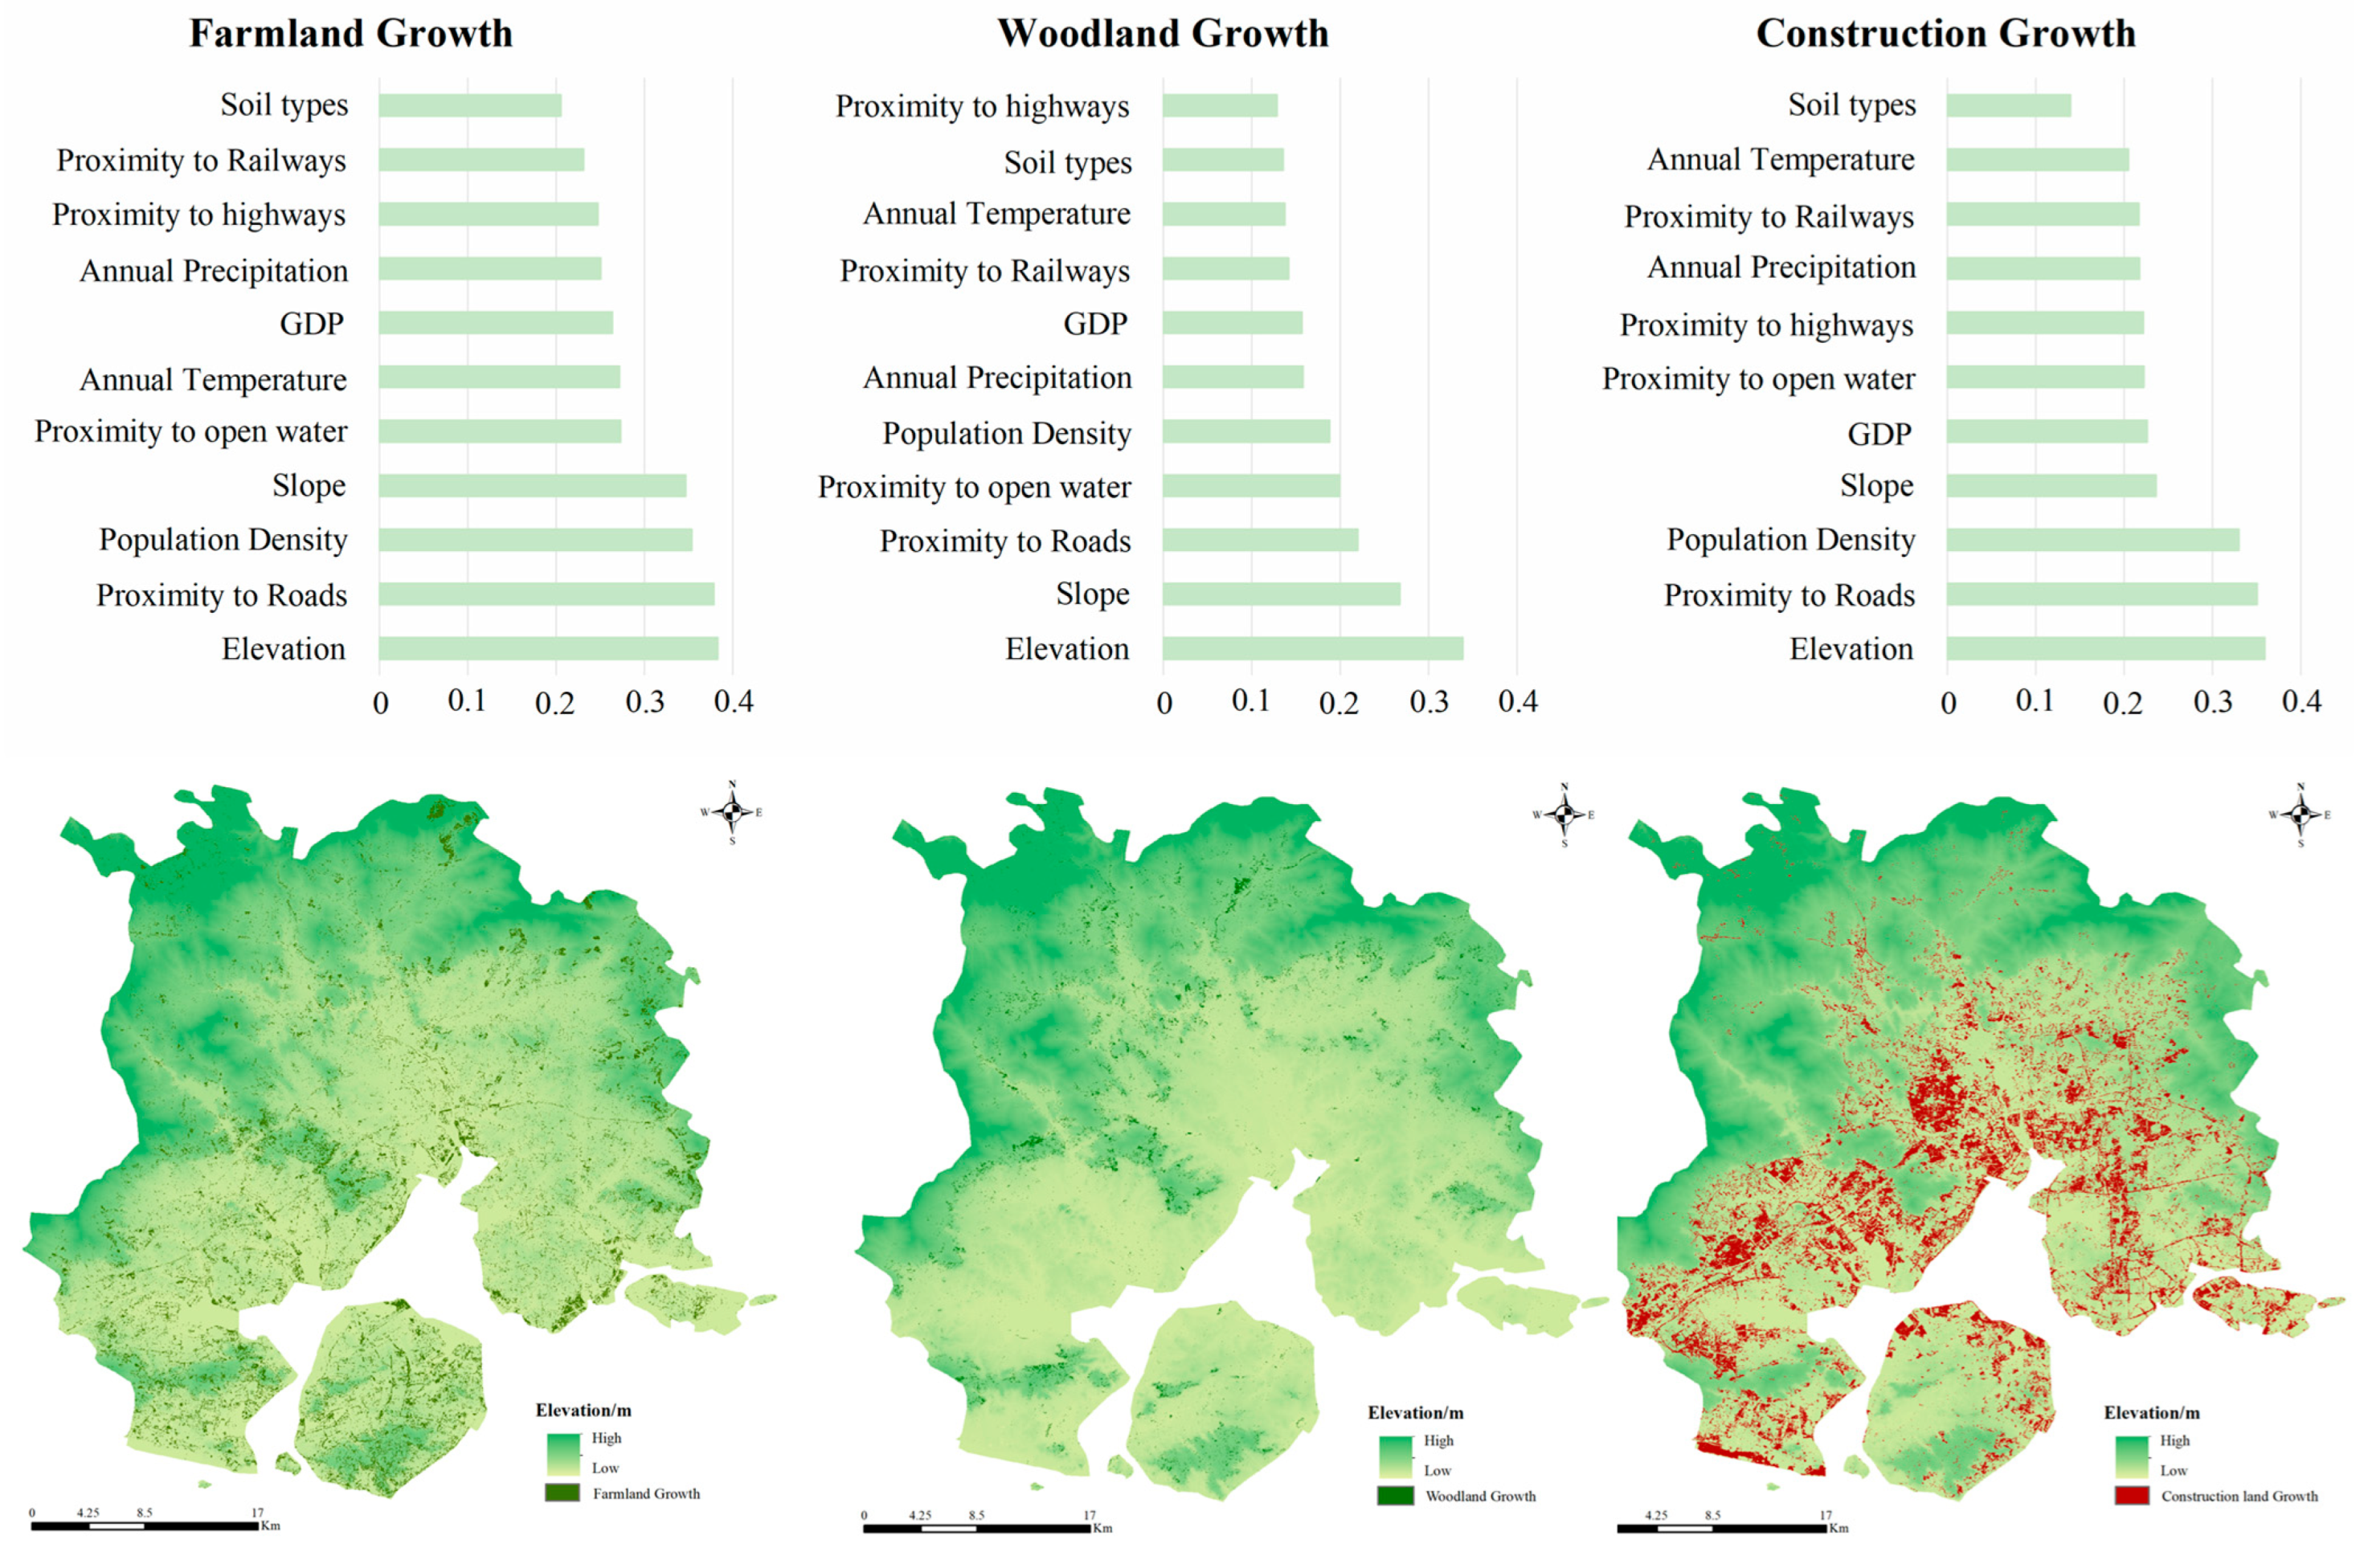
References
- Bilsborrow, R.E.; Okoth-Ogendo, H. Population-driven changes in land use in developing countries. Ambio J. Hum. Environ. 1992, 21, 37–45. Available online: http://www.jstor.org/stable/4313884 (accessed on 2 March 2025).
- Entwisle, B.; Stern, P.C. Population, Land Use, and Environment: Research Directions; Academies Press: Cambridge, MA, USA, 2005. [Google Scholar]
- Wu, R.; Li, Z.G.; Wang, S.J. The varying driving forces of urban land expansion in China: Insights from a spatial-temporal analysis. Sci. Total Environ. 2021, 766, 142591. [Google Scholar] [CrossRef] [PubMed]
- Mahtta, R.; Fragkias, M.; Güneralp, B.; Mahendra, A.; Reba, M.; Wentz, E.A.; Seto, K.C. Urban land expansion: The role of population and economic growth for 300+ cities. Npj Urban Sustain. 2022, 2, 5. [Google Scholar] [CrossRef]
- Luo, J.J.; Xing, X.S.; Wu, Y.Z.; Zhang, W.W.; Chen, R.S. Spatio-temporal analysis on built-up land expansion and population growth in the Yangtze River Delta Region, China: From a coordination perspective. Appl. Geogr. 2018, 96, 98–108. [Google Scholar] [CrossRef]
- Li, Y.J.; Kong, X.S.; Zhu, Z.Q. Multiscale analysis of the correlation patterns between the urban population and construction land in China. Sustain. Cities Soc. 2020, 61, 102326. [Google Scholar] [CrossRef]
- Li, G.D.; Fang, C.L.; Li, Y.J.; Wang, Z.B.; Sun, S.; He, S.W.; Qi, W.; Bao, C.; Ma, H.T.; Fan, Y.P.; et al. Global impacts of future urban expansion on terrestrial vertebrate diversity. Nat. Commun. 2022, 13, 1628. [Google Scholar] [CrossRef]
- Seto, K.C.; Fragkias, M.; Gueneralp, B.; Reilly, M.K. A Meta-Analysis of Global Urban Land Expansion. PLoS ONE 2011, 6, e23777. [Google Scholar] [CrossRef]
- Kuang, B.; Lu, X.H.; Han, J.; Fan, X.Y.; Zuo, J. How urbanization influence urban land consumption intensity: Evidence from China. Habitat Int. 2020, 100, 102103. [Google Scholar] [CrossRef]
- Jiao, L.M.; Dong, T.; Xu, G.; Zhou, Z.Z.; Liu, J.F.; Liu, Y.L. Geographic micro-process model: Understanding global urban expansion from a process-oriented view. Comput. Environ. Urban Syst. 2021, 87, 101603. [Google Scholar] [CrossRef]
- Yang, Z.W.; Chen, Y.B.; Guo, G.H.; Zheng, Z.H.; Wu, Z.F. Using nighttime light data to identify the structure of polycentric cities and evaluate urban centers. Sci. Total Environ. 2021, 780, 146586. [Google Scholar] [CrossRef]
- Li, W.M.; Cai, Z.Y.; Jin, L.S. Urban green land use efficiency of resource-based cities in China: Multidimensional measurements, spatial-temporal changes, and driving factors. Sustain. Cities Soc. 2024, 104, 105299. [Google Scholar] [CrossRef]
- Geng, Y.W.; Li, X.S.; Chen, J.Q. Integration of land use resilience and efficiency in China: Analysis of spatial patterns, differential impacts on SDGs, and adaptive management strategies. Appl. Geogr. 2025, 175, 103490. [Google Scholar] [CrossRef]
- Vollset, S.E.; Goren, E.; Yuan, C.-W.; Cao, J.; Smith, A.E.; Hsiao, T.; Bisignano, C.; Azhar, G.S.; Castro, E.; Chalek, J.; et al. Fertility, mortality, migration, and population scenarios for 195 countries and territories from 2017 to 2100: A forecasting analysis for the Global Burden of Disease Study. Lancet 2020, 396, 1285–1306. [Google Scholar] [CrossRef]
- Xu, Z.; Xu, G.; Lan, T.; Li, X.; Chen, Z.; Cui, H.; Zhou, Z.; Wang, H.; Jiao, L.; Small, C. Global consistency of urban scaling evidenced by remote sensing. PNAS Nexus 2025, 4, pgaf037. [Google Scholar] [CrossRef] [PubMed]
- Chen, G.Z.; Li, X.; Liu, X.P.; Chen, Y.M.; Liang, X.; Leng, J.Y.; Xu, X.C.; Liao, W.L.; Qiu, Y.A.; Wu, Q.L. Global projections of future urban land expansion under shared socioeconomic pathways. Nat. Commun. 2020, 11, 537. [Google Scholar] [CrossRef] [PubMed]
- Kelley, A.C.; Schmidt, R.M. Aggregate population and economic growth correlations: The role of the components of demographic change. Demography 1995, 32, 543–555. [Google Scholar] [CrossRef] [PubMed]
- Sasaki, H.; Mino, K. Effects of exhaustible resources and declining population on economic growth with Hotelling’s rule. Int. Rev. Econ. Financ. 2024, 94, 103395. [Google Scholar] [CrossRef]
- Carter, R.C.; Parker, A. Climate change, population trends and groundwater in Africa. Hydrol. Sci. J.-J. Des Sci. Hydrol. 2009, 54, 676–689. [Google Scholar] [CrossRef]
- Li, K.M.; Fang, L.T.; He, L.R. How population and energy price affect China’s environmental pollution? Energy Policy 2019, 129, 386–396. [Google Scholar] [CrossRef]
- Molotoks, A.; Smith, P.; Dawson, T.P. Impacts of land use, population, and climate change on global food security. Food Energy Secur. 2021, 10, e261. [Google Scholar] [CrossRef]
- Jiao, L.M.; Xu, Z.B.; Xu, G.; Zhao, R.; Liu, J.F.; Wang, W.L. Assessment of urban land use efficiency in China: A perspective of scaling law. Habitat Int. 2020, 99, 102172. [Google Scholar] [CrossRef]
- Lei, W.Q.; Jiao, L.M.; Xu, Z.B.; Zhu, X.H. Evolution of urban land and population system coupling micro-dynamics and macro-stability: Trends and paths. Land Use Policy 2024, 141, 107152. [Google Scholar] [CrossRef]
- Ma, S.; Wang, G.; Xu, C.; Zhang, X.; Zhao, Y.; Cai, Y. Does the optimal land use pattern for cross-regional cooperation change at different stages of urbanization? Evidence from the trade-off between urban growth scenarios and SDGs indicators. Appl. Geogr. 2024, 167, 103294. [Google Scholar] [CrossRef]
- Yang, Y.Z.; Feng, Z.M.; Zhao, Y.D.; You, Z. Coordination between urban land expansion and population growth in China. Geogr. Res. 2013, 32, 1668–1678. [Google Scholar] [CrossRef]
- Zhu, F.K.; Zhang, F.R.; Li, C.; Jiao, P.F.; Wang, J.X. Coordination and regional difference of urban land expansion and demographic urbanization in China during 1993–2008. Prog. Geogr. 2014, 33, 647–656. [Google Scholar] [CrossRef]
- Jiang, S.G.; Zhang, Z.K.; Ren, H.; Wei, G.; Xu, M.H.; Liu, B.L. Spatiotemporal Characteristics of Urban Land Expansion and Population Growth in Africa from 2001 to 2019: Evidence from Population Density Data. Isprs Int. J. Geo-Inf. 2021, 10, 584. [Google Scholar] [CrossRef]
- Sarayrah, H.; Hayek, W.; Thneibat, A.; Ibrahim, M. Mapping of population growth influence on land use transformation from 1994 to 2015 in Madaba Governorate, Jordan. Environ. Monit. Assess. 2024, 196, 250. [Google Scholar] [CrossRef] [PubMed]
- Xu, Z.; Jiao, L.; Lan, T.; Zhou, Z.; Cui, H.; Li, C.; Xu, G.; Liu, Y. Mapping hierarchical urban boundaries for global urban settlements. Int. J. Appl. Earth Obs. Geoinf. 2021, 103, 102480. [Google Scholar] [CrossRef]
- Xiamen Ecological Environment Bureau. The ‘13th Five-Year Plan’ of Ecological Civilization Construction in Xiamen City. Available online: https://view.officeapps.live.com/op/view.aspx?src=https%3A%2F%2Fsthjj.xm.gov.cn%2Fzwgk%2Fzfxxgk%2Ffdzdgknr%2Fghjh%2Fsthjbhgh%2F201712%2FP020240823618841730059.doc&wdOrigin=BROWSELINK (accessed on 10 March 2025).
- Zhai, Z.W.; Chen, J.J.; Li, L. Future trends of China’s population and Aging: 2015~2100. Popul. Res. 2017, 41, 60–71. [Google Scholar]
- Wang, X.C.; Xiong, F.; Wang, Z.W.; Chen, S.; Zhang, Z.; Peng, L. Planning and Layout of Facilities for the Elders Based on POI and Machine Learning:A Case Study of Wuhan. Econ. Geogr. 2021, 41, 49–56. [Google Scholar] [CrossRef]
- Kumar, A.; Nanthaamornphong, A.; Selvi, R.; Venkatesh, J.; Alsharif, M.H.; Uthansakul, P.; Uthansakul, M. Evaluation of 5G techniques affecting the deployment of smart hospital infrastructure: Understanding 5G, AI and IoT role in smart hospital. Alex. Eng. J. 2023, 83, 335–354. [Google Scholar] [CrossRef]
- Ji, X.M.; Wang, K.; Ji, T.; Zhang, Y.H.; Wang, K. Coupling Analysis of Urban Land Use Benefits: A Case Study of Xiamen City. Land 2020, 9, 155. [Google Scholar] [CrossRef]
- Liang, C.; Zeng, J.; Shen, Z.J.; Wang, Q.W. Spatial pattern analysis and management of urban ecosystem services under rapid urbanization:A case study of Xiamen. Acta Ecol. Sin. 2021, 41, 4379–4392. Available online: https://www.ecologica.cn/stxb/ch/html/2021/11/stxb202012283297.htm (accessed on 21 August 2025).
- Li, Y.; Niu, Z.G. Systematic method for mapping fine-resolution water cover types in China based on time series Sentinel-1 and 2 images. Int. J. Appl. Earth Obs. Geoinf. 2022, 106, 102656. [Google Scholar] [CrossRef]
- Peng, S. 1-km monthly maximum temperature dataset for China (1901–2022). Natl. Tibet. Plateau/Third Pole Environ. Data Cent. 2020, 11, 1931–1946. [Google Scholar] [CrossRef]
- United Nations World Population Prospects 2024. Available online: https://population.un.org/wpp/assets/Files/WPP2024_Methodology-Report_Final.pdf (accessed on 10 March 2025).
- State Council National Population Development Plan (2016–2030). Available online: https://www.gov.cn/zhengce/content/2017-01/25/content_5163309.htm (accessed on 10 March 2025).
- Xiamen Municipal People ‘s Government. Xiamen Population Development Plan (2016–2030). Available online: https://view.officeapps.live.com/op/view.aspx?src=https%3A%2F%2Fwww.xm.gov.cn%2Fzwgk%2Fflfg%2Fsfwj%2F201812%2FP020181219404911586534.docx&wdOrigin=BROWSELINK (accessed on 10 March 2025).
- Tapio, P. Towards a theory of decoupling: Degrees of decoupling in the EU and the case of road traffic in Finland between 1970 and 2001. Transp. Policy 2005, 12, 137–151. [Google Scholar] [CrossRef]
- Liang, X.; Guan, Q.F.; Clarke, K.C.; Liu, S.S.; Wang, B.Y.; Yao, Y. Understanding the drivers of sustainable land expansion using a patch-generating land use simulation (PLUS) model: A case study in Wuhan, China. Comput. Environ. Urban Syst. 2021, 85, 101569. [Google Scholar] [CrossRef]
- Wang, B.S.; Liao, J.F.; Zhu, W.; Qiu, Q.Y.; Wagn, L.; Tang, L.N. The weight of neighborhood setting of the FLUS model based on a historical scenario: A case study of land use simulation of urban agglomeration of the Golden Triangle of Southern Fujian in 2030. Acta Ecol. Sin. 2019, 39, 4284–4298. Available online: https://www.sciengine.com/doi/pdf/A4E0315809FF45AABF61355DED4C2DA9 (accessed on 21 August 2025).
- Wang, J.N.; Wang, W.C.; Zhang, S.S.; Wang, Y.Y.; Sun, Z.H.; Wu, B.L. Spatial and temporal changes and development predictions of urban green spaces in Jinan City, Shandong, China. Ecol. Indic. 2023, 152, 110373. [Google Scholar] [CrossRef]
- Liang, X.; Liu, X.P.; Li, X.; Chen, Y.M.; Tian, H.; Yao, Y. Delineating multi-scenario urban growth boundaries with a CA-based FLUS model and morphological method. Landsc. Urban Plan. 2018, 177, 47–63. [Google Scholar] [CrossRef]
- Liang, X.; Tian, H.; Li, X.; Huang, J.-L.; Clarke, K.C.; Yao, Y.; Guan, Q.F.; Hu, G.H. Modeling the dynamics and walking accessibility of urban open spaces under various policy scenarios. Landsc. Urban Plan. 2021, 207, 103993. [Google Scholar] [CrossRef]
- Jian, L.; Xia, X.J.; Liu, X.Y.; Zhang, Y.; Wang, Y.Q. Spatiotemporal variations and multi-scenario simulation of urban thermal environments based on complex networks and the PLUS model: A case study in Chengdu central districts. Sustain. Cities Soc. 2024, 115, 105833. [Google Scholar] [CrossRef]
- UN-Habitat. A New Strategy of Sustainable Neighbourhood Planning: Five Principles. Available online: https://unhabitat.org/sites/default/files/download-manager-files/A%20New%20Strategy%20of%20Sustainable%20Neighbourhood%20Planning%20Five%20principles.pdf (accessed on 10 March 2025).
- Zhai, Y.; Yao, Y.; Guan, Q.; Liang, X.; Li, X.; Pan, Y.; Yue, H.; Yuan, Z.; Zhou, J. Simulating urban land use change by integrating a convolutional neural network with vector-based cellular automata. Int. J. Geogr. Inf. Sci. 2020, 34, 1475–1499. [Google Scholar] [CrossRef]
- Yao, Y.; Liu, X.; Li, X.; Liu, P.; Hong, Y.; Zhang, Y.; Mai, K. Simulating urban land-use changes at a large scale by integrating dynamic land parcel subdivision and vector-based cellular automata. Int. J. Geogr. Inf. Sci. 2017, 31, 2452–2479. [Google Scholar] [CrossRef]
- Pontius, R.G.; Boersma, W.; Castella, J.C.; Clarke, K.; Nijs, T.D.; Dietzel, C.; Duan, Z.; Fotsing, E.; Goldstein, N.; Kok, K.; et al. Comparing the input, output, and validation maps for several models of land change. Ann. Reg. Sci. 2008, 42, 11–37. [Google Scholar] [CrossRef]
- Zhang, X.L.; Zhai, Z.W.; Tao, T. Trends and patterns of negative population growth in China. Popul. Res. 2020, 44, 3–20. [Google Scholar]
- Kabisch, N.; Haase, D.; Haase, A. Urban Population Development in Europe, 1991-2008: The Examples of Poland and the UK. Int. J. Urban Reg. Res. 2012, 36, 1326–1348. [Google Scholar] [CrossRef]
- Haartsen, T.; Venhorst, V. Planning for Decline: Anticipating on Population Decline in The Netherlands. Tijdschr. Voor Econ. En Soc. Geogr. 2010, 101, 218–227. [Google Scholar] [CrossRef]
- Assmann, S. Japan’s Shrinking Regions in the 21st Century: Contemporary Responses to Depopulation and Socioeconomic Decline. J. Asian Stud. 2014, 73, 1135–1137. [Google Scholar] [CrossRef]
- Rosen, B.; Waitzberg, R.; Israeli, A.; Hartal, M.; Davidovitch, N. Addressing vaccine hesitancy and access barriers to achieve persistent progress in Israel’s COVID-19 vaccination program. Isr. J. Health Policy Res. 2021, 10, 43. [Google Scholar] [CrossRef]
- Liu, Y.; Huang, C.; Wu, R.; Pan, Z.; Gu, H. The spatial patterns and determinants of internal migration of older adults in China from 1995 to 2015. J. Geogr. Sci. 2022, 32, 2541–2559. [Google Scholar] [CrossRef]
- Hermawan, F.; Rachmawati, T.; Wahyono, H.L. Does Demographic Pattern Matter for Sustainable Infrastructure Policy? Procedia Eng. 2015, 125, 481–488. [Google Scholar] [CrossRef]
- Faust, K.M.; Abraham, D.M.; DeLaurentis, D. Coupled Human and Water Infrastructure Systems Sector Interdependencies: Framework Evaluating the Impact of Cities Experiencing Urban Decline. J. Water Resour. Plan. Manag. 2017, 143. [Google Scholar] [CrossRef]
- Faure, J.C.; Faust, K.M. Socioeconomic characteristics versus density changes: The operational effects of population dynamics on water systems. Sustain. Resilient Infrastruct. 2023, 8, 3–16. [Google Scholar] [CrossRef]
- Ju, Y.J.; Kim, W.; Chang, K.; Lee, T.H.; Lee, S.Y. Association between residing in municipalities facing population decline and satisfaction with neighboring healthcare infrastructure in older aged adults. BMC Public Health 2024, 24, 2070. [Google Scholar] [CrossRef] [PubMed]
- Wu, R.W.; Zhang, J.L.; Zhou, L.; Zhang, Q. Population aging in Chinese counties: Change of regional types and influencing factors from the population mobility perspective. Prog. Geogr. 2025, 44, 1213–1226. [Google Scholar] [CrossRef]
- Xu, Z.B.; Jiao, L.M.; Wang, Y. Comparison of urban land expansion between urban physical and administrative areas in China from 1988 to 2018. Acta Geogr. Sin. 2022, 77, 2514–2528. [Google Scholar] [CrossRef]
- Xiang, S.S.; Huang, L.Y.; Zhou, M.M.; Shan, L.P.; Dong, B.Y.; Wang, K. Dynamic analysis of correlation patterns between urban population and construction land at different administrative levels: The case of Hangzhou megacity. Ecol. Indic. 2023, 154, 110407. [Google Scholar] [CrossRef]
- Lawrence, M.; Homer-Dixon, T.; Janzwood, S.; Rockstöm, J.; Renn, O.; Donges, J.F. Global polycrisis: The causal mechanisms of crisis entanglement. Glob. Sustain. 2024, 7, e6. [Google Scholar] [CrossRef]
- Lawrence, M. Polycrisis in the Anthropocene: An invitation to contributions and debates. Glob. Sustain. 2024, 7, e5. [Google Scholar] [CrossRef]
- Haase, D. Shrinking Cities, Biodiversity and Ecosystem Services. In Urbanization, Biodiversity and Ecosystem Services: Challenges and Opportunities: A Global Assessment; Thomas, E., Michail, F., Julie, G., Güneralp, B., Marcotullio, P.J., McDonald, R.I., Parnell, S., Schewenius, M., Sendstad, M., et al., Eds.; Springer: Dordrecht, The Netherlands, 2013; pp. 253–274. [Google Scholar]
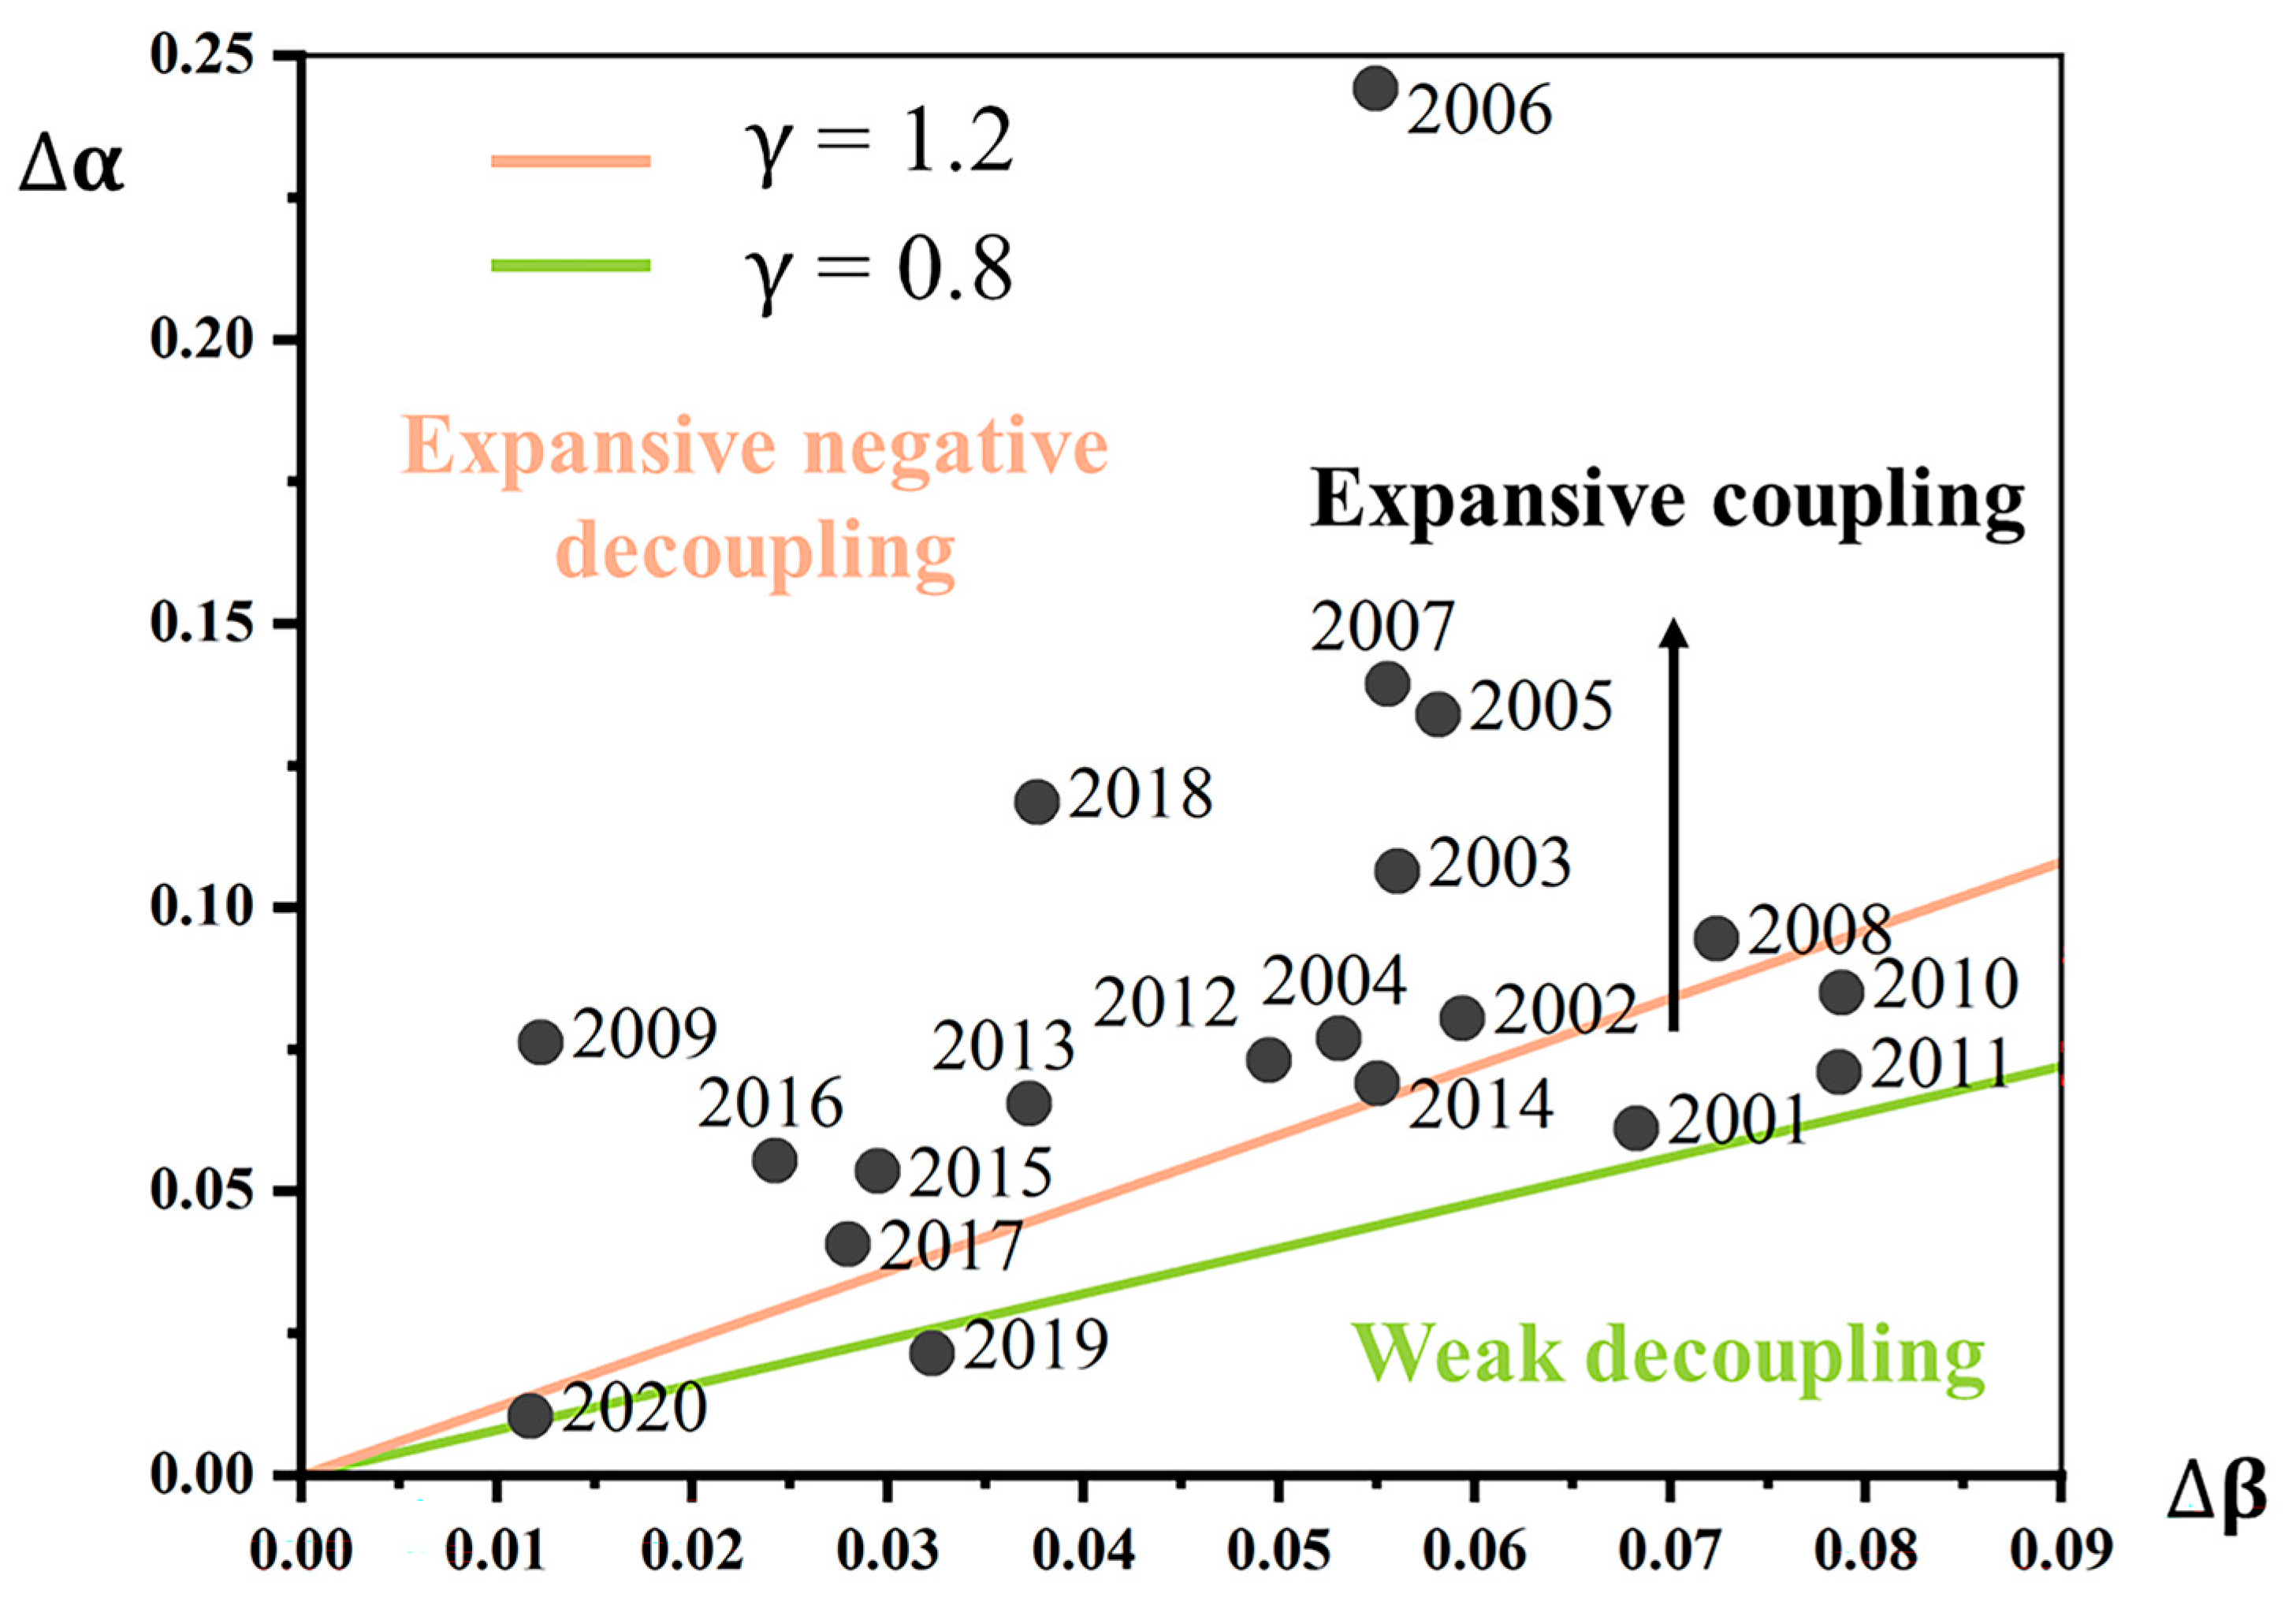
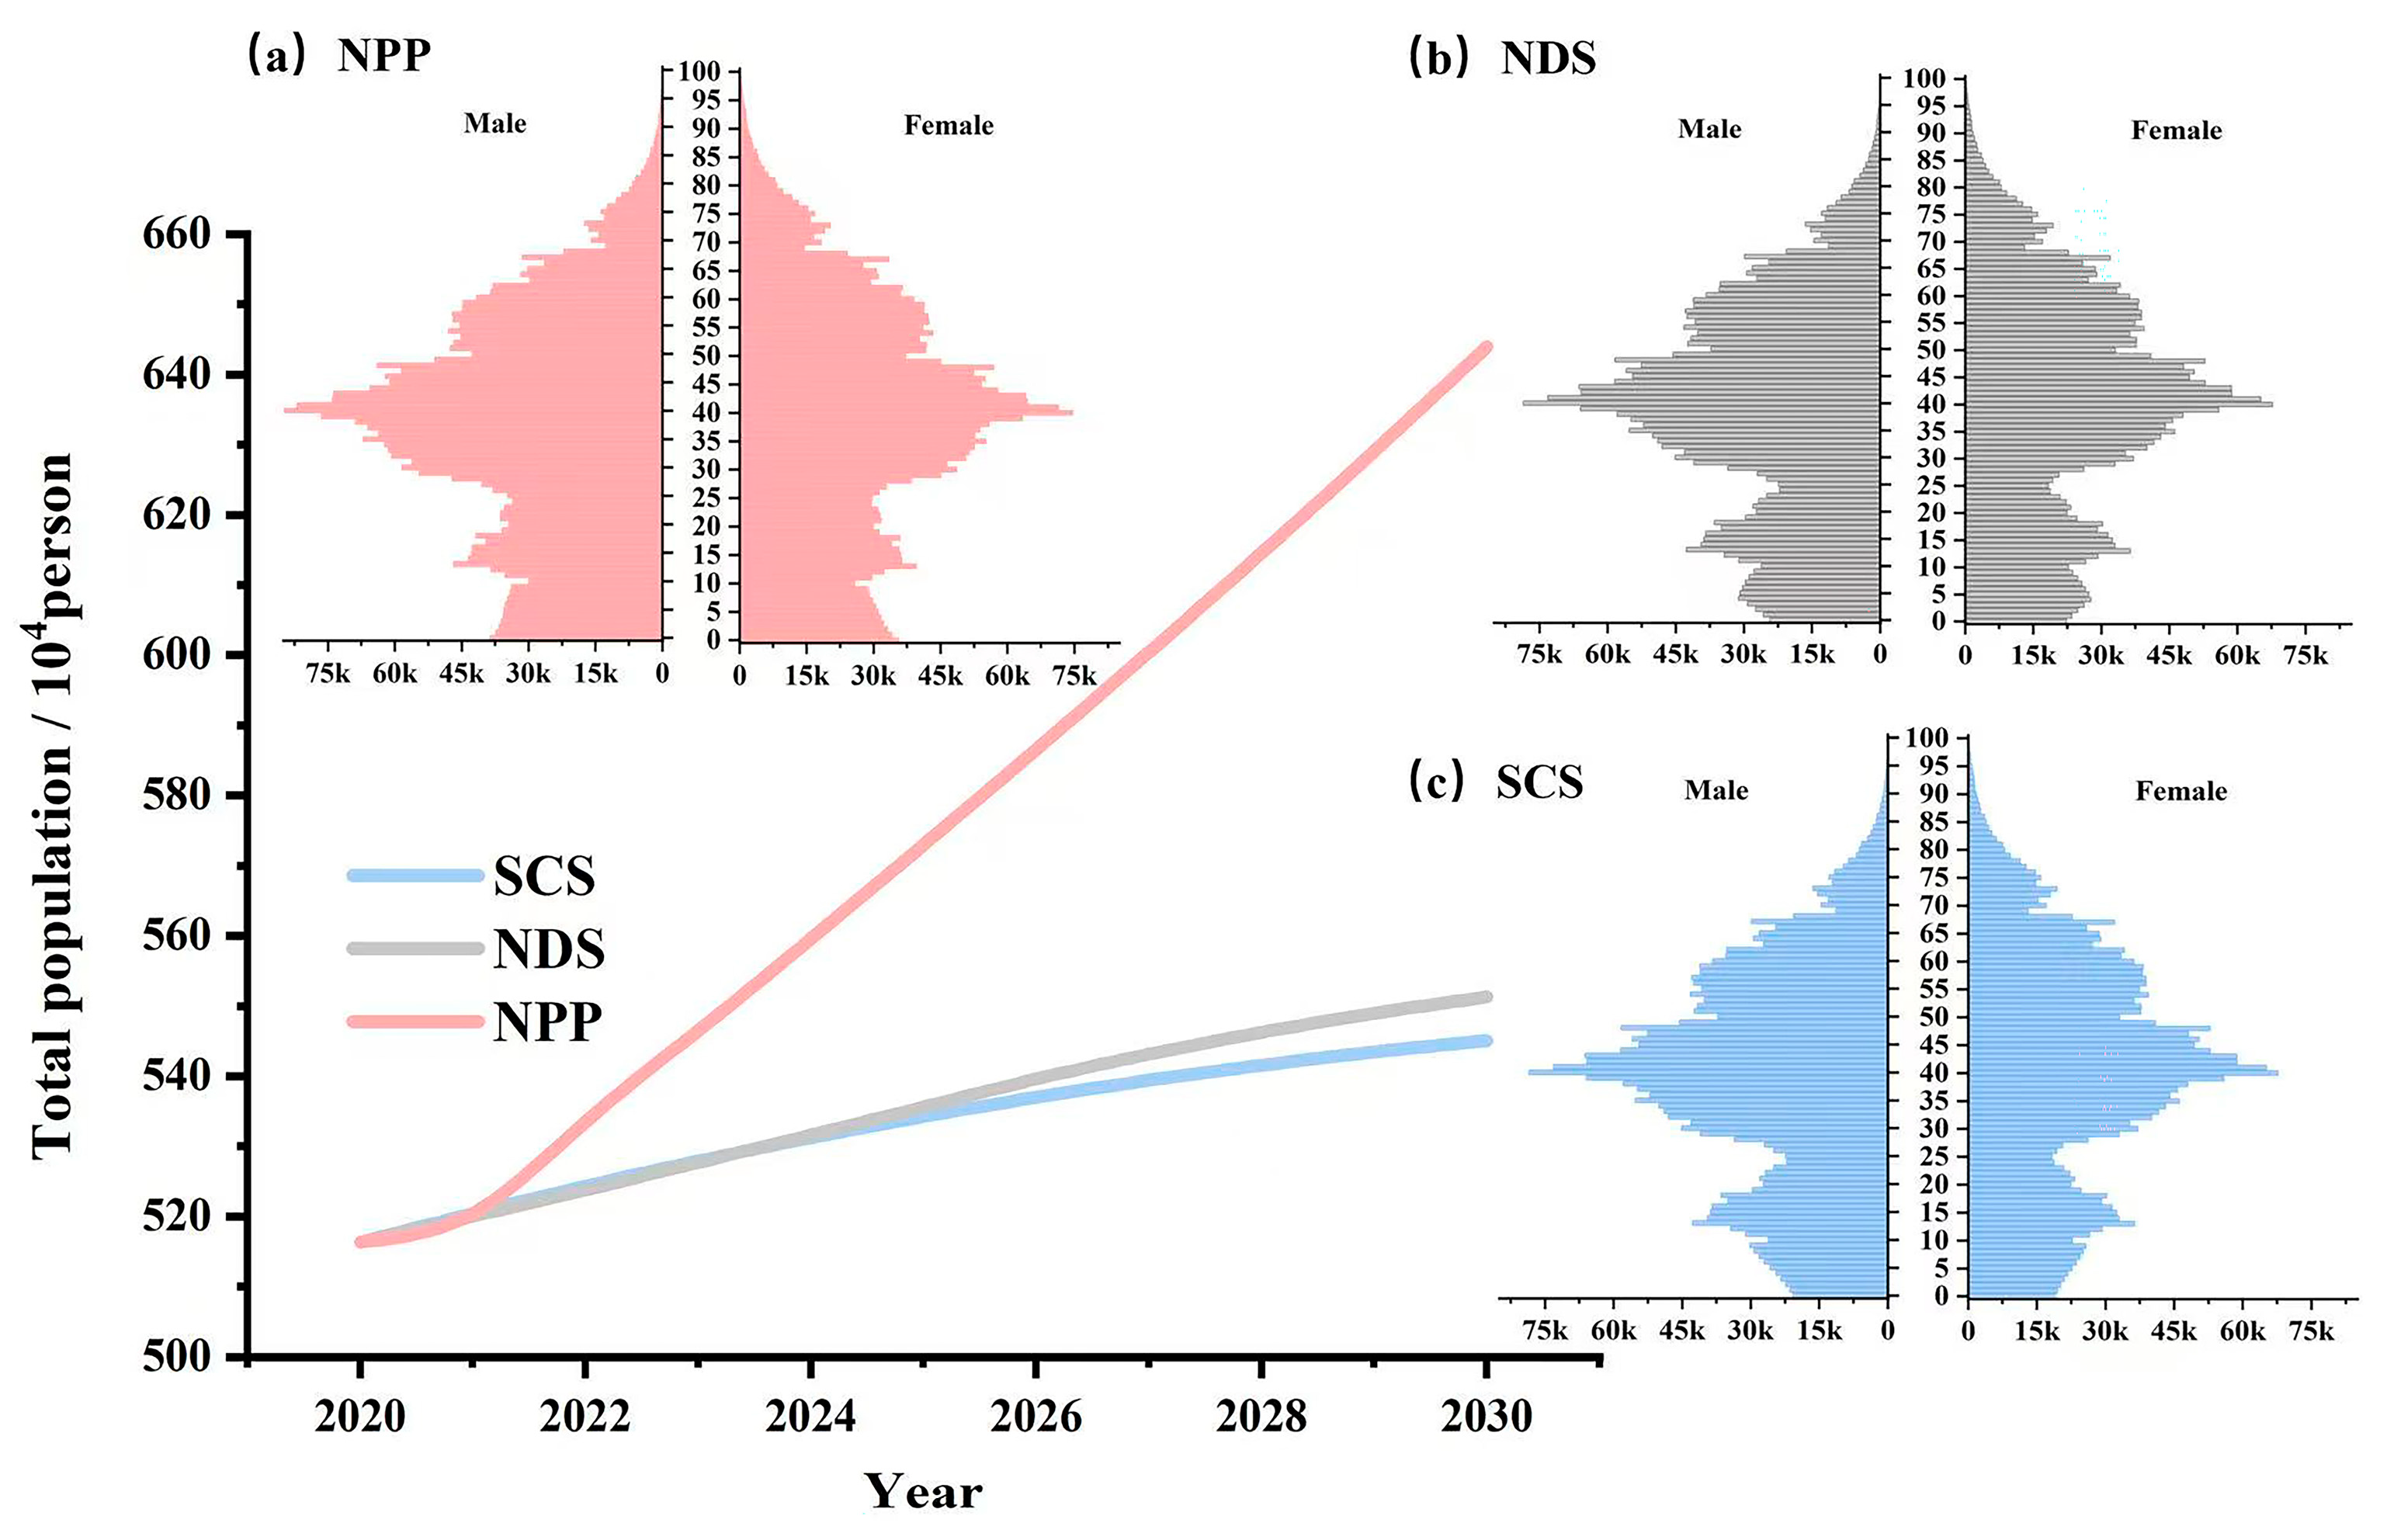
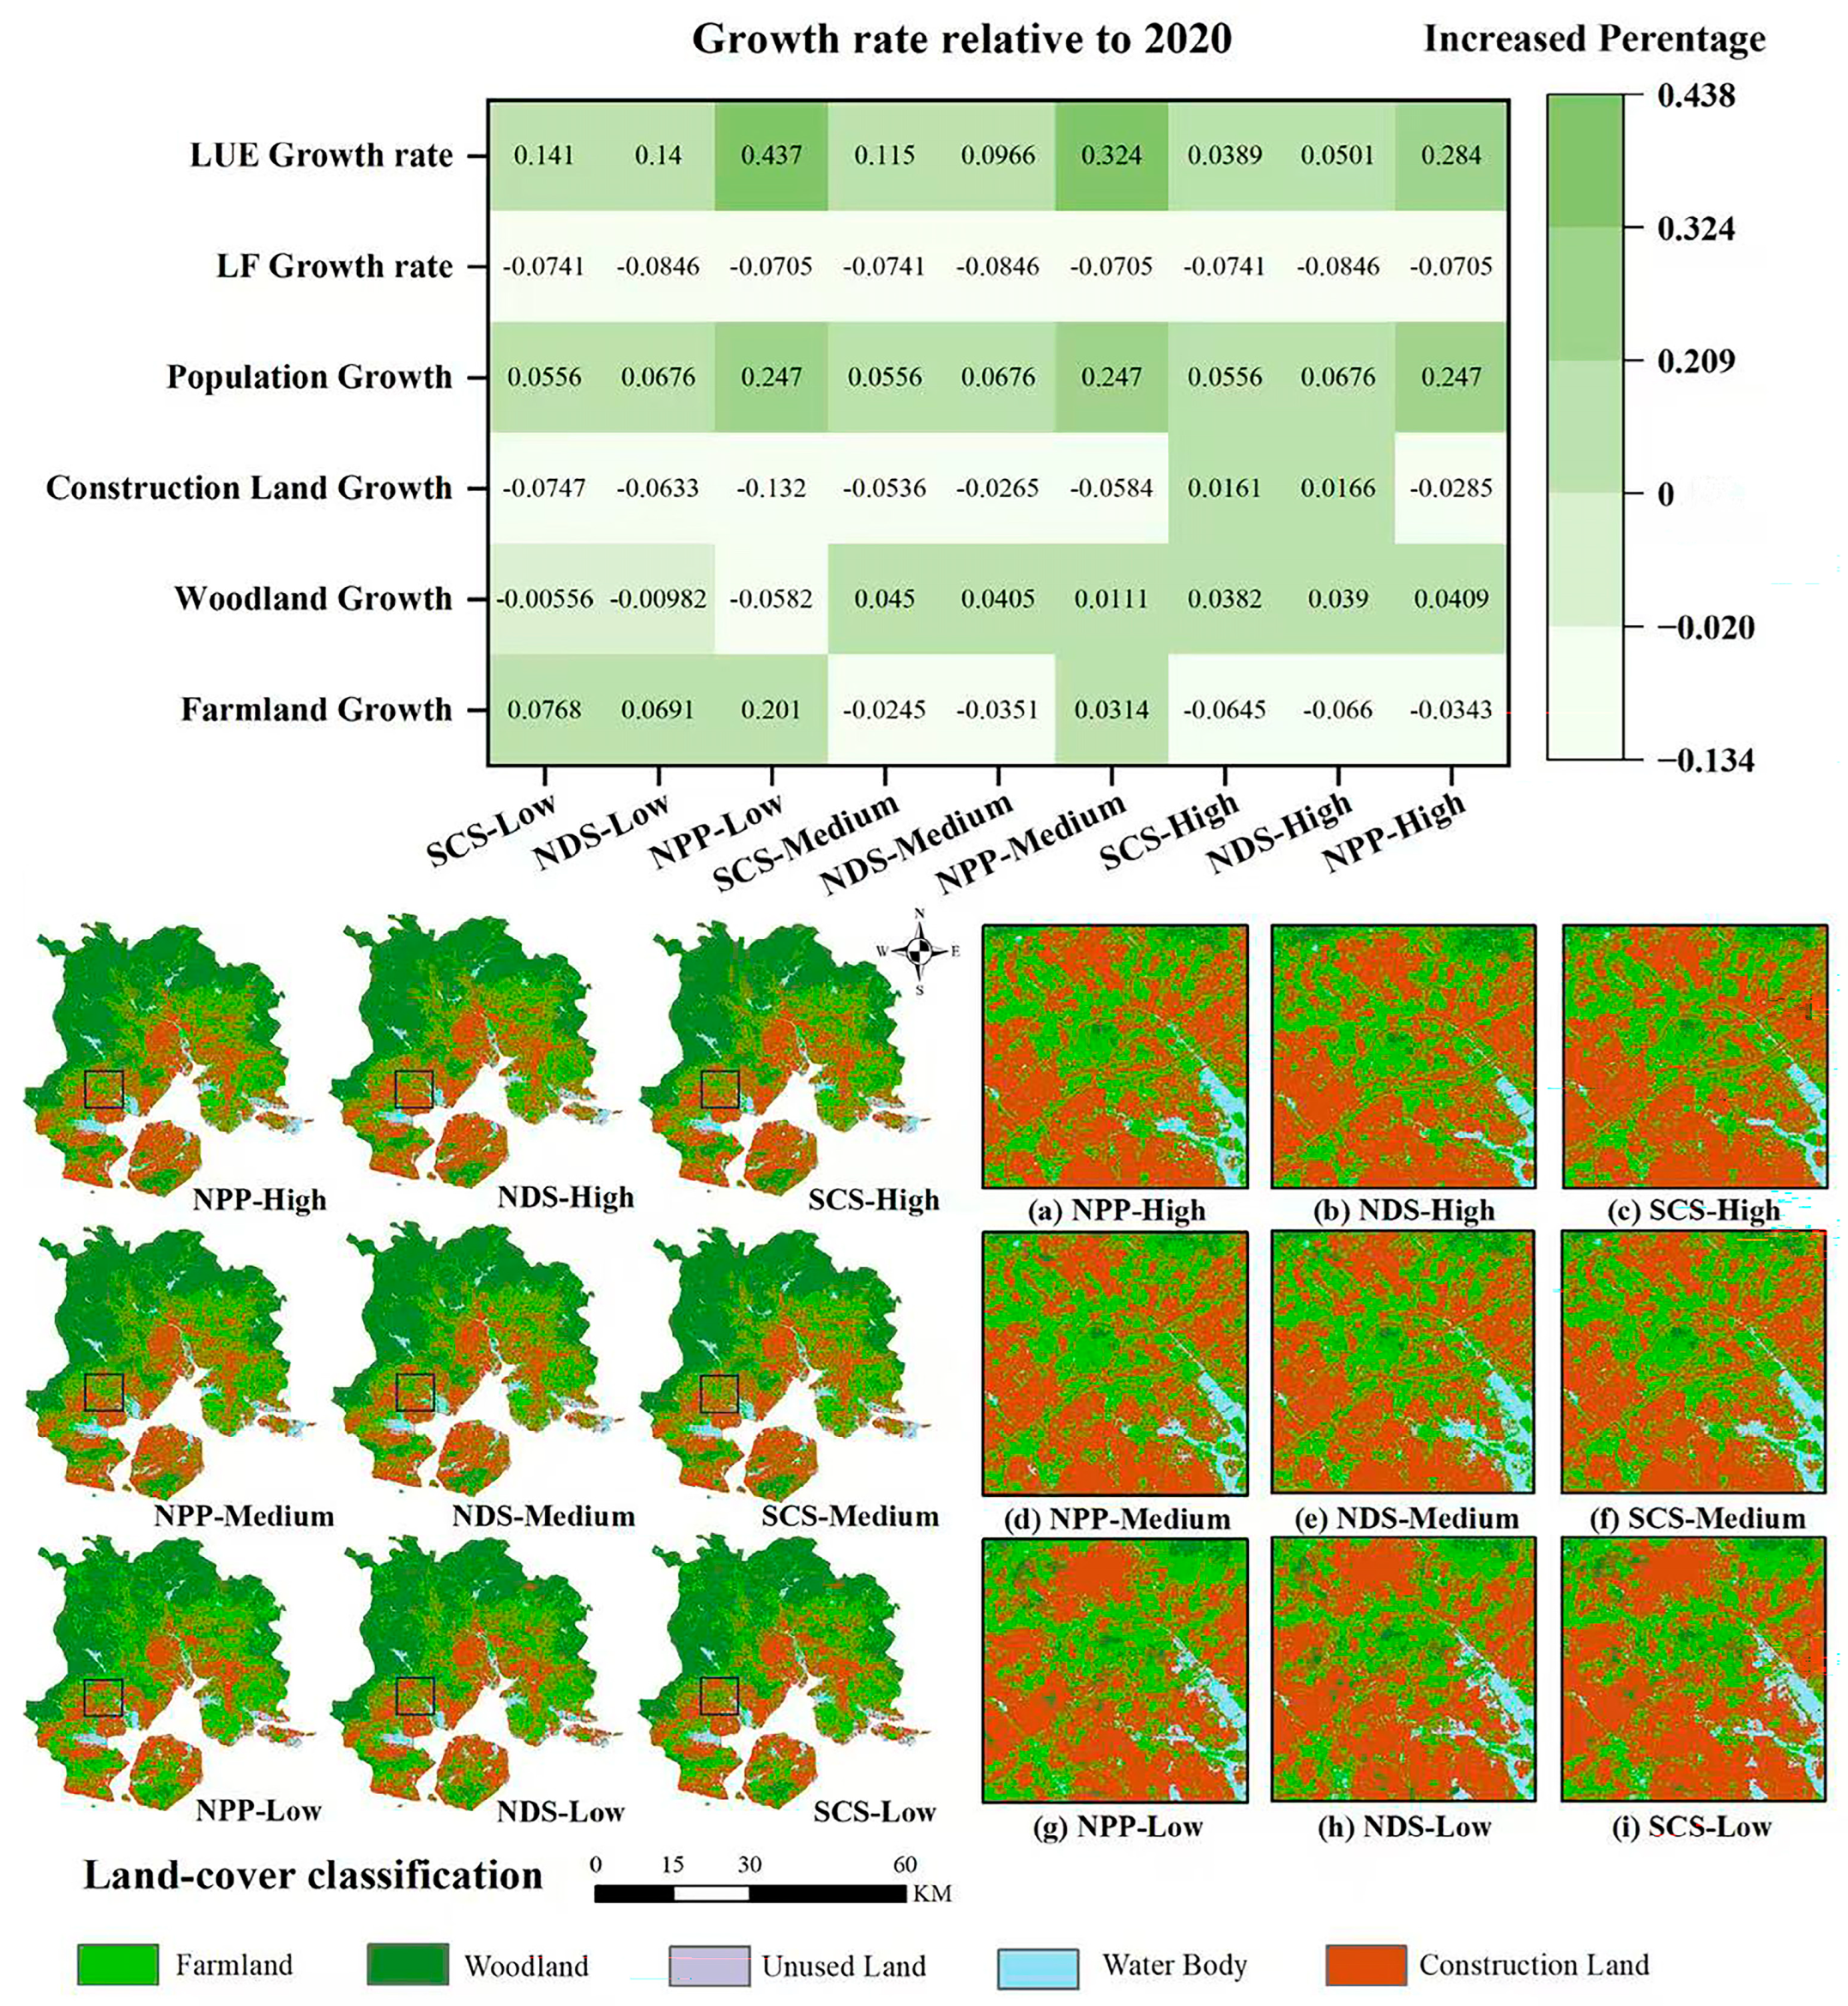
| Data Types | Time Node (Year) | Data Source |
|---|---|---|
| Permanent population data | 2000–2020 | Xiamen Economic Census Yearbook and The Seventh Census Yearbook |
| Bulit-up area | 2000–2020 | China City Statistical Yearbook |
| Migration population data | 1990–2020 | Xiamen Economic Census Yearbook |
| Land use data | 2000, 2005, 2010, 2015, 2020 | The Institute of Space Information Innovation, Chinese Academy of Sciences |
| Spatial interpolation data of annual precipitation and spatial distribution data of soil types at 1 km resolution in China | 2020 | The Institute of Space Information Innovation, Chinese Academy of Sciences |
| GDP | 2020 | Resource and Environmental Science Data Platform |
| Water coverage type map | 2020 | The results of Yang Li et al. [36] |
| Digital Elevation Model (DEM) | 2020 | National Aeronautics and Space Administration (NASA) |
| 1 km monthly minimum temperature dataset for China | National Tibetan Plateau/Third Pole Environment Data Center [37] | |
| National road network vector data | 2020 | OSM (www.openstreetmap.org) (accessed on 1 January 2020) |
| Name | Interpretation | Key Indicators (TFR) | Setting Basis |
|---|---|---|---|
| Stable continuation scenario (SCS) | Maintain the TFR unchanged in 2020 | 2020–2030: 1.146 | China’s TFR is at a low level going forward, according to the “China Population Research Report” [38] |
| Natural development scenarios (NDS) | Low fertility warning line TFR = 1.5; The ultra-low fertility boundary TFR = 1.3 | 2020: 1.146 2025: 1.5 2030: 1.3 | TFR first rose and then fell before and following the enactment of the “comprehensive two-child” policy |
| National 2030 population planning scenario (NPP) | TFR will meet the relevant planning requirements in 2030 | 2020: 1.146 2030: 1.8 | National and Xiamen population development plan (2016–2030) [39,40] |
| Population Density/People km−2 | Population Projection Scenarios | Land Simulation Scenario |
|---|---|---|
| 10,407 | Stable continuation scenario | SCS-Low |
| Natural development scenarios | NDS-Low | |
| National 2030 population planning scenario | NPP-Low | |
| 12,848 | Stable continuation scenario | SCS-Medium |
| Natural development scenarios | NDS-Medium | |
| National 2030 population planning scenario | NPP-Medium | |
| 15,000 | Stable continuation scenario | SCS-High |
| Natural development scenarios | NDS-High | |
| National 2030 population planning scenario | NPP-High |
Disclaimer/Publisher’s Note: The statements, opinions and data contained in all publications are solely those of the individual author(s) and contributor(s) and not of MDPI and/or the editor(s). MDPI and/or the editor(s) disclaim responsibility for any injury to people or property resulting from any ideas, methods, instructions or products referred to in the content. |
© 2025 by the authors. Licensee MDPI, Basel, Switzerland. This article is an open access article distributed under the terms and conditions of the Creative Commons Attribution (CC BY) license (https://creativecommons.org/licenses/by/4.0/).
Share and Cite
Li, C.; Xu, Z.; Wang, C.; Nie, L.; Wang, H. Local Land Use Simulation in Migrant-Receiving Xiamen Under National Population Decline: Integrating Cohort-Component and PLUS Models. Land 2025, 14, 1713. https://doi.org/10.3390/land14091713
Li C, Xu Z, Wang C, Nie L, Wang H. Local Land Use Simulation in Migrant-Receiving Xiamen Under National Population Decline: Integrating Cohort-Component and PLUS Models. Land. 2025; 14(9):1713. https://doi.org/10.3390/land14091713
Chicago/Turabian StyleLi, Cui, Zhibang Xu, Cuiping Wang, Lei Nie, and Haowei Wang. 2025. "Local Land Use Simulation in Migrant-Receiving Xiamen Under National Population Decline: Integrating Cohort-Component and PLUS Models" Land 14, no. 9: 1713. https://doi.org/10.3390/land14091713
APA StyleLi, C., Xu, Z., Wang, C., Nie, L., & Wang, H. (2025). Local Land Use Simulation in Migrant-Receiving Xiamen Under National Population Decline: Integrating Cohort-Component and PLUS Models. Land, 14(9), 1713. https://doi.org/10.3390/land14091713


