Abstract
Urban sustainability has become the most important urban development issue globally. Facing the problem of spatial structure optimization during urbanization, how to effectively use public data access to promote urban polycentric development has become a new area of concern for urban planners and policy makers. To quantify how government open-data platforms shape polycentric urban spatial structure across Chinese cities, this study takes the launch of government data platforms as a quasi-natural experiment, constructs the multi-period differences-in-differences model, uses data of 271 Chinese prefectural-level cities from 2010 to 2021, and examines the impact and mechanism of public data access on urban spatial structure. We find that public data access promotes urban polycentric development, especially in large cities, those in urban agglomerations, and resource-abundant cities. The effect follows an inverted ‘N’ trend, which reflects the evolving role of PDA across different urban development stages, highlighting the need for adaptive policies to optimize its benefits. Mechanisms include information process radicalization and industrial structure upgrading, moderated positively by government intervention and regional competition. These insights can inform policies for optimizing urban spatial patterns and advancing sustainable urban development.
1. Introduction
Urban spatial structure is a crucial instrument for governing and planning of sustainable urban development. Optimizing urban spatial structure is related to urban sustainable development, residents’ life quality and economically efficient operation [1,2]. Since the reform and opening-up, China’s urbanization rate has risen significantly, which has fueled high economic growth, but has also brought about many new challenges. Compared with the advanced urbanized countries, Chinese cities are facing many development difficulties, such as leapfrog population growth, rapid expansion of land use, and drastic changes in spatial structure. There is an urgent need to shift from the ‘sprawling’ mode of external expansion to the ‘compact and intensive’ mode of internal upgrading [3]. In December 2015, the Central Urban Work Conference proposed the concept of intensive development. The National 14th Five-Year Plan has mentioned the need to “transform urban development mode and promote urban spatial structure’ optimization’’. The process of modernization is inevitably accompanied by a profound adjustment of regional structure. In 2024, the government work report puts forward the idea that there is still much room for improving the quantity and quality of China’s urbanization development. To adapt to the new situation and further release the domestic demand potential of new urbanization, it is urgent to form a perfect spatial pattern of urbanization. Urban polycentric spatial structure development is an important trend in modern urban planning and management [4]. In China, the urban polycentric development model has gradually become an important means to support new urban spatial pattern and release new kinetic energy of urban development [5]. The study of urban spatial structure optimization can provide scientific guidance for urban development, help decision makers understand the complexity of urban spatial structure changes, and formulate more precise and effective policies.
Against the backdrop of deep global urbanization and accelerated digital transformation, data has become one of the core resources of strategic importance for urban development. The promotion of “Sustainable Cities and Communities” (SDG 11) as the key to the 17 United Nations Sustainable Development Goals (SDGs) is facing the serious challenge of missing data, which has seriously hindered the monitoring and evaluation of SDG 11 indicators. The urbanization process urgently requires the optimization of urban space. Digital transformation provides unprecedented opportunities for the efficient collection and accurate analysis of data, so that scientific and efficient decisions can be made. Public data access (PDA) refers to the provision of public data sets by public administration departments or organizations, primarily government agencies, to enterprises, research and development institutes, and other social groups or individuals, without compromising state secrets or infringing upon personal privacy [6]. The optimization of urban spatial structure needs to rely on accurate and real-time data support, and PDA can supply abundant data resources and new analytical tools for studying urban spatial structure. This enables urban planning and management based on empirical data, thereby optimizing urban spatial layout in a more scientific manner and enhancing urban governance efficiency. PDA is increasingly recognized as a vital force in urban governance [7]. However, PDA encounters several challenges in practice, such as data quality, privacy protection, and data sharing mechanisms, which significantly constrain the efficient flow of public data and prevent it from playing a pivotal role in urban development [6,8]. Therefore, we aim to explore how PDA affects urban spatial structure. The research questions include the following: What is the direct effect of PDA on urban spatial structure? What are the indirect influence mechanisms? Are there heterogeneous impact differences? What moderating variables amplify or diminish the impact effects? Through in-depth discussion of the above issues, we expect to provide new theoretical perspectives and practical strategies for optimizing urban spatial structure, to promote scientific, refined and intelligent urban governance, and to contribute wisdom and strength to achieve the goals of SDG 11.
This paper theoretically analyses the impact of PDA on urban spatial structure, and empirically examines these impacts using data of 271 Chinese prefecture-level cities from 2010 to 2021. We employ the launch of government data platforms as a quasi-natural experiment, utilizing the multi-period differences-in-differences (DID) method. Potential contributions are as follows: (1) This paper innovatively incorporates data elements into studying urban spatial structure and systematically examines the impact of PDA on urban spatial structure, expanding the analytical framework, thereby making up for a significant oversight in prior research. (2) The study delves deeply into the impact mechanisms of PDA on urban spatial structure and its heterogeneity. It helps to elucidate the intrinsic relationship between the two, enhancing our understanding of how PDA affects the differences in urban spatial structure among cities with varying characteristics. (3) From subjective and objective perspectives, this paper comprehensively considers the moderating effects of government intervention and regional competition. It is conducive to further identifying the effects of urban subjective and objective characteristics on the direct impact. Moreover, it provides valuable policy insights for optimizing urban spatial structure.
The remainder of this paper is organized as follows. Section 2 provides a literature review. Section 3 discusses policy background and theoretical analysis. Section 4 describes the model, variables and data. Section 5 analyzes empirical results. Section 6 conducts further analysis. Section 7 discusses the empirical and further results. Section 8 presents policy implications derived from the findings.
2. Literature Review
In recent years, PDA, as a crucial component of digital government construction, has garnered extensive attention within the academic community. Public data refers to data resources with public attributes, including government data and data related to public interests generated by enterprises and other market entities in their commercial activities [9]. Existing studies on PDA can be categorized into two primary groups, based on their methodologies. One group predominantly employs qualitative analyses to explore the theoretical origins [10,11], performance evaluation [12], and practical pathways of PDA [13]. The other group focuses on the specific impact effects of PDA, analyzing its role in anti-corruption governance [14], coordinated regional development [9], stock price fluctuations [15], corporate innovation [16], and municipal bond pricing [17]. These studies collectively demonstrate the fact that PDA can unlock significant economic and social value through data sharing and reuse.
Urban spatial structure is spatial manifestation of the relationships between urban socio-economic activities, physical environment, and other constituent elements. It primarily reflects spatial distribution and dynamics of different urban socio-economic elements (e.g., GDP, population, energy consumption, carbon emissions) and the interactive relationships among them [2]. Monocentricity and polycentricity are key dimensions for studying urban spatial structure [18], describing whether urban resource elements are concentrated in one area or dispersed across multiple areas [19]. The essential difference between the two is mainly reflected in different degrees of aggregation and aggregation patterns chosen in spatial development strategies [20]. Factors affecting urban spatial structure include natural endowments, economic levels, public services, and traffic conditions, which mainly affect the urban spatial pattern by changing the spatial distribution of population size and the economic scale within a specific region [5]. Most of the literature focuses on whether urban spatial structure should develop towards monocentric or polycentric development, but the conclusions of these studies on the same factors affecting spatial structure development are quite different. Additionally, due to data limitations and real problem complexity, the depth and breadth of research on influencing factors remain insufficient. Moreover, several studies have examined the externalities of urban polycentric spatial structure in terms of their economic, social, environmental and innovation performance. The underlying logic of these studies is the migration of economic and social development factors within regions, as well as the agglomeration effects of economies of scale on economy, society, and environment [21].
Among existing studies on public data and urban spatial structure, one of the most relevant strands of literature to this paper is the application of big data in urban governance [22]. This strand of literature covers two main areas: Firstly, the digital transformation of urban planning and management. In urban planning and management, PDA and the development of information and communication technologies, such as 5G and the Internet of Things, provide new perspectives and tools for optimizing urban spatial structure [23,24]. This type of research focuses on how public data can be used to optimize urban planning, including land use, transport planning, and the layout of public facilities [25,26]. These data help planners better understand trends and patterns of urban development, and make decision-making more scientific and forward-looking through digital means, such as big data analysis and simulation. For example, by analyzing traffic flow data, planners can design more efficient transport networks, reduce congestion and improve urban connectivity [27]. PDA also improves urban governance efficiency by enhancing effectiveness of public participation and policy evaluation through data sharing and increased transparency [28,29]. Secondly, the digital impact of economic development and social dynamics. PDA is crucial for understanding changes in urban economic growth, industrial distribution and labor markets. Such studies have analyzed how public data can reveal new trends in urban industrial distribution, and how it can promote economic efficiency and industrial upgrading by optimizing spatial structure. Meanwhile, public data have been used to investigate urban social issues, such as housing, poverty and inequality, which also affect urban spatial structure development [30]. Digital technologies, such as telecommuting and social networks, are transforming the spatial connectivity of social activities, allowing policymakers to more accurately identify and address social problems and promote social equity and inclusive growth [31].
Some shortcomings remain in existing studies. Firstly, existing studies focus on the economic and governance effects of PDA, and few explore them from the perspective of urban spatial structure. Secondly, while many studies focus on qualitative analyses and descriptive statistics, there is a notable lack of in-depth exploration into the causal relationship between PDA and urban spatial structure. Thirdly, although existing studies have explored the impact of data infrastructure on urban governance, there is still a lack of systematic research on the mechanisms through which PDA shapes urban polycentric spatial structure.
3. Policy Background and Theoretical Analysis
3.1. Policy Background
Recently, the Chinese government has increasingly emphasized PDA as a key strategy to enhance government transparency, promote social engagement and foster innovation. Since the report of the Regulations of the People’s Republic of China on the Openness of Government Information in 2015, PDA has become an important part of the government’s work. The core objective of this policy is to achieve the integration and sharing of data resources through establishing a unified open data platform, thereby improving government services efficiency and ability to respond to public needs. The policy reflects a shift in government functions from a single role of administrator to a diversified role of service provider and facilitator of social development, while meanwhile stimulating new impetus for social innovation and economic growth. Since Beijing and Shanghai pioneered the launch of government data platforms in 2012, the number of such platforms at the prefecture level and above has been steadily increasing. The content of PDA is relatively broad, including urban planning, transportation, the environment, the economy, and other fields, which is closely related to urban spatial structure optimization. The opening of urban planning data helps the public and research institutions to more accurately understand the dynamics of urban development, participate in urban planning discussions, and promote scientific and rational urban planning. The opening of traffic data provides support for traffic management and optimization of urban traffic network, which is of great significance in easing traffic congestion and improving urban operational efficiency. The opening of environmental data aids in monitoring and assessing the state of the urban ecological environment, and provides a basis for decision-making on sustainable urban development. PDA can provide information support for urban development and promote the rational allocation of resources and balanced development of urban functions.
3.2. Theoretical Analysis
Urban planning theory emphasizes the importance of a rational layout of urban spatial structure to enhance urban function and residents’ quality of life [32,33]. PDA provides rich information resources that enable urban planners to grasp the dynamics of urban development more accurately, so that they can better balance the development needs of different regions in their planning and promote the formation of urban polycentric structure [34]. Urban economic theory states that urban spatial structure, as a concentration of economic activities, significantly affects economic efficiency and growth [2,35]. By providing data on markets, transportation, and the environment, PDA can help optimize the allocation of resources and improve urban economic efficiency, which in turn affects urban spatial structure evolution [36]. Urban economic theory reveals how PDA reshapes spatial configuration by optimizing resource allocation; urban planning theory, on the other hand, elucidates how institutional arrangements such as zoning, investment, and governance influence research outcomes. The two complement each other, explaining both the general effects and the heterogeneous effects of homogeneous policies. Therefore, this paper chooses to combine urban planning theory and urban economic theory, to construct the theoretical analytical framework.
The direct impact effects of PDA are reflected in the following aspects (Figure 1). Firstly, PDA enhances the transparency of urban governance and makes government decision-making more scientific and democratic, which helps to build a fairer and more inclusive urban spatial structure [26]. Secondly, PDA facilitates the optimization of urban transport and infrastructure by providing data on traffic flow and infrastructure conditions. This helps to alleviate traffic congestion and improve urban operational efficiency, which is directly related to the accessibility and attractiveness of urban polycentric structure [37]. Furthermore, PDA supports urban environmental monitoring and management, which helps to improve urban environment quality and enhance urban sustainability through data disclosure on environmental quality and pollution sources [36]. Finally, PDA may also provide new impetus for urban polycentric development by promoting urban innovation and economic development, especially in the fields of information technology and the green economy [34]. Based on these, the hypothesis is proposed:
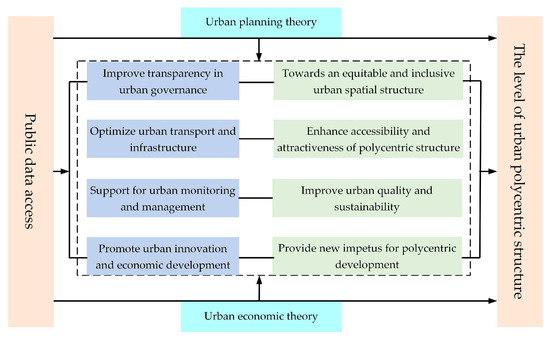
Figure 1.
Mechanism diagram of the direct effects.
H1.
PDA is conducive to promoting urban polycentric spatial development.
This paper analyses the specific impact from the two perspectives of the radicalizing effect of the information process and the upgrading effect of industrial structure (Figure 2).
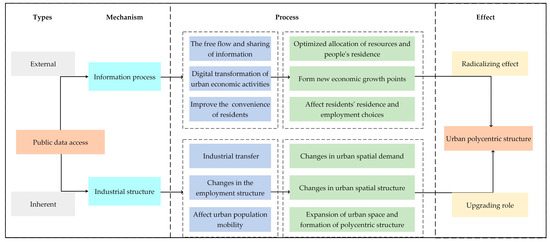
Figure 2.
Mechanism diagram of indirect effects.
Radicalizing effect of the information process. Firstly, PDA can promote the free flow and sharing of information and improve the transparency and efficiency of urban governance. This openness and circulation of information makes the links between urban regions closer, which is conducive to resource optimal allocation and the rational distribution of urban functions [24]. Secondly, the acceleration of the information process promotes digital transformation of urban economic activities. Rapid development of new industries and services, particularly high-tech and creative industries, tends to cluster in urban centers or sub-centers, forming new economic growth points [38]. The spatial agglomeration of these new economic activities promotes the diversified development of the urban economy, and pushes transformation of urban spatial structure to the polycentric pattern. Finally, the information process also affects urban spatial structure evolution by improving life quality and convenience for residents, thereby affecting their choices of residence and employment.
Upgrading role of industrial structure. With upgrading of industrial structure, the focus of urban economic activities has shifted from traditional manufacturing to service and high-tech industries [39]. This shift has led to changes in urban spatial demand, with service and high-tech industries often requiring more office space and commercial facilities, which tend to cluster in city centers or areas with convenient transportation [40]. The upgrading of industrial structure has also brought about changes in the employment structure, with the highly skilled labor force demanding a higher level of living and working environments, leading to the development of urban spatial structure in a more humane and ecological direction [41]. Additionally, upgrading of industrial structure indirectly affects urban spatial structure evolution by influencing urban economy growth and population flow. With the optimization and upgrading of industrial structure, urban economy growth attracts more population inflow, and the demand for residence and employment for this new population further promotes urban space expansion and polycentric structure formation [42]. Based on these, the hypothesis is proposed:
H2.
PDA can promote urban polycentric spatial structure development through the radicalizing effect of the information process and the upgrading effect of industrial structure.
4. Method
4.1. Model Construction
This paper applies the DID model to control for temporal and individual differences of the research object before and after the implementation of PDA. The empirical model is as follows:
where, represents the city, and represents the year. is urban spatial structure. is the virtual variable of public data access. represents control variables. is urban fixed effect (FE), and is the year fixed effect. is the random perturbation term.
4.2. Variable Selection
The dependent variable is the urban polycentric spatial structure index (Poly). Urban spatial structure is a complex system encompassing multiple dimensions such as physical entities, socio-economic characteristics, and functional relationships. It describes the spatial distribution and interactions of various elements within a city, thereby integrating its different subsystems into a coordinated and cohesive whole [43]. This structure not only focuses on the spatial layout of physical entities such as buildings, roads, and public facilities, but also encompasses the socio-economic characteristics of different urban areas, such as income levels, educational attainment, and occupational distribution. The spatial distribution of these characteristics reveals the socio-economic disparities within a city. Additionally, the urban spatial structure includes functional connections and interactions between regions, such as transportation links, economic dependencies, and information exchange. The spatial manifestations of these connections reveal urban functional organization and operational patterns [44]. The urban multi-centered structure emphasizes the existence of multiple functional centers within the city, which significantly exceed surrounding areas in terms of population, employment, commercial activity, and construction density, reflecting the urban pattern of functional zone distribution [45]. This multi-centered structure is a key phenomenon in the urbanization process, reflecting the complexity and diversity of urban spatial organization and functional layout, and is influenced by factors such as economic development, population distribution, transportation networks, and policy guidance. The combined effects of these factors have driven the transformation of urban space from a single-center to a multi-center structure, optimizing urban functional layout and enhancing urban operational efficiency and sustainability. Within this structure, the competition and cooperation among different functional centers, as well as their connections with peripheral urban areas, collectively shape urban spatial form and developmental trends.
Population density is a key indicator for measuring urban spatial structure. It is directly related to residents’ needs for living, working, education, and entertainment, and reflects the operational patterns of urban functional zones. Areas with high population density are typically also areas where economic activities are concentrated, marking the functional centers of a city. Therefore, analyzing population density and its aggregated areas is crucial for revealing the actual operation of urban functional zones. This study selects population density as a measure of urban multi-center structure because population data is easily accessible, and there is a wealth of existing research supporting the close relationship between population density and the distribution of urban functional zones. Additionally, this measurement method has significant practical application value in urban planning and policy-making, aiding urban planners and decision-makers in more accurately understanding the operation of urban functional zones, optimizing public service and infrastructure planning, enhancing urban operational efficiency, promoting balanced urban development, and strengthening urban sustainability. Therefore, this paper mainly conducts a quantitative analysis of urban spatial structure from a morphological perspective based on population data. Referring to Chen et al. [45], in this paper, the city center is defined as an area whose population density is significantly higher than other areas and where a sufficient continuous area exists.
This study uses LandScan population data (https://landscan.ornl.gov) to identify and extract urban centers. This is a global source of high-resolution population distribution data that provides detailed information on regional population distribution. The selection of this data source helps improve the accuracy and reliability of urban center identification. The specific operational steps are as follows: First, for raster datasets from different years, the relative minimum threshold method is applied, with 90% of the maximum population density of each city serving as the minimum threshold for identifying urban centers [43,46]. This threshold selection ensures that the identified urban center areas have a significant advantage in population density, thereby representing the regions where economic and social activities are most concentrated within the city. By setting the 90% maximum population density as the threshold, we can exclude areas with relatively low population density that may not exhibit urban center characteristics. Second, a further screening is conducted using criteria based on area and population. To enhance identification accuracy, considering the scale of urban centers and population size, areas exceeding 1 square kilometer in area and 10,000 in population are selected as valid urban population-center regions. Such criteria help ensure that the identified regions not only have a population density advantage, but are also sufficiently large in scale to significantly influence urban overall development. Finally, the polycentric index is used to quantify urban polycentric structure [44,45]. When calculating the polycentric index, not only is the standard deviation of the “importance” of different centers within the city considered, but the maximum standard deviation of the “importance” of two centers is also introduced, enabling the polycentric index to more accurately reflect the distribution characteristics of urban centers. The specific calculation formula is as follows:
The larger the value of Poly is, the more balanced the distribution of the urban center is; and the smaller value indicates that the urban center is concentrated in a certain area. is the standard deviation between the “importance” of different centers within the city. is the standard deviation of the assumed “importance” of two centers. A visual presentation of the Poly index for partial years is shown in Figure 3.
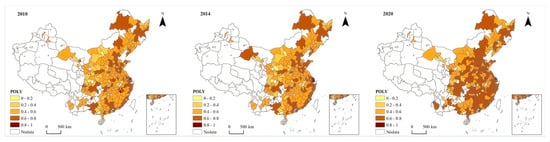
Figure 3.
Visual presentation of urban polycentric spatial structure index.
The core explanatory variable is public data access (PDA). This study adopts the launch of government data platforms as an exogenous shock to measure public data openness. Referring to Fang et al. [9] and Han et al. [47], the online launch dates of public data platforms are collected and collated. When the city i launched government data platform in t year, take 1; otherwise, take 0. We conducted three steps for data collection: (1) Local government-driven public data platforms must have URLs containing “gov.cn” and be centralized unified platforms aggregating data from multiple government departments. Independent non-centralized platforms built by other local government departments were excluded. (2) We manually searched search engines like Baidu, using combinations of city names with keywords such as “data openness”, “data resources”, and “public data” to obtain their initial launch dates. (3) After manual screening of public data platforms according to predefined criteria, cross-verified data from Fudan University’s Digital and Mobile Governance Lab’s “China Local Government Data Openness Report (Cities)” and Central China Normal University’s School of Information Management’s “Research Report on Government Open Data Utilization in China” yielded the initial launch dates of urban public data platforms between 2010 and 2021.
Referring to Liu et al. [21], we select the following variables for control: (1) economic development level (Gdp), measured by the logarithmic value of per capita GDP. (2) Tertiary industry contribution ratio (Ticr), measured by the proportion of the value-added of tertiary industry to GDP. (3) Financial development level (Finance), measured by the year-end loan balance of financial institutions as a percentage of GDP. (4) Internet development level (Internet), measured by the number of Internet broadband subscribers per 100 people. (5) Level of government intervention (Gov), measured by the share of total local fiscal expenditures as a percentage of GDP. (6) Population density (People), measured by the number of people per unit of land area.
4.3. Data Description
This paper excludes the samples of cities with serious administrative division adjustments and missing data, and finally selects panel data of 271 prefecture-level cities from 2010–2021, totaling 3252 research samples. The raw data mainly come from the China Urban Statistical Yearbook, the China Regional Statistical Yearbook, and statistical yearbooks of provinces. The moving average method is used to fill in individual missing data for individual cities. Additionally, data on price-related indicators are all after price deflations. Table 1 shows descriptive statistics of variables.

Table 1.
Descriptive statistics of variables.
5. Empirical Results
5.1. Basic Regression
In Table 2, the coefficient of PDA in columns (1)–(7) exhibits a marked positive sign, thus substantiating the notion that PDA plays a pivotal role in promoting urban multi-center development. Furthermore, it is evident that the digital construction of government data platforms serves as a pivotal conduit in guiding urban multi-center spatial layout, thereby validating research hypothesis H1.
Table 2.
Results of basic regression.
5.2. Robustness Test
(1) Parallel trend test. Referring to Fang et al. [9], we use the event research method for parallel trend test. The model is set up as follows:
where denotes the time dummy variable for PDA in year within the time window. Figure 4 reports that there is no significant difference in urban spatial structure between the treatment and control groups before the launch. After the launch, the index of urban polycentric spatial structure is significantly higher than that of the control group, verifying the parallel trend hypothesis of the basic regression. And the increasing trend of indicates that PDA has a long-term temporal dynamic effect, and that this effect increases with time.
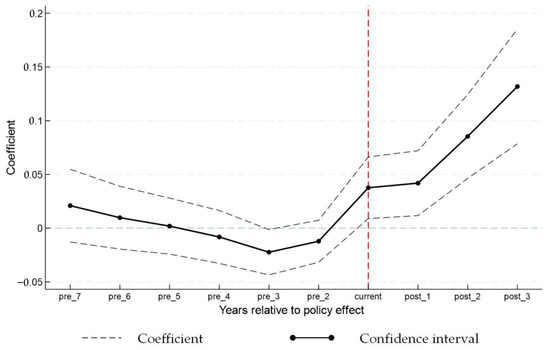
Figure 4.
Parallel trend test.
(2) Placebo test. We conduct 500 random sampling regression on the city and the launch time of the government data platform. In Figure 5, the kernel density of estimated coefficients approximates a normal distribution with a mean of 0. The p-values of the vast majority of the estimated coefficients are greater than the 10% significance level of 0.1, and none exceed basic regression coefficient of 0.0251. The conclusion passes the placebo test and is not driven by random factors.
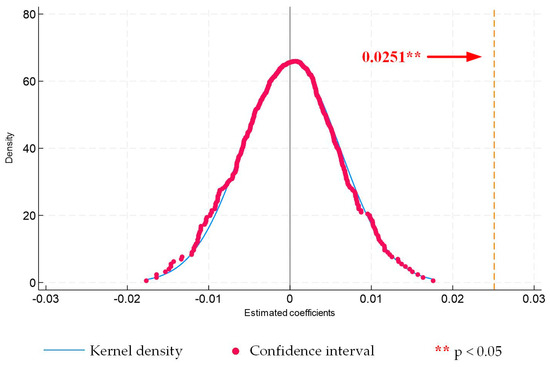
Figure 5.
Placebo test.
(3) Test for heterogeneity of treatment effects. When using the multi-period DID model for policy effect estimation, the different timing of policy shocks in multiple treatment groups may produce heterogeneous treatment effects, leading to serious bias in the estimates after weighted average treatment [48]. To address this issue, this paper draws on Goodman-Bacon [49] to identify bias sources and interference extent from heterogeneous treatment effects. This is achieved by decomposing the two-way fixed effects estimator into three sets of 2 × 2-DID estimators and calculating the average treatment effects and weights for each set separately. Figure 6 reports the results of the heterogeneous treatment-effect test, based on the Goodman-Bacon decomposition method. The results show that the combined overall weight of the 2 × 2-DID estimates with cities that entered the public data access pilot later, and never entered the public data access pilot as the control group is 97.79%, while only the 2 × 2-DID estimates with an overall weight of 2.21% have cities that entered the public data access pilot earlier, as the control group. This indicates that the heterogeneity degree of the treatment effects used in this paper is small, and does not significantly affect the results of basic regressions, strengthening the reliability of basic conclusions of this paper.
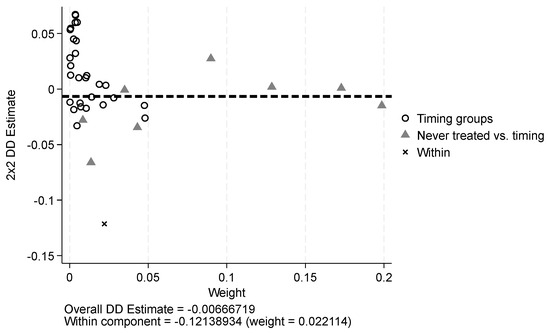
Figure 6.
Results of Goodman-Bacon decomposition.
(4) Excluded confounding policy shocks. This paper manually collects policies that are more similar to PDA for testing. The related policies mainly include Smart City (SMART), Information Benefits the People (INFO), Broadband China (BROADBAND), Power Sector Reform (POWER), and administrative reform (Data on administrative division changes includes county-to-district conversions, county-to-city reorganizations, provincial-level county administration, and newly established prefecture-level cities during the study period. The original data was sourced from the National Administrative Division Information Inquiry Platform provided by the Ministry of Civil Affairs) (ADMINISTRATIVE) pilots. Table 3 shows that the estimated coefficients of the remaining strategies, except PDA, are insignificant. Thus, it suggests that the pilot shock selected in this paper to bring the government data platform online is unique and relatively exogenous, and the findings are not affected by the remaining confounding policy factors.
Table 3.
Result of excluding confounding policy shocks.
(5) Instrumental variables. To mitigate the potential endogeneity problem, we adopt the instrumental variable (IV) method. On the one hand, the IV1 is defined as the inverse of the mean of the distances from the coastline of all municipal party secretaries’ domicile cities in each city. The correlation in instrumental variables stems from the potential influence of municipal party secretaries’ hometown characteristics on their support for public data openness policies, as personal backgrounds may correlate with policy preferences. Exogeneity is ensured by the historical fixed nature of these hometown characteristics, which were established prior to policy implementation and are unlikely to be inversely affected by urban spatial structures. This guarantees the independence between instrumental variables and error terms, making them suitable for estimating the impact of public data openness on urban spatial structure. The domicile characteristics of successive municipal party secretaries in each city from 1985 to 2009 (before the launch of the urban public open data platform) are manually collected [50]. It is important to note that the domicile characteristics of municipal party secretaries prior to 2009 are cross-sectional data, which poses a challenge in their direct utilization as IV1 for panel data. The cross-multiplier term between the number of internet broadband-access subscribers per 100 people and the domicile characteristics of pre-2010 municipal party secretaries is adopted as the IV1 [51]. To alleviate potential endogeneity, the two-stage least squares method is employed. In columns (1) and (2) of Table 4, the p-value of the under-identification test is 0.0001, rejecting the hypothesis of non-identification. The Cragg–Donald Wald F value of 86.0820 exceeds the commonly accepted rule of thumb of 10 and surpasses the Stock–Yogo 10% threshold for weak IV1 of 16.38, indicating that the problem of weak IV1 in this paper is less significant. The regression coefficient of PDA is significantly positive, indicating that basic conclusions remain robust.
Table 4.
Results of instrumental variables.
On the other hand, this study references Bosker and Buringh’s [52] research, using the ratio of river density to exchange rate (IV2) as the core instrumental variable derived from geographical feature data. (The original data of river density should be extracted according to the vector map of rivers provided by the National Geographic Information Center. River density = river length/area). Regarding river density, correlation analysis reveals that cities with higher river density typically encounter complex challenges in managing water resources, conserving ecosystems, and controlling floods. To address these challenges, there is a need for increased transparency in public data concerning water resource monitoring, water environment governance, and urban drainage systems. This enhanced data openness is crucial for supporting sustainable urban development and enhancing the quality of life for residents, especially prior to the establishment of government data platforms. This establishes a positive correlation between river density and public data openness. Externally, river density is primarily determined by a city’s natural geographical conditions—a long-formed characteristic—without direct causal relationship with urban spatial structure, thus meeting the exogeneity requirement for instrumental variables. Considering this geographical feature variable as cross-sectional data, this study employs the ratio of river density to exchange rate (IV2) as an instrumental variable for instrumental variable regression, to align with panel data. As shown in columns (3) and (4) of Table 4, the under-identification test and Cragg–Donald Wald F statistics confirm compliance with instrumental-variable selection criteria, with estimated coefficients of IV2 being significantly positive, consistent with theoretical expectations.
Regarding the exogeneity issue of IV, exclusion of endogeneity is challenging to verify, as the disturbance term is inherently unobservable. Conley et al. [53] introduced a novel method termed “reasonable exogenous instrumental variable estimation,” which replaces strict exclusion of endogeneity by assuming that instrumental variables exert a certain influence on the dependent variable. Parameters are constrained within specific ranges or prior distributions, and confidence intervals for regression coefficients are constructed using prior information about these parameters to assess the robustness of estimates under incomplete exogeneity. This study references Huang et al. [54], and employs the Local-to-Zero (LTZ) method proposed by Conley et al. [53], for estimation. Results in columns (1)–(6) of Table 5 demonstrate that findings based on “reasonable exogenous instrumental variable estimation” align with previous conclusions.
Table 5.
Results of IV robustness.
(6) Additional controls for other factors. Given the established correlations between educational attainment, digital literacy, and urban governance quality with this study, these three indicators were incorporated as control variables. Educational level was measured using human capital metrics, calculated as the ratio of regular university students to total population at year-end. Digital literacy was assessed using Peking University’s “Digital Financial Inclusion City Index”, developed by its Digital Finance Research Center. Urban governance quality was evaluated through the Government Transparency Index, published by Tsinghua University. The results in column (1) of Table 6 show that the results are still robust.
Table 6.
Results of adding other control variables and replacing the core explanatory variables.
(7) Replace core explanatory variables. Firstly, the method of identifying urban areas is changed. Based on LandScan data, the exploratory spatial data analysis method is used to identify urban areas [55]. A spatial weight matrix is constructed, based on vertex principles, with local Moran indices calculated to screen out grids showing spatial lag values of population density above average. Adjacent grids are merged into polygons according to vertex adjacency rules, with the polygon containing the most population designated as the main urban area. Final urban areas are identified using the criteria of area exceeding 1 km2 and total population surpassing 50,000. Secondly, referring to Li [56], we use consumer-service and public-service POI data, and use kernel density estimation to measure the multi-center agglomeration service-facility index. The results in Table 6 demonstrate that replacing core explanatory variables maintains robust results.
(8) Other robust tests. This paper also adopts the following methods for robust test. Adjust the research sample: to verify the robustness of research results, the sample of municipalities is excluded for regression. Remove outlier effects: this paper shrinks all variables in the basic regression, except the disposal variable, by 1%. Consider province–time interaction fixed effects: this paper adds province–time interaction fixed effects to basic regressions. Table 7 indicates that the basic conclusion that “PDA is conducive to promoting urban polycentric development” is still valid.
Table 7.
Results of other robust tests.
5.3. Mechanistic Analysis
The intensified effect of the information process. Referring to Wen and Zhong [57], we use the entropy weight method to calculate the digital infrastructure index, which is then employed as a proxy indicator for the information process. Based on the average value in the sample period, this paper divides the research sample into the high group and low group of the information process. The coefficients of PDA in Table 8 indicate that the effect of PDA in promoting urban polycentric development is stronger in the context of a better information process. This confirms the mechanism through which PDA promotes urban polycentric development by the radicalization effect of the information process.
Table 8.
Results of mechanistic analysis.
The driving role of industrial structure upgrading. Referring to Gan et al. [58] and Zhao et al. [59], we adopt the ratio of the tertiary industry’s added value to that of the secondary industry as a proxy indicator of industrial structure upgrading. Based on the average value in the sample period, this paper divides the research sample into high and low groups of industrial structure upgrading. The coefficients of PDA in Table 8 indicate that the effect of PDA in promoting urban polycentric development is stronger in the context of higher levels of industrial structural upgrading. It confirms the mechanism that PDA promotes urban polycentric development through the upgrading effect of industrial structure.
6. Further Analysis
6.1. Heterogeneity Analysis
(1) City size. City size is directly related to urban economic strength, resource allocation, and technological development level. There are significant differences among cities of varying sizes, which may affect the impact between the two. Referring to Han et al. [47], we categorize city size based on population size, with whether or not the population exceeded 3 million at the end of the year prior to the policy implementation was used as the criterion for classifying large and small cities. Table 9 indicates that PDA significantly promotes polycentric development in large cities, but not in small cities. Large cities show a stronger role in promoting PDA and polycentric development, due to their advantages in economic scale, policy support, resource endowment, and technological progress. These cities can effectively share the fixed costs of PDA, and leverage their superior economic and technological conditions to promote the information process, leading to more effective technological progress and structural upgrading, thereby facilitating the formation and development of polycentric spatial structures. In contrast, small cities may struggle to fully realize the potential of PDA, due to limitations in resources and technological capabilities, thus affecting the evolution of their spatial structures.
Table 9.
Results of heterogeneity test.
(2) Urban agglomeration effect. Cities within urban agglomerations have comparative advantages over cities not within urban agglomeration, in terms of resource endowment, policy support, and other core elements, which play an important role in both PDA and urban multi-center development. This may result in heterogeneity regarding the impact of PDA on urban spatial structure. The subsequent analysis will be divided into two groups, depending on whether the city is located within urban agglomerations or outside them. Table 9 shows that PDA significantly promotes urban polycentric development located within urban agglomerations, while the promotion effect on the cities located outside urban agglomerations is not significant. The form of urban agglomerations is essentially a development pattern that is formed under the guidance of the market and policies, after a certain degree of urban agglomeration and urban development. Compared to non-agglomeration cities, cities within agglomerations may have more advantages or basic conditions to implement a polycentric development mode. They benefit from economies of scale, can effectively share the fixed costs of open data access, and leverage their superior economic and technological conditions to advance the information process. This leads to more effective technological progress and structural upgrading, thereby more effectively promoting urban polycentric development.
(3) Regional factor endowment. The Hu Huanyong Line delineates the significant difference in population density between Chinese eastern and western regions, and is also an important demarcation line between natural geography and ecology, as well as the imbalance in economic and social development between the east and west. The two sides of this demarcation line have very different economic development situations, with the southeast of the demarcation line being densely populated, with a solid economic foundation and a strong productivity level, while the opposite is true for northwest of the demarcation line. The agglomeration of factors in cities located in different zones may have different impacts on urban spatial structure. Based on urban geographical location, the sample is divided into two groups: cities on the northwest side of the Hu Huanyong Line and cities on the southeast side. Table 9 shows that PDA significantly contributes to urban polycentric development on the southeast side of the Hu Huanyong Line, while its enhancement effect on cities on the northwest side is not significant. Compared with cities on the northwest side of the Hu Huanyong Line, cities on the southeast side have relatively well-developed infrastructures and operational systems, which can better support the independent innovation of information technology and promote urban polycentric development. These cities also have a certain comparative advantage in terms of economic and industrial base, which can better stimulate market vitality and promote urban multi-center development.
(4) Heterogeneous differences in urban polycentric spatial structure. We adopt quantile regression to further analyze asymmetric effects of PDA on urban spatial structure under varying urban spatial configurations [60]. This approach captures the differentiated impacts across different stages of urban polycentric development, thereby revealing the varied roles that PDA plays at different levels of urban spatial structure. In Figure 7, the upgrading effect of PDA on urban polycentric spatial structure exhibits a similar inverted ‘N’-shaped trend. This trend may stem from the stage-specific characteristics of urban development: in the early stage of urbanization, due to inadequate infrastructure and technological capabilities, the benefits of PDA have not yet fully emerged, resulting in weaker promotion of polycentric spatial structure. As cities enter the middle stage of development and the urban polycentricity index is located in the (0.5, 0.75) range, PDA starts to show more obvious positive effects. This is because cities have already possessed better infrastructure and data processing capabilities, and are able to make effective use of public data to optimize resource allocation and enhance service efficiency. However, as cities become more polycentric, a saturation effect may occur, where the marginal benefits of PDA diminish, or other challenges faced by cities, such as environmental issues and social inequality, begin to offset the positive effects, leading to a weakening of PDA’s contribution to urban polycentric spatial structure. This changing trend highlights the role and challenges of PDA at different stages of urban development and the need for urban policies and planning to adapt to these evolving stages of urban development, so as to maximize the benefits of PDA.
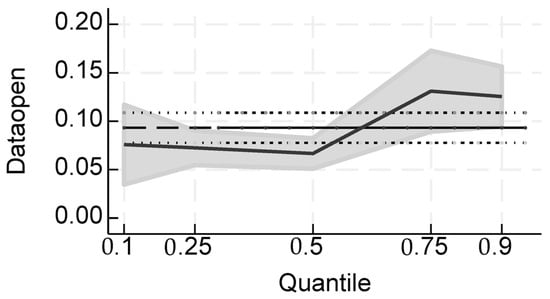
Figure 7.
Heterogeneity of urban polycentric spatial structure. Note: In the horizontal dashed line section of the Figure 7, the middle horizontal dashed line represents the OLS estimated coefficient. Because the OLS coefficient is fixed, the graph is horizontal. The middle horizontal line between the upper and lower days represents the 95% confidence interval of the OLS estimate.
6.2. Extensiveness Analysis
(1) Government intervention effect. In China, the influence of local governments on urban spatial structure cannot be ignored. In particular, fiscal decentralization and local “GDP tournaments” have increased the incentives for local governments to intervene in urban spatial structure. Therefore, this paper further examines whether government intervention can modulate the effect between the two. Referring to Nie et al. [61], we adopt the proportion of local government’s general fiscal expenditure for GDP (Gov) as a measure of the intensity of government intervention. The coefficients of Gov*PDA are significantly positive in Table 10. This indicates that as the intensity of government intervention increases, the promotional effect of PDA on urban multi-spatial development is higher. An increase in the intensity of government intervention can lead to more timely and detailed information disclosure by the government, which can help the efficient circulation and utilization of public data elements and have a positive impact on urban polycentric development.
Table 10.
Results of extended analysis.
(2) Regional competition effect. Due to geographic proximity and the same administrative affiliation, cities within the same province inevitably experience competitive and learning effects, which influence the extent to which local governments plan and prioritize their urban development strategies. In view of this, this paper further tests whether the competition effect among local governments moderates the effect between the two. Referring to Ling et al. [62], we adopt the mean value of the spatial structure index of other cities in the same province, other than the local city, to measure the regional competition indicator (Com) of the local government’s development model. For municipalities, the regional competition indicator is measured by the mean value of the spatial structure index of the remaining three municipalities. The coefficient of Com*PDA in Table 10 is significantly positive. As regional competition’s intensity increases, the promotional effect of PDA on urban multi-spatial development is higher; i.e., regional competition positively moderates the enhancement effect of PDA on urban multi-spatial development. This result aligns with theoretical expectation that, due to neighborhood and benchmark effects, as the index of other cities in the same province improves, the local urban spatial structure index will also improve, thereby increasing the effect of PDA in enhancing urban spatial structure.
7. Discussion
This study focuses on the impact of PDA on urban spatial structure, and reveals that PDA significantly promotes multi-centered urban development. This conclusion has far-reaching implications for urban planning and digital governance theory. In the field of urban planning, multi-centered structure is considered an effective approach for optimizing urban functional layout, enhancing urban operational efficiency, and alleviating urban issues such as traffic congestion and environmental pollution. This study demonstrates, through empirical analysis, that PDA significantly promotes the development of a multi-centered urban structure by enhancing information circulation efficiency and driving industrial upgrading. This finding not only provides urban planners with new insights into leveraging public data openness to promote balanced urban spatial development, but also offers a new perspective for urban planning theory, emphasizing the crucial role of digital technology in optimizing urban spatial layout. Within the framework of digital governance theory, this finding further validates the pivotal role of digital technology in enhancing urban governance capabilities. Digital governance emphasizes enhancing the transparency of government decision-making and public participation through information technology. The implementation of PDA not only promotes information flow, but also optimizes urban spatial planning through data-driven decision support systems. This conclusion provides new empirical evidence for digital governance theory, indicating that PDA is not only a tool for governance innovation, but also an important means of spatial planning, which is consistent with the research of Fan et al. [63].
Our finding prompts a deeper dialogue with the existing literature. On one hand, numerous studies emphasize the positive impacts of digital technology on urban development, such as enhancing urban efficiency, promoting innovation, and driving economic growth. On the other hand, some studies point out that the digital divide may exacerbate spatial inequality, particularly in regions with unequal resource distribution. The findings of this study do not contradict these studies, but rather offer a more comprehensive perspective: while PDA promotes multi-centered development, it may also produce heterogeneous effects, due to differences in urban scale and regional characteristics. The heterogeneity analysis in this study indicates that PDA is more effective in large cities and urban agglomerations, which may be related to resource concentration and policy support in these regions. This suggests that we need to fully consider urban scale and regional context when formulating policies, to avoid further widening the digital divide. The heterogeneity analysis further reveals an inverted ‘N’-shaped relationship between PDA and urban multi-center structure, meaning that PDA’s promotional effect is most pronounced when the multi-center index ranges between 0.50 and 0.75. This finding highlights the non-linear patterns of urban development, indicating that within a certain range, PDA can effectively promote the multi-centralization of urban space, but, beyond a certain threshold, its promotional effect may weaken, or even reverse. This suggests that urban planners should consider the dynamic changes in urban spatial structure when formulating policies, to avoid excessive concentration or dispersion. In this way, this study not only enriches the existing literature, but also provides comprehensive insights into how to effectively utilize PDA in different urban contexts.
Mechanism analysis results indicate that PDA influences urban polycentric structure through two main channels: radicalization of information processes and industrial upgrading. In the real world, these mechanisms correspond to specific urban development phenomena. For example, the radicalization of information processes reduces the cost of information circulation within cities by improving digital infrastructure, thereby promoting coordinated development between different regions. This phenomenon has been widely studied in the field of smart cities, emphasizing the key role of digital technology in improving urban operational efficiency. Industrial upgrading, on the other hand, drives the optimization and polycentricization of urban space by attracting high-end industries and innovative resources. This phenomenon has been thoroughly discussed in urban economic geography, highlighting the importance of industrial agglomeration economics in shaping urban spatial patterns. For example, many large cities have achieved multi-centered development of urban space by developing high-tech industries and innovation parks. These phenomena indicate that PDA is not only a digital governance tool, but also an important means of promoting industrial upgrading and spatial optimization in cities, providing specific policy recommendations for urban planners and policymakers. Additionally, extended analysis indicates that government intervention and regional competition moderate the impact of PDA on urban polycentric structure, to some extent. This suggests that the policy environment and inter-regional competitive dynamics significantly influence the spatial benefits of open data. This finding further underscores the importance of the policy environment in urban planning, prompting policymakers to comprehensively consider the implementation effects of policies and inter-regional competition and cooperation, when promoting public data openness.
8. Conclusions and Policy Implications
8.1. Conclusions
This study systematically examines the impact and mechanism of PDA on urban spatial structure. The findings show that PDA positively promotes urban polycentric development, and this conclusion still holds after robust tests. The positive impact is more significant in large cities, cities within urban agglomerations, and cities with abundant regional factor endowments. The effect of PDA on urban polycentric spatial structure shows an inverted ‘N’-shaped trend, and there exists an optimization interval; i.e., the polycentricity index is between 0.5 and 0.75. Mechanism analysis shows that the radicalization of the information process and the upgrading of industrial structure are two effective mechanisms. Expansive analysis shows that government intervention and regional competition have a positive moderating effect between the two. This study provides empirical support for further promoting the public data openness policy, and offers important policy insights for optimizing urban spatial patterns and promoting sustainable urban development. Meanwhile, the results are of great significance for other countries in optimizing urban spatial structure and formulating public data access policy, providing new perspectives and strategies for global urban sustainability.
8.2. Policy Recommendations
Firstly, it is crucial to enhance the integration of PDA with urban planning. Urban planning agencies should collaborate closely with data management entities to synchronize the advancement of PDA and urban spatial planning. By leveraging the integration of public data resources, urban development needs can be more precisely evaluated, resource allocation can be optimized, and the evolution of urban polycentric structures can be facilitated. Secondly, implement differentiated public data access strategies. Policymakers are advised to devise tailored public-data access strategies that align with the specific conditions and requirements of cities. For large cities and cities within urban agglomerations, efforts should be made to promote data access to urban support polycentric development, while for small cities, policies should prioritize improving data infrastructure and data utilization capabilities to progressively maximize the benefits of PDA. For cities with a high multi-center index (e.g., greater than 0.75), the policy focus should shift from simply accessing more data to solving bottlenecks in data utilization, such as improving data analysis capabilities and addressing new challenges arising from data saturation. Thirdly, policies should encourage the synergistic development of PDA and urban innovation, particularly in information processing and industrial structure upgrading. The government could establish a dedicated fund to support innovative projects based on public data, as a strategic way to promote urban polycentric development. Policies should encourage the combination of public data and industrial upgrading planning, and use data to guide high-tech industries to be laid out in urban sub-centers.
8.3. Future Research
This study has several limitations, which remain. Firstly, we adopt “government data platform launch” as a binary dummy variable, to represent “public data access”, which constitutes a significant oversimplification. There is often a considerable gap between the nominal availability of data on a platform and its actual accessibility and usability for the public. Future research, as data acquisition channels become increasingly accessible, can focus more on data availability, using API call volumes, download logs, or crowd-sourced availability scores to construct continuous, multidimensional openness indices, thereby more accurately depicting the real impact of data volume, timeliness, machine readability, and user feedback on spatial structures. Secondly, the scope of the research is limited to Chinese cities, which may restrict the universality of the conclusions. Future research could be expanded to include urban environments in different countries and cultural contexts, exploring cross-national comparisons of experiences across countries. Thirdly, while this study considers the heterogeneity in city size and regional characteristics, further exploration is needed to analyze additional factors that could impact the benefits of PDA, such as socio-economic structures and residents’ behavioral patterns.
Author Contributions
Conceptualization, L.W. and F.Z.; methodology, L.W. and P.L.; software, P.L. and N.H.; writing—original draft preparation, P.L.; writing—review and editing, F.Z. and N.H.; data curation, N.H. and D.Z.; supervision, D.Z.; funding acquisition, F.Z. All authors have read and agreed to the published version of the manuscript.
Funding
This research was supported by the National Natural Science Foundation of China Special Project on “the Impact, Mechanism, and Countermeasures of Digital Economy Transformation on the Inclusive Finance System” (Grant 72341031), the Open Research Program of the International Research Center of Big Data for Sustainable Development Goals (Grant No. CBAS2023ORP04); the Key Laboratory of Ecology and Environment in Minority Areas (Minzu University of China), National Ethnic Affairs Commission (KLEEMA202306); and the Fundamental Research Funds for the Central Universities (2024JCYJ11).
Data Availability Statement
The raw data supporting the conclusions of this article will be made available by the authors on request.
Conflicts of Interest
The authors declare no conflicts of interest.
References
- Liu, X.; Xia, H. Networking and sustainable development of urban spatial planning: Influence of rail transit. Sustain. Cities Soc. 2023, 99, 104865. [Google Scholar] [CrossRef]
- Zhuang, Z.; Han, F. Urban spatial structure and firm growth: Evidence from China. Land Use Policy 2024, 145, 107278. [Google Scholar] [CrossRef]
- Wu, Y.; Luo, J.; Zhang, X.; Skitmore, M. Urban growth dilemmas and solutions in China: Looking forward to 2030. Habitat Int. 2016, 56, 42–51. [Google Scholar] [CrossRef]
- Li, Y. Towards concentration and decentralization: The evolution of urban spatial structure of Chinese cities, 2001–2016. Comput. Environ. Urban Syst. 2020, 80, 101425. [Google Scholar] [CrossRef]
- He, X.; Zhou, Y. Urban spatial growth and driving mechanisms under different urban morphologies: An empirical analysis of 287 Chinese cities. Landsc. Urban Plan. 2024, 248, 105096. [Google Scholar] [CrossRef]
- Fang, J.; Zhao, L.; Li, S. Exploring open government data ecosystems across data, information, and business. Gov. Inf. Q. 2024, 41, 101934. [Google Scholar] [CrossRef]
- Wang, R.; Xu, C.K.; Wu, X. Open Government Data (OGD) as a catalyst for smart city development: Empirical evidence from Chinese cities. Gov. Inf. Q. 2024, 41, 101983. [Google Scholar] [CrossRef]
- Chen, X.; Hu, M. Identifying factors and configurations influencing the effectiveness of government data openness in China based on fsQCA. Data Inf. Manag. 2024, 9, 100071. [Google Scholar] [CrossRef]
- Fang, J.; Liu, Y.; Gao, H.; Dong, J.; Lv, B. Does Public Data Access Promote Regional Harmonious Development? On a Quasi-natural Experiment of Government Data Platform Access. J. Manag. World 2023, 39, 124–142. (In Chinese) [Google Scholar]
- Overton, M.; Larson, S.; Carlson, L.; Kleinschmit, S. Public data primacy: The changing landscape of public service delivery as big data gets bigger. Glob. Public Policy Gov. 2022, 2, 381–399. [Google Scholar] [CrossRef]
- Naeem, M.; Ozuem, W.; Howell, K.; Ranfagni, S. A Step-by-Step Process of Thematic Analysis to Develop a Conceptual Model in Qualitative Research. Int. J. Qual. Methods 2023, 22, 16094069231205789. [Google Scholar] [CrossRef]
- Schmidthuber, L.; Willems, J.; Krabina, B. Trust in Public Performance Information: The Effect of Data Accessibility and Data Source. Public Adm. Rev. 2023, 83, 279–295. [Google Scholar] [CrossRef]
- Yukhno, A.S. Digital Transformation: Exploring big data Governance in Public Administration. Public Organ. Rev. 2022, 1–15. [Google Scholar] [CrossRef]
- Park, C.; Kim, K. E-government as an Anti-Corruption Tool: Panel Data Analysis Across Countries. Int. Rev. Adm. Sci. 2020, 86, 691–707. [Google Scholar] [CrossRef]
- Du, J.; Gao, H.; Wen, H.; Ye, Y. Public data access and stock price synchronicity: Evidence from China. Econ. Model. 2024, 130, 106591. [Google Scholar] [CrossRef]
- Kazantsev, N.; Islam, N.; Zwiegelaar, J.; Brown, A.; Maull, R. Data sharing for business model innovation in platform ecosystems: From private data to public good. Technol. Forecast. Soc. Change 2023, 192, 122515. [Google Scholar] [CrossRef]
- Ouyang, Y.; Wang, Y.; Li, P.; Gao, H. Data factors and pricing chengtou bonds: A quasi-natural experiment based on open government data. J. World Econ. 2024, 2, 174–203. (In Chinese) [Google Scholar]
- Liu, P.; Zhong, F.; Yang, C.; Jiang, D.; Luo, X.; Song, X.; Guo, J. Influence mechanism of urban polycentric spatial structure on PM2.5 emissions in the Yangtze River Economic Belt, China. J. Clean. Prod. 2022, 365, 132721. [Google Scholar] [CrossRef]
- Zhang, T.; Sun, B.; Li, W. The economic performance of urban structure: From the perspective of Polycentricity and Monocentricity. Cities 2017, 68, 18–24. [Google Scholar] [CrossRef]
- Zhou, H.; Sun, B.; Zhang, T. The evolution of urban employment spatial structure in China: From the perspective of monocentricity and polycentricity. Cities 2024, 147, 104824. [Google Scholar] [CrossRef]
- Liu, P.; Zhong, F.; Han, N. Efficiency and equity: Effect of urban agglomerations’ spatial structure on green development efficiency in China. Sustain. Cities Soc. 2024, 108, 105504. [Google Scholar] [CrossRef]
- Nica, E. Urban Big Data Analytics and Sustainable Governance Networks in Integrated Smart City Planning and Management. Geopolit. Hist. Int. Relat. 2021, 13, 93–106. [Google Scholar]
- Wang, D.; Zhou, T.; Wang, M. Information and communication technology (ICT), digital divide and urbanization: Evidence from Chinese cities. Technol. Soc. 2021, 64, 101516. [Google Scholar] [CrossRef]
- Chen, K.; Zhang, S. How does open public data impact enterprise digital transformation? Econ. Anal. Policy 2024, 83, 178–190. [Google Scholar] [CrossRef]
- Kandt, J.; Batty, M. Smart cities, big data and urban policy: Towards urban analytics for the long run. Cities 2021, 109, 102992. [Google Scholar] [CrossRef]
- Guo, Y.; Chen, J.; Liu, Z. Government responsiveness and public acceptance of big-data technology in urban governance: Evidence from China during the COVID-19 pandemic. Cities 2022, 122, 103536. [Google Scholar] [CrossRef]
- Soudeep, S.; Lailun Nahar Aurthy, M.; Jim, J.; Mridha, M.; Kabir, M. Enhancing road traffic flow in sustainable cities through transformer models: Advancements and challenges. Sustain. Cities Soc. 2024, 116, 105882. [Google Scholar] [CrossRef]
- Pereira, G.; Macadar, M.; Luciano, E.; Testa, M. Delivering public value through open government data initiatives in a Smart City context. Inf. Syst. Front. 2016, 19, 213–229. [Google Scholar] [CrossRef]
- Zhang, D.; Mu, Z.; Tan, Z. Effects of public data open on performance of government functions in China: The roles of digital economy and market economic system adopting the perspective of resource- based view. Front. Political Sci. 2024, 6, 1484579. [Google Scholar] [CrossRef]
- Guo, X.; Yang, Y.; Cheng, Z.; Wu, Q.; Li, C.; Lo, T.; Chen, F. Spatial social interaction: An explanatory framework of urban space vitality and its preliminary verification. Cities 2022, 121, 103487. [Google Scholar] [CrossRef]
- Yang, M.; Fu, M.; Zhang, Z. The adoption of digital technologies in supply chains: Drivers, process and impact. Technol. Forecast. Soc. Change 2021, 169, 120795. [Google Scholar] [CrossRef]
- Han, S.; Kwan, M.; Miao, C.; Sun, B. Exploring the effects of urban spatial structure on green space in Chinese cities proper. Urban For. Urban Green. 2023, 87, 128059. [Google Scholar] [CrossRef]
- Elrahman, A.; Asaad, M. Urban design & urban planning: A critical analysis to the theoretical relationship gap. Ain Shams Eng. J. 2020, 12, 1163–1173. [Google Scholar] [CrossRef]
- Wu, T.; Xu, W.; Kung, C. The impact of data elements on urban sustainable development: Evidence from the big data policy in China. Technol. Soc. 2025, 81, 102800. [Google Scholar] [CrossRef]
- Henderson, V. The Urbanization Process and Economic Growth: The So-What Question. J. Econ. Growth 2003, 8, 47–71. [Google Scholar] [CrossRef]
- Wu, D.; Xie, Y. Unveiling the impact of public data access on collaborative reduction of pollutants and carbon emissions: Evidence from open government data policy. Energy Econ. 2024, 138, 107822. [Google Scholar] [CrossRef]
- Wan, J.; Xie, Q.; Fan, X. The impact of transportation and information infrastructure on urban productivity: Evidence from 256 cities in China. Struct. Change Econ. Dyn. 2023, 68, 384–392. [Google Scholar] [CrossRef]
- Zhang, Q.; Wu, P.; Li, R.; Chen, A. Digital transformation and economic growth Efficiency improvement in the Digital media era: Digitalization of industry or Digital industrialization? Int. Rev. Econ. Financ. 2024, 92, 667–677. [Google Scholar] [CrossRef]
- Tang, D.; Li, J.; Zhao, Z.; Boamah, V.; Lansana, D. The Influence of Industrial Structure Transformation on Urban Resilience Based on 110 Prefecture-level Cities in the Yangtze River. Sustain. Cities Soc. 2023, 96, 104621. [Google Scholar] [CrossRef]
- Zandiatashbar, A.; Hamidi, S.; Foster, N. High-tech business location, transportation accessibility, and implications for sustainability: Evaluating the differences between high-tech specializations using empirical evidence from U.S. booming regions. Sustain. Cities Soc. 2019, 50, 101648. [Google Scholar] [CrossRef]
- Xia, L.; Han, Q.; Yu, S. Industrial intelligence and industrial structure change: Effect and mechanism. Int. Rev. Econ. Financ. 2024, 93, 1494–1506. [Google Scholar] [CrossRef]
- Wang, Z.; Fu, H.; Liu, H.; Liao, C. Urban development sustainability, industrial structure adjustment, and land use efficiency in China. Sustain. Cities Soc. 2023, 89, 104338. [Google Scholar] [CrossRef]
- Li, Y.; Xiong, W.; Wang, X. Does polycentric and compact development alleviate urban traffic congestion? A case study of 98 Chinese cities. Cities 2019, 88, 100–111. [Google Scholar] [CrossRef]
- Green, N. Functional polycentricity: A formal definition in terms of social network analysis. Urban Stud. 2007, 44, 2077–2103. Available online: http://www.jstor.org/stable/43197561 (accessed on 14 July 2025). [CrossRef]
- Chen, Y.; Yu, P.; Wang, L.; Chen, Y. The impacts of the district-level administrative restructuring on urban polycentricity and balanced regional development. Prog. Geogr. 2023, 42, 2084–2098. (In Chinese) [Google Scholar] [CrossRef]
- Li, Y.; Liu, X. How did urban polycentricity and dispersion affect economic productivity? A case study of 306 Chinese cities. Landsc. Urban Plan. 2018, 173, 51–59. [Google Scholar] [CrossRef]
- Han, N.; Liu, P.; Zhong, F.; Zhao, D. Does public data access improve fiscal transparency?—On a Quasi-natural experiment from government data platform access. Socio-Econ. Plan. Sci. 2025, 98, 102184. [Google Scholar] [CrossRef]
- Baker, A.; Larcker, D.; Wang, C. How much should we trust staggered difference-in-differences estimates? J. Financ. Econ. 2022, 144, 370–395. [Google Scholar] [CrossRef]
- Goodman-Bacon, A. Difference-in-differences with variation in treatment timing. J. Econom. 2021, 225, 254–277. [Google Scholar] [CrossRef]
- Xu, Y.; Ma, G. Local officials’ turnover and enterprises’ overcapacity. Econ. Res. J. 2019, 54, 129–145. (In Chinese) [Google Scholar]
- Nunn, N.; Qian, N. US food aid and civil conflict. Am. Econ. Rev. 2014, 104, 1630–1666. [Google Scholar] [CrossRef]
- Bosker, M.; Buringh, E. City seeds: Geography and the origins of the European city system. J. Urban Econ. 2017, 98, 139–157. [Google Scholar] [CrossRef]
- Conley, T.; Hansen, C.; Rossi, P. Plausibly exogenous. Rev. Econ. Stat. 2012, 94, 260–272. [Google Scholar] [CrossRef]
- Huang, C.; Hao, S.; Ma, L. The impact of ESG advantages on the economic development of neighboring regions. Energy Econ. 2025, 145, 108431. [Google Scholar] [CrossRef]
- Qiao, Y.; Luo, Z. Impact of polycentric spatial structure on the innovation performance of Chinese cities: Evidence from 279 cities at or above the prefecture level. City Plan. Rev. 2024, 48, 17–26. (In Chinese) [Google Scholar]
- Li, X. Recognition of urban polycentric structure based on spatial aggregation characteristics of POI elements: A case of Zhengzhou City. Acta Sci. Nat. Univ. Pekin. 2020, 56, 692–702. (In Chinese) [Google Scholar] [CrossRef]
- Wen, H.; Zhong, Q. Digital infrastructure and enterprise total factor productivity--Evidence from Chinese listed companies. Soft Sci. 2022, 36, 64–71. (In Chinese) [Google Scholar]
- Gan, C.; Zheng, R.; Yu, D. An Empirical study on the effects of industrial structure on Economic growth and fluctuations in China. Econ. Res. J. 2011, 46, 4–16. (In Chinese) [Google Scholar]
- Zhao, J.; Jiang, Q.; Dong, X.; Dong, K.; Jiang, H. How does industrial structure adjustment reduce CO2 emissions? Spatial and mediation effects analysis for China. Energy Econ. 2022, 105, 105704. [Google Scholar] [CrossRef]
- Gu, Y.; You, X. A spatial quantile regression model for driving mechanism of urban heat island by considering the spatial dependence and spatial non-stationary: An example of Beijing, China. Sustain. Cities Soc. 2022, 79, 103692. [Google Scholar] [CrossRef]
- Nie, S.; Zeng, G.; Zhang, H.; Ji, J. The local government fiscal pressure’s effect on green total factor productivity: Exploring mechanisms from the perspective of government behavior. Int. Rev. Econ. Financ. 2024, 96, 103702. [Google Scholar] [CrossRef]
- Ling, C.; Zhang, A.; Zhen, X. Peer Effects in Consumption among Chinese Rural Households. Emerg. Mark. Financ. Trade 2018, 54, 2333–2347. [Google Scholar] [CrossRef]
- Fan, J.; Wang, Y.; Zhou, L.; Xu, L.; Wang, Z. Can digital economy reshape urban spatial structure? Evidence from the perspective of urban sprawl. Ann. Reg. Sci. 2025, 74, 73. [Google Scholar] [CrossRef]
Disclaimer/Publisher’s Note: The statements, opinions and data contained in all publications are solely those of the individual author(s) and contributor(s) and not of MDPI and/or the editor(s). MDPI and/or the editor(s) disclaim responsibility for any injury to people or property resulting from any ideas, methods, instructions or products referred to in the content. |
© 2025 by the authors. Licensee MDPI, Basel, Switzerland. This article is an open access article distributed under the terms and conditions of the Creative Commons Attribution (CC BY) license (https://creativecommons.org/licenses/by/4.0/).