Abstract
China has entered an era of population decline, yet urbanization continues as rural-to-urban migration persists. This demographic transition has prompted a strategic shift in urban development from extensive spatial expansion toward quality-oriented, intensive growth models. However, evolving human–land supply–demand dynamics in cities historically characterized by population inflows remain insufficiently understood. This study focuses on Xiamen, a prototypical coastal migrant-receiving city, to investigate land use simulation under demographic transition. By integrating the cohort-component method with the Patch-generating Land Use Simulation (PLUS) model, we project Xiamen’s population under three scenarios by 2030: Stable Continuation (SCS), Natural Development (NDS), and National 2030 Population Planning (NPP), with projected increases of 5.56%, 6.76%, and 24.69%, respectively. Results show continued but decelerating population growth, with adequate labor supply and persistent demographic dividend. Notably, the NPP scenario reveals a negative correlation between population growth and construction land expansion. In NPP-High, prioritizing compact development and ecological conservation, population grows by 1.27 million while construction land decreases by 2.85% and forest land increases by 4.09%. This framework provides empirical evidence for compact urban development under the dual constraints of land-use efficiency and ecological protection.
1. Introduction
One of the central themes in urban research has been the relationship between land use and population dynamics. Population changes has been recognized as a primary driver of environmental change and land system transformation [1,2], as well as a major contributor to the expansion of construction land [3,4]. Since the 20th century, a global misalignment has emerged between population growth and construction land expansion [5,6,7]. Estimates suggest that the annual growth rate of urban land expansion exceeds population growth by more than twofold [8]. This disproportionate expansion has led to numerous problems, including excessive spatial sprawl and urban land development, and inefficient land use [9,10,11,12,13]. However, global population growth trends have gradually decelerated since the early 21st century [14]. Despite national decline trends, migrant-receiving cities face complex dynamics requiring integrated demographic and spatial modeling approaches [15]. Countries such as Japan (2012), Italy (2015), and South Korea (2021) have experienced population decline and transitioned into “super-aged” societies (with populations aged 65 and above exceeding 20%) in 2004, 2007, and 2024, respectively. These nations confront the dual pressures of population aging and low fertility rates [16], affecting economic and social dimensions [17,18], while posing novel challenges to sustainable development [19,20,21]. China, formerly the world’s most populous nation, reached its population peak in 2021, followed by its first natural population decline since 1962 in 2022 under normal developmental conditions. The Total Fertility Rate (TFR) (i.e., the sum of the fertility rates of all the women in a population group) declined below 1.1, significantly lower than the replacement level of 2.1 required for intergenerational population stability. By 2022, more than half of China’s provinces were experiencing negative natural population growth, and even Guangdong Province—traditionally a major destination for net population inflows—witnessed markedly slower population growth. Against this backdrop, the central government has established strategic frameworks for coordinating population development with economic and social objectives through national population planning initiatives. Local governments at all levels have subsequently formulated differentiated population policies based on regional conditions and development priorities. However, spatial heterogeneity persists in policy implementation: migrant-receiving cities like Xiamen have maintained substantial population clustering effects despite national demographic decline. This phenomenon stems from several contributing factors: first, Xiamen’s designation as a special economic zone provides enhanced economic opportunities and preferential policy treatment; second, its strategic geographic position facilitates cross-strait trade with Taiwan, generating sustained economic growth; third, superior urban infrastructure and educational resources create competitive advantages in talent attraction. Consequently, migrant-receiving cities face unprecedented developmental transitions, experiencing complex dynamics between national demographic trends and local economic magnetism that subsequently influence land use patterns.
Existing research predominantly focuses on the relationship between land expansion and population change [22,23,24], spatiotemporal coupling between population growth and construction land expansion [6,25,26], or land use changes under population growth scenarios [27,28]. However, research on land use in migrant-receiving cities under population decline contexts remains relatively limited, particularly through integrated simulation approaches that combine demographic projections with spatial land use modeling. Remote sensing provides consistent urban boundary definitions that overcome country-specific administrative variations [29]. As a major transportation, cultural, and economic hub on China’s southeast coast, Xiamen exemplifies a typical migrant-receiving city that has long confronted tensions between limited land resources and urban expansion demands [30]. Data from the seventh national census reveal that while Xiamen’s permanent resident population growth has notably decelerated, the built-up area continues expanding. This asynchrony between population growth rates and urban expansion may reduce construction land demand while intensifying optimization pressures on existing land stocks. Additionally, population aging [31] generates new requirements for public service facilities [32,33]. Furthermore, constrained urban space, unbalanced population distribution, and complex mobility patterns pose challenges for optimizing construction land allocation. Balancing contradictions between population changes and land use has become an urgent priority. Therefore, this study integrates multi-scenario population projections with land use simulations to explore how macro-level population decline influences migrant-receiving cities and affects human–land supply–demand relationships. Recognizing that demographic transitions occur within broader systemic uncertainties, our scenario-based approach acknowledges the multidimensional nature of urban planning challenges, though the present analysis focuses primarily on demographic drivers while noting the potential for future research to incorporate climate, economic, and geopolitical uncertainties. The research addresses three core subjects: (1) analyzing population and land change trends in Xiamen from 2000–2020 and evaluating their sustainability; (2) investigating dynamic relationships between Xiamen’s permanent resident population and built-up area to reveal evolutionary patterns of human–land relationships across different periods; (3) exploring multi-scenario construction land scale projections based on population forecasts to prevent land resource waste.
This study first employs the cohort-component method, which projects future population by analyzing demographic changes within specific age and gender groups, for multi-scenario population projections of Xiamen through 2030. Second, it analyzes quantitative dynamic relationships between population and construction land based on historical data. Finally, combining population projection results with different population density scenarios, it utilizes the PLUS model to simulate land use changes in Xiamen by 2030 and explores reasonable construction land scales under various scenarios. This integrated modeling framework addresses critical knowledge gaps in understanding human–land relationships during demographic transitions, providing empirical evidence for sustainable urban planning policies in migrant-receiving cities. The research outcomes offer valuable insights for urban planners and policymakers to optimize land allocation strategies, prevent inefficient land expansion, and achieve compact urban development under evolving demographic conditions. Ultimately, this study contributes to the theoretical understanding of urbanization patterns under population decline while providing practical guidance for sustainable land management in similar coastal cities facing demographic transitions.
2. Materials and Methods
2.1. Study Area
Xiamen is located along China’s southeastern coast, facing the Taiwan Strait to the east, and represents one of China’s first four special economic zones established in 1980. The city covers a total land area of 1699 square kilometers. From 2000 to 2020, the Gross Domestic Product (GDP) increased from 50.1 billion RMB to 638.4 billion RMB, contributing 13.52% of Fujian Province’s regional GDP while occupying only 1.4% of its land area. The urbanization rate increased from 70.84% to 89.41%, ranking first in Fujian Province. Rapid urbanization has generated extensive land use changes, resulting in relatively low land use coupling coefficients [34] (a metric quantifying the coordination degree between population growth and construction land expansion), which conflicts with required sustainable development objectives [35] of optimizing land use efficiency and maintaining ecological balance.
2.2. Data Sources
The data and information utilized in this study are presented in Table 1.

Table 1.
Data summary.
2.3. Methods
This study first examines relationships between Xiamen’s permanent resident population and built-up area from 2000–2020 using the Tapio decoupling model. Subsequently, employing the cohort-component method with 2020 as the baseline year, we project permanent resident population scales under different scenarios through 2030. Based on these projections, various population density scenarios are established, and the PLUS model simulates land use changes in Xiamen by 2030. The research framework is illustrated in Figure 1.
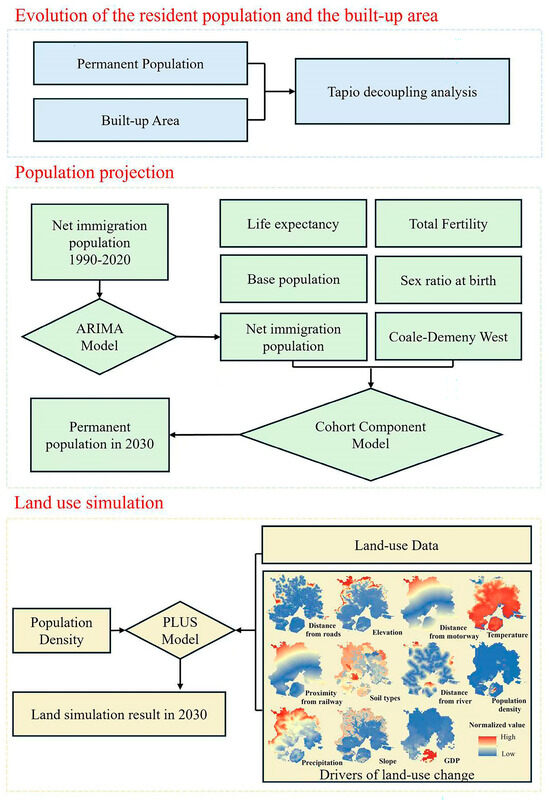
Figure 1.
Research framework diagram.
2.3.1. Cohort Component Model
The cohort component model is a widely applied approach in population forecasting, with core principles involving separate consideration of changes within each age–gender cohort. This study selects PADIS-INT as the population projection tool, using 2020 as the baseline year to forecast Xiamen’s population scale from 2021–2030. Parameter settings are as follows:
(1) Fertility level: TFR serves as a crucial parameter in population projections. To optimize projection results, three scenarios are established (Table 2).
Table 2.
Population projection scenarios.
(2) Mortality pattern: Regional model life tables can accurately reflect changes in mortality levels and patterns based on empirical data from different regions and countries. This study adopts the Western pattern of the Coale–Demeny regional model life table, with data primarily sourced from Africa and Asia (including China and South Korea), effectively representing general conditions.
(3) Life expectancy: Based on United Nations empirical values for annual life expectancy increases, we assume an average annual increase of 0.05 years from 2021–2030 [38].
(4) Sex ratio at birth: According to relevant planning documents [40], Xiamen’s sex ratio at birth is projected to decline to 108 by 2030. This ratio represents 108 male births per 100 female births, approaching the natural biological range of 103–107. China has historically experienced elevated sex ratios at birth due to son preference and family planning policies, with ratios reaching 121.2 in 2004.
(5) Migration level: As a typical migrant-receiving city, Xiamen’s migration population significantly influences total population scale. To estimate migrant population scale from 2021 to 2030, the ARIMA model is applied based on migration data spanning 1990 to 2020.
2.3.2. Decoupling Model
To investigate human–land relationship development patterns, this study applies the Tapio decoupling model to analyze relationships between changes in Xiamen’s permanent resident population and built-up area. Based on the indicators Δα and Δβ, decoupling states can be classified into eight types: weak decoupling, strong decoupling, recessive decoupling, recessive coupling, weak negative decoupling, strong negative decoupling, expansive negative decoupling, and expansive coupling [41]. These states indicate whether urban land expansion is proportionate to, exceeds, or lags behind population growth rates. The decoupling index is calculated using the following formula:
where is the decoupling index; is the growth rate of built-up area; is the growth rate of resident population; Lt+1 and Lt are the built-up area in year t + 1 and year t, respectively; Pt+1 and Pt are the number of resident populations in year t + 1 and year t, respectively.
2.3.3. PLUS Model
The PLUS model (Patch-generating Land Use Simulation) represents a raster-based framework for simulating land use change through the generation of spatial patches [42]. The model integrates the Land Expansion Analysis Strategy (LEAS) and the growth mechanism based on multiple types of random patch seeds (CARS). The LEAS module employs Random Forest (RF) algorithm to extract expansion patterns of each land use type during historical LUCC periods (2000–2020) and expanded land use components to explore expansion status and quantify the contribution of each driving factor to land use type expansion, generating development probability surfaces and factor importance rankings (Figure A1). The CARS module utilizes the growth mechanism based on cellular automata to dynamically simulate various types of land patches. Neighborhood weights play important roles in land use simulation, influencing expansion intensity and capacity of various land types, with parameter ranges from 0–1. Values closer to 1 indicate stronger expansion capacity for land types. This study establishes neighborhood weight parameters based on existing research [43,44], with specific values and calibration procedures detailed in Appendix A, Table A1. Following established research principles [44,45,46,47] of relevance, data availability, quantifiability, and spatial heterogeneity, this study selects 11 driving factors influencing land use change. These include socio-economic factors (GDP and population density), natural factors (elevation, slope, temperature, precipitation, and soil type), and accessibility factors (proximity to roads, open water, railways, and highways). The low-density scenario (10,407 people km−2) represents a continuation of the projected density decline based on 2000–2020 trends. The medium-density scenario (12,848 people km−2) maintains 2020 baseline levels, serving as a stabilization reference. The high-density scenario (15,000 people km−2) corresponds to the high-density threshold defined by UN-Habitat [48] and falls within Xiamen’s demonstrated density capacity, as evidenced by substantial spatial variation across districts (ranging from 7761 to 20,766 people km−2 in 2020), supporting compact urbanization objectives for land-constrained coastal cities.
Nine integrated land use simulation scenarios for 2030 were developed based on population forecasts and Xiamen’s historical population density (population density = resident population/built-up area) (Table 3).
Table 3.
Integrated land use scenarios.
3. Results
3.1. The Change Process of Population and Land from 2000 to 2020
3.1.1. The Change in the Population and Land from 2000 to 2020
As shown in Figure 2a, Xiamen’s permanent resident population experienced substantial growth between 2000 and 2020. By 2020, the permanent population had reached 5.164 million, representing an increase of 1.6326 million or 46.23% compared to 2010. Population increases accounted for 35.14% of Fujian Province’s total population growth, ranking first at the provincial level. Among special economic zones, Xiamen ranked second (after Shenzhen), sixth among sub-provincial cities, and eighteenth nationally. Compared to 2000, the net population increased by 3.111 million, representing a 151.5% increase, with an average annual growth rate of 4.7%, far exceeding the national average of 0.57%. In 2020, 9.56% of the population was aged 60 or above, below the 10% standard typically used to define an aging society. Despite continued growth, population density has exhibited a declining trend, primarily attributed to the rapid expansion of built-up areas, accelerated urbanization processes, and large-scale development in off-island areas, causing land area growth rates to exceed population growth rates and decrease overall population density.
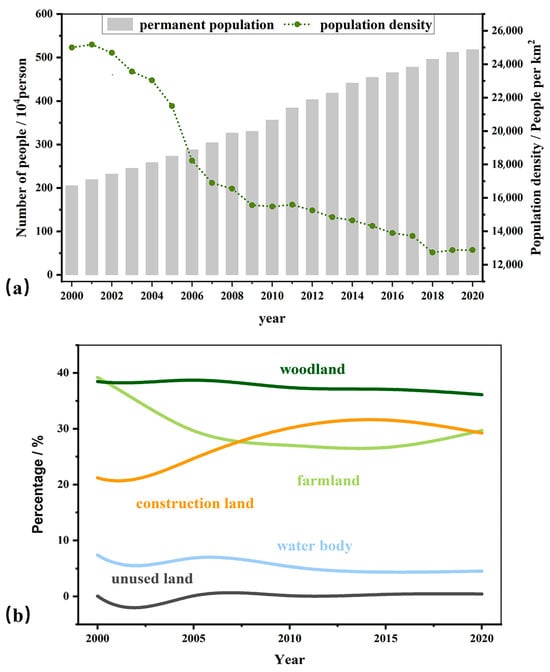
Figure 2.
Population and land use in Xiamen, 2000–2020. (a) Overview of resident population and population density in Xiamen, 2000–2020. (b) Proportion of land in Xiamen City by category, 2000–2020.
Figure 2b summarizes land use type distributions from 2000 to 2020. The study area’s primary land use types include cropland, forestland, and construction land, with cropland and forestland having the largest proportions, their combined area exceeding 60% of total area, while unused land comprises minimal proportions. Notably, construction land proportions increased from 21.2% in 2000 to 29.22% in 2020, showing obvious upward trends. Simultaneously, proportions of woodland and water bodies exhibited declining trends.
3.1.2. Spatial Transfer of Land Use
Based on land use data from 2000 to 2020, dynamic changes in land use were analyzed by calculating land use transfers for the periods 2000–2005, 2005–2010, 2010–2015, and 2015–2020 (Figure 3). During the study period, frequent conversions occurred among different land use types in Xiamen, with changes primarily concentrated between farmland and construction land. For instance, from 2000 to 2005, the total land area converted was 173.20 km2, with farmland experiencing the largest transfers, mainly converting to construction land (69.37%) and woodland (28.39%). From 2005 to 2010, 188.86 km2 of land was transferred, mainly from farmland and water bodies to construction land (56%). During 2010–2015, 164.86 km2 of land was converted, with 83% of the transitions occurring among farmland, construction land, and woodland; notably, 50.54 km2 of farmland was transformed into construction land. From 2015 to 2020, a total of 247.52 km2 was again transferred, with the dominant transitions being from farmland to construction land (62.1%) and woodland (30.2%). Additionally, some woodland and water bodies were also converted into construction land.
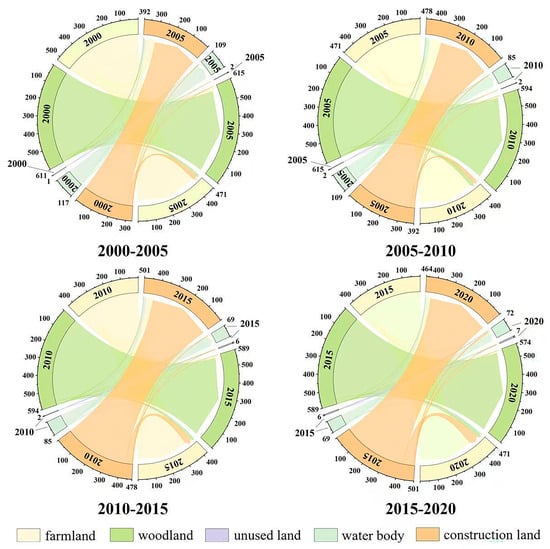
Figure 3.
Land use change 2000–2020. Each chord diagram represents land use conversion over a five-year interval: top-left (2000–2005), top-right (2005–2010), bottom-left (2010–2015), and bottom-right (2015–2020). Colors denote different land use categories, including farmland, woodland, unused land, water bodies, and construction land. The connecting chords illustrate the flow of land conversion from one category to another, with the width proportionally representing the magnitude of land area converted (measured in km2). The numerical values along the perimeter indicate the area of each land use type, while the flow directions show the source and destination of land conversions. Detailed quantitative land use transition matrices for each five-year period are provided in Appendix A, Table A2, Table A3, Table A4 and Table A5.
3.2. The Quantitative Relationship Between Population Growth and Urban Expansion
Between 2000 and 2020, Xiamen’s resident population and built-up area exhibited a dynamically coupled yet asynchronous growth pattern (Figure 4). During the periods 2002–2009 and 2012–2018, the decoupling index (γ) exceeded 1.2, presenting a state of “expansive negative decoupling”, including that the expansion rate of built-up area far exceeded that of the population, reflecting land resource utilization efficiency risks under rapid urbanization processes. Particularly in 2006, 2009, and 2018, significantly elevated decoupling indices highlighted accelerated land urbanization characteristics during specific periods. In contrast, 2019 showed γ values below 0.8, suggesting improved alignment between built-up area expansion and population growth. This transformation may relate to population inflows following household registration policy reforms implemented after the National Development and Reform Commission issued “Priority Tasks for New Urbanization Construction in 2019” in April 2019. These reforms fundamentally relaxed the hukou (household registration) system by requiring Type I large cities like Xiamen to fully liberalize settlement conditions and eliminate residency restrictions for key population groups, facilitating rural-to-urban migration and inter-city population mobility. From the long term, Xiamen’s decoupling indices have gradually declined since 2010, marking transitions in urbanization development modes from extensive expansion toward intensive and rational development.
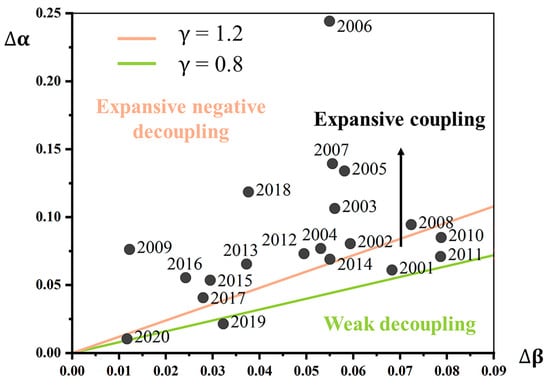
Figure 4.
Decoupling index between resident population and built-up area in Xiamen, 2000–2020. The scatter plot displays annual decoupling relationships where the x-axis (Δβ) represents the growth rate of residential population and the y-axis (Δα) represents the growth rate of built-up area. Each point corresponds to a specific year (2001–2020) showing the annual decoupling index (γ = Δα/Δβ). The red line (γ = 1.2) and green line (γ = 0.8) serve as threshold boundaries defining decoupling categories. The area in the figure has been divided into three categories. The first category is “Expansive negative decoupling” (the upper left area of the figure, marked with red text); The second category is Weak decoupling (the area at the bottom right of the graph, marked in green); The third category is Expansive coupling (the middle area, marked in black).
3.3. Integrated Simulation Results of Future Population and Land Use
3.3.1. Model Validation and Robustness Analysis
Migration population projections were estimated using ARIMA modeling based on net migration data spanning 1990–2020. Model identification following AIC and BIC criteria indicated ARIMA(1, 1, 1) as the optimal specification (AIC = 695.29, BIC = 699.59) with significant parameters (AR(1) = 0.554, p = 0.020; MA(1) = −1.000, p < 0.001). Ljung–Box diagnostic tests confirmed adequate model structure with no significant autocorrelation in residuals (p = 0.954). The PLUS model achieved overall accuracy of 86.9%, Kappa coefficient of 0.81, and FOM value of 0.53, substantially exceeding the 0.2 threshold for excellent simulation capability in land use change models [49,50,51].
Robustness testing was conducted by reducing projected migration inflows by 30% under the NPP scenario. Results demonstrate exceptional model stability: total population reaches 6.14 million compared to 6.44 million in the baseline NPP scenario, while maintaining working-age population at 74%. Land use patterns exhibit minimal variation with relative differences below 6.4% across all land types (Table A6). This indicates that moderate changes in migration assumptions do not fundamentally alter land use simulation outcomes.
Sensitivity analysis examining alternative neighborhood weight configurations and driving factor combinations reveals robust model performance across different parameter settings. Kappa coefficients vary within a narrow range of 0.05 for major land types (Table A7). The consistent performance across sensitivity tests confirms the reliability of our integrated modeling framework for supporting land use planning decisions under demographic transition scenarios.
3.3.2. Population Forecast Results
Figure 5 presents projections of Xiamen population between 2020 and 2030, including the expected male and female distributions in 2030 under three TFR scenarios: Stable Continuation Scenarios (SCS), Natural Development Scenarios (NDS), and National 2030 Population Planning Scenarios (NPP). In these three scenarios, Xiamen’s permanent resident population totals all show upward trends. By 2030, the proportion of populations aged 60 and above is projected to reach 16.95%, 16.76%, and 15.39% (population of 60+ < 20%), respectively, while those aged 65 and above will account for 10.98%, 10.86%, and 9.92%. The working-age populations (15–64 years) is expected to comprise 74.39%, 73.56%, and 74.06% of the total population, respectively. Among the scenarios, the NPP scenario shows the highest growth, with a 24.69% increase in population, which is relatively minimally affected by the negative growth of the national population. In contrast, under SCS and NDS scenarios, increases reach 5.56% and 6.76%, respectively. Although permanent resident populations continue increasing, growth rates gradually decelerate, with population totals trending toward stability. Xiamen’s population aging rates and age structures remain superior to provincial and national averages, but the city entered mild aging society status in 2022 and will remain in mild aging society status through 2030.
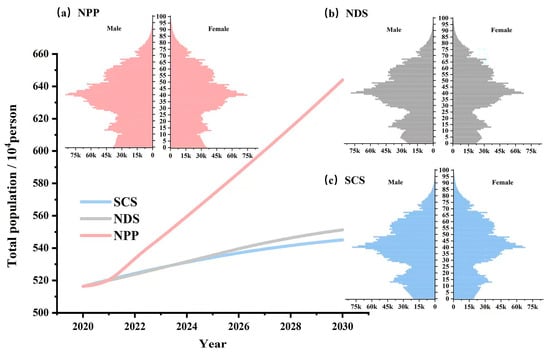
Figure 5.
Population projection results. The graphs show population trends under three scenarios: the SCS (blue line), the NDS (gray line), and the NPP (red line). The distribution of the number of males and females in 2030 under the three projection scenarios is presented in three subplots of the figure.
3.3.3. Integrated Land Use Simulation Results
A multi-scenario simulation of Xiamen’s land use demand in 2030 was conducted using the integrated PLUS modeling framework, as shown in Figure 6. The spatial distribution maps reveal distinct land use patterns across scenarios, with increasing population density typically accompanying construction land expansion and woodland increases, while farmland relatively decreases. Systematic cross-scenario comparison (Figure 6, heat map) demonstrates pronounced performance variations across the nine scenarios. NPP scenarios consistently outperform SCS and NDS alternatives in land use efficiency, with NPP-High achieving optimal balance by accommodating the largest population growth (24.7%) while reducing construction land (−2.85%) and expanding woodland (4.09%). This configuration exhibits superior land use efficiency (0.28), maximizing demographic accommodation per unit construction area.
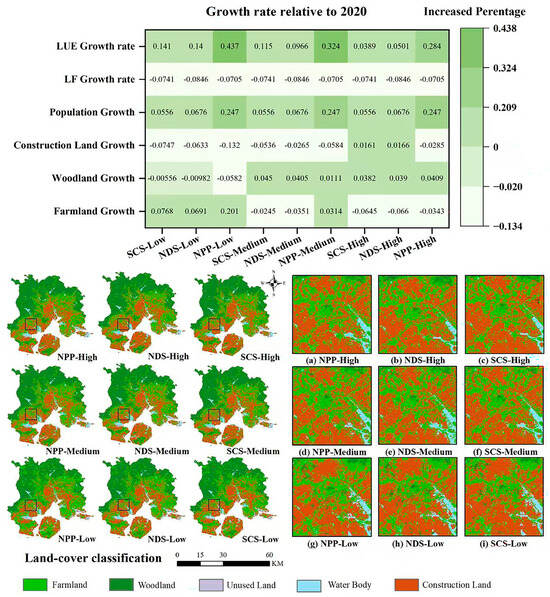
Figure 6.
Integrated land use simulation results. The upper bar chart shows the area of land cover by category in 2020 and in different scenarios, with different colors representing different land types. LUE growth rate refers to the growth rate of per capita construction land area. LF growth rate refers to the growth rate of the labor force population ratio. The lower graph shows the land cover in 2030 under different scenarios. The (a–i) on the right show a subregions of the black box in the left figure, respectively.
Construction land dynamics vary systematically across population projections and density scenarios. Under identical population density conditions, SCS and NDS scenarios demonstrate positive correlations between total population scales and construction land scales, while NPP scenarios present negative correlations despite having the largest population scales. Under low-density scenarios, all projections show farmland expansion with construction land decreases, with NPP-Low achieving the most significant farmland expansion (20.1%) and construction land reduction (−13.2%). High-density scenarios promote woodland expansion across all population projections, with NPP-High achieving balanced outcomes through moderate construction land reduction (−2.85%) and substantial woodland restoration (4.09%).The comparative analysis reveals that NPP scenarios, particularly under high-density configurations, offer optimal pathways for sustainable compact development, effectively balancing demographic transition management with ecological conservation objectives while maximizing urban land use efficiency.
4. Discussion
Since China’s labor force entered a phase of negative growth in 2015, multiple cities including Beijing, Shanghai, and Guangzhou have experienced population decline. Beijing’s permanent resident population decreased by 22,000 in 2017 and 30,000 in 2022, while Shanghai recorded declines of 13,700 in 2017 and 130,000 in 2022. Guangdong Province witnessed a reduction of 270,000 in 2022. Although some cities’ populations maintain growth, all cities will face similar challenges regardless of scale, economic development levels, or geographic locations [52]. The results of Xiamen are consistent with observed patterns of population transformation in the global context. Cities like Amsterdam and Munich continue attracting populations while their national contexts face aging and fertility decline [53,54], and Tokyo exhibits similar patterns despite Japan’s national population decline since 2011 [55]. These international comparisons validate our framework’s applicability beyond the Chinese context, suggesting that migrant-receiving cities globally face similar trade-offs between population accommodation and sustainable land development.
Population decline signifies not only numerical reductions but also profound population structural changes. As numerous studies indicate, increasing aging populations will alter demands for public services [56,57] and traditional infrastructure [58,59,60,61,62], thereby influencing the allocation and planning of construction land. For migrant-receiving cities such as Xiamen, emphasis should focus on improving land use efficiency, promoting coordinated and rational land resource allocation [63], and optimizing regional human–land relationships [64]. These dynamics challenge conventional urban development models that assume continuous population and economic growth. Contemporary urban development occurs within interconnected systemic challenges where demographic transitions intersect with ecological, economic, climatic, and geopolitical pressures that interact non-linearly [65,66]. This necessitates a shift toward adaptive urban development frameworks that can accommodate non-linear demographic transitions while maintaining urban functionality. The compact city model and smart shrinkage approaches provide theoretical foundations for managing population-land relationships under declining growth scenarios, yet their application in migrant-receiving cities within declining national contexts remains underexplored. Cities like Xiamen are increasingly shaped by multi-scalar risks and systemic pressures beyond their local context, requiring theoretical frameworks that integrate demographic resilience with spatial efficiency.
Our results demonstrate that Xiamen’s population will continue growing through 2030 despite national decline, with populations aged 60 and above will comprise approximately 17%, respectively. Compared to first-tier cities such as Beijing (60+ population: 19.6% in 2020) and Shanghai (60+ population: 23.4% in 2020), Xiamen exhibits obvious “less old” characteristics in population structure. Working-age population proportions exceed 50%, indicating continued demographic dividends in Xiamen. The integrated simulation results reveal that under NPP scenario, with the NPP-High scenario demonstrating how larger populations can be accommodated with smaller construction land scales. This negative correlation between population growth and construction land expansion offers significant policy implications for addressing migration and aging challenges in comparable international contexts. For European cities experiencing similar demographic transitions, strategic migration attraction provides a policy template applicable to regions experiencing accelerated population decline. Recent studies on urban shrinkage demonstrate that proactive land use consolidation can maintain urban vitality despite population decline [67], supporting the compact development strategies identified in this research. These findings suggest that migrant-receiving cities can serve as demographic and economic anchors within declining national contexts, requiring coordinated policies that balance local growth management with national demographic challenges.
However, several limitations warrant acknowledgment. While the PLUS model generates patch-based land use simulations with detailed spatial resolution, this study operates at the municipal scale without effective integration of sub-municipal administrative units, thereby overlooking critical spatial dynamics such as inter-district migration flows, demographic heterogeneity across administrative boundaries, and spatial variations in population age structures. Migration projections based on historical ARIMA patterns may inadequately capture flow volatility under evolving economic and policy conditions. The assumed resilience of Xiamen’s demographic dividend through 2030 requires critical examination, as economic or policy shifts could alter the city’s migrant attractiveness. Additionally, the study does not examine institutional feasibility for implementing compact development strategies. Future work should downscale to district-level resolution, incorporate institutional analysis of regulatory mechanisms, and stress-test migration assumptions under varying economic scenarios.
5. Conclusions
Based on data from 2000 to 2020, this study concludes that Xiamen’s urbanization model has shifted from extensive expansion to a more intensive development pattern. Through integrated cohort-component and PLUS modeling framework projections, total population scales under SCS, NDS, and NPP scenarios through 2030 all show growth trends, with increases of 5.56%, 6.76%, and 24.69%, respectively, significantly lower than the 46.23% increase from 2010–2020. Xiamen has entered mild aging society status (population of 60+ > 10%) but has not yet reached moderate aging society levels (population of 60+ > 20%). Working-age population proportions exceed 50%, remaining within continued demographic dividend release phases. The integrated PLUS modeling framework simulates land use evolution under SCS-Low, NDS-Low, NPP-Low, SCS-Medium, NDS-Medium, NPP-Medium, SCS-High, NDS-High, and NPP-High scenarios. Results show that as population density increases, both construction and woodland tend to expand, while farmland decreases. Under identical population density conditions, SCS and NDS scenarios exhibit positive relationships between total population and construction land area, whereas the NPP scenario demonstrates a negative correlation. In the NPP-Low scenario, construction land decreases by 61.4 km2 while farmland expands by 94.71 km2, suggesting a development path that prioritizes agriculture but requires enhanced ecological protection. The SCS-Medium scenario shows woodland increases of 25.8 km2 with relatively stable other land use changes, providing optimal ecological stability. The NDS-High scenario shows construction land expansion of 7.72 km2 and farmland decreases of 30.42 km2, suitable for rapid urbanization development. The NPP-High scenario achieves balanced land use, accommodating larger populations with smaller construction land scales, most closely aligning with sustainable compact city development requirements.
Author Contributions
Conceptualization, C.L. and Z.X.; methodology, C.L. and Z.X.; formal analysis, C.L.; writing—original draft preparation, C.L.; writing—review and editing, C.L., Z.X., C.W., L.N. and H.W.; visualization, C.L.; supervision, H.W.; funding acquisition, H.W. and Z.X. All authors have read and agreed to the published version of the manuscript.
Funding
This research was funded by the Natural Science Foundation of Xiamen, China [grant numbers 3502Z202372054 and 3502Z202472039], the Fujian Provincial Natural Science Foundation of China [grant number 2023J05080], the Science and Technology Planning Project of Fujian Province, China [grant number 2022H0044], and the Science and Technology Planning Project of Fujian Province, China [grant number 2023H0048].
Data Availability Statement
The raw data supporting the conclusions of this article will be made available by the authors upon request. This study employs MATLAB R2024a to forecast the migrant population in Xiamen City and utilizes Padis—int v1.2.2.5 to predict the permanent resident population in Xiamen City. The land use transfer situation in Xiamen City from 2000 to 2020 is calculated through the communication analysis tool in ArcMap 10.8. Additionally, PLUS v1.40 is adopted to predict the land use in Xiamen City in 2030.
Conflicts of Interest
The authors declare no conflicts of interest.
Appendix A
Table A1.
Neighborhood weight parameter.
Table A2.
Land-use type transfer matrix for Xiamen from 2000 to 2005 (km2).
Table A3.
Land-use type transfer matrix for Xiamen from 2005 to 2010 (km2).
Table A4.
Land-use type transfer matrix for Xiamen from 2010 to 2015 (km2).
Table A5.
Land-use type transfer matrix for Xiamen from 2015 to 2020 (km2).
Table A6.
Stability test results.
Table A7.
Sensitivity test results.

Figure A1.
The importance of the contribution of each variable to the growth of three land use types. The most important factors were overlapped with the expansion of the corresponding land uses.

References
- Bilsborrow, R.E.; Okoth-Ogendo, H. Population-driven changes in land use in developing countries. Ambio J. Hum. Environ. 1992, 21, 37–45. Available online: http://www.jstor.org/stable/4313884 (accessed on 2 March 2025).
- Entwisle, B.; Stern, P.C. Population, Land Use, and Environment: Research Directions; Academies Press: Cambridge, MA, USA, 2005. [Google Scholar]
- Wu, R.; Li, Z.G.; Wang, S.J. The varying driving forces of urban land expansion in China: Insights from a spatial-temporal analysis. Sci. Total Environ. 2021, 766, 142591. [Google Scholar] [CrossRef] [PubMed]
- Mahtta, R.; Fragkias, M.; Güneralp, B.; Mahendra, A.; Reba, M.; Wentz, E.A.; Seto, K.C. Urban land expansion: The role of population and economic growth for 300+ cities. Npj Urban Sustain. 2022, 2, 5. [Google Scholar] [CrossRef]
- Luo, J.J.; Xing, X.S.; Wu, Y.Z.; Zhang, W.W.; Chen, R.S. Spatio-temporal analysis on built-up land expansion and population growth in the Yangtze River Delta Region, China: From a coordination perspective. Appl. Geogr. 2018, 96, 98–108. [Google Scholar] [CrossRef]
- Li, Y.J.; Kong, X.S.; Zhu, Z.Q. Multiscale analysis of the correlation patterns between the urban population and construction land in China. Sustain. Cities Soc. 2020, 61, 102326. [Google Scholar] [CrossRef]
- Li, G.D.; Fang, C.L.; Li, Y.J.; Wang, Z.B.; Sun, S.; He, S.W.; Qi, W.; Bao, C.; Ma, H.T.; Fan, Y.P.; et al. Global impacts of future urban expansion on terrestrial vertebrate diversity. Nat. Commun. 2022, 13, 1628. [Google Scholar] [CrossRef]
- Seto, K.C.; Fragkias, M.; Gueneralp, B.; Reilly, M.K. A Meta-Analysis of Global Urban Land Expansion. PLoS ONE 2011, 6, e23777. [Google Scholar] [CrossRef]
- Kuang, B.; Lu, X.H.; Han, J.; Fan, X.Y.; Zuo, J. How urbanization influence urban land consumption intensity: Evidence from China. Habitat Int. 2020, 100, 102103. [Google Scholar] [CrossRef]
- Jiao, L.M.; Dong, T.; Xu, G.; Zhou, Z.Z.; Liu, J.F.; Liu, Y.L. Geographic micro-process model: Understanding global urban expansion from a process-oriented view. Comput. Environ. Urban Syst. 2021, 87, 101603. [Google Scholar] [CrossRef]
- Yang, Z.W.; Chen, Y.B.; Guo, G.H.; Zheng, Z.H.; Wu, Z.F. Using nighttime light data to identify the structure of polycentric cities and evaluate urban centers. Sci. Total Environ. 2021, 780, 146586. [Google Scholar] [CrossRef]
- Li, W.M.; Cai, Z.Y.; Jin, L.S. Urban green land use efficiency of resource-based cities in China: Multidimensional measurements, spatial-temporal changes, and driving factors. Sustain. Cities Soc. 2024, 104, 105299. [Google Scholar] [CrossRef]
- Geng, Y.W.; Li, X.S.; Chen, J.Q. Integration of land use resilience and efficiency in China: Analysis of spatial patterns, differential impacts on SDGs, and adaptive management strategies. Appl. Geogr. 2025, 175, 103490. [Google Scholar] [CrossRef]
- Vollset, S.E.; Goren, E.; Yuan, C.-W.; Cao, J.; Smith, A.E.; Hsiao, T.; Bisignano, C.; Azhar, G.S.; Castro, E.; Chalek, J.; et al. Fertility, mortality, migration, and population scenarios for 195 countries and territories from 2017 to 2100: A forecasting analysis for the Global Burden of Disease Study. Lancet 2020, 396, 1285–1306. [Google Scholar] [CrossRef]
- Xu, Z.; Xu, G.; Lan, T.; Li, X.; Chen, Z.; Cui, H.; Zhou, Z.; Wang, H.; Jiao, L.; Small, C. Global consistency of urban scaling evidenced by remote sensing. PNAS Nexus 2025, 4, pgaf037. [Google Scholar] [CrossRef] [PubMed]
- Chen, G.Z.; Li, X.; Liu, X.P.; Chen, Y.M.; Liang, X.; Leng, J.Y.; Xu, X.C.; Liao, W.L.; Qiu, Y.A.; Wu, Q.L. Global projections of future urban land expansion under shared socioeconomic pathways. Nat. Commun. 2020, 11, 537. [Google Scholar] [CrossRef] [PubMed]
- Kelley, A.C.; Schmidt, R.M. Aggregate population and economic growth correlations: The role of the components of demographic change. Demography 1995, 32, 543–555. [Google Scholar] [CrossRef] [PubMed]
- Sasaki, H.; Mino, K. Effects of exhaustible resources and declining population on economic growth with Hotelling’s rule. Int. Rev. Econ. Financ. 2024, 94, 103395. [Google Scholar] [CrossRef]
- Carter, R.C.; Parker, A. Climate change, population trends and groundwater in Africa. Hydrol. Sci. J.-J. Des Sci. Hydrol. 2009, 54, 676–689. [Google Scholar] [CrossRef]
- Li, K.M.; Fang, L.T.; He, L.R. How population and energy price affect China’s environmental pollution? Energy Policy 2019, 129, 386–396. [Google Scholar] [CrossRef]
- Molotoks, A.; Smith, P.; Dawson, T.P. Impacts of land use, population, and climate change on global food security. Food Energy Secur. 2021, 10, e261. [Google Scholar] [CrossRef]
- Jiao, L.M.; Xu, Z.B.; Xu, G.; Zhao, R.; Liu, J.F.; Wang, W.L. Assessment of urban land use efficiency in China: A perspective of scaling law. Habitat Int. 2020, 99, 102172. [Google Scholar] [CrossRef]
- Lei, W.Q.; Jiao, L.M.; Xu, Z.B.; Zhu, X.H. Evolution of urban land and population system coupling micro-dynamics and macro-stability: Trends and paths. Land Use Policy 2024, 141, 107152. [Google Scholar] [CrossRef]
- Ma, S.; Wang, G.; Xu, C.; Zhang, X.; Zhao, Y.; Cai, Y. Does the optimal land use pattern for cross-regional cooperation change at different stages of urbanization? Evidence from the trade-off between urban growth scenarios and SDGs indicators. Appl. Geogr. 2024, 167, 103294. [Google Scholar] [CrossRef]
- Yang, Y.Z.; Feng, Z.M.; Zhao, Y.D.; You, Z. Coordination between urban land expansion and population growth in China. Geogr. Res. 2013, 32, 1668–1678. [Google Scholar] [CrossRef]
- Zhu, F.K.; Zhang, F.R.; Li, C.; Jiao, P.F.; Wang, J.X. Coordination and regional difference of urban land expansion and demographic urbanization in China during 1993–2008. Prog. Geogr. 2014, 33, 647–656. [Google Scholar] [CrossRef]
- Jiang, S.G.; Zhang, Z.K.; Ren, H.; Wei, G.; Xu, M.H.; Liu, B.L. Spatiotemporal Characteristics of Urban Land Expansion and Population Growth in Africa from 2001 to 2019: Evidence from Population Density Data. Isprs Int. J. Geo-Inf. 2021, 10, 584. [Google Scholar] [CrossRef]
- Sarayrah, H.; Hayek, W.; Thneibat, A.; Ibrahim, M. Mapping of population growth influence on land use transformation from 1994 to 2015 in Madaba Governorate, Jordan. Environ. Monit. Assess. 2024, 196, 250. [Google Scholar] [CrossRef] [PubMed]
- Xu, Z.; Jiao, L.; Lan, T.; Zhou, Z.; Cui, H.; Li, C.; Xu, G.; Liu, Y. Mapping hierarchical urban boundaries for global urban settlements. Int. J. Appl. Earth Obs. Geoinf. 2021, 103, 102480. [Google Scholar] [CrossRef]
- Xiamen Ecological Environment Bureau. The ‘13th Five-Year Plan’ of Ecological Civilization Construction in Xiamen City. Available online: https://view.officeapps.live.com/op/view.aspx?src=https%3A%2F%2Fsthjj.xm.gov.cn%2Fzwgk%2Fzfxxgk%2Ffdzdgknr%2Fghjh%2Fsthjbhgh%2F201712%2FP020240823618841730059.doc&wdOrigin=BROWSELINK (accessed on 10 March 2025).
- Zhai, Z.W.; Chen, J.J.; Li, L. Future trends of China’s population and Aging: 2015~2100. Popul. Res. 2017, 41, 60–71. [Google Scholar]
- Wang, X.C.; Xiong, F.; Wang, Z.W.; Chen, S.; Zhang, Z.; Peng, L. Planning and Layout of Facilities for the Elders Based on POI and Machine Learning:A Case Study of Wuhan. Econ. Geogr. 2021, 41, 49–56. [Google Scholar] [CrossRef]
- Kumar, A.; Nanthaamornphong, A.; Selvi, R.; Venkatesh, J.; Alsharif, M.H.; Uthansakul, P.; Uthansakul, M. Evaluation of 5G techniques affecting the deployment of smart hospital infrastructure: Understanding 5G, AI and IoT role in smart hospital. Alex. Eng. J. 2023, 83, 335–354. [Google Scholar] [CrossRef]
- Ji, X.M.; Wang, K.; Ji, T.; Zhang, Y.H.; Wang, K. Coupling Analysis of Urban Land Use Benefits: A Case Study of Xiamen City. Land 2020, 9, 155. [Google Scholar] [CrossRef]
- Liang, C.; Zeng, J.; Shen, Z.J.; Wang, Q.W. Spatial pattern analysis and management of urban ecosystem services under rapid urbanization:A case study of Xiamen. Acta Ecol. Sin. 2021, 41, 4379–4392. Available online: https://www.ecologica.cn/stxb/ch/html/2021/11/stxb202012283297.htm (accessed on 21 August 2025).
- Li, Y.; Niu, Z.G. Systematic method for mapping fine-resolution water cover types in China based on time series Sentinel-1 and 2 images. Int. J. Appl. Earth Obs. Geoinf. 2022, 106, 102656. [Google Scholar] [CrossRef]
- Peng, S. 1-km monthly maximum temperature dataset for China (1901–2022). Natl. Tibet. Plateau/Third Pole Environ. Data Cent. 2020, 11, 1931–1946. [Google Scholar] [CrossRef]
- United Nations World Population Prospects 2024. Available online: https://population.un.org/wpp/assets/Files/WPP2024_Methodology-Report_Final.pdf (accessed on 10 March 2025).
- State Council National Population Development Plan (2016–2030). Available online: https://www.gov.cn/zhengce/content/2017-01/25/content_5163309.htm (accessed on 10 March 2025).
- Xiamen Municipal People ‘s Government. Xiamen Population Development Plan (2016–2030). Available online: https://view.officeapps.live.com/op/view.aspx?src=https%3A%2F%2Fwww.xm.gov.cn%2Fzwgk%2Fflfg%2Fsfwj%2F201812%2FP020181219404911586534.docx&wdOrigin=BROWSELINK (accessed on 10 March 2025).
- Tapio, P. Towards a theory of decoupling: Degrees of decoupling in the EU and the case of road traffic in Finland between 1970 and 2001. Transp. Policy 2005, 12, 137–151. [Google Scholar] [CrossRef]
- Liang, X.; Guan, Q.F.; Clarke, K.C.; Liu, S.S.; Wang, B.Y.; Yao, Y. Understanding the drivers of sustainable land expansion using a patch-generating land use simulation (PLUS) model: A case study in Wuhan, China. Comput. Environ. Urban Syst. 2021, 85, 101569. [Google Scholar] [CrossRef]
- Wang, B.S.; Liao, J.F.; Zhu, W.; Qiu, Q.Y.; Wagn, L.; Tang, L.N. The weight of neighborhood setting of the FLUS model based on a historical scenario: A case study of land use simulation of urban agglomeration of the Golden Triangle of Southern Fujian in 2030. Acta Ecol. Sin. 2019, 39, 4284–4298. Available online: https://www.sciengine.com/doi/pdf/A4E0315809FF45AABF61355DED4C2DA9 (accessed on 21 August 2025).
- Wang, J.N.; Wang, W.C.; Zhang, S.S.; Wang, Y.Y.; Sun, Z.H.; Wu, B.L. Spatial and temporal changes and development predictions of urban green spaces in Jinan City, Shandong, China. Ecol. Indic. 2023, 152, 110373. [Google Scholar] [CrossRef]
- Liang, X.; Liu, X.P.; Li, X.; Chen, Y.M.; Tian, H.; Yao, Y. Delineating multi-scenario urban growth boundaries with a CA-based FLUS model and morphological method. Landsc. Urban Plan. 2018, 177, 47–63. [Google Scholar] [CrossRef]
- Liang, X.; Tian, H.; Li, X.; Huang, J.-L.; Clarke, K.C.; Yao, Y.; Guan, Q.F.; Hu, G.H. Modeling the dynamics and walking accessibility of urban open spaces under various policy scenarios. Landsc. Urban Plan. 2021, 207, 103993. [Google Scholar] [CrossRef]
- Jian, L.; Xia, X.J.; Liu, X.Y.; Zhang, Y.; Wang, Y.Q. Spatiotemporal variations and multi-scenario simulation of urban thermal environments based on complex networks and the PLUS model: A case study in Chengdu central districts. Sustain. Cities Soc. 2024, 115, 105833. [Google Scholar] [CrossRef]
- UN-Habitat. A New Strategy of Sustainable Neighbourhood Planning: Five Principles. Available online: https://unhabitat.org/sites/default/files/download-manager-files/A%20New%20Strategy%20of%20Sustainable%20Neighbourhood%20Planning%20Five%20principles.pdf (accessed on 10 March 2025).
- Zhai, Y.; Yao, Y.; Guan, Q.; Liang, X.; Li, X.; Pan, Y.; Yue, H.; Yuan, Z.; Zhou, J. Simulating urban land use change by integrating a convolutional neural network with vector-based cellular automata. Int. J. Geogr. Inf. Sci. 2020, 34, 1475–1499. [Google Scholar] [CrossRef]
- Yao, Y.; Liu, X.; Li, X.; Liu, P.; Hong, Y.; Zhang, Y.; Mai, K. Simulating urban land-use changes at a large scale by integrating dynamic land parcel subdivision and vector-based cellular automata. Int. J. Geogr. Inf. Sci. 2017, 31, 2452–2479. [Google Scholar] [CrossRef]
- Pontius, R.G.; Boersma, W.; Castella, J.C.; Clarke, K.; Nijs, T.D.; Dietzel, C.; Duan, Z.; Fotsing, E.; Goldstein, N.; Kok, K.; et al. Comparing the input, output, and validation maps for several models of land change. Ann. Reg. Sci. 2008, 42, 11–37. [Google Scholar] [CrossRef]
- Zhang, X.L.; Zhai, Z.W.; Tao, T. Trends and patterns of negative population growth in China. Popul. Res. 2020, 44, 3–20. [Google Scholar]
- Kabisch, N.; Haase, D.; Haase, A. Urban Population Development in Europe, 1991-2008: The Examples of Poland and the UK. Int. J. Urban Reg. Res. 2012, 36, 1326–1348. [Google Scholar] [CrossRef]
- Haartsen, T.; Venhorst, V. Planning for Decline: Anticipating on Population Decline in The Netherlands. Tijdschr. Voor Econ. En Soc. Geogr. 2010, 101, 218–227. [Google Scholar] [CrossRef]
- Assmann, S. Japan’s Shrinking Regions in the 21st Century: Contemporary Responses to Depopulation and Socioeconomic Decline. J. Asian Stud. 2014, 73, 1135–1137. [Google Scholar] [CrossRef]
- Rosen, B.; Waitzberg, R.; Israeli, A.; Hartal, M.; Davidovitch, N. Addressing vaccine hesitancy and access barriers to achieve persistent progress in Israel’s COVID-19 vaccination program. Isr. J. Health Policy Res. 2021, 10, 43. [Google Scholar] [CrossRef]
- Liu, Y.; Huang, C.; Wu, R.; Pan, Z.; Gu, H. The spatial patterns and determinants of internal migration of older adults in China from 1995 to 2015. J. Geogr. Sci. 2022, 32, 2541–2559. [Google Scholar] [CrossRef]
- Hermawan, F.; Rachmawati, T.; Wahyono, H.L. Does Demographic Pattern Matter for Sustainable Infrastructure Policy? Procedia Eng. 2015, 125, 481–488. [Google Scholar] [CrossRef]
- Faust, K.M.; Abraham, D.M.; DeLaurentis, D. Coupled Human and Water Infrastructure Systems Sector Interdependencies: Framework Evaluating the Impact of Cities Experiencing Urban Decline. J. Water Resour. Plan. Manag. 2017, 143. [Google Scholar] [CrossRef]
- Faure, J.C.; Faust, K.M. Socioeconomic characteristics versus density changes: The operational effects of population dynamics on water systems. Sustain. Resilient Infrastruct. 2023, 8, 3–16. [Google Scholar] [CrossRef]
- Ju, Y.J.; Kim, W.; Chang, K.; Lee, T.H.; Lee, S.Y. Association between residing in municipalities facing population decline and satisfaction with neighboring healthcare infrastructure in older aged adults. BMC Public Health 2024, 24, 2070. [Google Scholar] [CrossRef] [PubMed]
- Wu, R.W.; Zhang, J.L.; Zhou, L.; Zhang, Q. Population aging in Chinese counties: Change of regional types and influencing factors from the population mobility perspective. Prog. Geogr. 2025, 44, 1213–1226. [Google Scholar] [CrossRef]
- Xu, Z.B.; Jiao, L.M.; Wang, Y. Comparison of urban land expansion between urban physical and administrative areas in China from 1988 to 2018. Acta Geogr. Sin. 2022, 77, 2514–2528. [Google Scholar] [CrossRef]
- Xiang, S.S.; Huang, L.Y.; Zhou, M.M.; Shan, L.P.; Dong, B.Y.; Wang, K. Dynamic analysis of correlation patterns between urban population and construction land at different administrative levels: The case of Hangzhou megacity. Ecol. Indic. 2023, 154, 110407. [Google Scholar] [CrossRef]
- Lawrence, M.; Homer-Dixon, T.; Janzwood, S.; Rockstöm, J.; Renn, O.; Donges, J.F. Global polycrisis: The causal mechanisms of crisis entanglement. Glob. Sustain. 2024, 7, e6. [Google Scholar] [CrossRef]
- Lawrence, M. Polycrisis in the Anthropocene: An invitation to contributions and debates. Glob. Sustain. 2024, 7, e5. [Google Scholar] [CrossRef]
- Haase, D. Shrinking Cities, Biodiversity and Ecosystem Services. In Urbanization, Biodiversity and Ecosystem Services: Challenges and Opportunities: A Global Assessment; Thomas, E., Michail, F., Julie, G., Güneralp, B., Marcotullio, P.J., McDonald, R.I., Parnell, S., Schewenius, M., Sendstad, M., et al., Eds.; Springer: Dordrecht, The Netherlands, 2013; pp. 253–274. [Google Scholar]


Disclaimer/Publisher’s Note: The statements, opinions and data contained in all publications are solely those of the individual author(s) and contributor(s) and not of MDPI and/or the editor(s). MDPI and/or the editor(s) disclaim responsibility for any injury to people or property resulting from any ideas, methods, instructions or products referred to in the content. |
© 2025 by the authors. Licensee MDPI, Basel, Switzerland. This article is an open access article distributed under the terms and conditions of the Creative Commons Attribution (CC BY) license (https://creativecommons.org/licenses/by/4.0/).