Article

From Bare Soil to Green Infrastructure: Micrometeorological Benefits from the Restoration of a Small Urban Park in a Mediterranean City

by
Nikolaos D. Proutsos
1,*,
Alexandra D. Solomou
1 and
Stefanos P. Stefanidis
2
1
Institute of Mediterranean Forest Ecosystems, Hellenic Agricultural Organization-DIMITRA, 11528 Athens, Greece
2
Forest Research Institute, Hellenic Agricultural Organization-DIMITRA, 57006 Thessaloniki, Greece
*
Author to whom correspondence should be addressed.
Land 2025, 14(8), 1681; https://doi.org/10.3390/land14081681
Submission received: 18 July 2025 / Revised: 8 August 2025 / Accepted: 18 August 2025 / Published: 20 August 2025

Abstract

Urban green spaces (UGSs) are a vital component of urban landscapes nowadays, with an impact on energy distribution in cities and local climate regulation. This study aims to quantify the thermal and optical behavior of various materials in a small-scale Mediterranean UGS and provide insights into the use of green and artificial materials in urban parks. The analysis also includes the changes in the UGS’s optical and thermal properties following its restoration in 2024. The thermal comfort in the UGS is assessed for the 2020–2024 period, along with the reflectivity and surface temperatures of the different materials pre- (in 2022) and post-restoration (in 2024), using in situ measurements. The results show notable seasonal and interannual variability in the thermal comfort of the site. The impact of vegetation on the UGS was critical. The vegetation-covered surfaces exhibited surface temperatures close to ambient air temperature, highlighting their effective thermal regulation. During summer mornings, the average temperatures of the vegetation-covered surfaces were around 30.5 °C, lower compared to artificial or non-green materials, like asphalt, concrete, gravel, and dry bare soil, which were above 42 °C. The vegetation albedo was relatively lower (around 0.19), while artificial covers showed a greater reflectance (up to 0.35), thus boosting the heat retention. These results highlight the essential importance of green infrastructure incorporation to boost the thermal dynamics of urban open spaces and mitigate climate change effects.

1. Introduction

Urban green spaces (UGSs) are widely acknowledged as an effective nature-based solution to mitigate urban warming, moderate the urban heat island (UHI) effect, and regulate urban temperatures in modern cities [1,2,3,4,5,6]. This is critically important for densely built and heavily populated urban areas, especially in the Mediterranean, which is considered one of the most densely populated regions globally [7]. In addition, the Mediterranean basin is considered as a global climate change hot spot [8] since the local climate is characterized by long summers with hot and dry conditions and increased water scarcity [9,10,11], high solar radiation intensity, increased and long-lasting heat stress conditions, and decreased diurnal temperature fluctuations [10], suggesting a harsh environment for citizens’ health and well-being [7].
Such conditions intensify the UHI effect [12,13], whereas future projections for the Mediterranean foresee even more unfavorable conditions. Increasing warming with longer and warmer summers, stronger and more frequent heatwaves, droughts, and dust storms, and reduced precipitation is likely to occur in the future [7,14]. In conjunction with the synergetic effect of urban pollution, this raises concerns and brings significant challenges to the comfort conditions of citizens and the sustainability of modern cities [15].
The incorporation of urban green infrastructure into urban design provides multiple environmental and socio-economic benefits, including valuable ecosystem and ecological services, and strengthens the resilience of modern smart cities [16,17,18,19,20,21,22]. The increase in urban green spaces is highly encouraged and promoted in many countries worldwide [23,24]. Although the relevant research on UGSs is generally limited, it has presented remarkably increasing trends during the last decades [25]. Recent studies are focused on evaluating the impact of green roofs, urban parks, and vertical greening systems on the urban environment [25] and examining the effects of shading [21,26,27], evapotranspiration and energy exchange processes [26,28,29], albedo modification and radiation energy allocation [30,31], thermal comfort conditions [32,33,34,35,36], temporal variability in vegetation cooling effect [37,38,39], urban biodiversity and habitat complexity [40], etc.
At the international level, there is an increasing demand for integrating an ecosystem approach into the urban environment. The application of ecosystem-based assessments and methodologies in urban areas oriented to climate change adaptation and mitigation policies for ecosystem protection [41], as well as the allocation of nature-based solutions (NbS) in the urban environment in order to enhance ecosystem services [42], is highly recommended in modern resilient smart cities. Such approaches align vital green infrastructure planning principles with urban regeneration [43] and alter the current traditional unsustainable management and design framework of urban green infrastructure, aiming to create resilient and healthier environments in urban and rural areas [44].
Understanding the relations between vegetation, material properties, and thermal regulation in cities is essential in urban planning. Vegetation influences microclimates through processes and mechanisms, such as transpiration and shading, which reduce surface and air temperatures [29]. Vegetation patterns with different plant species and densities affect transpiration rates and canopy cover [45], impacting the effective reduction in heat storage in cities. Accordingly, material properties, such as reflectivity to solar radiation, thermal conductivity, and moisture content, can determine the surface response to absorb, store, and release heat [46]. These physical properties are directly associated with residents’ thermal comfort and public health and welfare [47].
The cooling effect of UGSs, regardless of their size, is particularly important for the Mediterranean region, especially during summer middays [48]. Particularly in the Mediterranean, small UGSs are quite common, due to constraints of the built-up urban environment [49]. Research interest in the thermal behavior of small-scale UGSs has increased in recent years. Small UGSs are characterized as highly important for modern cities because they provide several social and ecological benefits, including resident wellbeing, biodiversity conservation, mitigation of urban heat and climate change impacts, etc. [50]. However, there are generally few microscale case studies, suggesting a literature gap [51].
The aim of this work is to investigate the thermal and optical behavior of a small-scale urban green space in a Mediterranean city during warm summer conditions, following previous works by the authors in Greek cities [30,35]. The objective is to understand how vegetation can influence surface temperatures and reflectance under summer heat conditions, providing insights into the positive effects of vegetation on the regulation of the microclimate at localized scales. Measurements of reflectance (albedo) and surface temperatures were taken during one-day campaigns under clear skies and warm conditions in the years 2022 and 2024. In the first year, the urban space was covered mainly by dry bare soil, and in 2024, it was fully restored and planted. The changes in the optical and thermal properties of the urban green space are discussed, and the differences between the different types of materials (either green or artificial) used in the restoration are assessed. The results of this study can provide insights for strategic planning of urban green infrastructure and climate governance in cities and useful information for researchers, urban planners, and decision-making stakeholders.
It is important to note that the measurements concerning the performance of the different materials presented in this work were conducted during specific summer days characterized by heat stress conditions, not over the entire year or multiple seasons. This is because the primary aim was to evaluate the optical and thermal behavior of the different cover types under heat-stressful conditions, providing insights into the cooling potential of small-scale urban green spaces during peak heat stress periods in Mediterranean cities.

2. Materials and Methods

2.1. Study Site

The study site is a small-scale urban open space covering an area of 0.64 ha (Figure 1), located in the city of Heraklion, Crete, S. Greece (35.31° N, 25.14° E, alt.: 81 m a.s.l.). The surroundings of the site areas are mainly built up, but many private open spaces covered by bare soil and sparse vegetation remain. The study focused on a relatively small urban green space, which can be considered representative of the urban environment in many Mediterranean cities, including those in Greece, where urban open spaces are compact and characterized by small green patches. Thus, microclimatic dynamics and the thermal and optical performance of such small areas can provide insights for targeted urban planning interventions, tailored to small-scale urban settings.
Since 2022, the site has been an open space covered by dry soil with sparse vegetation. More specifically, the vegetation consisted of several woody plants (e.g., Pinus brutia Tenore, Araucaria heterophylla Salisb. Franco, Cascabela thevetia L., Ficus elastica Roxb, Ficus carica L., Rosmarinus officinalis L., Medicago arborea L.) and herbaceous plants (e.g., Erodium cicutarium L., Veronica polita Fr., Capsella bursa-pastoris L., Smyrnium olusatrum L., Catapodium rigidum L., Bromus rubens L., Avena sterilis L., Papaver rhoeas L., Plantago lagopus L.).
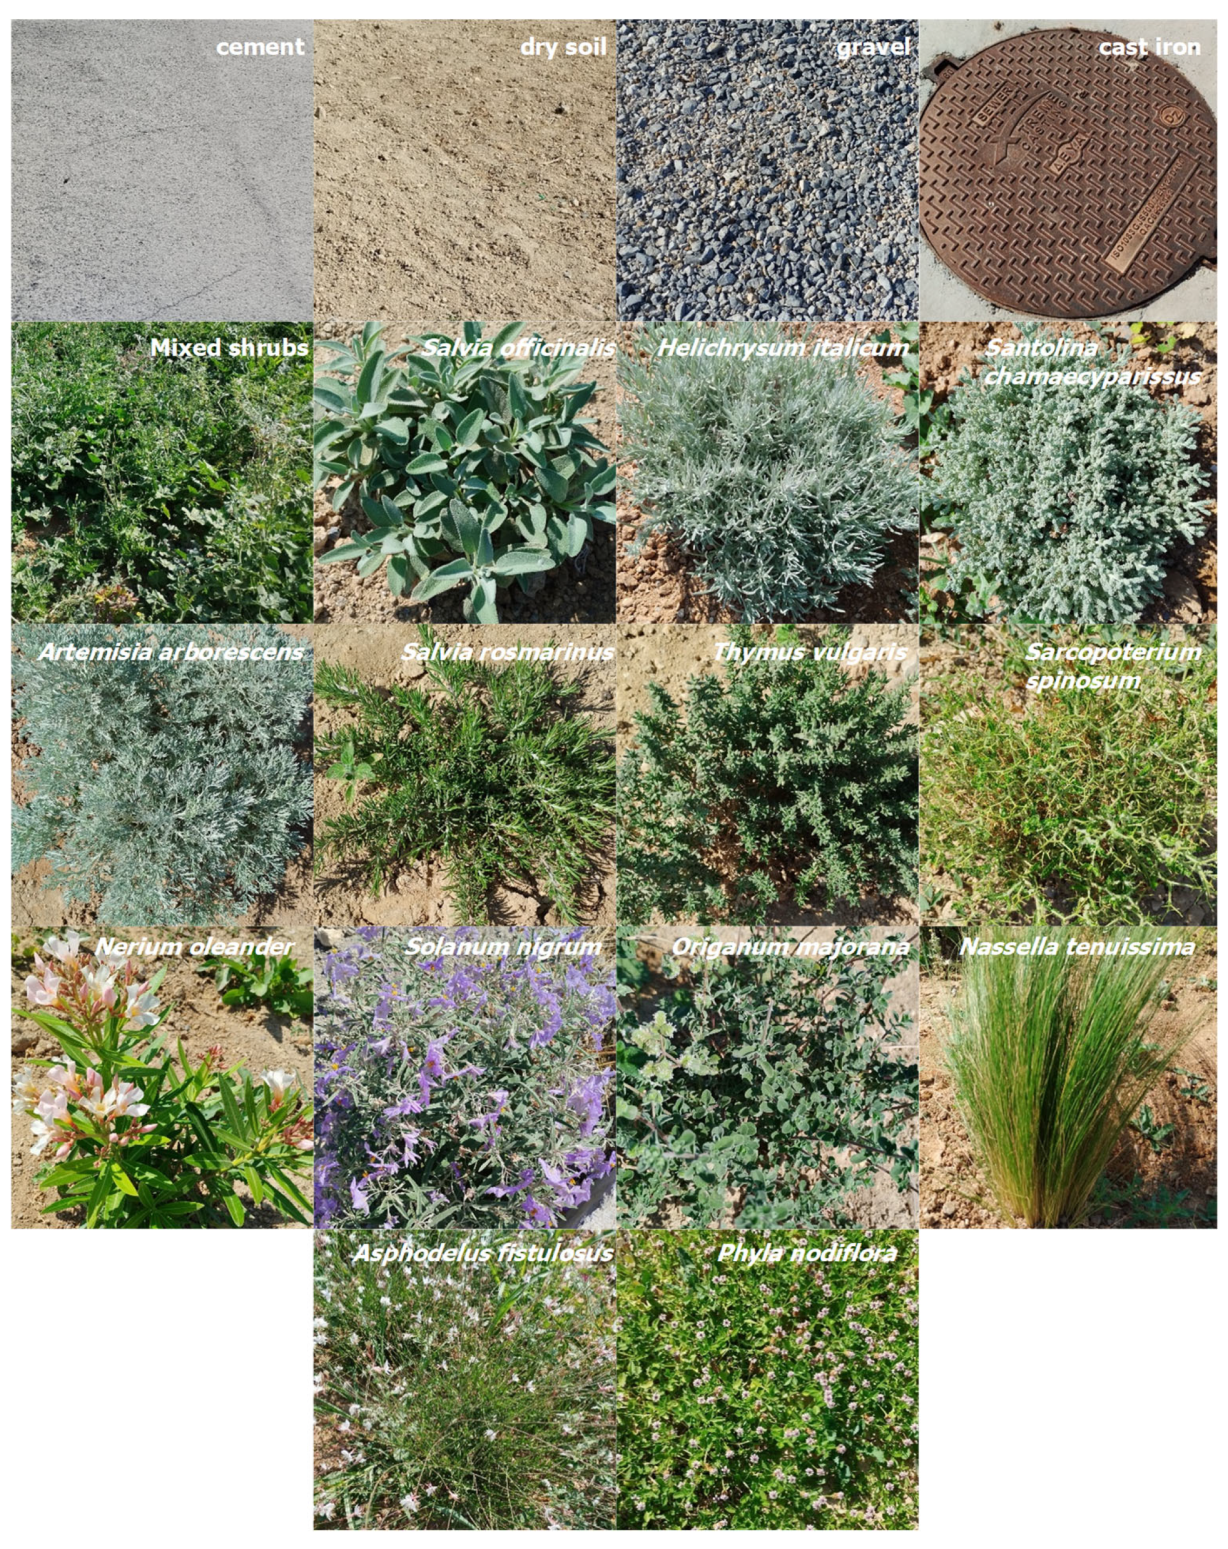
In 2024, it was restored and transformed into a planted urban green space (UGS). Selected plant species were planted by the Municipality of Heraklion, consisting mainly of shrubs and herbaceous plants (Figure 2) in mixed patterns, whereas parts of the area were occupied by corridors covered with gravel, cement, and dry bare soil. The restoration of the site was completed in July 2024.
Based on long-term meteorological data of the 1955–2017 period, recorded by the local meteorological station (35.34° N, 25.18° E, alt.: 39 m a.s.l.) that is owned and operated by the Hellenic Meteorological Service, the climate of the area is sub-humid [52,53] according to UNEP’s aridity classification system [54], based on Thornthwaite’s water balance approach [55,56]. However, recent trends indicate that the local climate shifted to more arid and warm conditions, whereas drought episodes increased in frequency during the recent decades compared to the past [53,57,58].

2.2. Data and Methods

At the site, an automatic meteorological station was installed in 2019 (Figure 1) to monitor the environmental conditions, recording several atmospheric and soil parameters, including air temperature and relative humidity (EE08, E+E Elektronik Ges.m.b.H., Engerwitzdorf, Austria), global solar radiation (Pyranometer SP-Lite, ADCON Telemetry, Klosterneuburg, Austria, with a sensitivity change of 2% per year), and wind speed (Small Wind Transmitter, THIES CLIMA, Adolf Thies GmbH & Co. KG, Göttingen, Germany), which were the meteorological parameters used in this study. The measurements from all sensors were recorded every 5 s and averaged on a 10 min basis.
Surface temperatures and reflectance properties of the UGS’s elements were also measured by using portable sensors. More specifically, an MI-210 infrared radiometer (Apogee Electronics, Santa Monica, CA, USA) was used to record surface temperatures. The sensor was placed about 40 cm above each surface. An LP 471 RAD radiation sensor (Delta OHM, Caselle di Selvazzano, Italy) was used to record the incoming and reflected global solar radiation flux densities at wavelengths of 400–1050 nm, in order to determine the reflectance (albedo) of the surfaces. Air temperature and relative humidity conditions were also measured by a portable HD 2301.0 handheld thermo-hygrometer equipped with a Pt100 humidity/temperature sensor, and the recordings were confirmed with the data recorded by the meteorological station.
These in situ measurements were conducted during very warm summer days in the years 2022 and 2024 (i.e., before and after the restoration of the UGS). More specifically, two daily campaigns were implemented on 29 July 2022 (around noon 11:30–13:30) and on 1 August 2024 (both in the morning, 9:30–10:30, and at noon, 13:30–15:30). Surface temperature and albedo measurements were conducted at 90 points in 2022 and at 203 points in 2024, inside the site and above different elements and cover types of the UGS. Prior to data collection, all the sensors were calibrated against new, unused instruments to ensure accuracy. The typical calibration errors were less than ±0.2 °C for the infrared radiometers and less than ±2% for the radiation sensors. The geo-reference of the point measurements was confirmed by GPS, and the validation of the geo-tagging correction was performed by cross-referencing the GPS positions with known landmarks within the study area, achieving positional accuracy within 0.5 m. All measurement points were located to represent typical conditions of surfaces covered by vegetation, artificial materials, and bare soil in the total area of the site.
The spatial patterns of the measured parameters presented in this work were generated by Surfer® ver. 13 software [59]. The widely used Point Kriging geostatistical gridding method was employed, as it is a recognized method for producing dependable gridded data across a spatial domain [60]. This method is appropriate for irregularly spaced data points [60], using weighted averages of neighboring known values, and it was also employed in similar research studies [30,35].
The Predicted Mean Vote (PMV, [61]) and the Physiological Equivalent Temperature (PET, [62]) were also estimated to assess and classify the thermal comfort for an average human (35 years old male, 1.75 m height, 75.0 kg weight, 80 W internal heat production due to activity, 0.9 clo clothing index) standing in the UGS, using RayMan Pro © ver. 3.1 software [63,64] according to the guidelines and the thermal comfort classification system described in Matzarakis and Mayer [65].
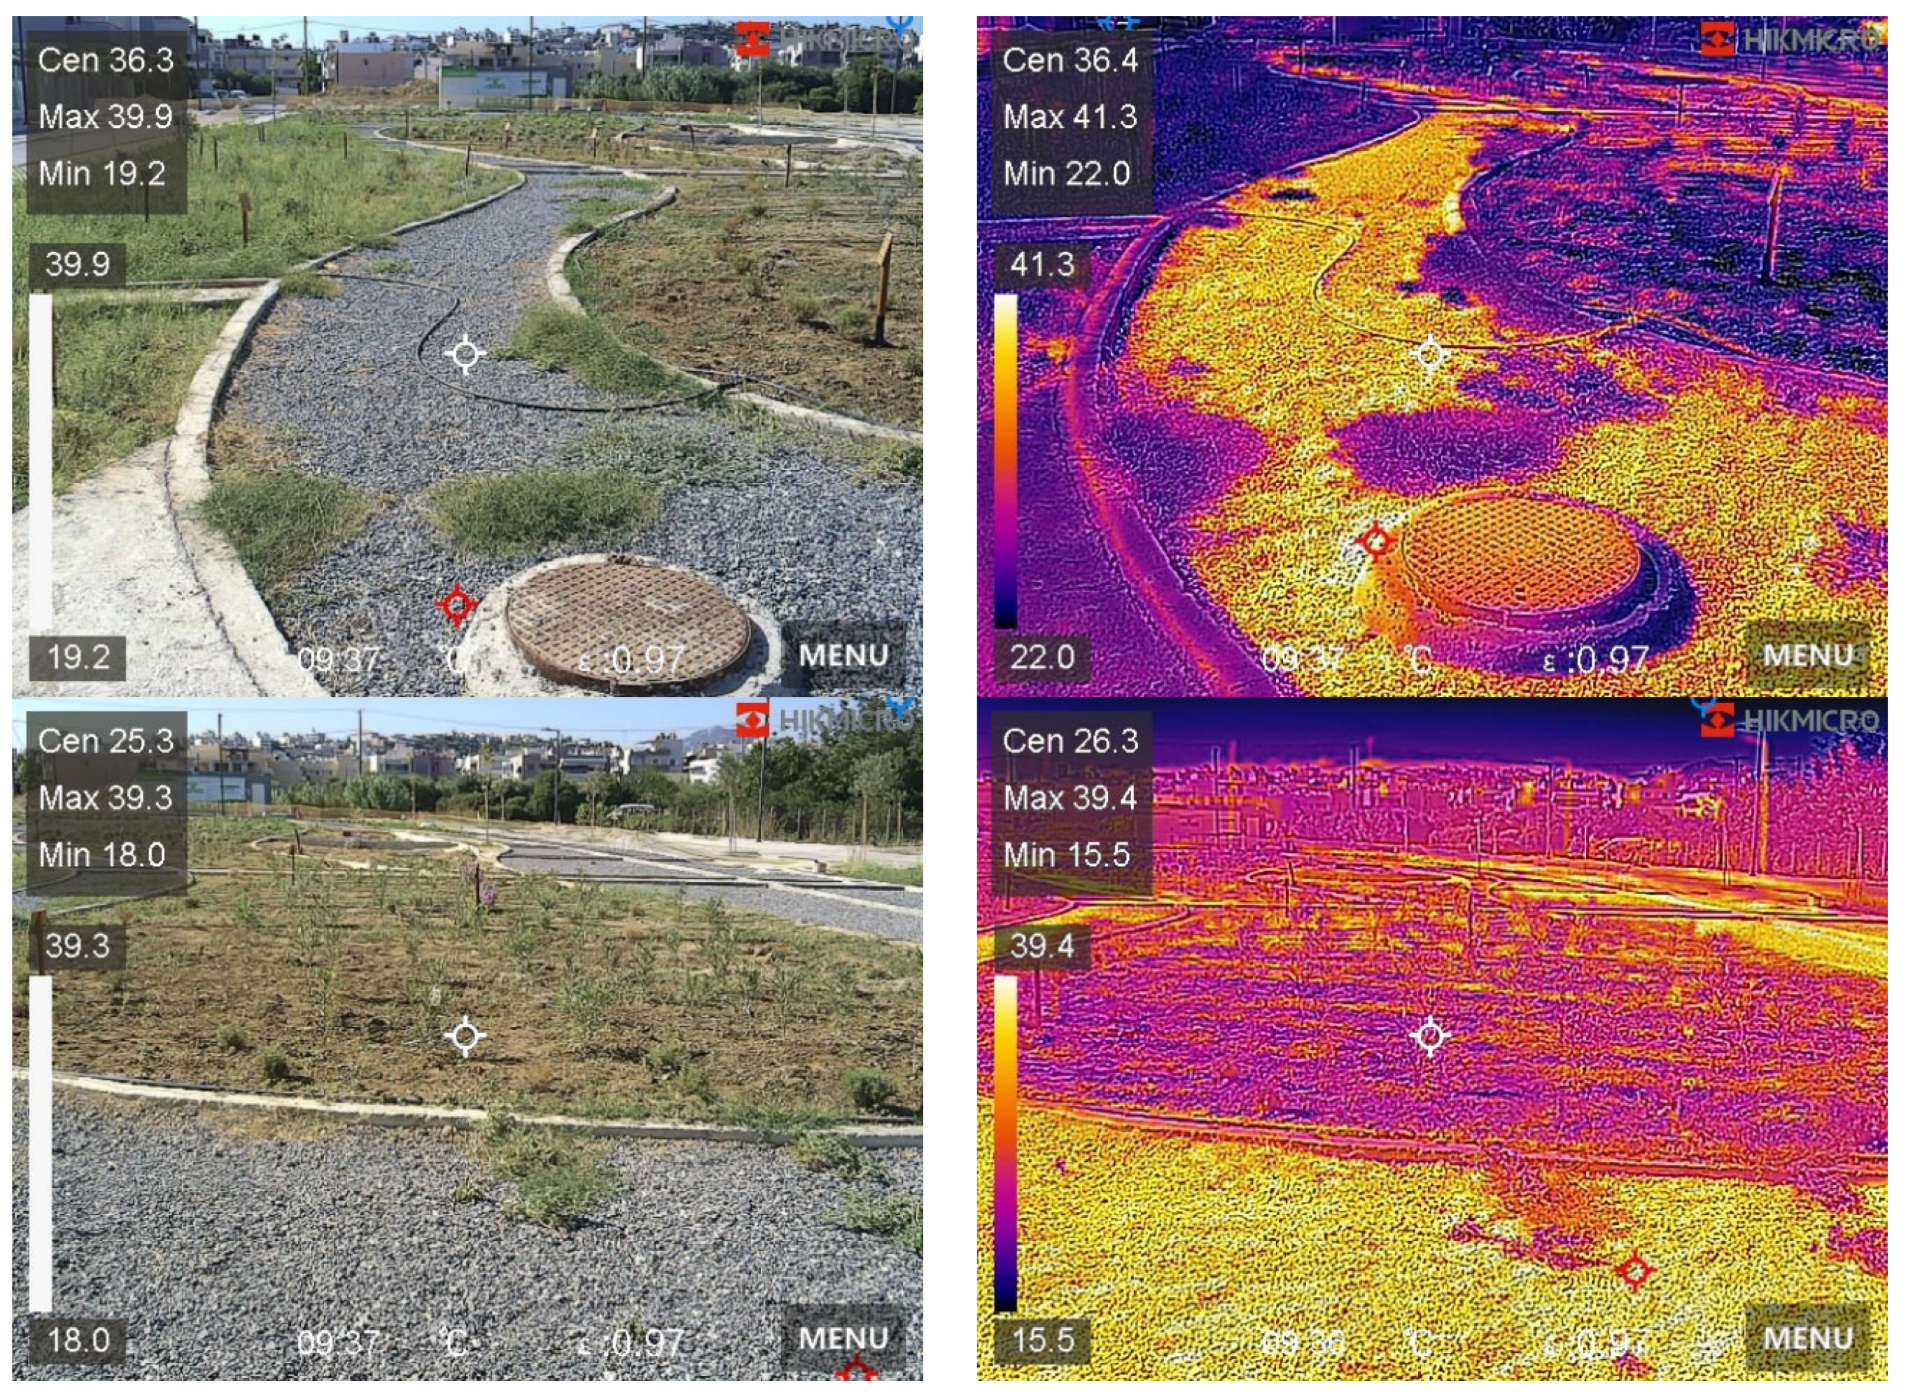
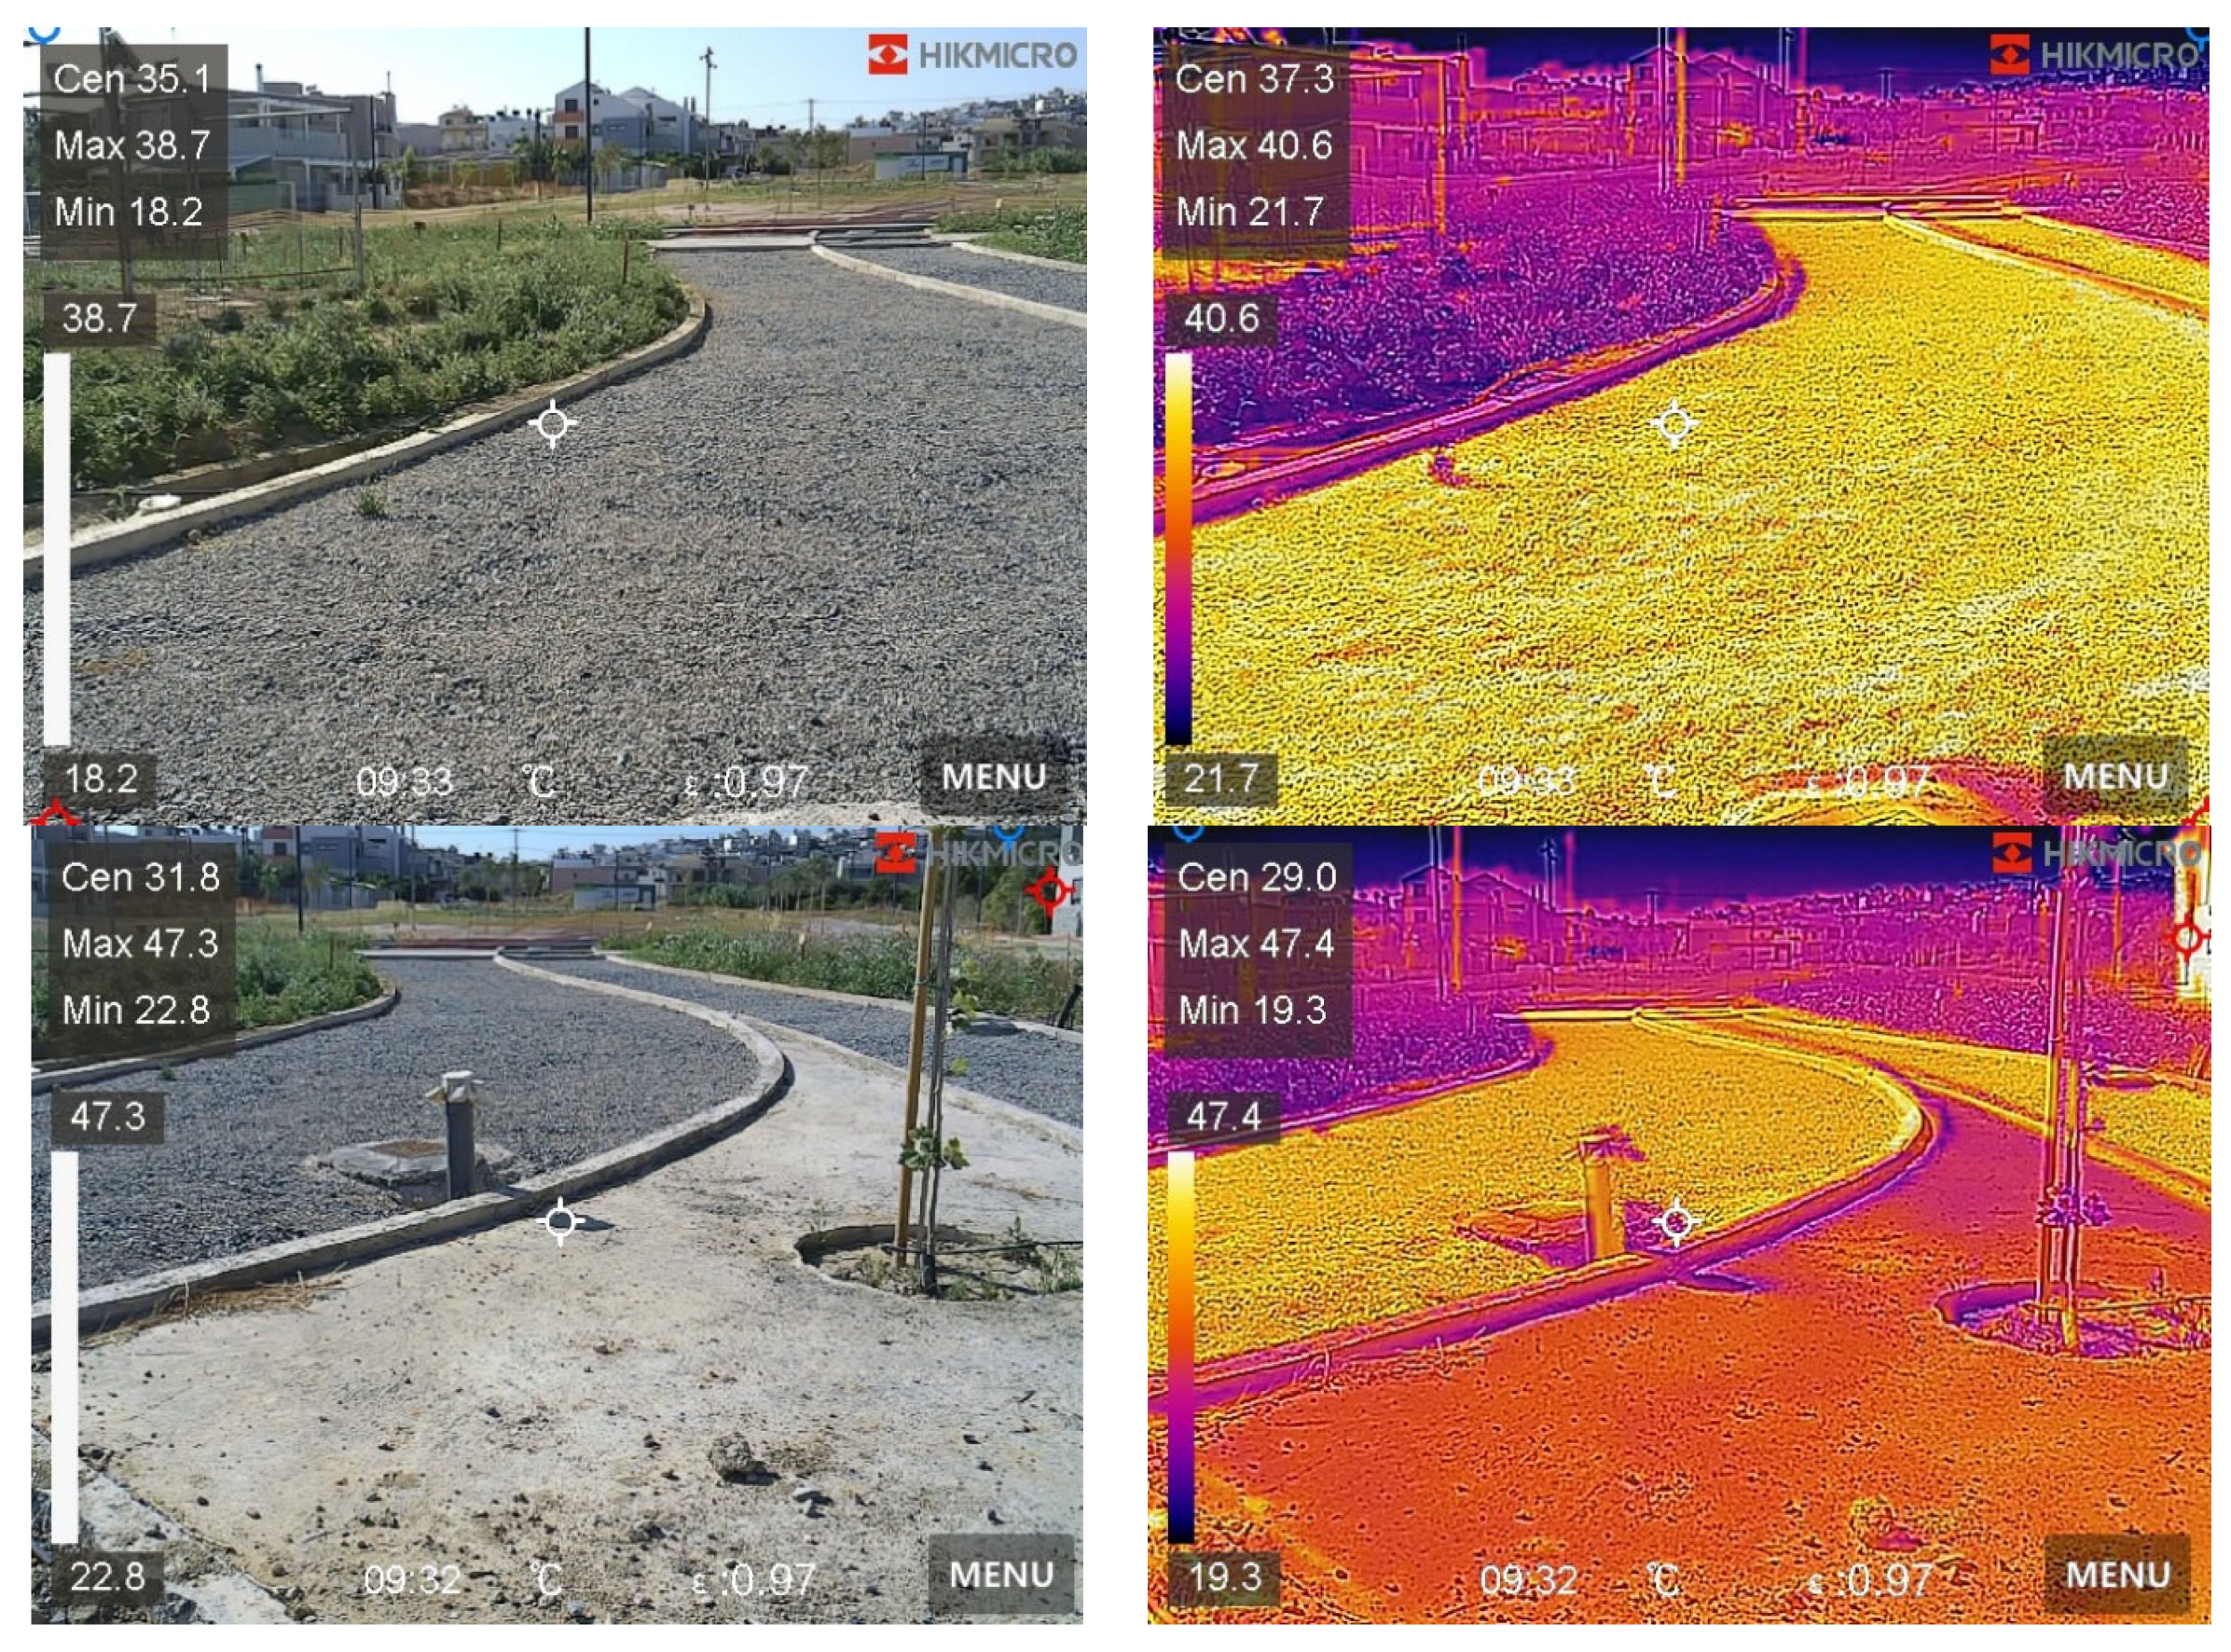
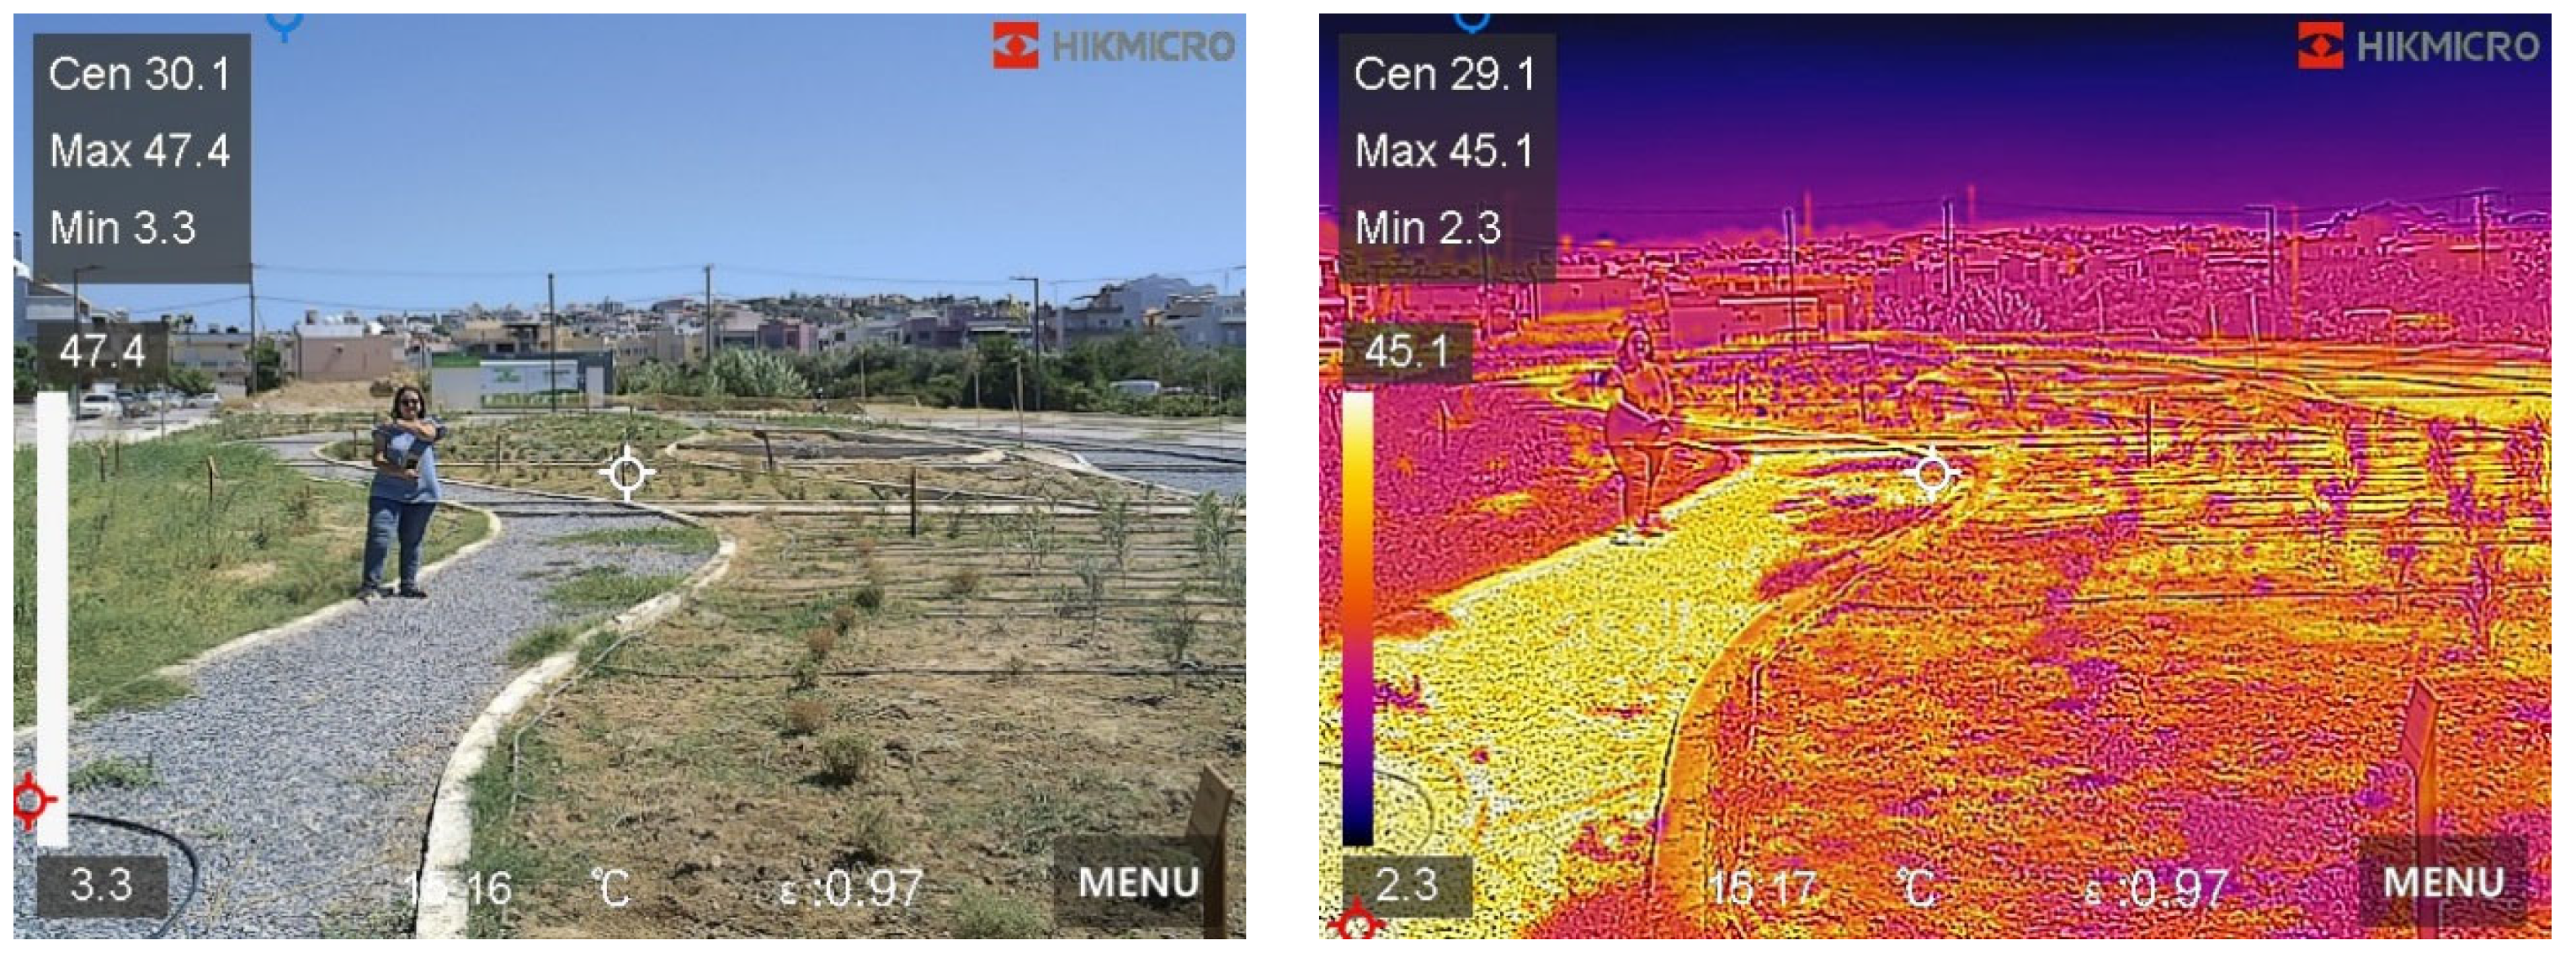
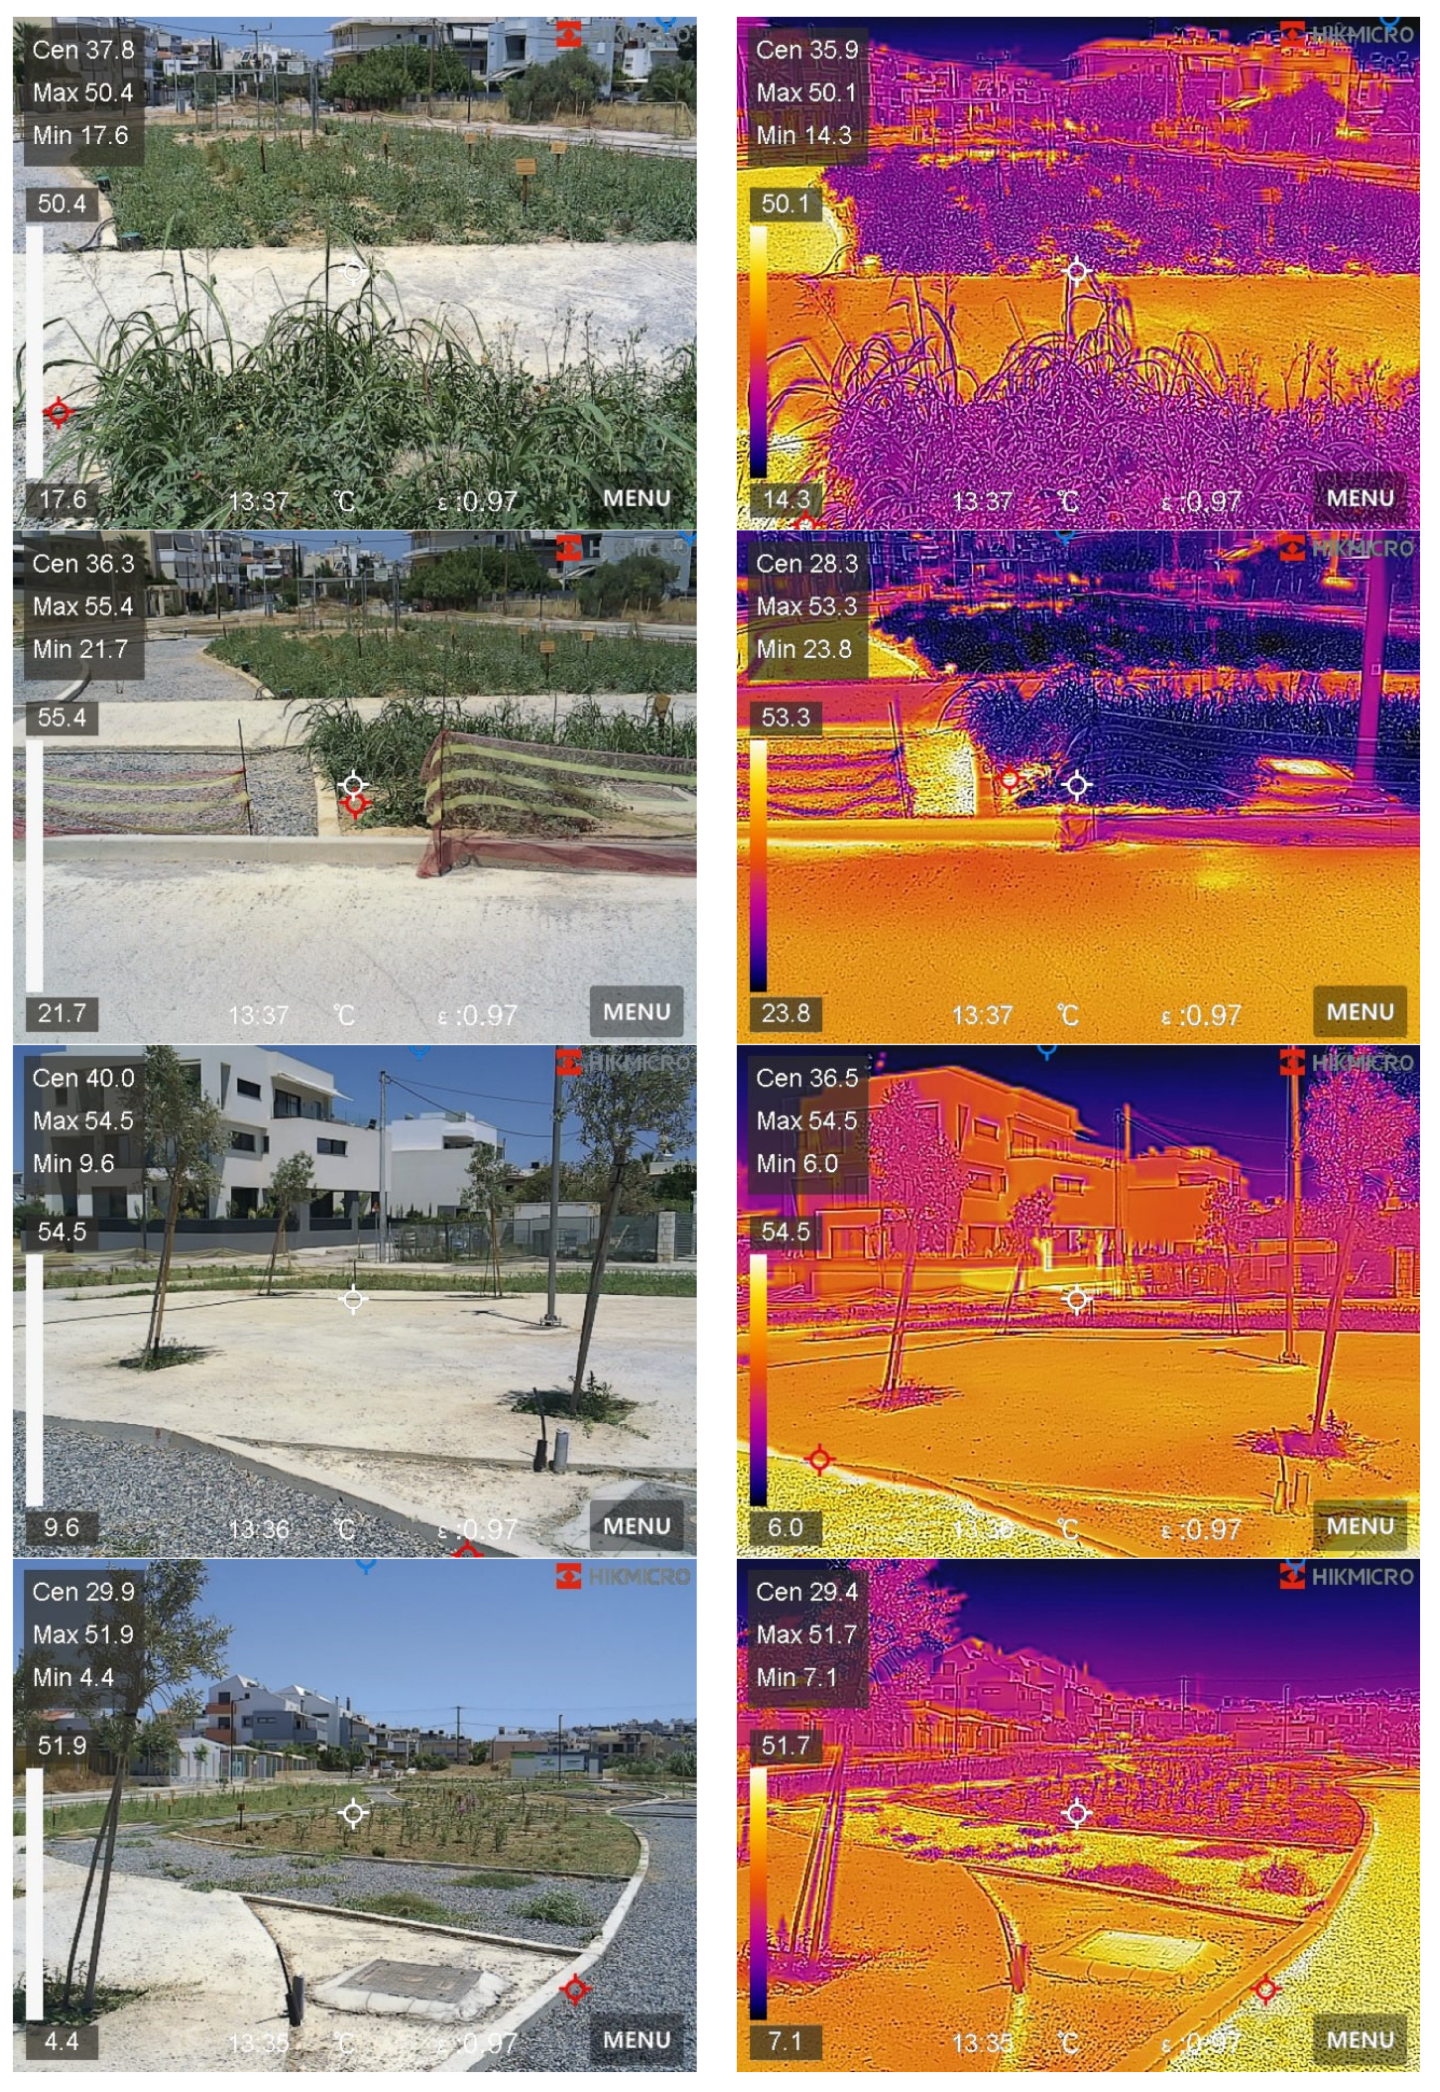
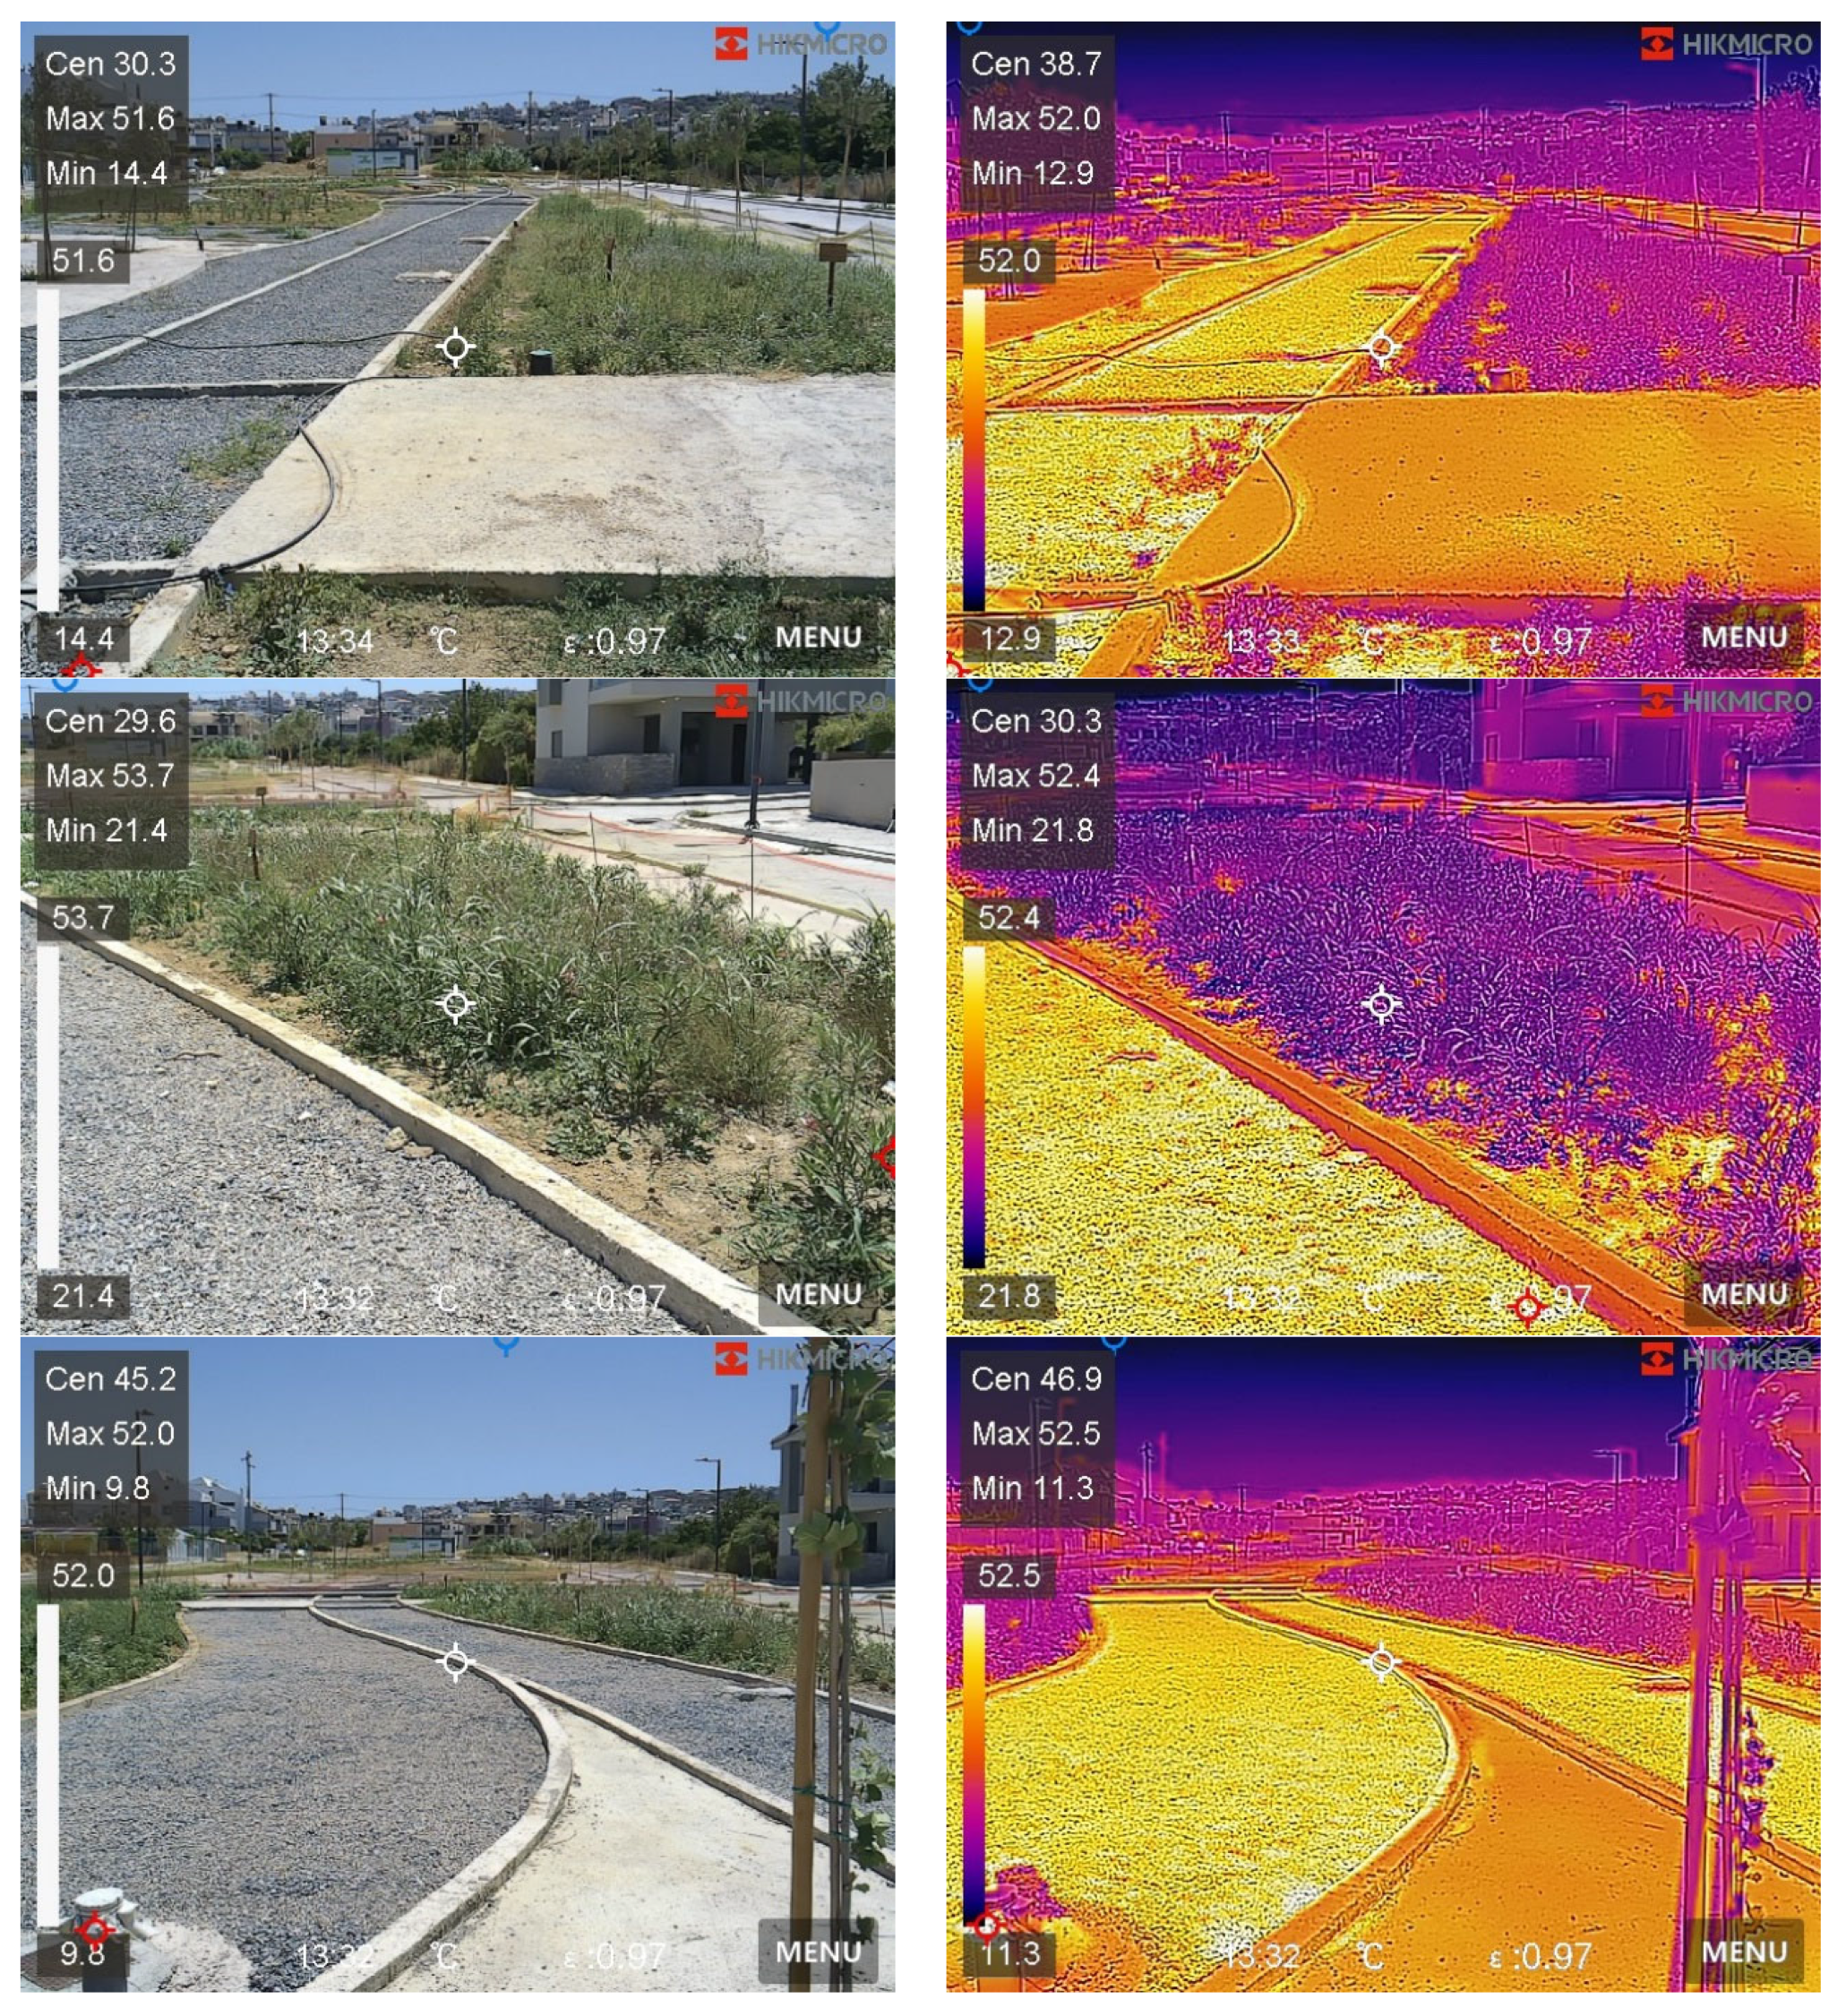
To visually present the thermal conditions in the UGS, thermal images were taken during the 2024 measurement campaign, which are presented in Appendix A. The images were taken by a HIKMICRO handheld thermography camera (model: HM-TP42-3AQF/W-Pocket2, Hangzhou Microimage Software Co., Ltd., Hangzhou, China) and can clearly depict the differences between surface temperatures at the different elements present in the UGS.

2.3. Meteorological Conditions

During the 2020–2024 time period, when the meteorological station was installed, the average annual air temperature at the site was 19.5 °C, varying among years from 18.9 °C in 2022 to 20.3 °C in 2024. In general, July was the hottest month of the year (average air temperature 27.6 °C), and February was the coolest (12.4 °C). Regarding precipitation, the area receives low precipitation amounts on an annual basis (432 mm), distributed mainly in the winter months (December to February: 218 mm), with lower amounts during the transitional seasons of autumn (125 mm) and spring (78 mm), and negligible amounts in summer (11 mm). This pattern suggests that stressful environmental conditions for vegetation growth and survival persist in the area.
It is worth noting that during the recording period of the station, specifically in July 2023, a strong heatwave hit Europe [66,67,68,69], which, according to the United Nations, was the strongest and longest heatwave ever recorded [70]. According to the records of our station, July’s average air temperature was 28.5 °C and was higher compared to all other years (ranging from 26.6 °C in 2020 to 28.4 in 2024), confirming that the heatwave also hit the island of Crete, which is located at the southernmost part of Europe.
Focusing on the meteorological conditions prevailing at the site during the two measurement campaigns that were conducted on 29 July 2022 and on 1 August 2024, the diurnal distributions of air temperatures are presented in Figure 3, in conjunction with the respective annual patterns for the years 2022 and 2024 and for the 2020–2024 period.
The above patterns generally indicate that the air temperatures in 2022 were cooler, and those in 2024 were warmer, compared to the averages in the 2022–2024 period, and these differences persisted in both the day and night. During the measurement campaigns, the daily temperatures were high for both summer days (29 July 2022 and 1 August 2024), and daytime temperatures on 29 July 2022 were warmer compared to 1 August 2024, but the pattern was opposite during nighttime. Soil moisture at the site was low during both days of measurement, measuring 13.6% p.v. on 29 July 2022 and 6.9% p.v. on 1 August 2024, indicating relatively dry soil conditions.

3. Results

3.1. Thermal Comfort

In the site in Heraklion, the monthly averages of PMV and PET, along with the respective classification in human thermal comfort classes, are presented in Table 1 and Table 2 for the time period from January 2020 to December 2024. Based on these results, the annual PMV presented an average annual value of −0.30, varying between years from −0.45 in 2022 to −0.14 in 2024. This suggests that the overall thermal comfort at the site is neutral, but cooler conditions prevailed at the site in 2022 compared to 2024. The index’s seasonal distribution demonstrates, in general, negative values in winter, spring, and autumn (on average −1.94, −0.74, and −0.04, respectively) and positive values in summer (+1.50), which is rather expected for the Mediterranean climate of the region. Its interannual variation for the 2020–2024 period indicates that the winter was cooler in 2022 (PMV average values of −2.06) and warmer in 2023 (−1.86) compared to all other years, whereas a cooler spring was also recorded in 2022 (−1.01) and a warmer spring was recorded in 2024 (−0.46). Accordingly, in 2020 and in 2022, the summers were cooler (1.36 and 1.37, respectively), and in 2024, the summer was warmer (1.75), whereas the autumn of 2021 was the coolest (−0.16) and that in 2023 was the warmest (+0.19). Considering only the years 2022 and 2024, in general, cooler atmospheric conditions prevailed at the site during all seasons in 2022 compared to 2024.
Similar to the PMV values, the PET values confirm the above-mentioned annual and seasonal patterns. For the 2020–2024 period, the annual PET was on average 19.0 °C, ranging inter-annually from 18.2 °C in 2022 to 19.8 °C in 2024. Year 2022 was also cooler compared to 2024 during all seasons.
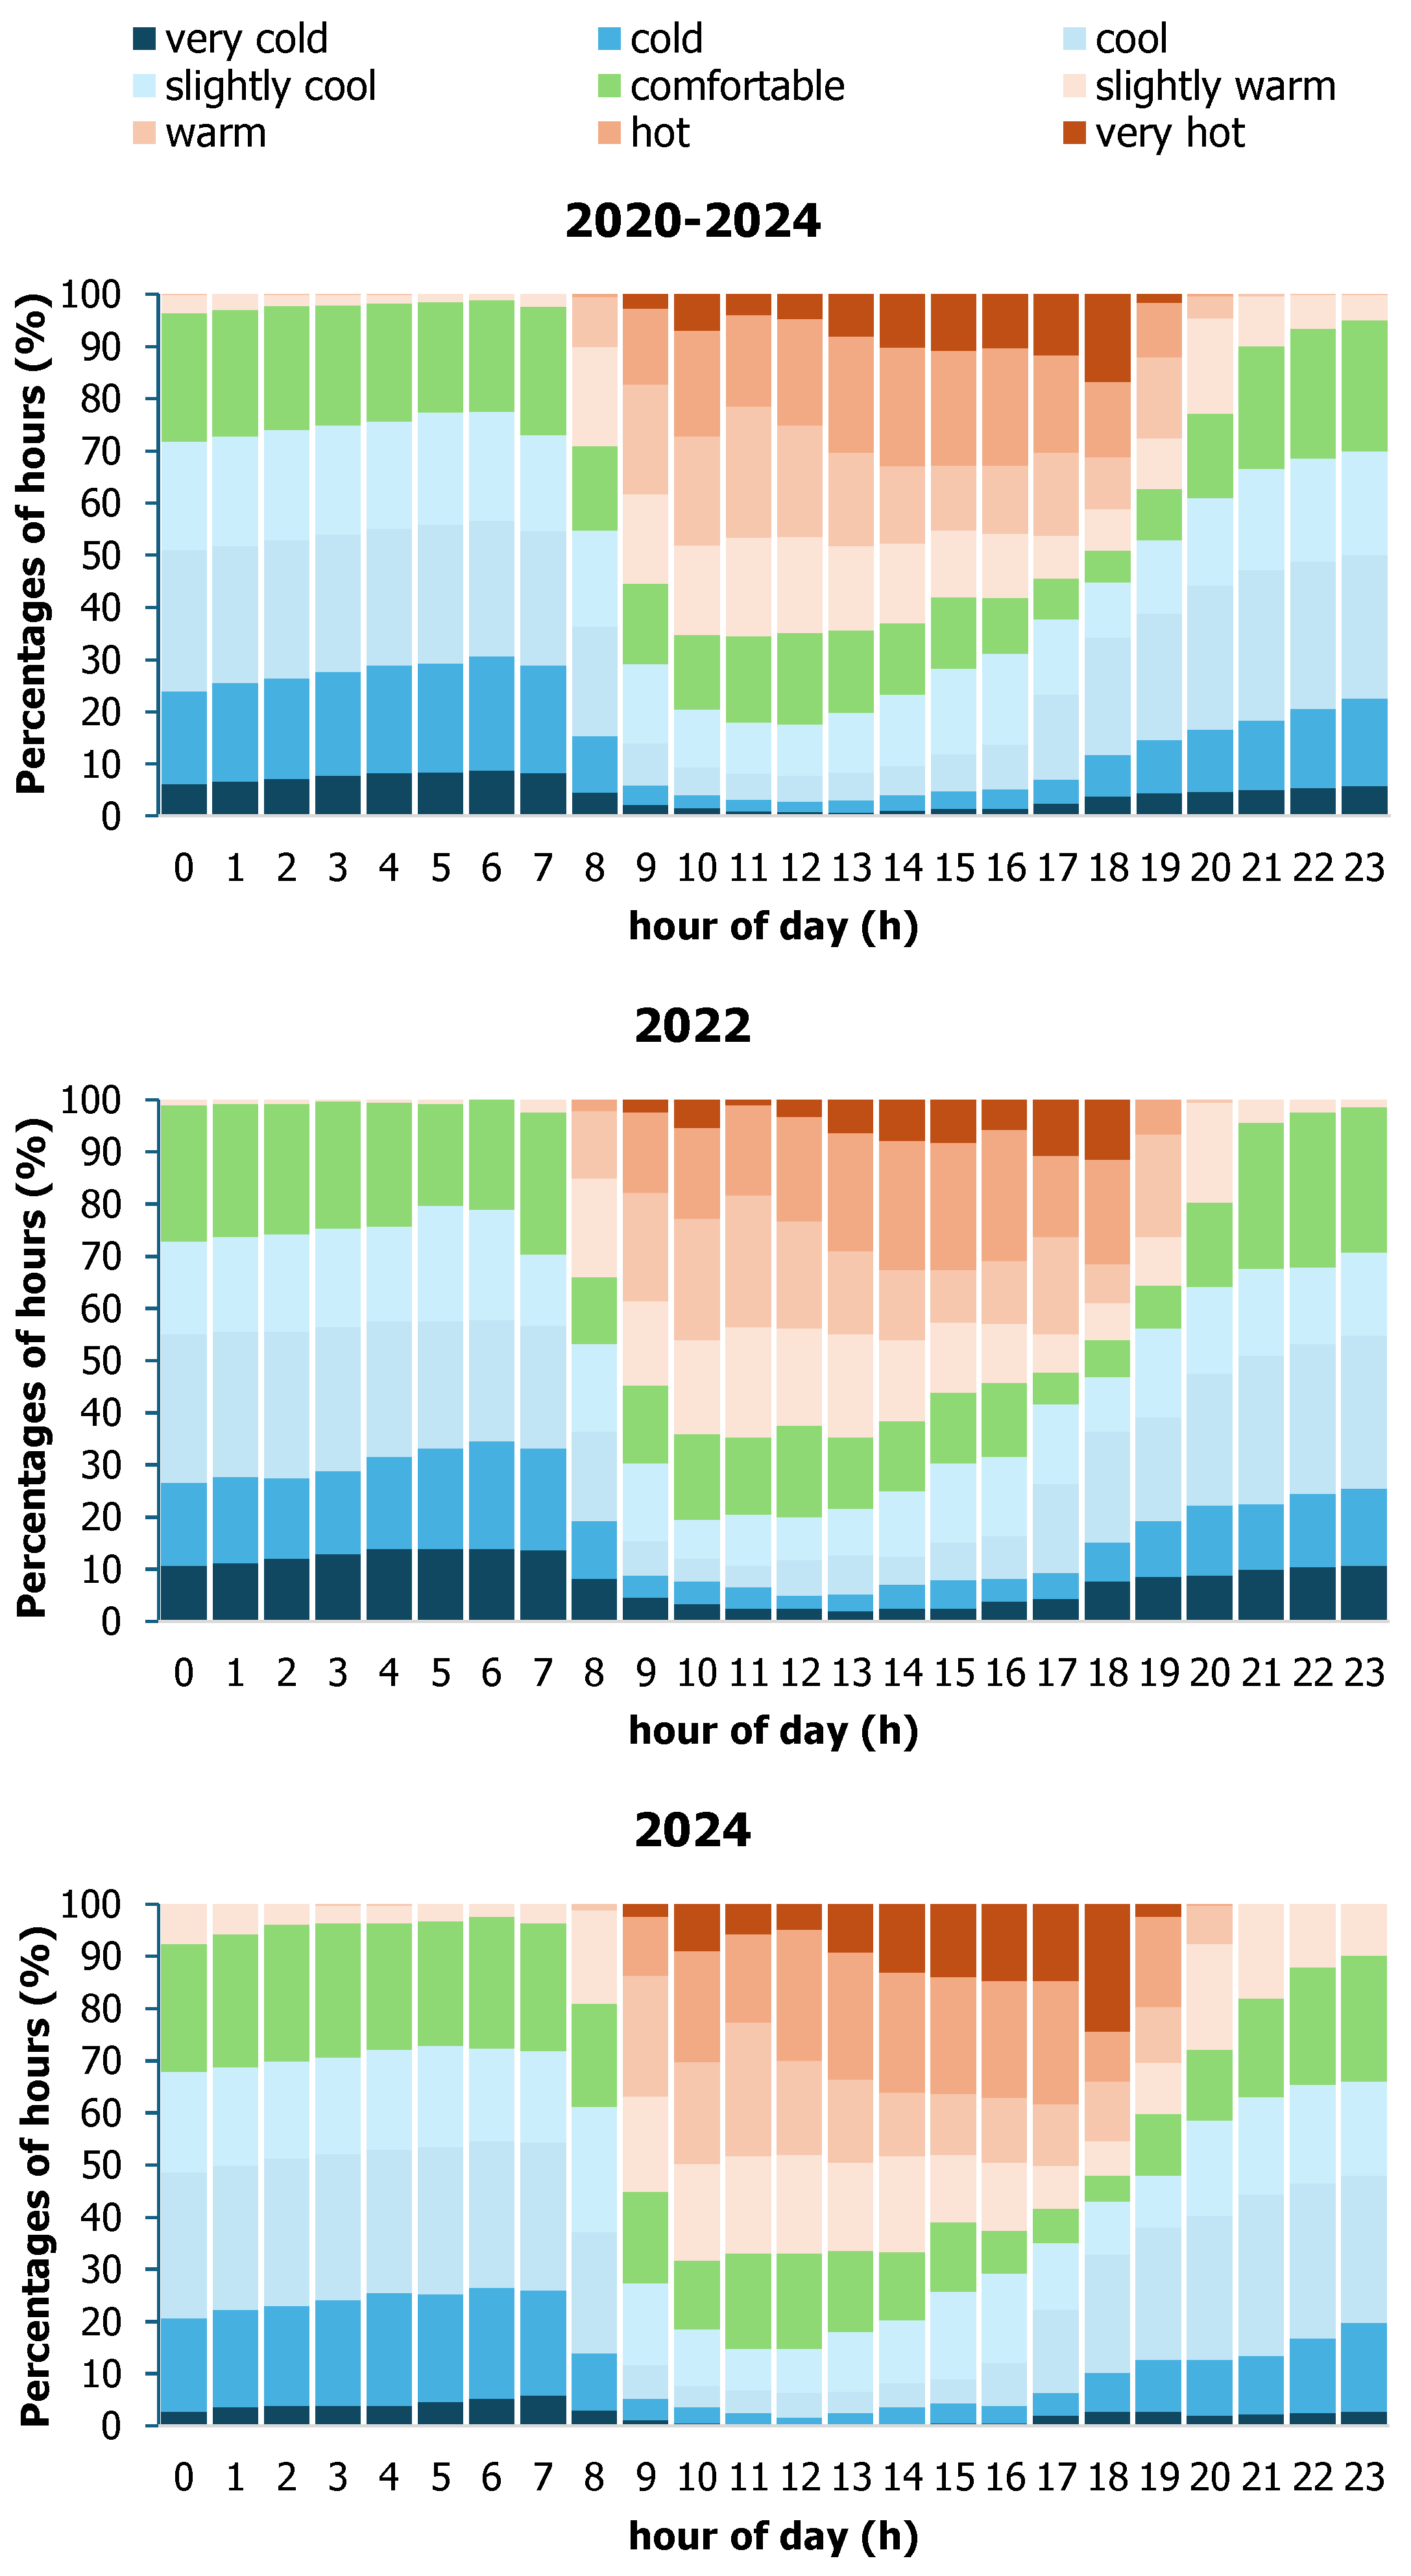
Based on the results of PET, which defines nine thermal comfort categories, the number of hours with specific thermal comfort conditions and hours of the day were assessed for the 2020–2024 period. The respective percentages are depicted in Figure 4, which confirms that at the site, much warmer conditions persist during daytime compared to nighttime, and the effect is maximized around noon. In about 44% of the total hours of the 2020–2024 period, the comfort level at the site was in the comfortable zone, whereas 35% were cool (including the very cold, cold, cool, and slightly cool categories) and 21% were warm (including the slightly warm, warm, hot, and very hot categories).
The general pattern in Figure 4 is generally valid for the specific years 2022 and 2024, but warmer conditions prevailed during 2024 compared to 2022. It is worth noting that in 2024, the occurrence of persistent warmer conditions was evident, even at night hours. On an annual basis, cool (including very cold, cold, cool, and slightly cool categories) conditions in 2022 were recorded for 38% of the total annual hours and for 33% in 2024. Accordingly, warm (including the slightly warm, warm, hot, and very hot categories) conditions prevailed for 20% of the annual hours in 2022 and for 21% in 2024, whereas the conditions were comfortable for 42% of the annual hours in 2022 and 46% in 2024.

3.2. Changes in the Reflectance of the UGS

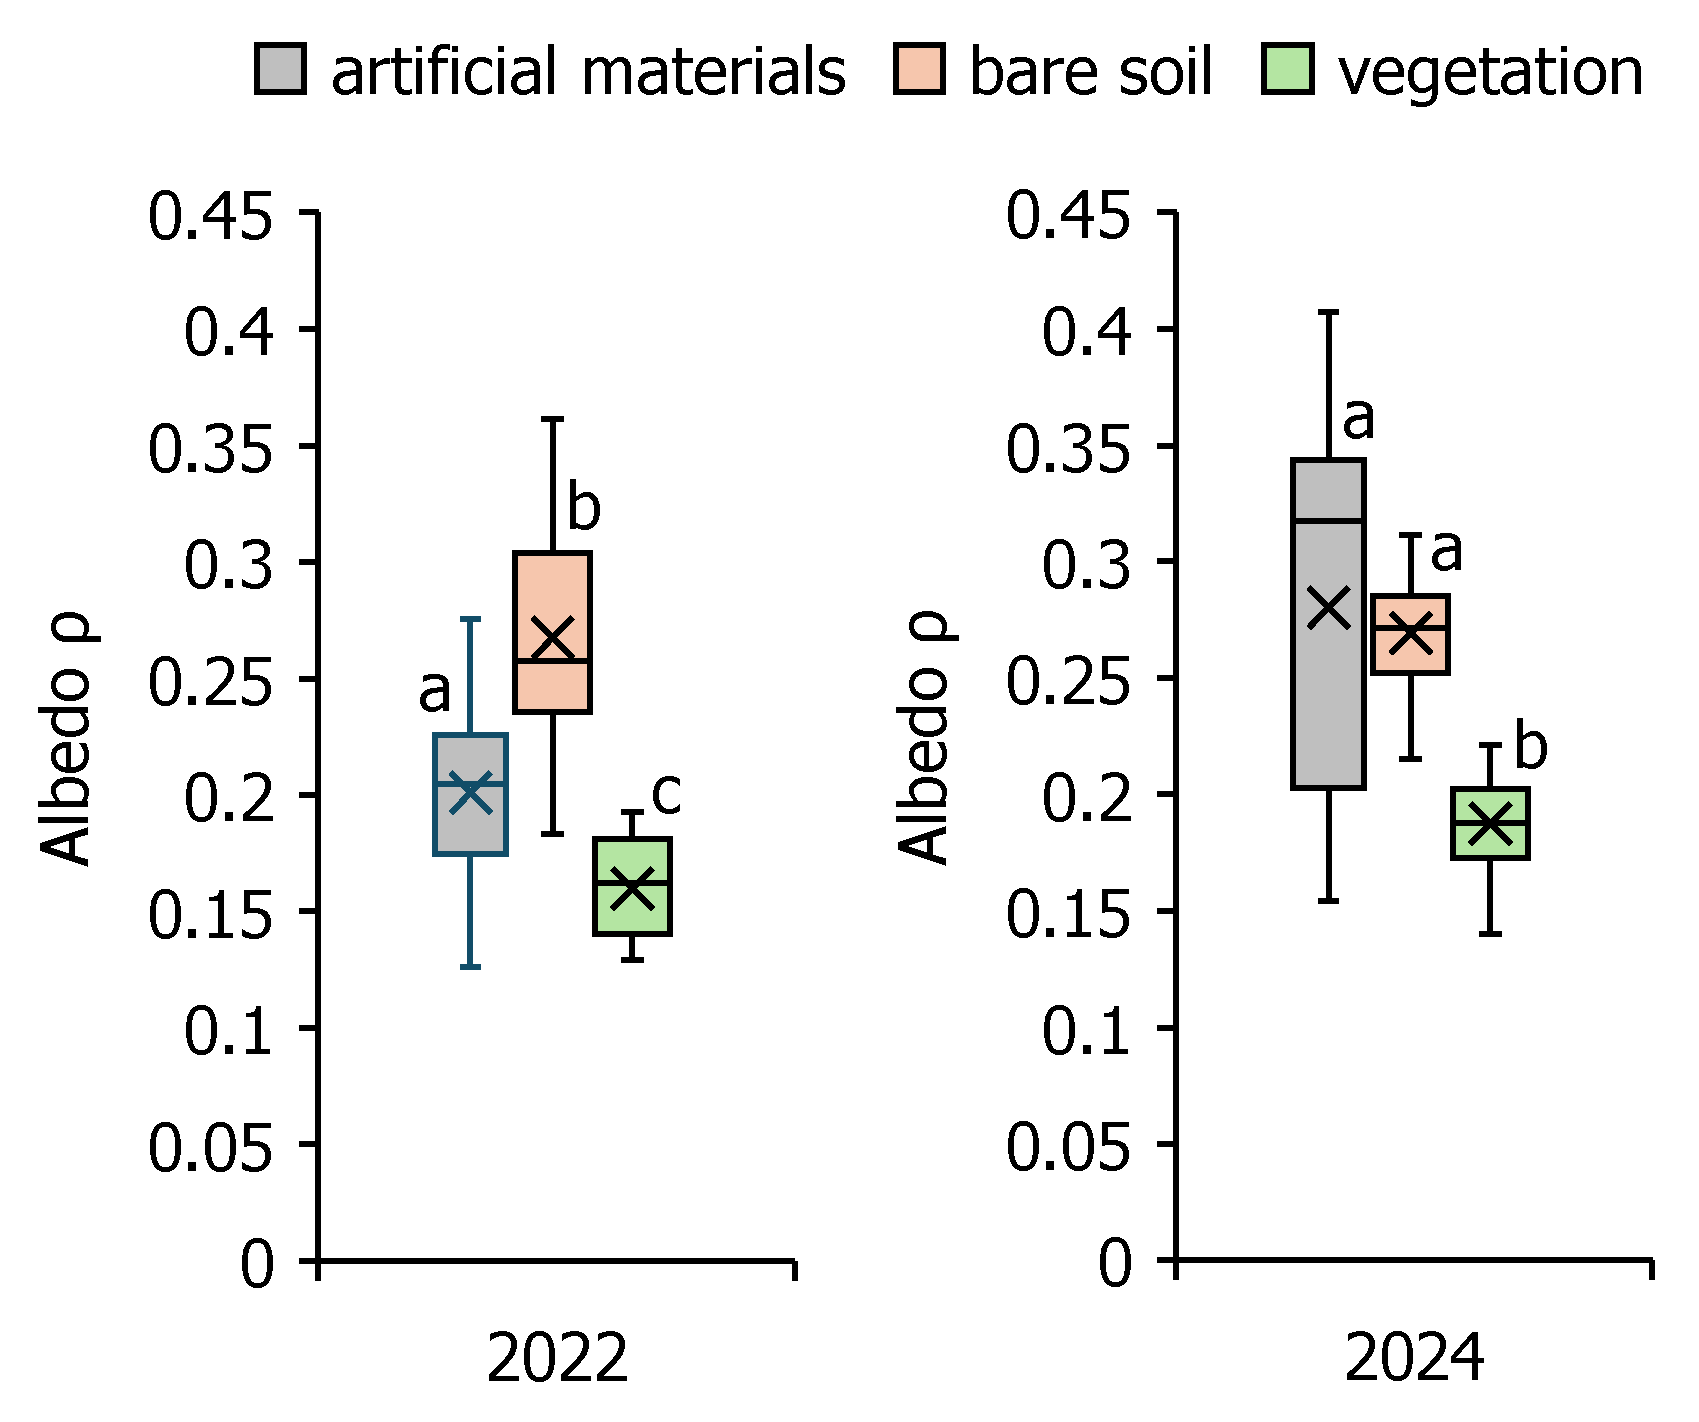
The restoration of the urban area that occurred in 2024 resulted in changes in its optical behavior. The changes in albedo, ρ, pre- and post-restoration (years 2022 and 2024) during midday are presented in Figure 5, highlighting the positive impact of vegetation. In 2022, when the urban space was mainly covered by asphalt and dry bare soil, the albedo values differed between the two types of cover, at 0.20 and 0.28, respectively. The sparse rain-fed vegetation inside the open space reduced the reflectance to 0.17 (on average).
Post-restoration actions implemented in 2024 changed the pre-restoration albedo pattern in the area. The vegetation albedo remained low (0.19), presenting, however, variability with regard to the selected species, due to the specific plant optical properties (mainly color, vegetation architecture, and roughness). For example, the darker-green-leafed Gaura sp. presented a smaller albedo (0.15) and thus increased absorbance in solar radiation compared to the light-green-leafed Santolina chamaecyparissus (ρ = 0.21), sage (0.20), and lavender (0.20). In all cases, the vegetation albedo retained smaller values compared to the artificial or non-green elements in the UGS. The bare soil and gravel-covered surfaces presented higher reflectance (0.27 and 0.20, respectively), which was even higher for the newly established artificial materials, such as the roads and pavements around the UGS (with ρ values 0.33 and 0.34, respectively) and the internal corridors (ρ = 0.35) that were covered with concrete.
Statistical analysis was also employed to detect significant differences between the different types of material in both years. The box plots of the albedo values for the artificial materials, bare soil, and vegetation, as presented in Figure 6, indicate significantly lower values of reflectance for vegetation compared to the other land covers, at p < 0.05 for both years of measurements.

3.3. Changes in the Thermal Behavior of the UGS

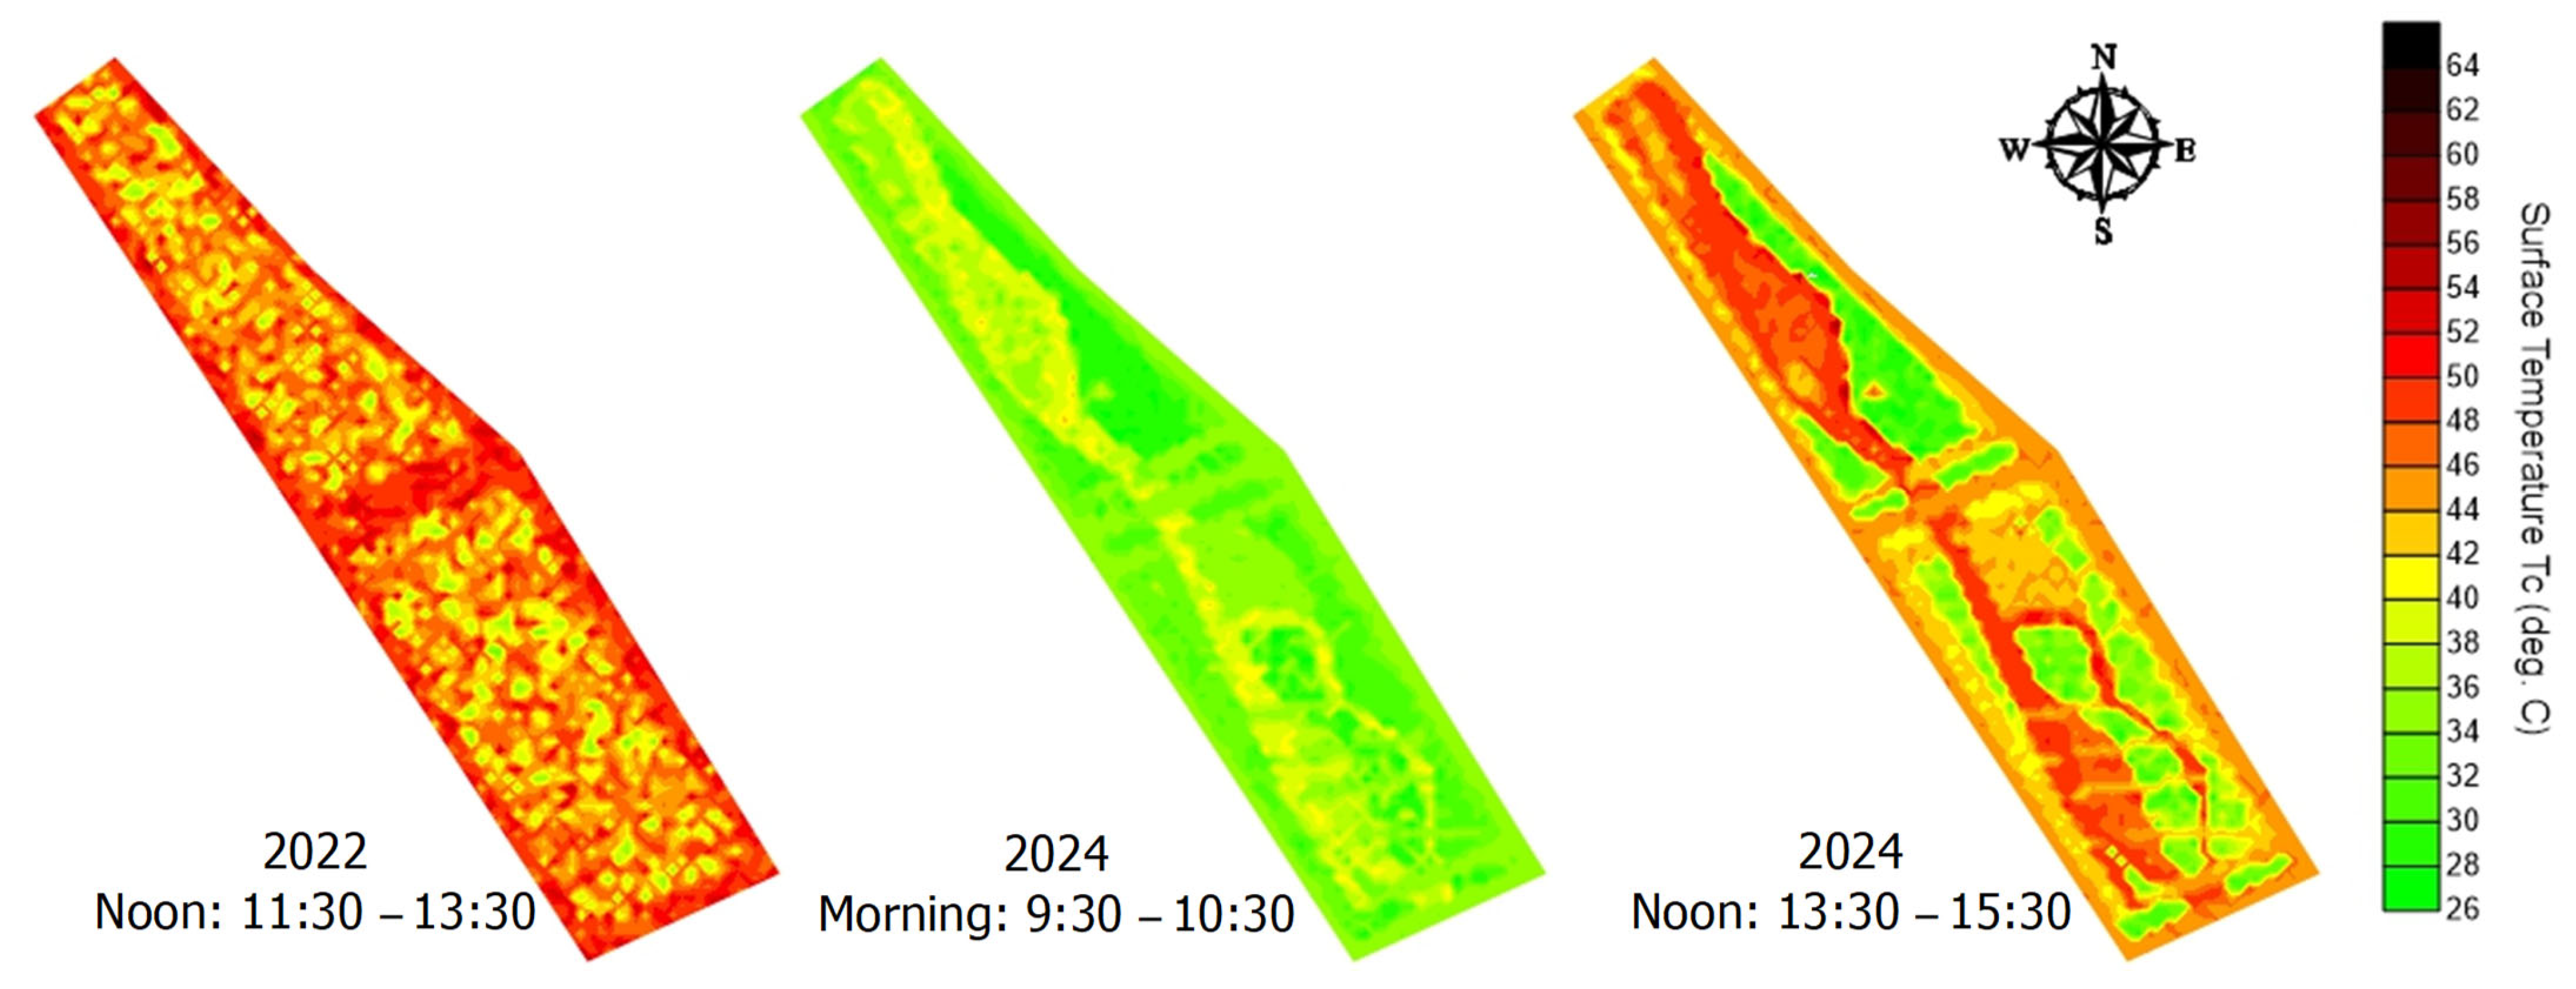
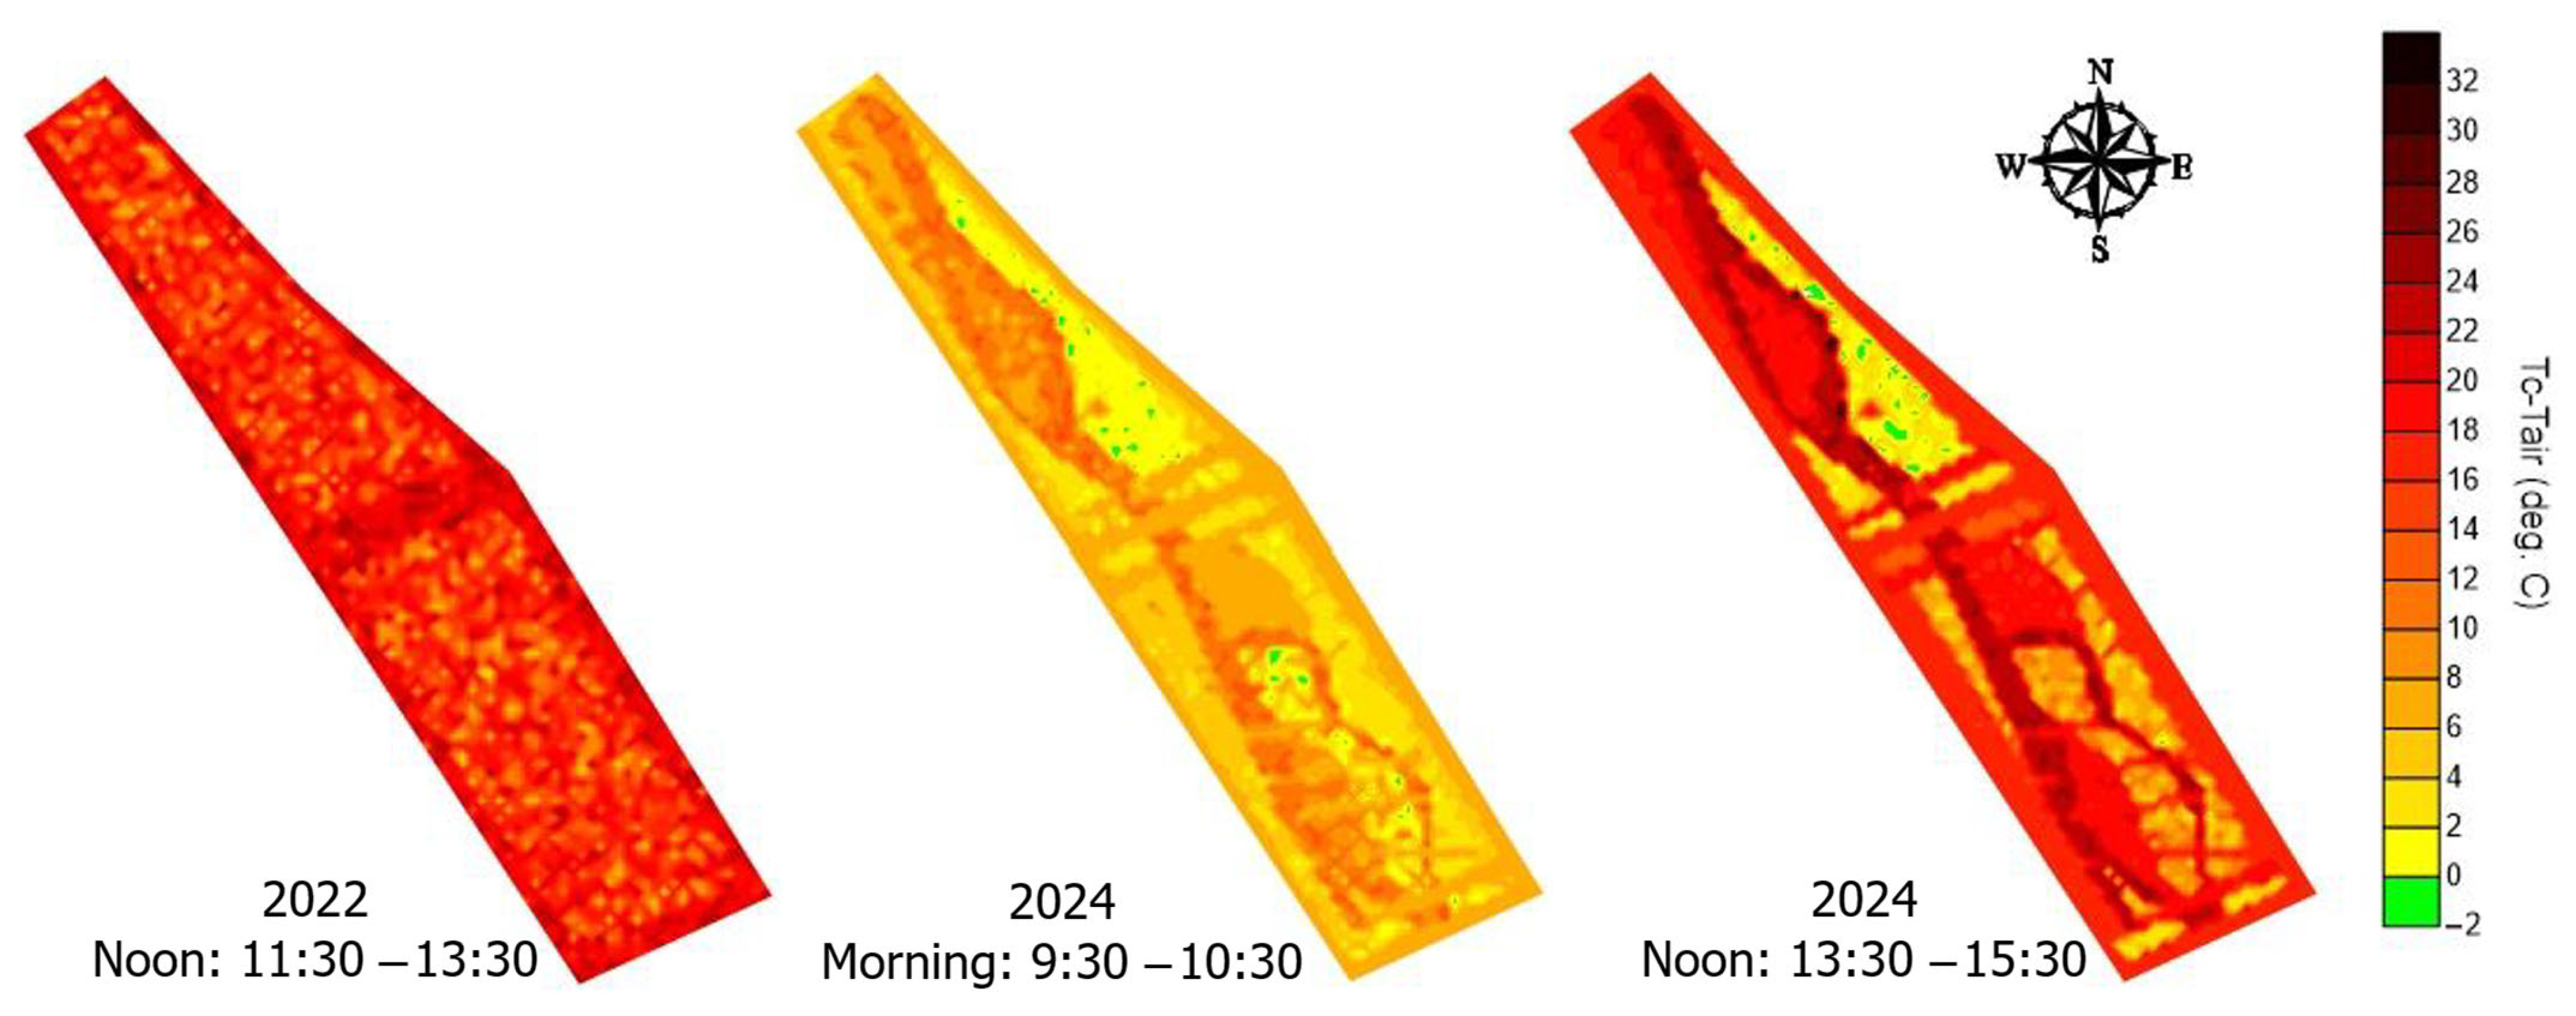
The records of heat accumulation during 2022 and before the implementation of plantings in the urban area show significantly increased surface temperatures. Specifically, the temperature on the asphalt at noon (11:30–13:30) of a summer day (29 July 2022) was 49.5 °C, i.e., 20.2 °C higher than the air temperature, which was recorded at 29.3 °C for the specific time period. The soil-covered surfaces also showed a small difference, where the surface temperature reached 44.3 °C and was 15.1 °C warmer than the air temperature. For these surfaces, the reflectivity of solar radiation also increased, as mentioned above. Detailed spatial visualizations of the variations in surface temperature and its differences in air temperature before (2022) and after (2024) the urban space restoration are presented in Figure 7 and Figure 8.
The above figures show a clear positive effect of vegetation related to its thermal behavior, which is also confirmed by the respective patterns in 2024. The measurements carried out during the morning hours (9:30–10:30) of the summer day in 2024 show that the average surface temperature of the vegetated surfaces was 30.5 °C, i.e., 2.6 °C warmer than the air temperature. The temperature of the bare dry soil was much higher and reached 37.1 °C (9 °C warmer than the air), while the temperature of the gravel-covered areas was even higher (39.0 °C). Correspondingly high surface temperatures were exhibited by the asphalt (34.4 °C), the internal and external concrete elements of the space (34.7 and 32.0 °C, respectively), and also the metal cast iron surfaces (39.4 °C).
The thermal load of the space was strengthened at noon, when all artificial surfaces showed temperatures higher than 42.1 °C, with the highest values for cast iron elements (49.1 °C) and gravel-covered surfaces (48.9 °C). The bare dry soil showed equally high surface temperatures, around 47.6 °C (19.2 °C warmer than the air temperature). On the contrary, the thermal behavior of the plant-covered surfaces was clearly different. Specifically, the average value of their surface temperature was lower compared to all other materials, reaching 33.1 °C. This value was only 4.7 °C higher than the air temperature, highlighting the effective use of solar energy by vegetation, not to increase the thermal load but to produce photosynthetic products.
The above results are further statistically confirmed by the results of the one-way ANOVA and Tukey’s HSD test, both for the surface temperatures Tc and the differences between surface and air temperatures (Tc-Tair), for the different land covers (artificial materials, bare soil, and vegetation) measured during all three measurement campaigns (Figure 9 and Figure 10). The box plots indicate a similar thermal behavior of the artificial materials and bare soil; however, this behavior is significantly different compared to the vegetation-covered surfaces, which generally present lower surface temperatures and lower differences in the air temperatures in both years of measurement. These differences also remain significantly different for both the morning and noon measurements of 2024.
The above results are additionally supported by thermal photographs taken in the study area on 1 August 2024, both in the morning and at noon. Selected photographic material is presented in Figure A1 and Figure A2 in Appendix A, which simultaneously show visual and thermal images of parts of the urban green space in Heraklion.

4. Discussion

Thermal comfort indicators (Predicted Mean Vote, PMV, and Physiological Equivalent Temperature, PET) are analyzed in this study for an urban green space in Heraklion city (S. Greece), during the 2020–2024 time period. The site’s overall thermal environment, with an average PMV of −0.30 and a PET of 19.0 °C, tended toward neutral thermal conditions, on an annual basis, and is primarily in the “comfortable” range. Yet seasonal and interannual variations were identified, which is rather expected for the Mediterranean climate. Year 2022 was the coolest of the record (PET = 18.2 °C), and year 2024 the warmest (PET = 19.8 °C). The seasonal PMV and PET values in Heraklion confirm the typical Mediterranean seasonal pattern, also showing interannual variability. For example, winter 2022 was the coolest of the 2020–2024 study period (PMV = −2.06), whereas the 2024 winter was the mildest (–0.46).
A distinct pattern emerges from the diurnal distribution of the PET-derived comfort levels: daytime hours, particularly around noon, are warmer, with approximately 44% of all hours being “comfortable”. On the other hand, cooler conditions predominate at night (35% of the total hours), while warmer conditions still have high hour percentages (21%).
The site’s Mediterranean climate profile is compatible with the pattern of warmer summers and cooler winters identified in this work. Interannual variations, however, and particularly the July 2023 heatwave and the warm conditions that prevailed in 2024, suggest shifting thermal comfort levels and require continuous monitoring. The warmer temperatures prevailing in 2024, which retained relatively high percentages even during the night, suggest a trend toward increasing thermal night discomfort, with possible concerns about energy consumption and outdoor comfort. Future studies should examine additional climate factors and environmental variables and evaluate the impacts on urban planning, climate adaptation plans, and public health in the region.
The thermal and optical behavior of different cover materials in the urban green space was also assessed before and after its restoration. The measurements were conducted during daily campaigns on 29 July 2022 (around noon, 11:30–13:30; average air temperature of 29.3 °C) and on 1 August 2024 (both in the morning, 9:30–10:30, and at noon, 13:30–15:30; average air temperatures of 27.9 and 29.3 °C, respectively).
The positive effect of vegetation, compared to other artificial or non-green materials, on the thermal behavior of the urban green space is confirmed in this study. The results, based on high-accuracy in situ direct measurements during heat stress days at a small-scale urban green space in Heraklion, demonstrate that vegetation-covered surfaces exhibit significantly lower surface temperatures compared to artificial materials or dry bare soil, even immediately after the site’s restoration and the establishment of young vegetation. These findings underscore the potential of small green spaces to provide cooling benefits in Mediterranean urban environments.
More specifically, green elements inside the urban green space showed temperatures of about 30.5 °C in the morning and 33.1 °C at noon, under clear-sky warm conditions in 2024, whereas all other types of materials (either artificial or non-green, like asphalt, cement, gravel, or bare soil) showed much higher surface temperatures, exceeding, in all cases, 32 °C in the morning and 42 °C at noon. These results suggest that the positive vegetation effect, by mitigating the UHI effect, is sufficient in the morning but strengthens even more during the noon hours of the day, when high summer temperatures and thus, heat stress, are maximum. This is also confirmed by other studies conducted in Greece by the authors [30,35]. However, this effect of vegetation appears to have a threshold, limited by extreme temperatures. As mentioned by Proutsos et al. [35], who studied the urban cool island effect of vegetation during the peak of July 2023’s heatwave, the green elements of an urban green space had higher surface temperatures and smaller differences with the air temperature compared to the previous milder year (2022).
These results suggest that urban green spaces can be an effective alternative in mitigating the urban heat island effect and are also in line with the findings of Cao et al. [71]. Similarly, Mohajerani et al. [72] also identified a significant impact of asphalt concrete on the exacerbation of the UHI effect, whereas other studies mentioned extremely high temperatures on asphalt, on the order of 50 or even 60 °C, during hot summer days [35,73,74]. On the other hand, Grimmond [75] identified strong differences between artificial and natural materials, as reported in our study.
Assessing the optical properties, vegetation reflectance at the urban green space in Heraklion was found to be equal to 0.19, indicating that 19% of the solar radiation is reflected, and most of it is absorbed by the plants. This, combined with the thermal behavior of the vegetation, shows that plants have the ability to absorb much larger amounts of solar energy without increasing their thermal load. This is attributed to vegetation’s effective use of absorbed radiation for the production of photosynthetic products, allocating the absorbed radiation energy for evapotranspiration and providing cooling [76]. On the contrary, the artificial elements and the bare soil showed clearly higher reflectance values, such as 0.33 on the roads and 0.35 on the concrete, indicating that a large part of the solar energy is reflected into the atmosphere and also to the surrounding buildings, causing a significant effect on the increase in their temperatures. The bare soil and gravel generally showed relatively low reflectance values (0.27 and 0.20, respectively). Similar results were mentioned in other studies. For concrete, Proutsos et al. [35] reported an albedo value of 0.28, and Đekić et al. [73] mentioned a range between 0.10 and 0.35. For green-covered surfaces, the reported values were in the range of 0.15–0.18, quite similar to those reported in our study.
The observed differences between the various land covers are attributed to the physical and physiological properties of the materials. Vegetation’s ability to allocate absorbed radiation energy in order to perform photosynthesis and enhance transpiration results in decreased surface temperatures on plant canopies compared to artificial materials or bare soil, which store heat energy, even under extreme heat stress conditions. Artificial materials and soil have high heat capacity and store more heat during the daytime, increasing their surface temperatures and affecting the local microclimate. The use of high-reflective materials can decrease the amount of heat storage, but the reflected energy can be absorbed by the surrounding buildings, increasing their temperatures.
Species selection is also critical. Different plant species have a significant impact on the visual—and, therefore, optical and thermal—behavior of a green space, mainly due to the roughness and the color of the foliage. Plant species such as Sarcopoterium spinosum, wormwood, levantine, and sage showed foliage temperatures lower than 2 °C, while others, such as gaura, heliotrope, marjoram, and clover, showed temperatures higher than 5 °C, indicating the need for the proper selection of species when planting urban green spaces.
The interplay between albedo and surface temperatures of various materials provides valuable insights into their use and combinations in urban design. In our case, the low radiation reflectance (high absorbance) of vegetation is not associated with increased surface temperatures but rather the opposite, suggesting that green elements can be a favorable cover material for urban surfaces, as also suggested by Salata et al. [77]. On the other hand, high-albedo materials, such as concrete, may increase the temperature of the surrounding buildings in heavily built urban settings, as also noted by Yang et al. [78].
It is worth noting that the urban space in Heraklion was restored only a few weeks before the implementation of the measurement campaign in 2024. This suggests that the vegetation mainly consisted of small plants with a relatively small-developed rooting system. Under this view, the ecological functionality of the urban green space is expected to rapidly increase in the next years as the planted vegetation grows and establishes deeper root systems. This is extremely important when considering urban green infrastructure as a nature-based solution that provides ecosystem services in urban climate adaptation [79], temperature regulation in cities, and carbon sequestration [80]. Such ecosystem-based approaches are highly recommended to enhance the resilience of modern cities [41,42], aligning green infrastructure planning principles with urban regeneration and sustainability in urban areas [43,44].
The fact that the newly established vegetation was not fully functional may influence the thermal and optical behavior of the study site in Heraklion. However, it is worth noting that even immediately after the installation of the green infrastructure in the urban space, its optical and thermal properties changed radically, underlining the effectiveness of vegetation in the urban environment as a tool for immediate mitigation of the UHI effect.
The positive effects of vegetation, as identified in this study, are obvious even in the case of the small-scale UGS. The significantly lower surface temperatures of the vegetation compared to the other land covers highlight its cooling potential at our site, which is in line with the findings of other studies. Cohen et al. [48] studied several UGSs in Tel Aviv, Israel, and confirmed the cooling effect of vegetation, especially in summer, regardless of the size of the site. Similarly, in their review, Egerer et al. [50] addressed the socio-ecological importance of small UGSs, highlighting their critical role in the mitigation of urban heat and climate change impacts in cities. Perini et al. [51] studied microclimatic and environmental improvement through the regeneration of an area with nature-based solutions in Genoa, investigating different design scenarios and plant species and reported significant changes in the thermal behavior of the studied small-scale urban area after the installation of vegetation elements.
The results of this study provide valuable insights into the proper use of different materials in an urban green space in the Eastern Mediterranean and underline the significant role of green spaces in the urban environment as agents to change the thermal and optical behavior of a city and mitigate the urban heat island (UHI) effect. While interannual and seasonal variability in the optical and thermal performance of different UGS materials were not assessed in this study, the results highlight the UGS’s response during heat stress conditions, which are critical periods for urban heat mitigation in Mediterranean cities.
Although the present case study is localized, it provides valuable insights into the behavior of small-scale urban green spaces in Mediterranean cities, which are often constrained by space, under heat-stress summer conditions. Future work should focus on studying the long-term impacts of vegetation and material properties, which require exploration [73,81]. Focus should also be directed at the study of seasonal variations in optical and thermal behavior and thus, the cooling effect of urban green infrastructure, especially in winter and the transitional seasons of spring and autumn, to quantify the positive effects of vegetation elements on urban thermal comfort and optical characteristics. Also considering the diurnal variability in the cooling effect of vegetation [15], similar assessments are required to evaluate urban green space performance and behavior during nighttime [32]. Such studies may provide guidelines, informing strategic planning in cities across the Mediterranean basin, especially under the current and projected climate change trends and escalating stress conditions.

5. Conclusions

This study confirms that urban green infrastructure can be a valuable asset for Mediterranean cities and a useful and effective tool to regulate urban temperatures and mitigate the urban heat island effect. The results, based on in situ measurements taken at an urban green space in Heraklion, Greece, revealed a notable change in the optical and thermal properties of the site before and after its restoration, whereas large differences were identified in the optical and thermal properties of vegetation compared to other non-green and artificial materials used at the site. The green elements showed lower surface temperatures, around 30.5 °C, during summer mornings, markedly cooler compared to the artificial surfaces, exceeding 42 °C, which also maintained lower reflectance values. Notably, the higher solar energy amounts absorbed by the green elements did not lead to increased surface temperatures, suggesting that the absorbed energy is effectively used for vegetation-related processes and not for heating.
The analysis of the noon patterns of albedo and surface temperatures during the peak warm hours with maximum solar radiation intensities showed albedo values around 0.19 and surface temperatures averaging 33.1 °C (slightly higher than the ambient air temperatures) for vegetation. Artificial materials, such as asphalt and concrete, presented much higher reflectance (up to 0.35) but also much higher surface temperatures compared to vegetation, exceeding 48 °C. These patterns suggest that urban vegetation may absorb higher amounts of solar energy, but it is much more effective in reducing heat accumulation during periods with extreme thermal energy, especially at noon, compared to other non-green or artificial materials.
Plant species selection can notably alter the optical and thermal properties of an urban green space. Different species exhibit variability in their foliage architectural characteristics, color, roughness, etc., affecting their ability to absorb/reflect radiation and reduce surface temperatures. For example, in this study, plant species with a darker green color showed lower albedo and surface temperature values, enhancing their cooling potential compared to lighter-colored or less dense plants. These results highlight that the proper site-specific selection of plant species can enhance the functionality of the cooling benefits of urban vegetation and should be considered cautiously in urban design.
The assessment of the thermal comfort indices (PMV and PET) at the urban green space for the 2020–2024 period is generally “neutral”; however, they demonstrate high seasonal and interannual variability, suggesting variations in the thermal stress in the area. The warmer conditions prevailing at the site in 2024, compared to all previous years, in conjunction with the relatively high numbers of warm night hours, suggest trends that can highly affect human heat stress and require continuous monitoring.
In conclusion, the findings of this study show that the strategic inclusion of properly designed green spaces in the urban environment—through careful selection and distribution of plant species and use of materials—can enhance the effectiveness of urban green infrastructures in cooling and can alter the optical characteristics of the urban environment. Vegetation’s low reflectance and low thermal storage capacity may contribute to the reduction in heat accumulation in the area.
A critical issue in the modern design of urban green areas is the use and combination of appropriate materials to enhance the cooling effect of urban green spaces by retaining smaller quantities of heat and by benefiting from the cooler temperatures of vegetation. At the same time, it is challenging to ensure the security of visitors and easy access to the parks. Under this view, different properties, either the optical (such as the reflectance characteristics) or thermal properties of the used materials, should be considered when designing an urban green space, in addition to the visitor load, the surrounding environment, and the local plant species availability and tolerance to the local climatic conditions.
The limitations of this study include its short temporal scope, with measurements conducted over single-day campaigns with heat-stressful conditions at a relatively small urban green space in Greece. In addition, vegetation maturity, vegetation species composition, and maintenance practices were not assessed. These factors may affect the observed microclimate effects and restrict the generalization of this case study’s findings across broader urban contexts or seasonal variations. Future research may focus on the study of the long-term changes in the optical and thermal properties of the urban green spaces in the Mediterranean, assessing also diurnal and seasonal variability. Emphasizing species selection may enhance the urban green space cooling effect, providing insights into the ecological and climate resilience of modern cities.

Author Contributions

Conceptualization, N.D.P.; methodology, N.D.P.; software, N.D.P.; validation, N.D.P., A.D.S. and S.P.S.; formal analysis, N.D.P.; investigation, N.D.P.; resources, N.D.P.; data curation, N.D.P., A.D.S. and S.P.S.; writing—original draft preparation, N.D.P., A.D.S. and S.P.S.; writing—review and editing, N.D.P., A.D.S. and S.P.S.; visualization, N.D.P.; supervision, N.D.P.; project administration, N.D.P.; funding acquisition, N.D.P. and A.D.S. All authors have read and agreed to the published version of the manuscript.

Funding

This research was funded by the LIFE GrIn project “Promoting urban Integration of GReen INfrastructure to improve climate governance in cities” LIFE17 GIC/GR/000029, which is co-funded by the European Commission under the Climate Change Action–Climate Change Governance and Information component of the LIFE Programme and the Greek Green Fund.

Data Availability Statement

The data presented in this study are available on request from the corresponding author to maintain privacy.

Acknowledgments

The authors highly acknowledge the support of the Municipality of Heraklion for conducting this study, especially the former head of the Urban Green Management Unit, Forester Erofili Fragouli.

Conflicts of Interest

The authors declare no conflicts of interest.

Appendix A

Figure A1. Indicative optical and thermal images of the urban green site in Heraklion in the morning (9:30–10:30) on a warm summer day (1 August 2024), depicting the temperature ranges of the concrete, gravel, metallic elements, and planted green surfaces. Blue and red cycles indicate the minimum and maximum temperatures, whereas white cycles show the temperature at the center of the photograph.
Land 14 01681 g0a1aLand 14 01681 g0a1b
Figure A2. Indicative optical and thermal images of the urban green site in Heraklion at noon (13:30–15:30) on a warm summer day (1 August 2024), depicting the temperature ranges of various elements occupying the site. Blue and red cycles indicate the minimum and maximum temperatures, whereas white cycles show the temperature at the center of the photograph.
Land 14 01681 g0a2aLand 14 01681 g0a2bLand 14 01681 g0a2c

References

  1. García, D.H. Spatio-temporal analysis of the urban green infrastructure of the city of Granada (Spain) as a heat mitigation measure using high-resolution images Sentinel 3. Urban For. Urban Green. 2023, 87, 128061. [Google Scholar] [CrossRef]
  2. Marando, F.; Heris, M.P.; Zulian, G.; Udías, A.; Mentaschi, L.; Chrysoulakis, N.; Parastatidis, D.; Maes, J. Urban heat island mitigation by green infrastructure in European Functional Urban Areas. Sustain. Cities Soc. 2022, 77, 103564. [Google Scholar] [CrossRef]
  3. Najah, F.T.; Abdullah, S.F.K.; Abdulkareem, T.A. Urban land use changes: Effect of green urban spaces transformation on urban heat islands in Baghdad. Alex. Eng. J. 2023, 66, 555–571. [Google Scholar] [CrossRef]
  4. Pugh, T.A.; MacKenzie, A.R.; Whyatt, J.D.; Hewitt, C.N. Effectiveness of green infrastructure for improvement of air quality in urban street canyons. Environ. Sci. Technol. 2012, 46, 7692–7699. [Google Scholar] [CrossRef]
  5. Salih, K.; Báthoryné Nagy, I.R. Review of the Role of Urban Green Infrastructure on Climate Resiliency: A Focus on Heat Mitigation Modelling Scenario on the Microclimate and Building Scale. Urban Sci. 2024, 8, 220. [Google Scholar] [CrossRef]
  6. Wong, N.H.; Tan, C.L.; Kolokotsa, D.D.; Takebayashi, H. Greenery as a mitigation and adaptation strategy to urban heat. Nat. Rev. Earth Environ. 2021, 2, 166–181. [Google Scholar] [CrossRef]
  7. Nastos, P.; Saaroni, H. Living in Mediterranean cities in the context of climate change: A review. Int. J. Climatol. 2024, 44, 3169–3190. [Google Scholar] [CrossRef]
  8. Diffenbaugh, N.S.; Giorgi, F. Climate change hotspots in the CMIP5 global climate model ensemble. Clim. Change 2012, 114, 813–822. [Google Scholar] [CrossRef]
  9. Lionello, P. The Climate of the Mediterranean Region: From the Past to the Future; Elsevier: Oxford, UK, 2012. [Google Scholar]
  10. Lionello, P.; Malanotte-Rizzoli, P.; Boscolo, R. Mediterranean Climate Variability; Elsevier: Amsterdam, The Netherlands, 2006; Volume 4. [Google Scholar]
  11. Xoplaki, E.; González-Rouco, J.F.; Luterbacher, J.; Wanner, H. Mediterranean summer air temperature variability and its connection to the large-scale atmospheric circulation and SSTs. Clim. Dyn. 2003, 20, 723–739. [Google Scholar] [CrossRef]
  12. Kumar, P.; Debele, S.E.; Khalili, S.; Halios, C.H.; Sahani, J.; Aghamohammadi, N.; de Fatima Andrade, M.; Athanassiadou, M.; Bhui, K.; Calvillo, N. Urban heat mitigation by green and blue infrastructure: Drivers, effectiveness, and future needs. Innovation 2024, 5, 100588. [Google Scholar] [CrossRef]
  13. Oke, T.R. Boundary Layer Climates; Routledge: London, UK, 2002. [Google Scholar]
  14. Linares, C.; Díaz, J.; Negev, M.; Martínez, G.S.; Debono, R.; Paz, S. Impacts of climate change on the public health of the Mediterranean Basin population-current situation, projections, preparedness and adaptation. Environ. Res. 2020, 182, 109107. [Google Scholar] [CrossRef]
  15. Wu, Q.; Huang, Y.; Irga, P.; Kumar, P.; Li, W.; Wei, W.; Shon, H.K.; Lei, C.; Zhou, J.L. Synergistic control of urban heat island and urban pollution island effects using green infrastructure. J. Environ. Manag. 2024, 370, 122985. [Google Scholar] [CrossRef]
  16. Emmanuel, R.; Loconsole, A. Green infrastructure as an adaptation approach to tackling urban overheating in the Glasgow Clyde Valley Region, UK. Landsc. Urban Plan. 2015, 138, 71–86. [Google Scholar] [CrossRef]
  17. Lei, Y.; Davies, G.M.; Jin, H.; Tian, G.; Kim, G. Scale-dependent effects of urban greenspace on particulate matter air pollution. Urban For. Urban Green. 2021, 61, 127089. [Google Scholar] [CrossRef]
  18. Proutsos, N.D.; Solomou, A.D. Urban Green Spaces as an Effective Tool to Regulate Urban Climate and Biodiversity: Current Research and Challenges. Land 2025, 14, 497. [Google Scholar] [CrossRef]
  19. Rodrigues, B.N.; Junior, V.E.M.; Canteras, F.B. Green Infrastructure as a solution to mitigate the effects of climate change in a coastal area of social vulnerability in Fortaleza (Brazil). Environ. Adv. 2023, 13, 100398. [Google Scholar] [CrossRef]
  20. Sebastiani, A.; Marando, F.; Manes, F. Mismatch of regulating ecosystem services for sustainable urban planning: PM10 removal and urban heat island effect mitigation in the municipality of Rome (Italy). Urban For. Urban Green. 2021, 57, 126938. [Google Scholar] [CrossRef]
  21. Speak, A.; Montagnani, L.; Wellstein, C.; Zerbe, S. The influence of tree traits on urban ground surface shade cooling. Landsc. Urban Plan. 2020, 197, 103748. [Google Scholar] [CrossRef]
  22. Van Oijstaeijen, W.; e Silva, M.F.; Back, P.; Collins, A.; Verheyen, K.; De Beelde, R.; Cools, J.; Van Passel, S. The Nature Smart Cities business model: A rapid decision-support and scenario analysis tool to reveal the multi-benefits of green infrastructure investments. Urban For. Urban Green. 2023, 84, 127923. [Google Scholar] [CrossRef]
  23. Liberalesso, T.; Cruz, C.O.; Silva, C.M.; Manso, M. Green infrastructure and public policies: An international review of green roofs and green walls incentives. Land Use Policy 2020, 96, 104693. [Google Scholar] [CrossRef]
  24. United Nations Environment Programme and United Nations Human Settlements Programme (UN-Habitat). Global Environment Outlook for Cities–GEO for Cities: Towards Green and Just Cities. Available online: https://unhabitat.org/sites/default/files/2021/11/geocities_updated.pdf (accessed on 6 February 2025).
  25. Halder, N.; Kumar, M.; Deepak, A.; Mandal, S.K.; Azmeer, A.; Mir, B.A.; Nurdiawati, A.; Al-Ghamdi, S.G. The role of urban greenery in enhancing thermal comfort: Systematic review insights. Sustainability 2025, 17, 2545. [Google Scholar] [CrossRef]
  26. Gunawardena, K.R.; Wells, M.J.; Kershaw, T. Utilising green and bluespace to mitigate urban heat island intensity. Sci. Total Environ. 2017, 584, 1040–1055. [Google Scholar] [CrossRef] [PubMed]
  27. Yu, Q.; Ji, W.; Pu, R.; Landry, S.; Acheampong, M.; O’Neil-Dunne, J.; Ren, Z.; Tanim, S.H. A preliminary exploration of the cooling effect of tree shade in urban landscapes. Int. J. Appl. Earth Obs. Geoinf. 2020, 92, 102161. [Google Scholar] [CrossRef]
  28. Taha, H. Urban climates and heat islands: Albedo, evapotranspiration, and anthropogenic heat. Energy Build. 1997, 25, 99–103. [Google Scholar] [CrossRef]
  29. Winbourne, J.B.; Jones, T.S.; Garvey, S.M.; Harrison, J.L.; Wang, L.; Li, D.; Templer, P.H.; Hutyra, L. Tree transpiration and urban temperatures: Current understanding, implications, and future research directions. BioScience 2020, 70, 576–588. [Google Scholar] [CrossRef]
  30. Proutsos, N.D.; Solomou, A.D.; Petropoulou, M.; Chatzipavlis, N.E. Micrometeorological and hydraulic properties of an urban green space on a warm summer day in a Mediterranean City (Attica–Greece). Land 2022, 11, 2042. [Google Scholar] [CrossRef]
  31. Tan, C.L.; Wong, N.H.; Tan, P.Y.; Jusuf, S.K.; Chiam, Z.Q. Impact of plant evapotranspiration rate and shrub albedo on temperature reduction in the tropical outdoor environment. Build. Environ. 2015, 94, 206–217. [Google Scholar] [CrossRef]
  32. Chang, C.-R.; Li, M.-H. Effects of urban parks on the local urban thermal environment. Urban For. Urban Green. 2014, 13, 672–681. [Google Scholar] [CrossRef]
  33. Nitidara, N.P.A.; Sarwono, J.; Suprijanto, S.; Soelami, F.N. The multisensory interaction between auditory, visual, and thermal to the overall comfort in public open space: A study in a tropical climate. Sustain. Cities Soc. 2022, 78, 103622. [Google Scholar] [CrossRef]
  34. Núñez, J.M.; Santamaría, A.; Avila, L.; Perez-De La Mora, D. Using Local Entropy Mapping as an Approach to Quantify Surface Temperature Changes Induced by Urban Parks in Mexico City. Land 2024, 13, 1701. [Google Scholar] [CrossRef]
  35. Proutsos, N.D.; Solomou, A.D.; Stefanidis, S.P.; Tsiros, I.X. Reflectance and Thermal Micrometeorological Characteristics of an Urban Green Space in the Mediterranean During July’s 2023 Heatwave. Land 2025, 14, 194. [Google Scholar] [CrossRef]
  36. Tsiros, I.X.; Hoffman, M.E. Thermal and comfort conditions in a semi-closed rear wooded garden and its adjacent semi-open spaces in a Mediterranean climate (Athens) during summer. Archit. Sci. Rev. 2014, 57, 63–82. [Google Scholar] [CrossRef]
  37. Hamada, S.; Ohta, T. Seasonal variations in the cooling effect of urban green areas on surrounding urban areas. Urban For. Urban Green. 2010, 9, 15–24. [Google Scholar] [CrossRef]
  38. Meili, N.; Manoli, G.; Burlando, P.; Carmeliet, J.; Chow, W.T.; Coutts, A.M.; Roth, M.; Velasco, E.; Vivoni, E.R.; Fatichi, S. Tree effects on urban microclimate: Diurnal, seasonal, and climatic temperature differences explained by separating radiation, evapotranspiration, and roughness effects. Urban For. Urban Green. 2021, 58, 126970. [Google Scholar] [CrossRef]
  39. Yang, J.; Bou-Zeid, E. Should cities embrace their heat islands as shields from extreme cold? J. Appl. Meteorol. Climatol. 2018, 57, 1309–1320. [Google Scholar] [CrossRef]
  40. Cabon, V.; Quénol, H.; Dubreuil, V.; Ridel, A.; Bergerot, B. Urban heat island and reduced habitat complexity explain spider community composition by excluding large and heat-sensitive species. Land 2024, 13, 83. [Google Scholar] [CrossRef]
  41. Hernandez, R.C.; Camerin, F. The application of ecosystem assessments in land use planning: A case study for supporting decisions toward ecosystem protection. Futures 2024, 161, 103399. [Google Scholar] [CrossRef]
  42. Longato, D.; Cortinovis, C.; Balzan, M.; Geneletti, D. A method to prioritize and allocate nature-based solutions in urban areas based on ecosystem service demand. Landsc. Urban Plan. 2023, 235, 104743. [Google Scholar] [CrossRef]
  43. Mell, I. Examining the role of green infrastructure as an advocate for regeneration. Front. Sustain. Cities 2022, 4, 731975. [Google Scholar] [CrossRef]
  44. Ige-Elegbede, J.; Pilkington, P.; Orme, J.; Williams, B.; Prestwood, E.; Black, D.; Carmichael, L. Designing healthier neighbourhoods: A systematic review of the impact of the neighbourhood design on health and wellbeing. Cities Health 2022, 6, 1004–1019. [Google Scholar] [CrossRef]
  45. Rahman, M.A.; Moser, A.; Rötzer, T.; Pauleit, S. Comparing the transpirational and shading effects of two contrasting urban tree species. Urban Ecosyst. 2019, 22, 683–697. [Google Scholar] [CrossRef]
  46. Cheela, V.S.; John, M.; Biswas, W.; Sarker, P. Combating urban heat island effect—A review of reflective pavements and tree shading strategies. Buildings 2021, 11, 93. [Google Scholar] [CrossRef]
  47. Kolimenakis, A.; Solomou, A.D.; Proutsos, N.; Avramidou, E.V.; Korakaki, E.; Karetsos, G.; Maroulis, G.; Papagiannis, E.; Tsagkari, K. The socioeconomic welfare of urban green areas and parks; a literature review of available evidence. Sustainability 2021, 13, 7863. [Google Scholar] [CrossRef]
  48. Cohen, P.; Potchter, O.; Matzarakis, A. Daily and seasonal climatic conditions of green urban open spaces in the Mediterranean climate and their impact on human comfort. Build. Environ. 2012, 51, 285–295. [Google Scholar] [CrossRef]
  49. Reyes-Paecke, S.; Gironás, J.; Melo, O.; Vicuna, S.; Herrera, J. Irrigation of green spaces and residential gardens in a Mediterranean metropolis: Gaps and opportunities for climate change adaptation. Landsc. Urban Plan. 2019, 182, 34–43. [Google Scholar] [CrossRef]
  50. Egerer, M.; Annighöfer, P.; Arzberger, S.; Burger, S.; Hecher, Y.; Knill, V.; Probst, B.; Suda, M. Urban oases: The social-ecological importance of small urban green spaces. Ecosyst. People 2024, 20, 2315991. [Google Scholar] [CrossRef]
  51. Perini, K.; Calise, C.; Castellari, P.; Roccotiello, E. Microclimatic and environmental improvement in a Mediterranean city through the regeneration of an area with nature-based solutions: A case study. Sustainability 2022, 14, 5847. [Google Scholar] [CrossRef]
  52. Proutsos, N.D.; Tsiros, I.X.; Nastos, P.; Tsaousidis, A. A note on some uncertainties associated with Thornthwaite’s aridity index introduced by using different potential evapotranspiration methods. Atmos. Res. 2021, 260, 105727. [Google Scholar] [CrossRef]
  53. Tsiros, I.X.; Nastos, P.; Proutsos, N.D.; Tsaousidis, A. Variability of the aridity index and related drought parameters in Greece using climatological data over the last century (1900–1997). Atmos. Res. 2020, 240, 104914. [Google Scholar] [CrossRef]
  54. UNEP. World Atlas of Desertification; UNEP: Cambridge, UK, 1992. [Google Scholar]
  55. Thornthwaite, C. Una aproximación para una clasificación racional del clima. Geogr. Rev. 1948, 38, 55–94. [Google Scholar] [CrossRef]
  56. Thornthwaite, C.W.; Mather, J. The water balance. Publ. Climatol. 1955, VIII, 1–104. [Google Scholar]
  57. Proutsos, N.; Korakaki, E.; Bourletsikas, A.; Solomou, A.; Avramidou, E.; Georgiadis, C.; Kontogianni, A.; Tsagari, K. Urban temperature trends in east Mediterranean: The case of Heraklion-Crete. Eur. Water 2020, 69, 3–14. [Google Scholar]
  58. Proutsos, N.; Solomou, A.; Tigkas, D. Decadal variation of aridity and water balance attributes at the urban and peri-urban environment of Attica-Greece. In Proceedings of the HAICTA 2022: 10th International Conference on ICT in Agriculture, Food & Environment, Athens, Greece, 22–25 September 2022; pp. 472–477. [Google Scholar]
  59. Golden Software LLC. Surfer® Ver. 13 Software. Available online: https://www.goldensoftware.com/products/surfer (accessed on 3 July 2025).
  60. Salvati, L.; Zitti, M.; Di Bartolomei, R.; Perini, L. Climate aridity under changing conditions and implications for the agricultural sector: Italy as a case study. Geogr. J. 2012, 2013. [Google Scholar] [CrossRef]
  61. Markov, D. Practical evaluation of the thermal comfort parameters. In Annual International Course: Ventilation and Indoor Climate; Avangard: Sofia, Bulgaria, 2002; pp. 158–170. [Google Scholar]
  62. ASHRAE. Fundamentals. Available online: https://sovathrothsama.wordpress.com/wp-content/uploads/2016/03/ashrae-hvac-2001-fundamentals-handbook.pdf (accessed on 3 July 2025).
  63. Matzarakis, A.; Rutz, F.; Mayer, H. Modelling radiation fluxes in simple and complex environments—Application of the RayMan model. Int. J. Biometeorol. 2007, 51, 323–334. [Google Scholar] [CrossRef]
  64. Matzarakis, A.; Rutz, F.; Mayer, H. Modelling radiation fluxes in simple and complex environments: Basics of the RayMan model. Int. J. Biometeorol. 2010, 54, 131–139. [Google Scholar] [CrossRef]
  65. Matzarakis, A.; Mayer, H. Another kind of environmental stress: Thermal stress. WHO Newsl. 1996, 18, 7–10. [Google Scholar]
  66. Delgado-Capel, M.J.; Egea-Cariñanos, P.; Cariñanos, P. Assessing the Relationship between Land Surface Temperature and Composition Elements of Urban Green Spaces during Heat Waves Episodes in Mediterranean Cities. Forests 2024, 15, 463. [Google Scholar] [CrossRef]
  67. Matzarakis, A.; Nastos, P. Greece 2023: Crazy Summer or New Normal—Lessons Not Learned. Atmosphere 2024, 15, 1241. [Google Scholar] [CrossRef]
  68. Pantavou, K.; Kotroni, V.; Kyros, G.; Lagouvardos, K. Thermal bioclimate in Greece based on the Universal Thermal Climate Index (UTCI) and insights into 2021 and 2023 heatwaves. Theor. Appl. Climatol. 2024, 155, 6661–6675. [Google Scholar] [CrossRef]
  69. Tousi, E.; Mela, A.; Tseliou, A. Thermal Stress in Outdoor Spaces During Mediterranean Heatwaves: A PET and UTCI Analysis of Different Demographics. Urban Sci. 2024, 8, 193. [Google Scholar] [CrossRef]
  70. Nations, U.; UN News. Global Perspective Human Stories: Heatwave Deaths Increased Across Almost All Europe in 2023, Says UN Weather Agency. Available online: https://news.un.org/en/story/2024/04/11487960 (accessed on 3 July 2025).
  71. Cao, X.; Onishi, A.; Chen, J.; Imura, H. Quantifying the cool island intensity of urban parks using ASTER and IKONOS data. Landsc. Urban Plan. 2010, 96, 224–231. [Google Scholar] [CrossRef]
  72. Mohajerani, A.; Bakaric, J.; Jeffrey-Bailey, T. The urban heat island effect, its causes, and mitigation, with reference to the thermal properties of asphalt concrete. J. Environ. Manag. 2017, 197, 522–538. [Google Scholar] [CrossRef] [PubMed]
  73. Đekić, J.P.; Mitković, P.B.; Dinić-Branković, M.M.; Igić, M.Z.; Đekić, P.S.; Mitković, M.P. The study of effects of greenery on temperature reduction in urban areas. Therm. Sci. 2018, 22, 988–1000. [Google Scholar] [CrossRef]
  74. Pomerantz, M.; Akbari, H.; Chang, S.-C.; Levinson, R.; Pon, B. Examples of Cooler Reflective Streets for Urban Heat-Island Mitigation: Portland Cement Concrete and Chip Seals. 2003. Available online: https://eta-publications.lbl.gov/sites/default/files/lbnl-49283.pdf (accessed on 3 July 2025).
  75. Grimmond, S. Urbanization and global environmental change: Local effects of urban warming. Geogr. J. 2007, 173, 83–88. [Google Scholar] [CrossRef]
  76. Sieber, P.; Bohme, S.; Ericsson, N.; Hansson, P.-A. Albedo on cropland: Field-scale effects of current agricultural practices in Northern Europe. Agric. For. Meteorol. 2022, 321, 108978. [Google Scholar] [CrossRef]
  77. Salata, F.; Golasi, I.; de Lieto Vollaro, A.; de Lieto Vollaro, R. How high albedo and traditional buildings’ materials and vegetation affect the quality of urban microclimate. A case study. Energy Build. 2015, 99, 32–49. [Google Scholar] [CrossRef]
  78. Yang, J.; Wang, Z.-H.; Kaloush, K.E. Environmental impacts of reflective materials: Is high albedo a ‘silver bullet’for mitigating urban heat island? Renew. Sustain. Energy Rev. 2015, 47, 830–843. [Google Scholar] [CrossRef]
  79. Egegård, C.H.; Lindborg, M.; Gren, Å.; Marcus, L.; Pont, M.B.; Colding, J. Climate Proofing Cities by Navigating Nature-Based Solutions in a Multi-Scale, Social–Ecological Urban Planning Context: A Case Study of Flood Protection in the City of Gothenburg, Sweden. Land 2024, 13, 143. [Google Scholar] [CrossRef]
  80. Hanna, E.; Felipe-Lucia, M.R.; Comín, F.A. Scenario Analysis of Green Infrastructure to Adapt Medium-Size Cities to Climate Change: The Case of Zaragoza, Spain. Land 2024, 13, 280. [Google Scholar] [CrossRef]
  81. Lee, Y.Y.; Md Din, M.F.; Iwao, K.; Lee, Y.H.; Anting, N. Impact of thermal behaviour of different environmental conditions on ambient environment and thermal discomfort in Malaysia. Indoor Built Environ. 2021, 30, 520–534. [Google Scholar] [CrossRef]
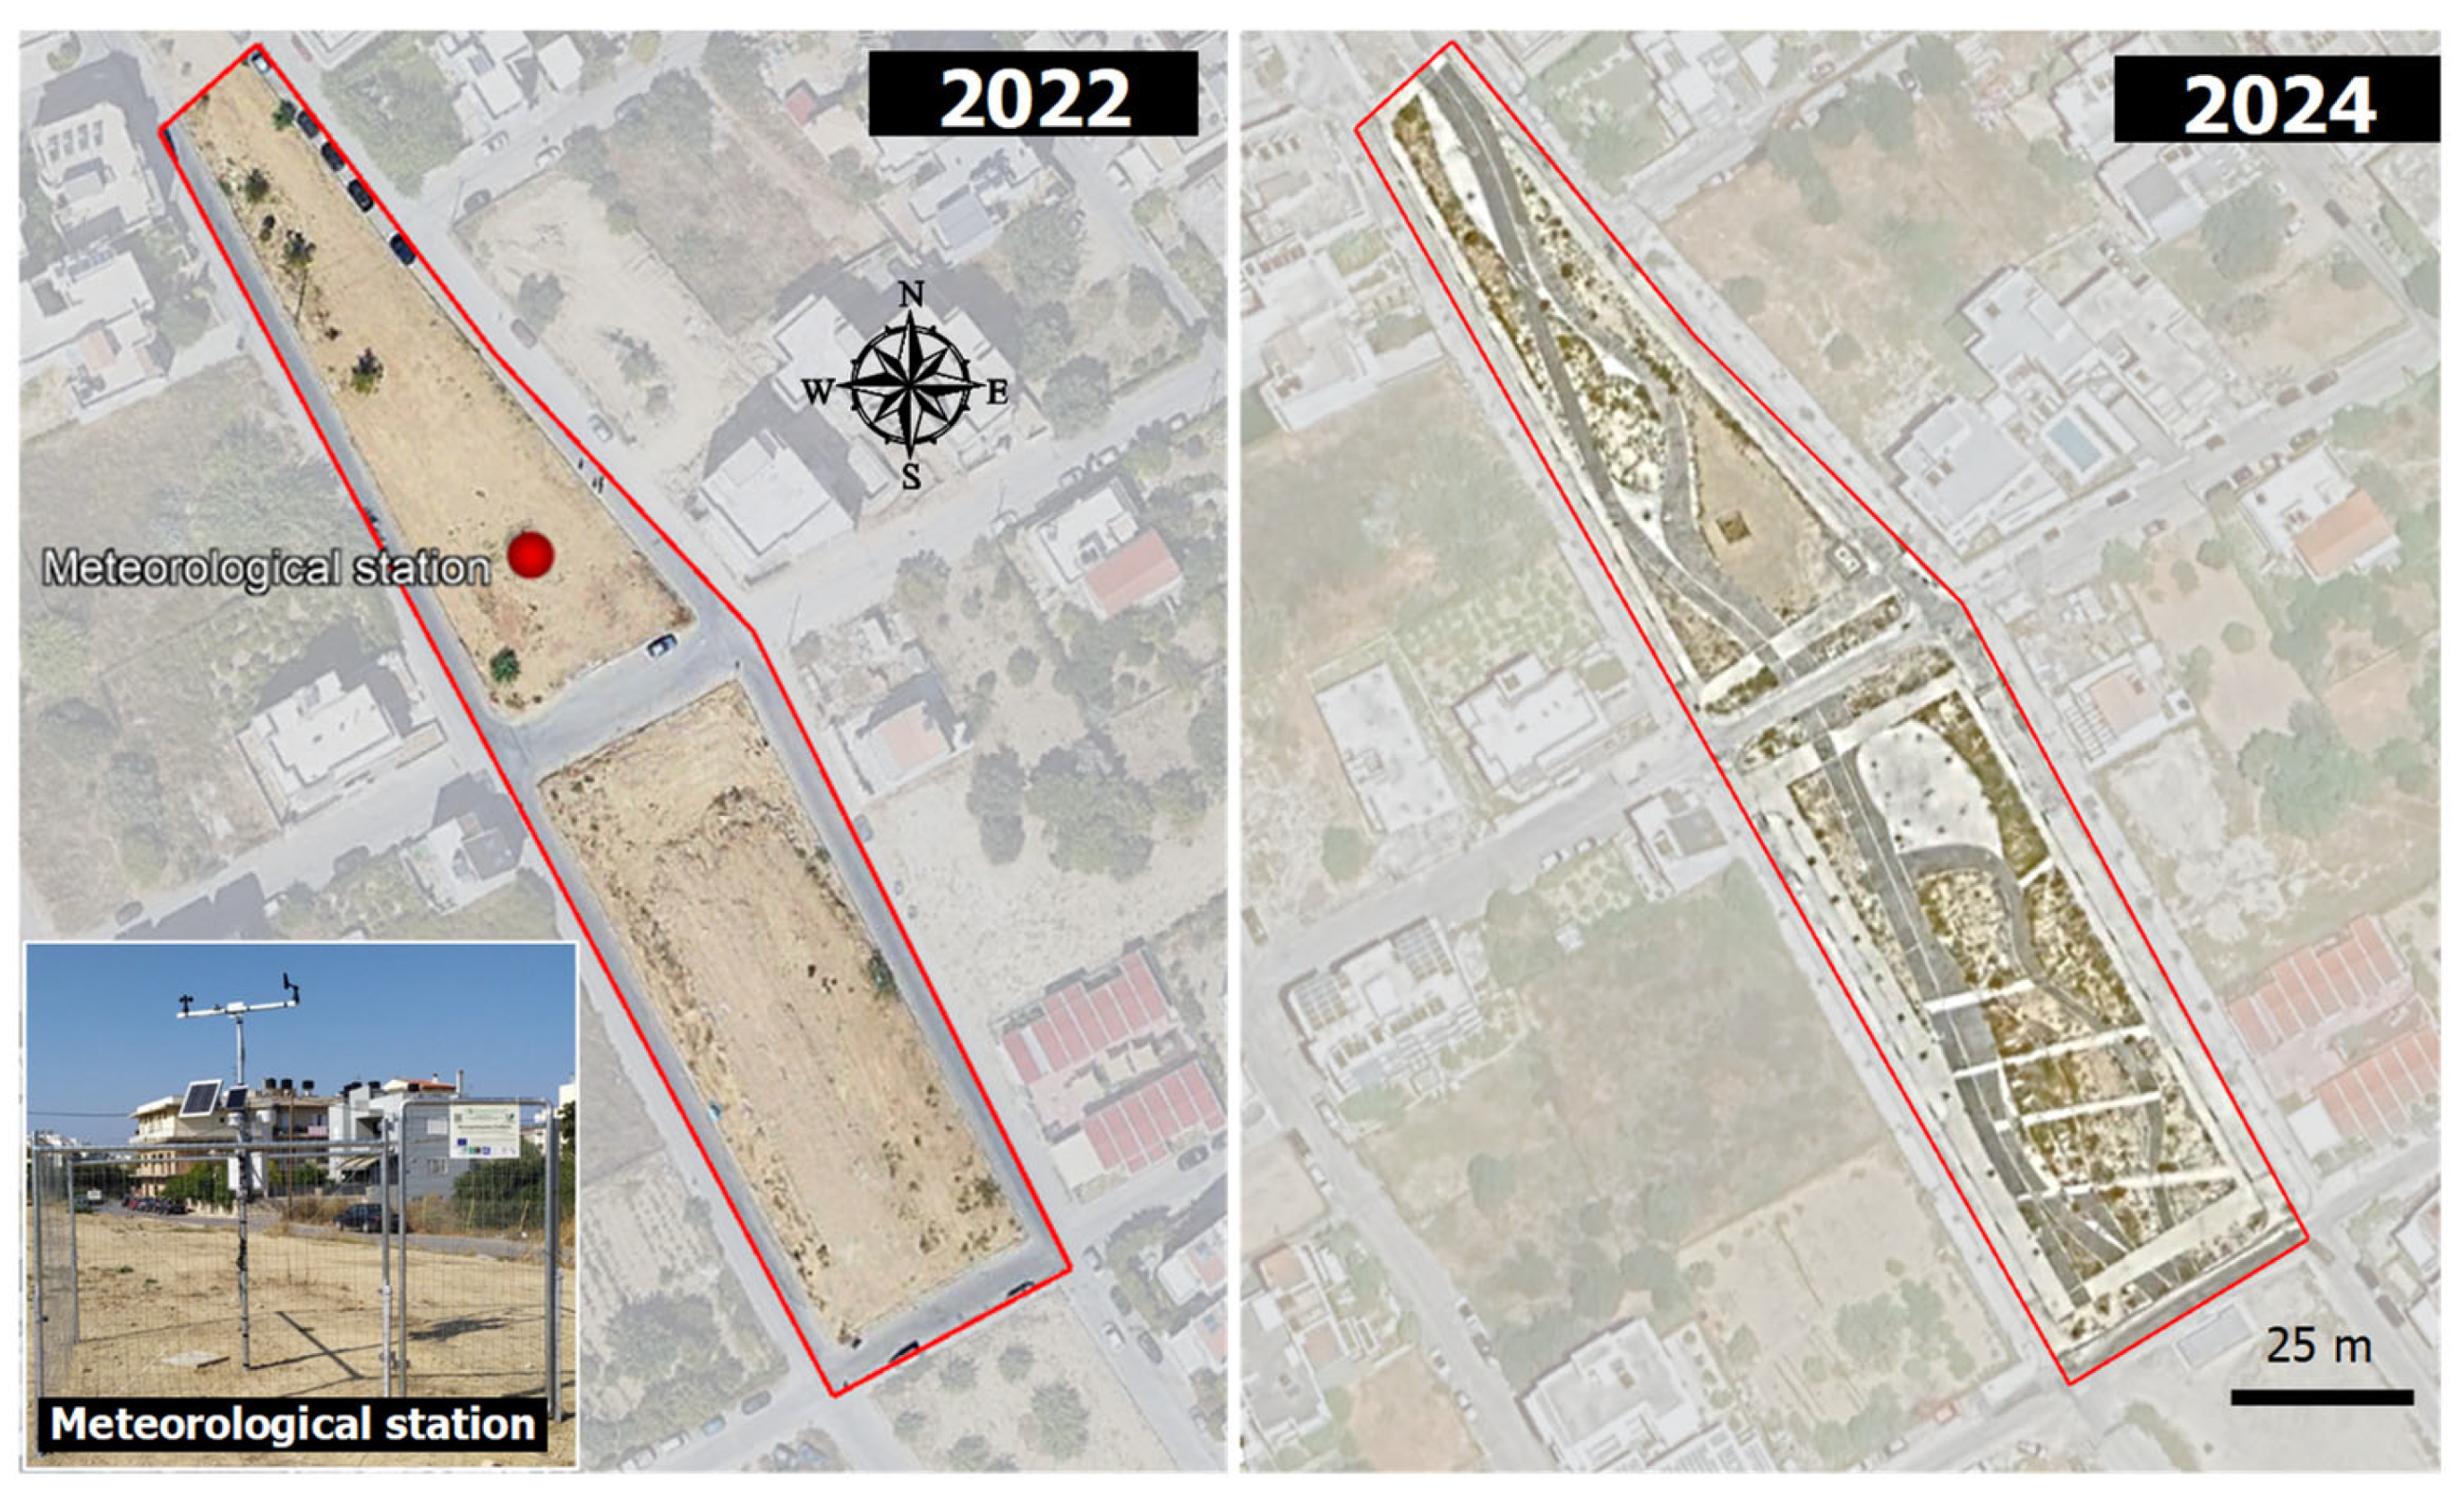
Figure 1. The study site in Heraklion (Crete), with a total area of 0.64 ha (red line), before (2022) and after (2024) its restoration. The meteorological station installed inside the area is also depicted.
Land 14 01681 g001
Figure 2. Different materials (artificial or natural) present at the study site in Heraklion (Crete) after its restoration in 2024.
Land 14 01681 g002
Figure 3. Hourly average air temperature values for the 2022–2024 period, the years 2022 and 2024, and for the dates 29 July 2022 and 1 August 2023, when the measurement campaigns were conducted in the urban space in Heraklion.
Land 14 01681 g003
Figure 4. Diurnal percentage distribution of the hours per thermal comfort category for the 2020–2024 period and for the years 2022 and 2024.
Land 14 01681 g004
Figure 5. Spatial pattern of the albedo, ρ, at the urban green space in Heraklion at noon during warm summer days, before (29 July 2022, 11:30–13:30) and after (1 August 2024, 13:30–15:30) the site’s restoration.
Land 14 01681 g005
Figure 6. Box plots showing the albedo (ρ) differences in the artificial materials, bare soil, and vegetation at the urban green space in Heraklion before (29 July 2022, around noon 11:30–13:30) and after (1 August 2024, both in the morning, 9:30–10:30, and at noon, 13:30–15:30) the site’s restoration. Different letters indicate significant differences according to the results of one-way ANOVA followed by Tukey’s HSD test at p < 0.5.
Land 14 01681 g006
Figure 7. Surface temperatures Tc at the urban green space in Heraklion before (29 July 2022, around noon, 11:30–13:30) and after (1 August 2024, both in the morning, 9:30–10:30, and at noon, 13:30–15:30) the site’s restoration.
Land 14 01681 g007
Figure 8. Differences between surface temperature Tc and air temperature Tair at the urban green space in Heraklion before (29 July 2022, around noon, 11:30–13:30) and after (1 August 2024, both in the morning, 9:30–10:30, and at noon, 13:30–15:30) the site’s restoration.
Land 14 01681 g008
Figure 9. Box plots showing surface temperatures of the artificial materials, bare soil, and vegetation at the urban green space in Heraklion before (29 July 2022, around noon 11:30–13:30) and after (1 August 2024, both in the morning, 9:30–10:30, and at noon, 13:30–15:30) the site’s restoration. Different letters indicate significant differences according to the results of one-way ANOVA followed by Tukey’s HSD test at p < 0.5.
Land 14 01681 g009
Figure 10. Box plots showing the surface to air temperature differences (Tc-Tair) of artificial materials, bare soil, and vegetation at the urban green space in Heraklion before (29 July 2022, around noon 11:30–13:30) and after (1 August 2024, both in the morning, 9:30–10:30, and at noon, 13:30–15:30) the site’s restoration. Different letters indicate significant differences according to the results of one-way ANOVA followed by Tukey’s HSD test at p < 0.5.
Land 14 01681 g010
Table 1. Monthly average Predicted Mean Vote (PMV) values at the study site in Heraklion. Cells are shaded according to the classes described in the legend.
Month20202021202220232024
1−2.5−1.9−2.6−1.9−2.1
2−2.0−1.8−2.2−2.4−1.8
3−1.5−1.9−2.6−1.5−1.2
4−0.9−0.7−0.6−0.9−0.4
50.60.60.2−0.40.1PMV classification
61.01.21.20.81.6+3 hot
71.51.81.41.91.8+2 warm
81.51.81.51.61.8+1 slightly warm
91.10.70.90.81.00 neutral
100.3−0.4−0.30.20.1−1 slightly cool
11−1.3−0.9−1.0−0.5−1.2−2 cool
12−1.6−2.0−1.4−1.3−1.8−3 cold
Table 2. Monthly average Physiological Equivalent Temperature (PET) values at the study site in Heraklion. Cells are shaded according to the classes described in the legend.
Month20202021202220232024
17.610.36.910.19.5
210.111.09.28.311.1PET (°C) classification
312.711.07.112.514.2PET (°C)Thermal PerceptionGrade of Physical stress
416.317.117.615.718.9>41Very hotExtreme heat stress
524.224.422.218.421.535–41HotStrong heat stress
626.527.427.325.029.929–35WarmModerate heat stress
729.030.128.230.730.423–29Slightly warmSlight heat stress
829.030.528.428.830.018–23ComfortableNo thermal stress
926.124.525.224.626.113–18Slightly coolSlight cold stress
1022.118.318.621.621.28–13CoolModerate cold stress
1112.915.614.717.414.14–8ColdStrong cold stress
1211.69.512.712.810.8≤4Very coldExtreme cold stress
Disclaimer/Publisher’s Note: The statements, opinions and data contained in all publications are solely those of the individual author(s) and contributor(s) and not of MDPI and/or the editor(s). MDPI and/or the editor(s) disclaim responsibility for any injury to people or property resulting from any ideas, methods, instructions or products referred to in the content.