Abstract
Understanding vegetation dynamics and climate variability in the vicinity of Internally Displaced Person (IDP) camps is critical due to the high dependency of displaced populations on local natural resources. This study investigates vegetation cover changes and long-term climate variability around the Sortony IDP camp in Darfur, Sudan, using satellite and climate data spanning 1980 to 2024. High-resolution imagery from PlanetScope and Sentinel–2 Level 2A was used to assess vegetation cover changes from 2015 to 2024, while precipitation, temperature, and drought trends were analyzed over 44 years (1980–2024). Vegetation changes were quantified using the Normalized Difference Vegetation Index (NDVI), and drought conditions were assessed through the Standardized Precipitation Evapotranspiration Index (SPEI) at 6-, 9-, and 12-month timescales. Future precipitation predictions were modeled using the Autoregressive Integrated Moving Average (ARIMA) model. The results revealed a substantial increase in vegetative cover: the dense vegetation class increased by 3.50%, moderate vegetation by 17.33%, and low vegetation by 30.22%. In contrast, sparse and non-vegetated areas declined by 4.55% and 46.51%, respectively. The SPEI analysis indicated a marked reduction in drought frequency and severity after 2015, following a period of prolonged drought from 2000 to 2014. Forecasts suggest continued increases in rainfall through 2034, which may further support vegetation regrowth. These findings underscore the complex interplay between climatic factors and human activity in conflict-affected landscapes. The observed vegetation recovery highlights the region’s potential for ecological resilience, reinforcing the urgent need for sustainable land-use planning and climate-adaptive management strategies in humanitarian and post-conflict settings such as Darfur.
1. Introduction
In conflict-affected and other nations, forests and areas of ecological importance are increasingly recognized not only for their multifaceted benefits to local communities, but also for their role in environmental conservation and climate change mitigation [1]. Climate change is a pressing global challenge that has profound impacts on vegetation, biodiversity, and ecosystem services. Semi-arid regions, such as Darfur, Sudan, are particularly vulnerable to these changes [2,3].
The Darfur region has faced a prolonged humanitarian crisis since the early 2000s, which is marked by armed conflict, mass displacement, and severe environmental degradation [4]. Recent escalations in violence [5], including clashes between armed movements, government forces, and tribal militias in 2023, have further exacerbated these challenges, with approximately 10.7 million people representing 2.1 million families now internally displaced across Sudan [6].
Refugee/IDP camps, from an ecological standpoint, are characterized by higher rates of deforestation, soil degradation, and water pollution [7]. The high demand for resources like firewood and water by large populations often leads to overexploitation and improper waste management [8]. Settled areas, while also impacting the environment, generally have more established infrastructure and resource management systems, though these can also be strained by population growth [9].
Drought remains one of the most insidious and costly natural hazards and is characterized by a gradual onset and prolonged impacts on communities and ecosystems [10,11] Considerable progress has been made in drought assessment, with indices such as the Standardized Precipitation Index (SPI) [12] and the Standardized Precipitation Evapotranspiration Index (SPEI) [13] widely adopted for evaluating drought conditions. The SPEI integrates climatic water balance and atmospheric evaporative demand, making it more sensitive to temperature-driven drought dynamics than SPI, especially in regions experiencing significant temperature increases and changes in potential evapotranspiration [14,15].
Extreme climatic events, such as floods, droughts, and tropical cyclones, have profound effects on vegetation ecosystems, leading to declining crop yields, delays in planting schedules, increased forest losses, higher plant vulnerability, and heightened risks of pest infestations and diseases [16]. Among these challenges, drought is particularly detrimental, especially in arid and semi-arid regions (ASALs), where water scarcity significantly limits plant growth and ecosystem stability [17]. Prolonged drought conditions reduce the availability of soil moisture, thus decreasing vegetation density and accelerating land degradation [18,19,20]. Severe water shortages also impair photosynthetic activity, leading to lower Normalized Difference Vegetation Index (NDVI) values, which indicate stress or dying vegetation [21]. In extreme cases, drought can drive desertification, in which sparse vegetation is replaced by barren land, exacerbating soil erosion and biodiversity loss [11,22]. In conflict-affected regions such as Darfur, the effects of drought are compounded by human activities, including widespread deforestation for fuelwood, unsustainable agricultural expansion, and resource overexploitation [23,24]. These factors contribute to ecosystem instability, making vegetation recovery more challenging even after drought conditions improve. Understanding the role of drought-shaped vegetation cover is crucial for assessing long-term environmental resilience and planning sustainable land management strategies in vulnerable areas.
Agroforestry practices have long been integral to the region’s land use, where mature trees coexist with field crops near villages and within areas adopted by the Internally Displaced Person (IDP) communities [25]. Pearl millet (Pennisetum glaucum), a staple crop, dominates cultivation for subsistence and traditional diets in Western Sudan [26]. Surrounding areas such as the Jebel Marrah region are intermittently used for diverse cash crops, including orange, mango, guava, sesame, and dried hibiscus petals [27,28].
Remote sensing (RS) and geographic information system (GIS) technologies have proven invaluable for monitoring vegetation dynamics and climatic impacts, particularly in arid and semi-arid regions where ground data are sparse [29,30,31,32,33]. While previous studies in Darfur have primarily focused on land use and vegetation changes in Central, Western, and Southern Darfur [34,35], this study is the first, to the best of our knowledge, to specifically analyze vegetation recovery and climate variability near the Sortony IDP camp. Unlike prior research, which largely focused on regional land degradation trends, this study adopted an integrated, site-specific approach to assess the complex interactions between climate variability, human displacement, and ecological resilience in a conflict-affected landscape. Our research advances the current knowledge by combining multi-source satellite imagery (Sentinel–2 Level 2A and PlanetScope), an advanced time-series forecasting model, Autoregressive Integrated Moving Average (ARIMA), and drought assessment (SPEI) to provide a comprehensive, data-driven analysis of vegetation dynamics. This study fills an important knowledge gap by examining how changes in climate and displacement patterns affect vegetation dynamics over time, shedding light on the long-term environmental impacts of Internally Displaced Person (IDP) settlements. The novelty of this study lies in its holistic methodological framework, which integrates remote sensing, climate forecasting, and drought analysis to assess climate-induced vegetation changes within an IDP-affected area. These findings provide valuable insights into the interactions between displacement, environmental stress, and vegetation regeneration, contributing essential data for sustainable land-use planning, ecosystem restoration, and climate adaptation strategies in conflict-prone regions.
2. Materials and Methods
2.1. Description of the Study Area
The study area is situated in Western Sudan, within the Northern Darfur state, covering approximately 69,098 hectares between latitudes 13°18′ and 13°30′ N and longitudes 24°12′ and 24°28′ E (Figure 1). The region experiences an average annual temperature of 23–24 °C and receives approximately 200–400 mm of rainfall annually (Figure 2). At the center of this area lies the Sortony Internally Displaced Person (IDP) camp, established in January 2016, located about 52 km southeast of Kebkabiya Town within the administrative boundaries of the Kebkabiya locality [36,37]. Situated near the conflict-ridden Jebel Marrah region and adjacent to the United Nations–African Union Hybrid Operation in Darfur (UNAMID) base, the camp serves as a critical refuge for displaced populations. Its prominence grew in 2016 as it received a significant influx of IDPs escaping violent clashes between the Sudan Liberation Army/Abdul Wahid (SLA/AW) faction and the Sudan Armed Force (SAF) in Jebel Marrah. Since mid-January 2016, an estimated 61,000 Darfuris have sought refuge in the Sortony camp, primarily arriving from Rokero (60%) and Boly (32%) in the Shamal Jabal Marrah locality, Central Darfur state, and Kogna (8%) in the Kebkabiya locality in the Northern Darfur state [38].
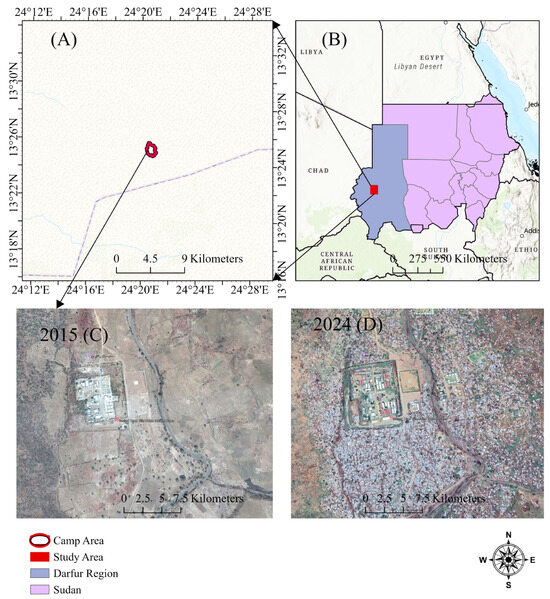
Figure 1.
Map of the study area showing the following: (A) the delineated study boundary; (B) the location of the study area within the Darfur region; (C) a satellite image from 2015 illustrating the site prior to the establishment of the IDP camp; and (D) a satellite image from 2024 showing the site after the camp was established.
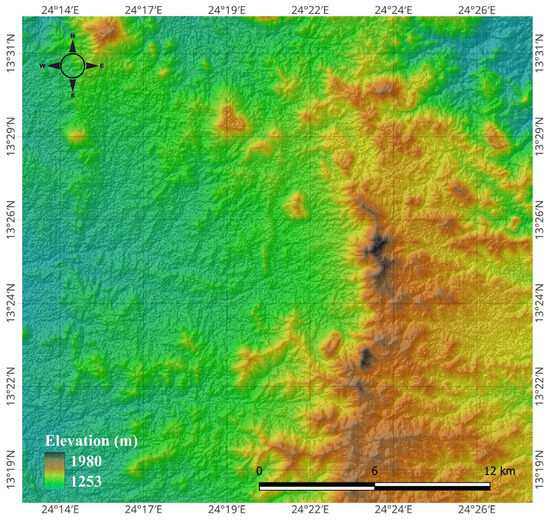
Figure 2.
Elevation map of the study area.
The study area encompasses diverse terrains, including the western slopes of the Jebel Marrah mountain range, which are characterized by low hills descending to sandy and clay plains at lower elevations. Seasonal watercourses, or wadis, traverse the region, collect rainwater, and drain water into Lake Chad. The woody vegetation is dominated by five tree species: Eucalyptus spp., Albizia amara, Acacia senegal, Anogeissus leiocarpus, and Balanites aegyptiaca [29]. Notably, Eucalyptus spp., Anogeissus leiocarpus, and Balanites aegyptiaca exhibit vegetative regeneration and are capable of resprouting from cut stems or recovering after heavy grazing or fire [29]. The area was traditionally used for rain-fed agriculture and extensive agro-pastoralism, with crops like millet, sorghum, and groundnut [39,40]. Based on satellite imagery and field knowledge, we identified the key habitat types as follows: dry Acacia–Combretum woodland, shrubland, fallow croplands, degraded plains, and mountainous regions.
2.2. Data Acquisition and Analysis
2.2.1. Satellite Data
This study utilized Sentinel–2 Level 2A satellite imagery with a spatial resolution of 10 m, complemented by PlanetScope data offering a finer resolution of 3.5 m. Sentinel–2 Level 2A imagery was used for all temporal analysis (2015–2024), while PlanetScope data was used for fine-scale validation. Satellite images were sourced from the Copernicus Data Space Ecosystem https://dataspace.copernicus.eu/ (accessed on 1 May 2025) and Planet Labs (https://planet.com, accessed on 1 May 2025). Data from 2015, 2017, 2020, and 2024 were selected to capture both short- and long-term vegetation changes. The year 2015 was specifically chosen to represent conditions before the establishment of the Sortony IDP camp while ensuring the availability of cloud-free images (<10%). October was chosen to ensure NDVI consistency and minimize phenological variations, as most rainfed crops are harvested by this time. October represents the transition from the wet season to the dry season in the study area, a period when vegetation is fully developed after the peak rainfall months. Analyzing the NDVI during this period allows for a clearer distinction between different vegetation classes while reducing the influence of short-term fluctuations caused by rainfall events [41,42]. Additionally, selecting images from the same season across all study years minimizes the impact of phenological differences, ensuring that variations in NDVI values reflect actual vegetation changes rather than seasonal effects [43]. Table 1 summarizes the details of the satellite images used in this study. Image pre-processing and analysis were conducted using QGIS 3.34.3 software and the Google Earth Engine (GEE) platform. These platforms facilitate comprehensive pre- and post-processing workflows, including atmospheric correction, spatial alignment, and vegetation index calculations. The rigorous methodology ensured consistency and reliability in assessing the vegetation cover dynamics over the selected years. Elevation data were obtained from the United States Geological Survey (USGS) Earth Explorer (SRTM 30 m resolution) (https://earthexplorer.usgs.gov/, accessed on 6 July 2025), and the datasets were processed and analyzed using QGIS version 3.34.3 for spatial assessment and mapping.

Table 1.
Summary of utilized satellite data.
2.2.2. Temperature and Precipitation
This study utilized satellite-based datasets to analyze rainfall and temperature patterns. Although the NDVI analysis covers the 2015–2024 period due to the limited availability of high-resolution Sentinel–2 Level 2A and PlanetScope data, we also show long trends in precipitation and temperature from 1980 to 2024. Rainfall data were obtained from the Climate Hazards Group Infrared Precipitation with Station (CHIRPS) dataset, which was developed through a collaboration between the United States Geological Survey (USGS) and the University of California, Santa Barbara (UCSB). CHIRPS provides high-resolution rainfall data with a spatial resolution of 0.05° and daily temporal granularity [44]. Temperature data of 0.5° × 0.625° grid resolution at 2 m height were sourced from the Modern-Era Retrospective Analysis for Research and Applications (MERRA–2), a part of the NASA POWER Prediction of Worldwide Resource (POWER) project [45,46]. Both datasets were accessed through GEE for extraction, and subsequent analyses were conducted using Microsoft Excel and the R Statistical Software [47].
2.2.3. Drought Monitoring and Analysis
To monitor long-term drought conditions in the study area, this research utilized daily precipitation and temperature data from 1980 to 2024. The Standardized Precipitation Evapotranspiration Index (SPEI), developed by [13], was employed as the primary drought index. Unlike indices based solely on precipitation (e.g., the SPI), the SPEI integrates both precipitation deficits and temperature-driven evapotranspiration, allowing for a more accurate and climatically sensitive assessment of drought dynamics. The SPEI was calculated at three distinct timescales, 6-month (SPEI-6), 9-month (SPEI-9), and 12-month (SPEI-12), to capture drought impacts across varying temporal dimensions.
SPEI-6 represents short- to medium-term drought conditions, typically affecting agricultural productivity, pasture conditions, and seasonal crop yields. SPEI-9 reflects prolonged dry periods, influencing soil moisture reserves, groundwater recharge, and broader hydrological system performance. SPEI-12 captures long-term drought patterns, encompassing the cumulative impact of climate variability on ecosystems, resource sustainability, and socioeconomic vulnerabilities, including conflict and displacement dynamics. Data pre-processing and SPEI calculations were performed using the SPEI package in the R Statistical Software version 4.3.2, which allowed for efficient time series analysis and graphical visualization of drought variability. This multiscale approach provided a comprehensive picture of both historical and recent drought trends, helping to distinguish between short-term seasonal water stress and longer-term climatic drought phenomena [48,49].
2.2.4. Vegetation Cover Analysis
Changes in vegetation cover were assessed using the NDVI derived from Sentinel–2 Level 2A and PlanetScope data for 2015, 2017, 2020, and 2024. The NDVI was calculated using the spectral red and near-infrared (NIR) bands. This index ranges from −1 to +1, with higher values indicating abundance of green biomass and lower values showing sparse vegetation [50,51]. NDVI analysis was performed to evaluate spatial and temporal vegetation changes, and the resulting maps were processed using the QGIS 3.34.3 software for visualization and interpretation [52,53].
2.2.5. NDVI Classification
NDVI classification was performed to assess vegetation cover changes, which are essential for monitoring vegetation health, guiding land-use planning, and informing ecosystem management strategies [54]. The classification thresholds were determined based on existing NDVI classification studies [55] and were calibrated to reflect the specific ecological and vegetation characteristics of the study area (Table 2).
Table 2.
NDVI classification ranges.
To enhance ecological interpretation, each NDVI class was linked to dominant potential habitat types, as follows:
No vegetation (NDVI < 0): This includes barren land, residential areas, exposed rock surfaces, and sandy soils.
Sparse vegetation (NDVI 0–0.2): This represents degraded lands with minimal plant cover and scattered herbaceous growth.
Low vegetation (NDVI 0.2–0.3): This is typically associated with open woodlands or areas dominated by Acacia species and early-stage regrowth.
Moderate vegetation (NDVI 0.3–0.4): This reflects regenerating shrublands, fallow agricultural fields, or mixed cropland with natural cover.
Dense vegetation (NDVI > 0.4): This indicates riparian corridors, woodland patches, and moist zones with stable vegetative biomass.
This classification framework enhances the ecological relevance of NDVI-based land cover analysis in arid and semi-arid conflict-affected landscapes such as Darfur.
To quantify vegetation changes over time, area statistics and percentage calculations were performed to assess shifts between classification categories over consecutive years. This approach facilitates a detailed interpretation of vegetation dynamics, enabling the identification of growth and decline trends across different temporal scales. We also used the networkD3 package in the R software to create a Sankey plot for better visualization of the results.
2.2.6. Accuracy Assessment
An accuracy assessment was conducted for the vegetation cover classifications in 2015, 2017, 2020, and 2024 to evaluate the reliability of the classified vegetation categories. The accuracy of such assessments depends on the availability of precise ground truth or reference data [56]. Reference data were obtained from high-resolution satellite imagery from Google Earth Pro (0.15 m), which was visually interpreted and supplemented with the first author’s local knowledge to ensure a comprehensive representation across different vegetation cover types; training samples were strategically selected following the best practices outlined by [57]. A stratified random sampling approach was employed, with 60 samples per vegetation class collected each year. This method helped to minimize spatial bias and improve classification accuracy [58]. Multi-year imagery was used instead of a single time-point dataset to account for seasonal variability and long-term land-cover changes [59]. This approach enhanced the capture of vegetation phenology and land-use dynamics. To maintain a balanced and unbiased accuracy assessment, 50% of the training samples were used for validation [60]. Accuracy metrics were derived from confusion matrices and included the overall accuracy (OA), Kappa coefficient, Producer’s Accuracy (PA), and User’s Accuracy (UA). Producer’s Accuracy (PA) indicates the probability that a reference (ground truth) sample has been correctly classified, reflecting the classifier’s ability to avoid omission errors. User’s Accuracy (UA) represents the probability that a pixel labeled as a certain class on the map actually corresponds to that class on the ground, highlighting the level of commission error. These metrics provide a comprehensive evaluation of classification performance from both the map producer’s and end-user’s perspectives [61].
2.2.7. Time-Series Forecasting
Time-series forecasting involves analyzing a sequence of observations recorded at consistent intervals to develop models that effectively represent the underlying structure of the data. These models enable accurate prediction, monitoring, and control of the observed phenomena [62]. Various methodologies exist for modeling time series with single seasonal patterns, including Exponential Smoothing (ETS), ARIMA [63], state-space models [64], and innovative state-space models [65]. The ARIMA model is particularly notable for its ability to forecast time series by utilizing a combination of its own past values, previous errors, and, where applicable, current and past values of the related variables. It is designed to explain autocorrelation within the data and can be applied to both stationary and non-stationary time series [66]. On the other hand, ETS generates forecasts by weighing past observations, with weights decreasing exponentially over time. This technique often provides more accurate forecasts than simple averaging methods because of its emphasis on recent data trends [67].
In this study, both ARIMA and ETS models were applied using the R Statistical Software to predict rainfall and temperature trends, based on data with a spatial resolution of 0.05° and annual temporal resolution, derived from mean yearly precipitation and temperature values. ARIMA combines three mathematical components, namely autoregressive, integrated, and moving-average processes, allowing it to capture complex temporal dependencies. The ETS complements this by accounting for trends and seasonal variations in the data. Together, these models provide robust forecasts that support the analysis of future climatic conditions in the region.
3. Results
3.1. Climate Variability
An analysis of satellite-derived temperature and precipitation data from 1980 to 2024 revealed significant trends in climate variability across the study area (Figure 3). Precipitation trends exhibited two clear phases: a relatively flat and variable trend from 1980 to approximately 2012, followed by a notable upward shift from 2013 onward. This post-2012 increase is captured by the overall linear trend (R2 = 0.13, p = 0.015), indicating a statistically significant rise in annual rainfall, with pronounced inter-annual fluctuations. The shift aligns with the observed vegetation recovery during the latter part of the study period and reflects a regional transition to wetter conditions since 2015. The linear regression of the maximum temperature against time showed a statistically significant increasing trend (R2 = 0.18, p = 0.004), reflecting a steady rise in daytime extremes. The mean temperature also showed a moderate yet significant increase (R2 = 0.10, p = 0.032), while the minimum temperature exhibited a weaker, statistically non-significant trend (R2 = 0.03, p = 0.289), suggesting less consistent warming during nighttime or cooler periods.
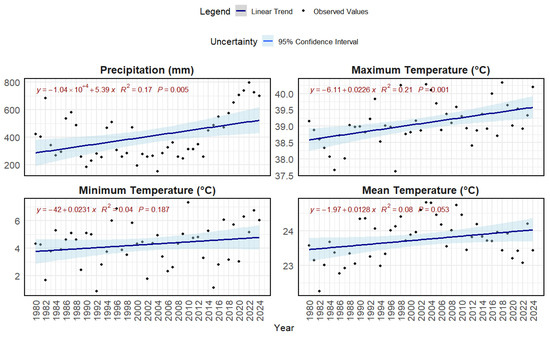
Figure 3.
The average annual precipitation (mm) and temperature maximum, minimum, and average trend (°C) of the study area (1980–2024).
Together, these trends suggest a warming and increasingly humid climate in the region, which has likely supported vegetation regeneration in recent years, especially in areas affected by prior droughts and land degradation.
3.2. Rainfall and Temperature Forecast
The rainfall and temperature forecast for 2024–2034 indicated a consistent trend of increased precipitation and temperature across the study area. The ARIMA time series forecasting model (Figure 4) projects a stable trend in annual rainfall, stabilizing around 700 mm, with moderate uncertainty suggesting potential variations between 500 mm and 880 mm. The temperature indicates a stable trend in the maximum, minimum, and mean temperatures, stabilizing at 39.4 °C, 4 °C, and 23.5 °C, respectively. The projections indicate moderate uncertainty, with potential fluctuations ranging from 38.5 °C to 41 °C for maximum temperatures, 2.5 °C to 6 °C for minimum temperatures, and 23 °C to 24.3 °C for mean temperatures.
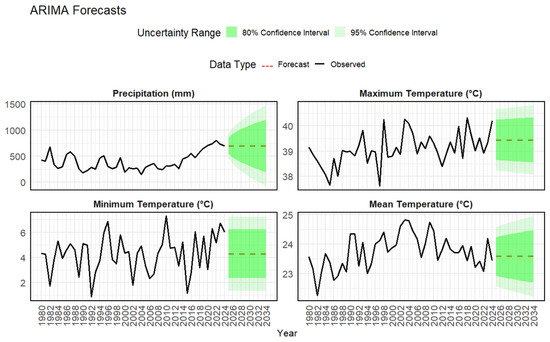
Figure 4.
Forecasting of climate variables with the ARIMA model (2024–2034).
Similarly, the ETS model (Figure 5) predicts rainfall levels stabilizing around 700 mm annually; however, it presents higher uncertainty, with potential fluctuations ranging from 400 mm to 1000 mm. The temperature indicates an increased trend in maximum temperature, with moderate uncertainty, with potential fluctuation ranging between 38.8 °C and 40.4 °C.
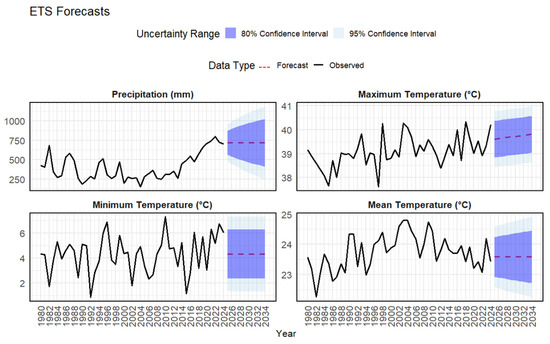
Figure 5.
Forecasting of climate variables with the ETS model (2024–2034).
The mean and minimum temperatures showed a stable trend, stabilizing at 23.6 °C and 4.3 °C, respectively, with moderate uncertainty, with potential fluctuation ranging from 2.2 °C to 6.2 °C of the minimum temperature, and 23 °C to 24.3 °C of the mean temperature.
Both models align with the historical trends of increasing precipitation, reinforcing the expectation of sustained high rainfall levels by 2034.
3.3. Drought Analysis (SPEI-Based Assessment)
To assess long-term drought dynamics, the SPEI was analyzed over 44 years (1980–2024) using three timescales: 12-month, 9-month, and 6-month (Figure 6). These timescales reflect long-, medium-, and short-term hydrological stress, respectively. The 1980–2000 period was characterized by highly variable wet and dry episodes, with frequent fluctuations between drought and recovery phases. A prolonged dry period from 2000 to 2014 was evident across all SPEI timescales, indicating sustained meteorological drought conditions. In contrast, 2015–2024 exhibited a clear shift toward wetter conditions, with only minor drought episodes, reflecting increased precipitation and reduced water stress in recent years. SPEI-12’s (long-term drought indicator) R2 = 0.181, with p = 1.11, indicates a mild but statistically weak positive trend toward reduced long-term drought severity. SPEI-9’s (medium-term drought indicator) R2 = 0.042, with p = 1.78 indicates a very weak trend, suggesting minimal change in mid-term drought variability. SPEI-6’s (short-term drought indicator) R2 = 0.13, with p = 7.95, shows a moderate decreasing drought trend, though with limited statistical confidence. These results indicate that drought conditions have become less frequent and less intense since 2015, reinforcing the observed trends in rainfall and vegetation recovery. However, the relatively weak statistical strength of the trends highlights the complexity of drought variability in arid and semi-arid climates.
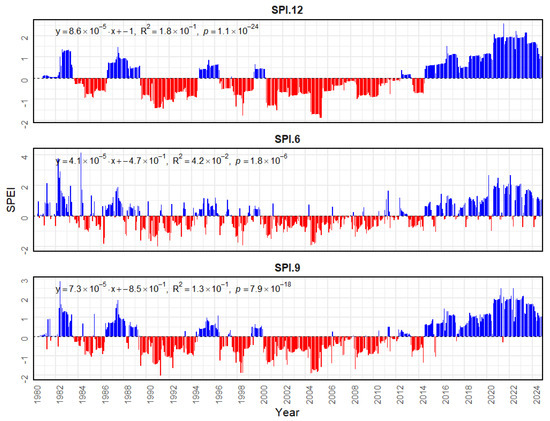
Figure 6.
SPEI trends over 6-, 9-, and 12-month timescales in Darfur showing variation in the duration, severity, and intensity of dry and wet conditions. The red bars represent negative SPEI values drought periods, while the blue bars represent positive SPEI values, indicating wet conditions. The variations in bar length and frequency across different timescales illustrate fluctuations in drought and wet periods over time.
3.4. Vegetation Cover Changes
3.4.1. Accuracy Assessment Results
The accuracy assessment of the vegetation cover classification revealed that the various vegetation types in the study region were classified accurately (Table 3). The overall accuracy ranged between 87.84 and 93.59, and the Kappa Hat between 0.78 and 0.88.
Table 3.
NDVI classification accuracy of 2015, 2017, 2020, and 2024.
3.4.2. Vegetation Dynamic Statistics and Maps
The analysis of vegetation dynamics around the Sortony IDP camp from 2015 to 2024 revealed significant changes in vegetation cover, as assessed through NDVI-based classification. This study classified vegetation into five categories: no vegetation, sparse vegetation, low vegetation, moderate vegetation, and dense vegetation. These categories were quantified in terms of their spatial extent (hectares) and percentage of the total study area (Figure 7 and Table 4). The no vegetation class, which constituted a significant portion of the area in 2015 (52.26%) and 2017 (55.07%), dramatically decreased to just 5.75% by 2024. In contrast, sparse vegetation, which covered approximately 41.81% of the study area in 2015, showed a minimal change in 2017 (40.16%), followed by a slight increase to 44.50% in 2020, before declining to 37.26% in 2024. Low vegetation cover began at 5.51% in 2015 and experienced a decline in 2017, but experienced a significant increase to around 35% in 2020, stabilizing at 35.73% by 2024. The moderate vegetation category was minimal in 2015 (0.40%) and 2017 (0.11%) but increased dramatically to 10.11% in 2020 and further expanded to 17.73% by 2024. Meanwhile, dense vegetation, which was nearly negligible in 2015 and 2017, increased to 0.83% in 2020 and reached 3.53% by 2024. The transformation in vegetation cover, as depicted in the NDVI maps (Figure 7), clearly illustrates a trend of vegetation recovery and densification over time. This positive trend correlates with the observed improvements in precipitation and a reduction in drought episodes throughout the study period, indicating a favorable shift in the ecological landscape. The observed trend in sparse vegetation indicates a transition towards more robust vegetation types in recent years. Figure 8 illustrates the correlation between the NDVI and elevation across the study area, revealing a statistically significant positive relationship. NDVI values increase with elevation, with a coefficient of determination (R2) of 0.23 and a p-value < 0.001, indicating a moderate but meaningful trend at the 95% confidence level.
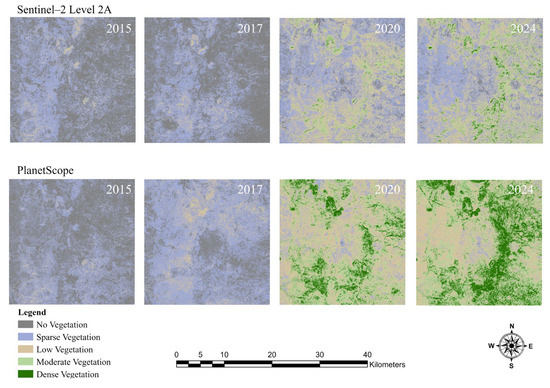
Figure 7.
Vegetation cover classes from 2015 to 2024 derived from Sentinel–2 Level 2A and PlanetScope data.
Table 4.
Area statistics of vegetation cover classes derived from Sentinel–2 Level 2A.
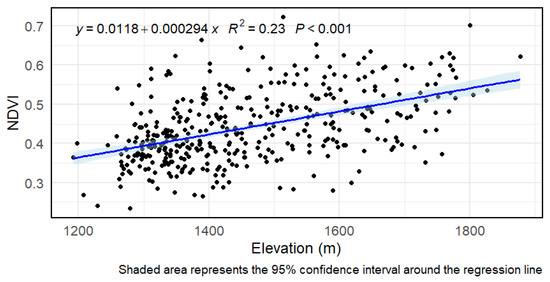
Figure 8.
Correlation between the NDVI and elevation. The black dots represent observed points, while the light blue shaded area represents the 95% confidence interval around the regression line.
3.4.3. IDPs and Vegetation Cover Change
Results from the two buffer zones’ analysis (Figure 9 and Table 5) show the percentage and actual area for different classification categories in both the 0–5 km and 5–10 km buffers between 2015 and 2024. The 0–5 km zone saw a 40.38% decrease in the no vegetation class, while sparse, low, moderate, and dense vegetation increased by 2.88%, 25%, 9%, and 2.88%, respectively. In contrast, the 5–10 km buffer experienced a 44.25% decrease in non-vegetated areas and a 7.14% reduction in sparse vegetation, with notable increases in low (29.96%), moderate (17.86%), and dense vegetation (3.57%). This pattern suggests that the area farther from the camp has seen more significant vegetation recovery, potentially due to lower human pressure.
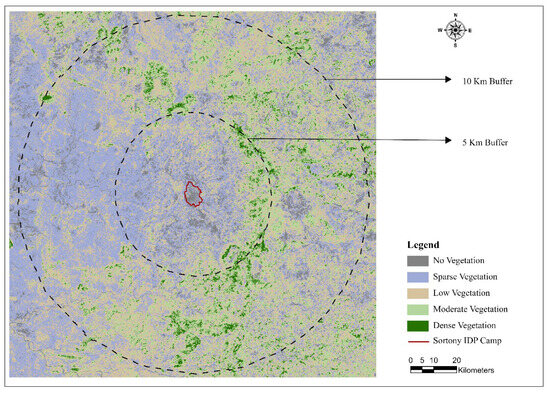
Figure 9.
Buffer zones of 0–5 km and 5–10 km from the Sortony IDP camp.
Table 5.
Vegetation cover classification within the two-buffer zone.
3.4.4. Vegetation Transition
A Sankey plot (Figure 10) effectively illustrates the relative changes in vegetation dynamics within the study area in 2015, 2017, 2020, and 2024. This visualization highlights the transitions among various vegetation classes, showing their evolution over time. The analysis of vegetation dynamics surrounding the Sortony IDP camp indicated a significant ecological transformation. Notably, there was a marked shift from barren and sparsely vegetated areas towards regions exhibiting low to moderate vegetation density, suggesting an overall improvement in vegetation health and density.
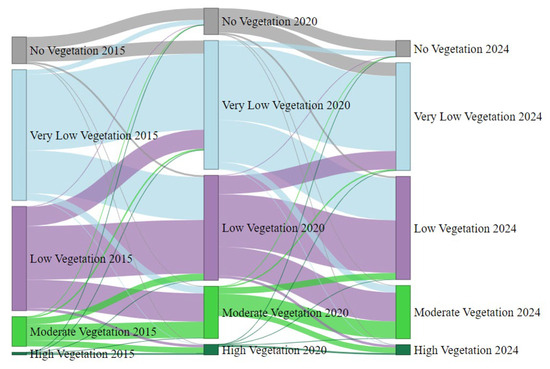
Figure 10.
The Sankey plot shows the vegetation transitions between 2015, 2020, and 2024 in the study area.
4. Discussion
4.1. Vegetation Dynamics and Climate Variability
The present study utilized high-resolution multispectral Sentinel–2 Level 2A and PlanetScope imagery with a 10 m and 3 m spatial resolution, respectively, to assess vegetation cover changes around the Sortony IDP camp in North Darfur, Sudan. The study findings highlight the complex interplay between climate variability, particularly rainfall, drought, temperature fluctuations from 1980 to 2024, and vegetation dynamics from 2015 to 2024. The observed increase in vegetation cover from 2016 onwards exhibited an increased trend, coinciding with increased precipitation levels and a reduction in drought intensity. The elevation map (Figure 2) and the NDVI–elevation correlation plot (Figure 8) demonstrate a clear positive association between NDVI values and elevation. This indicates that higher elevation zones generally support denser or healthier vegetation, likely due to better moisture retention, reduced surface runoff, and lower anthropogenic pressure. These findings are consistent with previous studies that reported similar elevation-driven vegetation patterns in semi-arid environments [68,69]. The maximum, minimum, and mean temperature trends, though fluctuating, exhibited an overall increase. The post-2012 shift in precipitation is now explicitly connected to vegetation recovery trajectories observed through NDVI analyses. The growth in vegetation cover during the reduced drought period (2016–2024) underscores the region’s potential for ecological recovery under favorable climatic conditions.
Future climate scenario analyses using the ARIMA and ETS models indicate continued precipitation increase, suggesting further vegetation recovery and enhanced environmental sustainability. However, variability in projected rainfall highlights the need for adaptive water resource management and climate-sensitive land-use planning to mitigate risks associated with extreme climatic fluctuations.
The observed vegetation recovery aligns with the increased rainfall trends, corroborating previous studies that emphasize the role of interdecadal precipitation variations in promoting ecosystem regeneration. Ref. [70] noted that variations in rainfall distribution were reflected in NDVI-based assessments of vegetation health within agricultural zones. Similarly, Ref. [71] reported that higher precipitation levels in arid and semi-arid regions significantly enhance vegetation regrowth. The expansion of low-density vegetation might reflect natural regeneration and conservation efforts, whereas the notable increase in moderate and dense vegetation suggests positive ecological changes (Figure 6). This is further supported by the resilience of dominant tree species in the area, such as Eucalyptus spp., Anogeissus leiocarpus, and Balanites aegyptiaca, which are capable of resprouting after disturbances such as wood cutting, heavy grazing, or fire [29]. The vegetation recovery observed post-2015 is largely attributed to resilient tree species.
Temperature variations in the study area align with the findings from [72], who highlighted that elevated temperatures in semi-arid climates often lead to increased evaporation rates, thus limiting vegetation recovery. However, in this study, improved rainfall appears to have mitigated the adverse effects of rising temperatures, fostering a positive trajectory in vegetation cover. These results align with the studies of [73] in Central Chile and [74] in the Yellow River Basin, both of which identified precipitation as a key determinant of NDVI trends and vegetation regrowth, further reinforcing the intricate relationship between climatic variability and ecosystem resilience.
The transition from prolonged droughts (2000–2014) to increased wet periods (2015–2024) (Figure 5) is likely a broader manifestation of the shifting climate patterns. Although enhanced precipitation has benefited vegetation recovery, abrupt increases in wet events could disrupt ecosystem stability if not managed effectively. This highlights the need for adaptive environmental strategies to sustain positive ecological changes while mitigating the potential risks associated with climate variability. Previous studies in Sudan and the Sudano-Sahelian region have similarly documented vegetation recovery alongside a decline in barren land, which is primarily attributed to increased precipitation [75,76]. Ref. [77] further observed that increased precipitation not only improved vegetation greenness but also contributed to enhanced water cycles, including improved runoff and water storage, which facilitated long-term vegetation regeneration.
4.2. The Impact of IDPs’ Presence on the Environment
The role of human displacement in shaping vegetation dynamics was a critical factor in this study. Previous research has shown that an influx of IDP populations often leads to initial environmental degradation due to increased demand for fuelwood, agricultural expansion, and settlement construction [78]. Similar trends have been observed in other IDP settings, where rapid population growth exerts pressure on natural resources, leading to localized deforestation and land degradation [79,80]. The spatial analysis supports findings from previous studies, indicating that human displacement can initially result in severe vegetation loss due to resource overuse [81,82]. However, post-settlement phases may also involve natural regeneration, changes in land-use practices, and adaptive reforestation. The results from the 5–10 km buffer zone indicate improved vegetation density in less human-impacted areas, aligning with documented patterns in other IDP zones [25]. However, the findings of this study suggest that vegetation cover has increased over time, which may be attributed to several factors, including improved precipitation, shifts in land-use practices, and the natural regeneration of resilient species. Ref. [83] documented similar trends, noting that IDPs often engaged in community-led land restoration efforts to rebuild their livelihoods. Additionally, sustainable land management initiatives, such as reforestation programs and agroforestry, have emerged as adaptive strategies to mitigate deforestation caused by high fuelwood demand [84]. Many IDP communities in Darfur have incorporated tree planting along with drought-resistant crop cultivation, improving soil fertility and water retention, which has contributed to the observed vegetation regrowth [85]. Ref. [86] also reported similar land cover transitions in IDP camps, where barren land gradually transitioned into vegetated areas owing to environmental restoration efforts.
Comparative analyses with other conflict-affected semi-arid regions, such as the Sahel, northern Nigeria, and parts of the Horn of Africa, further support these findings. For example, studies in the Sahel have documented the “Greening of the Sahel” phenomenon, where increased precipitation has facilitated vegetation recovery in areas affected by displacement, despite localized degradation due to human activities [87]. Similarly, research in northern Nigeria showed that IDP-led agroforestry and reforestation efforts, coupled with improved rainfall conditions, have contributed to gradual vegetation recovery [88].
Additionally, studies in Somalia and South Sudan, regions experiencing prolonged conflicts and climate stress, indicate that while IDP settlements initially accelerate land degradation, they can later contribute to land rehabilitation through afforestation programs and sustainable land-use practices [40,89]. These findings align with our study, reinforcing the notion that conflict-induced displacement has both short-term negative impacts and potential long-term ecological benefits when coupled with climate improvement and adaptive land management.
4.3. Policy Implications
While the findings indicate a positive trend in vegetation recovery, the risk of future degradation remains a concern, particularly if the conflict intensifies. Studies in conflict-prone regions have shown that vegetation recovery can be temporary, as renewed displacement, resource exploitation, and land-use pressure often lead to cycles of deforestation and degradation [90]. In Darfur, increased reliance on fuelwood, overgrazing livestock, and settlement expansion could reverse ecological gains if conflicts disrupt sustainable land management efforts. Proactive policy interventions are required to mitigate these risks.
Encouraging IDP and host communities to engage in reforestation initiatives can help maintain vegetation cover while providing alternative livelihoods. Participatory land management has been shown to foster environmental resilience in conflict-affected regions. Reducing deforestation in IDP settings requires investment in alternative energy sources such as solar panels, solar boilers, solar cookstoves, and fuel-efficient technologies. Establishing buffer zones around IDP settlements and promoting controlled grazing can prevent excessive land degradation. Integrating conflict-sensitive environmental policies with humanitarian responses is crucial for long-term sustainability [7]. Supporting drought-resistant crops and implementing soil conservation techniques can enhance food security while reducing dependence on forest resources.
Water Resources and Precipitation Variability Management
Rainwater harvesting and micro-catchment systems to store seasonal rainfall and reduce runoff in high-rainfall years are particularly relevant for supporting dry-season fodder and reforested plots.
Soil and water conservation techniques, such as contour bunds and mulching, can be used to improve soil infiltration and reduce evapotranspiration losses in agricultural and reforestation zones.
Climate-smart water planning may be done at the camp and community level, including early warning systems for drought or above-average rainfall, and seasonal rainfall forecasts can be integrated into land-use planning.
Community-based water governance structures can be established to equitably manage shared water resources under conditions of variable precipitation, especially where both host communities and IDPs rely on the same water sources. These measures complement the reforestation and land management strategies already proposed, providing a more climate-resilient policy framework.
4.4. Study Limitations and Future Research Directions
While this study provides valuable insights into vegetation recovery, it has several limitations:
Remote Sensing Constraints: NDVI-based classification is effective for vegetation analysis but does not fully capture species-level vegetation composition or ground-level ecological processes. Future research should incorporate ground-truth surveys and high-resolution hyperspectral imagery to improve the accuracy.
Limited Field-Based Human Activity Data: The study infers human impacts (fuelwood collection, agriculture, and grazing) from remote sensing trends, but direct field observations and socioeconomic surveys are needed to provide a more detailed understanding of human–environment interactions in IDP-affected areas. The lack of high-frequency land-use data and ground verification limits definitive attribution. Future research should incorporate household-level surveys and high-resolution socioeconomic data.
Narrow Climate Variable Focus: While this study focuses on precipitation and temperature trends, other critical environmental variables, such as soil moisture dynamics, groundwater availability, and land management practices, may also play a significant role in influencing vegetation recovery. To provide a more holistic understanding of ecosystem responses, future research should incorporate multi-dimensional climate assessments. Furthermore, comparative analyses between the study area and adjacent zones with similar climatic conditions but differing population densities are recommended to better isolate and evaluate the influence of human activities on vegetation dynamics.
5. Conclusions
Vegetation recovery in conflict-affected areas is a critical indicator of environmental resilience and ecological stability. IDP camps, such as the Sortony IDP camp in Sudan, present both challenges and opportunities for sustainable land management, intensifying pressure on natural resources while fostering ecological interventions. This study examined vegetation dynamics around the Sortony IDP camp from 2015 to 2024, analyzing land cover transformations and the environmental drivers of these changes. The findings revealed a significant increase in vegetation cover, with barren land decreasing from over 50% in 2015–2017 to just 5.75% by 2024. Concurrently, areas with low, moderate, and dense vegetation expanded, suggesting a positive ecological shift. This recovery aligns with increasing precipitation levels and a decline in drought frequency since 2015, as confirmed by SPEI analysis. In addition to climatic influences, natural regeneration processes, shifting land-use practices, and potential ecological restoration efforts also contribute to vegetation recovery. These findings underscore the complex interplay between climate variability, human displacement, and ecological resilience in arid and semi-arid regions. This study highlights the value of satellite-based remote sensing tools, particularly the NDVI, for monitoring ecological changes in fragile landscapes such as Darfur. The results demonstrate the potential for vegetation recovery even in conflict-affected regions, emphasizing the need for sustainable land management and climate adaptation strategies to enhance environmental resilience and mitigate future land degradation risks.
Author Contributions
Conceptualization, A.A.; Methodology, A.A. and B.G.; Software, A.A.; Validation, A.A.; Formal analysis, A.A.; Resources, K.C.; Writing—original draft, A.A.; Writing—review & editing, A.A., B.R., H.K.K., A.S.L., B.G. and K.C.; Visualization, A.A.; Supervision, K.C. All authors have read and agreed to the published version of the manuscript.
Funding
This research received funds from “the project TKP2021-NVA-13 which has been implemented with the support provided by the Ministry of Culture and Innovation of Hungary from the National Research, Development and Innovation Fund, financed under the TKP2021-NVA funding scheme”.
Data Availability Statement
The raw data supporting the conclusions of this article will be made available by the authors on request.
Conflicts of Interest
The authors declare no conflict of interest.
References
- Deafalla, T.H.H.; Csaplovics, E. Tree Species Classification of the Conflict Regions of Sudan Using RapidEye Satellite Imagery. In The Climate-Conflict-Displacement Nexus from a Human Security Perspective; Springer: Berlin/Heidelberg, Germany, 2022; pp. 293–320. [Google Scholar] [CrossRef]
- Sunga, L.S. Does Climate Change Kill People in Darfur? J. Hum. Rights Environ. 2011, 2, 64–85. [Google Scholar] [CrossRef]
- Hakim, S. The Role of Climate Change in the Darfur Crisis. In The Economic, Social and Political Elements of Climate Change; Climate Change Management; Springer: Berlin/Heidelberg, Germany, 2011; pp. 815–823. [Google Scholar] [CrossRef]
- Waal, A.D.E. Darfur and the Failure of the Responsibility to Protect. Int. Aff. 2007, 6, 1039–1054. [Google Scholar] [CrossRef]
- OCHA Sudan. OCHA: The Sudan Humanitarian Fund. Available online: https://www.unocha.org/sudan (accessed on 17 November 2024).
- OCHA. Sudan Humanitarian Update (29 July 2024) [EN/AR]|OCHA. Available online: https://www.unocha.org/publications/report/sudan/sudan-humanitarian-update-29-july-2024 (accessed on 17 November 2024).
- Hagenlocher, M.; Lang, S.; Tiede, D. Integrated Assessment of the Environmental Impact of an IDP Camp in Sudan Based on Very High Resolution Multi-Temporal Satellite Imagery. Remote Sens. Environ. 2012, 126, 27–38. [Google Scholar] [CrossRef]
- Jensen, D. Evaluating the Impact of UNEP’s Post-Conflict Environmental Assessments. In Assessing and Restoring Natural Resources in Post-Conflict Peacebuilding; Taylor & Francis: London, UK, 2013; pp. 31–76. [Google Scholar] [CrossRef]
- Abuawad, M.; Di Raimo, A. Building Better Lives for Refugees: A Call for Sustainable Urban Camps (Comparative Study on Al Azraq and Kutupalong Refugee Camps). In Advances in Science, Technology and Innovation; Springer: Berlin/Heidelberg, Germany, 2025; pp. 59–75. [Google Scholar] [CrossRef]
- Lingcheng, L.; She, D.; Zheng, H.; Lin, P.; Yang, Z.-L. Elucidating Diverse Drought Characteristics from Two Meteorological Drought Indices (SPI and SPEI) in China. J. Hydrometeorol. 2020, 21, 1513–1530. [Google Scholar] [CrossRef]
- Mishra, A.; Hydrology, V.S. A Review of Drought Concepts. J. Hydrol. 2010, 391, 202–216. [Google Scholar] [CrossRef]
- McKee, T.; Doesken, N.; Kleist, J. The Relationship of Drought Frequency and Duration to Time Scales. In Proceedings of the 8th Conference on Applied Climatology, Anaheim, CA, USA, 17–22 January 1993; pp. 17–22. [Google Scholar]
- Vicente-Serrano, S.M.; Beguería, S.; López-Moreno, J.I. A Multiscalar Drought Index Sensitive to Global Warming: The Standardized Precipitation Evapotranspiration Index. J. Clim. 2010, 23, 1696–1718. [Google Scholar] [CrossRef]
- Vicente-Serrano, S.M.; Lopez-Moreno, J.I.; Beguería, S.; Lorenzo-Lacruz, J.; Sanchez-Lorenzo, A.; García-Ruiz, J.M.; Azorin-Molina, C.; Morán-Tejeda, E.; Revuelto, J.; Trigo, R.; et al. Evidence of Increasing Drought Severity Caused by Temperature Rise in Southern Europe. Environ. Res. Lett. 2014, 9, 044001. [Google Scholar] [CrossRef]
- Wang, W.; Zhu, Y.; Xu, R.; Liu, J. Drought Severity Change in China during 1961–2012 Indicated by SPI and SPEI. Nat. Hazards 2015, 75, 2437–2451. [Google Scholar] [CrossRef]
- ADB (Asian Development Bank). The Economics of Climate Change in Southeast Asia: A Regional Review; ADB: Jakarta, Indonesia, 2009; Available online: http://www.Adb.Org/Publications/Economics-Climate-Change-Southeast-Asia-Regional-Review (accessed on 15 March 2025).
- Zhang, B.; Zhang, L.; Guo, H.; Leinenkugel, P.; Zhou, Y.; Li, L.; Shen, Q. Drought Impact on Vegetation Productivity in the Lower Mekong Basin. Int. J. Remote Sens. 2014, 35, 2835–2856. [Google Scholar] [CrossRef]
- Xiangyi, L.; Piao, S.; Huntingford, C.; Peñuelas, J.; Yang, H.; Xu, H.; Chen, A.; Friedlingstein, P.; Keenan, T.F.; Sitch, S.; et al. Global Variations in Critical Drought Thresholds That Impact Vegetation. Natl. Sci. Rev. 2023, 10, nwad049. [Google Scholar] [CrossRef]
- Yang, Y.; Dai, E.; Yin, J.; Jia, L.; Zhang, P.; Sun, J. Spatial and Temporal Evolution Patterns of Droughts in China over the Past 61 Years Based on the Standardized Precipitation Evapotranspiration Index. Water 2024, 16, 1012. [Google Scholar] [CrossRef]
- Cao, S.; He, Y.; Zhang, L.; Chen, Y.; Yang, W.; Indicators, S.Y.-E. Spatiotemporal Characteristics of Drought and Its Impact on Vegetation in the Vegetation Region of Northwest China; Elsevier: Amsterdam, The Netherlands, 2021. [Google Scholar]
- Trenberth, K.E.; Dai, A.; Van Der Schrier, G.; Jones, P.D.; Barichivich, J.; Briffa, K.R.; Sheffield, J. Global Warming and Changes in Drought. Nat. Clim. Change 2014, 4, 17–22. [Google Scholar] [CrossRef]
- Singh Bisht, D.; Sridhar, V.; Mishra, A.; Chatterjee, C.; Raghuwanshi, N.S. Drought Characterization over India under Projected Climate Scenario. Int. J. Climatol. 2019, 39, 1889–1911. [Google Scholar] [CrossRef]
- Akasha, M. Darfur: A Tragedy of Climate Change; Anchor Academic Publishing: Hamburg, Germany, 2013. [Google Scholar]
- Onyango, D.O. Climate Change and Conflict: A Case Study of Darfur Conflict. Ph.D. Thesis, University of Nairobi, Nairobi, Kenya, 2013. [Google Scholar]
- Rajab, E. Institutions, Utilisation and Conservation of Indigenous Woody Plants in Pader Internally Displaced Persons’(Idp) Camps, Northern Uganda. Ph.D. Dissertation, Makerere University, Kampala, Uganda, 2014. [Google Scholar]
- Beldados, A.; Manzo, A.; Murphy, C.; Stevens, C.J.; Fuller, D.Q. Evidence of Sorghum Cultivation and Possible Pearl Millet in the Second Millennium BC at Kassala, Eastern Sudan. In Plants and People in the African Past: Progress in African Archaeobotany; Springer: Berlin/Heidelberg, Germany, 2018; pp. 503–528. [Google Scholar] [CrossRef]
- OCHA Taking Root: The Cash Crop Trade in Darfur—Sudan|ReliefWeb. Available online: https://reliefweb.int/report/sudan/taking-root-cash-crop-trade-darfur (accessed on 16 November 2024).
- UNEP Taking Root: The Cash Crop Trade in Darfur|UNEP—UN Environment Programme. Available online: https://www.unep.org/resources/report/taking-root-cash-crop-trade-darfur (accessed on 16 November 2024).
- Hegazy, A.K.; Hosni, H.A.; Kabiel, H.F.; Badawi, E.S.M.; Emam, M.H.; Lovett-Doust, L. Population Ecology of Some Keystone Tree Species in the Jebel Marra Region of Darfur. Rend. Lincei 2018, 29, 659–673. [Google Scholar] [CrossRef]
- Hegazy, A.K.; Kabiel, H.F.; Hosni, H.A.; Badawi, E.S.M.; Lovett-Doust, L. Spatial and Temporal Variation in Plant Community Phenology in the Jebel Marra Region of Darfur. Folia Geobot 2018, 53, 389–403. [Google Scholar] [CrossRef]
- Kranz, O.; Sachs, A.; Lang, S. Assessment of Environmental Changes Induced by Internally Displaced Person (IDP) Camps in the Darfur Region, Sudan, Based on Multitemporal MODIS Data. Int. J. Remote Sens. 2015, 36, 190–210. [Google Scholar] [CrossRef]
- Spröhnle, K.; Kranz, O.; Schoepfer, E.; Moeller, M.; Voigt, S. Click for Updates Geocarto International Earth Observation-Based Multi-Scale Impact Assessment of Internally Displaced Person (IDP) Camps on Wood Resources in Zalingei, Darfur. Geocarto Int. 2015, 31, 575–595. [Google Scholar] [CrossRef]
- Olaf, K.; Gunter, Z.; Dirk, T.; Stephen, C.; Denis, B.; Thomas, K.; Stefan, L.; Mathidlde, C. Monitoring Refugee IDP Camps to Support International Relief Action. 2016. Available online: https://www.researchgate.net/profile/Dirk-Tiede/publication/225006357_Monitoring_RefugeeIDP_camps_to_Support_International_Relief_Action/links/0fcfd508a813270ed8000000/Monitoring-Refugee-IDP-camps-to-Support-International-Relief-Action.pdf (accessed on 5 July 2025).
- Jakata, C. Mapping and Monitoring the Impacts of Climate Variabilities on Rangelands in North Darfur, Sudan. Master’s Thesis, University of the Witwatersrand, Johannesburg, South Africa, 2021. [Google Scholar]
- Ahmed, A.; Czimber, K. Spatiotemporal Dynamics of Vegetation Cover and Drought Conditions in West Darfur, Sudan: Implications of Climate Variability and Future Projections. Geo 2025, 12, e70016. [Google Scholar] [CrossRef]
- DTM Sudan Displacement Tracking Matrix|DTM Sudan DTM Sudan Situation Assessment Report Internally Displaced Persons Casualties and Losses. 2021. Available online: https://reliefweb.int/report/sudan/iom-sudan-displacement-tracking-matrix-dtm-sudan-mobility-update-18-publication-date-jun-05-2025 (accessed on 6 July 2025).
- OCHA Sudan Sortony (North Darfur) Flash Update. 2021. Available online: https://reliefweb.int/report/sudan/sudan-sortony-north-darfur-flash-update-no-01-4-august-2021-enar (accessed on 6 July 2025).
- MSF Sudan: Conditions in Sortoni Camp, North Darfur Leave 61,000 Residents Who Fled Jebel Mara in Danger|MSF. Available online: https://www.msf.org/sudan-conditions-sortoni-camp-north-darfur-leave-61000-residents-who-fled-jebel-mara-danger (accessed on 13 November 2024).
- Alamin, N.K.N.; Idris, A.A.A.; Khugali, G.E.A.; Kalcon, G.O.A.; Khaleel, M.S.S.; Alamin, K.N. Science in Times of War: Reflections from Sudan. ASFI Res. J. 2024, 1, 14296. [Google Scholar] [CrossRef]
- Saeed, E.; Mohamed, E. Environmental Change, Conflicts and Internal Displacement as Destabilizing Factors to Food Security in Sudan: Econometric Analysis. J. Intern. Displac. 2020, 10, 2–24. [Google Scholar]
- Recuero, L.; Litago, J.; Pinzón, J.E.; Huesca, M.; Moyano, M.C.; Palacios-Orueta, A. Mapping Periodic Patterns of Global Vegetation Based on Spectral Analysis of NDVI Time Series. Remote Sens. 2019, 11, 2497. [Google Scholar] [CrossRef]
- Martínez, B.; Gilabert, M.A. Vegetation Dynamics from NDVI Time Series Analysis Using the Wavelet Transform. Remote Sens. Environ. 2009, 113, 1823–1842. [Google Scholar] [CrossRef]
- Liu, Z.; Chen, Y.; Chen, C. Analysis of the Spatiotemporal Characteristics and Influencing Factors of the NDVI Based on the GEE Cloud Platform and Landsat Images. Remote Sens. 2023, 15, 4980. [Google Scholar] [CrossRef]
- Funk, C.; Peterson, P.; Landsfeld, M.; Pedreros, D.; Verdin, J.; Shukla, S.; Husak, G.; Rowland, J.; Harrison, L.; Hoell, A.; et al. The Climate Hazards Infrared Precipitation with Stations—A New Environmental Record for Monitoring Extremes. Sci. Data 2015, 2, 150066. [Google Scholar] [CrossRef] [PubMed]
- Rienecker, M.; Suarez, M.; Todling, R.; Bacmeister, J. The GEOS-5 Data Assimilation System-Documentation of Versions 5.0.1, 5.1.0, and 5.2.0; NASA: Washington, DC, USA, 2008. [Google Scholar]
- Westberg, D.J.; Stackhouse, P.W., Jr.; Hoell, J.M.; Chandler, W.S. An Analysis of NASA’s MERRA Meteorological Data to Supplement Observational Data for Calculation of Climatic Design Conditions. ASHRAE Trans. 2013, 119, 210. [Google Scholar]
- Tittensor, D.P.; Walpole, M.; Hill, S.L.L.; Boyce, D.G.; Britten, G.L.; Burgess, N.D.; Butchart, H.M.; Leadley, P.W.; Regan, E.C.; Alkemade, R.; et al. A Mid-Term Analysis of Progress Toward International Biodiversity Targets. Science 2014, 346, 241–244. [Google Scholar] [CrossRef]
- Mirdarsoltany, A.; Dariane, A.B.; Borhan, M.I. Comprehensive GIS-Driven Evaluation of Drought Severity and Duration: Comparative Assessment of Parametric and Non-Parametric SPI Methodologies. Theor. Appl. Climatol. 2025, 156, 225. [Google Scholar] [CrossRef]
- Calim Costa, M.; Marengo, J.A.; Alves, L.M.; Cunha, A.P. Multiscale Analysis of Drought, Heatwaves, and Compound Events in the Brazilian Pantanal in 2019–2021. Theor. Appl. Climatol. 2024, 155, 661–677. [Google Scholar] [CrossRef]
- Mohiuddin, G.; Mund, J.P. Spatiotemporal Analysis of Land Surface Temperature in Response to Land Use and Land Cover Changes: A Remote Sensing Approach. Remote Sens. 2024, 16, 1286. [Google Scholar] [CrossRef]
- Tiwari, A.K.; Kanchan, R. Analytical Study on the Relationship among Land Surface Temperature, Land Use/Land Cover and Spectral Indices Using Geospatial Techniques. Discov. Environ. 2024, 2, 1. [Google Scholar] [CrossRef]
- Aka, K.S.R.; Akpavi, S.; Dibi, N.H.; Kabo-Bah, A.T.; Gyilbag, A.; Boamah, E. Toward Understanding Land Use Land Cover Changes and Their Effects on Land Surface Temperature in Yam Production Area, Côte d’Ivoire, Gontougo Region, Using Remote Sensing and Machine Learning Tools (Google Earth Engine). Front. Remote Sens. 2023, 4, 1221757. [Google Scholar] [CrossRef]
- Nogovitcyn, A.; Shakhmatov, R.; Morozumi, T.; Tei, S.; Miyamoto, Y.; Shin, N.; Maximov, T.C.; Sugimoto, A. Historical Variation in the Normalized Difference Vegetation Index Compared with Soil Moisture in a Taiga Forest Ecosystem in Northeastern Siberia. Biogeosciences 2023, 20, 3185–3201. [Google Scholar] [CrossRef]
- Al-Doski, J.; Mansor, S.B.; Shafri, H.Z.M. NDVI Differencing and Post-Classification to Detect Vegetation Changes in Halabja City, Iraq. IOSR J. Appl. Geol. Geophys. 2013, 1, 1–10. [Google Scholar] [CrossRef]
- Lixia, W.; Yu, D.; Liu, Z.; Yang, Y.; Zhang, J.; Han, J.; Mao, Z. Study on NDVI Changes in Weihe Watershed Based on CA–Markov Model. Geol. J. 2018, 53, 435–441. [Google Scholar] [CrossRef]
- Hossain, M.D.; Chen, D. ISPRS Journal of Photogrammetry and Remote Sensing Segmentation for Object-Based Image Analysis (OBIA): A Review of Algorithms and Challenges from Remote Sensing Perspective. ISPRS J. Photogramm. Remote Sens. 2019, 150, 115–134. [Google Scholar] [CrossRef]
- Congalton, R.; Green, K. Assessing the Accuracy of Remotely Sensed Data Principles and Practices, 3rd ed.; CRC Press: Boca Raton, FL, USA, 2009. [Google Scholar]
- Li, C.; Ma, Z.; Wang, L.; Yu, W.; Tan, D.; Gao, B.; Feng, Q.; Guo, H.; Zhao, Y. Improving the Accuracy of Land Cover Mapping by Distributing Training Samples. Remote Sens. 2021, 13, 4594. [Google Scholar] [CrossRef]
- Zhao, W.; Lyu, R.; Zhang, J.; Pang, J.; Zhang, J. A Fast Hybrid Approach for Continuous Land Cover Change Monitoring and Semantic Segmentation Using Satellite Time Series. Int. J. Appl. Earth Obs. Geoinf. 2024, 134, 104222. [Google Scholar] [CrossRef]
- Lameck, A.S.; Rotich, B.; Ahmed, A.; Kipkulei, H.K.; Akos, P.; Boros, E. Influence of Environmental Variables and Anthropogenic Activities on Soda-Saline Lakes Chemistry in Northern Tanzania: A Remote Sensing and GIS Approach. Heliyon 2025, 11, e41691. [Google Scholar] [CrossRef]
- Wafdan, L. Accuracy Assessment of Land Use/Land Cover Classification Data from Sentinel-2 & ASTER Imagery Interpretation Using Unsupervised Classification Algorithm. Proceeding Int. Conf. Sci. Eng. 2021, 4, 229–234. [Google Scholar]
- Murat, M.; Malinowska, I.; Gos, M.; Krzyszczak, J. Forecasting Daily Meteorological Time Series Using ARIMA and Regression Models. Int. Agrophys. 2018, 32, 253–264. [Google Scholar] [CrossRef]
- Box, G.E.P.; Jenkins, G.M.; Reinsel, G.C.; Ljung, G.M. Time Series Analysis: Forecasting and Control; John Wiley & Sons: Hoboken, NJ, USA, 2016. [Google Scholar]
- Harvey, A.C. Forecasting, Structural Time Series Models and the Kalman Filter; Cambridge University Press: Cambridge, UK, 1994; p. 554. [Google Scholar]
- Hyndman, R.; Koehler, A.; Ord, K.; Snyder, R. Forecasting with Exponential Smoothing: The State Space Approach; Springer: Berlin/Heidelberg, Germany, 2008. [Google Scholar]
- Agaj, T.; Budka, A.; Janicka, E.; Bytyqi, V. Using ARIMA and ETS Models for Forecasting Water Level Changes for Sustainable Environmental Management. Sci. Rep. 2024, 14, 22444. [Google Scholar] [CrossRef] [PubMed]
- Jain, G.; Mallick, B. A Study of Time Series Models ARIMA and ETS. 2017. Available online: https://ssrn.com/abstract=2898968 (accessed on 6 July 2025).
- Han, J.C.; Huang, Y.; Zhang, H.; Wu, X. Characterization of Elevation and Land Cover Dependent Trends of NDVI Variations in the Hexi Region, Northwest China. J. Environ. Manage 2019, 232, 1037–1048. [Google Scholar] [CrossRef] [PubMed]
- Ahmed, A.; Rotich, B.; Czimber, K. Climate Change as a Double-Edged Sword: Exploring the Potential of Environmental Recovery to Foster Stability in Darfur, Sudan. Climate 2025, 13, 63. [Google Scholar] [CrossRef]
- Mbuqwa, P.; Magagula, H.B.; Kalumba, A.M.; Afuye, G.A. Interdecadal Variations in Agricultural Drought Monitoring Using Land Surface Temperature and Vegetation Indices: A Case of the Amahlathi Local Municipality in South Africa. Sustainability 2024, 16, 8125. [Google Scholar] [CrossRef]
- Keria, H.; Bensaci, E.; Zoubiri, A. Assessment of the Long-Term Effects of Climate on Vegetation in 25 Watersheds in Dry and Semi-Dry Areas, Algeria. Nat. Hazards 2024, 120, 7575–7596. [Google Scholar] [CrossRef]
- Mwabumba, M.; Yadav, B.K.; Rwiza, M.J.; Larbi, I.; Dotse, S.Q.; Limantol, A.M.; Sarpong, S.; Kwawuvi, D. Rainfall and Temperature Changes under Different Climate Scenarios at the Watersheds Surrounding the Ngorongoro Conservation Area in Tanzania. Environ. Chall. 2022, 7, 100446. [Google Scholar] [CrossRef]
- Vega Briones, J.; De Jong, S.; Nijland, W.; Wanders, N. Surface and Groundwater Drought Impact on Natural Vegetation Growth and Drought Recovery. In Proceedings of the EGUGA, Vienna, Austria, 14–19 April 2024; p. 12189. [Google Scholar] [CrossRef]
- Wei, Q.; Peinan, C.; Pufang, Z.; Xingyou, T.; Jiuyuan, L.; Wei, Q.; Peinan, C.; Pufang, Z.; Xingyou, T.; Jiuyuan, L. Spatiotemporal Changes of GWS Changes and Their Sustainability in the Upper Reaches of the Yellow River Basin from 2002 to 2022 Revealed by GRACE/GRACE-FO Observations. Geomat. Inf. Sci. Wuhan Univ. 2024, 49, 1287–1299. [Google Scholar] [CrossRef]
- Yagoub, Y.E.; Li, Z.; Musa, O.S.; Anjum, M.N.; Wang, F.; Xu, C.; Bo, Z. Investigation of Vegetation Cover Change in Sudan by Using Modis Data. J. Geogr. Inf. Syst. 2017, 9, 279–292. [Google Scholar] [CrossRef]
- Zeng, Y.; Jia, L.; Menenti, M.; Jiang, M.; Barnieh, B.A.; Bennour, A.; Lv, Y. Changes in Vegetation Greenness Related to Climatic and Non-Climatic Factors in the Sudano-Sahelian Region. Reg. Environ. Change 2023, 23, 92. [Google Scholar] [CrossRef]
- Xu, C.; Zhang, Z.; Fu, Z.; Xiong, S.; Chen, H.; Zhang, W.; Wang, S.; Zhang, D.; Lu, H.; Jiang, X. Impacts of Climatic Fluctuations and Vegetation Greening on Regional Hydrological Processes: A Case Study in the Xiaoxinganling Mountains–Sanjiang Plain Region, Northeastern China. Remote Sens. 2024, 16, 2709. [Google Scholar] [CrossRef]
- Ahmed, A.; Rotich, B.; Czimber, K. Assessment of the Environmental Impacts of Conflict-Driven Internally Displaced Persons: A Sentinel-2 Satellite Based Analysis of Land Use/Cover Changes in the Kas Locality, Darfur, Sudan. PLoS ONE 2024, 19, e0304034. [Google Scholar] [CrossRef]
- Lang, S.; Tiede, D.; Hölbling, D.; Füreder, P.; Zeil, P. Earth Observation (EO)-Based Ex Post Assessment of Internally Displaced Person (IDP) Camp Evolution and Population Dynamics in Zam Zam, Darfur. Int. J. Remote Sens. 2010, 31, 5709–5731. [Google Scholar] [CrossRef]
- Friedrich, H. Breaking Ground: Automating the Detection of Refugee Settlement Establishment and Growth through Landsat Time Series Analysis with a Case Study in Northern Uganda. Master’s Thesis, Oregon State University, Corvallis, OR, USA, 2019. [Google Scholar]
- Owen, J.R.; Kemp, D.; Lechner, A.M.; Ern, M.A.L.; Lèbre, É.; Mudd, G.M.; Macklin, M.G.; Saputra, M.R.U.; Witra, T.; Bebbington, A. Increasing Mine Waste Will Induce Land Cover Change That Results in Ecological Degradation and Human Displacement. J. Environ. Manage 2024, 351, 119691. [Google Scholar] [CrossRef] [PubMed]
- Wassie, S.B. Natural Resource Degradation Tendencies in Ethiopia: A Review. Environ. Syst. Res. 2020, 9, 33. [Google Scholar] [CrossRef]
- Omer, S.; Abdoun, M. Incentives for Reforestation and Forest’s Plantations Option, under the National Strategy of REDD+Program in Sudan. Adv. Ecol. Environ. Res. 2020, 5, 53–85. [Google Scholar]
- Funder, M.; Cold-Ravnkilde, S.M.; Ginsborg, I.P. Addressing Climate Change And Conflict in Development Cooperation Experiences from Natural Resource Management; Danish Institute for International Studies (DIIS): Copenhagen, Denmark, 2012. [Google Scholar]
- Fao Republic of Sudan Implementation of National Forest Monitoring System Action Plan. 2021. Available online: https://www.fao.org/fileadmin/user_upload/faoweb/Themes__pages/Forests/REDD-NFM/Sudan_MRV/Sudan_-_NFI_Report.pdf (accessed on 7 July 2025).
- Tenreiro, T.R.; García-Vila, M.; Gómez, J.A.; Jiménez-Berni, J.A.; Fereres, E. Using NDVI for the Assessment of Canopy Cover in Agricultural Crops within Modelling Research. Comput. Electron. Agric. 2021, 182, 106038. [Google Scholar] [CrossRef]
- Herrmann, S.M.; Brandt, M.; Rasmussen, K.; Fensholt, R. Accelerating Land Cover Change in West Africa over Four Decades as Population Pressure Increased. Commun. Earth Environ. 2020, 1, 53. [Google Scholar] [CrossRef]
- Annette, B.S. Environmental Changes in the Lake Chad Basin: A Case Study Analyzing Its Influence on Boko Haram’s Violent Activities in Northern Nigeria. Master’s Thesis, University of Oslo, Oslo, Norway, 2024. [Google Scholar]
- Moyo, M.M.; Blake, R. Pastoralist Conflict in Ethiopia from 2015 to 2022: Climate Change and Food Insecurity as Exacerbating Factors. Master’s Thesis, University of Pretoria, Pretoria, South Africa, 2024. [Google Scholar]
- Ilintsev, A.; Bogdanov, A.; Nakvasina, E.; Amosova, I.; Koptev, S.; Tretyakov, S. The Natural Recovery of Disturbed Soil, Plant Cover and Trees after Clear-Cutting in the Boreal Forests, Russia. IForest 2020, 13, 531. [Google Scholar] [CrossRef]
Disclaimer/Publisher’s Note: The statements, opinions and data contained in all publications are solely those of the individual author(s) and contributor(s) and not of MDPI and/or the editor(s). MDPI and/or the editor(s) disclaim responsibility for any injury to people or property resulting from any ideas, methods, instructions or products referred to in the content. |
© 2025 by the authors. Licensee MDPI, Basel, Switzerland. This article is an open access article distributed under the terms and conditions of the Creative Commons Attribution (CC BY) license (https://creativecommons.org/licenses/by/4.0/).