Article

Influence Mechanism, Simulation, and Prediction of Urban Expansion in Shaanxi Province, China

1
School of Public Administration, Xi’an University of Architecture and Technology, Xi’an 710055, China
2
Technology Innovation Center for Land Engineering and Human Settlements, Shaanxi Land Engineering Construction Group Co., Ltd., Xi’an Jiaotong University, Xi’an 712000, China
*
Author to whom correspondence should be addressed.
Land 2025, 14(8), 1637; https://doi.org/10.3390/land14081637
Submission received: 15 June 2025 / Revised: 25 July 2025 / Accepted: 11 August 2025 / Published: 13 August 2025
(This article belongs to the Special Issue Spatial-Temporal Evolution Analysis of Land Use)

Abstract

The purpose of this study is to analyze the temporal and spatial characteristics of urban expansion and its influencing factors in Shaanxi Province, China, as well as simulate future land use and predict the situation and development stage of urban expansion. An understanding of these factors is conducive to the coordinated development of the population, resources, and the economy; the optimization of the urban spatial layout; and the high-quality development of Shaanxi Province. Research methods: With IDRISI Selva17 and the expansion intensity index, the CA–Markov model was adopted to simulate and predict the land use type based on the land use data of Shaanxi Province from 2000 to 2020. The urban built-up areas in Shaanxi Province have been continuously expanding in the past 30 years, especially since 2010, when expansion slightly accelerated, and the expansion intensity changed, first rising and then falling. The Kappa index is as high as 0.70, which further confirms the accuracy of the land use spatial evolution prediction by the CA–Markov model. By combining the urban expansion index with the simulation model, this paper provides an in-depth analysis of the internal relationship between the historical evolution of and future trends in construction land expansion because of the high-quality coordinated development of Shaanxi Province and extends the research perspective with creative ideas.

1. Introduction

The accelerating pace of urbanization remains a critical global research priority. According to the World Cities Report 2022 by UN-Habitat, 56% of the global population resided in urban areas in 2021, with projections indicating that this proportion will rise to 68% by 2050 [1]. Concurrently, the OECD’s report “Rethinking Urban Sprawl: Moving Towards Sustainable Cities” estimates that 70% of the global population (86% in OECD nations) will inhabit urban areas by mid-century, underscoring cities’ escalating socioeconomic significance [2]. However, urban expansion frequently exacerbates spatial inequalities through mismatched population migration and residential development. In Lagos, Africa’s largest metropolis, 60% of residents occupy informal settlements where infrastructure coverage falls below 20%, epitomizing a dual-city dichotomy between formal and informal urban systems [3]. Mumbai’s Dharavi slum exemplifies extreme density–pressure mismatches, accommodating over 1 million inhabitants within 3 km2—a population density of 334,000 persons/km2—far exceeding municipal service capacities [4].
Driven by the wave of urbanization, China’s urbanization level has significantly increased from 36.22% in 2000 to 66.16% in 2023. This growth trend indicates that China’s urban development is moving at a rapid pace, and the ongoing expansion of urban land space has become a fundamental aspect of urban development. Sustainable urban development is the main concern in urban expansion in China, which is currently undergoing a significant transition from quantitative to qualitative urbanization. Understanding the spatial and temporal evolution characteristics of built-up urban areas, simulating the state of urban growth, and forecasting future development trends are therefore crucial for urban development.
Scholars worldwide have adopted multifaceted approaches to investigate urban expansion, exploring its scale, rate, and impacts on land use transitions from diverse perspectives. Current research on urban land expansion primarily focuses on three domains: (1) the spatiotemporal characteristics and evolutionary patterns of urban expansion [5]; (2) the driving mechanisms behind urban expansion [6]; (3) the socioeconomic, climatic, and eco-environmental impacts of urban spatial growth. These studies address core issues of urbanization through interdisciplinary lenses. For instance, Ouyang et al. (2020) analyzed the spatiotemporal evolution of urban land expansion in specific urban agglomerations from 1990 to 2015, revealing its effects on landscape ecology and providing critical insights into human–nature interactions [7]. They further developed a comprehensive indicator system integrating population, economy, and land use coordination to assess the “human–land relationship” during urban expansion, highlighting the synergistic roles of natural, economic, and demographic drivers. Yu et al. (2017) systematically investigated urban expansion in Wuhan from 1995 to 2015 using GIS Model Builder and the common edge measurement method, elucidating the dynamic processes and spatial characteristics of urban sprawl [8]. Recent studies have advanced urban expansion simulation through integrated models, such as the PLUS model for scenario-based projections [9,10] and the FLUS model combining the In-VEST model [11]. While the CA–Markov model is widely applied for its efficiency in spatial dynamics [12,13], its reliance on historical transition probabilities may overlook spatial constraints. Urban expansion monitoring has emerged as a research hotspot [14,15,16], with multidimensional quantitative methods—tailored to regional specificities and data availability—widely applied to evaluate expansion patterns [17]. While simulation models demonstrate efficacy in projecting urban spatial changes under resource constraints, their oversimplified assumptions often fail to capture the intrinsic mechanisms of spatial evolution [18,19]. To address these limitations, this study proposes an integrated monitoring model combining urban expansion indices and simulation modeling. This framework not only optimizes historical expansion data but also simulates urban spatial dynamics in multiple scenarios, enabling the systematic analysis of causal factors. Furthermore, it supports spatial optimization for evidence-based urban planning and policy formulation [20,21]. Meanwhile, this study proposes a dual-model framework comparing the CA–Markov and PLUS models, rigorously validating their accuracy in predicting land use transitions. Collectively, the existing research provides a robust theoretical foundation for analyzing spatiotemporal features, predictive modeling, and optimization strategies in urban expansion.
Based on the urban expansion history of Shaanxi Province over the past two decades, this paper conducts an in-depth investigation into its spatiotemporal characteristics, identifies the influencing factors driving its development, and simulates land use projections for Shaanxi Province in 2030. This research holds significant academic and practical value for optimizing urban spatial layouts, adapting to and guiding rational land use change trends, and effectively curbing disorganized expansion in super-large cities.

2. Overview of the Study Area and Data Sources

2.1. Overview of the Study Area

Shaanxi Province, located in central China along the middle reaches of the Yellow River, occupies a strategically significant position in the inland northwest region. It is bordered by Shanxi to the east, Inner Mongolia to the north, Ningxia and Gansu to the west, Sichuan and Chongqing to the south, and Hubei and Henan to the southeast. Covering an area of 205,600 km2, the province is administratively divided into 11 prefecture-level cities—Xi’an, Tongchuan, Baoji, Xianyang, Weinan, Yan’an, Hanzhong, Yulin, Ankang, Shangluo, and the Yangling Demonstration Zone, along with 76 counties and cities. Shaanxi Province’s unique geographical structure has a profound influence on its urban layout and development mode. Shaanxi Province is located in central China, winding along the middle reaches of the Yellow River. It has a complex and diverse terrain that is higher in the north and west and gradually decreases in the middle and east. In terms of geographical distribution, the Qinba Mountains in the south of Shaanxi Province occupy about 36% of the province’s area; the north of Shaanxi Province is a vast plateau area, accounting for about 45%; and the central Guanzhong Plain, although only about 19%, is the core area of the province. The Guanzhong region, with its flat and open terrain serving as a geographical advantage, has a relatively dense urban distribution and a large scale, forming a number of economically active and culturally prosperous urban clusters. In contrast, due to the rugged terrain and inconvenient transportation, the urban layout of northern and southern Shaanxi Province is more dispersed, and each seeks a development path in a specific natural environment. In the process of urbanization, the phenomenon of urban expansion in Shaanxi Province also presents distinct regional characteristics. The Guanzhong area continues to give full play to its geographical advantages, and the urban area continues to expand outward, which promotes the rapid development of the economy and society. On the other hand, in northern and southern Shaanxi Province, under the premise of maintaining the balance of the ecological environment, the urbanization process is prudently promoted, with the aim of achieving sustainable development. This regional difference in urban expansion reflects not only the diversity of the geographical environment in Shaanxi Province but also the different choices and strategies of different regions on the road to urbanization. Taking the provincial capital Xi’an as an example, the land use in its central urban area is characterized by high intensification and efficient use, and its expansion mode is more characterized by filling, so the expansion rate is relatively gentle [22]. In contrast, the urban fringe has more abundant land resources and better expansion conditions, and its expansion speed is much faster than that of the central area, showing a more significant extensional development trend. In terms of spatial layout, construction land has gradually expanded in the southeast direction, while it has rapidly developed by leaps and bounds in the northwest direction [23]. However, these expansion trends are accompanied by a series of complex land use challenges and urgent issues. As a model of the western region taking the lead in entering the ranks of urban society, Shaanxi Province, with its unique charm and development potential, has attracted substantial population migration in the province and even the whole northwest region and promoted the continuous and steady growth of the provincial population. Urban planning that does not match development leads to inefficient land use, insufficient urban space, and increasingly serious urban problems such as traffic congestion and environmental pollution [24,25,26].
Based on significant differences in its natural geography, Shaanxi Province is divided into three major regions: Guanzhong, northern Shaanxi Province, and southern Shaanxi Province. As an ancient transportation hub connecting eastern and western China, the Guanzhong Plain has historically witnessed the prosperity of important trade routes such as the Qinchi Road and the Silk Road. Today, with the opening of the Longhai–Lanxin Railway, the Guanzhong region continues to play a key role in facilitating the flow of goods, technological exchanges, and cultural integration between the eastern and western regions. Northern Shaanxi Province, located north of the Beishan Mountain Range, with the vast Loess Plateau in the south and the Mao Wusu Sandy Land in the north, is not only a sacred place in China’s modern revolutionary history but also carries a deep cultural heritage and natural features. Southern Shaanxi Province encompasses the Han River basin—a major tributary of the Yangtze River—and the Qinba Mountain area, located upstream of the Jialing River, and is endowed with abundant natural resources and a unique ecological environment, making it a “green pearl” of the province (see Figure 1).
In 2022, Shaanxi Province’s Gross Regional Product (GRP) exceeded USD 327 million, and its Gross Per Capita Product exceeded CNY 82,000. By the end of 2022, the size of the resident population had reached 39.56 million, of which the proportion of the urban population was 64.02%. With the booming economy and growing population, the imbalance between the supply and demand of land is becoming increasingly prominent, which, in turn, is driving the continuous expansion of cities.

2.2. Data Sources

Landsat ETM/OLI8 image data with a 30 m × 30 m resolution were obtained for the years 2000, 2010, and 2020 from the National Geographic Data Cloud website. The images were captured between June and September in each respective year. The detailed data types and sources are shown in Table 1.

2.3. Data Processing

In the data processing of this study, remote sensing and geographic information software ArcGIS v10.8.2 were used, and the triangular grid method was used for accurate geometric correction. In order to accurately delineate the boundary of the central city, the spatial analysis module is used to process the classified images, and the grid images of three selected time points are generated. These raster images are combined with the administrative regions and land use data of the same period, and then vectorized to make a detailed map of the distribution of construction land in Shaanxi Province in the third phase. All raster data are clipped using the Chinese standard map boundary, and the unified resolution is 1 km. The coordinate system is re-projected as WGS_1984_UTM_Zone_49N.
The preprocessed land use maps of 2000 and 2010 underwent identical processing procedures and served as unified input data for both the CA–Markov and PLUS models, thereby eliminating interference from data discrepancies on subsequent accuracy comparisons.

3. Research Methodology

3.1. Expansion Intensity Index and Expansion Rate Index

In studies on the dynamic characteristics of urban land expansion, two key indicators are commonly employed: the Urban Expansion Intensity Index (UEII) and the Urban Expansion Rate Index (UERI). The UEII is primarily used to quantify the extent of built-up urban area expansion over a specified time period, while the UERI focuses on measuring the speed of this process. The formulas for these two indices are presented below:
U E I I = ( U b U a ) U a × 100 %
U E R I = U c U d T c T d × 100 %
In these formulas, U a and U b in (1) and U c and U d in (2) are defined as the urban built-up area at two different time nodes to distinguish the scale of urban development at different stages; T c and T d are introduced as two specific research time sequence identifiers, corresponding to different time nodes, to analyze the changes in the built-up urban area during these time sequences, where T c and T d denote start and end years.

3.2. CA–Markov Model

Markov modeling, a method based on Markov chain process theory, is widely used in the prediction of event probabilities. The core assumption of this approach is the memoryless nature of event evolution, meaning that the probability distribution of future states depends solely on the current state, rather than on previous states [27]. Therefore, in dynamic land use simulations, a land use transition can be treated as a stochastic process that adheres to the Markov property. In this context, different land use types are represented as potential states, and the transitions between these types reflect the probabilities of state changes (Table 2). Based on this framework, the Markov model is capable of effectively capturing the probability of transitions between land use types and generating reliable predictions. The mathematical formulation is presented below:
S t + 1 = P i j × S t
In the above expression, S t and S t + 1 represent the system at moments t and t + 1 , while P i j is used to describe the transfer probability of transitioning from state i to state j .
A Cellular Automaton (CA) is a discretized dynamical simulation tool that integrates the concepts of time, space, and state to model the spatial dynamics of complex systems over time [28]. Its mathematical model can be represented as follows:
S t + 1 = f S t , N
In the constructed model, the finite discrete state of the cell is represented by S, t and t + 1 represent different time nodes, N refers to the adjacent region of the cell, and f is the regular function of the local transformation. Together, these key elements guide the dynamic evolution within complex systems.

3.3. PLUS Model

The PLUS model is a method to simulate land use change on the plot scale. The model integrates multi-dimensional driving factors such as social economy, environment, and policy, and couples spatial constraints and geographical conditions to realize the prediction of land use dynamic change. Its significant advantages are reflected in the ability to describe the details of land use conversion on a high-resolution spatial scale, and to quantitatively evaluate the effects of different policies and development plans through scenario analysis, providing high-precision scientific basis for urban planning and land management decisions [29].
In the PLUS model, the neighborhood influence factor is one of the core mechanisms that drive the cellular automata to run. This factor quantifies the degree to which a specific land use type in the simulation unit is affected by the land use of the adjacent area (whether the same or different), and its value is expressed as an influence coefficient within the range of [0, 1]. The coefficient value approaching 1 indicates that the land use type has a strong tendency of spatial expansion and agglomeration. On the contrary, the coefficient value approaching 0 reflects that its spatial distribution is less affected by the adjacent area (Table 3).
The specific calculation formula for the neighborhood weights is as follows:
X = X X m i n X X m i n
X* denotes the min-max normalized value; X represents the change area of each land use type between the two-period land use data; Xmax is the maximum change area among all land use types; and Xmin is the minimum change area among all land use types.
The cost conversion matrix represents the conversion rules between land use types and clearly stipulates whether mutual conversion is allowed between categories. The matrix is characterized by Boolean logic value: if a land use type can be converted to another type, the corresponding matrix element is assigned to 1; conversely, if the conversion is prohibited, the assignment is 0 [30] (Table 4).

3.4. Precision Testing

The Kappa coefficient is widely regarded as an effective measure for assessing the accuracy of remote sensing interpretations and the degree of similarity between two images. In this study, the Kappa coefficient is used as an evaluation metric to verify the accuracy of the CA–Markov model in simulating land use changes in Shaanxi Province [31]. The calculation method for the Kappa coefficient is outlined as follows:
K a p p a = P o P c P p P c
P o = n 1 n , P c = 1 N
In the formula, P o represents the proportion of grids correctly simulated, P c is the expected proportion of grids correctly simulated, P p is the proportion of grids correctly simulated assuming an ideal classification, n is the total number of grids, n 1 is the number of grids correctly simulated, and N is the number of land use types.
A Kappa coefficient below 0 indicates poor agreement between the simulation and actual data. A value between 0 and 0.2 suggests weak consistency, while a value ranging from 0.2 to 0.4 reflects low consistency. Values between 0.4 and 0.6 represent moderate consistency, and a Kappa coefficient between 0.6 and 0.8 indicates significant agreement. Finally, a value between 0.8 and 1 signifies an optimal agreement between the simulation and the actual data [32].

4. Findings

4.1. Spatial and Temporal Characteristics of Urban Land Expansion in Shaanxi Province

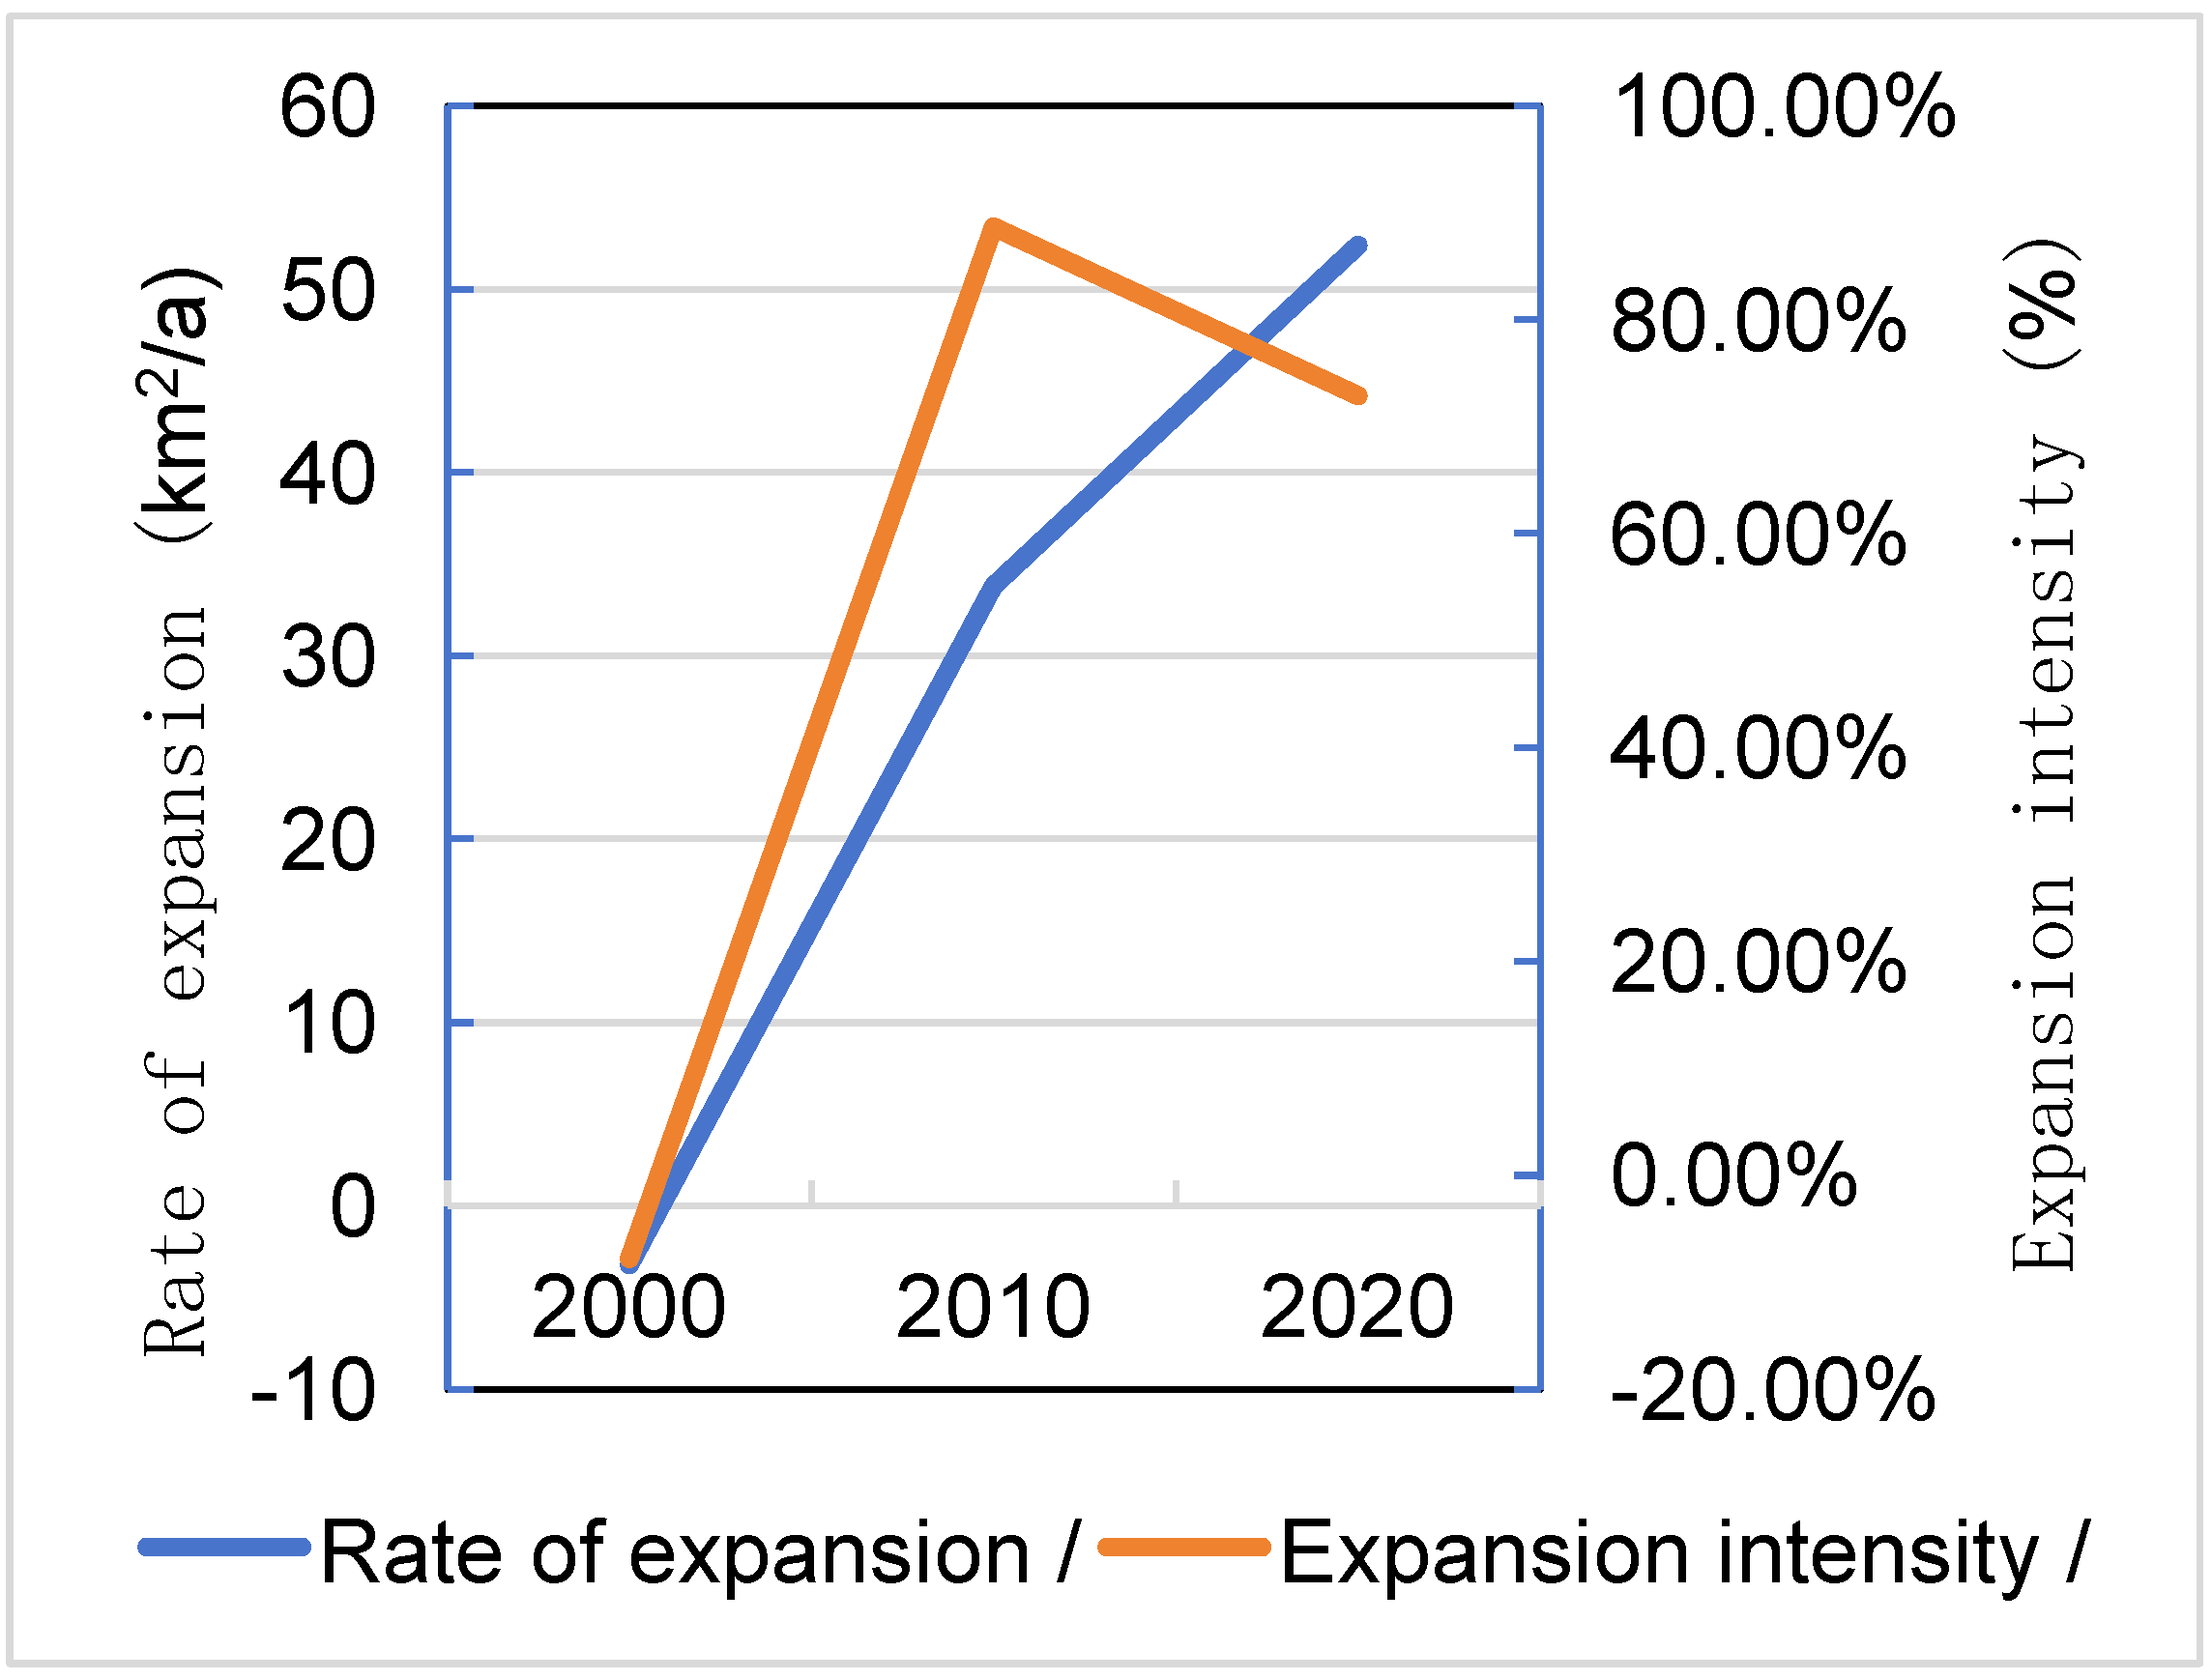
Table 5 shows the built-up urban area of Shaanxi Province in 1990, 2000, 2010, and 2020. Overall, the built-up urban area of Shaanxi Province has been expanding over the past 30 years, especially since 2010, when expansion slightly accelerated. The intensity of expansion changed over time: between 1990 and 2000, the intensity of expansion was negative, after which it rose and then fell. Due to the small size of the urban built-up area in the previous period, the rate of expansion gradually accelerated after 2000, and the intensity of expansion began to decrease between 2010 and 2020 (Figure 2).
The trajectory of urban development is characterized by the expansion of the central urban area and its gradual integration with the surrounding regions, ultimately achieving the strategic goal of regional integration [33]. In Xi’an, prior to the formation of the metropolitan area, the core urban area was mainly limited to six urban areas centered on the Bell Tower. In the 1985 urban layout, the radius of Xi’an’s main urban area was about 5 km, while the distance to Xianyang City was around 15 km. In recent years, the urban spatial layout of Xi’an has significantly changed. The western boundary has seamlessly merged with the main city of Xianyang, creating a vast radius of 30 km, which marks a significant shift in the city’s center of gravity to the west. This process not only reflects the close ties between the two cities but also marks significant progress in the regional integration strategy, which is important for promoting regional economic development and urbanization.

4.2. Factors Influencing Urban Land Expansion in Shaanxi Province

The evolution of the urban spatial structure is the result of the interweaving of multiple factors, covering human activities, the geographical environment, and other dimensions. Urban expansion is guided and regulated by urban development planning policies, while economic and population growth are the core forces driving its development. Specifically, population growth triggers a surge in demand for land for functions such as residential, educational, employment, and recreational activities, while booming economic development promotes land expansion for factory construction and commercial land [12]. The government’s macro policies have had a profound impact on the allocation of land resources and the direction of expansion, while the ecological basis of urban expansion has been constrained by natural conditions such as road transportation networks and water system layouts. Based on an in-depth analysis of the development history of central urban areas in Shaanxi Province over the past two decades, these influencing factors are grouped into five core dimensions: natural geographic conditions, transportation network construction, economic development dynamics, policy-oriented effects, and historical and cultural background (see Figure 3).

4.2.1. The Binding Force of Natural Geography

The pronounced topographic diversity across Shaanxi Province exerts a fundamental constraint on urban expansion patterns. The flat terrain of the Guanzhong Plain facilitates efficient infrastructure development and connectivity, enabling contiguous, low-cost outward expansion and fostering the formation of dense, large-scale urban clusters. Conversely, the rugged topography of the Loess Plateau in the north and the Qinba Mountains in the south acts as a significant physical barrier. Expansion is largely confined to narrow valleys and river corridors where developable land is scarce and fragmented. This severely limits the potential scale and contiguity of urban development, forces dispersed settlement patterns and increases the costs and complexities of infrastructure provision. Consequently, the rate and spatial configuration of urban expansion are directly dictated by the binding force of the underlying natural geography.

4.2.2. The Supporting Force of the Transportation Network

The continued optimization and expansion of transportation networks, especially the construction of modern transportation infrastructure such as highways and high-speed railroads, have significantly enhanced regional connectivity and accessibility. This improvement not only makes remote areas easily accessible but also leverages their potential to attract investment, increase population flow, and foster industrial concentration, which in turn promotes the orderly expansion of urban land. The layout of the transportation network is equally important to the shaping of the urban spatial structure. For example, the introduction of urban rail transit often leads to the formation of a checkerboard spatial layout that combines ring and radial patterns, which not only optimizes the internal transportation routes of the city but also promotes the efficient allocation of urban land. A well-planned transportation network can effectively guide the development of urban land toward intensification and high efficiency. The establishment of additional traffic arteries in the peripheral or suburban areas of the city can guide enterprises and residents to migrate to these areas, thus dispersing the population and industrial pressure in the core area of the city and achieving the intensive use and optimal allocation of land resources. In addition, the improvement of the transportation network also promotes close inter-regional ties and cooperation, accelerates the flow and sharing of resources between cities in the region, and lays a solid foundation for the coordinated development of the regional economy.

4.2.3. The Driving Force of Economic Development

With the sustained and rapid economic growth in Shaanxi Province, there has been an increasing demand for land resources for all types of economic activities, covering a wide range of dimensions, including commercial, industrial, residential, and public facilities. In order to meet these diverse demands, the scale of urban land use has had to correspondingly expand. Economic development has been accompanied by a profound restructuring of the industrial structure, with Shaanxi Province undergoing a transition from a secondary- to a tertiary-led industry. This shift has led to a decrease in the demand for traditional industrial land and a significant increase in the demand for land in new fields such as commerce and services, which in turn has driven the optimization and expansion of the urban land structure. The attraction of economic prosperity is reflected not only in the convergence of capital but also in its ability to introduce advanced technology, management concepts, and development models, injecting new vitality into local industries and pushing the economy to a higher level. The implementation of these investment projects often requires supporting land resources, further accelerating the pace of urban land expansion. For example, as the capital city of Shaanxi Province, Xi’an’s rapid economic development and accelerated urbanization are directly reflected in the significant increase in the pace of urban land expansion, which has become a microcosm of regional economic development [34]. According to the Xi’an 2024 State-owned Construction Land Supply Plan announced by the Xi’an Municipal Bureau of Natural Resources and Planning, Xi’an plans to supply over 50,000 mu (approximately 35 km2) of construction land. This plan reflects not only Xi’an’s confidence and determination in economic development but also the actual demand for urban land expansion. Xi’an also promotes the efficient use of urban land and coordinated development by optimizing the spatial layout of the city and strengthening the construction of transportation networks. For example, in the Xi’an Land Space Ecological Restoration Plan, the term “Central City Ecological Infrastructure Enhancement Zone” is explicitly mentioned, and the scope and functional positioning of the central city is clearly defined. These measures help to achieve a virtuous cycle of economic development, ecological environmental protection, and the sustainable use of urban land.

4.2.4. Regulatory Power of Policy Guidance

Government policies and development plans have a significant impact on the direction and pace of urban land expansion. For example, in order to promote the development of a certain area, the government may invest more resources, including land resources, thus promoting the expansion of urban land in that area [35]. The policy orientation guides the layout of urban land by formulating urban development plans and land use plans, which specify the direction and key areas of urban development. For example, in the Xi’an City Land Space Ecological Restoration Plan, the concept of the “Central City Ecological Infrastructure Enhancement Zone” is put forward and clearly outlines the scope and functional focus of the central city. This policy orientation has directly influenced the direction and layout of urban land expansion in Xi’an, making urban land use more rational and efficient.

4.2.5. Integration of History and Culture

Shaanxi Province’s profound historical and cultural heritage significantly integrates with, and thereby shapes, urban expansion dynamics, primarily through preservation constraints and tourism-driven development. The concentration of major heritage sites within or near existing urban cores imposes stringent regulatory limitations on surrounding development. Urban planning designates protected zones with strict controls on building height, density, and land use type to safeguard heritage integrity. This actively directs expansion away from these core heritage vicinities, altering its spatial trajectory and often slowing the pace in historically sensitive corridors. On the other hand, this cultural integration also fuels expansion in other directions. Heritage sites act as powerful tourist magnets and cultural anchors, stimulating demand for supporting infrastructure, cultural, and commercial districts nearby, albeit outside the strict protection zones. This tourism-oriented development becomes a distinct driver of land conversion in designated areas, demonstrating how the integration of historical–cultural assets not only constrains expansion in one context but actively channels and stimulates it in others, creating unique spatial patterns around cultural landmarks.

4.3. Simulation and Prediction of Urban Land Expansion in Shaanxi Province

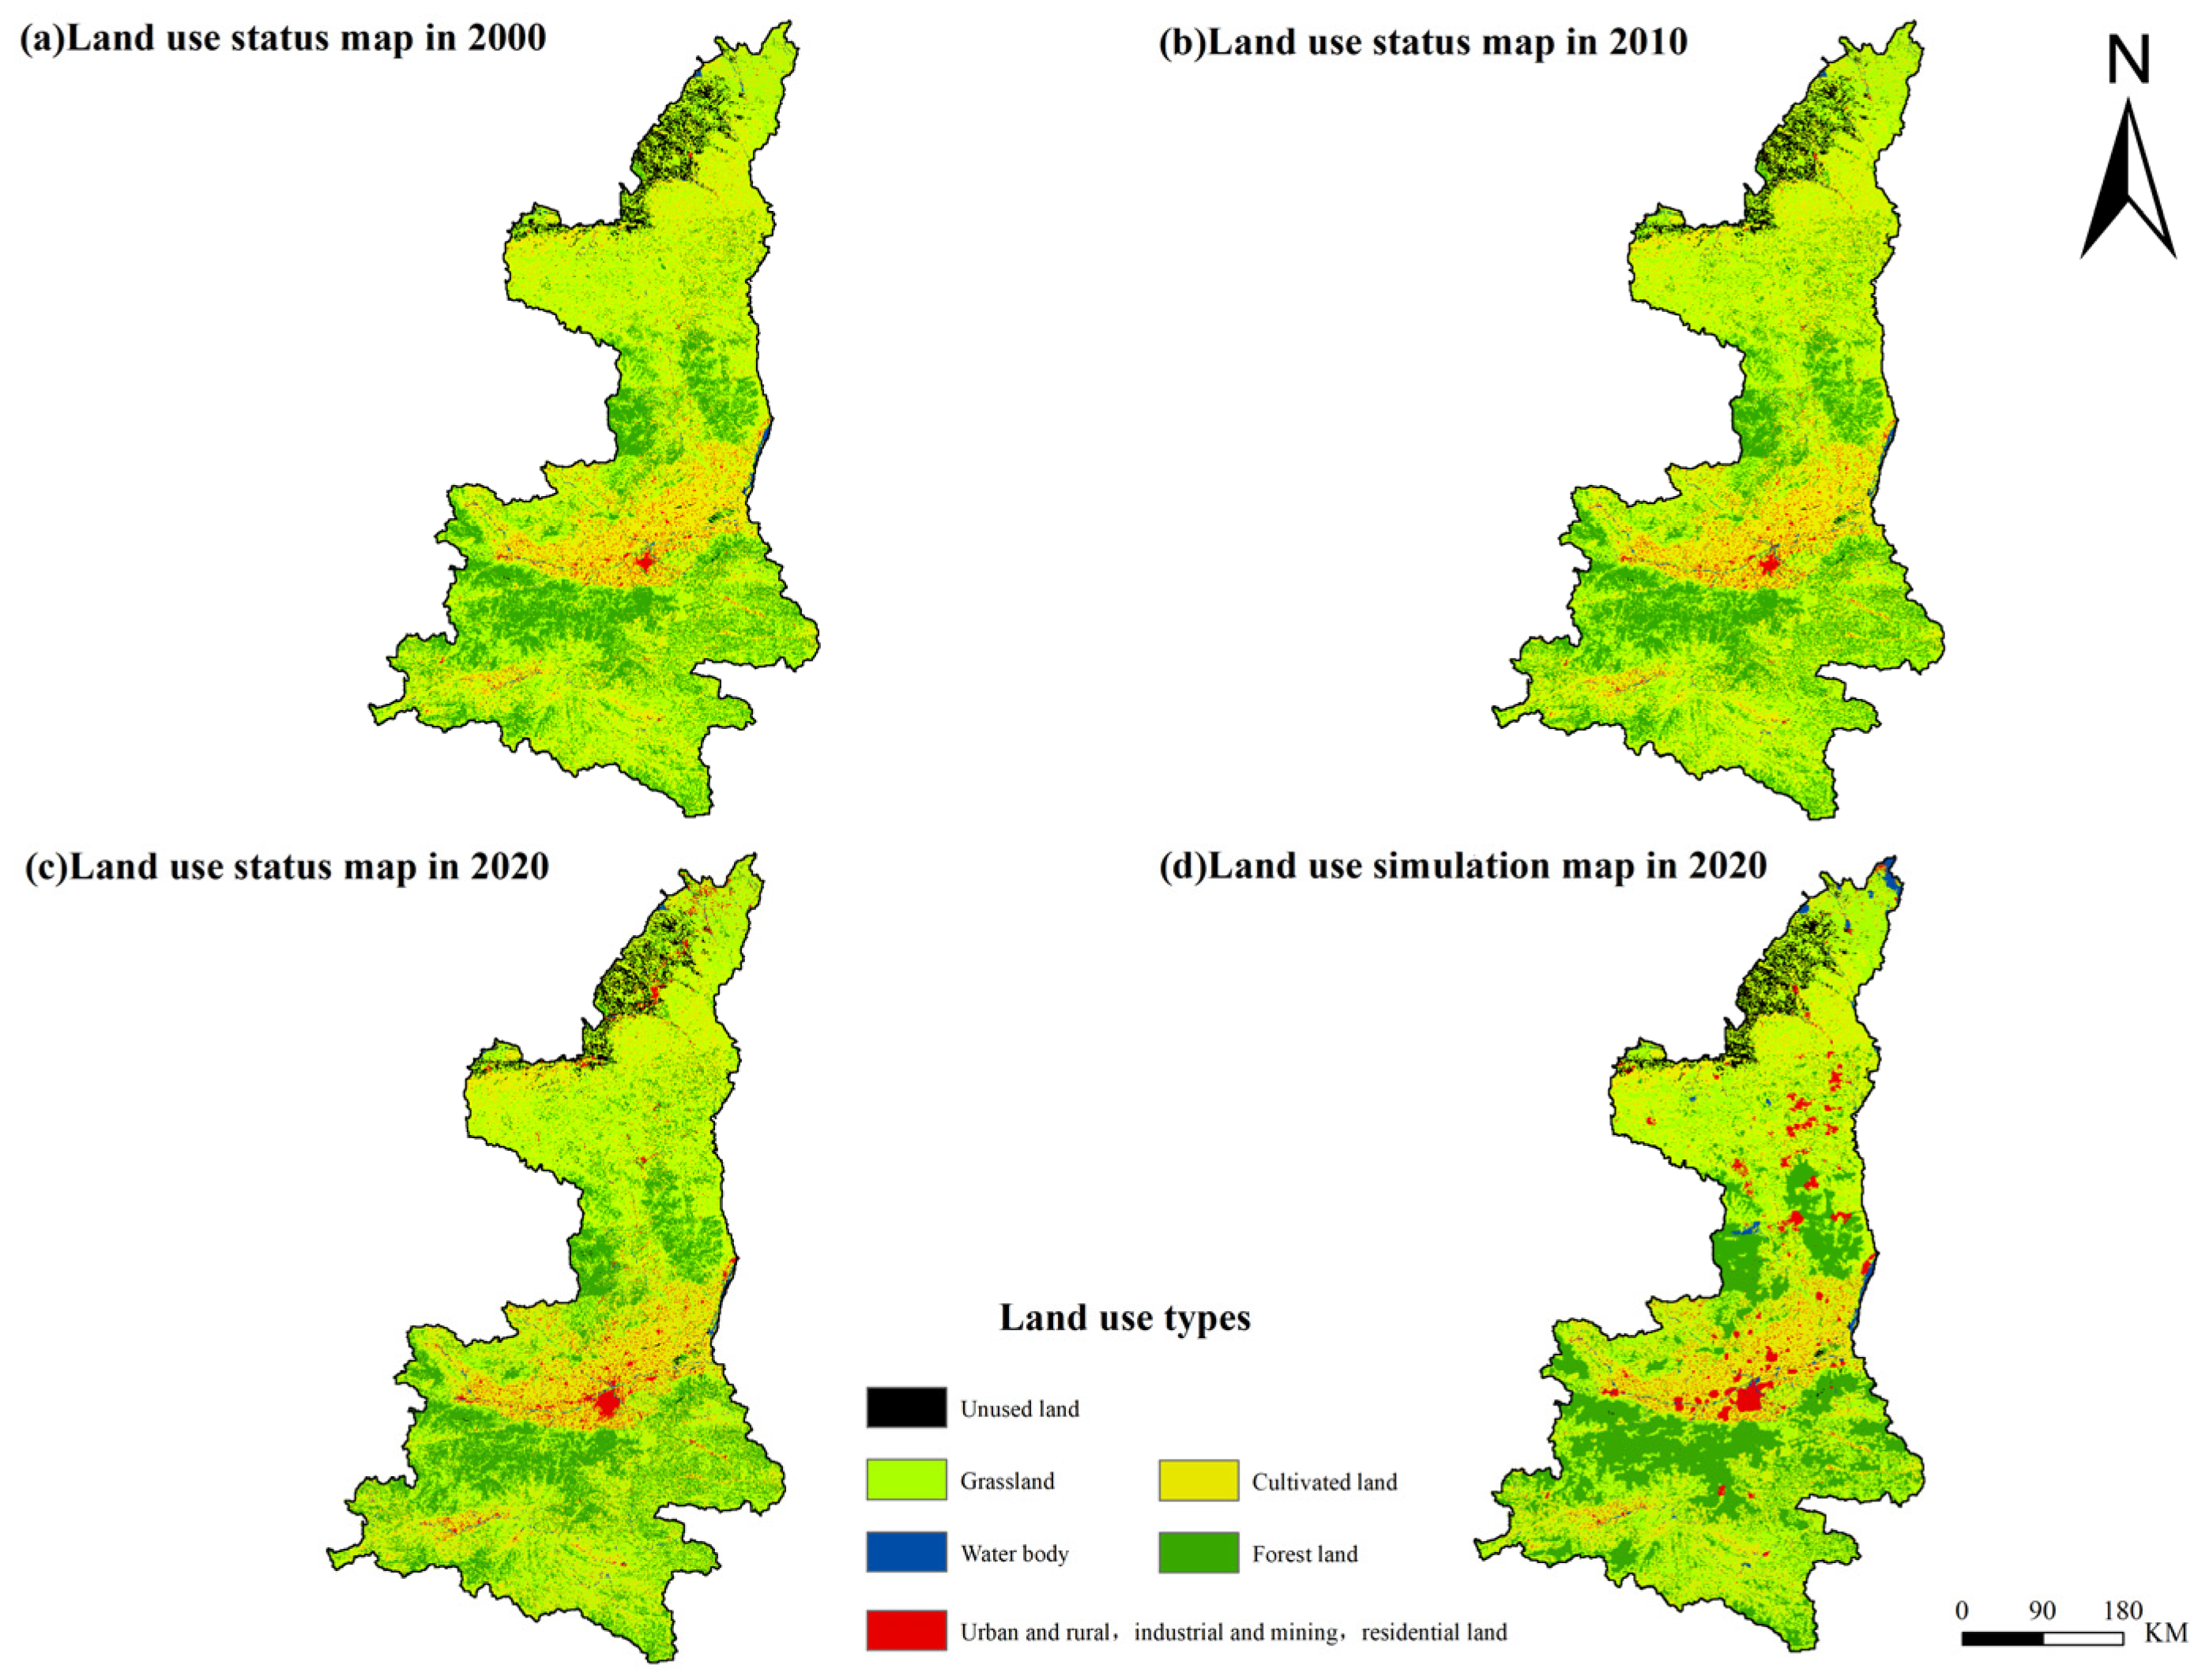
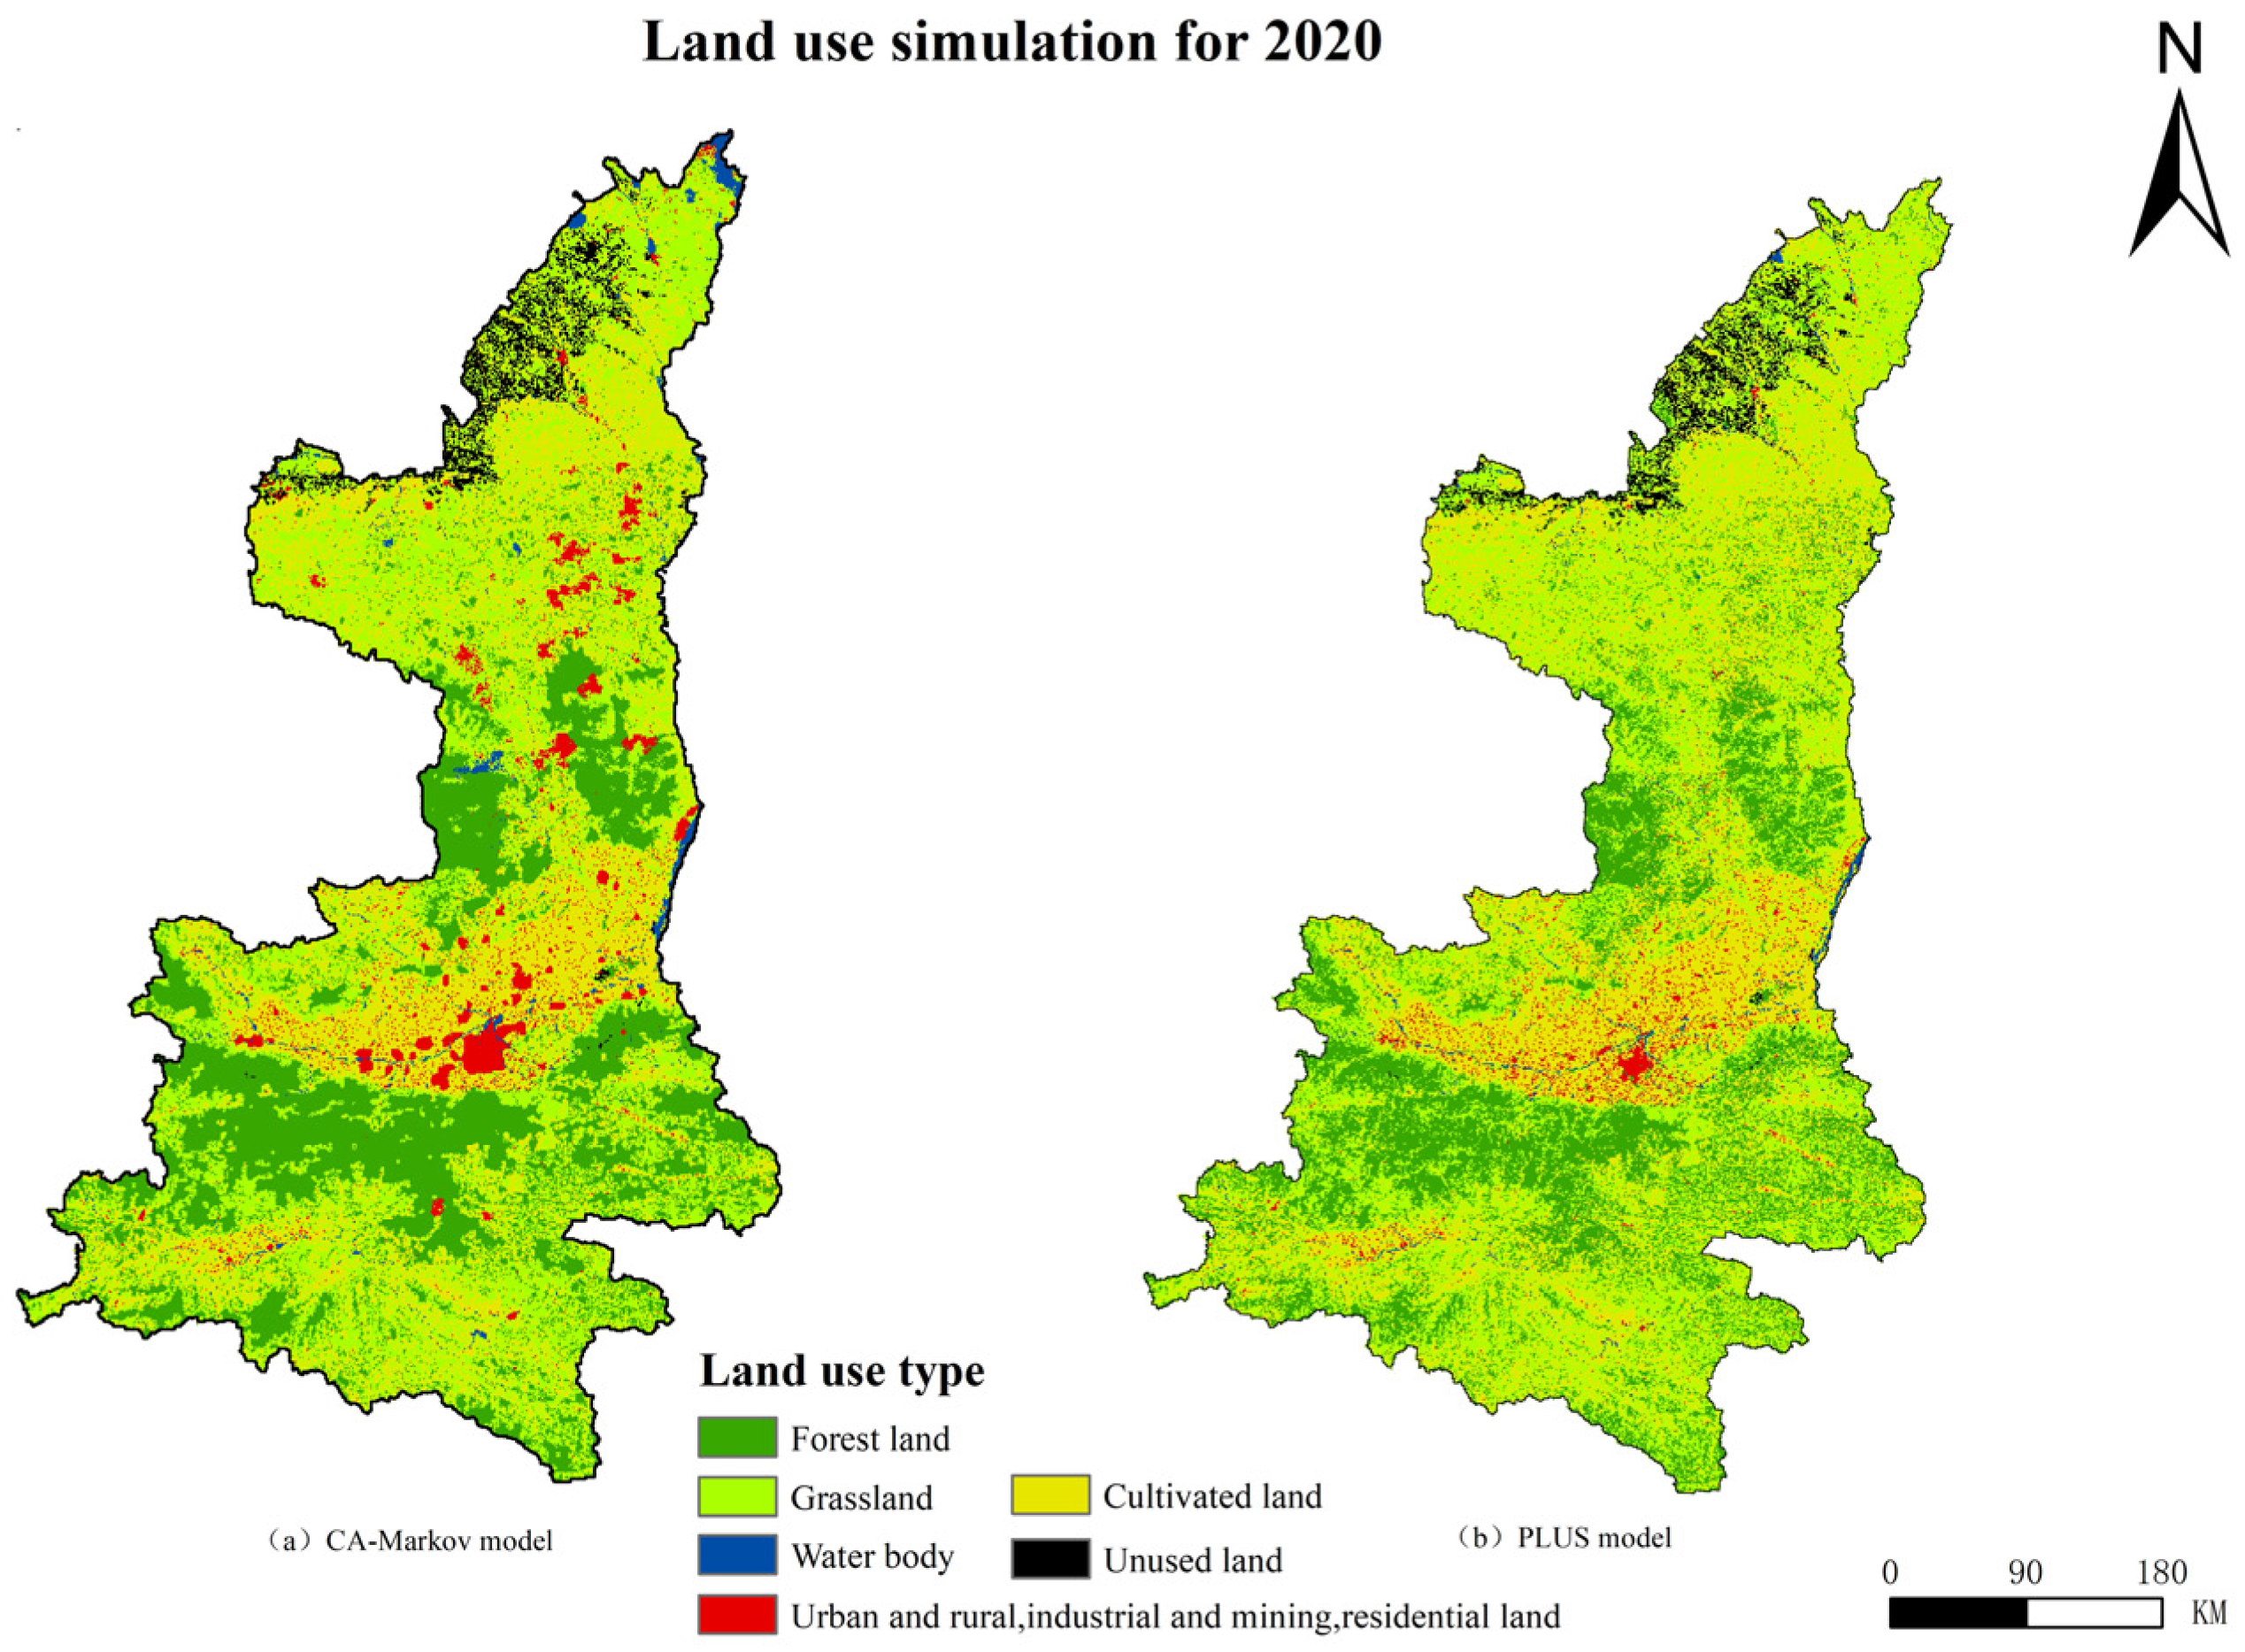
This study employed land use data from 2000 and 2010 to predict the 2020 spatial land use pattern through both CA–Markov and PLUS models. The CA–Markov model integrated transition matrices and suitability atlases as simulation rules. The predictive results were rigorously validated against actual 2020 land use data using GIS-based spatial overlay subtraction [36], while the PLUS model utilized a patch-generating land use simulation strategy. Validation against actual 2020 data revealed that the CA–Markov model achieved an overall accuracy of 83.48% and a Kappa coefficient of 70%, indicating high reliability (Figure 4). In contrast, the PLUS model yielded a Kappa coefficient of 38%, reflecting moderate consistency. The superior performance of the CA–Markov model underscores its efficacy in capturing contiguous urban expansion patterns in Shaanxi Province (Figure 5).
In addition, Figure 4 shows that the construction land in northern Shaanxi Province is significantly reduced compared with 2020, and there may be two reasons. First, the Grain for Green Project will convert some suitable urban land into forest land; second, due to the decline of mining industry, some resource-exhausted cities have implemented contractionary planning to reduce the demand for industrial land. Some industrial and mining land has been converted into other types of land, and the outflow of population has led to the merger and revocation of residential areas.
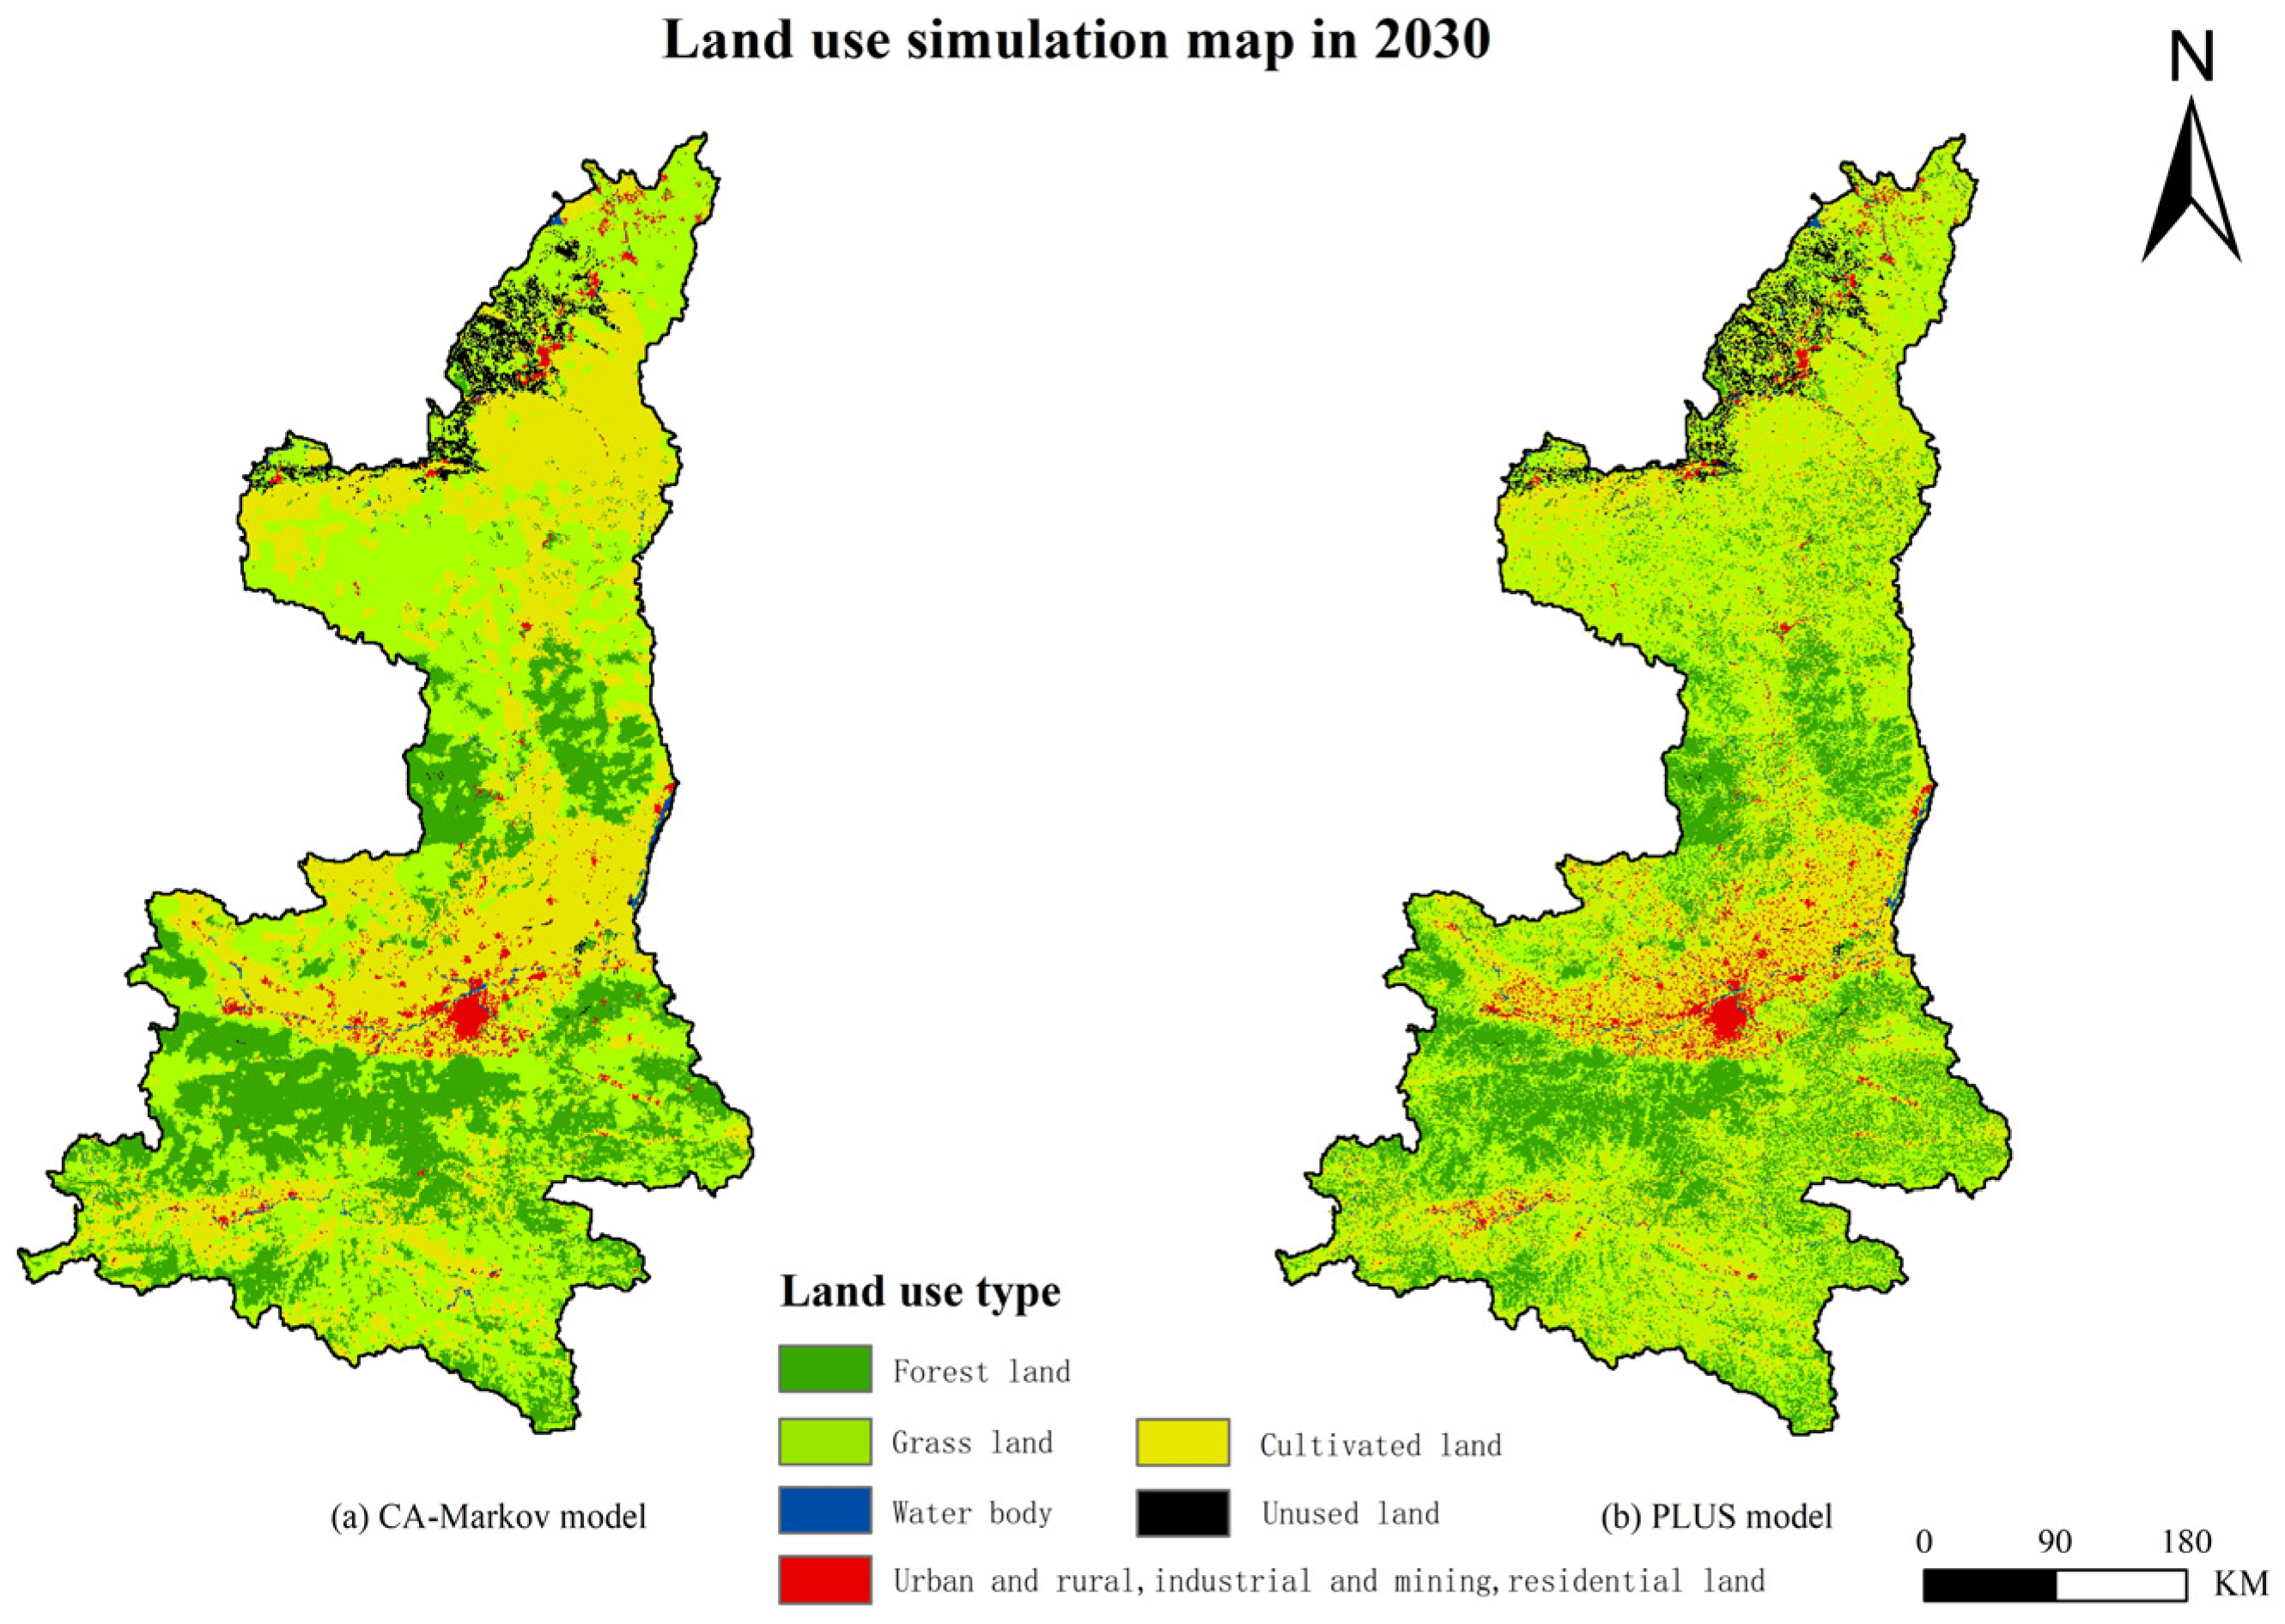
A systematic analysis of the spatial simulation efficacy revealed exceptional consistency between modeled and observed land use dynamics, thereby verifying the methodological rigor and implementation validity. To enhance predictive precision, we recalibrated the suitability atlases using 2010 as the updated baseline. Leveraging the 2010–2020 land transition matrix and refined suitability parameters as guiding principles, the CA–Markov model successfully projected the 2030 land use distribution (Figure 6), providing critical insights for territorial spatial planning.
Furthermore, the PLUS model integrates land expansion analysis strategies and multi-class random patch seeding mechanisms. By incorporating driving factors such as socioeconomic conditions and the natural environment, it successfully predicts the land use distribution for 2030 (Figure 6).
The CA–Markov model significantly overestimates urban land and underestimates cultivated land in the 2020 simulation. The PLUS model urban land is low, but the error is small and closer to the actual value. The 2030 CA–Markov model predicts that land use in 2030 will rebound, and urban land will shrink, while the PLUS model predicts that cultivated land will continue to decrease and urban expansion, which may be related to the sensitivity of the PLUS model to human driving forces (Table 6).

5. Discussion

An in-depth analysis of the spatial and temporal evolution of urban land expansion and its driving forces is essential for understanding the regional urbanization process, revealing the spatial pattern of land use, and guiding transportation, demographic, and economic planning in the region. Given the accelerated urbanization process and inappropriate use of land resources, urban ecosystems and residents’ quality of life are facing increasing challenges [37]. Therefore, predicting future urban expansion trends is vital for the rational allocation of land resources and sustainable urban development.

5.1. Comparison with Existing Research

The existing research mostly separates the expansion index and the simulation model. This paper combines the expansion intensity index with the CA–Markov model. This framework not only optimizes the historical expansion data but also simulates the urban spatial dynamics under multiple scenarios, supports systematic causal analysis, and provides spatial optimization support for evidence-based urban planning and policy formulation.

5.2. Research Limitations

Combining the urban expansion index and the simulation model, we not only comprehensively analyzed the spatial and temporal characteristics of construction land expansion in Shaanxi Province between 2000 and 2020 but also explored the driving mechanisms behind it. Based on these analyses, we simulated the land use distribution pattern of Shaanxi Province in 2030. Combining the urban expansion index with the simulation model, we comprehensively analyzed the intrinsic connection between the historical evolution of construction land expansion and future trends in the high-quality coordinated development of Shaanxi Province, thus achieving an innovative expansion of research perspectives. However, due to limited data acquisition channels and the lack of long-term images, this study failed to compare multiple cities, and it is difficult to fully explore the influencing factors of urban expansion in Shaanxi Province. Further research is needed on the mechanisms of urban expansion.

5.3. Future Research Prospects

Looking ahead, the proportion of construction land in Shaanxi Province is expected to continue to climb, and the mode of urban expansion will be dominated by external expansion, further promoting the expansion of the city’s scale and improvements in its functions. In order to balance urban development and the construction of ecological civilization, Shaanxi Province should optimize the efficiency of land use and take effective measures, such as construction land consolidation and arable land reclamation [38]. At the same time, the scientificity and rationality of urban planning should be enhanced, and the pattern of urban land use should be actively regulated to avoid over-expansion and achieve the rational allocation and sustainable development of land resources, thus promoting the high-quality upgrading of the urbanization process in Shaanxi Province.

6. Conclusions

From the in-depth analysis of the results of the prediction of various types of land use in Shaanxi Province, combined with the regional slope, rivers, and other natural elements, the following conclusions are drawn:
(1)
There are significant trends in land use. In the time span from 2000 to 2030, the growth trend of construction land was substantial, while the area of arable land showed a significant shrinking trend, with the main direction of transformation being toward construction land and unutilized land, demonstrating an obvious dynamic change trend.
(2)
On the basis of an in-depth analysis of the development history of central urban areas in Shaanxi Province over the past two decades, the influencing factors of urban land expansion in Shaanxi Province are categorized into five core dimensions: natural geographic conditions, the construction of transportation networks, the trend in economic development, the role of policy orientation, and historical and cultural background.
(3)
Multiple suitability factors, such as topography and road network density, were introduced to evaluate the suitability of land transfer. The results show that the multi-criteria evaluation method possesses a high degree of rationality and accuracy and is an effective tool for formulating the rules of land use transformation. Its Kappa index is as high as 0.70, which further confirms the accuracy of the method. Meanwhile, it also provides strong support for the applicability of the CA–Markov model in the simulation and prediction of the spatial evolution of urban land use.

Author Contributions

C.L. contributed to the conception of the study; Y.F. performed the experiment; C.L. and Y.F. contributed significantly to the analysis and manuscript preparation; H.C. performed the analysis with constructive discussions. All authors have read and agreed to the published version of the manuscript.

Funding

This work was supported by the General Project of Humanities and Social Sciences Research of the Ministry of Education (23YJC630076), Shaanxi Natural Science Basic Research Program (grant number 2023-JC-QN-0803), Open Fund Funding Projects of Technology Innovation Center for Land Engineering and Human Settlements, Shaanxi Land Engineering Construction Group Co., Ltd., and Xi’an Jiaotong University (grant number 2024WHZ2056), Xi’an University of Architecture and Technology 2024 New Urbanization Research Fund (2024SCZH05).

Data Availability Statement

The original contributions presented in this study are included in the article. Further inquiries can be directed to the corresponding author.

Conflicts of Interest

Chenxi Li is employed by Shaanxi Land Engineering Construction Group Co., Ltd. The authors declare no conflicts of interest.

References

  1. United Nations Human Settlements Programme. World Cities Report 2022: Envisaging the Future of Cities; United Nations Research Institute for Social Development: Geneva, Switzerland, 2022. [Google Scholar]
  2. OECD. Rethinking Urban Sprawl: Moving Towards Sustainable Cities; OECD Publishing: Paris, France, 2018. [Google Scholar]
  3. UN-Habitat. Global Urban Indicators Database: Lagos Metropolitan Analysis; United Nations Human Settlements Programme: Nairobi, Kenya, 2022. [Google Scholar]
  4. World Bank. Slum Upgrading in Mumbai: Spatial Equity and Service Delivery; World Bank Urban Development Series: Tokyo, Japan, 2021. [Google Scholar]
  5. Chen, L.; Gong, C.; Guo, Y.; Guo, Y.; Su, J.; Xu, X.; Xu, G. Integrating macro-micro perspectives to measure urban land expansion in Minsk, Belarus. J. Urban Manag. 2025; in press. [Google Scholar] [CrossRef]
  6. Mansour, S.; Alotaibi, O.; Alnasrallah, M. Geospatial modelling of urban expansion effects on the land ecosystems in Kuwait using random forest and cellular automata. J. Urban Manag. 2025; in press. [Google Scholar] [CrossRef]
  7. Ouyang, X.; Zhu, X. Spatio-temporal characteristics of urban land expansion in Chinese urban agglomerations. Acta Geogr. Sin. 2020, 75, 571–588. [Google Scholar]
  8. Yu, Y.; Hu, S.; Tong, Y. Research on modeling for urban expansion pattern recognition based on shared boundary analysis. Geogr. Geo-Inf. Sci. 2017, 33, 78–81. [Google Scholar]
  9. Zhang, X.; Liu, Y.; Wang, W. Simulation of multi-scenario land use change and its impact on ecosystem services in China based on PLUS-InVEST model. Acta Ecol. Sin. 2025, 19, 1–17. [Google Scholar]
  10. Huang, L.; Cheng, A.; Liu, X. Simulation and prediction of land use change and carbon storage spatiotemporal evolution in Yulin city based on the PLUS-InVEST model. Environ. Sci. 2025, 1–15. [Google Scholar]
  11. Reng, Y.; Liu, X.; Xu, X. Multi-scenario simulation of land use change and its impact on ecosystem services in Beijing-Tianjin-Hebei region based on the PLUS-InVEST model. Acta Geogr. Sin. 2023, 43, 4473–4487. [Google Scholar]
  12. Wang, K.; Qin, J.; Ma, H. Spatial-temporal evolution simulation and ecological response of urban expansion in western new city of Chongqing based on CA-Markov model. J. Univ. Chin. Acad. Sci. 2023, 40, 496–505. [Google Scholar]
  13. Cheng, C.; Hu, Y.; Feng, Y. Construction of urban ecological zones based on CA-Markov model: A case study of the main urban area of Jinzhong. Acta Ecol. Sin. 2020, 40, 1455–1462. [Google Scholar] [CrossRef]
  14. Bagheri, B.; Tousi, S.N. An explanation of urban sprawl phenomenon in Shiraz Metropolitan Area (SMA). Cities 2017, 73, 71–90. [Google Scholar] [CrossRef]
  15. Li, Y.; Meng, D.; Ye, H.P. Spatiotemporal pattern and driving forces of typical Russian cities: Based on remote sensing decision fusion and multiple discrete regression model. Geogr. Res. 2021, 40, 2967–2985. [Google Scholar]
  16. Li, G.D. Spatio-temporal change of global land cover and China’s contribution. Acta Geogr. Sin. 2022, 77, 353–368. [Google Scholar]
  17. Guan, D.; He, X.; He, C. Does the urban sprawl matter in Yangtze River Economic Belt, China? An integrated analysis with urban sprawl index and one scenario analysis model. Cities 2020, 99, 102611. [Google Scholar] [CrossRef]
  18. Chen, Y.; Xue, Y.; Hu, Y. How multiple factors control evapotranspiration in North America evergreen needleleaf forests. Sci. Total Environ. 2018, 622, 1217–1224. [Google Scholar] [CrossRef]
  19. Liao, J.; Shao, G.; Wang, C. Urban sprawl scenario simulations based on cellular automata and ordered weighted averaging ecological constraints. Ecol. Indic. 2019, 107, 105572. [Google Scholar] [CrossRef]
  20. Yuan, M.Y.; Li, J.X.; Zeng, L. Spatial-temporal Change and Driving Forces Analysis of Land-use in Xi’an City. Sci. Technol. Eng. 2022, 22, 13846–13855. [Google Scholar]
  21. Fan, X.; Qie, H. Analysis on the Characteristics of the Tempo-spatial Evolution of Xi’an Metropolitan Area. Urban Dev. Stud. 2021, 28, 34–39. [Google Scholar]
  22. Ge, Y.; Han, L.; Zhao, Y. Spatio-temporal analysis of urban expansion in Xi’an from 1984 to 2016. Shengtaixue Zazhi 2019, 38, 1491–1499. [Google Scholar]
  23. Xu, P.; Du, P. Remote Sensing Monitoring Analysis of City Expansion and Land Use Change in Xi’an. J. Beijing Union Univ. 2018, 32, 42–51. [Google Scholar]
  24. Xiao, H.; Xue, F.; Yang, Y. Relationships between construction land expansion and habitat quality change and coupling coordination in Xi’an. J. Arid Land Resour. Environ. 2023, 37, 56–64. [Google Scholar]
  25. Li, C.; Lou, N.; Yang, Y. Study on the relationship between spatio-temporal evolution of road network and urban spatial change in Xi’an. Sci. Surv. Mapp. 2021, 46, 173–180+200. [Google Scholar]
  26. Li, J.; Sun, S.; Zhao, D. Evaluation of spatial distribution of urban functions based on road network density—Taking Xi’an as an example. Res. Dev. 2023, 6, 97–105. [Google Scholar]
  27. Li, Y.; Chang, J.; Wang, Y. Land use simulation and prediction in the Yellow River Basin based on CA-Markov model. J. Northwest Agric. For. Univ. 2020, 48, 107–116. [Google Scholar]
  28. Gan, X.; Chen, J. Application of cellular automata model in urban expansion of Chengdu city. Remote Sens. Inf. 2022, 37, 116–122. [Google Scholar]
  29. Wang, B.; Liao, J.; Zhu, W. The weight of neighborhood setting of the PLUS model based on a historical scenario: A case study of land use simulation of urban agglomeration of the Golden Triangle of Southern Fujian in 2030. Acta Geogr. Sin. 2019, 39, 4284–4298. [Google Scholar]
  30. Ouyang, X.; He, Q.; Zhu, X. Simulation of impacts urban agglomeration land use change on ecosystem services value under multi-scenarios:Case study in Changesha-Zhuzhou-Xiangtan urban agglomeration. Econ. Geogr. 2020, 40, 93–102. [Google Scholar]
  31. Li, Y.; Lin, A.; Wu, H. Refined simulation of urban land use change with emphasis on spatial scale effect. Acta Geogr. Sin. 2022, 77, 2738–2756. [Google Scholar]
  32. Liu, X.; Li, X.; Wei, X. Study on Fusion Demarcation of Urban Development Boundary Based on MCR and CA Model: A Case Study of Xuzhou City. China Land Sci. 2020, 34, 8–17. [Google Scholar]
  33. Gao, X.; Song, Z.; Li, C. Landscape Pattern Optimization in Baiyangdian Basin Based on Landscape Ecological Risk Assessment. Shengtai Yu Nongcun Huanjing Xuebao 2023, 39, 174–183. [Google Scholar]
  34. Zhu, L.; Zhao, M.; Li, Y. The Space-time relationship between ecosystem service value and human activity intensity in Xi’an metropolitan area. Hengtai Yu Nongcun Huanjing Xuebao 2024, 40, 325–334. [Google Scholar]
  35. Li, T. Research on the Spatial Development of the New Zone Located in the Edge of Xi’an City Since the 1990s—Xi’an Economic-Technological Development Area. Master’s Thesis, Xi’an University of Architecture and Technology, Xi’an, China, 2015. [Google Scholar]
  36. Gao, X.; Yang, L.; Wanqing, L. Land use change and ecosystem service value measurement in Baiyangdian Basin under simulated multiple scenarios. Shengtai Xuebao 2021, 41, 7974–7988. [Google Scholar]
  37. Song, B.; Zhou, Z. Influence of road network on landscape pattern in Xi’an metropolitan zone. Jilin Daxue Xuebao, Diqiu Kexueban 2017, 47, 1521–1532. [Google Scholar]
  38. Li, C.; Wu, K.; Gao, X. Manufacturing industry agglomeration and spatial clustering: Evidence from Hebei Province, China. Environ. Dev. Sustain. 2020, 22, 2941–2965. [Google Scholar] [CrossRef]
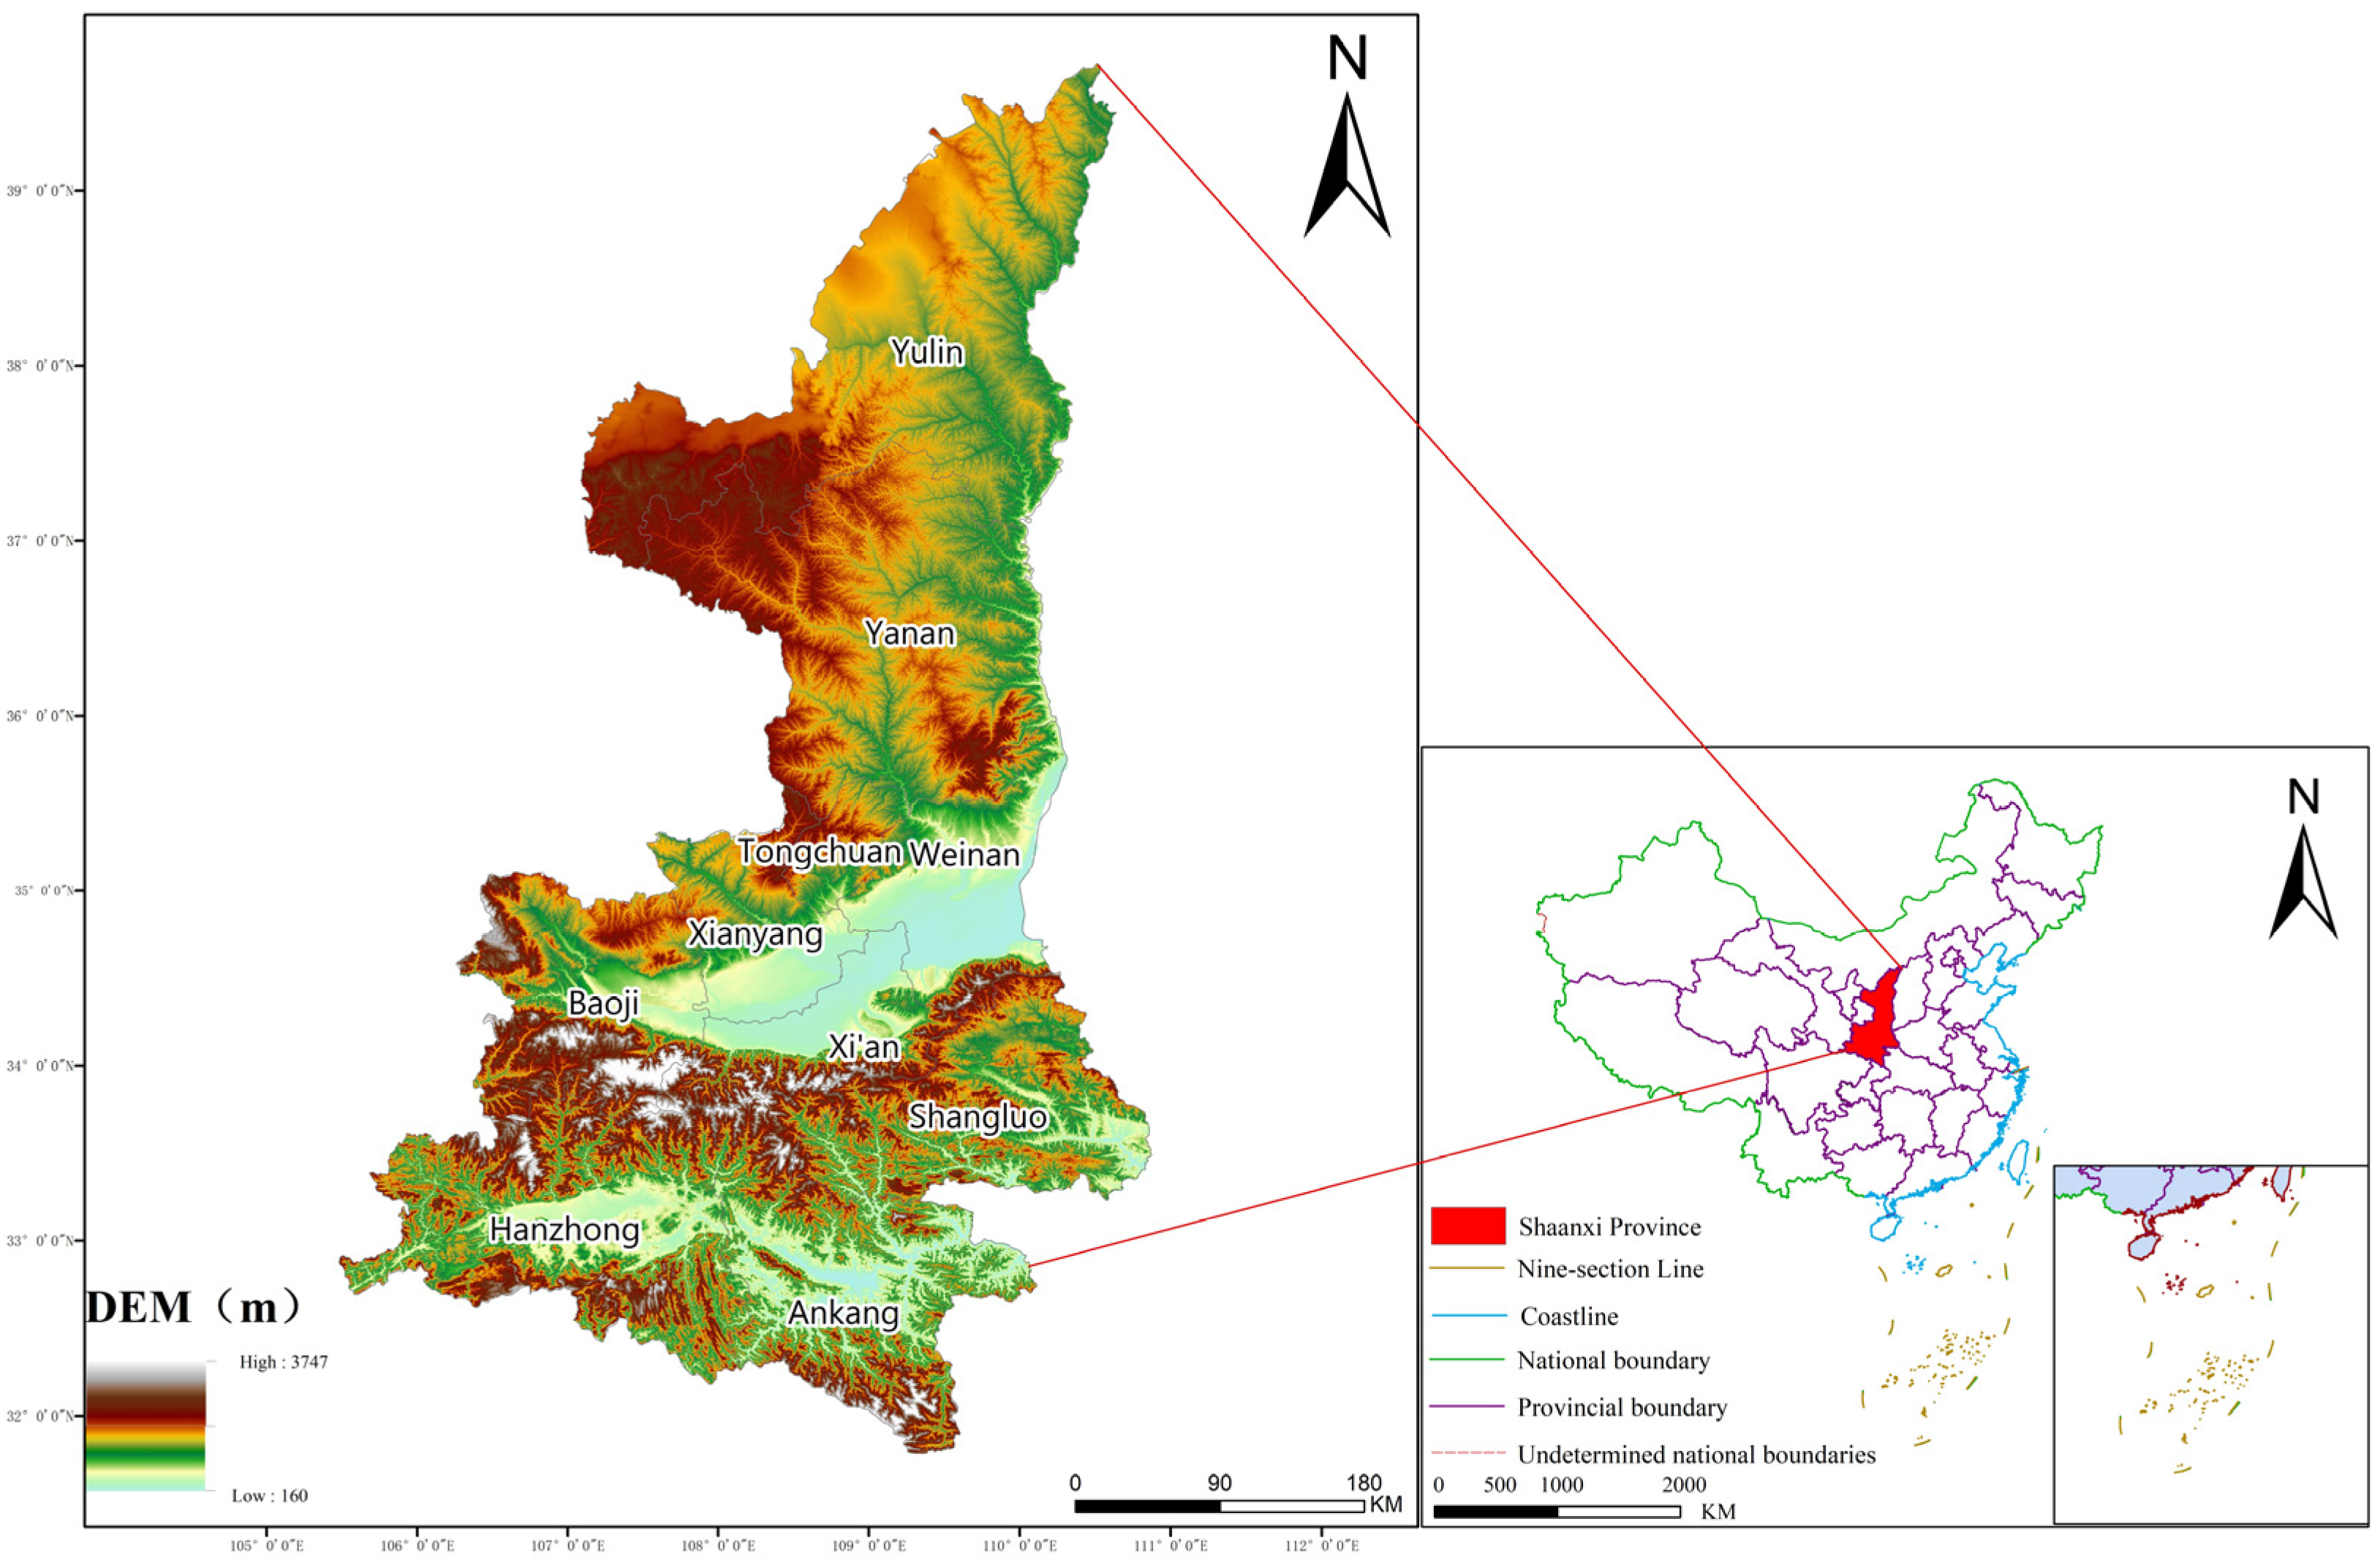
Figure 1. An overview map of the study area. The map was produced based on the standard map with review number GS(2023)2767, downloaded from the standard map service website of the State Administration of Surveying, Mapping and Geoinformation (SAGGI). The boundaries of the base map have not been modified. The same applies below.
Land 14 01637 g001
Figure 2. Expansion curve of Shaanxi Central City.
Land 14 01637 g002
Figure 3. Mechanisms influencing urban spatial evolution.
Land 14 01637 g003
Figure 4. Map of current land use in 2000, 2010, and 2020 and land use simulation for 2020.
Land 14 01637 g004
Figure 5. Land use simulation maps of the CA–Markov model and PLUS model in 2020.
Land 14 01637 g005
Figure 6. Land use simulation maps of the CA–Markov model and PLUS model in 2030.
Land 14 01637 g006
Table 1. Data sources.
Data TypeData NameResolutionData sources
Land Use DataLand use data in 2000, 2010, and 2020.1 kmResources and Environmental Science and Data Center, Chinese Academy of Sciences (https://www.resdc.cn, accessed on 1 July 2024)
Natural Environment DataElevation1 kmGeospatial Data Cloud
(https://www.gscloud.cn/, accessed on 19 July 2025)
Slope1 km
Socioeconomic DataPopulation Density1 kmGlobal Change Research Data Publishing & Repository (http://www.geodoi.ac.cn/, accessed on 18 July 2025)
GDP1 km
Proximity to Highway1 kmOpenStreetMap (https://www.openstreetmap.org/, accessed on 20 May 2025)
Proximity to Primary Road1 km
Proximity to Secondary Road1 km
Proximity to Tertiary Road1 km
Table 2. 2000–2010 land transfer matrix.
2010
2000Cultivated LandForest LandGrass LandWater BodyUrban and Rural, Industrial and Mining, Residential LandUnused LandGrand TotalTransfer-out Amount
Cultivated land69,873766744132348471,8671994
Forest land1246,431475241046,52998
Grass land12157976,75624344077,554798
Water body987131742521867125
Urban and rural, industrial and mining, residential land10303059030634
Unused land3181314646664846180
Grand total70,13647,79177,694190734764722205,7263199
Transfer volume2631360938165417563199
Table 3. Domain weight setting in 2020.
TypeCultivated LandForest LandGrass LandWater BodyUrban and Rural, Industrial and Mining, Residential LandUnused Land
Domain weight10.7460.0850.0230.2430.07
Table 4. Land conversion cost matrix setting.
TypeCultivated LandForest LandGrass LandWater BodyUrban and Rural, Industrial and Mining, Residential LandUnused Land
Cultivated land111111
Forest land111011
Grass land111111
Water body101101
Urban and rural, industrial and mining, residential land111011
Unused land111111
Table 5. Area expansion of Shaanxi Province Center from 2000 to 2020.
Parameters1990200020102020
Urban area (km2)4133817191243
Expansion area (km2)/−32338524
Expansion intensity (%)/−7.75%88.71%72.88%
Rate of expansion (km2/a)/−3.233.852.4
Table 6. Two-model simulation of land area comparison.
YearCultivated LandForest LandGrass LandWater BodyUrban and Rural, Industrial and Mining, Residential LandUnused Land
Actual land area(km2)200071,86346,59677,593187130724817
201070,14747,84777,736190934804693
202067,01548,03179,071172455864388
The CA–Markov model simulates the area of land type (km2)202061,31854,22174,434307774265252
The PLUS model simulates the area of land type (km2)202068,48049,07877,858190938394648
The CA–Markov model simulates the area of land type.(km2)203070,37546,69078,063166645754408
The PLUS model simulates the area of land type.(km2)203065,09249,16979,062168965584182
Disclaimer/Publisher’s Note: The statements, opinions and data contained in all publications are solely those of the individual author(s) and contributor(s) and not of MDPI and/or the editor(s). MDPI and/or the editor(s) disclaim responsibility for any injury to people or property resulting from any ideas, methods, instructions or products referred to in the content.