Abstract
Ecosystem services (ES) serve as a critical link between ecosystems and the sustainable development goals (SDGs). Exploring the relationship between ES and SDGs is of great significance for promoting regional sustainable development. This study proposes a conceptual framework to examine the interlinkages between ES and SDGs. First, the equivalent factor method is employed to estimate the county-level ES value in Jiangsu Province from 2005 to 2020. Second, the entropy-weighted TOPSIS model is used to assess SDG performance. Third, the coupling coordination degree model is applied to quantify the synergistic relationship between ES and SDGs, based on which regional typologies are constructed. Finally, a geographically and temporally weighted regression (GTWR) model is utilized to investigate the spatial–temporal impacts of various ecosystem service functions on SDGs. The results reveal that (1) over the past 15 years, the value of ES in Jiangsu Province has shown an overall upward trend, with a peak followed by a slight decline; (2) that the SDGs performance exhibited an increasing trend until 2015, after which it began to decline; (3) the coupling coordination degree between ES and SDGs has increased annually and that, based on the coupling results, four types of regions are identified: potential development zones, ecological deficit zones, priority improvement zones, and high-quality synergy zones; and (4) that the relationship between different ecosystem service functions and SDGs demonstrates significant regional heterogeneity. Future efforts should focus on enhancing provisioning services in counties within the Yi-Shu-Si River Basin, balancing economic development and ecological protection in the Yangtze River Basin, and improving cultural services in western counties of both the Yangtze River Basin and the Taihu Lake Basin. The findings offer insights for regional SDG strategies from the perspective of ES in Jiangsu Province.
1. Introduction
Ecosystem services (ES) bridge natural capital and human well-being, functioning as vital connectors between ecological and socio-economic systems [1]. These services are categorized into provisioning, regulating, supporting, and cultural services [2]. Since the UN Millennium Ecosystem Assessment (MA), ES have emerged as a critical framework for understanding human–nature relationships, significantly contributing to regional ecological security and sustainable development [3]. In 2015, the United Nations adopted the 2030 Agenda for Sustainable Development, which established 17 sustainable development goals (SDGs) and 169 associated targets [4], providing a clear roadmap for global sustainable development [5].
Research by the Intergovernmental Science-Policy Platform on Biodiversity and Ecosystem Services (IPBES) and the International Union for Conservation of Nature (IUCN) has emphasized that ecosystems form the foundation for implementing the SDGs, and that ES act as a key interface between ecological systems and SDGs [6,7]. ES thus play a foundational and pivotal role in achieving regional sustainability goals. Provisioning services supply essential material resources such as adequate food, raw materials, and water for achieving the SDGs [8]; regulating services buffer environmental risks and enhance the adaptive capacity of ecosystems to environmental changes for sustainable development [9,10]; and cultural services safeguard and enhance the sustainability of social infrastructure [11]. Therefore, linking ES with the SDGs contributes to realizing sustainable ecological management and promoting regional sustainable development.
In recent years, domestic and international research on the relationship between ES and SDGs has been relatively abundant. Some studies have explored the contributions of different ecological systems to SDGs, such as revealing how farmland ES contribute to SDGs [12] or investigating the driving factors behind sustainable forest ecosystem development [13]. Meanwhile, other scholars have examined the connections between mountain ES and SDGs, revealing that SDG 3 (Good Health and Well-being), SDG 11 (Sustainable Cities and Communities), SDG 13 (Climate Action), and SDG 15 (Life on Land) are the most closely linked indicators with mountain ecosystem services (MES) [14]. In terms of research scale, most existing studies have been conducted at the national, provincial [15], or municipal levels [16,17], which focus on macro-level assessments of sustainability. However, these higher-level scales often mask intra-regional disparities and are constrained by limitations in localized assessment frameworks, making them less reflective of actual developmental conditions. In contrast, the county level offers finer granularity and can more accurately capture local development dynamics [18].
Current research indicates that regional SDGs are closely linked to their natural geographical location [19]. The mismatch between areas with high ecosystem service values (ESVs) and those with high sustainable SDG scores exacerbates regional development imbalances. However, research on the complex relationship between ES and SDGs has not yet received sufficient attention, hindering progress towards achieving the SDGs. Amid the frequent occurrence of challenges such as global climate change, ecosystem degradation, and uneven economic growth [20], and compounded by geopolitical tensions and the impact of the COVID-19 pandemic, progress toward these goals has significantly slowed, with wide disparities among countries [21]. Some studies even suggest that achieving any of the 17 SDGs in full may be increasingly difficult [22]. Additionally, inherent trade-offs and synergies exist among the 17 goals themselves, making it difficult to achieve integrated and synergistic development of the SDGs [23].
To address this gap, this study aims to accurately examine the influence of ES on SDGs. Building on existing research [16,24], we focus on the four SDGs most directly related to ES—SDG2 (Zero Hunger), SDG6 (Clean Water and Sanitation), SDG11 (Sustainable Cities and Communities), and SDG15 (Life on Land). We investigate the coupling coordination between ES and SDGs and analyze how ES impact the progress of these goals at the county level. This study analyzes the coupling coordination relationship and spatial distribution patterns between ES and SDGs in Jiangsu Province from a county-level perspective, aiming to provide references and recommendations for Jiangsu’s sustainable development and to offer Chinese insights for achieving SDGs in globally imbalanced regions.
2. Materials and Methods
2.1. Overview of the Study Area
Jiangsu Province (30°45′–35°08′ N, 116°21′–121°56′ E) is located in the Yangtze River Delta region of eastern China, covering a total area of approximately 107,200 km2. As a highly developed coastal province, Jiangsu exhibits considerable regional heterogeneity in terms of economic development, ecological conservation, cultural traditions, and natural resource endowment—particularly evident at the county level [25]. According to 2024 statistics, Jiangsu’s gross regional product (GRP) reached CNY 13.7 trillion, ranking first nationwide in terms of annual increase and second in total volume. Rapid socioeconomic development has significantly reshaped both the ecological and economic structures of the province, thereby affecting ecosystem service (ES) capacities and progress toward the SDGs. Based on Jiangsu’s territorial spatial planning, the province is divided into four major hydrological and ecological zones: the Yishu River Basin, the Huaihe-Lixiahe River Basin, the Yangtze River Basin, and the Taihu Lake Basin. The geographic location and regional division of Jiangsu Province are shown in Figure 1.
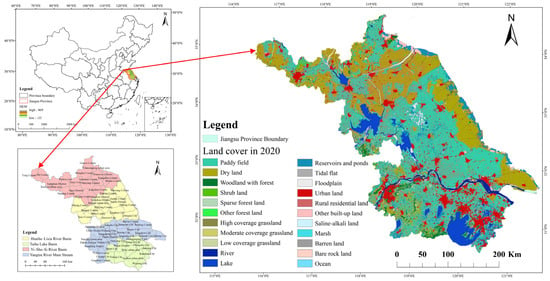
Figure 1.
Geographic location of the study area.
2.2. Data Sources
The primary data sources for this study were derived from land use data provided by the Institute of Geographic Sciences and Natural Resources Research, Chinese Academy of Sciences and regional statistical yearbooks. All spatial datasets employed the WGS_1984_Albers projected coordinate system. Data processing, analysis, and visualization were conducted using ArcGIS 10.8, Origin 2019, and Stata 17 software. Detailed data sources and corresponding time periods are summarized in Table 1.

Table 1.
Datasets and sources used in this study.
Socioeconomic indicators such as per capita green park area, total park area, green coverage ratio of built-up areas, industrial wastewater discharge, and centralized sewage treatment rate were collected from the Jiangsu Statistical Yearbook (2005, 2010, 2015, and 2020 editions).
2.3. Research Framework
This study first deconstructs the composition of ES and SDGs to select appropriate dimensions and indicators. Comprehensive evaluation is then conducted using the equivalent factor method and entropy-weighted TOPSIS model, followed by spatiotemporal analysis through coupling coordination degree (CCD) modeling and geographically and temporally weighted regression (GTWR). After rigorous data validation and preprocessing, Jiangsu Province is partitioned into distinct development zones based on CCD results to identify key ecological functions influencing regional sustainability. Finally, tailored policy recommendations for sustainable development are proposed at the county level. The general framework of this study is illustrated in Figure 2.
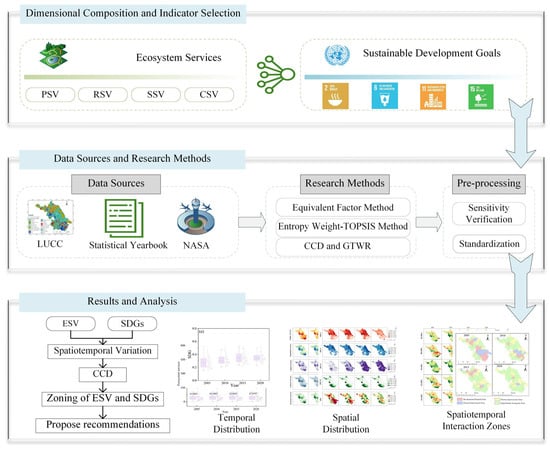
Figure 2.
Research framework of the study.
2.4. Research Methods
2.4.1. Methodology for Accounting for the Value of ESV
This study adopts and refines the ecosystem service valuation methodology proposed by Xie Gaodi et al. [26], adjusting the equivalent value factor table to better reflect regional characteristics. By utilizing standardized value equivalents per unit area, it eliminates the need for complex field surveys—making it particularly suitable for large-scale regional assessments. This approach ensures high comparability of results across different regions and time periods through its unified value equivalence system. Furthermore, its compatibility with land cover data enables efficient spatial ESV mapping when integrated with remote sensing data.
Jiangsu Province’s major crops include rice, wheat, and maize. Referring to the Jiangsu Statistical Yearbook and the Compilation of National Agricultural Product Cost and Benefit Data, we collected data on the yield per unit area, total planting area, and market prices of these three crops for the years 2005–2020. Price indices from different years were adjusted to constant 2020 values using Jiangsu’s consumer price index (CPI). Based on this, the equivalent supply coefficient for one standard unit in Jiangsu was calculated as 2213.10 CNY/hm2.
The economic value of the food production service (Ea) provided by the farmland ecosystem per unit area is calculated using the following formula:
where Ea is the economic value of food production services per hectare (CNY/hm2); mi is the planting area of crop i (hm2); pi is the national average price of crop i for a given year (CNY/t); qi is the yield per unit area of crop i (t/hm2); and M is the total planting area of all major crops (hm2). The total ecosystem service value (ESV) for Jiangsu Province is then calculated as follows:
where ESV is the total ecosystem service value; is the ecosystem service value coefficient for land use type j; and Aj is the area of land use type j.
Given that Jiangsu includes both paddy fields and dryland systems and encompasses diverse ecosystems—such as coastal tidal flats, the Lixiahe wetland, the Taihu Lake Basin, and hilly forest areas—using secondary land use classifications allows for a more precise representation of ecological heterogeneity. Accordingly, this study modifies the equivalent value coefficients based on the refined table by Xie Gaodi and adopts secondary land use categories for calculation.
Furthermore, the value equivalent factors were adjusted based on the ratio of Jiangsu’s average grain yield to the national average, resulting in a region-specific value coefficient table for unit area ES in Jiangsu Province. The final adjusted coefficients are presented in Table 2. As the ESV for construction land is assumed to be zero, it is excluded from the table.

Table 2.
ESV coefficients for different land use types in Jiangsu Province.
To verify the sensitivity of land use change to ESV, this study employs a sensitivity index to assess the reliability of the results, based on relevant references [27]. Specifically, the ESV coefficient for each land use type is adjusted by ±50%, and the corresponding changes in ESV are calculated using the following formula:
where ESVj and ESVi represent the total ESV and the adjusted ESV, respectively; VCik denotes the original coefficient for the kth land use type; and VCjk denotes the adjusted coefficient for the kth land use type.
CS quantifies how changes in specific land use and land cover change (LUCC) types affect total ESV [28]. Interpretation adheres to the following criteria: If CS > 1, ESV demonstrates high price elasticity to VC adjustments, indicating low reliability of results. If CS < 1, ESV is inelastic to VC changes, confirming high credibility of the model output.
Validation confirms that, during the study period, the CS for all land use types remained below 1, with a maximum value of 0.48. This indicates that ESV is inelastic to VC adjustments, demonstrating that the calculated VC in this study is empirically consistent with Jiangsu Province’s actual conditions. Furthermore, existing research [29,30] supports the idea that these values fall within a scientifically reasonable range.
2.4.2. SDGs Accounting Methodology
Grounded in existing scholarship [16], four SDGs were prioritized for their ecosystem service relevance: SDG 2 (Zero Hunger), SDG 6 (Clean Water and Sanitation), SDG 11 (Sustainable Cities and Communities), and SDG 15 (Life on Land). This selection addresses Jiangsu Province’s critical sustainability challenges through dual criteria—thematic relevance and scale appropriateness—while corresponding to its distinctive “water-field-urban-forest” ecosystem configuration.
Jiangsu is an agriculturally developed province, producing 5.5% of China’s grain with only 3.2% of the national arable land, making it one of the country’s major grain-producing provinces. However, recent urbanization has led to farmland conversion, threatening Jiangsu’s grain self-sufficiency [31]. Consequently, SDG2 (Zero Hunger) was prioritized as Jiangsu Province’s principal sustainability objective. This selection was operationalized through two theoretically grounded indicators: per capita cultivated land area, representing arable resource endowment and reflecting spatial constraints within ecological carrying capacity frameworks, and per capita grain output, quantifying food security provisioning while capturing agricultural productivity under technology-intensive regimes. The former metric characterizes fundamental biophysical supply constraints, whereas the latter integrates technological intensification effects within agro-ecosystem performance evaluations.
Although Jiangsu receives relatively abundant rainfall, the volume of surface water retained is insufficient; its per capita water resources amount to only one-fifth of the national average [32], and water quality issues are prominent. Thus, SDG6 is chosen to represent sustainable water management. Indicators include industrial wastewater discharge to represent anthropogenic pressure on aquatic ecosystems, precipitation as a driver of natural system regulation, and total water resources to measure the ultimate status of sustainable water security. Rapid urban expansion in Jiangsu has led to continuous reductions in ecological land such as forests, grasslands, rivers, and lakes [33].
According to official indicators under SDG 11.6, the average PM 2.5 concentration is used as the core urban environmental health metric; per capita park green space area and green coverage ratio of built-up areas reflect accessibility to ecological welfare and urban green patterns; while per capita road length measures regional connectivity. Forested land accounts for a relatively small proportion of Jiangsu’s area, yet each 1% change represents significant ecological implications [34]. SDG 15.1.1 mandates monitoring the “proportion of forest area to total land area,” while SDG 15.2 focuses on land degradation monitoring. Excessive fertilizer use is a major contributor to nonpoint source pollution in cropland, highlighting the intensity of anthropogenic pressure and ecosystem vulnerability. Together, these four goals form a closed-loop system of “Production (SDG2)—Resources (SDG6)—Habitat (SDG11)—Ecology (SDG15),” reflecting the typical contradictions in Jiangsu related to farmland protection, dense water networks, urban expansion, and ecological fragility.
Within Jiangsu Province’s context, SDG 3 (Good Health and Well-being) and SDG 7 (Affordable and Clean Energy) do not represent primary constraints. Furthermore, SDG 4 (Quality Education), SDG 5 (Gender Equality), SDG 9 (Industry, Innovation and Infrastructure), SDG 10 (Reduced Inequalities), and SDG 16 (Peace, Justice and Strong Institutions) lack direct linkages to ecosystem services. Although Jiangsu has coastal areas, this study operates at the county scale, where marine ecosystems do not cover all jurisdictions. Consequently, SDG 14 (Life Below Water) falls outside this research scope.
Considering Jiangsu’s regional characteristics and data availability, a customized SDG indicator system for Jiangsu Province was constructed (see Table 3). To eliminate discrepancies between indicators, raw data were standardized using the range method. Indicator weights within each SDG were calculated using the entropy weighting method. The entropy weighting method objectively quantifies SDG indicator weights by measuring intrinsic information entropy, eliminating subjective bias in human-determined weighting. Additionally, this method mathematically verifies indicator discrimination efficacy through entropy values, ensuring assessments scientifically expose true sustainability bottlenecks. Given equal importance among the four selected SDGs for sustainable development, the final weights for each SDG were computed using equal weighting.

Table 3.
Indicators and data sources for selected SDGs.
The TOPSIS model is employed to calculate the SDGs’ composite index. As a widely used multi-criteria decision-making method, TOPSIS has demonstrated excellent performance in the fields of environmental assessment, risk management, and resource allocation [35]. By quantifying the Euclidean distances between evaluation units and both the ideal solution and negative ideal solution, the method standardizes heterogeneous indicators into a normalized closeness coefficient (Ci [0, 1]). This approach inherently avoids the linear compensation assumption embedded in traditional weighted-sum methods [36]. Furthermore, the model flexibly integrates subjective–objective weighting methods [37]. This ensures results balance policy compliance with statistical rigor [38]. The calculation process is outlined as follows:
- (1)
- Construction of the Weighted Normalized Decision Matrix
The indicator weights Wj previously determined by the entropy weight method, are incorporated into the normalized evaluation matrix to obtain the weighted normalized decision matrix Aij, as follows:
where aij is the normalized value of the jth indicator for the ith region and Aij represents the weighted normalized value of each indicator.
- (2)
- Determination of the Positive Ideal Solution and Negative Ideal Solution.
- (3)
- Calculation of Weighted Euclidean Distances
The Euclidean distances from each evaluation unit to the PIS D+ and NIS D− are computed as follows:
where D+ and D− represent the distances of the ith evaluation object to the ideal and negative ideal solutions, respectively.
- (4)
- Calculation of Closeness Coefficient
The relative closeness Ci of each evaluation unit to the ideal solution is calculated as follows:
- (5)
- Calculation of the SDG Index
2.4.3. Methodology for Quantifying Interrelationships Between ESV and Sustainable SDGs
The CCD model is employed to evaluate the level of coordinated development between systems, effectively reflecting the degree of interaction and synchronization between them [39]. Originating from physical systems theory, CCD conceptualizes bidirectional influence mechanisms where multiple systems co-evolve through mutual interactions. Its core components include coupling degree measuring interaction magnitude and coordination degree capturing evolutionary progression from disordered states toward synergistic order [18]. In this study, the CCD model is used to assess the interrelationship between ecosystem service (ES) values and SDGs in Jiangsu Province. This approach not only quantifies the strength of coupling between ESV and SDGs but also indicates whether the relationship is synergistic or mutually constraining. The calculation formulas are as follows:
In the above formulas, C denotes the coupling degree, D represents the CCD, and Ri and Di refer to the ESV and the sustainable development goal index, respectively. Given the equivalent significance of ES and SDGs in coupling coordination analysis, equivalent weights were assigned to parameters α and β, specifically α = β = 0.5. This configuration ensures balanced consideration of both dimensions in the synergistic assessment framework [24]. To more accurately reflect the level of coupling coordination between ES and SDGs, the value of D is categorized into six distinct levels following existing studies [16,24], as shown in Table 4.

Table 4.
Classification criteria for CCD.
3. Results
3.1. Spatiotemporal Variation of ESV
Figure 3 illustrates the overall changing trend of eleven types of ES in Jiangsu Province from 2005 to 2020. The values presented in the figure represent the total ESV of Jiangsu Province, measured in CNY 100 million.
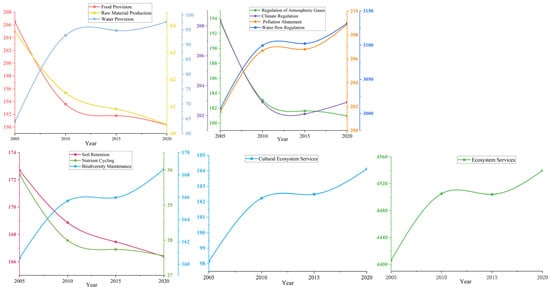
Figure 3.
Overall trend of ESV.
The results indicate that the total ESV in Jiangsu Province exhibited an S-shaped fluctuating upward trend from 2005 to 2020. The most significant increase occurred between 2005 and 2010, followed by a slight decline from 2010 to 2015, and a subsequent increase from 2015 to 2020, reaching its peak in 2015. Among the eleven ecosystem service types, water supply, environmental purification, hydrological regulation, biodiversity, and cultural services showed trends similar to the overall ESV, with S-shaped fluctuations and overall growth. Notably, hydrological regulation had the highest value, reaching CNY 313.19 billion in 2020, while water supply experienced the largest increase, with a growth rate of 52.68%.
In contrast, food provision, raw material supply, gas regulation, climate regulation, soil retention, and nutrient cycling generally showed declining trends. Among these, food provision, raw material supply, and soil retention decreased linearly, reaching their lowest levels in 2020. Gas regulation, climate regulation, and nutrient cycling reached their lowest points in 2015, followed by a slight recovery from 2015 to 2020. Based on the above trends, the eleven types of ES in Jiangsu Province demonstrate partial consistency in their trajectories. Therefore, for subsequent analyses, these services are categorized into four primary functional groups: provisioning services, regulating services, supporting services, and cultural services.
To identify spatial differences in ES across counties, the ESV for each of the 72 counties and districts in Jiangsu Province were calculated. As shown in Figure 4, the values represent county-level averages.
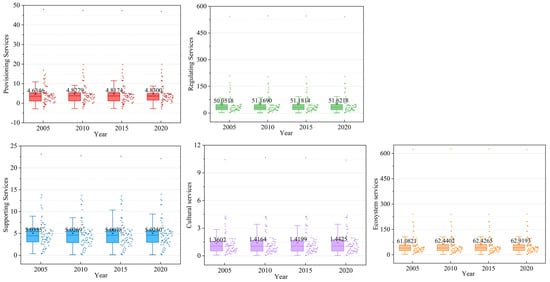
Figure 4.
Trends in county-level ESV.
The scatter plots reveal substantial spatial disparities in ES among different counties. Provisioning services, regulating services, cultural services, and total ES generally show a stable upward trend over time. In contrast, supporting services exhibited a decline from 2005 to 2015, reaching a low of 5.0078 in 2015, followed by a rebound between 2015 and 2020. The boxplots further illustrate the distribution characteristics of different service categories. The mean values of provisioning services, regulating services, and total ES are close to the upper quartile, indicating significant variability among counties. In contrast, the supporting services and cultural services have means closer to the median, with relatively wider boxes, suggesting less inter-county variation for these service types.
Notably, the outlier values in the plots correspond to Wujiang District, which contains Lake Taihu, the largest freshwater lake in Jiangsu Province. The presence of this major ecological feature contributes to significantly higher ESV in this region compared with others.
Figure 5 depicts the spatial patterns of provisioning services, regulating services, supporting services, cultural services, and overall ESV across Jiangsu Province in 2005, 2010, 2015, and 2020. Jiangsu features diverse land-use types and pronounced inter-county differences. From 2005 to 2020, provisioning services showed a gradual decline, with a particularly notable decrease in central Jiangsu. Generally, higher provisioning service values were observed in the western and southern regions, while persistent low-value zones appeared in the northeastern areas.
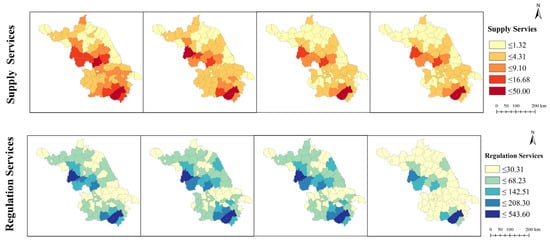
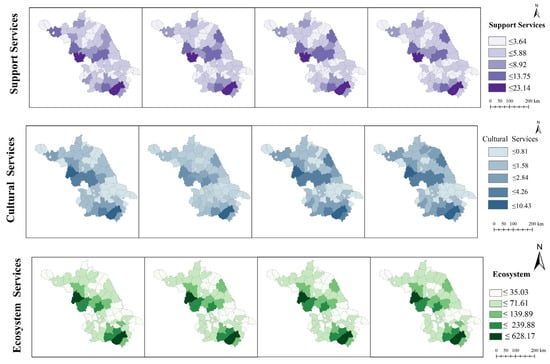
Figure 5.
Spatial distribution of county-level ESV in different years.
Regulating services during 2005–2015 were relatively low in central Jiangsu but higher in northern and southern regions. However, by 2020, many counties experienced a sharp drop in regulating services to below CNY 3.031 billion. Supporting services exhibited relatively small north–south disparities, though areas along the Yangtze River had comparatively lower values. Cultural services were higher in southern and western Jiangsu during 2005–2010, but increased in northern and southwestern regions during 2015–2020.
Overall, ESV demonstrated significant north–south spatial heterogeneity, with high values concentrated in southern Suzhou and northern Suqian and western Huai’an counties. The most substantial spatial variation from 2005 to 2020 occurred mainly in Lianyungang City.
3.2. Spatiotemporal Variation of SDGs Indicators
Figure 6 illustrates the temporal changes in SDG indicators across Jiangsu Province. Panel (a) shows SDG2 exhibiting an inverted U-shaped trend, gradually increasing from 2005 to 2015 to reach a peak value of 0.3323, then gradually declining between 2015 and 2020. The inter-county disparity was greatest in 2015 and smallest in 2020. Panel (b) indicates a similar inverted U-shaped trend for SDG6, with a maximum value of 0.4136 in 2015, followed by a decline through 2020. Panel (c) shows SDG11 increasing steadily year by year, reaching the highest value of 0.5910 in 2020. Panel (d) reveals generally low values for SDG15, with the highest point at 0.2214 in 2005. Between 2010 and 2015, SDG15 remained stable below 0.2000. Panel (e) presents the composite SDGs index, which increased from 0.2770 in 2005 to 0.3538 in 2015, before slightly decreasing to 0.3516 in 2020. Boxplots and scatter plots indicate that the variability in sustainable development levels among the 72 counties of Jiangsu Province has gradually diminished over time.
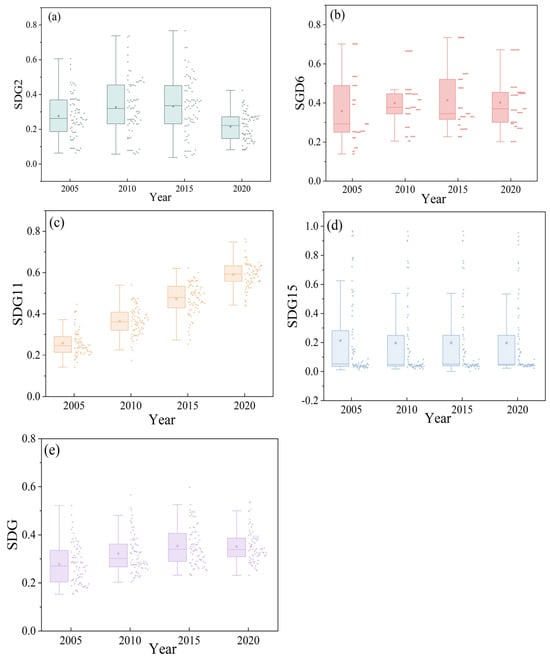
Figure 6.
Trends in SDG indicators.
Figure 7 illustrates the spatial distribution of SDG levels and their component indicators (SDG2, SDG6, SDG11, and SDG15) across Jiangsu Province in 2005, 2010, 2015, and 2020. For SDG2, higher values are observed in northern Jiangsu, particularly in Sihong County, Xuyi County, Sheyang County, and Dafeng County. The map indicates that SDG2 experienced substantial changes between 2015 and 2020, especially in these regions. SDG6 maintains consistently high values across most counties, with relatively low spatial dispersion. The differences between counties gradually narrowed over time, indicating more equitable progress in water-related SDGs. SDG11 exhibits greater spatial heterogeneity, with higher levels concentrated in Nanjing and its surrounding counties. By 2020, the inter-county differences in SDG11 had also begun to decrease.
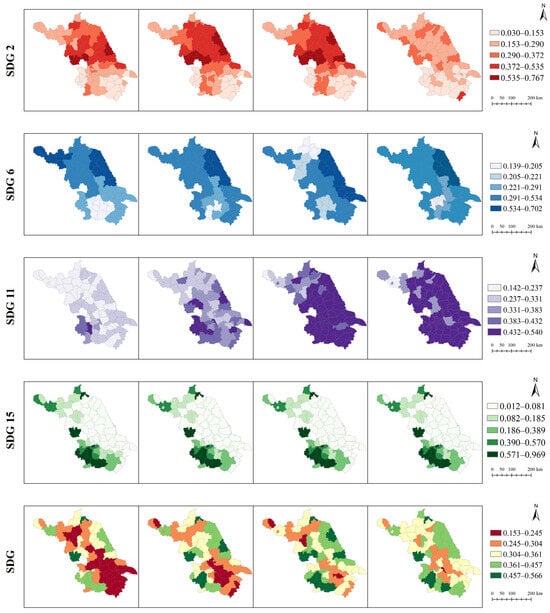
Figure 7.
Spatial distribution of county-level SDG levels across time periods.
In contrast, SDG15 showed minimal changes across the four time points, with high-value areas primarily concentrated in northern and southwestern Jiangsu. Other regions remained at uniformly low levels, indicating limited variation in land ecosystem sustainability. The composite SDG index demonstrated significant spatial evolution from 2005 to 2020, showing an overall upward trend. However, the improvements were distributed in a scattered, point-based pattern, without a clear spatially contiguous structure, suggesting a lack of spatial regularity in SDG progress at the county level.
3.3. Coupling Coordination Between ESV and SDGs
Figure 8 illustrates the evolution of the CCD between ES and SDGs across Jiangsu Province from 2005 to 2020. As shown by the scatter plots and boxplots, the CCD exhibited a clear upward trend over time, indicating improving synergy between ES and SDGs. By 2020, the average CCD across counties reached its highest value of 0.3915. Furthermore, the proximity between the mean and median values of the coordination index suggests that inter-county disparities were relatively balanced, reflecting a more equitable progression in the alignment between ecological functions and sustainable development across Jiangsu Province.
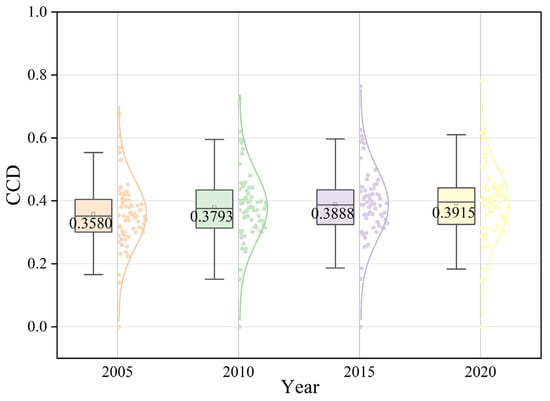
Figure 8.
Temporal trends in the CCD between ES and SDGs.
Figure 9 presents the spatial distribution of the CCD between different dimensions of ESV and SDGs in Jiangsu Province from 2005 to 2020. The coupling coordination between provisioning services and SDGs was in a state of severe imbalance in Qidong City and moderate imbalance in Haimen City during the observed period. However, several regions in central-northern and southern Jiangsu exhibited relatively good coordination. Over the 15-year span, the coordination between provisioning services and SDGs gradually improved. In contrast, regulating services showed generally poor coordination with SDGs. From 2005 to 2015, most counties were in a state of mild imbalance, although some counties showed improvement over time, transitioning into a state of bare coordination. Supporting services exhibited relatively high levels of coordination with SDGs.
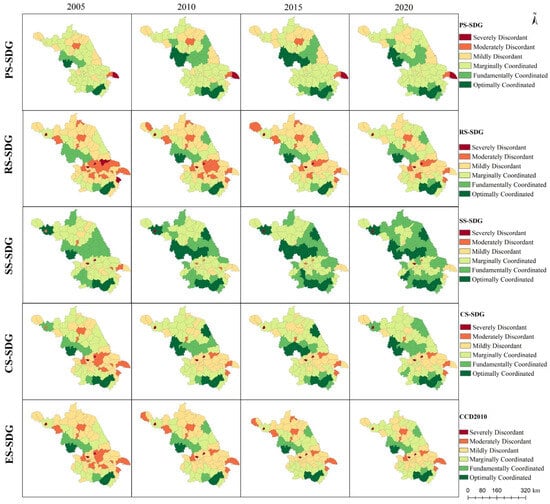
Figure 9.
Spatial distribution of the coupling coordination relationship between ES and SDG levels.
However, certain urban centers, such as Xuzhou, Yangzhou, and Taizhou, displayed notable uncoordinated states. In most other regions, the relationship remained coordinated, with many counties shifting from bare coordination to basic coordination between 2005 and 2020. Cultural services in central Jiangsu were mostly in a mildly uncoordinated state. However, uncoordinated areas in northern Jiangsu became increasingly scarce over time. From 2005 to 2010, the overall coordination between ES and SDGs across Jiangsu Province was relatively poor, particularly along the Yangtze River corridor and in the northern region. However, during 2015–2020, the number of uncoordinated areas noticeably decreased, and mild imbalances in northern Jiangsu gradually transitioned to bare coordination. Notably, Wujiang District and Xuyi County consistently maintained a state of good coordination throughout the entire study period.
3.4. Impact Analysis of ES Impact on SDGs
To accurately identify the influence of individual ecosystem service functions on SDGs in Jiangsu Province, we employed the GTWR plugin developed by Huang, B et al. [40] within ArcGIS 10.6. GTWR is a local linear regression technique that simultaneously accounts for spatial and temporal non-stationarity [41], overcoming the limitations of geographically weighted regression (GWR) imposed by cross-sectional data constraints [42]. The GTWR plugin enabled the computation and analysis of regression relationships between four ecosystem service categories—provisioning, regulating, supporting, and cultural services—and SDG metrics. In theory, there should be no multicollinearity between the factors themselves or in their impact on the SDGs. Multicollinearity checks for strong correlations between indicators, and empirical verification through data analysis in SPSS 24.0 confirms that no strong correlations exist between the indicators and the SDGs either. Table 5 presents key GTWR parameters, where optimal bandwidth selection was determined by minimizing the corrected Akaike information criterion (AICc) [43]. In the spatial analysis, spatial weights were defined using a kernel function. The fixed Gaussian kernel was employed, with weights decaying exponentially with distance [44]. The model achieved an adjusted R2 of 0.86, indicating strong explanatory power.

Table 5.
Related parameters of GTWR.
The regression results are visualized in Figure 10. Legend values denote Pearson correlation coefficients between individual ES functions and SDGs. Positive/negative values indicate positive/negative correlations, respectively, with absolute magnitude signifying association strength: higher absolute values denote stronger correlations, lower values weaker relationships.
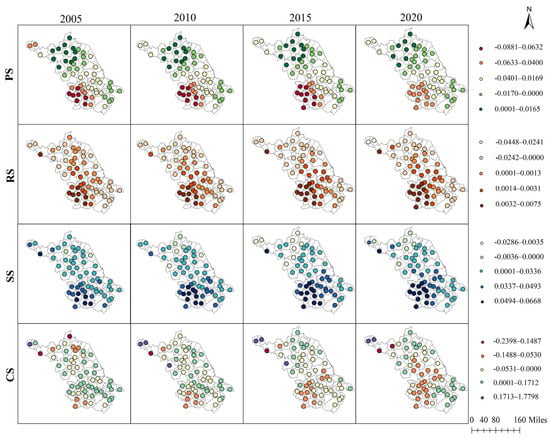
Figure 10.
Impact analysis of different ES functions and their impacts on the SDGs.
The analytical outcomes, presented graphically, reveal that ecological deficit areas exhibit positive correlations with both regulating and supporting services, while also demonstrating positive correlations with provisioning and cultural services. Consequently, county-level administrative units proximate to the Yangtze River Basin should prioritize enhancing regulating and supporting services to foster synergistic interactions between ESV and SDG objectives. Our results further demonstrate pronounced regional heterogeneity in the relationships between ecosystem service dimensions and SDGs across Jiangsu Province.
In the provisioning services dimension, most counties exhibit negative correlations with SDGs, with isolated positive correlations confined to specific counties within the Yishu-Si River Basin; notably, the spatial extent of these positive correlations progressively diminished from 2005 to 2020. Regarding regulating services, positive correlations predominate in most counties. However, negative correlations are observed in select counties of the Yishu-Si River Basin, as well as in certain areas along the Yangtze River and Tai Lake, whereas the strongest positive correlations are concentrated in the western sector of the Yangtze River Basin, particularly within the districts of Nanjing. Supporting services display near-universal positive correlations with SDGs across counties. While the number of counties exhibiting negative correlations increased between 2005 and 2015, only five counties within the Yishu-Si River Basin retained negative correlations by 2020. The relationship for cultural services presents greater complexity: a higher prevalence of positive correlations was observed from 2005 to 2010, followed by a gradual increase in counties displaying negative correlations; ultimately, negative correlations became predominant during the 2015–2020 period.
4. Discussion
4.1. ES, SDGs, and Their Coupling Coordination Relationship
The results show that, from 2005 to 2020, ES in Jiangsu Province exhibited a fluctuating upward trend, consistent with the findings of Xie et al. [45]. Among all services, hydrological regulation contributed the most, primarily due to the province’s extensive water surface area and the significant achievements in water environment governance across the Taihu Lake Basin, the Yangtze River corridor, and Grand Canal zones during the past decade.
Meanwhile, rapid economic development—particularly in the southern Taihu region—has led to the conversion of ecological land, precipitating marked declines across multiple ecosystem service categories. These encompass provisioning services, notably food production and raw material supply; regulating services, specifically climate regulation and gas regulation; and supporting services, particularly nutrient cycling and soil retention. This finding is corroborated by Gao et al.’s study [44], which demonstrates that anthropogenic disturbances significantly alter land use composition, triggering rapid degradation of regulating and supporting services provided by ecological lands. The most substantial decrease occurred between 2005 and 2010. However, since 2012, in response to China’s Ecological Civilization strategy, the declining trend has been mitigated, with climate regulation services even showing a slight rebound between 2015 and 2020. Ding et al. [46] document that enhanced riparian regulation in Jiangsu Province has significantly improved water–soil conservation capacity in recent years. Concurrently, Shi et al. [47] demonstrate that, since 2015, while built-up areas underwent rapid expansion, progressive increases in urban woodland and grassland coverage have contributed to measurable environmental enhancement. Within the Huai River–Lixia River Basin, stringent ecological conservation policies manifested through designated ecological economic demonstration zones in Sihong and Hongze Counties have preserved comparatively high ESV, consistent with findings reported by Ye et al. [48].
Conversely, Lianyungang City, as a key coastal development area, has experienced rapid port expansion and land reclamation, leading to greater ES value fluctuations compared with other areas. Notably, Wujiang District, with abundant water resources, consistently recorded the highest ESV, aligning with the results of Cai et al. [49].
From 2005 to 2015, intensive land use, advances in agricultural technology, and high-standard farmland construction significantly improved grain productivity and supply capacity, contributing to a steady increase in SDG2 performance. However, between 2015 and 2020, the decline in cultivated land area undermined the sustainability of agricultural production. Concurrently, strategic ecological restoration initiatives, including Jianghuai lake rehabilitation and wetland conservation, enhanced aquatic networks, improving water purification capacity and resource availability, thus advancing SDG6. Jiangsu’s persistent urbanization [50] was accompanied by major infrastructure upgrades and rising urban green space coverage, thereby improving the livability of urban environments and contributing to SDG11. While SDG 11 demonstrates overall progressive advancement, its spatial connectivity dimension reveals a critical paradox: transportation network improvements enhance human mobility efficiency at the hidden cost of ecological connectivity degradation. Road infrastructure fragments wildlife corridors, obstructs species migration, and exacerbates habitat fragmentation [51]. This conflict exposes an inherent tension between SDG 11’s dual objectives of ‘infrastructure optimization’ and ‘environmental sustainability.’ To reconcile this dichotomy, scholars advocate integrating ecological connectivity and wildlife requirements into transportation planning [52], prioritizing rehabilitation sites that maximize habitat connectivity within ecological networks during road upgrades [53]. Such spatial governance innovations enable co-synergistic advancement of human settlements and environmental conservation.
However, SDG15 remained persistently low, primarily due to urban land expansion, which encroached on forests and grasslands, leading to habitat fragmentation. Overall, the province’s SDGs performance followed a rise–fall pattern, with improvement from 2005 to 2015 followed by a slight decline thereafter.
Counties such as Sihong, Xuyi, and Wujiang displayed high values for both ES and SDG performance, maintaining a high-level coupling coordination throughout the study period. In contrast, Qidong and Haimen exhibited the lowest coupling coordination levels in provisioning services. Notably, Qilong Town in Qidong and Haiyong Town in Haimen are administratively isolated enclaves on Chongming Island. Constrained by ecological protection policies and administrative fragmentation, a large proportion of arable land in these towns has been converted to ecological land or low-intensity use, weakening agricultural provisioning capacity.
Regulating services demonstrated generally low but improving coordination with SDGs. Environmental issues along the Yangtze River counties, such as water pollution, were prominent; however, with the implementation of ecological buffer zones and water system restoration efforts, the situation has gradually improved. Due to rigid ecological land use controls, supporting services such as biodiversity conservation were relatively stable and exhibited a high degree of coordination with SDGs. However, cultural services, particularly in Yangtze-adjacent counties, had lower coordination with SDGs, reflecting lower SDGs scores in these areas.
Overall, coordination between ESV and SDGs has shown signs of improvement in northern Jiangsu, where areas previously categorized as mildly uncoordinated have transitioned to barely coordinated states. Wujiang District and Xuyi County have consistently demonstrated strong coordination, serving as exemplary cases of integrated ecological–socioeconomic development.
4.2. Zoning of ES and SDGs
ES are key drivers for achieving the SDGs [54]. Jiangsu Province exhibits the following four characteristic regional typologies through the integrated assessment of ecosystem service value and sustainable development indices: the potential development zone, distinguished by elevated ecosystem service value yet suboptimal sustainable development performance, harbors significant underutilized ecological capital that is essential for green industrial transitions; concurrently, the ecological deficit zone manifests acute sustainability constraints stemming from compromised ecosystem functionality alongside advanced socioeconomic metrics, necessitating immediate restorative interventions to reconcile ecological deficits; regions experiencing concurrent deficiencies in both ecological and developmental dimensions constitute the priority improvement zone, representing critical intervention targets for synergistic enhancement. Finally, the high-quality synergy zone demonstrates exemplary harmonization of robust ecological integrity with high development achievement, establishing self-reinforcing cycles where environmental stewardship catalyzes socioeconomic advancement. This spatial configuration provides diagnostic frameworks for context-specific sustainability governance.
Figure 11 illustrates the spatial zoning of Jiangsu Province for the years 2005, 2010, 2015, and 2020, based on ESV and SDG levels. In 2005, cities in northern Jiangsu, such as Pizhou, Siyang, Shuyang, Baoying, Gaoyou, Xinghua, and some counties in southern Jiangsu, were identified as potential development zones. From 2010 to 2020, the extent of these zones gradually diminished, with only Baoying County remaining in 2020, while others transitioned into high-quality synergy zones. In 2005, the priority improvement zones were mainly located along the Yangtze River, covering southern Yangzhou, central and southern Taizhou, parts of Nantong, Taicang, and northern counties such as Guanyun and Guannan. During 2010 and 2015, most of these areas evolved into high-quality synergy zones, while Pei County shifted from an ecological deficit zone to a priority improvement zone. By 2020, most of these areas, with the exception of Jiaxing, Jingjiang, Yangzhong, and urban Taizhou, had transitioned into ecological deficit zones or high-quality synergy zones, such as Guanyun County.
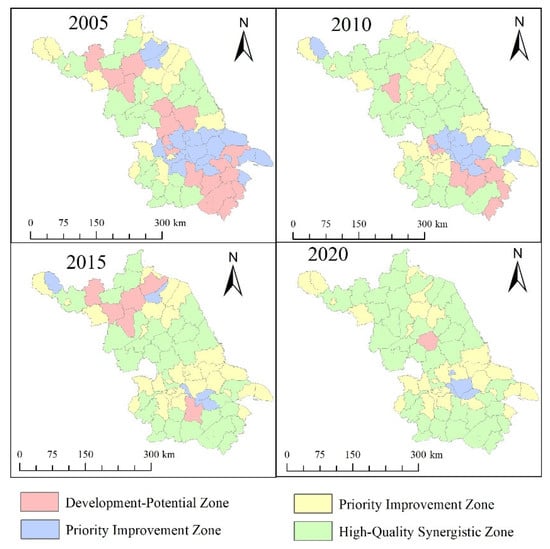
Figure 11.
Zoning of ES and SDGs in Jiangsu Province.
Since 2005, ecological deficit zones have expanded. Some of the original zones remained unchanged, while others evolved into high-quality synergy zones. A significant number of counties shifted from priority improvement to ecological deficit Zones. Overall, high-quality synergy zones have progressively increased from 2005 to 2020, indicating a growing synergy between ES and SDGs in Jiangsu Province.
The priority improvement zones are primarily concentrated in the Taihu Lake Basin, a region historically burdened with highly intensive industrial development and dense urban settlements. Before 2005, the basin faced an imbalanced state of “high economic growth and high ecological stress.” Between 2005 and 2020, intensive governance efforts were implemented, significantly enhancing the supply capacity of ecological products and laying a stronger foundation for SDGs. However, the area remains ecologically vulnerable. Furthermore, the trajectory of spatial transitions shows that priority improvement zones often evolve first into ecological deficit zones, indicating that SDG achievements outpace improvements in ES.
In 2005, the potential development zones were mainly located in the Taihu Lake Basin, central Yi-Shu-Si River Basin, and south-central Huai River–Lixiahe River Basin. Since 2010, Jiangsu Province has launched extensive restoration initiatives, including lakeside forest rehabilitation, wetland conservation, land consolidation, and pollution remediation in the Taihu Lake Basin. These efforts have gradually transformed these areas into high-quality synergy zones.
4.3. Policy Recommendations
From the perspective of ecosystem service–SDG zonation, the Yangtze River Basin includes many ecological deficit areas, indicating that, while promoting economic growth, ecological protection and restoration must be prioritized. To enhance the ESV of counties in this region, special focus should be placed on improving regulation, support, and cultural services. In particular, Baoying County should prioritize improving its SDG performance by optimizing housing and transportation infrastructure, enhancing wetland and ecosystem protection, building biodiversity corridors, and implementing measures for non-point source pollution control and soil remediation.
From the perspective of river basin divisions, the contributions of ecosystem service functions to SDGs vary across regions. For the Yi-Shu-Si River Basin, the focus should be on enhancing provisioning services across all cities. This includes optimizing surface water allocation, leveraging the “Yi River Diversion to Huai River” project to redistribute surplus flood-season water, and promoting dynamic control technologies for flood-level limits to improve the storage capacity of Nansi Lake and Luoma Lake. It is essential to strictly enforce the arable land redline, ensuring both quantity and quality of cultivated land. Where feasible, integrated ecological agriculture, such as rice–fish co-culture and under-forest economies, should be promoted to increase land productivity. For the western counties of the Yangtze River Basin and Taihu Lake Basin, the focus should be on improving regulating and supporting services. This includes increasing flood retention capacity, improving industrial wastewater treatment rates, and expanding green coverage in Nanjing to mitigate urban heat island effects. In the southwestern hilly regions, efforts should be made to enhance forest quality through targeted afforestation initiatives. Additionally, it is important to strengthen aquatic biodiversity conservation, including the construction of protected areas for aquatic species and the establishment of monitoring networks for aquatic biological resources. For the western counties of the Yangtze River Basin and Taihu Lake Basin (in terms of a cultural services focus), there should be a prioritization of the development of cultural services, including advancing cultural tourism, promoting geographical indication ecological products, and supporting intangible cultural heritage preservation. Conducting gross ecosystem product assessments for cultural services can help guide the allocation of eco-compensation funds, ensuring the financial return to local communities for their role in conservation.
These targeted strategies, differentiated by spatial and functional characteristics, are essential for achieving high-quality, regionally coordinated ecological and sustainable development in Jiangsu Province.
4.4. Prospects
This study estimates ESV based on land use types. Given the relatively small inter-annual variations in land use in Jiangsu Province, using data at five-year intervals is reasonable. However, such a temporal resolution may obscure the annual dynamics of ESV and SDG indicators. Future research could incorporate annual or higher-frequency data to capture more detailed inter-annual variations, thereby improving the timeliness and accuracy of the analysis. Moreover, this study primarily provides a descriptive analysis based on historical and current data without involving future scenario simulations. Subsequent work could integrate scenario forecasting and dynamic modeling approaches to quantitatively simulate the evolution of ESV and SDGs in Jiangsu Province. This would offer scientific support for formulating long-term adaptive management strategies and policies.
5. Conclusions
ES constitute a critical foundation for regional sustainable development. This study systematically assessed the coupling and coordination relationship between ES and SDGs based on ecosystem service valuation and SDG index calculation. Further spatial correlation characteristics between provisioning services, supporting services, regulating services, cultural services, and SDGs are also explored.
The main conclusions are as follows: From 2005 to 2020, provisioning services, regulating services, and cultural services across Jiangsu’s counties generally showed an increasing trend, while supporting services declined, leading to an overall increase in total ESV. The composite index of SDGs exhibited a trend of rising first and then declining, peaking in 2015, reflecting a phase-specific development pattern. The coupling coordination between ES and SDGs gradually improved. Particularly in the Yangtze River Basin, it evolved from a key improvement zone to an ecological deficit zone and then transformed into a high-quality coordinated zone. Supporting services were significantly positively correlated with SDGs, whereas provisioning and regulating services were mainly negatively correlated. The number of counties with a negative correlation between cultural services and SDGs gradually increased, indicating spatial heterogeneity in how different ecosystem service functions affect SDGs. Based on these findings, it is recommended to prioritize enhancing provisioning services in counties within the Yi-Shu-Si River Basin. Furthermore, while developing the economy in the Yangtze River Basin, more attention should be paid to ecological protection and restoration. Finally, there should be a focus on strengthening cultural services in counties in the Yangtze River and western Taihu Lake basins to promote the synergistic improvement of ES and SDGs.
Author Contributions
Data collection, J.W. and S.Z. (Shaoning Zhang); data analysis and processing, J.W. and S.Z. (Shaoliang Zhang); writing—original draft, Z.C., J.W. and H.H.; writing—review and editing, H.J. and Z.C. All authors have read and agreed to the published version of the manuscript.
Funding
This research was funded by the National Social Science Foundation of China (Grand NO. 22BJY064), Jiangsu Province Graduate Student Research and Innovation Program Project (Grand NO. KYCX25_3019) and Graduate Innovation Program of China University of Mining and Technology (2025WLKXJ157).
Data Availability Statement
The raw data supporting the conclusions of this article will be made available by authors on request.
Acknowledgments
We thank LetPub (www.letpub.com, accessed on 2 May 2024) for its linguistic assistance during the preparation of this manuscript.
Conflicts of Interest
The authors declare no conflicts of interest.
References
- Chen, D.; Zhao, Q.; Jiang, P.; Li, M. Incorporating ecosystem services to assess progress towards sustainable development goals: A case study of the Yangtze River Economic Belt, China. Sci. Total Environ. 2022, 806, 151277. [Google Scholar] [CrossRef] [PubMed]
- Ma, Z.; Gong, J.; Hu, C.; Lei, J. An integrated approach to assess spatial and temporal changes in the contribution of the ecosystem to sustainable development goals over 20 years in China. Sci. Total Environ. 2023, 903, 166237. [Google Scholar] [CrossRef]
- Shi, R.; Cheng, J.; Cai, W.; Wang, L.; Huang, C. Linking Relationship of Ecosystem Service Supply and Demand into Sustainable Development Goals (SDGs). Land Degrad. Dev. 2025. Early View. [Google Scholar] [CrossRef]
- Du, J.; Liu, Y.; Xu, Z.; Duan, H.B.; Zhang, M.H.; Hu, L.; Wang, Q.; Dong, J.C.; Wang, Y.F.; Fu, B.J. Global effects of progress towards Sustainable Development Goals on subjective well-being. Nat. Sustain. 2024, 7, 360–367. [Google Scholar] [CrossRef]
- Zhang, S.; Chen, W.; Zhang, Q.; Krey, V.; Byers, E.; Rafaj, P.; Nguyen, B.; Awais, M.; Riahi, K. Targeting net-zero emissions while advancing other sustainable development goals in China. Nat. Sustain. 2024, 7, 1107–1119. [Google Scholar] [CrossRef]
- Ipbes. Decision and Scoping Report for the IPBES Global Assessment on Biodiversity and Ecosystem Services. 2016. Available online: https://ipbes.net/global-assessment (accessed on 2 June 2025).
- Issc, I. Review of the Sustainable Development Goals: The Science Perspective. 2015. Available online: https://council.science/wp-content/uploads/2017/05/SDG-Report.pdf (accessed on 2 June 2025).
- Chen, L.; Yao, Y.; Xiang, K.; Dai, X.; Li, W.; Dai, H.; Lu, K.; Li, W.; Lu, H.; Zhang, Y.; et al. Spatial-temporal pattern of ecosystem services and sustainable development in representative mountainous cities: A case study of Chengdu-Chongqing Urban Agglomeration. J. Environ. Manag. 2024, 368, 122261. [Google Scholar] [CrossRef]
- Swan, T.; McBratney, A.; Field, D. Linkages between Soil Security and One Health: Implications for the 2030 Sustainable Development Goals. Front. Public Health 2024, 12, 1447663. [Google Scholar] [CrossRef]
- De Meester, L.; Vázquez-Domínguez, E.; Kassen, R.; Forest, F.; Bellon, M.R.; Koskella, B.; Scherson, R.A.; Colli, L.; Hendry, A.P.; Crandall, K.A.; et al. A Link between Evolution and Society Fostering the UN Sustainable Development Goals. Evol. Appl. 2024, 17, e13728. [Google Scholar] [CrossRef]
- Duxbury, N.; Kangas, A.; De Beukelaer, C. Cultural Policies for Sustainable Development: Four Strategic Paths. Int. J. Cult. Policy 2017, 23, 214–230. [Google Scholar] [CrossRef]
- Li, J.; Chen, X.; De Maeyer, P.; Van De Voorde, T.; Li, Y. Investigating the supply-demand gap of farmland ecosystem services to advance sustainable development goals (SDGs) in Central Asia. Agric. Water Manag. 2025, 312, 109419. [Google Scholar] [CrossRef]
- Mashizi, A.K.; Sharafatmandrad, M. Dry forests conservation: A comprehensive approach linking ecosystem services to ecological drivers and sustainable management. Glob. Ecol. Conserv. 2023, 47, e02652. [Google Scholar] [CrossRef]
- Zhao, Y.; Zhou, R.; Yu, Q.; Zhao, L. Revealing the contribution of mountain ecosystem services research to sustainable development goals: A systematic and grounded theory driven review. J. Environ. Manag. 2025, 373, 123452. [Google Scholar] [CrossRef] [PubMed]
- Huang, Y.; Kang, A.; Jiang, Z.; Li, J.; Ma, Y.; Gan, X.; Zhou, B. An approach based on ecosystem services for assessing progress towards sustainable development goals at both national and provincial levels in China. Sci. Rep. 2024, 14, 29250. [Google Scholar] [CrossRef] [PubMed]
- Zhu, L.; Wu, Z.; Huang, X. Exploring the relationship between ecosystem services and sustainable development goals in Guangdong province, China. Ecol. Indic. 2024, 169, 112907. [Google Scholar] [CrossRef]
- Phillis, Y.A.; Kouikoglou, V.S.; Verdugo, C. Urban sustainability assessment and ranking of cities. Environ. Urban Syst. 2017, 64, 254–265. [Google Scholar] [CrossRef]
- Ge, D.Z.; Wang, R.M.; Lu, X.X. Study on the Coupling Relationship Between Land Use Transition and Rural Transformation Development: A Case Study of Counties in Jiangsu Province. Resour. Sci. 2025, 47, 196–210. [Google Scholar]
- Zhang, J.; Sun, W.; Pradhan, P.; Gao, S.; Su, C.; Skene, K.R.; Fu, B. Nonlinear and weak interactions among sustainable development goals (SDGs) drive China’s SDGs growth rate below expectations. Environ. Impact Assess. Rev. 2025, 115, 107990. [Google Scholar] [CrossRef]
- Feng, S.Y.; Zhao, W.W.; Hua, T.; Wang, H. Accelerating Global Sustainable Development Goals in the Post-Pandemic Era. Acta Ecol. Sin. 2021, 41, 7955–7964. [Google Scholar]
- Jia, K.; Sheng, Q.Y.; Liu, Y.H.; Yang, Y.Z.; Dong, G.L.; Qiao, Z.; Wang, M.; Sun, C.H.; Han, D.R. A framework for achieving urban sustainable development goals (SDGs): Evaluation and interaction. Sustain. Cities Soc. 2024, 114, 105780. [Google Scholar] [CrossRef]
- Liu, Y.; Du, J.; Wang, Y.; Cui, X.; Dong, J.; Gu, P.; Hao, Y.; Xue, K.; Duan, H.; Xia, A.; et al. Overlooked uneven progress across sustainable development goals at the global scale: Challenges and opportunities. Innovation 2024, 5, 100573. [Google Scholar] [CrossRef]
- Malekpour, S.; Allen, C.; Sagar, A.; Scholz, I.; Persson, Å.; Miranda, J.J.; Bennich, T.; Dube, O.P.; Kanie, N.; Madise, N.; et al. What scientists need to do to accelerate progress on the SDGs(Note). Nature 2023, 621, 250–254. [Google Scholar] [CrossRef] [PubMed]
- Yang, Z.; Zhan, J.; Wang, C.; Twumasi-Ankrah, M.J. Coupling coordination analysis and spatiotemporal heterogeneity between sustainable development and ecosystem services in Shanxi Province, China. Sci. Total Environ. 2022, 836, 155625. [Google Scholar] [CrossRef] [PubMed]
- Zhang, X.L.; Qiu, F.D. Impact of County Economic Spatial Network on Ecological Efficiency from an Externality Perspective: A Case Study of Jiangsu Province. Resour. Environ. Yangtze Basin. 2023, 32, 2492–2503. [Google Scholar]
- Xie, G.D.; Zhang, C.X.; Zhang, L.M.; Chen, W.H.; Li, S.M. Improvements in the Valuation Method of Ecosystem Services Based on Unit Area Value Equivalent Factors. J. Nat. Resour. 2015, 30, 1243–1254. [Google Scholar]
- Li, J.; Qiu, J.; Amani-Beni, M.; Wang, Y.; Yang, M.; Chen, J. A Modified Equivalent Factor Method Evaluation Model Based on Land Use Changes in Tianfu New Area. Land 2023, 12, 1335. [Google Scholar] [CrossRef]
- He, Y.; Zhu, L.; Dou, L.; Wu, M.; Guo, Y. Estimation of ecosystem service value in Huixian Karst National Wetland Park based on equivalent factor method. Int. J. Digit. Earth 2025, 18, 2494073. [Google Scholar] [CrossRef]
- Li, Y.F.; Zhan, J.Y.; Liu, Y.; Zhang, F.; Zhang, M.L. Response of ecosystem services to land use and cover change: A case study in Chengdu City. Resour. Conserv. Recycl. 2018, 132, 291–300. [Google Scholar] [CrossRef]
- Jiang, H.; Wu, Q. Evaluation and spatiotemporal evolution of ecosystem service value in Jiangsu Province based on LUCC. Resour. Environ. Yangtze Basin 2021, 30, 2712–2725. [Google Scholar]
- Zhou, Y.; Wang, Y.X. Spatiotemporal Evolution Characteristics and Driving Mechanisms of Farmland Ecosystem Service Value in Jiangsu Province. Chin. J. Agric. Resour. Reg. Plan. 2024, 45, 95–103. [Google Scholar]
- Zhao, X.Y.; Yu, J.; Liu, Y.Y.; Liu, H.L.; Pang, G.B. Dynamic Evaluation of Water Resources Carrying Capacity in Jiangsu Province Based on Improved PPC Model. Chin. J. Agric. Resour. Reg. Plan. 2024, 7, 1–9+18. [Google Scholar]
- Han, B.; Jin, X.B.; Xiang, X.M.; Zhao, Q.L. Ecological Restoration Pattern Analysis and Strategies Along the Yangtze River in Jiangsu Province Based on the “Element-Landscape-System” Framework. J. Nat. Resour. 2020, 35, 141–161. [Google Scholar]
- Xie, X.; Fang, B.; He, S. Is China’s Urbanization Quality and Ecosystem Health Developing Harmoniously? An Empirical Analysis from Jiangsu, China. Land 2022, 11, 530. [Google Scholar] [CrossRef]
- Wang, J.; Wang, P.; Zhu, C.; Wang, Y.; Zhou, Z. Impact of Different Models of Relocating Coal Mining Villages on the Livelihood Resilience of Rural Households—A Case Study of Huaibei City, Anhui Province. Land 2023, 12, 2169. [Google Scholar] [CrossRef]
- Han, F.; Alkhawaji, R.N.; Shafieezadeh, M.M. Evaluating sustainable water management strategies using TOPSIS and fuzzy TOPSIS methods. Appl. Water Sci. 2024, 15, 4. [Google Scholar] [CrossRef]
- Watrobski, J.; Baczkiewicz, A.; Ziemba, E.; Salabun, W. Sustainable cities and communities assessment using the DARIA-TOPSIS method. Sustain. Cities Soc. 2022, 83, 103926. [Google Scholar] [CrossRef]
- Li, T.; Cai, S.; Singh, R.K.; Cui, L.; Fava, F.; Tang, L.; Xu, Z.; Li, C.; Cui, X.; Du, J.; et al. Livelihood resilience in pastoral communities: Methodological and field insights from Qinghai-Tibetan Plateau. Sci. Total Environ. 2022, 838, 155960. [Google Scholar] [CrossRef] [PubMed]
- Zhu, S.; Huang, J.; Zhao, Y. Coupling coordination analysis of ecosystem services and urban development of resource-based cities: A case study of Tangshan city. Ecol. Indic. 2022, 136, 108706. [Google Scholar] [CrossRef]
- Huang, B.; Wu, B.; Barry, M. Geographically and temporally weighted regression for modeling spatio-temporal variation in house prices. Int. J. Geo. Inf. Sci. 2010, 24, 383–401. [Google Scholar] [CrossRef]
- Wei, Q.; Zhang, L.; Duan, W.; Zhen, Z. Global and Geographically and Temporally Weighted Regression Models for Modeling PM2.5 in Heilongjiang, China from 2015 to 2018. Int. J. Environ. Res. Public Health 2019, 16, 5107. [Google Scholar] [CrossRef]
- Zhang, Z.; Li, J.; Fung, T.; Yu, H.; Mei, C.; Leung, Y.; Zhou, Y. Multiscale Geographically and Temporally Weighted Regression with a Unilateral Temporal Weighting Scheme and Its Application in the Analysis of Spatiotemporal Characteristics of House Prices in Beijing. Int. J. Geogr. Inf. Sci. 2021, 35, 2262–2286. [Google Scholar] [CrossRef]
- Ma, X.W.; Ji, Y.J.; Yuan, Y.F.; Van Oort, N.; Jin, Y.C.; Hoogendoorn, S. A comparison in travel patterns and determinants of user demand between docked and dockless bike-sharing systems using multi-sourced data. Transp. Res. Part A Policy Pract. 2020, 139, 148–173. [Google Scholar] [CrossRef]
- Gao, M.H.; Li, C.; Zhao, H. Spatiotemporal Pattern of Supply-Demand of Ecosystem Services and Influencing Factors in Jiangsu Province. Res. Soil Water Conserv. 2023, 30, 315–324. [Google Scholar]
- Xie, W.Y.; Fu, Y.H.; Yang, D.C.; Liu, J.; Wei, F.; Guo, Y.; Zhao, B. Spatiotemporal Evolution and Simulation Prediction of Ecosystem Service Value in Jiangsu Province Based on Land Use Change. Areal Res. Dev. 2022, 41, 126–132+158. [Google Scholar]
- Ding, M.T.; Pei, F.S.; Hu, Y.C.; Dong, S.; Zhang, N.; Lin, P. Spatial and temporal changes of ecosystem service value in Jiangsu Province based on LUCC. Acta Ecol. Sin. 2020, 40, 6801–6811. [Google Scholar]
- Shi, G.; Wang, Y.T.; Liu, J.H. Spatiotemporal evolution characteristics of terrestrial ecosystem carbon storage in Jiangsu Province based on land use/land cover change. Environ. Sci. 2025, 46, 2953–2962. [Google Scholar]
- Ye, B.; Sui, X.Y.; Wang, X.R.; Yin, Q.Q.; Wang, J.X.; Zhou, S.L. Identification and Delineation of Ecological Protection and Restoration Areas in Jiangsu Province. Resour. Environ. Yangtze Basin. 2023, 32, 250–259. [Google Scholar]
- Cai, W.; Shu, C.; Zhu, Y. Using Ecosystem Services to Inform Sustainable Waterfront Area Management: A Case Study in the Yangtze River Delta Ecological Green Integration Demonstration Zone. Land 2023, 12, 1351. [Google Scholar] [CrossRef]
- Chen, Z.; Li, X.; He, W.; Chen, J.; Ji, H. Study on Coupling and Coordination Relationship between Urbanization and Ecosystem Service Value in Jiangsu Province, China. Land 2024, 13, 204. [Google Scholar] [CrossRef]
- Grilo, C.; Neves, T.; Bates, J.; Le Roux, A.; Medrano-Vizcaíno, P.; Quaranta, M.; Silva, I.; Soanes, K.; Wang, Y. Global Roadkill Data: A dataset on terrestrial vertebrate mortality caused by collision with vehicles. Sci. Data 2025, 12, 1–14. [Google Scholar] [CrossRef]
- Hlatshwayo, T.I.; Zungu, M.M.; Collinson-Jonker, W.J.; Downs, C.T. Mainstreaming ecological connectivity and wildlife needs in green road transport infrastructure planning in South Africa. J. Environ. Manag. 2024, 371, 123062. [Google Scholar] [CrossRef]
- Gurrutxaga, M.; Saura, S. Prioritizing highway defragmentation locations for restoring landscape connectivity. Environ. Conserv. 2014, 41, 157–164. [Google Scholar] [CrossRef]
- Yuan, M.H.; Lo, S.L. Ecosystem services and sustainable development: Perspectives f1 rom the food-energy-water Nexus. Ecosyst. Serv. 2020, 46, 101217. [Google Scholar] [CrossRef]
Disclaimer/Publisher’s Note: The statements, opinions and data contained in all publications are solely those of the individual author(s) and contributor(s) and not of MDPI and/or the editor(s). MDPI and/or the editor(s) disclaim responsibility for any injury to people or property resulting from any ideas, methods, instructions or products referred to in the content. |
© 2025 by the authors. Licensee MDPI, Basel, Switzerland. This article is an open access article distributed under the terms and conditions of the Creative Commons Attribution (CC BY) license (https://creativecommons.org/licenses/by/4.0/).