Article

Saline Peatland Degradation in the Mezzano Lowland: 66 Years of Agricultural Impacts on Carbon and Soil Biogeochemistry

1
Department of Physics and Earth Sciences, University of Ferrara, Via G. Saragat, 1, 44122 Ferrara, Italy
2
Department of Geosciences, University of Padua, Via G. Gradenigo, 6, 35131 Padova, Italy
*
Author to whom correspondence should be addressed.
Land 2025, 14(8), 1621; https://doi.org/10.3390/land14081621
Submission received: 19 June 2025 / Revised: 27 July 2025 / Accepted: 7 August 2025 / Published: 9 August 2025

Abstract

The conversion of wetlands into croplands often leads to significant losses of peat soil salinity and soil organic matter (SOM), though quantifying these changes is challenging due to limited historical data. In this study, we compared current soil physicochemical properties with rare historical data from the Mezzano Lowland (ML) in Northeastern Italy, a former wetland drained over 60 years ago. The transformation, which affected approximately 18,100 hectares, was achieved through the construction of a network of drainage canals and pumping stations capable of removing large volumes of water, enabling intensive agricultural use. Results showed a marked decrease in electrical conductivity (EC) and sulphate concentration, indicating extensive salt leaching from the upper peat soil layers. EC dropped from historical values up to 196 m S /cm (1967–1968) to a current maximum of 4.93 m S /cm, while sulphate levels declined by over 90%. SOM also showed significant depletion, especially in deeper layers (50–100 cm), with losses ranging from 50 to 60 wt % , due to increased aeration and microbial activity post-drainage. These climatic and environmental changes, including a marked reduction in soil salinity and sulphate concentrations due to prolonged leaching, have likely shifted the Mezzano Lowland from a carbon sink to a net source of CO2 and CH4 by promoting microbial processes that enhance methane production under anaerobic conditions. To detect residual peat layers, we used Ground-Penetrating Radar (GPR), which, combined with soil sampling, proved effective for tracking long-term peat soil changes. This approach can inform sustainable land management strategies to prevent further carbon loss and maintain peat soil stability.

1. Introduction

Natural wetlands are significant carbon (C) sinks, as carbon sequestration occurs both in peat soil and biomass. Additionally, the high salinity of wetland peat soils helps suppress methane (CH4) emissions, a potent greenhouse gas (GHG). Due to these characteristics, riparian and coastal wetlands are estimated to store up to 50 times more carbon in their soils than many terrestrial forest ecosystems [1]. Therefore, they play a crucial role in the global carbon cycle, storing approximately 20–30% of the world’s soil organic carbon (SOC) [2,3]. Consequently, any land-use change (i.e., afforestation, drainage, cultivation, or urban development) can convert wetlands from carbon sinks into net carbon sources [4,5,6].
Globally, the conversion of peatlands and coastal wetlands into agricultural land has been a major driver of GHG emissions and soil carbon losses, especially in Southeast Asia, Northern Europe, and parts of North America [7]. For instance, large-scale drainage of tropical peatlands in Indonesia and Malaysia has led to rapid peat oxidation, severe subsidence, and increased fire vulnerability [8,9,10]. In temperate regions such as the Netherlands and the Baltic States, centuries of peatland drainage for agriculture have also caused significant CO2 emissions and irreversible loss of peat soil [11]. Despite the global recognition of these impacts, many studies are limited by a lack of long-term monitoring data, especially regarding the original peat conditions before drainage and cultivation [12,13]. This gap hinders accurate reconstruction of carbon dynamics over decadal scales and the development of targeted mitigation strategies. Beyond these specific regional impacts, since 1970, 35% of the world’s wetlands have vanished because of human activities [14], leading to a mass SOC depletion and GHG emissions. Accurately quantifying peat soil organic matter (SOM) loss is often challenging due to the lack of historical data on the physicochemical conditions, such as SOC content and salinity, at the time of wetland drainage in past decades.
In Northern Italy, large-scale wetland drainage was practised before World War II and continued until the 1960s to expand agricultural land, and the physicochemical characteristics of the areas during the drainage operations were reported in historical reports [15]. Among these areas is the Mezzano Lowland (ML, Northeast Italy), where between 1957 and 1974, approximately 78,000 hectares of wetlands were converted to agricultural fields [15,16]. In the late 1960s, at the beginning of drainage in the ML, a comprehensive soil survey was carried out by Boschi and Spallacci [17] to evaluate the conditions of the newly drained land. Between 1967 and 1968, the authors examined 405 stratigraphic profiles (up to 1 m in depth) and collected 290 soil samples across the entire valley. Their analyses revealed high-saline peat soils predominantly composed of thick peat layers, overlaid by thinner clay deposits. Laboratory analyses confirmed the presence of high organic matter content due to the presence of peats.
From this legacy dataset, this study re-examined the soil conditions (salinity and SOC contents) in ML in present-day (2023), in addition to new valuable tracers such as stable C isotopes to assess the long-term effects of climatic changes superimposed on decades of intensive agricultural practices, with special emphasis on residual salinity, loss of fertility, and evolution of SOM storage in an area where the total ML peat volume before drainage was estimated to be 177 × 106 m3 [18]. Notably, the Mezzano Lowland is currently affected by intense degradation processes, including subsurface peat burning, which initiates at depth and propagates through smouldering combustion within the 10–70 cm horizon [19]. This phenomenon, combined with prolonged drainage, soil aeration, and intensive agriculture, accelerates the mineralisation of SOM, alters the physical structure of peat layers, and amplifies greenhouse gas emissions. These processes, exacerbated by recent climatic extremes such as heatwaves and drought, have probably contributed to shifting the ML from a historical carbon sink to a net source of CO2 and CH4.
To better understand the long-term consequences of this transformation, we focused our analyses on salinity and carbon along soil profiles down to a depth of 150 cm, specifically targeting the zones where Boschi and Spallacci [17] had previously documented buried peat layers. The newly collected data were systematically compared with the 1967–1968 baseline dataset from Boschi and Spallacci, as well as with more recent investigations [20,21] that examined soil properties from the surface to 100–120 cm.
Moreover, many studies rely solely on contemporary measurements or remote sensing, which are insufficient to capture the legacy effects of drainage and land-use change. In contrast, this study leverages a rare historical soil dataset (1967–1968) combined with modern geochemical analyses and geophysical imaging using Ground-Penetrating Radar (GPR) to reconstruct long-term soil evolution in a post-drainage landscape [22,23]. This integrative approach, which also allowed us for the first time in this region to non-invasively estimate residual peat thickness and delineate stratigraphic boundaries, allows us to overcome the typical limitations of peatland research, particularly in reconstructing pre-drainage conditions and assessing residual carbon storage.
We think that the methodology and implications used for this work are broadly relevant to other former wetland regions globally experiencing similar land-use histories and degradation trajectories. By integrating geophysical imaging with historical and geochemical data, the study offers new insights into peat degradation, SOM loss, salinity evolution, and carbon emissions. While the Mezzano Lowland represents a unique case in Southern Europe, the processes documented here, peat desiccation, salinity shifts, subsoil combustion, and carbon loss, are increasingly observed in drained wetlands worldwide.

2. Materials and Methods

2.1. Study Area

The ML is located in the southeastern portion of the Po Valley in the Emilia-Romagna region (Northern Italy; Figure 1a). The area of Mezzano belongs to the Ferrara province; it is from 0 m to −4 m below sea level and represents the terminal portion of the Po River catchment close to the Adriatic Sea and the Comacchio lagoon [24]. Due to these geomorphological characteristics, ML hosted wetlands until the mid-60s when an extensive land-use change programme involving the entire Ferrara province was carried out to convert wetlands into croplands (Figure 1b) [15]. In particular, the drainage of wetlands in the Mezzano Lowland started in 1957 and by 1964 partial cultivation of the drained land was already feasible with full agricultural utilisation achieved by 1974 [17]. Today, the Mezzano Lowland covers a total area of approximately 18,100 hectares [20]. This large-scale drainage was facilitated by hydraulic pumping and a network of artificial channels [15,20,25], which still keep the area drained from the groundwater of the phreatic aquifer, whose level is close to the surface [20,21]. The dominant farming practices in the Mezzano Lowland involve intensive crop rotation of tomato, soybean, maize, wheat, alfalfa, melon, and watermelon [21]. The type of crop is determined by the peat soil’s characteristics, such as high organic matter and saltiness, and sorghum and ryegrass are used in rotation as well. Fertilizer regimens are found in NPK inputs and occasionally manure, specifically to counteract low phosphorus availability.
According to the soil texture maps of the Geological, Seismic and Soil Service of Regione Emilia-Romagna and those recently obtained by Maino et al. [26] using airborne radiometric data, most of the ML soils can be classified mostly as loam and clay-loam; however, there are also soils with sandy-loam and sandy-clay-loam textures. As reported by Di Giuseppe et al. [20], two distinct soil types can be identified today. The first type consists of fine-grained peat soils rich in organic matter (Histosols, [27]). These soils have developed within the drained areas in the northern and central parts of the ML [17,21]. The second type includes sandy soils (Arenosols, [27]) found in the southern part of ML, representing paleo-dunes. Due to wave action, which inhibited plant growth along the valley edges, these soils have a low organic matter content. The ML area has a humid subtropical climate (Cfa; [28]), with hot, humid summers (30–35 °C max) and cold winters (10–16 °C max). Mean rainfall is approximately 657 mm, the wettest month being April, and frost occurrence is rare [29]. Climatic conditions were identical in the 1950s, when the drainage of wetlands was carried out, with mean temperatures of 13–14 °C and slightly higher rainfall, especially during autumn [17]. The SNPA report “Climate in Italy in 2023” [30] examines the main climatic aspects of the year and recent climate changes, through detailed analyses at national, regional, and local scales (e.g., 1960–2023), highlighting that overall temperature has increased by approximately 2.5 °C over the past six decades.

2.2. Soil Sampling and Analyses—1967–1968

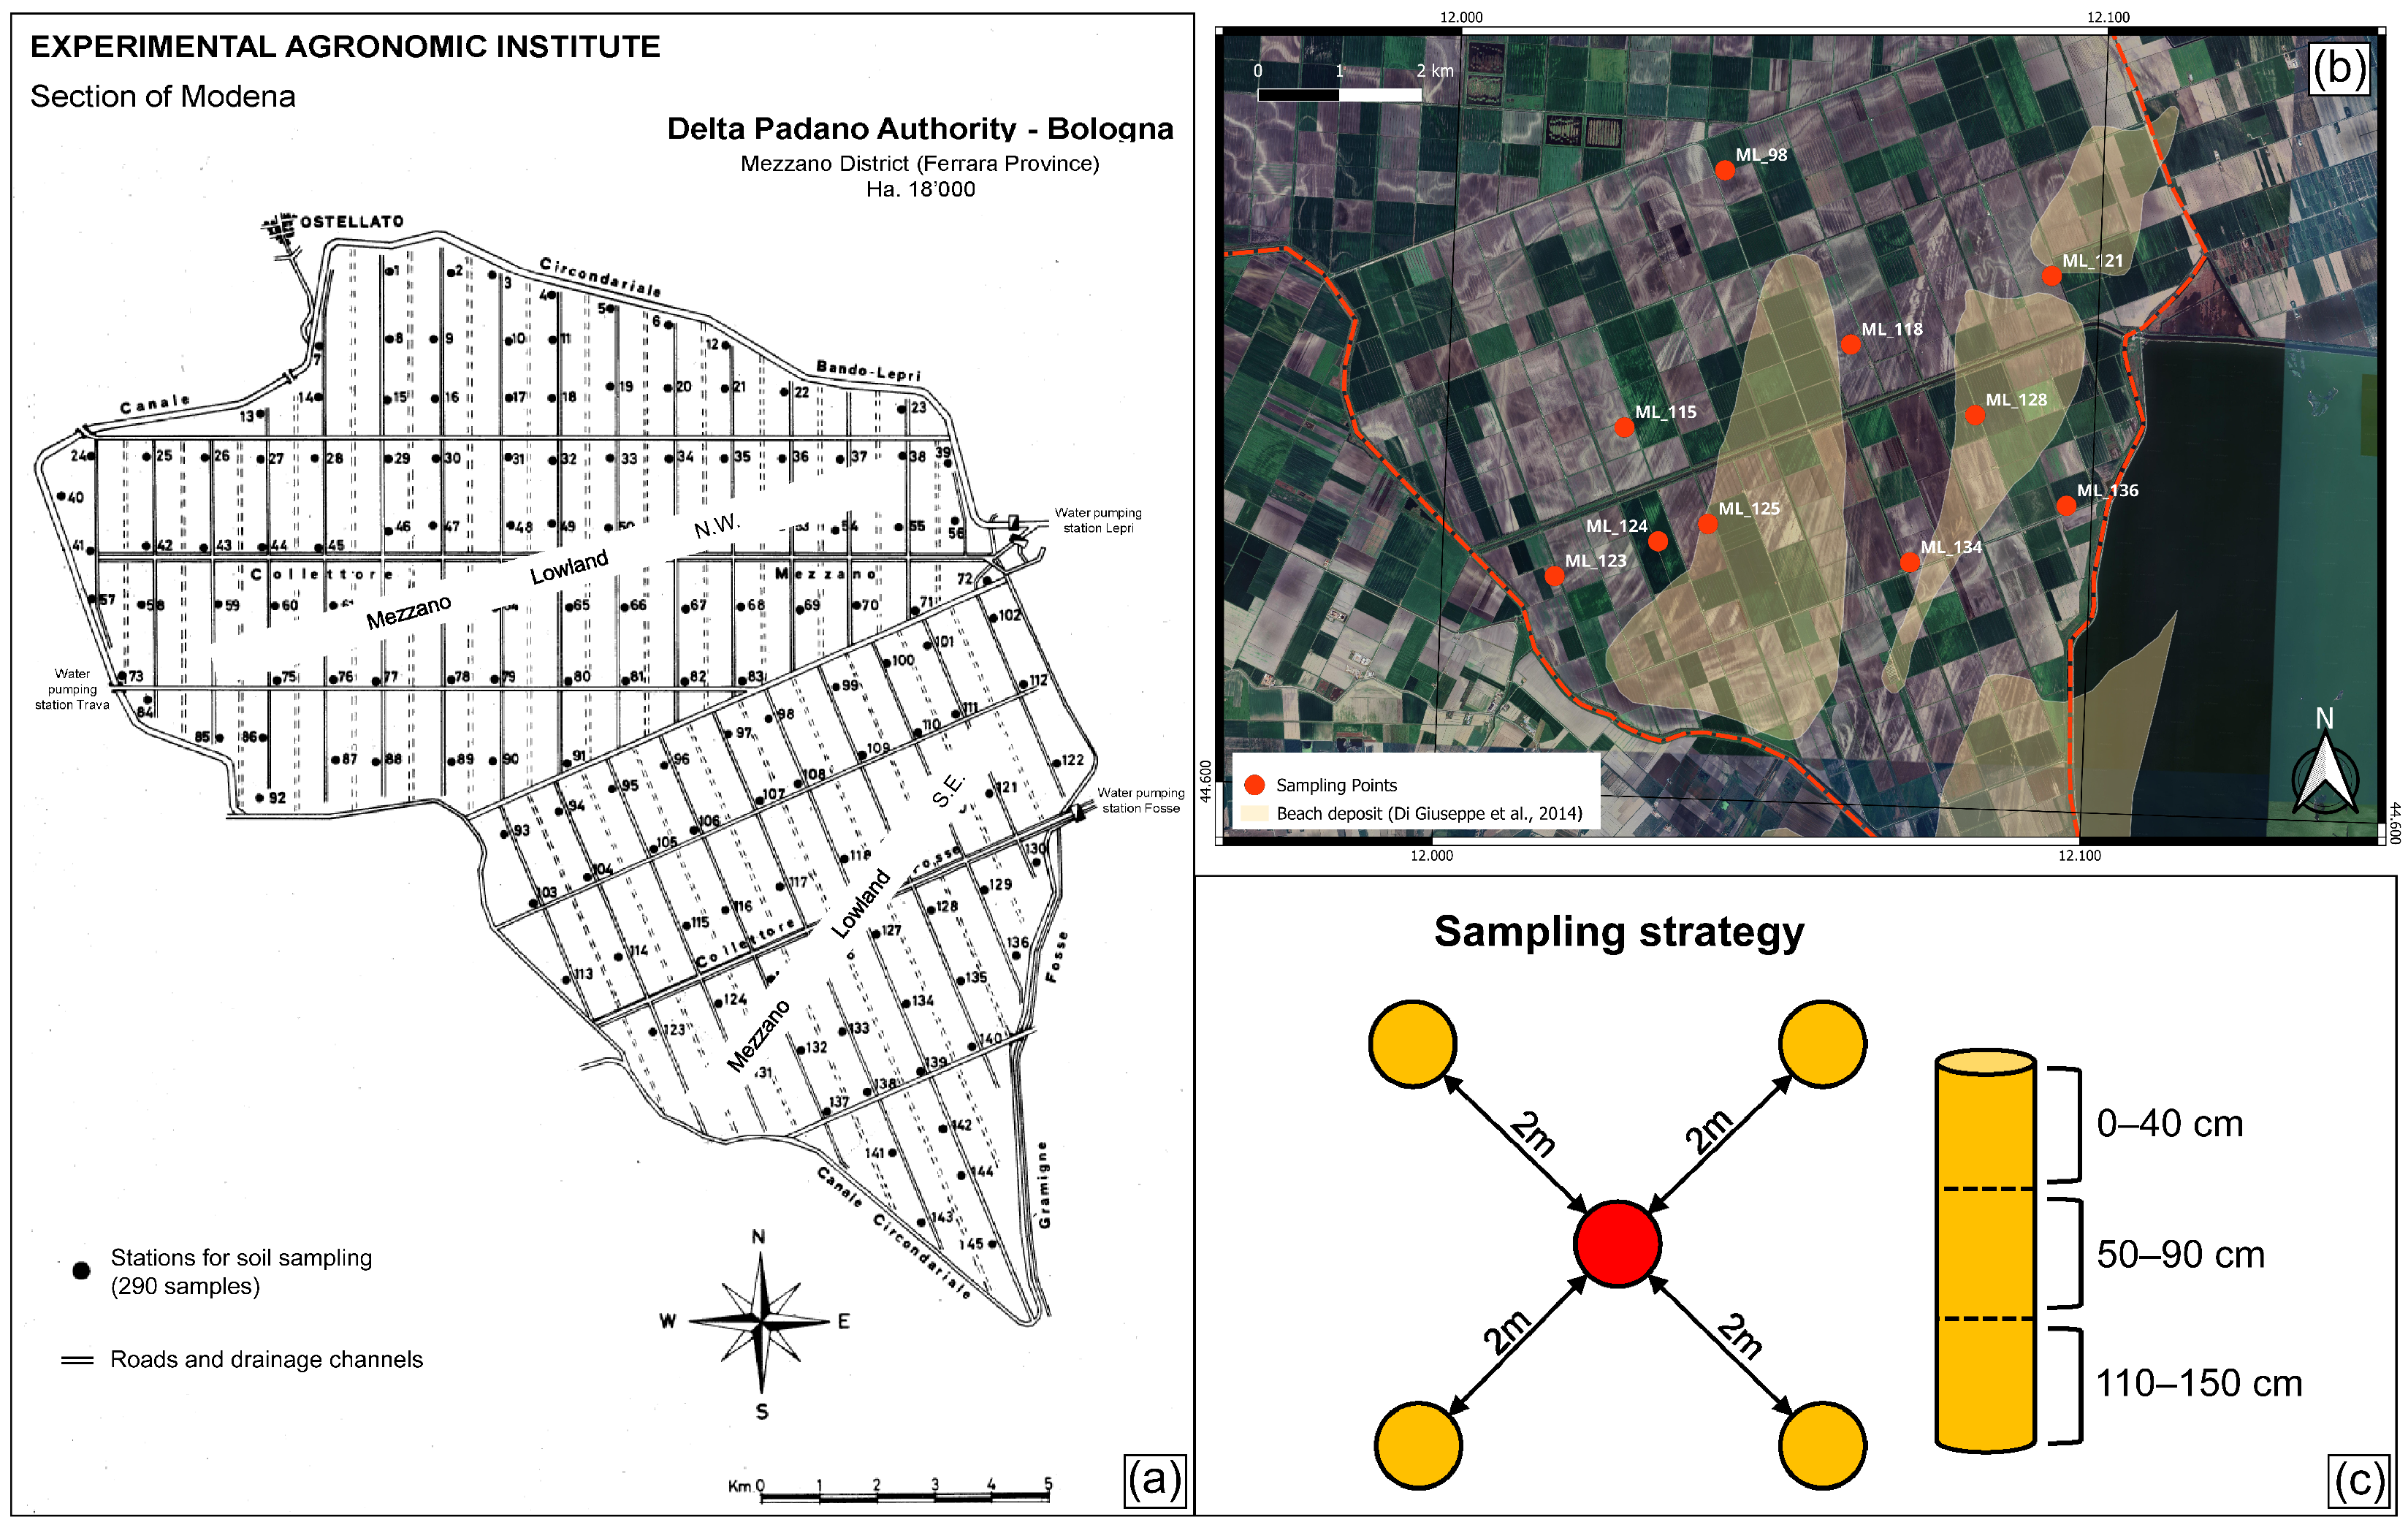
For the survey performed by Boschi and Spallacci [17], the peat soil reconnaissance and sampling started in the summer of 1967 in the northwest part of the area, and continued in 1968 in the southeastern part, following the progression of the land drainage works. The sampling for this study was carried out based on the geometric division of the land plots, which was established following land drainage works. In this division, roads and drainage channels were arranged in a regular, squared pattern (Figure 2a). Based on this layout, transects were drawn parallel to the roads and drainage channels, along which soil samples were collected at approximately one-kilometre intervals. In this way, in 145 grid points, pits were dug down to collect soil samples at fixed depths at 0–50 cm and 50–100 cm. In addition, stratigraphic analyses up to a depth of 1 m were conducted along the margins of the primary drainage canals.
Boschi and Spallacci [17] determined the texture of the soils, but granulometric data were excluded for samples with significant peat components, i.e., containing >20% organic matter. All the samples were also analysed for total nitrogen with the Kjeldahl method and for organic matter with the Lotti method [31]. In the Lotti method a known weight of air-dried soil sample is treated with a strong oxidising agent, typically potassium dichromate (K2Cr2O7), to oxidate the organic material. After the oxidation process, the amount of unreacted dichromate is determined through titration. The organic carbon content is calculated from the amount of dichromate reduced, and the total organic matter content is estimated by multiplying the carbon content by a factor of 1.72. After that, Boschi and Spallacci [17] identified 10 sampling points in the northwestern area of Mezzano, selecting the most representative sites for the main soil types present in the examined area, which were sandy and peat soils. For samples collected at depths of 0–50 cm and 50–100 cm at these locations, additional analyses were performed using specific methods. These included estimating soil EC and sulphate (SO42−) concentration. Soil EC was determined using a 1:5 soil-to-water extract. Sulfate concentration was measured by gravimetric analysis following its precipitation as barium sulphate (BaSO4), according to the method described by Jackson [32]. Data collected by Boschi and Spallacci [17] are reported in Supplementary Table S1.

2.3. Soil Sampling—2023

The peat soil sampling for the 2023 survey was concentrated in the southeastern portion of the Mezzano Lowland (Figure 2b), an area identified by Boschi and Spallacci [17] as having the highest concentrations of SOM, often exceeding 50 wt % . These elevated SOM values were a key factor in selecting the sampling sites, as they represent zones of particular interest for evaluating long-term changes in carbon storage and peat soil degradation. For the 2023 campaign, soil samples were collected from three different layers at 10 sampling points. These points were precisely located using GPS coordinates obtained by georeferencing the original sampling grid map published by Boschi and Spallacci [17]. In detail, around each sampling point selected by Boschi and Spallacci [17], four soil samples were collected using a gouge auger Edelman (Eijkelkamp, Giesbeek, The Netherlands). For each sampling point, material from the topsoil (0–40 cm), subsoil (50–90 cm), and deep subsoil (110–150 cm) layers was collected and thoroughly mixed, obtaining composite samples from each soil depth (Figure 2c). We divided the soil samples into Type A or B, on the basis of their characteristics in the field and following the description proposed by Di Giuseppe et al. [20]. The peat soil samples ML-98, ML-123, ML-134, and ML-136 samples were classified as Type A as they appeared very dark in colour, and rich in clay and organic matter, sometimes emitting a smell typical of decomposing organic material. The soil samples ML-115, ML-118, ML121, ML-124, ML-125, and ML-128 were classified as Type B as they had a sandy texture.
Each sampling site was georeferenced using a differential GPS and plotted on a GIS map (Figure 2b). The new soil samples were stored in sealed polyethylene (PTE) bags and labelled with the abbreviation “ML” and the same number of the grid point used by Boschi and Spallacci [17] in their survey. Samples were transported to the Laboratories of the Department of Physics and Earth Sciences of the University of Ferrara (Italy) for the geochemical analyses.

2.4. Soil Sample Preparation and Determination of Physicochemical Parameters

The soil samples of the 2023 campaign were air-dried for at least 72 h. After the manual removal of vegetation and shell fragments, soils were sieved at 2 mm mesh and ground into a fine, homogeneous powder using an automatic agate mortar. These powders were then used for subsequent geochemical analyses. The pH, electrical conductivity (EC), and total dissolved solids (TDSs) values were determined in a 1:10 (w/v) soil/distilled water suspension with a GroLine portable hydroponic probe (Hanna Instruments, Woonsocket, RI, USA). The water–soil interaction was simulated by shaking 5 g of soil with 50 mL of deionised water (resistivity > 18   M Ω · cm) for 1 h in an orbital oscillator. After the pH and EC determination, each suspension was centrifuged to separate solid particles, filtered through 0.45 μ m polypropylene filters, and analysed for water-soluble anions (Cl, NO3, SO42−) and cations (K+, Na+, Mg2+, Ca2+). Anion concentrations (in ppm) were measured using an isocratic dual-pump ion chromatograph (ICS-1000 Dionex; Thermo Fisher Scientific, Waltham, MA, USA) equipped with an AS-40 Dionex autosampler (Thermo Fisher Scientific, Waltham, MA, USA). This method demonstrated accuracy and precision below 3.3% of the measured values. Cation concentrations (in ppm) were determined using inductively coupled plasma mass spectrometry (ICP-MS) on a Thermo X-series spectrometer. For ICP-MS analyses instrument calibration was performed with certified solutions, and a known amount of rhenium (Re) and rhodium (Rh) was introduced into each sample as internal standards. The method demonstrated accuracy and precision below 10% of the measured values. The data collected in this 2023 campaign are reported in Supplementary Table S2.

2.5. Organic and Total Carbon and Nitrogen Elemental Analyses

The elemental contents (in weight percent, wt % ) of organic (OC) and total (TC) carbon as well as nitrogen (N) were analysed using an Elementar Vario MICRO Cube elemental analyser (EA) (Elementar Analysensysteme GmbH, Langenselbold, Germany), following the procedure described by Natali and Bianchini [33]. Powdered samples were weighed (up to 40 m g for OC analyses and up to 20 m g for TC and N analyses) and wrapped in tin capsules. The capsules were introduced into the Vario MICRO Cube autosampler to perform the analysis. In the elemental analyser, flash combustion of each sample occurred at 550 °C for OC or at 950 °C for TC, and N elemental determination in a sealed quartz tube (combustion tube) filled with copper oxide grains, releasing gaseous carbon and nitrogen species. The sample gases were transferred to the reduction tube operating at 550 °C and containing native copper chips, which reduced nitrogen oxides to N2. The analyte gases pass through a trap containing Sicapent® to remove H2O. The CO2 and N2 gases were separated via a temperature-programmable desorption column and quantified using a thermo-conductivity detector. Elemental content accuracy, evaluated by comparing reference and measured values, was within 5% of the absolute value but showed higher uncertainty near the detection limit (0.001 wt % ). To enable a comparison between the OC concentrations measured in this study using EA and those reported by Boschi and Spallacci [17] using the Lotti method [31], all sample values were converted to SOM using the Van Bemmelen conversion factor (=1.724).

2.6. Total Carbon Isotopic Analyses

After the elemental analysis, only CO2 gas was conveyed to the IRMS (Isotope Ratio Mass Spectrometer) for the total carbon isotopic ratio determination. Isotopic ratios (Rs) of 13C/12C were calculated using the δ notation in permil (‰), defined as follows:
δ = R sam R std 1 × 1000
where R sam represents the sample’s isotopic ratio and R std corresponds to the Pee Dee Belemnite (PDB) standard. Calibration was performed every 10 samples using reference materials such as Carrara Marble (calibrated at the Institute of Geoscience and Georesources, National Research Council, Pisa) and synthetic sulphanilamide (Elementar Analysensysteme GmbH, Langenselbold, Germany). For the isotopic analysis, precision was estimated through repeated analyses, yielding an average standard deviation of ± 0.1 % for δ 13C values.

2.7. Ground-Penetrating Radar (GPR)

To evaluate the potential of Ground-Penetrating Radar (GPR) for assessing soil stratigraphy in the Mezzano Lowland, a GPR survey was conducted in a 17.5 hectare agricultural field characterised by high soil chromatic heterogeneity, as evidenced by satellite imagery. The study aimed to identify stratigraphic discontinuities and estimate the superficial peat thickness, establishing a basis for a rapid environmental monitoring technique applicable at a broader scale. The selected test site exhibited significant pedological and geomorphological variability, making it suitable for GPR validation.
A dual-frequency GPR system (Geophysical Survey Systems, Inc. [GSSI], Nashua, NH, USA; 300–800 MHz antennas) was employed to acquire multiple subsurface profiles across the field. The instrument was manually pushed along continuous straight survey lines, ensuring consistent data collection. For better data visualisation, the acquired radargrams were processed using the software Reflex Win version 9.5.4 (1997–2021) (Sandmeier Geophysical Research, Karlsruhe, Germany). The resulting radargrams were then segmented at approximately 100 m intervals.
To validate and calibrate the radar data, nine soil cores (s1–s9) were collected at strategic points along one of the survey lines, targeting areas with anomalous radar reflections. These cores provided direct stratigraphic information, enabling the correlation between GPR wave velocities and subsurface layers. Based on soil core calibration, the investigation depth of the GPR was estimated at approximately 1 m , reflecting the signal penetration limit in the local soil conditions and the presence of a shallow water table.

2.8. Statistical Analyses

Statistical analyses were performed using the R environment (R version 4.0.2; R Core Team; R Foundation for Statistical Computing; Vienna, Austria; [34]). Analysis of variance (ANOVA) and Tukey’s HSD post hoc test were applied to each isotopic variable to determine statistical differences within EC, OC, TC, and N contents, as well as C isotopic signature, SOM, and sulphate concentrations to determine statistical differences among the soil samples collected in the different surveys and through depth. For all statistical tests, the cutoff value was set at p < 0.05 , which indicated significant differences between the groups.

3. Results

3.1. Distribution of Soil Electrical Conductivity Through Depth

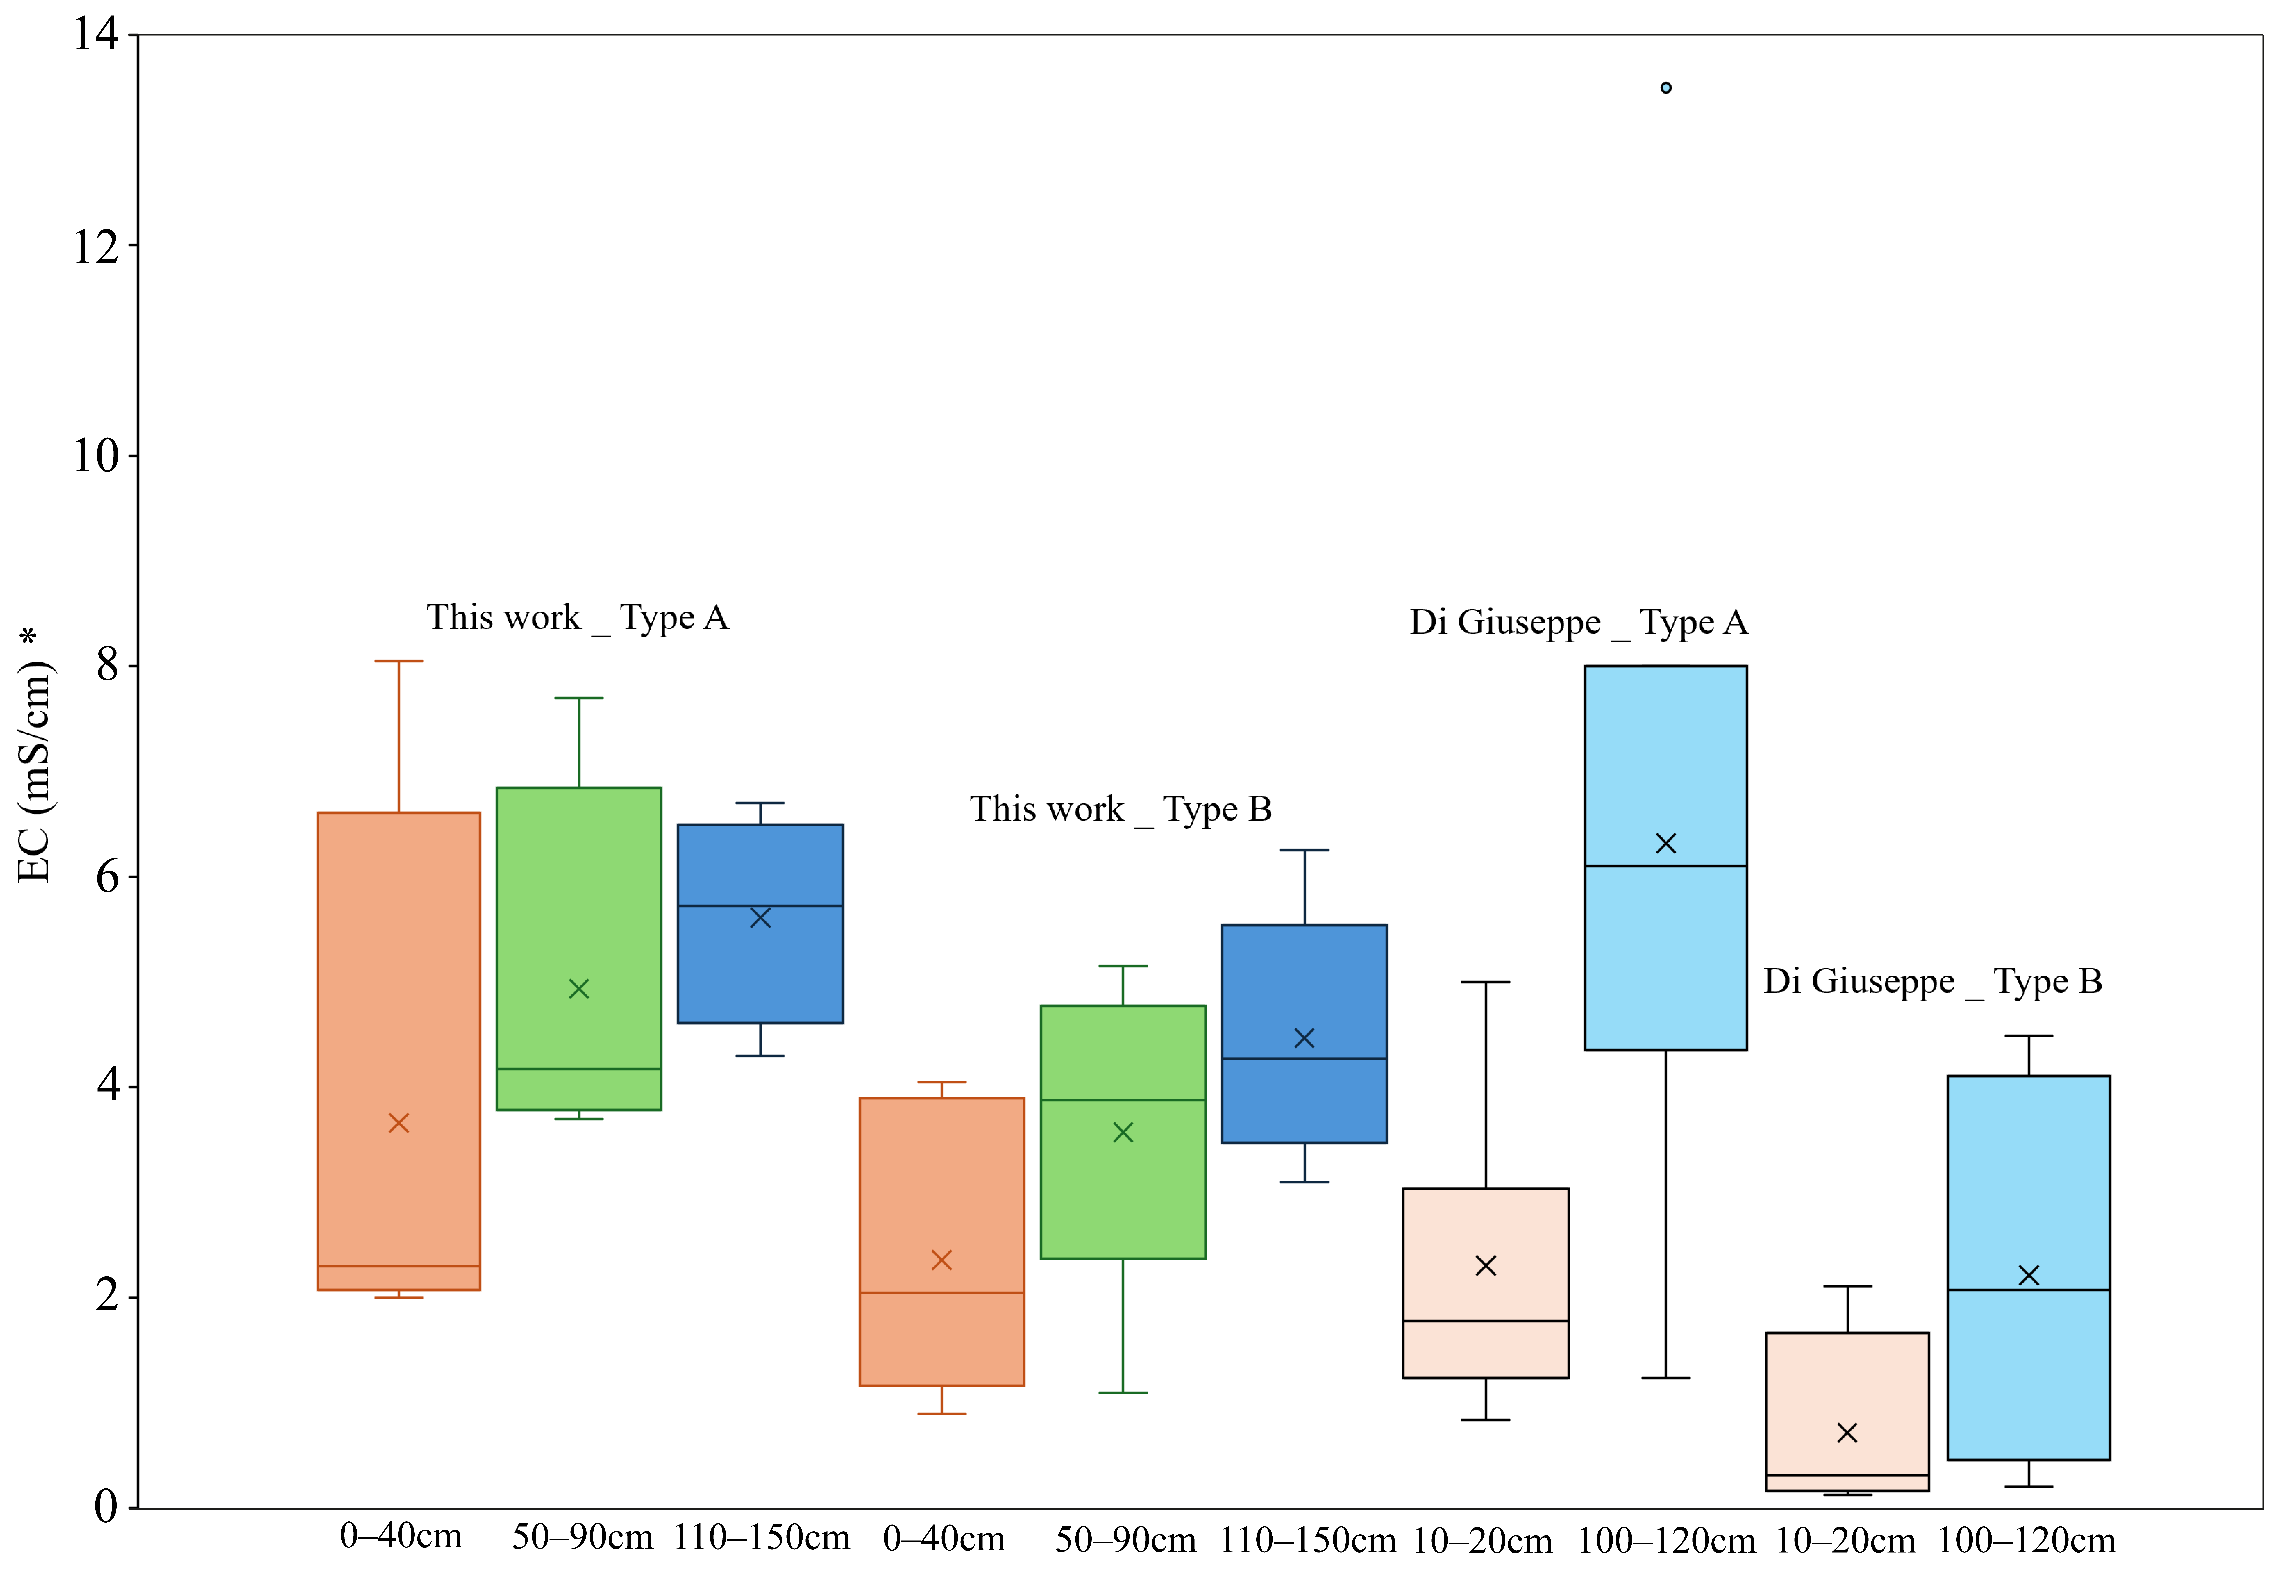
Long-term monitoring of salt concentration and soil salinity distribution along the soil profile in former wetland areas, using EC as an indicator, offers valuable insights into the effects of drainage practices [35]. In ML soil, EC values (Supplementary Table S2) increase with depth in the soil: the median EC and overall values are highest in the 110–150 cm depth (4.93 m S /cm), followed by the 50–90 cm depth (4.12 m S /cm), while the 0–40 cm depth exhibits the lowest values (2.88 m S /cm). This observed trend is consistent with findings from previous studies analysing EC in soil samples from the same area at depths up to 100–120 cm [20,21]. The elevated salinity in the deeper ML layer is attributed to two primary factors: (i) residual marine salinity, which has likely been leached from the upper layers due to percolation of rainwater and irrigation following drainage, leading to desalinization of surface horizons [20], and (ii) the influence of saline groundwater (up to 10 m S /cm), with a water table at 1 m below the surface [20,21].
While a positive correlation between EC values and depth is ubiquitous across all sampling sites, certain locations exhibit notably higher EC values. Based on deposit characteristics, Di Giuseppe et al. [20] categorised ML soils into two main types: Type A peat soils, characterised by fine-grained texture and high organic matter content, and Type B soils, associated with ancient sandy dunes (Figure 2b). Consistent with their distinct properties, Type A soils demonstrate a greater capacity for moisture and salt retention, contributing to their higher EC values at depth. Conversely, Type B peat soils, owing to their sandy texture, exhibit lower EC values due to increased permeability and enhanced leaching (Figure 3).

3.2. Distribution of Elemental Organic, Carbon, and Nitrogen Contents Through Depth

The ANOVA and Tukey’s HSD post hoc tests showed that in the ML soil, the contents of OC and N were significantly affected by the depth of sampling ( p < 0.0001 ; Figure 4). In fact, the distribution of OC and N content across soil profiles follows typical SOM dynamics decreasing with depths (Figure 4a,c). All the elements are concentrated in surface layers (0–40 cm); OC ranges from 4.43 to 13.60 wt % and N from 0.35 to 1.02 wt % , due to inputs from biomass; at 50–90 cm, OC drops to 1.40–10.34 wt % and N to 0.11–0.71 wt % , while at 110–150 cm, values fall further to 0.25–10.67 wt % for OC and 0.02–0.68 wt % for N. This trend reflects progressive SOM mineralisation and a reduced biological activity in deeper horizons. In further detail, the decrease in OC and N varies among the sampling sites. The highest depletion along the depth is recorded by samples ML-124, ML-125, and ML-128, all characterised by sandy soil textures. Conversely, certain samples, such as ML-121, ML-123, ML-134, and ML-136 at the depth of 110–150 cm exhibit relatively higher OC (ranging from 2.83 wt % to 10.67 wt % ) and N (ranging from 0.27 wt % to 0.68 wt % ) values, suggesting localised SOM accumulations or specific pedogenic processes that may have preserved organic matter at depth.

3.3. Distribution of Total Carbon Isotopic Signature Through Depth

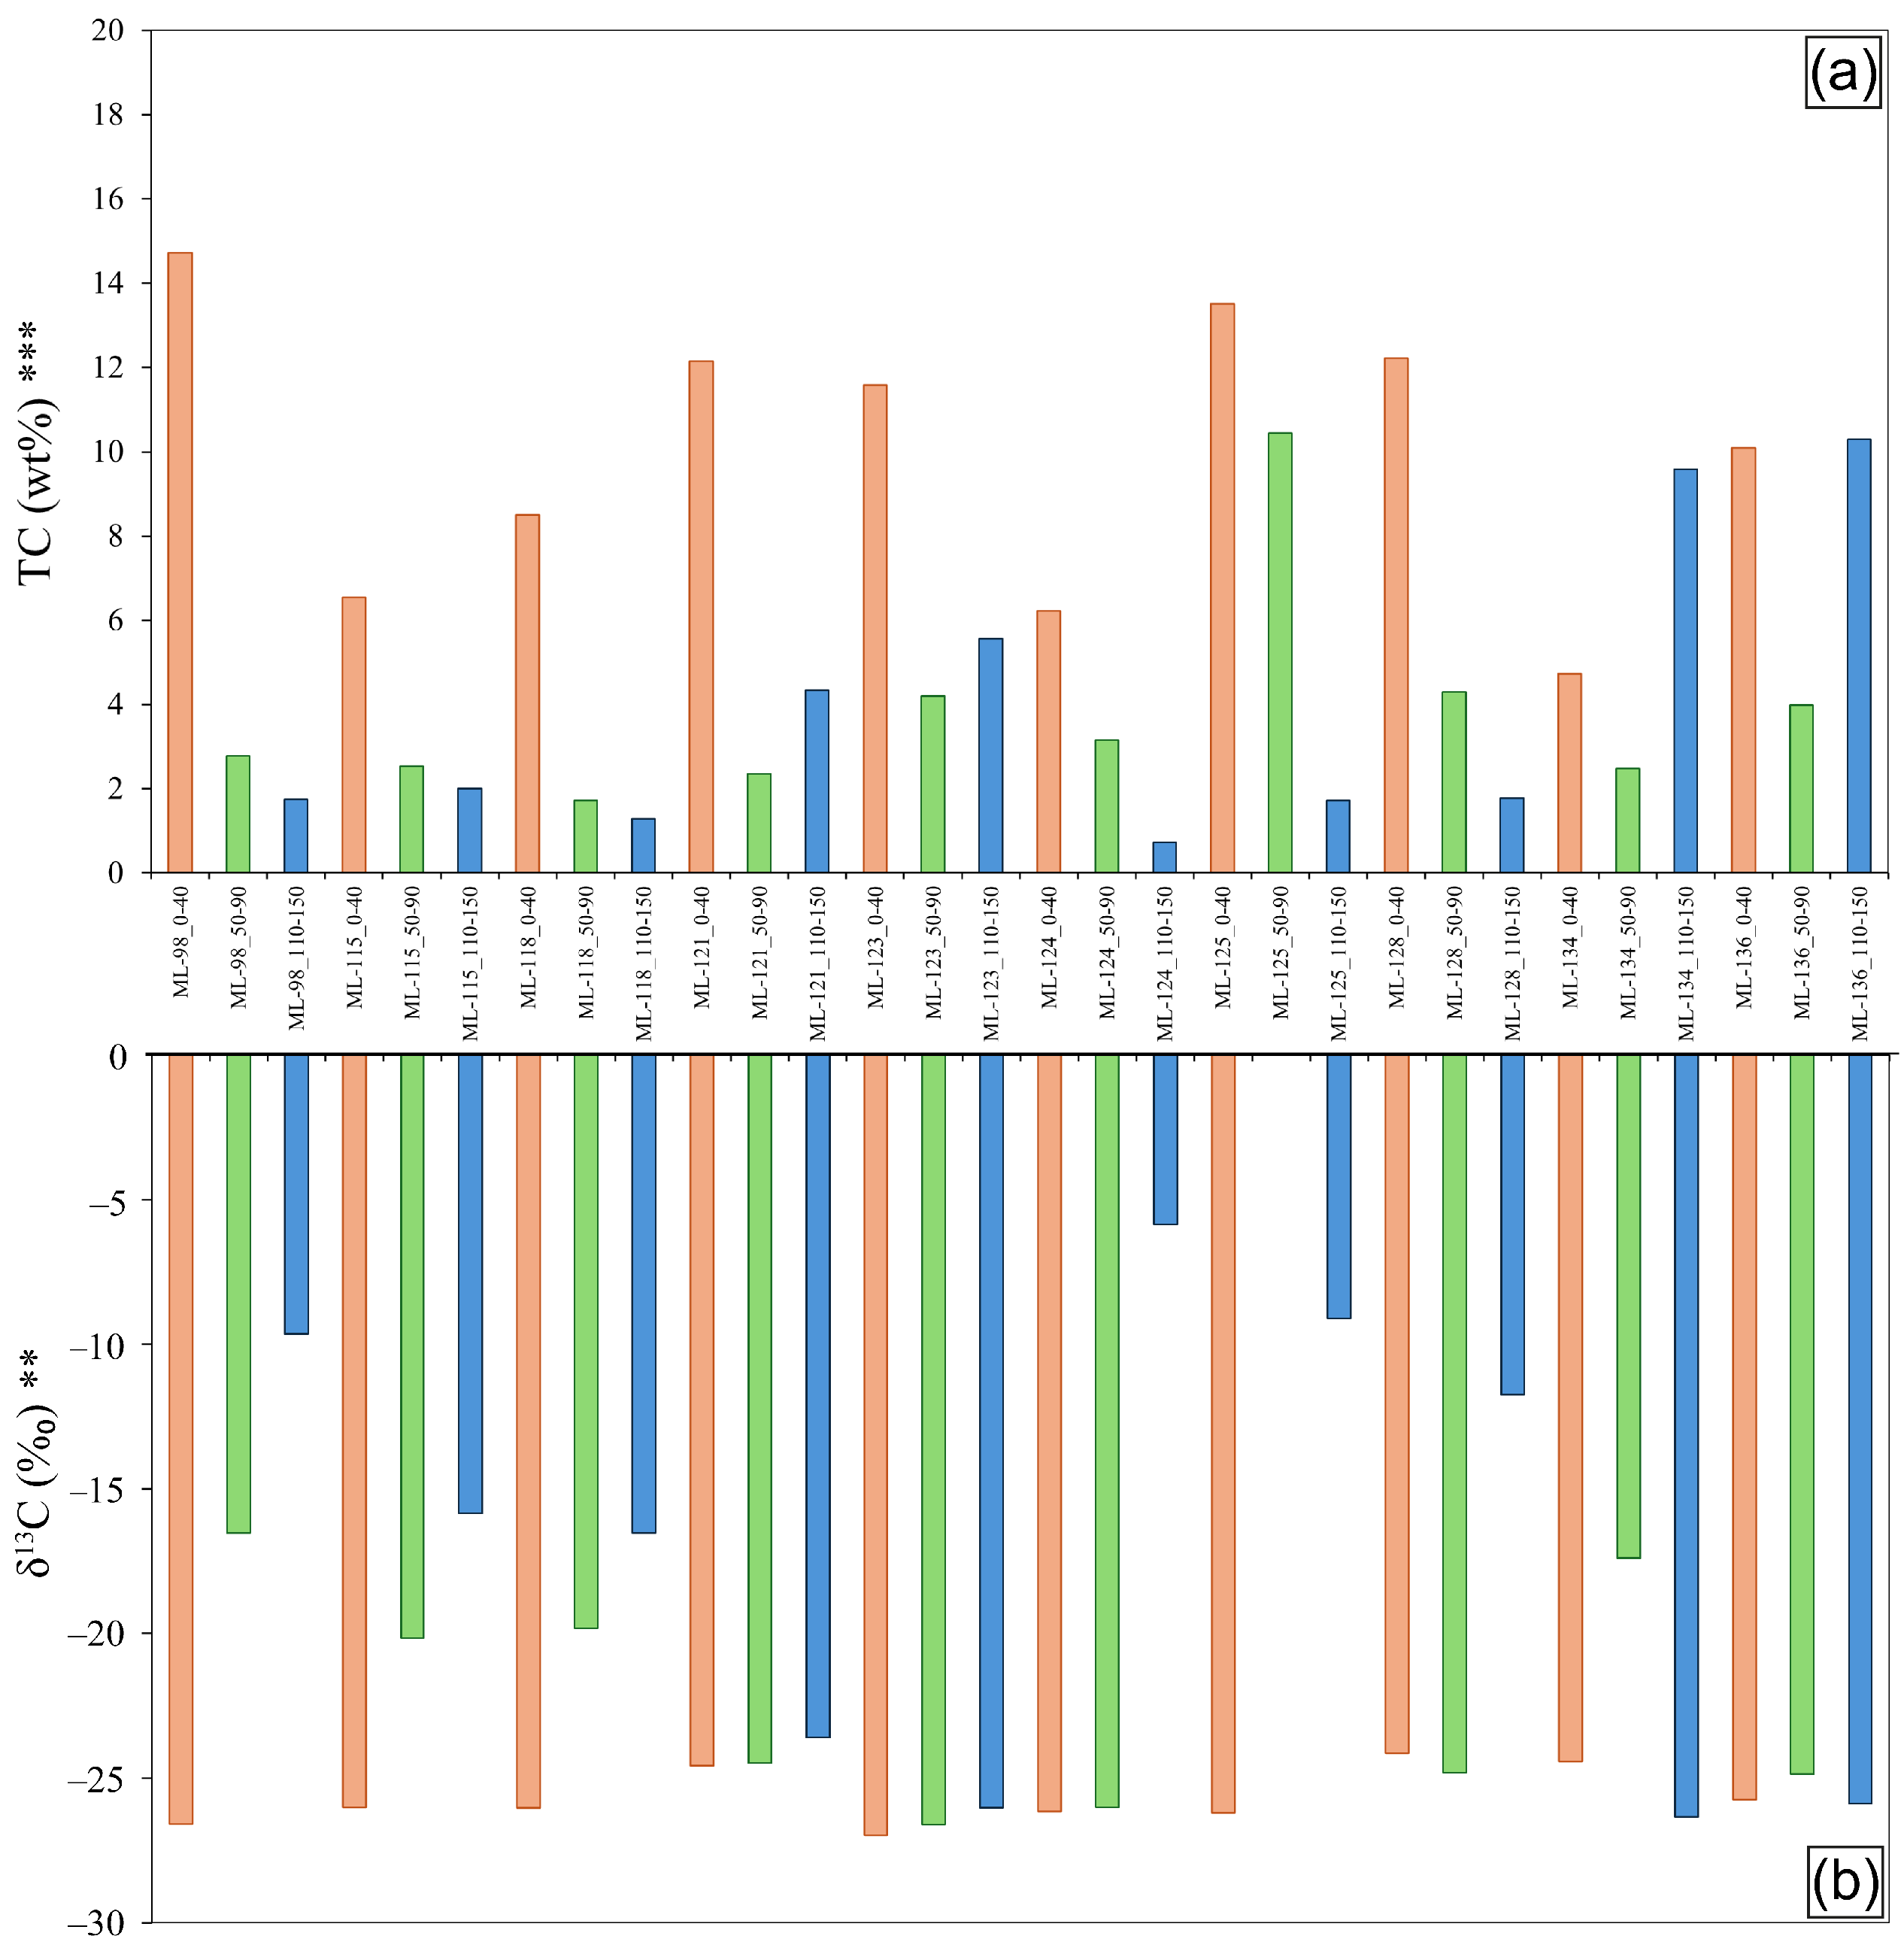
The distribution of TC concentrations across the sampled soil profiles (Figure 5a) follows a clear pattern typical of saline soil, closely resembling that of OC. In the 0–40 cm depth interval, TC levels are relatively high and almost identical to those of OC. This similarity persists in the deeper horizons (50–90 cm and 110–150 cm), where TC and OC concentrations remain very close, indicating that nearly all the carbon present in the investigated area is of organic origin. Shifts in δ 13C values with increasing depth are suggestive of enhanced organic matter decomposition, as microbial processing tends to enrich the remaining carbon in 13C due to isotopic fractionation. The isotopic signatures of TC along the sampled soil profiles (Figure 5b) for the layer 0–40 cm range from −27.0% to −24.1%, characteristic of C3 plants [36,37,38], and suggest a significant contribution from crops like wheat, barley, soybean, sugar beet, rapeseed, and tomato, characteristic of temperate regions and cultivated in ML.
In the depth of 50–90 cm, δ 13C varies from −26.60% to −16.53%. ML-123 (−26.60%) and ML-124 (−26.01%) still portray C3-sourced OC, whereas ML-98 (−16.53%) and ML-134 (−17.40%) are much less negative, which indicates selective removal of lighter 12C by microbial reworking and deposition of residue concentrated with 13C [39,40]. Deeper, at 110–150 cm, δ 13C increases once more to −26.35% and −5.84%. Though ML-123 (−26.03%) and ML-136 (−25.89%) still signify C3 inputs of residual peat, ML-98 (−9.64%) and ML-124 (−5.84%) show significant 13C enrichment.

3.4. Ion Dynamics and EC Correlations in Saline Soils

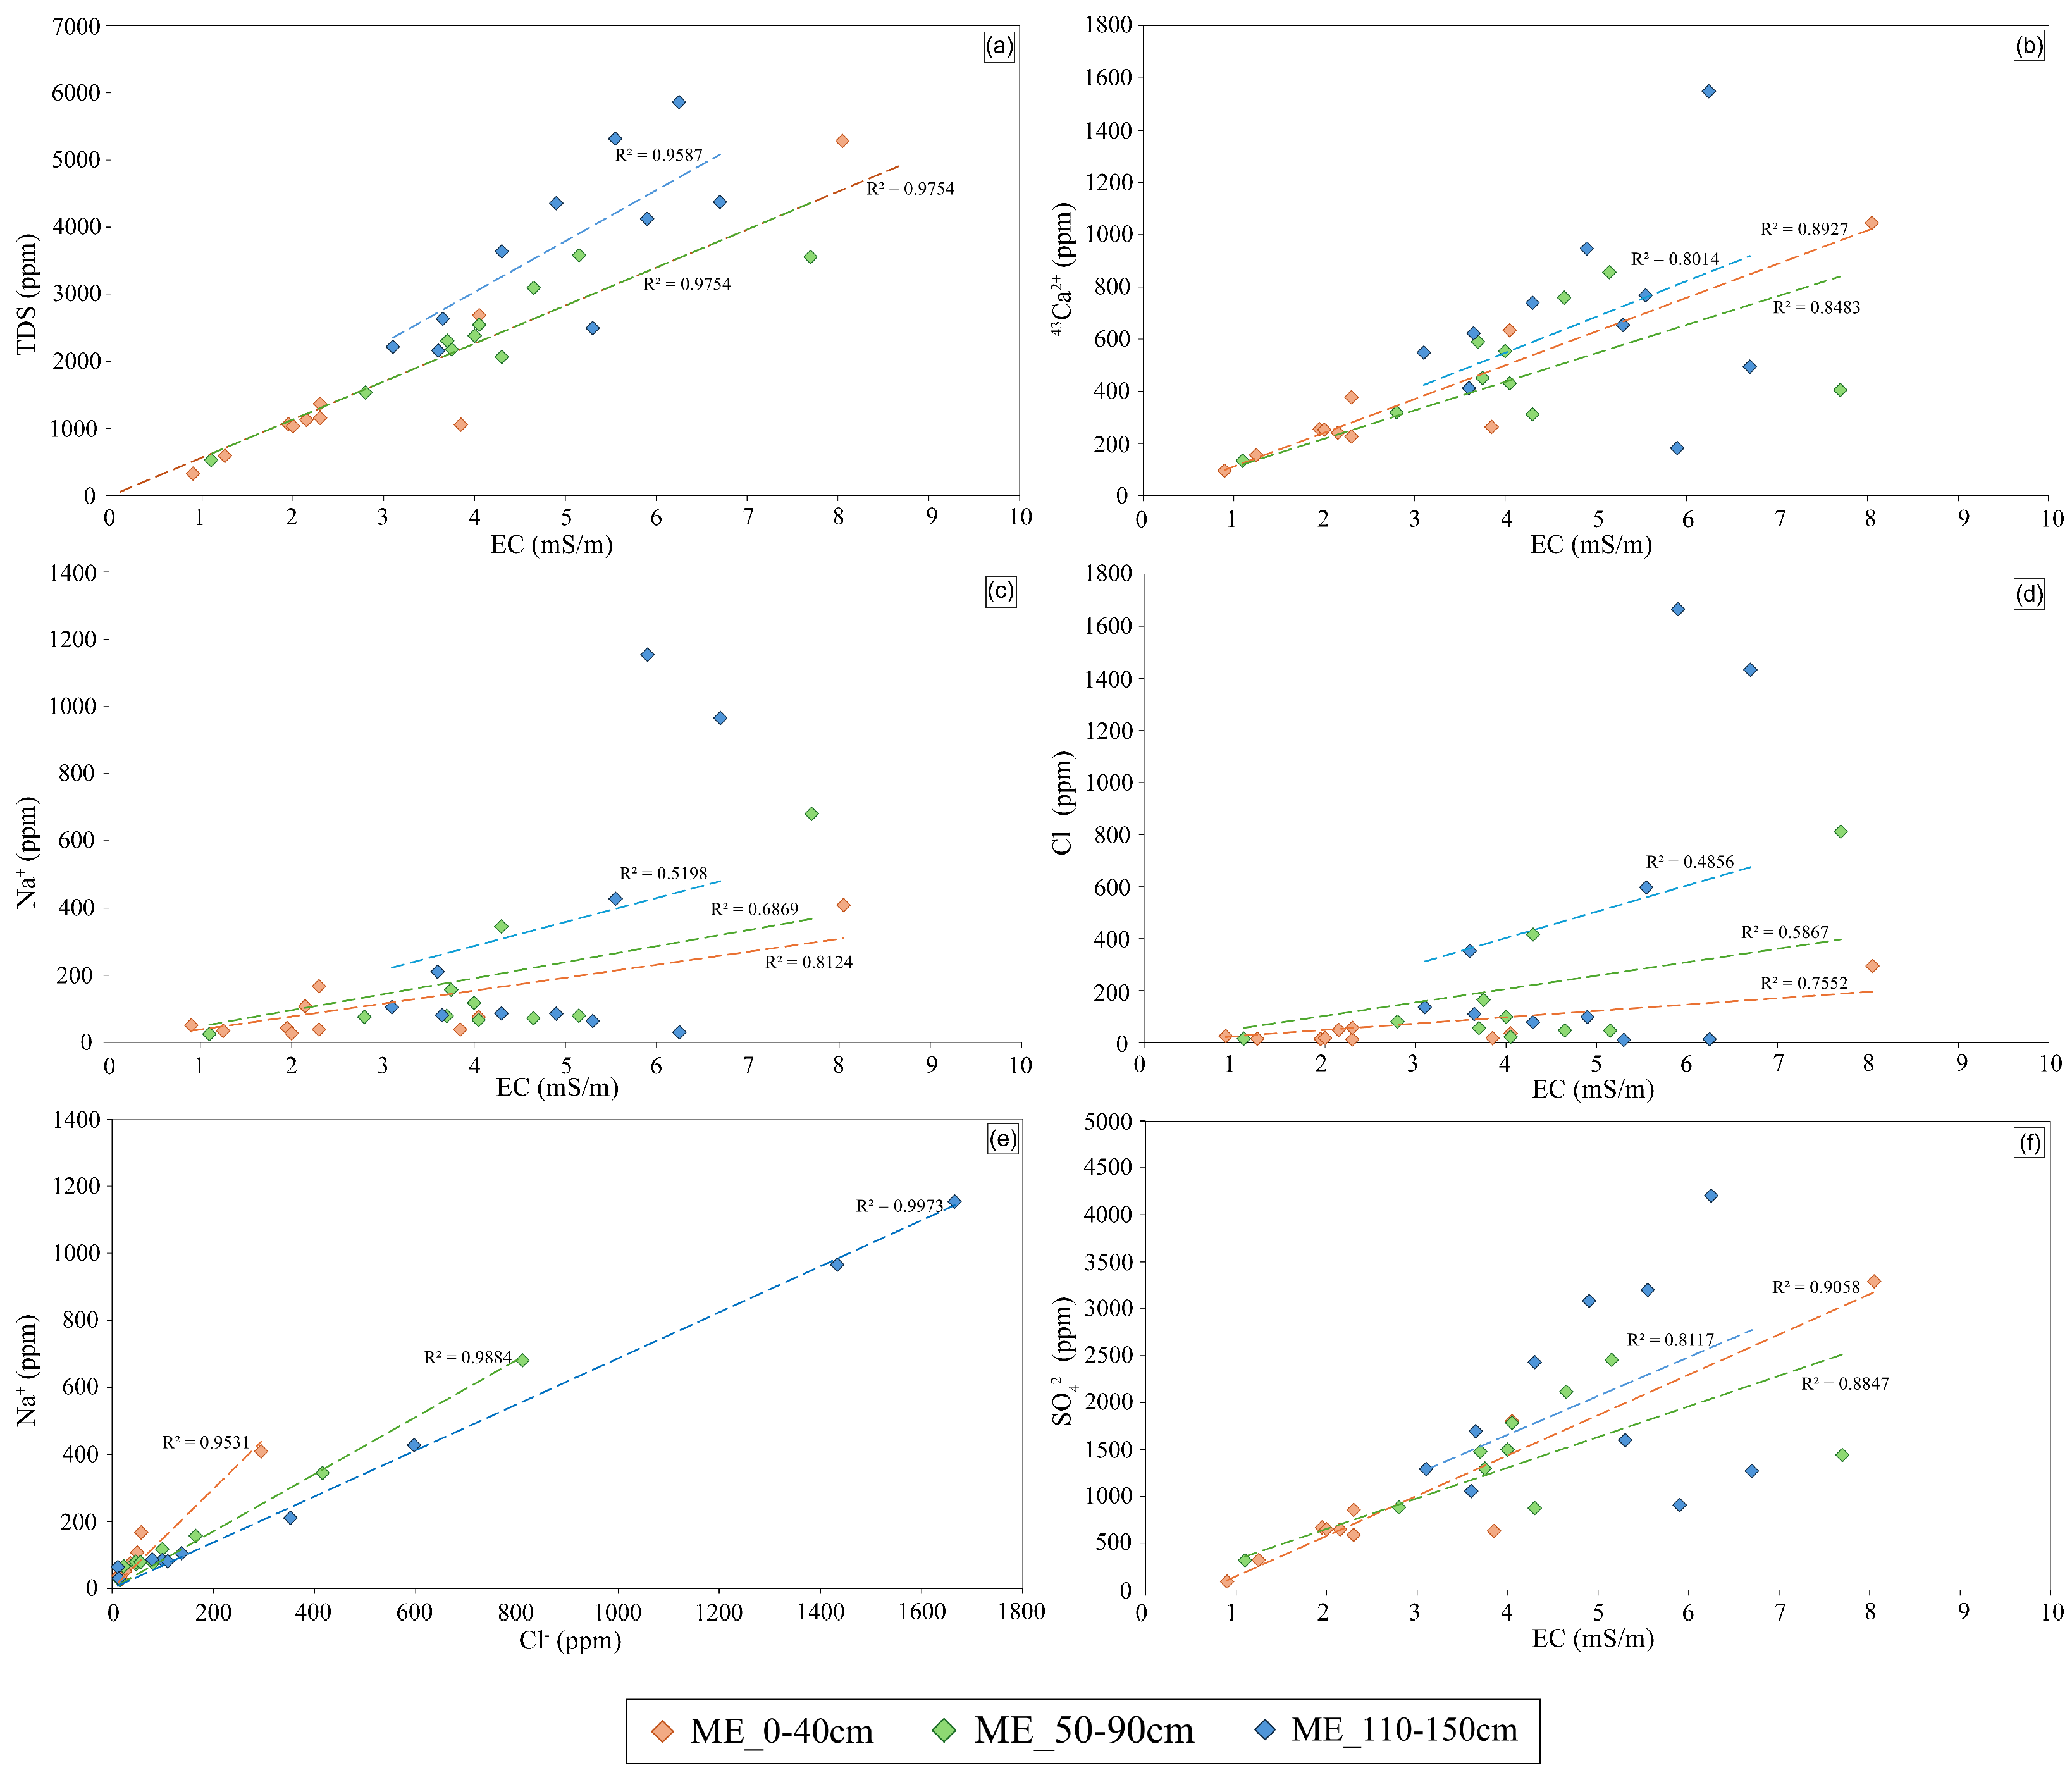
The plot of Figure 6a illustrates a strong positive correlation between TDS and EC, with particularly high R 2 values (∼0.98 for depths of 0–40 cm and 50–90 cm, ∼0.96 for 110–150 cm). This confirms that EC serves as an excellent proxy for estimating soil salinity, which is characterised by high concentrations of total dissolved solids, a typical feature of environments with strong marine influence [41,42,43].
Like the EC values, all the ions’ contents tend to decrease with depth, including the nitrate concentration (NO3; Supplementary Table S2), whose contents are higher in the superficial horizons due to the use of N-fertilisers by farmers for the agricultural activities. Below we described in detail the correlation between EC and the main cations and anions. Irrespectively to the sampling depth, in the ML soils, the most abundant cation is Ca2+, mainly due to the carbonatitic or aragonitic shells of calcifying organisms such as molluscs and foraminifera, which were buried in the soils as they accumulate. The strong positive correlation between Ca2+ and EC ( R 2 = 0.80 0.89 ; Figure 6b) in all the depths emphasises the significant role of this cation in shaping soil salinity. In addition, the pH also shows neutral-alkaline values (Supplementary Table S2) in all the soil layers, despite the presence of organic matter which should lower the pH. The widespread presence of bivalve shells has evidently buffered the soil pH.
Sodium (Na+) displays a clear positive correlation with EC ( R 2 = 0.52 0.81 ; Figure 6c). The strongest correlation ( R 2 = 0.81 ) is observed in the 0–40 cm soil layer, indicating that sodium is a primary determinant of surface soil salinity. Similarly, chloride (Cl) correlates positively with EC, though with slightly lower R 2 values ( 0.49 0.76 ; Figure 6d), with the highest correlation found in the 0–40 cm layer. The stronger correlation of Na+ compared to Cl indicates that sodium accumulation is more closely linked to EC variations in these soils. However, differences in R 2 values across depths reflect the influence of soil heterogeneity and water movement on ion distribution.
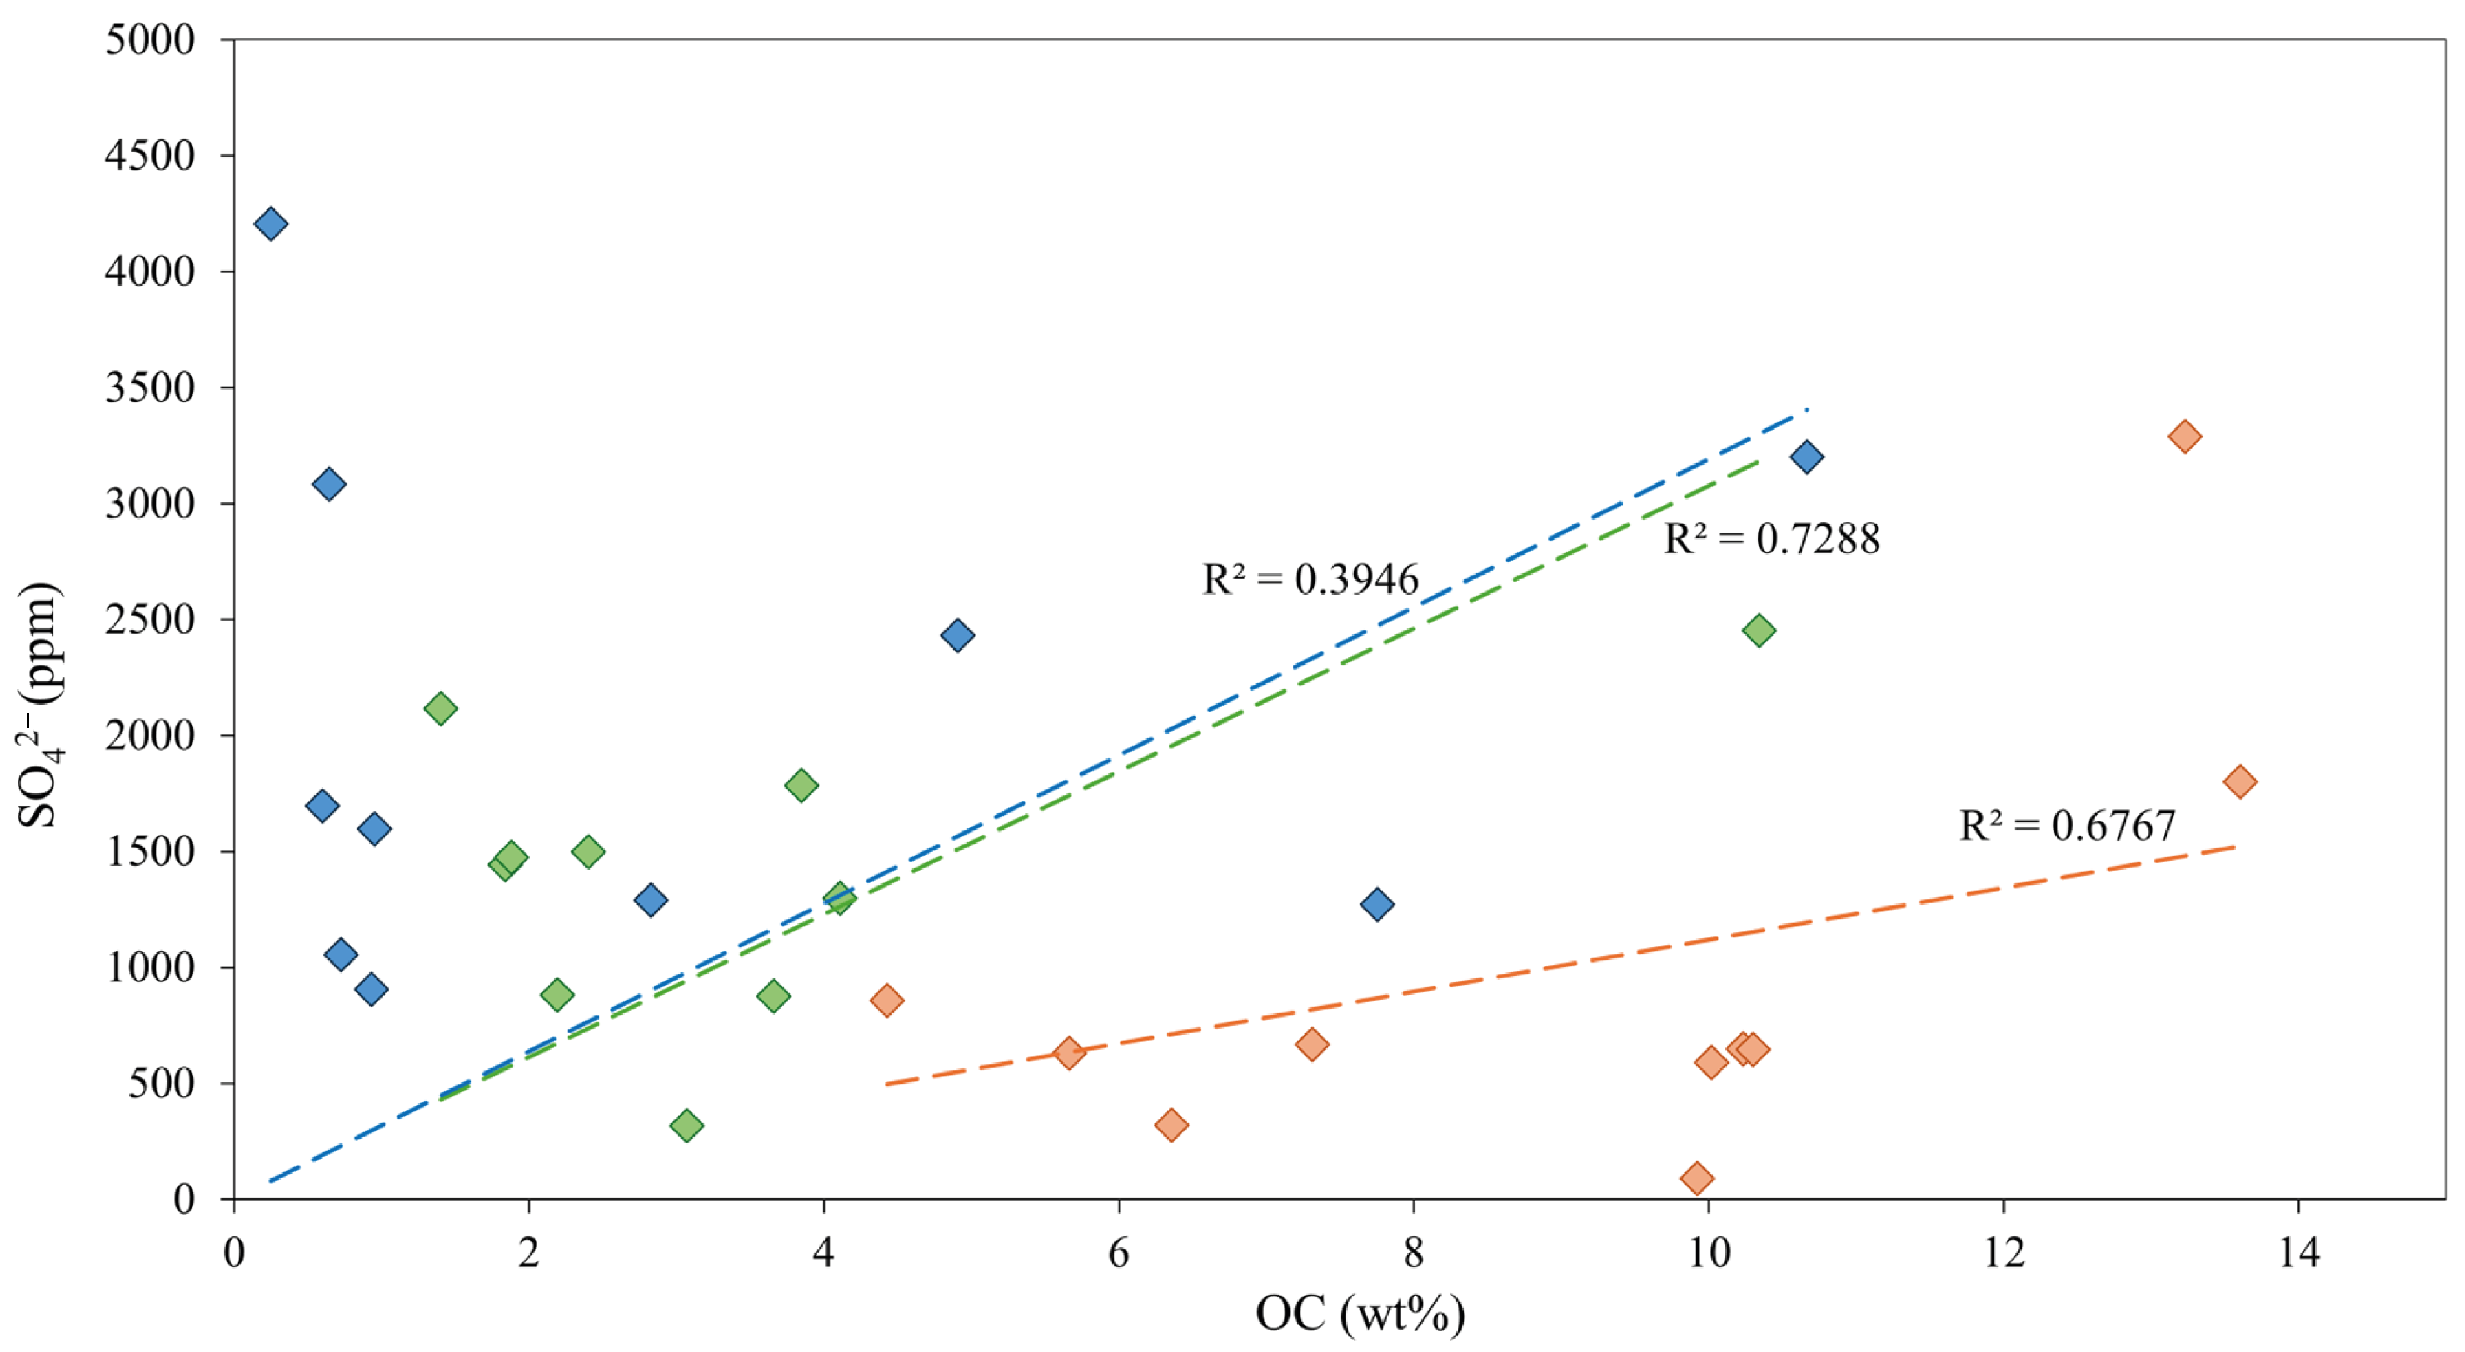
Sulphate ions (SO42−) exhibit a strong correlation with EC ( R 2 = 0.81 0.91 ; Figure 6f), highlighting their key role in soil salinity. In addition, the positive correlation between OC and SO42− ( R 2 = 0.68 0.73 ; Figure 7) suggests that OC significantly influences sulphate distribution in the sampled peat-rich and saline soils.

3.5. Soil Stratigraphy and Peatland Thickness Analysis Through GPR Data

Continuous monitoring of remaining peat deposits in the Mezzano Lowland is essential for assessing soil evolution, carbon storage, and greenhouse gas emissions. Ground-Penetrating Radar (GPR) provides high-resolution, non-invasive subsurface imaging, enabling quantification of soil properties like moisture and stratigraphy based on dielectric permittivity [44]. We conducted GPR surveys in an ML agricultural field with high pedological and geomorphological variability (Figure 8a), using a dual-frequency system along four different lines (Figure 8b). Nine soil cores (s1–s9; Figure 8c) were collected along the first of these profiles to calibrate radargrams, linking wave velocity to depth and refining stratigraphic interpretation.
Stratigraphic analysis revealed an upper layer of organic-rich and dark brown material characteristic of peat lying above a grey sand layer (s1, s2, s7, s8). In certain locations, there was a thin intermediate reddish-brown, slightly oxidised silt layer between the sand and the peat (s3, s4, s5, s6, s9). The GPR survey successfully defined a reflector at the peat–sand interface and an integration between direct and GPR data permitted to estimate an electromagnetic velocity of about 0.13 m /ns (Figure 8c). The stratigraphic contact between the Peat/Silt and Sand layers is well detected on the radargram, at least up to about 1 m. As the Peat/Silt layer increases in thickness (>1 m) the GPR is no longer able to detect it, due to clay-rich soils that absorb and attenuate GPR signals, limiting depth penetration.
Despite these constraints, our study confirms GPR as a viable non-invasive method for mapping peat thickness and subsurface stratigraphy at large scales [22,45]. The peat–sand interface was most effectively detected where peat overlay sand directly, with pedological boundaries detectable with accuracy. This case study illustrates how the integration of GPR with direct sampling improves the efficiency and precision of peatland surveys with significant implications for environmental monitoring, carbon storage inventories, and land-use planning [22].
Expansion of GPR applications across the Mezzano Lowland would be valuable for addressing peat thickness variation, which would be an effective monitoring metric for subsidence, carbon loss, and long-term land-use change impacts [46]. Given the region’s role as a source of greenhouse gases via peat oxidation, CH4 emissions, and spontaneous combustion, high-resolution mapping of peat deposits would inform carbon stock depletion assessments and conservation priority areas. Employment of 3D GPR survey grids, rather than single line transects, would enhance volumetric stratigraphic models, which would improve our understanding of peatland dynamics and support sustainable land management policy aimed at minimising environmental degradation further [22,47].

4. Discussion

Soil Property Data 66 Years After ML Wetland Drainage

The box plots in Figure 9 compare the present dataset with historical data from Boschi and Spallacci [17] for four key soil parameters: EC, sulphate concentration, N, and SOM. The Van Bemmelen factor (=1.724) was applied [48] to convert OC measured for the sample of this study into SOM, assuming that SOM consists of 58% OC [49].
The ANOVA and Tukey’s HSD post hoc tests showed that EC and sulphate contents were significantly affected by the year of sampling. In fact, there is a sharp decline in EC and sulphate levels during the past 66 years. The historical dataset recorded EC in the range of 22.9–127.8 m S /cm at the 0–50 cm depth and 47.6–196.4 m S /cm at the 50–100 cm depth (Figure 9a; [17]). On the other hand, the present dataset records consistently lower EC values across all depths, particularly in the surface and intermediate soil horizons. The reduction in EC suggests a redistribution of salts, most likely due to leaching processes having depleted the upper horizons of salts over time. However, high EC values in deeper levels in the present dataset can reflect the influence of saline groundwater and limited vertical drainage, suggesting a deviation from the historical salinity patterns of the lacustrine environment prior to the land-use change [17]. Similarly, sulphate concentrations (Figure 9b) show a consistent decline in the present dataset relative to the historical values. In the historical dataset, sulphate concentrations ranged from 3600 to 7440 ppm at 0–50 cm and from 4704 to 19,440 ppm at 50–100 cm depth [17]. The 2023 dataset, however, has considerably lower sulphate concentrations with an increasing trend with depth. This reduction in sulphate availability has important implications for greenhouse gas dynamics, particularly methane cycling. In wetland soils, higher salinity levels, especially from sulphates, are known to inhibit CH4 emissions by suppressing methanogenic archaea activity and altering microbial competition. Elevated salinity can also reduce the diversity and shift the structure of methanotrophic communities responsible for methane oxidation, thereby limiting CH4 turnover [50,51,52]. Conversely, the observed decline in sulphate concentrations in Mezzano soils may have weakened this microbial control, reducing competition from sulphate-reducing bacteria and enabling increased methane production under anaerobic conditions [53,54].
Despite the differences in measurement methodologies between the historical and current datasets, which were carefully considered to ensure comparability, according to the ANOVA and post hoc tests, N, OC, and SOM are strongly affected by the year of sampling and the depth. Nitrogen concentrations in the current dataset differ greatly from the historical records of Boschi and Spallacci [17]. Former N levels (Figure 9c) were higher at depth, ranging from 0.58 to 1.11 wt % in the 0–50 cm horizon to 1.37 to 1.64 wt % in the 50–100 cm horizon. In contrast, the present dataset contains higher nitrogen levels in the surface horizons (0–40 cm). This shift may reflect higher organic inputs over recent decades, perhaps a result of agricultural amendments or increased peat breakdown. The decreasing N content at lower depths suggests mineralisation rate changes, as well as deposition and retention process changes of organic matter that have been increasing with the passage of time [55]. The SOM decrease is among the most significant trend that has been identified in the current research (Figure 9d). Historical SOM contents ranged between 15.20 and 32.80 wt % in the 0–50 cm layer and between 51.90 and 60.40 wt % in the 50–100 cm layer [17], indicating that organic matter in the past was more stable. Nevertheless, the present dataset illustrates the significant reduction in SOM, particularly in deeper layers, as shown in Figure 9d. This SOM loss is attributable to changes in land management, namely increased drainage and aeration, promoting microbial decomposition and organic matter oxidation. These trends are consistent with other findings showing that agricultural utilisation and land drainage can drive SOM loss from peat soils [15,56,57]. As it is known, the enhanced mineralisation of SOM, induced particularly by intensified aeration and microbial activity, leads to enormous CO2 emissions [58,59]. In the Mezzano Lowland, this situation could be further influenced by decreased sulphate availability, which may affect microbial community dynamics. Specifically, reduced competition between sulphate-reducing bacteria and methanogenic archaea has been suggested as a mechanism that could potentially enhance methane production [53,54].
The preservation of SOM in deep soil layers can be attributed to several pedogenic mechanisms. Anoxic conditions in saturated soils, exemplified by those where samples ML-98, ML-123, ML-134, and ML-136 were collected in wetlands, can retard organic matter degradation [40,60,61]. Furthermore, the formation of recalcitrant humic substances promotes the stabilisation of SOM [62]. Organomineral interactions, involving SOM bonding with clays and Fe/Al oxides, enhance this stability by limiting microbial access and thus reducing SOM decomposition [63,64]. The OC and N levels observed in some deep ML samples likely arise from a combination of these processes. Specifically, samples ML-123, ML-134, and ML-136 were collected from areas adjacent to soils with a clay-loam texture (Figure 2b), as indicated by mapping from Maino et al. [26] and Di Giuseppe et al. [20]. Clays, with their large specific surface area and high cation exchange capacity, render organic matter less accessible to decomposer organisms [65]. This mechanism protects SOM, allowing OC to persist in recalcitrant forms within deep soils over extended time scales [66,67,68]. Such enrichment in 13C is characteristic of high-salinity regimes that redefine microbial communities to favour the dominance of halotolerant archaea with metabolic processes, methanogenesis, and sulphur cycling, proposed to be able to fractionate carbon and leave behind residual OC that is 13C-enriched [69,70,71]. Therefore, the amplitude increases and 13C enrichment with depth likely signifies prolonged saline stress, altered microbial assemblages, and enhanced organic matter decomposition along the profile [69,70].
Processes such as precipitation-driven leaching tend to reduce Na+ concentrations, whereas evaporation enhances accumulation through capillary rise [72]. Additionally, vegetation plays a role in sodium dynamics, either through root uptake or, in some cases, retention via secretions [73,74,75]. The use of irrigation water with high Na+ and Cl content, like those used in the ML area, can significantly alter the soil ionic composition, leading to organic carbon depletion and decreased microbial activity in the most superficial layers [76]. At greater depths (110–150 cm), the correlation between Na+ and Cl becomes more stable (Figure 6e), indicating a diminished influence of surface processes and a stronger imprint of marine salinity, reflecting the geological history of the Mezzano Lowland. The relationship between sulphate ions and organic carbon is likely driven by interactions between organic matter and sulphur cycling processes, including adsorption onto humic substances and microbial sulphate reduction [61,77]. Since the majority of soil sulphur is expected to be associated with organic matter, sulphate in these highly organic soils can be retained through adsorption onto humic substances or undergo microbial reduction under anoxic conditions, leading to the formation of reduced sulphur compounds [61]. Additionally, the interaction between organic matter and sulphates is strongly influenced by sodium content and fluctuating redox conditions, affecting ion mobility and nutrient availability for plants [76,78]. The variability in sulphate concentrations at similar OC levels suggests that additional factors, such as redox fluctuations, soil texture, and drainage conditions, influence sulphate mobility [79]. The stronger correlation observed in one dataset (i.e., 50–90 cm soil depth) may indicate a more dynamic sulphur cycling process, particularly in peat-rich layers where organic matter decomposition drives sulphate transformations [80]. Given the saline nature of these soils, the presence of competing anions, such as chloride, may also affect sulphate availability and mobility [76].
In addition, the ML is affected by peat burning, which triggers at specific depths and develops in the 10–70 cm-deep soil horizons via smouldering combustion [19]. Natali et al. [19] demonstrated that peat burning intensified carbon loss in deep horizon, depleting stable carbon pools and altering soil composition, further influencing elevated CO2 and CH4 emissions (with fluxes up to 120 g / m 2 /day, according to Cremonini et al. [81]). Based on Natali et al. [19] estimates, the average loss of SOC stock within the first metre of soil depth is approximately 110 k g /m2, potentially corresponding to around 580 k g CO 2 / m 3 of emissions. Moreover, ML peat soils are known for methane seepage and localised thermal anomalies, which have been recorded down to 1 m depth [82], further highlighting the influence of ongoing subsurface peat oxidation and associated biogeochemical processes. Rising temperatures and extreme climatic events, such as the 2022 heatwave and drought, could also have intensified the biogeochemical changes in the Mezzano Lowland [83]. These processes suggest that the Mezzano Lowland may have undergone a transition from functioning primarily as a carbon sink to acting as a potential source of CO2 and CH4, underscoring the possible implications of land-use change on greenhouse gas dynamics.

5. Conclusions

This study highlights the long-term consequences of agricultural practices and land-use conversion on the hydrogeochemical characteristics of the Mezzano Lowland (ML), a historically significant coastal wetland. Our comparative analysis of current soil parameters with pre-drainage data unequivocally demonstrates a fundamental shift in the peat soil’s chemical and biogeochemical processes over 66 years. The observed substantial decline in salinity and sulphate levels in the upper soil layers underscores the pervasive impact of sustained leaching, profoundly altering the soil’s ionic composition. Critically, the reduction in sulphate concentration carries significant implications for greenhouse gas dynamics, specifically by favouring methane production through a diminished competitive inhibition of methanogenic archaea by sulphate-reducing bacteria in anaerobic zones. These findings collectively emphasise that the conversion of this wetland to agricultural land has not only reshaped the physical and chemical properties of its peat soils but has also initiated a cascade of biogeochemical changes with direct relevance to regional carbon cycling and greenhouse gas emissions.
SOM loss is likely driven by enhanced drainage, increased aeration, peat burning, and climate change, all of which are known to accelerate microbial decomposition and carbon oxidation. While direct measurements of CO2 or CH4 fluxes were not reported in this study, these processes may indicate a shift in the Mezzano Lowland from functioning as a carbon sink to potentially acting as a source of greenhouse gases. This possibility supports the relevance of restoration practices, such as the Blue Carbon programme, in recovering lost ecosystem services and contributing to climate change mitigation [84]. The success of such initiatives will rely on integrated geochemical and geophysical assessments to develop site-specific and effective restoration strategies. This study also highlights the utility of Ground-Penetrating Radar (GPR), combined with soil sampling and carbon isotopic analysis, for mapping residual peat thickness and tracking carbon loss. GPR provides a cost-effective, non-invasive alternative to traditional coring methods, enhancing the resolution of peat–mineral soil boundaries and supporting long-term monitoring of soil organic matter (SOM). Expanding its application to three-dimensional survey grids could further improve our understanding of peatland processes and inform sustainable land management policies.
To address these challenges, a transition to more sustainable land use is essential. This involves overhauling agriculture through improved farming practices, restoring wetlands, and halting over-exploitation. Specifically, the restoration of the ML’s hydrology through re-flooding can rejuvenate its hydrological functions, sequester additional carbon, increase biodiversity, and support ecotourism. This approach would augment ecological integrity while generating economic benefits. Overall, the study calls for urgent strategies that reconcile agricultural productivity with environmental sustainability to protect soil health, reduce emissions, and enhance climate resilience.

Supplementary Materials

The following supporting information can be downloaded at: https://www.mdpi.com/article/10.3390/land14081621/s1, Table S1: Physico-chemical parameters, including pH, electrical conductivity (EC), sulphate (SO42−), content of organic carbon (OC), nitrogen (N) and soil organic matter (SOM) of soil samples collected by Boschi and Spallacci (1974) in 1967–1968 at Mezzano Lowland at 0–50 cm and 50–100 cm of depth; Table S2: Physico-chemical parameters, including pH, electrical conductivity (EC), total dissolved solids (TDS), concentration of chloride (Cl), nitrates (NO3), sulphate (SO42−), potassium (K+), sodium (Na+), magnesium (Mg2+), calcium (Ca2+), contents of organic carbon (OC), total carbon (TC), nitrogen (N) and isotopic carbon signature ( δ 13 C), contents of soil organic matter (SOM) of soil samples collected at different depth at the Mezzano Lowland in 2023 for this work.

Author Contributions

Conceptualization, A.S., E.R. and G.B.; Methodology, A.S., V.B., E.R. and G.B.; Software, A.S. and V.B.; Validation, A.S. and V.B.; Formal analysis, A.S.; Investigation, A.S., E.R. and G.B.; Resources, A.S.; Data curation, A.S. and V.B.; Writing—original draft, A.S. and V.B.; Writing—review and editing, A.S., V.B., E.R. and G.B.; Visualization, A.S.; Supervision, E.R. and G.B.; Funding acquisition, A.S., E.R. and G.B. All authors have read and agreed to the published version of the manuscript.

Funding

This work is supported by the Emilia-Romagna Region fund “Territorio: transizione tecnologica, culturale, economica e sociale verso la sostenibilità pr fse+ 2021/2027 priorità 2.” Grant number [PA 2023-19070/RER Codice CUP F71J23000030009].

Data Availability Statement

The raw data supporting the conclusions of this article will be made available by the authors on request.

Conflicts of Interest

The authors declare that they have no known competing financial interests or personal relationships that could have appeared to influence the work reported in this paper.

Abbreviations

The following abbreviations are used in this manuscript:
GHGGreenhouse Gas
SOCSoil Organic Carbon
SOMSoil Organic Matter
MLMezzano Lowland

References

  1. Ballut-Dajud, G.A.; Sandoval Herazo, L.C.; Fernández-Lambert, G.; Marín-Muñiz, J.L.; López Méndez, M.C.; Betanzo-Torres, E.A. Factors affecting wetland loss: A review. Land 2022, 11, 434. [Google Scholar] [CrossRef]
  2. Lal, R. Carbon sequestration. Philos. Trans. R. Soc. B Biol. Sci. 2008, 363, 815–830. [Google Scholar] [CrossRef]
  3. Mitsch, W.J.; Gosselink, J.G. Wetlands; John Wiley & Sons: Hoboken, NJ, USA, 2015. [Google Scholar]
  4. Gedan, K.B.; Silliman, B.R.; Bertness, M.D. Centuries of human-driven change in salt marsh ecosystems. Annu. Rev. Mar. Sci. 2009, 1, 117–141. [Google Scholar] [CrossRef] [PubMed]
  5. Ma, Z.; Melville, D.S.; Liu, J.; Chen, Y.; Yang, H.; Ren, W.; Zhang, Z.; Piersma, T.; Li, B. Rethinking China’s new great wall. Science 2014, 346, 912–914. [Google Scholar] [CrossRef] [PubMed]
  6. Xia, S.; Song, Z.; Yu, B.; Fan, Y.; Tony, V.; Guo, L.; Li, Q.; Fan, Y.; Zhang, Z.; Wang, Y.; et al. Land use changes and edaphic properties control contents and isotopic compositions of soil organic carbon and nitrogen in wetlands. Catena 2024, 241, 108031. [Google Scholar] [CrossRef]
  7. Bianchi, A.; Larmola, T.; Kekkonen, H.; Saarnio, S.; Lång, K. Review of greenhouse gas emissions from rewetted agricultural soils. Wetlands 2021, 41, 108. [Google Scholar] [CrossRef]
  8. Page, S.E.; Rieley, J.O.; Banks, C.J. Global and regional importance of the tropical peatland carbon pool. Glob. Change Biol. 2011, 17, 798–818. [Google Scholar] [CrossRef]
  9. Hooijer, A.; Silvius, M.; Wösten, H.; Page, S. PEAT-CO2. Assessment of CO2 Emissions from Drained Peatlands in SE Asia; Delft Hydraulics: Delft, The Netherlands, 2006. [Google Scholar]
  10. Wils, T.H.; van den Akker, J.J.; Korff, M.; Bakema, G.; Hegger, D.L.; Hessel, R.; van den Ende, M.A.; van Gils, M.M.; Verstand, D. Measures to reduce land subsidence and greenhouse gas emissions in peatlands: A Dutch case study. Land Use Policy 2025, 152, 107500. [Google Scholar] [CrossRef]
  11. Aben, R.C.; Van De Craats, D.; Boonman, J.; Peeters, S.H.; Vriend, B.; Boonman, C.C.; Van Der Velde, Y.; Erkens, G.; Van Den Berg, M. CO2 emissions of drained coastal peatlands in the Netherlands and potential emission reduction by water infiltration systems. Biogeosciences 2024, 21, 4099–4118. [Google Scholar] [CrossRef]
  12. Escobar, D.; Manzoni, S.; Tapasco, J.; Vestin, P.; Belyazid, S. Evaluation of long-term carbon dynamics in a drained forested peatland using the ForSAFE-Peat model. Biogeosciences 2025, 22, 2023–2047. [Google Scholar] [CrossRef]
  13. Webster, K.L.; Strack, M.; Balliston, N.; Davies, M.A.; Hettinga, E.K.; Hunter, M.; Kleinke, K.; Schmidt, M.; Barreto, C.; Bird, M.; et al. Data and knowledge needs for improving science and policy for peatlands in Canada in a changing world: Insights from Global Peatlands Initiative Workshop, June 2023. FACETS 2025, 10, 1–19. [Google Scholar] [CrossRef]
  14. Nature. The manicured wetland that sucks up more carbon than a natural marsh. Nature 2020, 577, 452. [Google Scholar] [CrossRef]
  15. Salani, G.; Bianchini, G.; Brombin, V.; Natali, C. Soil organic carbon data comparison after 85 years and new 13C/12C compositions: The case study of the Ferrara province (Northeastern Italy). J. Environ. Qual. 2024, 53, 147–161. [Google Scholar] [CrossRef] [PubMed]
  16. Simeoni, U.; Corbau, C. A review of the Delta Po evolution (Italy) related to climatic changes and human impacts. Geomorphology 2009, 107, 64–71. [Google Scholar] [CrossRef]
  17. Boschi, V.; Spallacci, P. Caratteristiche chimiche e agronomiche dei terreni salini della nuova bonifica del Mezzano. Ann. Dell’Istituto Sper. Agron. Bari 1974, 5, 263–363. [Google Scholar]
  18. GEMINA (Geomineraria Nazionale). Ligniti e Torbe dell’Italia Continentale; ILTE: Torino, Italy, 1963; p. 319. [Google Scholar]
  19. Natali, C.; Bianchini, G.; Cremonini, S.; Salani, G.M.; Vianello, G.; Brombin, V.; Ferrari, M.; Vittori Antisari, L. Peat soil burning in the Mezzano Lowland (Po Plain, Italy): Triggering mechanisms and environmental consequences. Geohealth 2021, 5, e2021GH000444. [Google Scholar] [CrossRef]
  20. Di Giuseppe, D.; Bianchini, G.; Vittori Antisari, L.; Martucci, A.; Natali, C.; Beccaluva, L. Geochemical characterization and biomonitoring of reclaimed soils in the Po River Delta (Northern Italy): Implications for the agricultural activities. Environ. Monit. Assess. 2014, 186, 2925–2940. [Google Scholar] [CrossRef]
  21. Natale, M. Soil Bio-Indicators in Different Pedoclimatic Regions of the Padana Plain (Northeast Italy). Ph.D. Thesis, University of Bologna, Bologna, Italy, 2017. [Google Scholar]
  22. Comas, X.; Terry, N.; Slater, L.; Warren, M.; Kolka, R.; Kristiyono, A.; Sudiana, N.; Nurjaman, D.; Darusman, T. Imaging tropical peatlands in Indonesia using ground-penetrating radar (GPR) and electrical resistivity imaging (ERI): Implications for carbon stock estimates and peat soil characterization. Biogeosciences 2015, 12, 2995–3007. [Google Scholar] [CrossRef]
  23. Parry, L.; West, L.; Holden, J.; Chapman, P. Evaluating approaches for estimating peat depth. J. Geophys. Res. Biogeosci. 2014, 119, JG002411. [Google Scholar] [CrossRef]
  24. Soldati, A.; Chiozzi, A.; Nikolić, Z.; Vaccaro, C.; Benvenuti, E. A PROMETHEE Multiple-Criteria Approach to Combined Seismic and Flood Risk Assessment at the Regional Scale. Appl. Sci. 2022, 12, 1527. [Google Scholar] [CrossRef]
  25. Di Giuseppe, D.; Bianchini, G.; Faccini, B.; Coltorti, M. Combination of wavelength dispersive X-ray fluorescence analysis and multivariate statistic for alluvial soils classification: A case study from the Padanian Plain (Northern Italy). X-Ray Spectrom. 2014, 43, 165–174. [Google Scholar] [CrossRef]
  26. Maino, A.; Alberi, M.; Barbagli, A.; Chiarelli, E.; Colonna, T.; Franceschi, M.; Gallorini, F.; Guastaldi, E.; Lopane, N.; Mantovani, F.; et al. A deep neural network for predicting soil texture using airborne radiometric data. Radiat. Phys. Chem. 2024, 221, 111767. [Google Scholar] [CrossRef]
  27. IUSS Working Group WRB. World Reference Base for Soil Resources 2006, First Update 2007; Number 103 in World Soil Resources Reports; FAO: Rome, Italy, 2007. [Google Scholar]
  28. Koppen, W. Das geographische System de Klimate. In Handbuch der klimatologie; Verlag Gebrüder Borntrager: Berlin, Germany, 1936. [Google Scholar]
  29. Climate-Data.org. Climate Ferrara: Temperature, Climate Graph, Climate Table for Ferrara. 2025. Available online: https://en.climate-data.org/europe/italy/emilia-romagna/ferrara-3207/ (accessed on 13 June 2025).
  30. Sistema Nazionale per la Protezione Dell’Ambiente (SNPA). Il clima in Italia nel 2023; Rapporti SNPA 42/2024; Sistema Nazionale per la Protezione dell’Ambiente (SNPA): Roma, Italy, 2024. [Google Scholar]
  31. Lotti, G.; Galoppini, C. Guida Alle Analisi Chimico-Agrarie; Agricole Bologna: Bologna, Italy, 1967. [Google Scholar]
  32. Jackson, M.L. Soil Chemical Analysis; Prentice Hall: Englewood Cliffs, NJ, USA, 1958; 498p. [Google Scholar]
  33. Natali, C.; Bianchini, G. Thermally based isotopic speciation of carbon in complex matrices: A tool for environmental investigation. Environ. Sci. Pollut. Res. 2015, 22, 12162–12173. [Google Scholar] [CrossRef] [PubMed]
  34. R Core Team. R: A Language and Environment for Statistical Computing; R Foundation for Statistical Computing: Vienna, Austria, 2020; Available online: https://www.R-project.org/ (accessed on 13 June 2025).
  35. Akça, E.; Aydin, M.; Kapur, S.; Kume, T.; Nagano, T.; Watanabe, T.; Çilek, A.; Zorlu, K. Long-term monitoring of soil salinity in a semi-arid environment of Turkey. Catena 2020, 193, 104614. [Google Scholar] [CrossRef]
  36. Boutton, T.W. Stable carbon isotope ratios of soil organic matter and their use as indicators of vegetation and climate change. In Mass Spectrometry of Soils; Marcel Dekker Inc.: New York, NY, USA, 1996; pp. 47–82. [Google Scholar]
  37. Ehleringer, J.R.; Buchmann, N.; Flanagan, L.B. Carbon isotope ratios in belowground carbon cycle processes. Ecol. Appl. 2000, 10, 412–422. [Google Scholar] [CrossRef]
  38. O’Leary, M. Carbon Isotope Fractionation in plants. Phytochemistry 1981, 20, 553–567. [Google Scholar] [CrossRef]
  39. Volk, M.; Bassin, S.; Lehmann, M.F.; Johnson, M.G.; Andersen, C.P. 13C isotopic signature and C concentration of soil density fractions illustrate reduced C allocation to subalpine grassland soil under high atmospheric N deposition. Soil Biol. Biochem. 2018, 125, 178–184. [Google Scholar] [CrossRef] [PubMed]
  40. Ma, T.; Wang, Y.; Dai, G.; Jia, J.; Liu, Z.; Jia, Y.; Wang, S.; Zhu, E.; Zhang, X.; Haghipour, N.; et al. Prolonged Storage of Bound Organic Carbon in Wetland but Not Upland Soils: A 13C and 14C Perspective. Geophys. Res. Lett. 2025, 52, e2024GL112491. [Google Scholar] [CrossRef]
  41. Corwin, D.L.; Lesch, S.M. Apparent soil electrical conductivity measurements in agriculture. Comput. Electron. Agric. 2005, 46, 11–43. [Google Scholar] [CrossRef]
  42. Corwin, D.L.; Yemoto, K. Salinity: Electrical conductivity and total dissolved solids. In Methods of Soil Analysis; Soil Science Society of America: Madison, WI, USA, 2017; Volume 2. [Google Scholar]
  43. Sumner, M.E. Handbook of Soil Science; CRC Press: Boca Raton, FL, USA, 1999. [Google Scholar]
  44. Grote, K.; Hubbard, S.; Rubin, Y. Field-scale estimation of volumetric water content using ground-penetrating radar ground wave techniques. Water Resour. Res. 2003, 39, 1321. [Google Scholar] [CrossRef]
  45. Holden, J.; Burt, T.; Vilas, M. Application of ground-penetrating radar to the identification of subsurface piping in blanket peat. Earth Surf. Process. Landf. 2002, 27, 235–249. [Google Scholar] [CrossRef]
  46. Hooijer, A.; Page, S.; Jauhiainen, J.; Lee, W.; Lu, X.; Idris, A.; Anshari, G. Subsidence and carbon loss in drained tropical peatlands. Biogeosciences 2012, 9, 1053–1071. [Google Scholar] [CrossRef]
  47. Pezdir, V.; Čeru, T.; Horn, B.; Gosar, M. Investigating peatland stratigraphy and development of the Šijec bog (Slovenia) using near-surface geophysical methods. Catena 2021, 206, 105484. [Google Scholar] [CrossRef]
  48. Pribyl, D. A critical review of the conventional SOC to SOM conversion factor. Geoderma 2010, 156, 75–83. [Google Scholar] [CrossRef]
  49. Collins, M.E.; Kuehl, R. Organic Matter Accumulation and Organic Soils; Lewis Publishers: Boca Raton, FL, USA, 2000. [Google Scholar]
  50. Zhang, S.; Yan, L.; Cao, J.; Wang, K.; Luo, Y.; Hu, H.; Wang, L.; Yu, R.; Pan, B.; Yu, K.; et al. Salinity significantly affects methane oxidation and methanotrophic community in Inner Mongolia lake sediments. Front. Microbiol. 2023, 13, 1067017. [Google Scholar] [CrossRef] [PubMed]
  51. Li, F.; Li, H.; Su, H.; Du, W.; Gao, Z.; Liu, H.; Liang, H.; Gao, D. Effects of salinity on methane emissions and methanogenic archaeal communities in different habitat of saline-alkali wetlands. Environ. Sci. Pollut. Res. 2023, 30, 106378–106389. [Google Scholar] [CrossRef] [PubMed]
  52. Poffenbarger, H.J.; Needelman, B.A.; Megonigal, J.P. Salinity influence on methane emissions from tidal marshes. Wetlands 2011, 31, 831–842. [Google Scholar] [CrossRef]
  53. Ding, W.; Cai, Z.; Wang, D. Preliminary budget of methane emissions from natural wetlands in China. Atmos. Environ. 2004, 38, 751–759. [Google Scholar] [CrossRef]
  54. Laanbroek, H.J. Methane emission from natural wetlands: Interplay between emergent macrophytes and soil microbial processes. A mini-review. Ann. Bot. 2010, 105, 141–153. [Google Scholar] [CrossRef]
  55. Bai, J.; Ouyang, H.; Deng, W.; Wang, Q.; Chen, H.; Zhou, C. Nitrogen mineralization processes of soils from natural saline-alkalined wetlands, Xianghai National Nature Reserve, China. Can. J. Soil Sci. 2005, 85, 359–367. [Google Scholar] [CrossRef]
  56. Mcleod, E.; Chmura, G.L.; Bouillon, S.; Salm, R.; Björk, M.; Duarte, C.M.; Lovelock, C.E.; Schlesinger, W.H.; Silliman, B.R. A blueprint for blue carbon: Toward an improved understanding of the role of vegetated coastal habitats in sequestering CO2. Front. Ecol. Environ. 2011, 9, 552–560. [Google Scholar] [CrossRef]
  57. Tang, J.; Ye, S.; Chen, X.; Yang, H.; Sun, X.; Wang, F.; Wen, Q.; Chen, S. Coastal blue carbon: Concept, study method, and the application to ecological restoration. Sci. China Earth Sci. 2018, 61, 637–646. [Google Scholar] [CrossRef]
  58. Hu, Y.; Wang, L.; Tang, Y.; Li, Y.; Chen, J.; Xi, X.; Zhang, Y.; Fu, X.; Wu, J.; Sun, Y. Variability in soil microbial community and activity between coastal and riparian wetlands in the Yangtze River estuary–potential impacts on carbon sequestration. Soil Biol. Biochem. 2014, 70, 221–228. [Google Scholar] [CrossRef]
  59. Xi, X.; Wang, L.; Hu, J.; Tang, Y.; Hu, Y.; Fu, X.; Sun, Y.; Tsang, Y.; Zhang, Y.; Chen, J. Salinity influence on soil microbial respiration rate of wetland in the Yangtze River estuary through changing microbial community. J. Environ. Sci. 2014, 26, 2562–2570. [Google Scholar] [CrossRef]
  60. Jobbágy, E.G.; Jackson, R.B. The vertical distribution of soil organic carbon and its relation to climate and vegetation. Ecol. Appl. 2000, 10, 423–436. [Google Scholar] [CrossRef]
  61. Cunha-Santino, M.B.d.; Bianchini, I. Reviewing the organic matter processing by wetlands. Acta Limnol. Bras. 2023, 35, e19. [Google Scholar] [CrossRef]
  62. Kleber, M.; Johnson, M.G. Advances in understanding the molecular structure of soil organic matter: Implications for interactions in the environment. Adv. Agron. 2010, 106, 77–142. [Google Scholar]
  63. Kaiser, K.; Guggenberger, G. The role of DOM sorption to mineral surfaces in the preservation of organic matter in soils. Org. Geochem. 2000, 31, 711–725. [Google Scholar] [CrossRef]
  64. Schmidt, M.W.; Torn, M.S.; Abiven, S.; Dittmar, T.; Guggenberger, G.; Janssens, I.A.; Kleber, M.; Kögel-Knabner, I.; Lehmann, J.; Manning, D.A.; et al. Persistence of soil organic matter as an ecosystem property. Nature 2011, 478, 49–56. [Google Scholar] [CrossRef]
  65. Georgiou, K.; Jackson, R.B.; Vindušková, O.; Abramoff, R.Z.; Ahlström, A.; Feng, W.; Harden, J.W.; Pellegrini, A.F.; Polley, H.W.; Soong, J.L.; et al. Global stocks and capacity of mineral-associated soil organic carbon. Nat. Commun. 2022, 13, 3797. [Google Scholar] [CrossRef] [PubMed]
  66. Brombin, V.; Salani, G.M.; De Feudis, M.; Mistri, E.; Precisvalle, N.; Bianchini, G. Soil organic carbon depletion in managed temperate forests: Two case studies from the Apennine chain in the Emilia-Romagna region (northern Italy). Environments 2023, 10, 156. [Google Scholar] [CrossRef]
  67. Islam, M.R.; Singh, B.; Dijkstra, F.A. Stabilisation of soil organic matter: Interactions between clay and microbes. Biogeochemistry 2022, 160, 145–158. [Google Scholar] [CrossRef]
  68. Singh, M.; Sarkar, B.; Sarkar, S.; Churchman, J.; Beerling, D. Stabilization of soil organic carbon as influenced by clay mineralogy. Adv. Agron. 2017, 148, 33–84. [Google Scholar]
  69. Gao, L.; Rao, M.P.N.; Liu, Y.H.; Wang, P.D.; Lian, Z.H.; Abdugheni, R.; Jiang, H.C.; Jiao, J.Y.; Shurigin, V.; Fang, B.Z.; et al. SALINITY-Induced changes in diversity, stability, and functional profiles of microbial communities in different Saline Lakes in Arid Areas. Microb. Ecol. 2024, 87, 135. [Google Scholar] [CrossRef]
  70. Li, Y.; Wang, J.; Li, E.; Yang, X.; Yang, J. Shifts in microbial community structure and Co-occurrence network along a wide soil salinity gradient. Microorganisms 2024, 12, 1268. [Google Scholar] [CrossRef]
  71. Sorokin, D.; Berben, T.; Melton, E.; Overmars, L.; Vavourakis, C.; Muyzer, G. Microbial diversity and biogeochemical cycling in soda lakes. Extremophiles 2014, 18, 791–809. [Google Scholar] [CrossRef]
  72. Li, S.; Lu, L.; Gao, Y.; Zhang, Y.; Shen, D. An Analysis on the characteristics and influence factors of soil salinity in the wasteland of the Kashgar river Basin. Sustainability 2022, 14, 3500. [Google Scholar] [CrossRef]
  73. Qadir, M.; Schubert, S. Degradation processes and nutrient constraints in sodic soils. Land Degrad. Dev. 2002, 13, 275–294. [Google Scholar] [CrossRef]
  74. Rengasamy, P. World salinization with emphasis on Australia. J. Exp. Bot. 2006, 57, 1017–1023. [Google Scholar] [CrossRef]
  75. Santiago Rosario, L.; Harms, K.; Elderd, B.; Hart, P.; Dassanayake, M. No escape: The influence of substrate sodium on plant growth and tissue sodium responses. Ecol. Evol. 2021, 11, 14231–14249. [Google Scholar] [CrossRef]
  76. Chen, L.; Li, C.; Feng, Q.; Wei, Y.; Zhao, Y.; Zhu, M.; Deo, R.C. Direct and indirect impacts of ionic components of saline water on irrigated soil chemical and microbial processes. Catena 2019, 172, 581–589. [Google Scholar] [CrossRef]
  77. Tipping, E. Cation Binding by Humic Substances; Cambridge University Press: Cambridge, UK, 2002. [Google Scholar]
  78. Dong, Y.; Chen, R.; Petropoulos, E.; Yu, B.; Zhang, J.; Lin, X.; Gao, M.; Feng, Y. Interactive effects of salinity and SOM on the ecoenzymatic activities across coastal soils subjected to a saline gradient. Geoderma 2022, 406, 115519. [Google Scholar] [CrossRef]
  79. Pester, M.; Knorr, K.H.; Friedrich, M.W.; Wagner, M.; Loy, A. Sulfate-reducing microorganisms in wetlands-familiars but yet unknown. Front. Microbiol. 2012, 3, 70. [Google Scholar]
  80. Smolders, A.J.P.; Lamers, L.P.M.; Hartog, C.; Roelofs, J.G.M. Mechanisms involved in the decline of freshwater bivalves in highly anoxic conditions. Freshw. Biol. 2006, 51, 627–635. [Google Scholar]
  81. Cremonini, S.; Etiope, G.; Italiano, F.; Martinelli, G. Evidence of possible enhanced peat burning by deep-origin methane in the Po River delta plain (Italy). J. Geol. 2008, 116, 401–413. [Google Scholar] [CrossRef]
  82. Bonzi, L.; Ferrari, V.; Martinelli, G.; Norelli, E.; Severi, P. Unusual geological phenomena in the Emilia-Romagna plain (Italy): Gas emissions from wells and the ground, hot water wells, geomorphological variations. A review and an update of documented reports. Boll. Geofis. Teor. Appl. 2017, 58, 87–102. [Google Scholar]
  83. Toreti, A.; Masante, D.; Acosta Navarro, J.; Bavera, D.; Cammalleri, C.; de Jager, A.; di Ciollo, C.; Hrast Essenfelder, A.; Maetens, W.; Magni, D.; et al. Drought in Europe, July 2022; Report; Publications Office of the European Union: Luxembourg, 2022. [Google Scholar]
  84. Puppin, A.; Tognin, D.; Paccagnella, M.; Zancato, M.; Ghinassi, M.; D’Alpaos, C.; Marani, M.; D’Alpaos, A. Blue carbon assessment in the salt marshes of the Venice Lagoon: Dimensions, variability and influence of storm-surge regulation. Earth’s Future 2024, 12, e2024EF004715. [Google Scholar] [CrossRef]
Figure 1. (a) Mezzano Lowland (ML) area (Ferrara province, Italy), subject to land drainage works in the 1960s, surveyed in the sampling conducted by Boschi and Spallacci [17], reference system: European Petroleum Survey Group (EPSG): 32633—World Geodetic System (WGS) 84/UTM zone 33 Northern Hemisphere; (b) land drainage process of the Mezzano Lowland in the 1960s, showing the construction of embankments and drainage canals through human labour. Image sourced from the historical archive of the “Consorzio di Bonifica Pianura di Ferrara” (https://www.bonificaferrara.it/il-consorzio/cenni-storici/161-cenni-storici, accessed on 12 March 2025).
Land 14 01621 g001
Figure 2. (a) Sampling scheme used by Boschi and Spallacci [17] in the ML. The numbered black dots represent the 145 sampling points along with the layout of roads and drainage systems established following the land drainage works; (b) satellite image of the selected portion of the Mezzano Lowland for sampling of this study, corresponding partially to the previous acquisition points of Boschi and Spallacci [17]. The image shows the locations of the sampled soils (red dots). Areas in yellow represent the beach deposits reported by Di Giuseppe et al. [20] the remaining uncoloured area is generally occupied by marsh deposits; (c) scheme of the composite soil sampling method at three different depths (0–40 cm; 50–90 cm; 110–150 cm used for this study).
Land 14 01621 g002
Figure 3. Electrical conductivity (EC) values of the ML soil samples collected at the distinct sampling depths in this study. Different colors are associated with different sampling depths. Soils have been classified as Type A (characterised by clay-dominated texture and rich in organic matter) and Type B (characterised by sandy-dominated texture) according to the classification proposed in [20]. The data from EC published in [20] are also reported for comparison. In each box plot, the horizontal line and the cross represent the median and the mean, respectively. The one-way ANOVA result is also reported (* p < 0.05 ).
Land 14 01621 g003
Figure 4. (a) Box plot of the organic carbon (OC) coupled with (b) the respective contents reported for each soil sample collected at the distinct sampling depths; (c) box plot of the nitrogen (N) coupled with (d) the respective contents reported for each soil sample collected at the distinct sampling depths. In each box plot, the horizontal line and the cross represent the median and the mean, respectively. Above the box plots, the letters represent the results of the Tukey’s HSD post hoc test: different letters denote significant differences among groups. The one-way ANOVA results are reported (*** p < 0.0001 ).
Land 14 01621 g004
Figure 5. (a) The total carbon (TC) contents of each soil sample collected at the distinct sampling depths coupled with (b) the relative isotopic signature.The one-way ANOVA results are reported (** p < 0.01 ; *** p < 0.0001 ).
Land 14 01621 g005
Figure 6. Correlation graphs for the three distinct depths of sampling of EC with (a) total dissolved solids (TDS), (b) calcium (Ca2+), (c) sodium (Na+), (d) chloride (Cl), and (f) sulphate (SO42−). We report also the correlation graphs between (e) Na+ and Cl.
Land 14 01621 g006
Figure 7. Correlation graph for the three distinct depths of sampling of OC with sulphate (SO42−). Same colours as in Figure 6.
Land 14 01621 g007
Figure 8. (a) Identification of the agricultural plot under investigation using GPR methods within the study area examined in this research, characterized by sandy soils and beach deposits [20]; (b) satellite image of the agricultural plot showing the path covered using the GPR method, from P1 to P2, overlaid with the corresponding soil samples, from s1 to s9; dashed blue lines, from P3 to P8, represent the further possible paths to draw with GPR surveys to map peat thickness; (c) representation of the GPR data obtained from continuous acquisition (split into four units for better visualisation) and overlay of the graphical representations of the soil cores sampled along the path. Red arrows notice the reflector that identifies the peat–sand interface.
Land 14 01621 g008
Figure 9. Comparison box plots for (a) EC, (b) SO42−, (c) N, and (d) SOM values among soil samples collected in 2023 (this study) and in 1967–1968 [17] in the Mezzano Lowland area. In each box plot, the horizontal line and the cross represent the median and the mean, respectively. A one-way ANOVA was applied to each parameter considered for the different studies (this work and Boschi and Spallacci [17]) separately, and the results were also reported (* p < 0.01; ** p < 0.001; *** p < 0.0001). Above the box plots, the letters represent the results of the Tukey’s HSD post hoc test: different letters denote significant differences among groups.
Land 14 01621 g009
Disclaimer/Publisher’s Note: The statements, opinions and data contained in all publications are solely those of the individual author(s) and contributor(s) and not of MDPI and/or the editor(s). MDPI and/or the editor(s) disclaim responsibility for any injury to people or property resulting from any ideas, methods, instructions or products referred to in the content.