Abstract
Peat inversion is a management technique used to reduce emissions and retain carbon in cultivated peatland while allowing for effective forage production. Although maps and land registers document the presence of cultivated peatland that is suitable for peat inversion, these data do not cover all regions of interest. This study explores how an expert system and geostatistical modelling can be used to identify cultivated peatland suitable for peat inversion. The expert system proved to work moderately well for cultivable (but not for cultivated) peatland. Geostatistical modelling, using cultivable peatland as statistical support, gave good results in regions with large, continuous landforms. The results were less accurate in regions with rough, rapidly shifting terrain forms and where peatland was less frequent. The difference could be seen in the range and shape of the semivariograms. Geostatistical modelling can be used to identify cultivated peatland suitable for peat inversion in regions where the semivariogram shows a clear and well-defined spatial autocorrelation structure.
1. Introduction
Peatlands are a globally significant carbon store and play an important role in regulating the Earth’s climate. Although they cover only about 3% of the Earth’s land surface, they contain 30–35% of all soil carbon, more than twice as much as all the world’s forests [1,2]. This large carbon stock, built up through millennia, is mainly caused by the slow decomposition of organic matter under waterlogged, anaerobic conditions [3].
Norwegian peatland, covering an estimated area of 28,778 km2 (around 9% of the mainland of Norway) [4] is thus a significant contributor to biodiversity and carbon storage. However, peatlands are threatened by various human activities, including drainage, cultivation, and processes causing climate change, which can lead to degradation and a release of stored carbon, in particular as carbon dioxide (CO2) through oxidation [3,5].
Cultivated peatland is already degraded in the sense that the natural vegetation has been replaced, and the surface layer is altered. Agricultural practices, such as drainage, soil tillage, and liming can increase and accelerate the loss of carbon since they increase microbial activity and, consequently, peat decomposition [6]. Methods are, therefore, needed to reduce emissions and retain carbon in cultivated peatland.
One approach to reduce the negative impacts of peat cultivation is peat inversion, where the peat layer is covered by an underlying mineral soil in order to prevent peat decomposition. The underlying mineral subsoil is excavated and placed as a topsoil covering the peat. The mineral soil may also be placed in inclined layers where the water can drain to the subsoil. The layer of mineral mass brought to the surface should be thicker than the plough layer, and is most often 0.5–1.0 m. Using this method, the buried peat is expected to maintain a high moisture content, protecting the organic material from oxic decomposition [7,8]. In addition to its climate benefits, peat inversion also prevents waterlogging of soil, improves trafficability, eases agricultural management, and improves yield stability [9]. Peat inversion is rarely used outside of Norway, and research is mostly limited to a few pilot studies [10].
The total area of cultivated land in Norway is around 12,500 km2. Out of this, 704 km2 (5.6%) is cultivated peatland [11]. Another 4741 km2 are cultivable peatlands, including 3322 km2 open mire, 945 km2 forested mire, and 474 km2 dry peatland [12]. It is not known how much of this approximately 5000 km2 cultivated and cultivable peatland is suitable for peat inversion, and this uncertainty calls for a deeper analysis useful for informing policymakers in charge of land management. Specifically, to consider the need for and the potential impact of political and economic incentives for peat inversion, Norwegian authorities need an overall estimate of the land area suitable for peat inversion.
Previous research has brought to attention the need to identify and map regions where peat inversion can be applied, starting by focusing on cultivated peatland areas over loose sediments [8].
The objective of the present study was to develop a method for identifying cultivated peatland suitable for peat inversion in Norway. We used a simple, rule-based expert system [13,14], combining existing information about land resources, soil, and geology to assess the suitability for peat inversion in locations where this information was present. A geostatistical model [15,16] was successively added to predict suitability in areas where the data were insufficient to use the expert system approach (Figure 1).
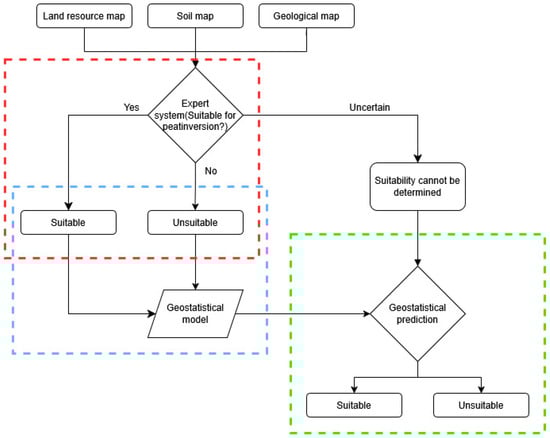
Figure 1.
The complete prediction model for peat inversion suitability combining an expert system with a geostatistical prediction model. Dashed lines indicate the three tests for model quality assessment: Test 1: a test of the classification of assumed suitability made by the expert system (red line); Test 2: a test of the geostatistical model (blue line); and Test 3: a test of the classification of predicted suitability made by the geostatistical model (green line).
The quality of the predictions made by the expert system and the accompanying geo-statistical model was determined by three tests (Figure 1). The first test was a verification of the results from the expert system. This was performed by comparing the assumed suitability to ground truth obtained by a field crew. The second test evaluated the geostatistical model as a means to predict suitability for peat inversion. This was achieved by comparing the suitability predicted by the geostatistical model to the assumed suitability determined by the expert system. The third test was a verification of the results from the geostatistical predictions by comparing them to ground truth, as in Test 1 obtained by a field crew.
During the description and discussion of the study, we will use the following terminology:
- Observed suitability: Suitability for peat inversion determined in situ by a qualified field crew;
- Assumed suitability: Suitability for peat inversion determined using an expert system (described below) based on existing maps and data;
- Predicted suitability: Suitability for peat inversion determined using a geostatistical model where assumed suitability is used as statistical support.
2. Materials and Methods
2.1. Material
The study areas are four municipalities located on the Norwegian mainland, North Europe. The Norwegian mainland covers an area of approximately 324,000 km2 between 58° and 71° N; 6° and 31° E. Out of 357 municipalities (in 2024), the four were chosen among those with large areas of cultivated peatland, representing different types of landscapes and topography: Andøy in northern Norway, Overhalla in central Norway, Ask-voll in western Norway and Våler in eastern Norway (Figure 2).
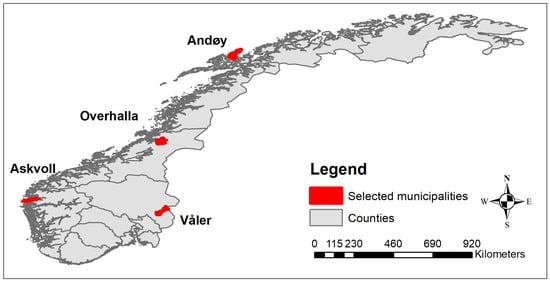
Figure 2.
Locations of the four Norwegian municipalities included in the study. Data source: Norway Digital.
Landforms and landscape characteristics were obtained from the Nature in Norway (NiN) landscape typology [17]. The topography in Andøy and Våler comprises large-scale landscapes with little variation. Andøy is dominated by coastal plains covered by large, flat, or undulating stretches of peatland. The cultivated land is found on this coastal plain, and much of it is cultivated peatland. Våler is located in a broad, glacial valley covered by moraines. Most of the cultivated land is found in a river plain at the bottom of the valley, surrounded by cultivable peatland. The topography in both municipalities is characterized by broad landforms.
Overhalla and Våler are both dominated by wide, glacial valleys. The elevations in the two municipalities are also similar, from low river plains up to approximately 700 m, but the terrain in Overhalla is steeper, and the surface is characterized by rapidly changing landforms. In contrast to Våler, the river plain in Overhalla is covered by marine deposits. Further up, these are replaced by thin layers of organic material covering bedrock, while the uppermost areas are exposed bedrock. Askvoll is different from the other three municipalities. The entire region is covered by exposed bedrock, occasionally overlain by a thin and discontinuous layer of soil. Peatland is found sporadically scattered over the area.
Information about land resources, soil, and geology was available from four national digital data sources:
- Map of the cultivable land (DMK; [18]);
- Land resource map of current agricultural land (AR5; [19]);
- Detailed soil map covering approximately 60% of the current agricultural land [20];
- Quaternary geological map produced by the Geological Survey of Norway.
DMK, AR5, and the soil map are all made for display in scale 1:5000 and stored in a database managed by the Norwegian Institute of Bioeconomy Research (NIBIO). The Quaternary geological map is made for display in scales from 1:50,000 down to 1:250,000, depending on the region, and is available through the Norwegian Spatial Data Infrastructure (geonorge.no). All maps can be inspected using the online viewing service (https://kilden.nibio.no (accessed on 27 May 2025)).
2.2. The Expert System
The expert system for the assessment of potential suitability for peat inversion was based on advice from national experts who considered the existing Norwegian literature [12,21] and references therein and practical experience. Based on these elements, four criteria have been defined and used in a practical expert assessment. According to this practical expert assessment, a peatland that is suitable for peat inversion must:
- Include a 40–200 cm thick peat layer;
- Be underlain by mineral material within 2 m depth;
- Exclude the presence of bedrock within 2 m depth;
- Have a slope of a maximum of 25%; or
- Include a 15–40 cm thick peat layer;
- Have a hardpan.
The required thickness of the peat layer (1.) ranges from the minimum thickness required for Histosols in the Norwegian classification system [20] to the assumed maximum thickness for financial soundness of peat inversion. The requirement of underlying mineral material (2.) ensures on-the-spot availability of mineral material, within a depth implicit from 1. Presence of bedrock (referred to as Endoleptic in Norwegian soil classification [20]) would restrict the use of excavator and needs to be avoided within a depth implicit from 1. (3.). The slope requirement (4.) ensures a safe use of machinery.
Furthermore, an organic top layer of 15–40 cm thickness (Histic in [20]) over a hardpan (Ortsteinic in [20]) is also suitable for peat inversion. Inversion of peat over hardpans may be financially sound even for relatively thin peat layers because this technique leads to a full-scale penetration of the hardpan and solves eventual problems with drainage and plant root growth.
This practical expert assessment was used in the fieldwork but had to be adjusted for the information in the available data in order to be used in the expert system. An example of such adjustment is that available data only classify the peat layer thickness as more or less than one meter. A less than one-meter-thick peat layer (when other conditions are met) was, therefore, classified as suitable for peat inversion, while thicker peat layers were classified as uncertain.
Peatland was divided into five classes, according to the available information on land use and soil (Table 1). The expert assessment of suitability for peat inversion in each class is explained below. Peatland, which was neither cultivated nor cultivable, was excluded from the study. The definitions of qualifiers and soil groups in the Norwegian soil classification used in the explanation are found in [20].

Table 1.
Peatland classes defined by the land use and soil type.
Peatland class CO: Cultivated mineral soil with an organic top layer (Histic) was considered suitable for peat inversion if the slope was <25%, no bedrock was present within 1 m depth, but the hardpan (Ortsteinic) was present within 50 cm depth. Hardpans are, per definition, linked to Podzols in the Norwegian classification system [20]. Histic mineral soil was classified as uncertain in the absence of a hardpan. Areas with bedrock within 1 m depth (Endoleptic) or slope > 25% were considered unsuitable for peat inversion.
Peatland class CH: Cultivated peatland (Histosols) was considered suitable for peat inversion if the slope was <25%, bedrock was present within 1 m depth (Endoleptic), and the peat layer was (1) underlain by coarse material (Endoskeletic); or (2) underlain by other types of mineral soil (Calcaric, Ruptic, or Limnic). The area was classified as uncertain if neither of the above conditions (1) or (2) applied and the peat was (1) mixed with mineral soil to at least 50 cm depth by mechanical digging by excavator (Relocatic) or (2) the area was classified as other than peatland or mire in the Quaternary geology map. The remaining areas were classified as unsuitable if also classified as peatland or mire in the Quaternary geological map. Other areas were considered unsuitable for peat inversion.
Peatland class CN: Cultivated peatland (per definition with no bedrock within 150 cm depth) with no soil map was considered suitable for peat inversion if the peat layer was less than 1 m thick or underlain by boulders. Peatland more than one meter deep was considered unsuitable for peat inversion if also classified as peatland or mire in the Quaternary geological map. The remaining areas were classified as uncertain.
Peatland class UP: Cultivable peatland (per definition with no bedrock within 150 cm depth) currently used as pasture was classified as suitable for peat inversion in the presence of boulders or stone runs. In the absence of boulders or stone runs, the land was classified as unsuitable for peat inversion if also classified as peatland or mire in the Quaternary geological map. The remaining areas were classified as uncertain.
Peatland class UN: Cultivable peatland (per definition with no bedrock within 150 cm depth) currently not used as pasture was classified as suitable for peat inversion when the peat layer was less than one meter thick. Areas with a more than one-meter-thick peat layer were classified as unsuitable for peat inversion when a detailed Quaternary geological map described the surface as peat or mire and uncertain when no detailed Quaternary geological map was available, or the Quaternary geological map showed the presence of other surface materials.
2.3. Geostatistical Model and Prediction
Geostatistical models used in the study are based on the kriging interpolation method. Kriging is a well-known geostatistical interpolation method [16,22] where correlation between and distance to data points in a group of locations with known characteristics is used to predict values for data points in another group of locations where the characteristics are unknown. The method is described in detail in many publications [23,24], and the equations are not repeated here.
Indicator kriging is a non-parametric version of ordinary kriging [25] as there is no assumption of normality. A binary indicator variable (here: unsuitable/suitable for peat inversion, coded as 0/1) is used as the input variable, and the predicted value (on a continuous scale in the range [0 … 1]) can be interpreted as an indicator value at the target locations. The predicted value is associated with a variance, allowing the computation of the probability of the value being above (or below) a certain threshold (e.g., 0.5).
The statistical support for the geostatistical computations was collected from map polygons classified using the expert system described above. We found the geometrical centroid of each polygon and attached the assumed suitability (0/1) to these single-point locations. For each pair of points classified by the expert system, we calculated the distance (Euclidean straight-line distance) and the semivariance (half the squared difference between the two suitability values). Since the assumed suitability is a binary variable (0/1), the semivariance is either 0.0 or 0.5. The pairs of point locations were grouped into “lags” (a lag is an interval of distances), and the mean semivariance was calculated for all pairs of points in each lag, resulting in an empirical semivariogram (a graph representing the mean semivariance for each lag). Finally, a theoretical semivariogram (a function) was fitted to the graph and used in the prediction of suitability for peat inversion at locations where the suitability was unknown. The theoretical semivariogram is characterized also by three values: sill, range, and nugget. Figure 3 shows an example of a semivariogram. The sill is the semivariance value (along the y-axis) at which the model becomes flat; the range is the distance (in m along the x-axis) at which the model becomes flat; and the nugget is the semivariance value at which the model intercepts the y-axis (0 in this case). The geostatistical computation was performed using QGIS 3.34 with the SmartMap plugin v. 1.5 [26].
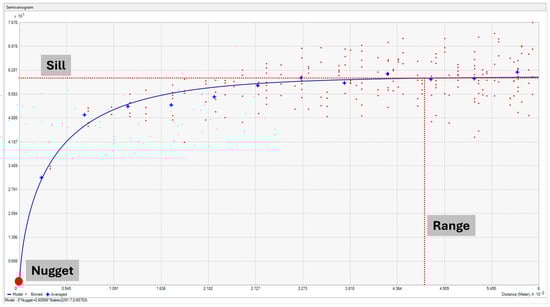
Figure 3.
An example of a semivariogram illustrating the sill, range, and nugget.
2.4. Test 1: Test of the Expert System
The assumed suitability generated by the expert system was verified by a field crew. The field crew assessed arbitrarily chosen clusters of locations (n = 270) scattered throughout one of the municipalities (Overhalla) and registered the observed suitability for peat inversion in situ. The observed suitability was defined by the four (for Histosols) or two criteria (for organic top layer over mineral soils) of the practical expert assessment described in Section 2.2, without the above-mentioned adjustments for available data. The field work included peat probing with narrow rods of 2 m length to observe the presence or absence of bedrock, underlying mineral material and hardpan. In a few cases where the slope was suspected to be too high, it was measured by clinometer.
The observed suitability for peat inversion was compared to the assumed suitability (based on the expert system) using simple descriptive statistical methods. The purpose of this test was to evaluate the quality of the classification of assumed suitability (assumed suitable/assumed unsuitable) done by the expert system.
2.5. Test 2: Test of the Geostatistical Model
The areas where the assumed suitability could be determined (as unsuitable or suitable) by the expert system were randomly divided into two groups. Approximately 70% of the areas were placed in group A, the remaining 30% in group B. Indicator kriging was then used to predict the suitability for peat inversion at the locations in group B, using the assumed suitability at the locations in group A as statistical support. The predicted suitability for the locations in group B was compared to the assumed suitability (from the expert model). The purpose of this test was to evaluate autocorrelation and the fitness of the geostatistical model for interpolation of these data.
2.6. Test 3: Test of the Geostatistical Prediction
A geostatistical model based on the assumed suitability for peat inversion (where available) was used to predict the suitability for peat inversion at all locations where the assumed suitability for peat inversion was uncertain. Arbitrarily chosen clusters of these locations (n = 467), scattered throughout the four municipalities (Overhalla, Askvoll, Våler, Andøy), were subsequently verified in situ by a field crew. The suitability observed by the field crew was based on the same field work method as described for Test 1.
Indicator kriging assigns a predicted value in the continuous range [0 … 1] and a standard deviation to each location. This predicted value can be interpreted as a rough probability of the location being suitable for peat inversion. The aim was, however, to classify the locations as suitable or unsuitable for peat inversion. Based on trial and error, the scale was cut at 0.5. Locations with a predicted suitability in the range [0 … 0.5) were classified as unsuitable, while locations with a predicted suitability in the range [0.5 … 1] were classified as suitable for peat inversion. This classification was compared to the in situ observed suitability reported by the field crew to assess the quality of the suitability predicted by the geostatistical model.
3. Results
3.1. Results of Test 1
The first test was carried out with data for Overhalla municipality. Cultivated and cultivable peatland was classified according to the expert system and verified by a field crew (Table 2). Land where the assumed suitability was uncertain was excluded from the test. The test involved 342.8 ha of peatland.
Table 2.
Assumed suitability (based on the expert system) compared to observed suitability (in situ) for Overhalla for tested polygons, presented as acreage (ha) and relative numbers (%).
The test revealed that the expert system classified only 56.3% of the cultivated peatland correctly. The test was carried out in one municipality (Overhalla) and is not necessarily representative of other regions. Still, it was decided to discard the results from the expert system for cultivated land and only use assumed suitability based on the cultivable peatland as training data for the geostatistical model. The assumed suitability for the cultivable land in Overhalla was correct for 67.3% of the area.
3.2. Results of Test 2
The results from the indicator kriging of the locations in group B based on the assumed suitability at the locations in group A are shown in Table 3. Overall, the suitability was correctly predicted for 84.7% of the locations.
Table 3.
Cross-tabulation of predicted and assumed suitability for 2497 individual locations on uncultivated peatland. The geostatistical prediction was correct for 84.66% of the locations.
The accuracy of the prediction in Test 2 varied between municipalities (Table 4). The overall accuracy of the prediction model was the highest in Våler (95%) and the lowest in Askvoll (77%). There was also a noticeable difference between the accuracy of predictions within suitable and unsuitable areas.
Table 4.
Accuracy of predicted sites in four municipalities. In addition to the overall percentage of correctly predicted locations (% of individual point locations), the table shows the percentage of correctly predicted suitable and unsuitable sites.
Predicted suitable sites were 97% correct for Andøy and Våler, with considerably lower accuracy for the predicted unsuitable sites. The accuracy was down to 56% correct when classifying unsuitable sites in Andøy. The results for Askvoll and Overhalla show fairly similar results for suitable and unsuitable sites, around 77% correct in Askvoll and 83% correct in Overhalla.
3.3. Results of Test 3
A geostatistical model trained with the assumed suitability for cultivable peatland (generated by the expert system) was used to predict suitability for locations on cultivated peatland (CH, CO, and CN) in the four municipalities. The map of predicted suitability for Andøy is shown in Figure 4. The results were compared to observed suitability from in situ field verification (Table 5).
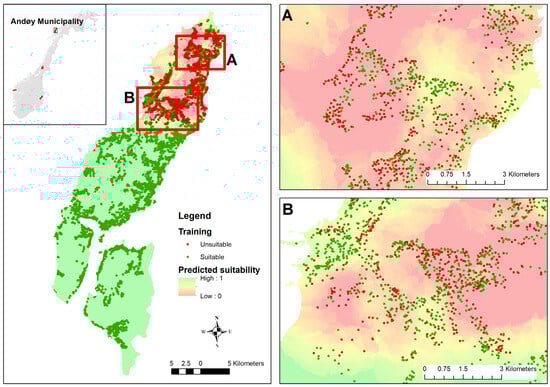
Figure 4.
Predicted suitability for Andøy as a surface model, depicted as a continuous color scale from high suitability (green = 1.0) to unsuitable (red = 0.0). Training points are shown as green (assumed suitable) and red (assumed unsuitable) dots. Subfigures (A,B) are enlarged maps of the two rectangular areas labeled A and B in the main map. Base map Norge Digitalt.
Table 5.
Observed suitability for peat inversion on cultivated peatland compared to predicted suitability (</≥ 0.5 probability), presented as acreage (ha).
The field verification showed that 62.5 out of 83.7 ha (75%) was correctly predicted as either suitable or unsuitable for peat inversion. Most locations predicted as suitable for peat inversion were also found suitable during the field verification (43.9 out of 49 ha, or 90% correct). Mistakes were mostly associated with locations predicted as unsuitable for peat inversion. 16.1 out of 34.7 ha (46%) predicted as unsuitable were found to be suitable when verified in the field. The geostatistical approach thus underestimates the areas suitable for peat inversion (at least for these four municipalities).
The autocorrelation function varied between the four municipalities in the study (Table 6). This variation was observed in Test 2 as well as Test 3. The semivariograms for Andøy and Våler were spherical, reaching a sill at semivariance 0.022. Andøy had a small nugget effect of 0.01, while there was no nugget effect in Våler. The range was 6 km in Andøy, but only 450 m in Våler. The semivariogram for Overhalla was exponential, with a nugget of 0.01 and reaching a sill at semivariance 0.22. The range was around 900 m. The autocorrelation in Askvoll was close to zero, with a weak linear autocorrelation, reaching a sill of 0.22 at a range of 260 m.
Table 6.
Autocorrelation functions in the four municipalities, described by the parameters of the semivariogram in Test 3.
Table 7 shows that the results were quite good for two of the four municipalities in the study (Andøy and Våler). The results for Overhalla were weaker, and the predictions in Askvoll were erratic (around 50% correct prediction in Askvoll).
Table 7.
Observed and predicted suitability for peat inversion on cultivated peatland (CH, CO, CN) by municipality, presented in hectares (ha).
4. Discussion
The test of the assumed suitability (Test 1) revealed severe problems with the expert system. The results were particularly weak for cultivated land, where soil maps were used in the expert assessment. There are several possible explanations. One obvious explanation is methodological weaknesses. The test was carried out in one municipality (Overhalla) and is not necessarily representative of other regions. In addition, the definition of suitability in situ deviates from the definition used in the expert system. The in situ definition of suitability was based on the practical expert assessment, whereas the definition in the expert system included adjustments for the information available in the data. The in situ definition of suitability included thicker peat layers (up to 200 cm) and deeper absence of bedrock (within 200 cm) than the information in the available data allowed. For example, Histosols (CH) with peat layer thickness between 100 and 200 cm would be observed as suitable by the field crew (when other conditions were met), even though the expert system assumed them to be unsuitable based on available information limited to the upper 100 cm.
Similar mismatch also applies for cultivated peatland without a soil map (CN) and cultivable peatland (UP, UN). The in situ verification by the field crew (observed suitability) can be considered more accurate than the assumed suitability.
On the contrary, bedrock observed by the field crew in 150 to 200 cm depth would be unsuitable for peat inversion, even though the expert system assumed suitability based on available information limited to the upper 100 (CH, CO) or 150 cm (CN, UP, UN).
Another explanation for the mismatch between assumed and observed suitability could be outdated soil data for cultivated peatland. Substantial peat loss may turn the peat soil into a mineral soil over time, which has previously been reported from systematic experiments in Norway [27]. Fields cultivated for decades can lose most of the organic layer [28] because of peat subsidence and mineralization caused by agricultural practices [29,30].
In Overhalla, the soil survey was carried out in 1997. Farmers have done a lot to their fields during the almost 30 years that have passed. Some farmers have improved the drainage conditions by renewing the pipe drainage systems. Together with tilling and liming, as part of the agricultural practice, this has increased the mineralization of the peat soil and reduced the depth of the organic topsoil layer. Surface grading, in order to remove water quickly from the fields, has been performed and has changed the thickness of the peat soil. Also, in a few cases, peat inversion had been carried out. Consequently, the part of the expert system that was based on soil maps could not be used to train the geostatistical model and was removed from the dataset.
The results from Test 1 are important in the sense that they, although unsystematically, document that changes can happen rapidly on cultivated organic soils [31,32]. Such changes result in inaccurate, or even obsolete, soil maps in areas with organic soils.
In the second test, we used kriging as a technique to assess suitability for peat inversion by interpolation from the assumed suitability of the surrounding cultivable peatland. This test was carried out on cultivable peatland only, using the assumed suitability for peat inversion as the test variable. The sample was randomly divided into two sets of observations, and the assumed suitability of the locations in one of these subsets was used to predict the suitability in the other subset. The prediction was correct for 84.7% of the peatland. Correctness was the highest for peatland suitable for peat inversion (91.4% correct) and lower for peatland unsuitable for peat inversion (68.9%). The prediction was also more successful in Andøy and Våler than in Overhalla and Askvoll.
The results from this second test showed that spatial autocorrelation was present in the material, and that a geostatistical method, like kriging, can be used to predict suitability for peat inversion when the suitability is known for some locations in an area. Spatial autocorrelation in soil data is reported by many studies [33], and our results are in agreement with these.
The test also uncovered certain limitations. First, the test only included cultivable peatland. Neither cultivated nor cultivable peatland is randomly located but will display some degree of spatial clustering. The distance from cultivable to cultivated peatland will generally be longer than the distance between locations with cultivable peatland. Statistical support will, therefore, be weaker when data from cultivable peatland is used to predict suitability on cultivated peatland than when data from some cultivable peatland is used to predict suitability on other cultivable peatland. We can thus expect a less accurate prediction in Test 3 than in Test 2.
The results of the third test showed that we were able to predict the correct suitability for peat inversion for approximately 75% of the cultivated peatland. Most of the mistakes were locations predicted as unsuitable, which can be explained by the difference between the definition of suitability in situ and the definition used in the expert system, equivalent to the explanations of poor assumed suitability (Test 1). The results were good for two of the municipalities (Andøy and Våler), barely passable for Overhalla, and miserable for Askvoll. The four municipalities represent different parts of the country, with different topography, different climatic conditions, and (possibly) also different agronomic practices.
Previous studies have shown how soil profile morphology in glacial landscapes is influenced by the glacial landforms [34]. A study of landscape types in Norway [17] shows that Andøy and Våler are characterized by broad, undulating landforms. This is a reasonable explanation for the well-defined autocorrelation structure.
Overhalla is dominated by a glacial valley, but the landforms in Overhalla are steeper, more variable, and covered by marine deposits. Askvoll is a fjord landscape where peatland occurs infrequently. It is known that soil properties are related to landform [35], and it is reasonable to assume that landforms have caused some of the differences observed in our study as well.
During the second and the third test, we also noticed that the autocorrelation function varied between the four municipalities included in the study (ref. Table 6). Similar variation in autocorrelation, related to land management as well as the physical environment, is also reported from other studies [36,37]. The nugget effect is generally small, but it shows, when present, that there is local variation unaccounted for by the sample. The largest nugget effect was found in Andøy. Sill is almost identical in Andøy and Våler (0.02) but ten times as high in Overhalla and Askvoll (0.2). The main difference between the municipal samples is the range and shape of the autocorrelation, from only 260 m in Askvoll to six kilometers in Andøy. Spatial autocorrelation was, for all practical purposes, absent in Askvoll and weak in Overhalla, while spherical variograms could be fitted to the samples in Våler and Andøy.
Climate, topography, hydrology, and vegetation are important drivers to infer the peatland distribution [38]. Terrain is also found to have an effect on peat depth [39]. It is thus reasonable to believe that the different autocorrelation functions reflect the differences in topography and terrain outlined above, and that topography, together with climate, vegetation, and hydrology, also contributes to the differences in the results for the four municipalities. The wide and open, broad, and continuous landscapes found in Andøy and Våler allow for more similarity between locations. The results also show that the municipalities where the geostatistical prediction was best are also the municipalities where the peatland is more abundant and dense. Peatland is rare in Askvoll, where our predictions were also the least accurate. More peatland probably means shorter distances between incidents, more consistent variograms, and better statistical support for predictions.
Finally, the interpretation of the failure to predict suitability for peat inversion based on soil maps was that conditions have changed considerably since the soil survey. Peat inversion has in some places been carried out; fields have been drained and undergone surface grading. The organic layer has disappeared or is minimized. These changes are also relevant for the interpretation of the results from Test 3. Predicting suitability for peat inversion on cultivated peatland by geostatistical interpolation using the surrounding, cultivable peatland as statistical support rests on the twin assumptions that (1) suitability is autocorrelated, and (2) the suitability of the cultivated peatland is the same as it was before this peatland was cultivated.
The results from Test 1 showed that the latter assumption is not necessarily correct. The characteristics of cultivated peatland change. Much of the cultivated peatland has been cultivated for hundreds of years. The long period of cultivation and agronomic practices are likely to have changed the cultivated peatland and make interpolation from the surrounding cultivable peatland less accurate.
Apart from possible explanations for the mismatch between assumed, predicted, and observed suitability for peat inversion, this study could not take into account every relevant aspect potentially important for the practical implementation of peat inversion. The definition of suitability for peat inversion used in this study, for example, does not differentiate locations based on the texture of the underlying mineral material. Neither does it take into account the degree of decomposition of the organic material in the organic layer, nor the density and quality of any existing drainage systems.
5. Conclusions
The objective of this study was to develop a method for identifying cultivated peatland suitable for peat inversion in Norway by combining a simple, rule-based expert system and a geostatistical model. The application of the expert system using currently available soil maps showed inaccurate results that are of limited use for the assessment of suitability for peat inversion on cultivated peatland. The explanation of this low accuracy is assumed to be the inaccuracy or absence of important parameters (e.g., accurate thickness of the peat layer, the presence of a layer of mineral soil beneath the peat, and changes due to cultivation and management over the years after the compilation of the soil map). Furthermore, the field verification of the results showed that the characteristics of cultivated peatland have a high variability, which is not captured by the relative simplicity of the model. As a consequence, the prediction of suitability for peat inversion must largely rely on statistical support from the surrounding, cultivable peatland.
Results were different with the application of the geostatistical model. The prediction of suitability for peat inversion among cultivable peatland sites where the observed suitability was known worked quite well using kriging. There were, however, differences between the four municipalities analyzed in the study. Such differences can be explained by the characteristics of the terrain and the topography, and were reflected in the semivariograms. The structure of the autocorrelation (i.e., the semivariograms) showed that regional characteristics like landforms and geomorphology have a large weight, and the geostatistical prediction had to be carried out separately for each region. This means that a single model cannot be used to make a prediction of suitability for peat inversion for a highly heterogeneous and large country like Norway.
The overall analysis of the results showed that the geostatistical prediction of suitability for peat inversion on cultivated peatland, using the assumed suitability of the surrounding, cultivable peatlands as statistical support, worked well for two of the four considered municipalities. Such cases represent wide, open landscapes, and the kriging model shows clear semivariograms. Such results represent a promising starting point to upscale the analysis at the national level and provide a first estimate (although with a range of uncertainty) of the peatlands that are suitable for peat inversion and of the implications on the greenhouse gas budgets.
Author Contributions
Conceptualization, G.-H.S. and S.R.; methodology, G.-H.S. and D.K.; validation, D.K.; geostatistical analysis, J.R.; data curation, J.R.; writing—original draft preparation, G.-H.S.; writing—review and editing, G.-H.S., J.R., D.K. and S.R.; visualization, J.R.; project administration, S.R.; funding acquisition, S.R. All authors have read and agreed to the published version of the manuscript.
Funding
This research was funded by the Norwegian Research Council, grant number 320270, supplemented with grants from several Norwegian county councils and private companies.
Data Availability Statement
Data collected for this study are available from the corresponding author upon reasonable request. Data from the Norwegian spatial data infrastructure are found at https://kartkatalog.geonorge.no (accessed on 25 May 2025).
Acknowledgments
Samson Øpstad, Anders Hovde and Jon Geirmund Lied contributed to the expert system used to assess suitability for peat inversion. Field work in Andøy, Våler, Overhalla, and Askvoll was carried out by Dorothee Kolberg, Elling Mjaavatten, Kjetil Fadnes, and Andreas Mickelson. Elling Mjaavatten prepared the data from the field verification for further analysis.
Conflicts of Interest
The authors declare no conflicts of interest. The funders had no role in the design of the study; in the collection, analyses, or interpretation of data; in the writing of the manuscript; or in the decision to publish the results.
References
- Yu, Z.; Loisel, J.; Brosseau, D.P.; Beilman, D.W.; Hunt, S.J. Global peatland dynamics since the Last Glacial Maximum. Geophys. Res. Lett. 2010, 37, L13402. [Google Scholar] [CrossRef]
- UNEP. Global Peatlands Assessment–The State of the World’s Peatlands: Evidence for Action Toward the Conservation, Restoration, and Sustainable Management of Peatlands; Main Report. Global Peatlands Initiative; UNEP: Nairobi, Kenya, 2022. [Google Scholar] [CrossRef]
- Harenda, K.M.; Lamentowicz, M.; Samson, M.; Chojnicki, B.H. The Role of Peatlands and Their Carbon Storage Function in the Context of Climate Change. In Interdisciplinary Approaches for Sustainable Development Goals; Zielinski, T., Sagan, I., Surosz, W., Eds.; GeoPlanet: Earth and Planetary Sciences; Springer: Cham, Switzerland, 2005. [Google Scholar] [CrossRef]
- Bryn, A.; Strand, G.H.; Angeloff, M.; Rekdal, Y. Land cover in Norway based on an area frame survey of vegetation types. Nor. Geogr. Tidsskr.-Nor. J. Geogr. 2018, 72, 131–145. [Google Scholar] [CrossRef]
- Mander, Ü.; Espenberg, M.; Melling, L.; Kull, A. Peatland restoration pathways to mitigate greenhouse gas emissions and retain peat carbon. Biogeochemistry 2024, 167, 523–543. [Google Scholar] [CrossRef]
- Kalita, B.; Boro, P.; Talukdar, S.; Borah, L. Greenhouse Gas Emission Reduction by Crop Management and Climate-Smart Agriculture. In Agricultural Greenhouse Gas Emissions: Problems and Solutions; Springer: Singapore, 2024; pp. 1–31. [Google Scholar] [CrossRef]
- Pouliot, K.; Rochefort, L.; LeBlanc, M.C.; Guêné-Nanchen, M.; Beauchemin, A. The Burial Under Peat Technique: An innovative method to restore Sphagnum peatlands impacted by mineral linear disturbances. Front. Earth Sci. 2021, 9, 658470. [Google Scholar] [CrossRef]
- Budai, A.E.; Rasse, D.P.; Cottis, T.; Joner, E.J.; Martinsen, V.; O’Toole, A.; Riley, H.; Rivedal, S.; Sturite, I.; Søgaard, G.; et al. Qualitative evaluation of nine agricultural methods for increasing soil carbon storage in Norway. Eur. J. Soil Sci. 2024, 75, e13493. [Google Scholar] [CrossRef]
- NIBIO. (2021–2025). Improving Conditions for Agricultural Management of Drained Peatlands While Reducing GHG Emissions (PEATIMPROVE). Available online: https://www.nibio.no/prosjekter/improving-conditions-for-agricultural-management-of-drained-peatlands-while-reducing-ghg-emissions-peatimprove (accessed on 25 May 2025).
- Wang, Y.; Paul, S.M.; Jocher, M.; Espic, C.; Alewell, C.; Szidat, S.; Leifeld, J. Soil carbon loss from drained agricultural peatland after coverage with mineral soil. Sci. Total Environ. 2021, 800, 149498. [Google Scholar] [CrossRef]
- Lågbu, R.; Nyborg, Å.; Svendgård-Stokke, S. Jordsmonnstatistikk for Norge; NIBO Report 2018, 013/2018; Norwegian Institute of Bioeconomy Research, NIBIO: Ås, Norway, 2018; Available online: http://hdl.handle.net/11250/2484038 (accessed on 25 May 2025). (In Norwegian)
- Bárcena, T.; Grønlund, A.; Hoveid, Ø.; Søgaard, G.; Lågbu, R. Kunnskapsgrunnlag om Nydyrking av Myr; NIBO Report 2016, 043/2016; Norwegian Institute of Bioeconomy Research, NIBIO: Ås, Norway, 2016; Available online: http://hdl.handle.net/11250/2415674 (accessed on 25 May 2025). (In Norwegian)
- Giuliani, G.; Rodila, D.; Külling, N.; Maggini, R.; Lehmann, A. Downscaling Switzerland land use/land cover data using nearest neighbors and an expert system. Land 2022, 11, 615. [Google Scholar] [CrossRef]
- Turban, E.; Aronson, J.E.; Liang, T. Decision Support Systems and Intelligent Systems, 7th ed.; Prentice Hall: Hoboken, NJ, USA, 2004; ISBN 978-0-13-046106-3. [Google Scholar]
- Huang, H.C.; Chen, C.S. Optimal Geostatistical Model Selection. J. Am. Stat. Assoc. 2007, 102, 1009–1024. [Google Scholar] [CrossRef]
- Cressie, N.A.C. Statistics for Spatial Data, Revised ed.; John Wiley & Sons: Hoboken, NJ, USA, 2015; ISBN 978-1-119-11517-5. [Google Scholar]
- Simensen, T.; Erikstad, L.; Halvorsen, R. Diversity and distribution of landscape types in Norway. Nor. Geogr. Tidsskr.-Nor. J. Geogr. 2021, 75, 79–100. [Google Scholar] [CrossRef]
- Bjørdal, I.; Bjørkelo, K.; Nilsen, B.; Nystuen, I.; Strand, G.H.; Thorvaldsen, K. Kodeverk og Symbolbruk i DMK og Avleidde Produkt; NIJOS dokument 2005, 36/04; Norwegian Land Inventory, NIJOS: Ås, Norway, 2005; Available online: http://hdl.handle.net/11250/2456803 (accessed on 25 May 2025). (In Norwegian)
- Ahlstrøm, A.P.; Bjørkelo, K.; Fadnes, K. AR5 Klassifikasjonssystem—Klassifisering av Arealressurser; NIBIO Bok 2019, 5; Norwegian Institute of Bioeconomy Research, NIBIO: Ås, Norway, 2019; Available online: http://hdl.handle.net/11250/2596511 (accessed on 25 May 2025). (In Norwegian)
- Svendgård-Stokke, S.; Cannell, R.J.S. The Norwegian Soil Information System. Data Capture, Data Management, Data Processing and Dissemination; NIBIO Report 2022, 067/2022; Norwegian Institute of Bioeconomy Research, NIBIO: Ås, Norway, 2022; Available online: https://hdl.handle.net/11250/2992191 (accessed on 25 May 2025).
- Døving, A.; Bakken, I.; Heggset, S.; Lied, J.G. Val av dreneringsmåte og omfang. In Drenering—Teori og Praksis; Bondevennen BA: Stavanger, Norway, 2013. (In Norwegian) [Google Scholar]
- Isaaks, E.H.; Srivastava, R.M. An Introduction to Applied Geostatistics; Oxford University Press: New York, NY, USA, 1989; ISBN 0-19-505013-4. [Google Scholar]
- Oliver, M.A.; Webster, R. Kriging: A method of interpolation for geographical information systems. Int. J. Geogr. Inf. Syst. 1990, 4, 313–332. [Google Scholar] [CrossRef]
- Wackernagel, H. Ordinary kriging. In Multivariate Geostatistics: An Introduction with Applications; Springer: Berlin/Heidelberg, Germany, 2003; pp. 79–88. [Google Scholar] [CrossRef]
- Solow, A.R. Mapping by simple indicator kriging. Math. Geol. 1986, 18, 335–352. [Google Scholar] [CrossRef]
- Pereira, G.W.; Valente, D.S.M.; Queiroz, D.M.d.; Coelho, A.L.d.F.; Costa, M.M.; Grift, T. Smart-Map: An Open-Source QGIS Plugin for Digital Mapping Using Machine Learning Techniques and Ordinary Kriging. Agronomy 2022, 12, 1350. [Google Scholar] [CrossRef]
- Grønlund, A.; Hauge, A.; Hovde, A.; Rasse, D.P. Carbon loss estimates from cultivated peat soils in Norway: A comparison of three methods. Nutr. Cycl. Agroecosyst. 2008, 81, 157–167. [Google Scholar] [CrossRef]
- Kekkonen, H.; Ojanen, H.; Haakana, M.; Latukka, A.; Regina, K. Mapping of cultivated organic soils for targeting greenhouse gas mitigation. Carbon Manag. 2019, 10, 115–126. [Google Scholar] [CrossRef]
- Oleszczuk, R.; Łachacz, A.; Kalisz, B. Measurements versus estimates of soil subsidence and mineralization rates at peatland over 50 years (1966–2016). Sustainability 2022, 14, 16459. [Google Scholar] [CrossRef]
- Kløve, B.; Berglund, K.; Berglund, Ö.; Weldon, S.; Maljanen, M. Future options for cultivated Nordic peat soils: Can land management and rewetting control greenhouse gas emissions? Environ. Sci. Policy 2017, 69, 85–93. [Google Scholar] [CrossRef]
- Ikkala, L.; Ronkanen, A.K.; Utriainen, O.; Kløve, B.; Marttila, H. Peatland subsidence enhances cultivated lowland flood risk. Soil Tillage Res. 2021, 212, 105078. [Google Scholar] [CrossRef]
- Paul, S.; Leifeld, J. Management of Organic Soils to Reduce Soil Organic Carbon Losses; Burleigh Dodds Science Publishing: Cambridge, UK, 2023. [Google Scholar] [CrossRef]
- Armanto, M.E.; Setiabudidaya, D.; Wildayana, E.; Zuhdi, M. Mapping and Analyzing Spatial Variability of Peat Depths by Using Geostatistics. J. Smart Agric. Environ. Technol. 2024, 2, 100–106. [Google Scholar] [CrossRef]
- Jacobs, P.M.; Mason, J.A.; Hanson, P.R. Loess mantle spatial variability and soil horizonation, southern Wisconsin, USA. Quat. Int. 2012, 265, 43–53. [Google Scholar] [CrossRef]
- Walker, P.H.; Hall, G.F.; Protz, R. Relation between landform parameters and soil properties. Soil Sci. Soc. Am. J. 1968, 32, 101–104. [Google Scholar] [CrossRef]
- Wang, M.; Liu, H.; Lennartz, B. Small-scale spatial variability of hydro-physical properties of natural and degraded peat soils. Geoderma 2021, 399, 115123. [Google Scholar] [CrossRef]
- Iqbal, J.; Thomasson, J.A.; Jenkins, J.N.; Owens, P.R.; Whisler, F.D. Spatial variability analysis of soil physical properties of alluvial soils. Soil Sci. Soc. Am. J. 2005, 69, 1338–1350. [Google Scholar] [CrossRef]
- Minasny, B.; Adetsu, D.V.; Aitkenhead, M.; Artz, R.R.; Baggaley, N.; Barthelmes, A.; Beucher, A.; Caron, J.; Conchedda, G.; Connolly, J.; et al. Mapping and monitoring peatland conditions from global to field scale. Biogeochemistry 2024, 167, 383–425. [Google Scholar] [CrossRef]
- Vollering, J.; Gatis, N.; Kusk Gillespie, M.; Muggerud, K.-K.; Nerhus, S.D.; Rydgren, K.; Sparf, M. Terrain is a stronger predictor of peat depth than airborne radiometrics in Norwegian landscapes. EGUsphere, 2025; preprint. [Google Scholar] [CrossRef]
Disclaimer/Publisher’s Note: The statements, opinions and data contained in all publications are solely those of the individual author(s) and contributor(s) and not of MDPI and/or the editor(s). MDPI and/or the editor(s) disclaim responsibility for any injury to people or property resulting from any ideas, methods, instructions or products referred to in the content. |
© 2025 by the authors. Licensee MDPI, Basel, Switzerland. This article is an open access article distributed under the terms and conditions of the Creative Commons Attribution (CC BY) license (https://creativecommons.org/licenses/by/4.0/).