Article

Biophysical and Social Constraints of Restoring Ecosystem Services in the Border Regions of Tibet, China

1
Lhasa Plateau Ecosystem Research Station, Key Laboratory of Ecosystem Network Observation and Modeling, Institute of Geographic Sciences and Natural Resources Research, Chinese Academy of Sciences, Beijing 100101, China
2
Xi’an University of Finance and Economics, Xi’an 710100, China
3
Industrial Ecology Programme and Department of Energy and Process Engineering, Norwegian University of Science and Technology, 7034 Trondheim, Norway
*
Author to whom correspondence should be addressed.
Land 2025, 14(8), 1601; https://doi.org/10.3390/land14081601
Submission received: 30 June 2025 / Revised: 31 July 2025 / Accepted: 2 August 2025 / Published: 6 August 2025
(This article belongs to the Special Issue The Role of Land Policy in Shaping Rural Development Outcomes)

Abstract

Ecosystem restoration represents a promising solution for enhancing ecosystem services and environmental sustainability. However, border regions—characterized by ecological fragility and geopolitical complexity—remain underrepresented in ecosystem service and restoration research. To fill this gap, we coupled spatially explicit models (e.g., InVEST and RUSLE) with scenario analysis to quantify the ecosystem service potential that could be achieved in China’s Tibetan borderlands under two interacting agendas: ecological restoration and border-strengthening policies. Restoration feasibility was evaluated through combining local biophysical constraints, economic viability (via restoration-induced carbon gains vs. opportunity costs), operational practicality, and simulated infrastructure expansion. The results showed that per-unit-area ecosystem services in border counties (particularly Medog, Cona, and Zayu) exceed that of interior Tibet by a factor of two to four. Combining these various constraints, approximately 4–17% of the border zone remains cost-effective for grassland or forest restoration. Under low carbon pricing (US$10 t−1 CO2), the carbon revenue generated through restoration is insufficient to offset the opportunity cost of agricultural production, constituting a major constraint. Habitat quality, soil conservation, and carbon sequestration increase modestly when induced by restoration, but a pronounced carbon–water trade-off emerges. Planned infrastructure reduces restoration benefits only slightly, whereas raising the carbon price to about US$50 t−1 CO2 substantially expands such benefits. These findings highlight both the opportunities and limits of ecosystem restoration in border regions and point to carbon pricing as the key policy lever for unlocking cost-effective restoration.

1. Introduction

Ecosystem services, the multiple benefits derived from functioning ecosystems, have become a foundational concept for aligning environmental planning with human welfare at varying scales [1,2,3]. Rapid urbanization and agricultural expansion have been shown to cause substantial losses in ecosystem services, including declines in water regulation, habitat quality, and carbon stock [4,5,6]. In response, the optimization of ecosystem services is primarily achieved through land use and land cover adjustments, often via nature-based solutions (NbSs) such as reforestation, reducing deforestation, and grassland restoration [7,8,9]. Recent assessments under the United Nations (UN) Decade on Ecosystem Restoration estimate that restoring 350 Mha of degraded land by 2030 could generate up to US$9 trillion in net ecosystem service benefits and sequester as much as 26 Gt of greenhouse gases [10]. However, restoration efforts can also displace productive lands (i.e., cropland and pasture), thereby posing critical challenges to food security and rural livelihoods [11,12]. As these benefits and potential trade-offs with other social–environmental priorities are largely mediated through land-use change, integrating ecosystem services into land-based restoration planning has become essential for safeguarding livelihoods and promoting long-term environmental sustainability [13,14,15,16].
Mechanistically, NbSs function to enhance ecosystem services through expanding or restoring natural vegetation, improving biogeochemical and hydrological processes, and promoting shifts toward more sustainable land management regimes [17,18]. However, in practice, the effectiveness of NbSs is often constrained by a range of biophysical, economic, and operational constraints, such as steep terrain, limited financial support, and water availability, and is in competition with other policy priorities [17,19,20,21]. For example, in biodiversity hotspots, natural vegetation regrowth [22,23] (i.e., passive vegetation recovery) is often a more nature-compatible alternative to active afforestation, which may cause unintended biological consequences. Reforestation in arid regions could increase evapotranspiration, thereby threatening water availability [24,25]. Additionally, in some cases, the opportunity cost of abandoning agricultural production for restoration purposes can be prohibitively high [7,11]. For instance, due to financial constraints, less than 20% of the 121 million hectares of biophysically suitable land in Southeast Asia is available for afforestation [19]. In China, 26–31%, 62–65%, and 90–91% of the total nature-based carbon solutions mitigation potential can be realized at carbon prices of US$10, US$50, and US$100 t−1 CO2, respectively [17]. Although previous studies have recognized the individual influence of these constraints, the combined effects of multiple constraints on ecological restoration outcomes have received limited attention.
Border regions often represent more critical socio-ecological frontiers, where fragile ecosystems intersect with geopolitical context. In addition to the inherent constraints of ecological restoration, border-strengthening policies (i.e., consolidating frontier populations and enhancing human-wellbeing through infrastructure expansion) further diminish such restoration efforts. Only a limited number of studies have explored ecosystem services (or related indicators) in border regions and typically focus on a single service. For example, these studies revealed the discontinuities in soil erosion across national borders [26] or the accelerating decline of habitat quality in China’s border areas [27]. Border regions have received limited attention in national-scale ecosystem service assessments, which often prioritize core ecological zones (e.g., [1,28]). Therefore, border regions remain systematically underrepresented in previous ecosystem service research.
One prominent example lies in the Tibetan borderlands of China. Known as the “Water Tower of Asia”, the Tibetan Plateau serves as the headwaters for several major transboundary rivers—including the Yarlung Zangbo, Salween, and Mekong—that sustain ecosystems and human livelihoods across South and Southeast Asia [29,30,31]. Consequently, ecological restoration efforts in this region have the potential to generate substantial downstream benefits that extend well beyond national boundaries [29,30,31]. Over the past two decades, infrastructure expansion, encompassing roads, hydropower stations, and urban development, has dramatically altered landscape structure and threatened ecosystem services along the Chinese Himalayan rim. Remote sensing analyses indicate that nearly one-third of the national border belt has experienced a persistent decline in habitat quality since the mid-1980s, with the most severe losses occurring in the Tibetan southwestern prefectures [27]. Given the vulnerability of these high-altitude environments, there is an urgent need for targeted strategies to reverse ongoing ecosystem degradation.
In this study, we applied a spatially explicit, process-based modelling framework to simulate ecosystem service dynamics in the Chinese Tibetan borderlands under two competing agendas: ecosystem restoration and border-strengthening policies. Ecological restoration enhances ecosystem services primarily by restoring degraded grasslands and forests to enhance vegetation cover and ecosystem functioning. In contrast, border-strengthening policies prioritize infrastructure expansion and settlement consolidation, often resulting in the conversion of natural ecosystems into impervious surfaces. These changes can diminish ecosystem service provisions and partially offset the gains from restoration efforts, particularly near settlements or transport corridors. Here, restoration scenarios were evaluated under various constraints—biophysical constraints, financial feasibility (via restoration-induced carbon gains vs. opportunity costs of agriculture production), operational practicality, and possible negative impacts from infrastructure expansion. Specifically, our analysis includes three objectives: (i) to quantify the current state, recent trends, and influencing factors of four major ecosystem services in the Tibetan borderlands; (ii) to identify areas that remain suitable for ecosystem restoration under multiple constraints; and (iii) to estimate the net ecosystem service potential when restoration is implemented alongside ongoing border-strengthening policies. Collectively, the study provides decision-makers with targeted guidance on where and how restoration efforts can deliver the ecosystem service returns in border regions.

2. Materials and Methods

2.1. Study Area

Our study focuses on the border counties of the Tibet Autonomous Region in southwestern China (Figure 1). These counties share long international borders with India, Nepal, Bhutan, and Myanmar. The region features a complex landscape and vulnerable environments, including high-altitude plateaus, steep mountains, and alpine meadows, with most areas located above 4000 m. Climate conditions vary from cold and arid in the northwest to warm and humid in the southeast. This region provides multiple key ecosystem services, like carbon sequestration, water and soil regulation, and biodiversity support. In recent years, national restoration strategies such as natural forest management, protected areas, and infrastructure development driven by the “border-strengthening policies” have had a profound impact on local ecosystem services. It offers a policy context for assessing ecosystem service dynamics and restoration potential.

2.2. Data Sources

The study utilized various types of data covering key variables such as land use, vegetation, topographic, soil, climate, grazing intensity, crop production, and human footprint (Table 1). All data were resampled to a spatial resolution of 500 m under Albers equal-area projections. It corresponds to the native resolution of the land use data used as the basis for restoration constraints and feasibility analysis.

2.3. Methodological Framework

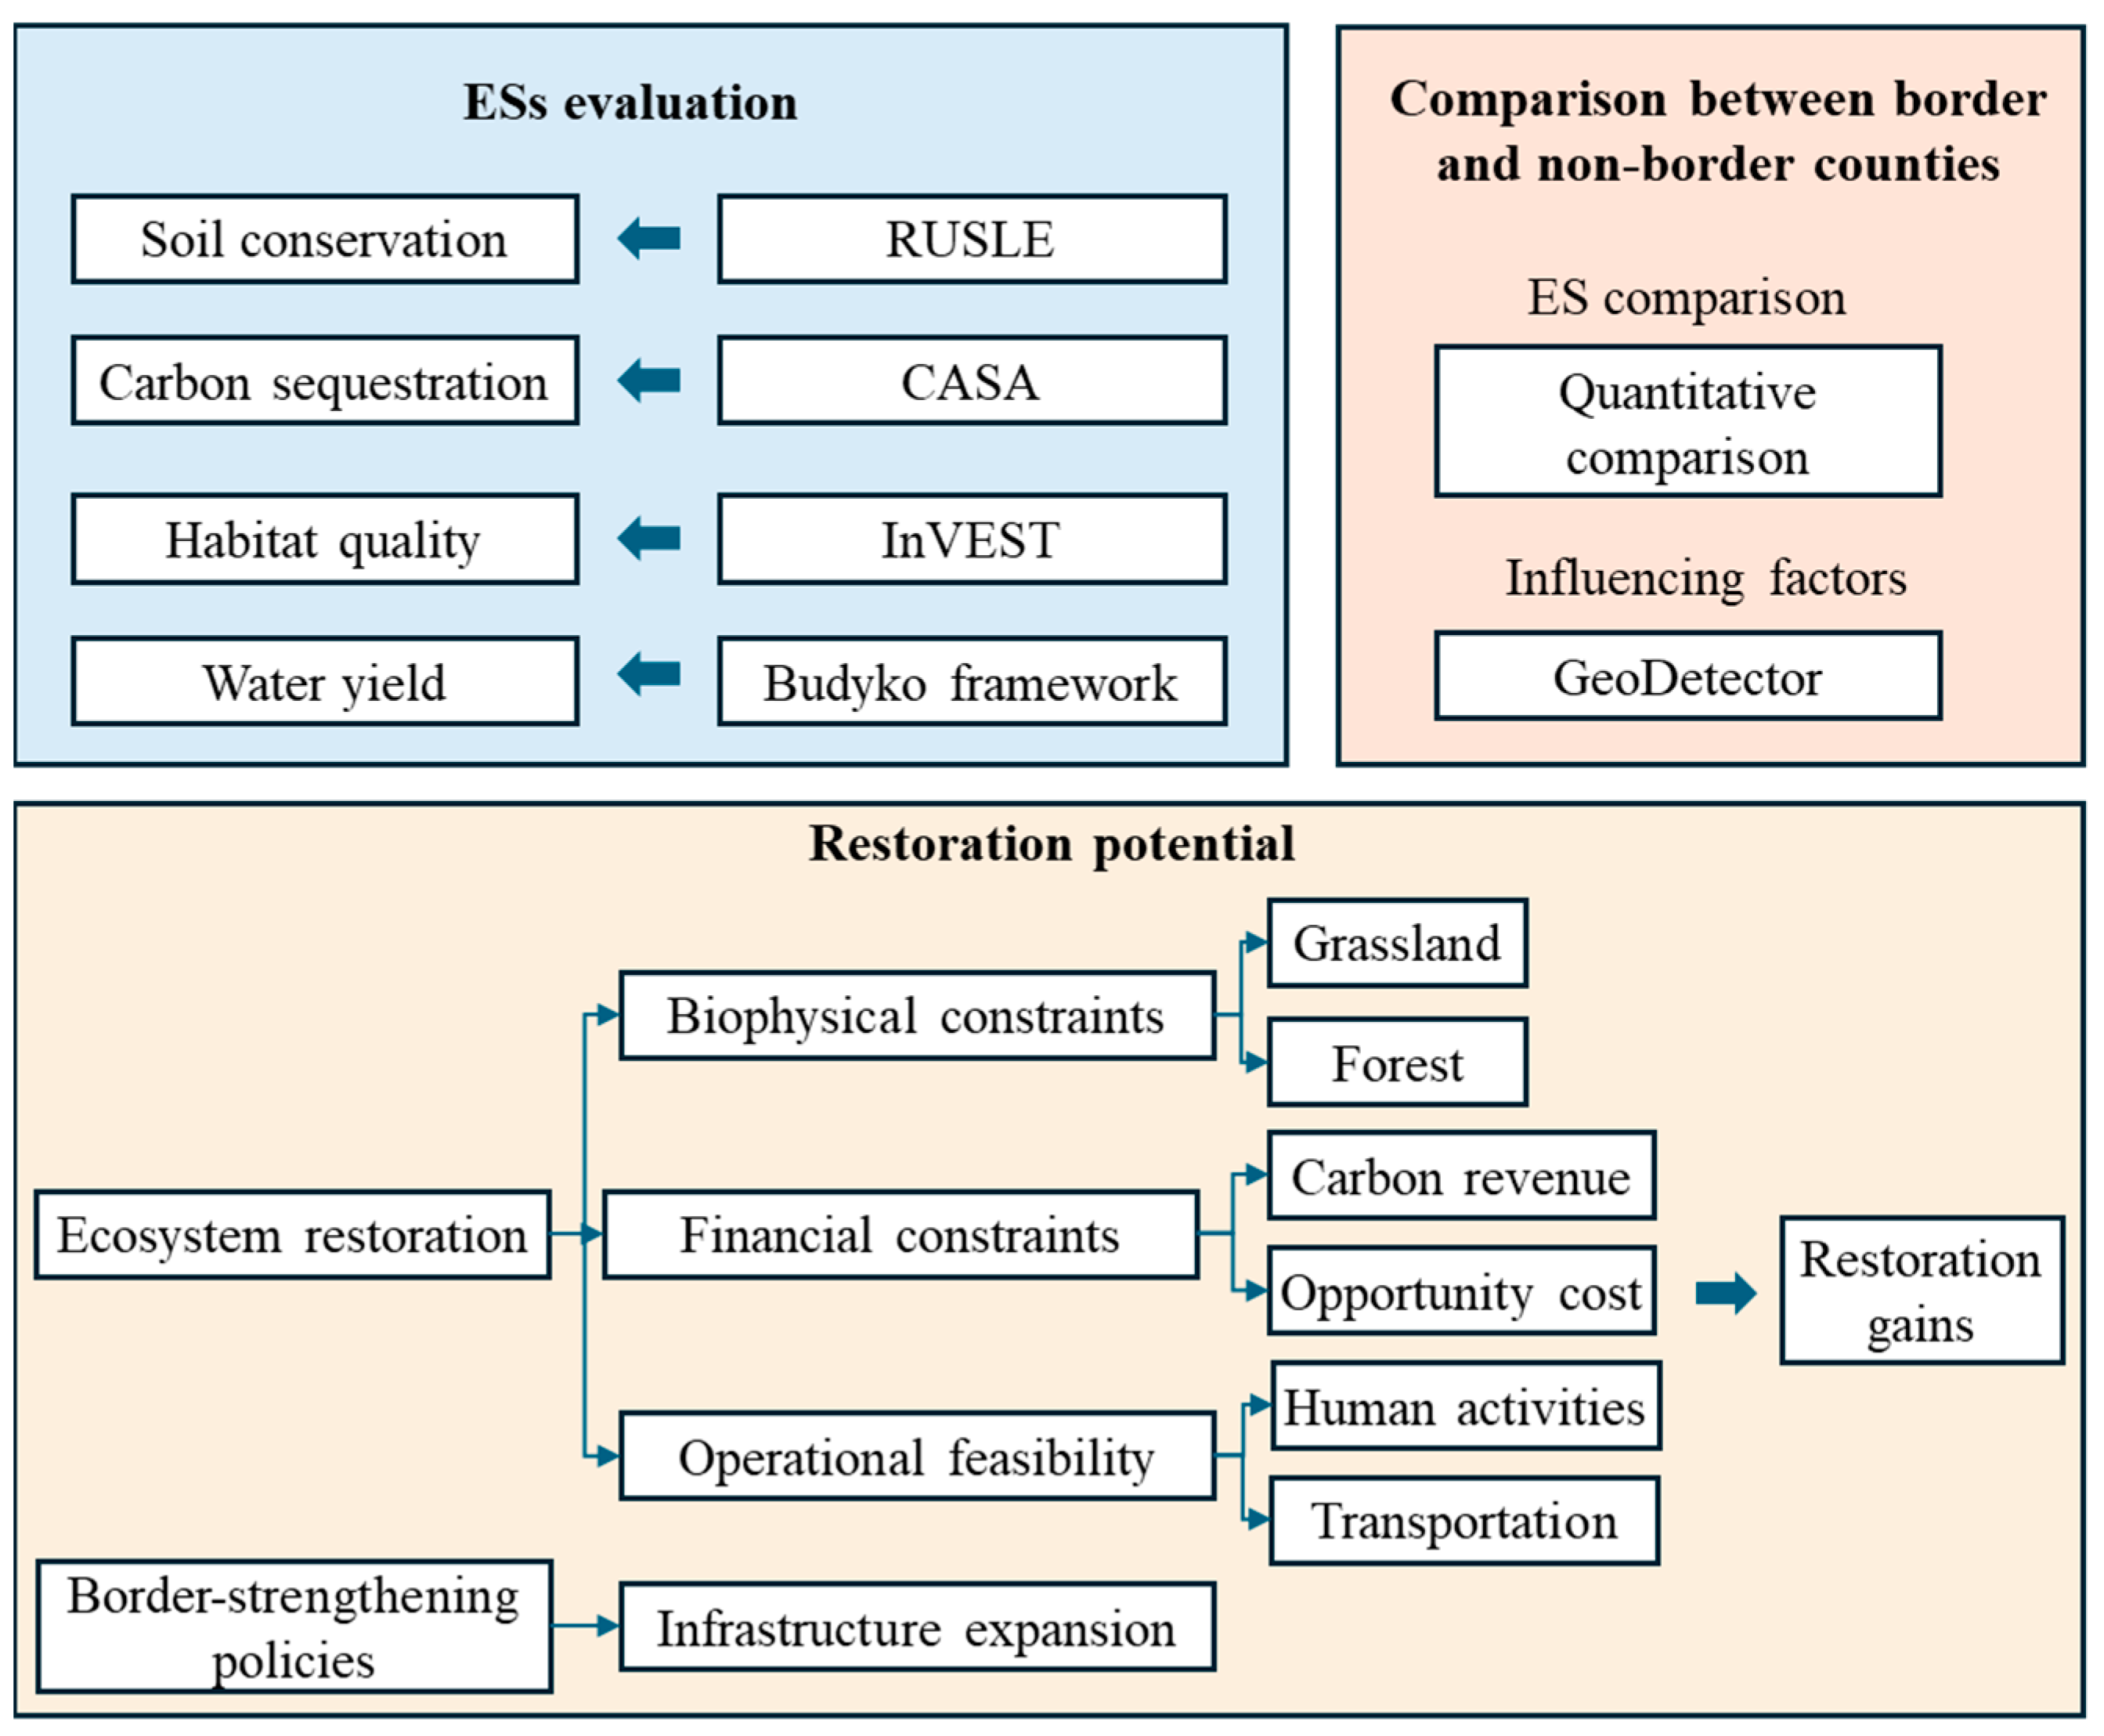
Figure 2 illustrates the technical pathway of this study. First, a suite of spatially explicit models was employed to evaluate multiple ecosystem services across the study area. Second, we compared the states, trends, and influencing factors of ecosystem services between Tibetan border counties and non-border counties. The underlying influencing factors were identified using the Geodetector method. This analysis aims to highlight the higher ecological and conservation value of border regions. Finally, we simulated restoration-induced gains in ecosystem services by integrating biophysical, economic, and operational constraints, as well as infrastructure expansion driven by border-strengthening policies, into the ecosystem service modeling framework. The methodological details are presented in a later section.

2.4. Ecosystem Services Evaluation

This study focused on four major ecosystem services: soil conservation, carbon sequestration, water yield, and habitat quality. This is due to Tibet playing a crucial role in soil and water conservation and climate mitigation. Soil conservation was estimated using the Revised Universal Soil Loss Equation (RUSLE [37]), defined as the difference between potential soil erosion (without vegetation and soil conservation practices) and actual soil erosion. The calculation is as follows:
A   =   A p   A r   =   R   ×   K   ×   L   ×   S   ×   1     C   ×   P
where A is the amount of soil conservation (t·ha−1·yr−1), Ap is potential soil erosion, and Ar is actual soil erosion. R is the rainfall erosivity factor (MJ·mm·ha−1·h−1·yr−1), K is the soil erodibility factor (t·h·MJ−1·mm−1), based on Environmental Policy Integrated Climate (EPIC) model [38], L is the slope length factor, S is the slope steepness factor [39], C is the cover-management factor, and P is the support practice factor. The L factor and S factor calculations refer to [40]. The calculation of C factor and P factor refers to [41].
Carbon sequestration was represented by net primary productivity (NPP) simulated using the improved CASA (Carnegie–Ames–Stanford Approach) model [42]. This model is calculated as the product of absorbed photosynthetically active radiation (APAR) and actual light-use efficiency (ε):
N P P x , t = A P A R x , t × ε ( x , t )
where APAR(x, t) is the absorbed photosynthetically active radiation for pixel x in month t (g C·m−2·month−1), and ε(x, t) is the light-use efficiency (g C·MJ−1).
Water yield was estimated using a water balance approach based on the Budyko framework [43], which calculates water yield as the difference between precipitation and actual evapotranspiration (AET):
Y x = 1 A E T x P x × P x
where Y(x) is the water yield (mm) for pixel x, P(x) is the annual precipitation (mm), and AET(x) is the actual evapotranspiration (mm).
Habitat quality was assessed by integrating NDVI data with the Habitat Quality module in InVEST model [44,45]. The output values range from 0 to 1, with higher values indicating better habitat quality. Following the work of [44], NDVI is further used to represent habitat suitability, as it more effectively captures the spatiotemporal dynamics of natural ecosystem. The formula is as follows:
Q x j = N D V I x j × ( 1 D x j   z D x j   z + k 2 )
where Qxj is the habitat quality of grid x for land use type j, NDVIxj is the NDVI value, Dxj is the habitat degradation level, k is a scaling parameter, and z is a weighting exponent.
These models represent well-established and widely accepted approaches for large-scale ecosystem service assessments, especially in data-scarce and topographically complex regions. They have been adopted in several national-level evaluations (e.g., [1,46]) and are commonly used in peer-reviewed studies focused on the Tibetan Plateau (e.g., [47,48,49]).
Based on time-series data (2001–2020) for the four ecosystem services, we conducted a pixel-wise linear trend analysis. Statistical significance was determined using a threshold of p < 0.05.

2.5. Influencing Factors Analysis Based on GeoDetector

This study employs the GeoDetector method [50] to quantify the explanatory power of different influencing factors on ecosystem services. A total of eight variables are considered: elevation, slope, temperature, precipitation, grazing intensity, population density, vegetation (represented by NDVI), and soil organic carbon. These variables reflect local climate, soil and topographic conditions, as well as human activities. The core principle of GeoDetector is to compare the variance of a dependent variable (i.e., various types of ecosystem services) within different strate of an explanatory variable against the total variance across the entire study area. The metric of GeoDetector (q-value) is calculated as follows:
Q D , H = 1 1 n σ H 2 i = 1 n n D , i σ 2 H D , i
where QD,H represents the explanatory power of factor D on ecosystem service H; n and σ2 denote the total number of samples and the overall variance of H, respectively. m is the number of strate of the factor D; nD,i is the number of samples in the i-th category of factor D; and QD,H is the variance of H within that category. We set randomly distributed points across the study area, with a minimum spatial distance of 5 km between any two points. At each point, values of ecosystem services and their associated driving factors were extracted for analysis.

2.6. Scenario Description

To align with both ecological and geopolitical policy objectives in Tibet border regions, we developed a set of multi-conditioning scenarios, integrating the restoration constraints and impacts of infrastructure expansion. In this study, ecosystem restoration scenarios refer to grassland and forest restoration under the biophysical constraints, financial constraints (considering restoration-induced carbon revenues under different carbon prices vs. opportunity cost of agriculture production), and operational feasibility (including regulatory and human disturbances; see details below). Moreover, the “border-strengthening policy” scenario refers to moderate intensity urban and infrastructure expansion outside protected areas in border regions.

2.6.1. Biophysical Constraints of Ecosystem Restoration

Biophysical constraints reflect the limitations imposed by local climate, topography, and soil conditions on the effectiveness of ecosystem restoration. We estimated the potential upper threshold of grassland restoration (NDVI as proxy), using a random forest approach combined with field investigations. Based on previous field samples [51], we extracted 356 long-term (>5 years) grazing exclusion sites across the Tibetan Plateau. This is assumed that NDVI in long-term (>5 years) within these fenced sites represents the maximum restoration potential of alpine grasslands under minimal human disturbance, given the regional climate, topography, and soil conditions. A total of 10 predictors were considered: mean temperature, precipitation, solar radiation, slope, aspect, elevation, soil organic carbon, sand fraction, silt fraction, and clay fraction. The resulting model was then applied across the study region to predict the spatial distribution of NDVI restoration potential under natural conditions. Due to the thin atmosphere and high elevation of the Tibetan Plateau, the number of high-quality field samples is relatively limited. Variations in grazing management history, disturbance legacy, scale dependency, and local ecological adaptation across fenced sites may also influence model outcomes. Therefore, the estimated NDVI should be interpreted as reference of biophysical potential, rather than a universally achievable target. Ecological restoration was selectively implemented: if a grassland pixel’s current NDVI was lower than the value predicted by the random forest model, restoration was performed to reach the predicted level of NDVI; otherwise, the pixel was left unchanged. Based on forest loss data from Global Forest Watch [32], areas that experienced deforestation since 2000 were assumed to be eligible for forest recovery. Reforested NDVI was estimated based on the mean NDVI of nearby forest pixels located within a 5 km neighborhood. The 5 km neighborhood was selected as a compromise between ensuring sufficient sampling of representative forest pixels and maintaining agri-ecosystem similarity at the landscape scale. Similar neighborhood-based windows search approaches have been adopted in previous ecological assessments on the Tibetan Plateau using 500 m resolution MODIS data (e.g., ref. [52]). This approach allows for capturing local patterns of forest, while avoiding overgeneralization from distant and dissimilar forest patches.

2.6.2. Social Constraints of Ecosystem Restoration

Social constraints include financial constraints and operational feasibility. Financial constraints were evaluated by comparing the potential revenue from enhanced carbon sequestration through ecological restoration, with the opportunity costs of crop and pastoral production, as well as the compensation costs associated with ecological resettlement. The carbon market value of restoration was estimated by first calculating pixel-level carbon sequestration based on post-restoration NDVI using the CASA model, and then multiplying the given carbon price. Three carbon pricing standards were considered: US$10 t−1 CO2, US$50 t−1 CO2, and US$100 t−1 CO2, following the work of [17]. The carbon price of US$100 represents a cost-effective price for the achievement of the Paris Agreement targets, while US$10 reflects the current carbon trading price in China. US$50 serves as an intermediate value between the two. This pricing structure has also been widely applied in other influential studies (e.g., [7,19,53]).
Crops and pastoral opportunity costs were calculated by combining spatial data on grazing intensity and crop yield with corresponding commodity prices. Compensation costs for ecological resettlement were estimated using spatial population density data from Worldpop and standardized per capita compensation rates based on local investigation. Compensation rate was based on a 2013 field study [54], which was conducted in the Sanjiangyuan region in cooperation with the Golog Tibetan Autonomous Prefecture government, the Sanjiangyuan Immigration Office, and two ecological resettlement villages (Guoluo New Village and Heyuan New Village). The compensation standard reported was 3944 CNY per person, derived using a combination of methods including the opportunity cost of pastoralism, opportunity cost of grassland use, and regional development gap analysis. To update this standardized per capita compensation rate to 2021 values, we applied for a 5% annual discount rate. Integrating per capita compensation rate and gridded population density data, we estimated spatially explicit ecological resettlement compensation costs at the pixel level. However, we acknowledge that this approach does not account for price fluctuations, policy subsidies, or non-market values (e.g., landholders’ decisions), and thus introduces uncertainty into the assessment of financial feasibility.
Operational constraints reflect the practical difficulties associated with implementing ecosystem restoration, including transportation limitations and human activity risks. In this study, the restoration area was restricted to within 90 km of main roads. This corresponds to a round-trip journey of 6 h at 30 km/h in areas without road infrastructure. Outside major roads, much of the Tibetan Plateau consists of desert or steep grassland terrain, where transportation is extremely limited. Ecological restoration beyond this range is considered to involve substantial implementation difficulties and may lack guarantees for sustained outcomes. This design draws on ref. [19], which defined accessibility as locations within a one-day travel distance from human settlements. Compared to their approach, our 90 km buffer is more conservative. Additionally, human footprint data sourced from [33] was used to represent human activity intensity. The mapping of human footprints combined multiple sources of human activities: cultivation, grazing, urban building, population density, and major roads. This dataset was used to identify high-risk areas where human activity intensity was ≥4, which may negatively affect restoration effectiveness.

2.6.3. Infrastructure Expansion Simulation

The strengthening broad development policy in Tibet emphasizes urban renewal and infrastructure expansion for consolidating frontier populations and enhancing local human-wellbeing. Here, we used the projections of moderate-intensity future urban expansion to represent such policy. It is derived from a land-use simulation dataset developed by [55], which simulates land-use transitions using actual land demand as input. Following a demand-driven framework, the model incorporates competition among different land-use types and accounts for constraints on land-use/land-cover change. Simulations were carried out using the PLUS-CARS model, a CA-based (cellular automata) approach for spatial land-use simulation.
We constructed seven scenarios based on simulated infrastructure expansion and different combinations of three types of constraints: biophysical constraints, financial constraints (under low, medium, and high carbon pricing), and operational constraints. On the basis of projected infrastructure expansion, these scenarios include the following: (1) biophysical constraints only; (2–4) biophysical constraints combined with economic constraints under three different carbon pricing levels; and (5–7) biophysical, economic, and operational constraints combined under the same three carbon pricing levels. The constraint layers were integrated using a spatial intersection approach. In each scenario, only areas that simultaneously meet the relevant constraints are retained as eligible for restoration. For example, a pixel that is biophysically suitable may still be excluded if it does not meet the economic or operational threshold.
We sequentially combined the aforementioned constraints to generate corresponding land cover and attainable NDVI values under seven representative scenarios. These were then integrated with the ecosystem service assessment method described above to quantify the ecosystem service gains achievable under different constraint conditions.

3. Results

3.1. Ecosystem Services, Trends, and Influencing Factors: Comparison Between Border and Non-Border Counties

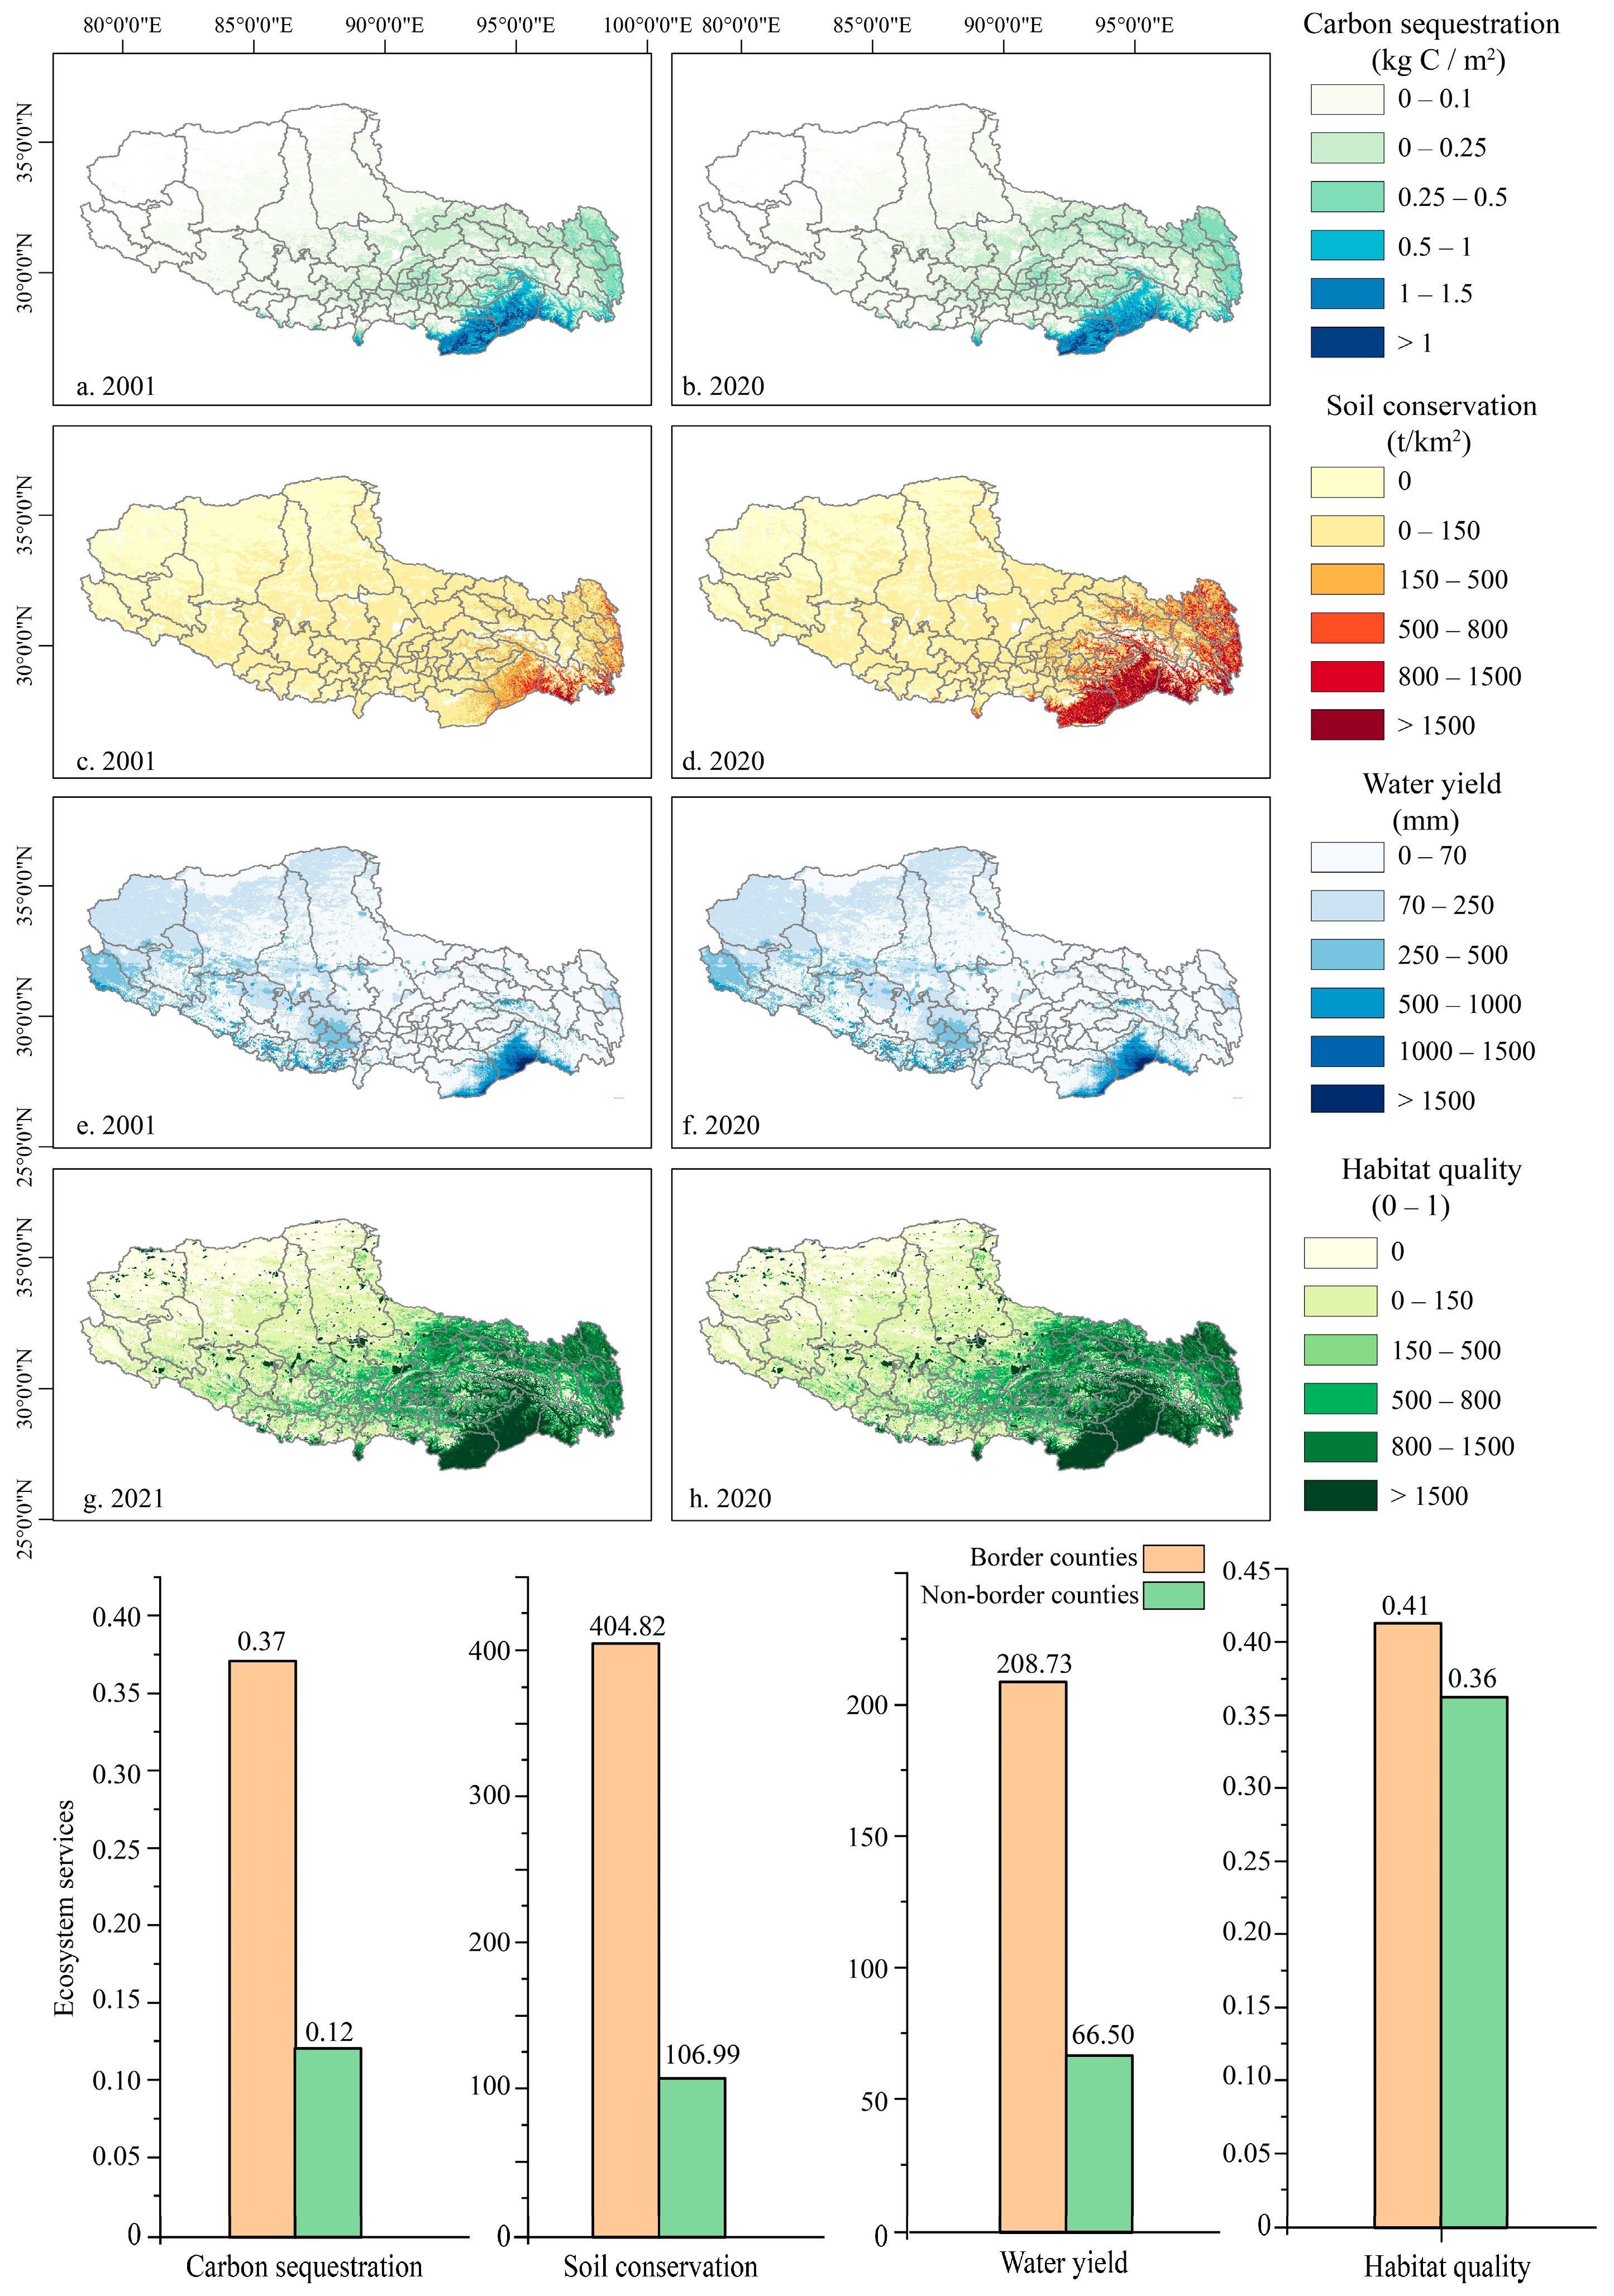
We compared the status, trends, and influencing factors of ecosystem services between the border and non-border regions of Tibet, and aimed to highlight the significant ecological value of border regions. The spatial distribution of four key ecosystem services in the Tibet Autonomous Region during 2001 and 2020 exhibited a consistent pattern of higher values in the southeast and lower values in the northwest (Figure 3). Carbon sequestration and soil conservation were particularly prominent in Medog, Cona, and Zayu. The harsh climatic conditions and sparse vegetation in northern and western Tibet, such as in Ritu, Shuanghu, Nima, Gerze, Zanda, and Gar, corresponded to low levels. Soil conservation followed a similar spatial gradient, decreasing from forests to meadows and grasslands, with notable increases in eastern Tibet over the two decades. High water yield was observed in southeastern counties, especially Medog and Cona. Habitat quality was significantly higher east of the 90° E meridian, while high-quality areas in western Tibet were mainly limited to alpine lakes. These spatial differences reflect underlying environmental constraints, including low vegetation cover and climatic aridity.
The comparison between border and non-border counties showed that border counties provided obviously higher ecosystem services across all four types. Specifically, carbon sequestration in border areas reached 0.37 kg C/m2, which was 3.08 times that of non-border areas (0.12 kg C/m2). Soil conservation was 404.82 t/km2 in border counties, which was 3.78 times higher than the 106.99 t/km2 observed in non-border counties. Water yield in border regions averaged 208.73 mm, also more than triple that in non-border areas (66.50 mm). Habitat quality was slightly higher in border counties (0.41) compared to non-border counties (0.36). These results indicate that the per-unit-area carbon sequestration, soil retention, and water yield in border counties are more than three times higher than those in non-border counties, while habitat quality is also marginally superior.
Figure 4 presents the fraction in each county showing significant increases (p < 0.05), increases, decreases, and significant decreases in four major ecosystem services. Carbon sequestration, soil conservation, and habitat quality predominantly exhibited increasing trends, particularly in southern Tibet. In contrast, water yield showed more spatial variability, with both significantly increasing and decreasing trends concentrated in border counties. Western border counties on the Tibetan Plateau tended to exhibit significant increases in water yield, while those in Shigatse, Shannan, and Nyingchi more often showed significant declines.
Across the border counties, carbon sequestration exhibited a heterogeneous spatial pattern, with significant increases in 5.20% of the area, moderate increases in 39.62%, moderate decreases in 32.64%, and significant decreases in 6.14%. Compared to non-border counties, border areas had lower proportions of increasing trends and higher proportions of decreasing trends in carbon sequestration. Soil retention in border counties improved markedly, with 50.25% and 70.77% of the area showing significant increases and increases, respectively, and only 3.47% showing decreases. However, non-border counties exhibited even higher proportions of improvement (62.79% and 83.62%), exceeding border areas by more than 10 percentage points.
Water yield and habitat quality in border counties improved more markedly than in non-border counties, with the increases in water yield (12.24% significant, 18.75% increase) and habitat quality (20.33% significant, 76.30% increase) both exceeding those in non-border areas by over 10 percentage points. Nonetheless, a notable exception was the significantly higher proportion of areas with a declining water yield in border counties (26.60%) compared to non-border counties (7.74%). Overall, border counties experienced greater improvements in water yield and habitat quality, whereas non-border counties performed better in enhancing carbon sequestration and soil retention.
GeoDetector analysis revealed that the NDVI, temperature, and elevation were the dominant influencing factors across all four ecosystem services (Table 2), while population density and grazing intensity consistently showed weak explanatory power in both border and non-border regions. Specifically, the NDVI, temperature, and elevation were the most influential factors affecting habitat quality in Tibet’s border regions, with q-values of 0.81, 0.61, and 0.57, respectively. In non-border regions, the NDVI (q = 0.72), temperature (q = 0.37), and soil organic carbon (q = 0.48) had relatively higher explanatory power. For carbon sequestration, the NDVI, temperature, and elevation showed very strong influences in border areas (all q > 0.80), while in non-border areas, the NDVI (q = 0.80), temperature (q = 0.50), and soil organic carbon (q = 0.47) ranked highest. Water yield in border areas was mainly explained by elevation (q = 0.49) and temperature (q = 0.37), but in non-border areas, all eight factors showed weak explanatory strength.

3.2. Constraints of Biophysical and Social Constraints on Available Ecosystem Restoration Regions

Figure 5 illustrates the spatial extent of available ecological restoration areas in Tibet’s border regions under the dual context of ecological restoration and border-strengthening policies. The analysis incorporates biophysical constraints, financial feasibility under different carbon pricing scenarios (US$10, US$50, and US$100 t−1 CO2), and operational constraints, including human activity risk and regulatory feasibility. When only biophysical constraints are considered, restoration potential is primarily concentrated in central counties such as Langkazi, Zhongba, and Saga. When financial feasibility is further introduced, the available areas shift toward southeastern counties such as Medog and Zayü. As carbon prices rise, the available zones expand into several central and western counties, including Zhongba and Saga. When operational feasibility is further combined, most border counties show high potential for restoration implementation, with low human disturbance and strong regulatory capacity. Only a few counties (i.e., Ritu, Cona, and Medog), exhibit localized risks due to limited accessibility. Counties such as Cona, Medog, and Gar exhibited slight but noticeable signs of infrastructure expansion.
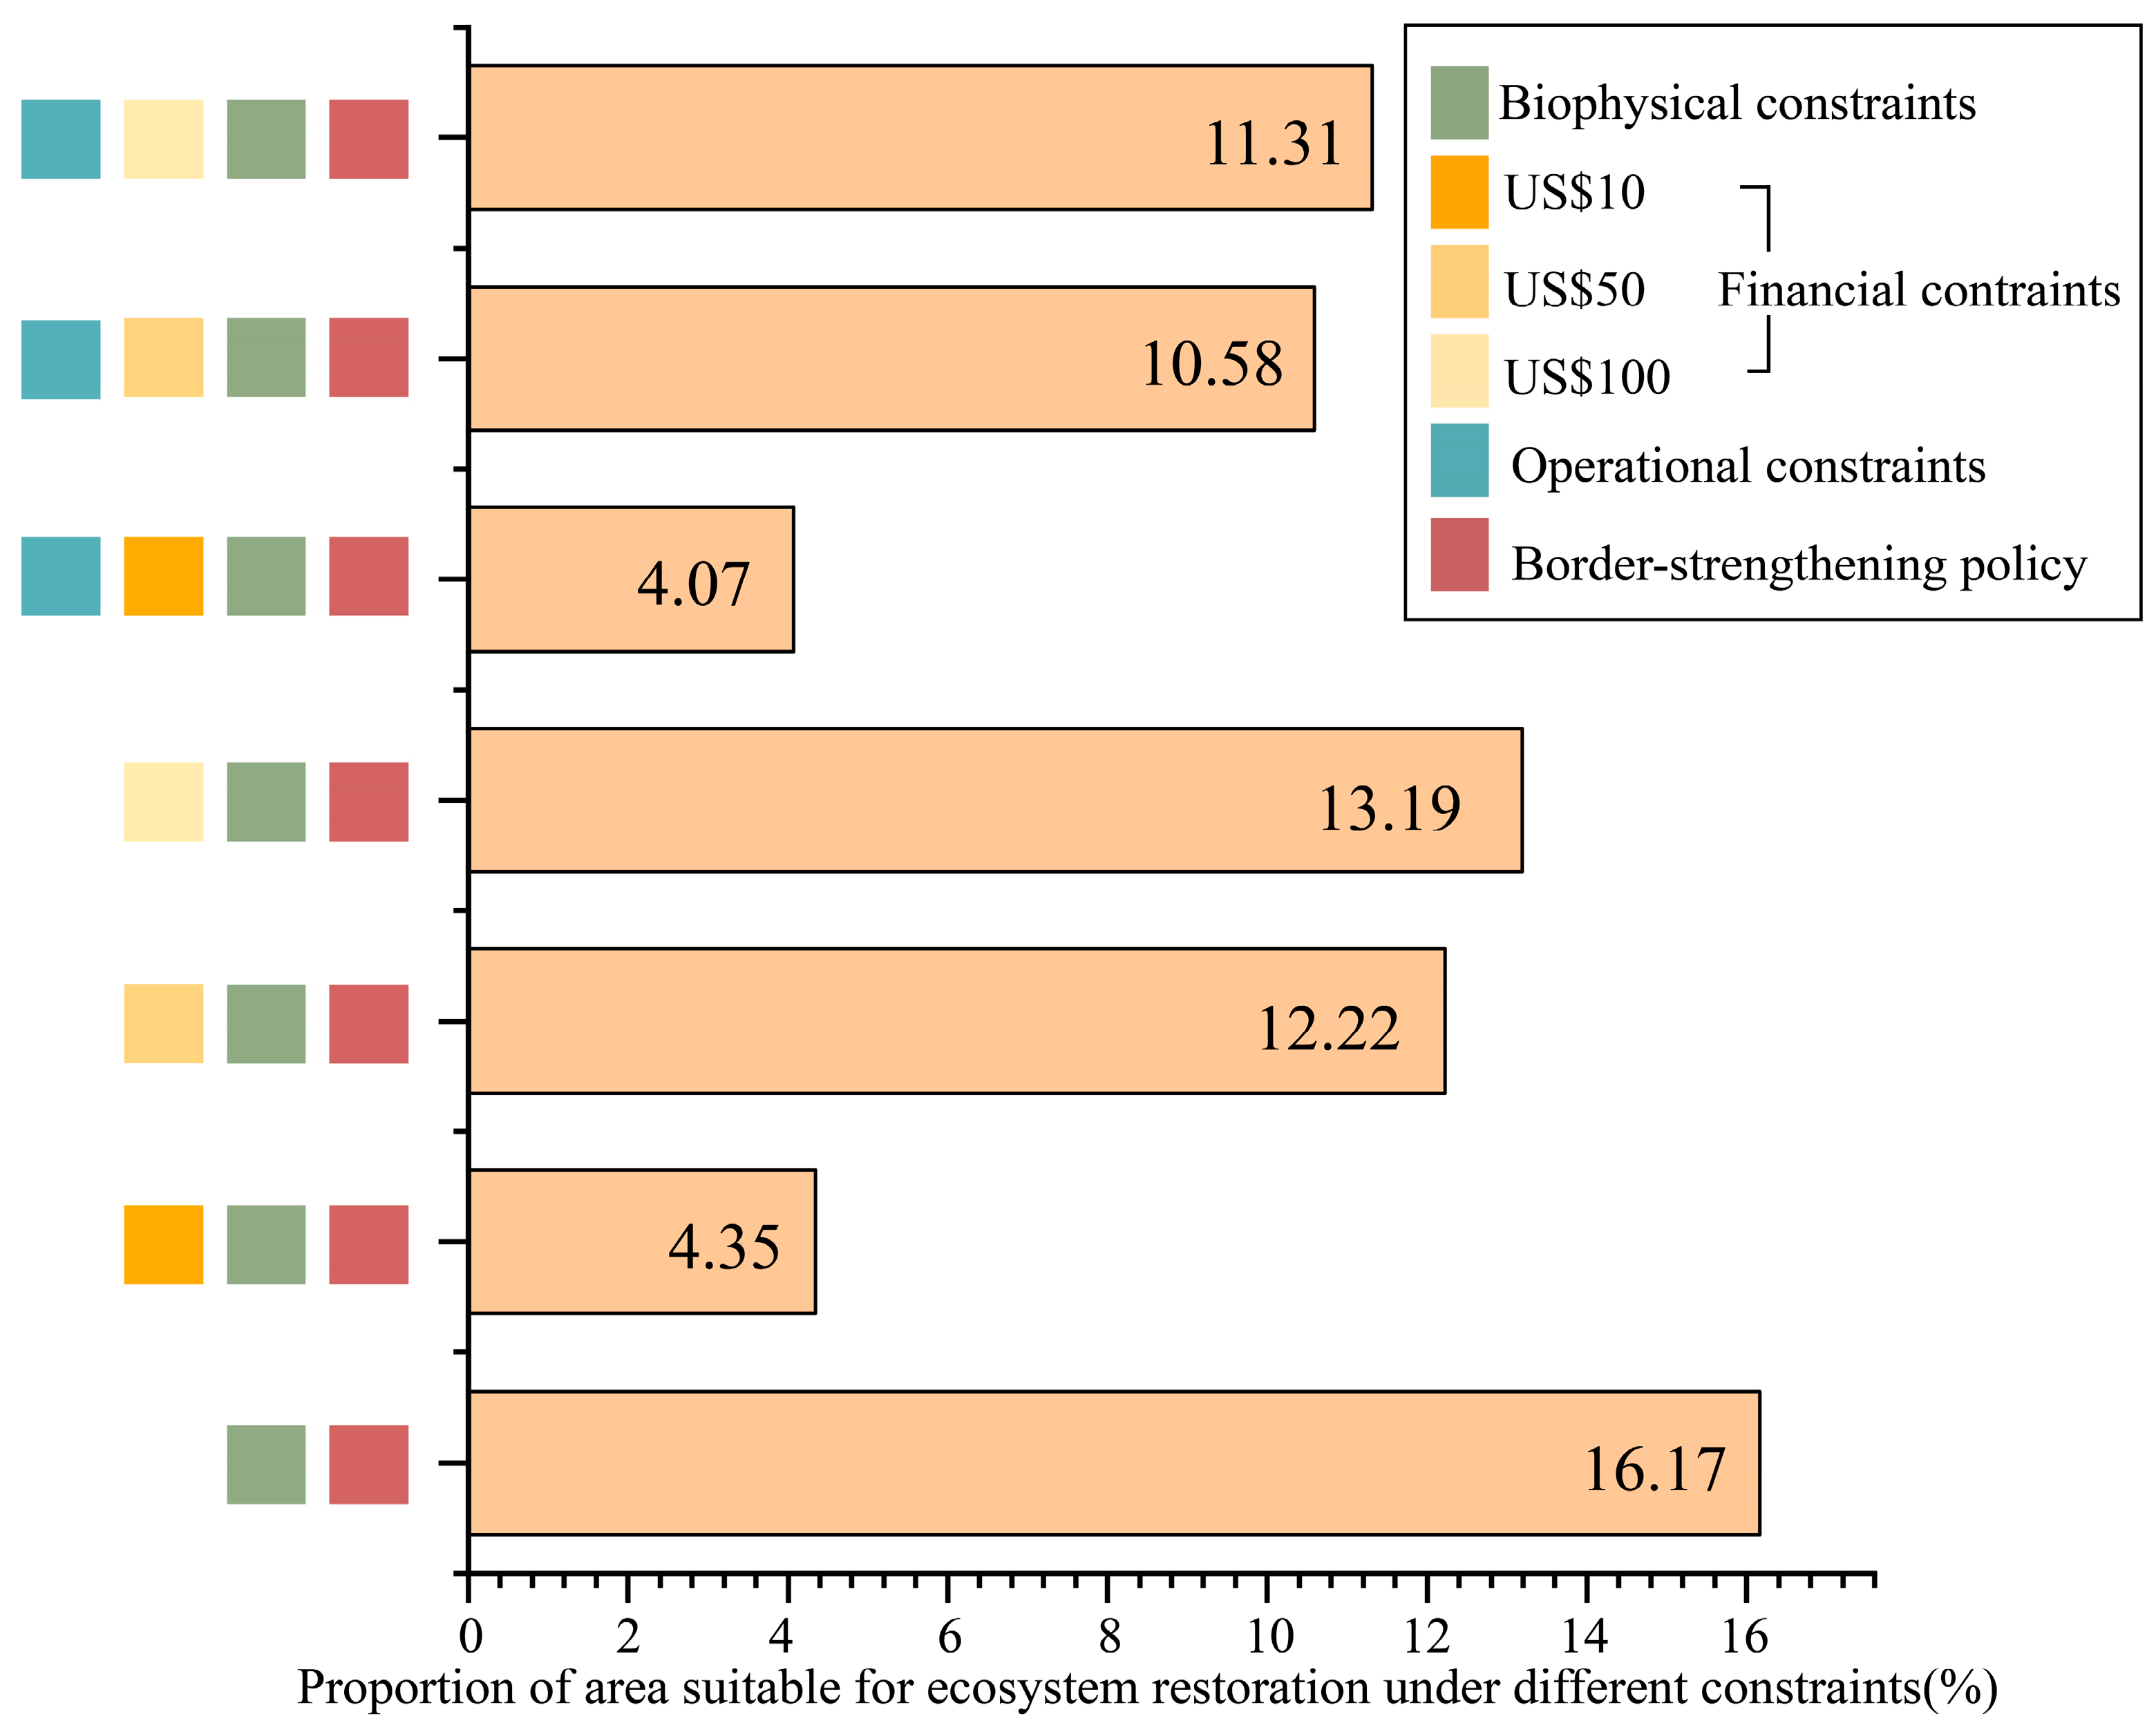
Figure 6 quantifies the proportion of area suitable for ecosystem restoration, considering multiple constraints and infrastructure expansion. Under biophysical constraints alone, the suitable restoration area is 16.17% of the total area. When economic constraints under three types of carbon prices (US$10, US$50, and US$100) were added, the restorable areas were 4.35%, 12.22%, and 13.19%. The inclusion of feasibility constraints leads to a shrinkage of about 20% in the restorable area. The impact of infrastructure expansion driven by border-strengthening policies was minimal, reducing the proportion of restorable land by only 0.2% to 0.9% relative to scenarios without them. Although there have been long-term ecological restoration efforts since the 1980s, approximately 17% of the region could further increase the NDVI. The choice of carbon pricing serves as a secondary determinant, as the area restored under a carbon price of US$10 is only one-third of that under a price range of US$50–100. These findings indicate that ongoing border-strengthening policies have limited spatial overlap with ecologically restorable areas and exert only a marginal influence on restoration potential.

3.3. Potential Impact of Ecosystem Restoration on Ecosystem Services

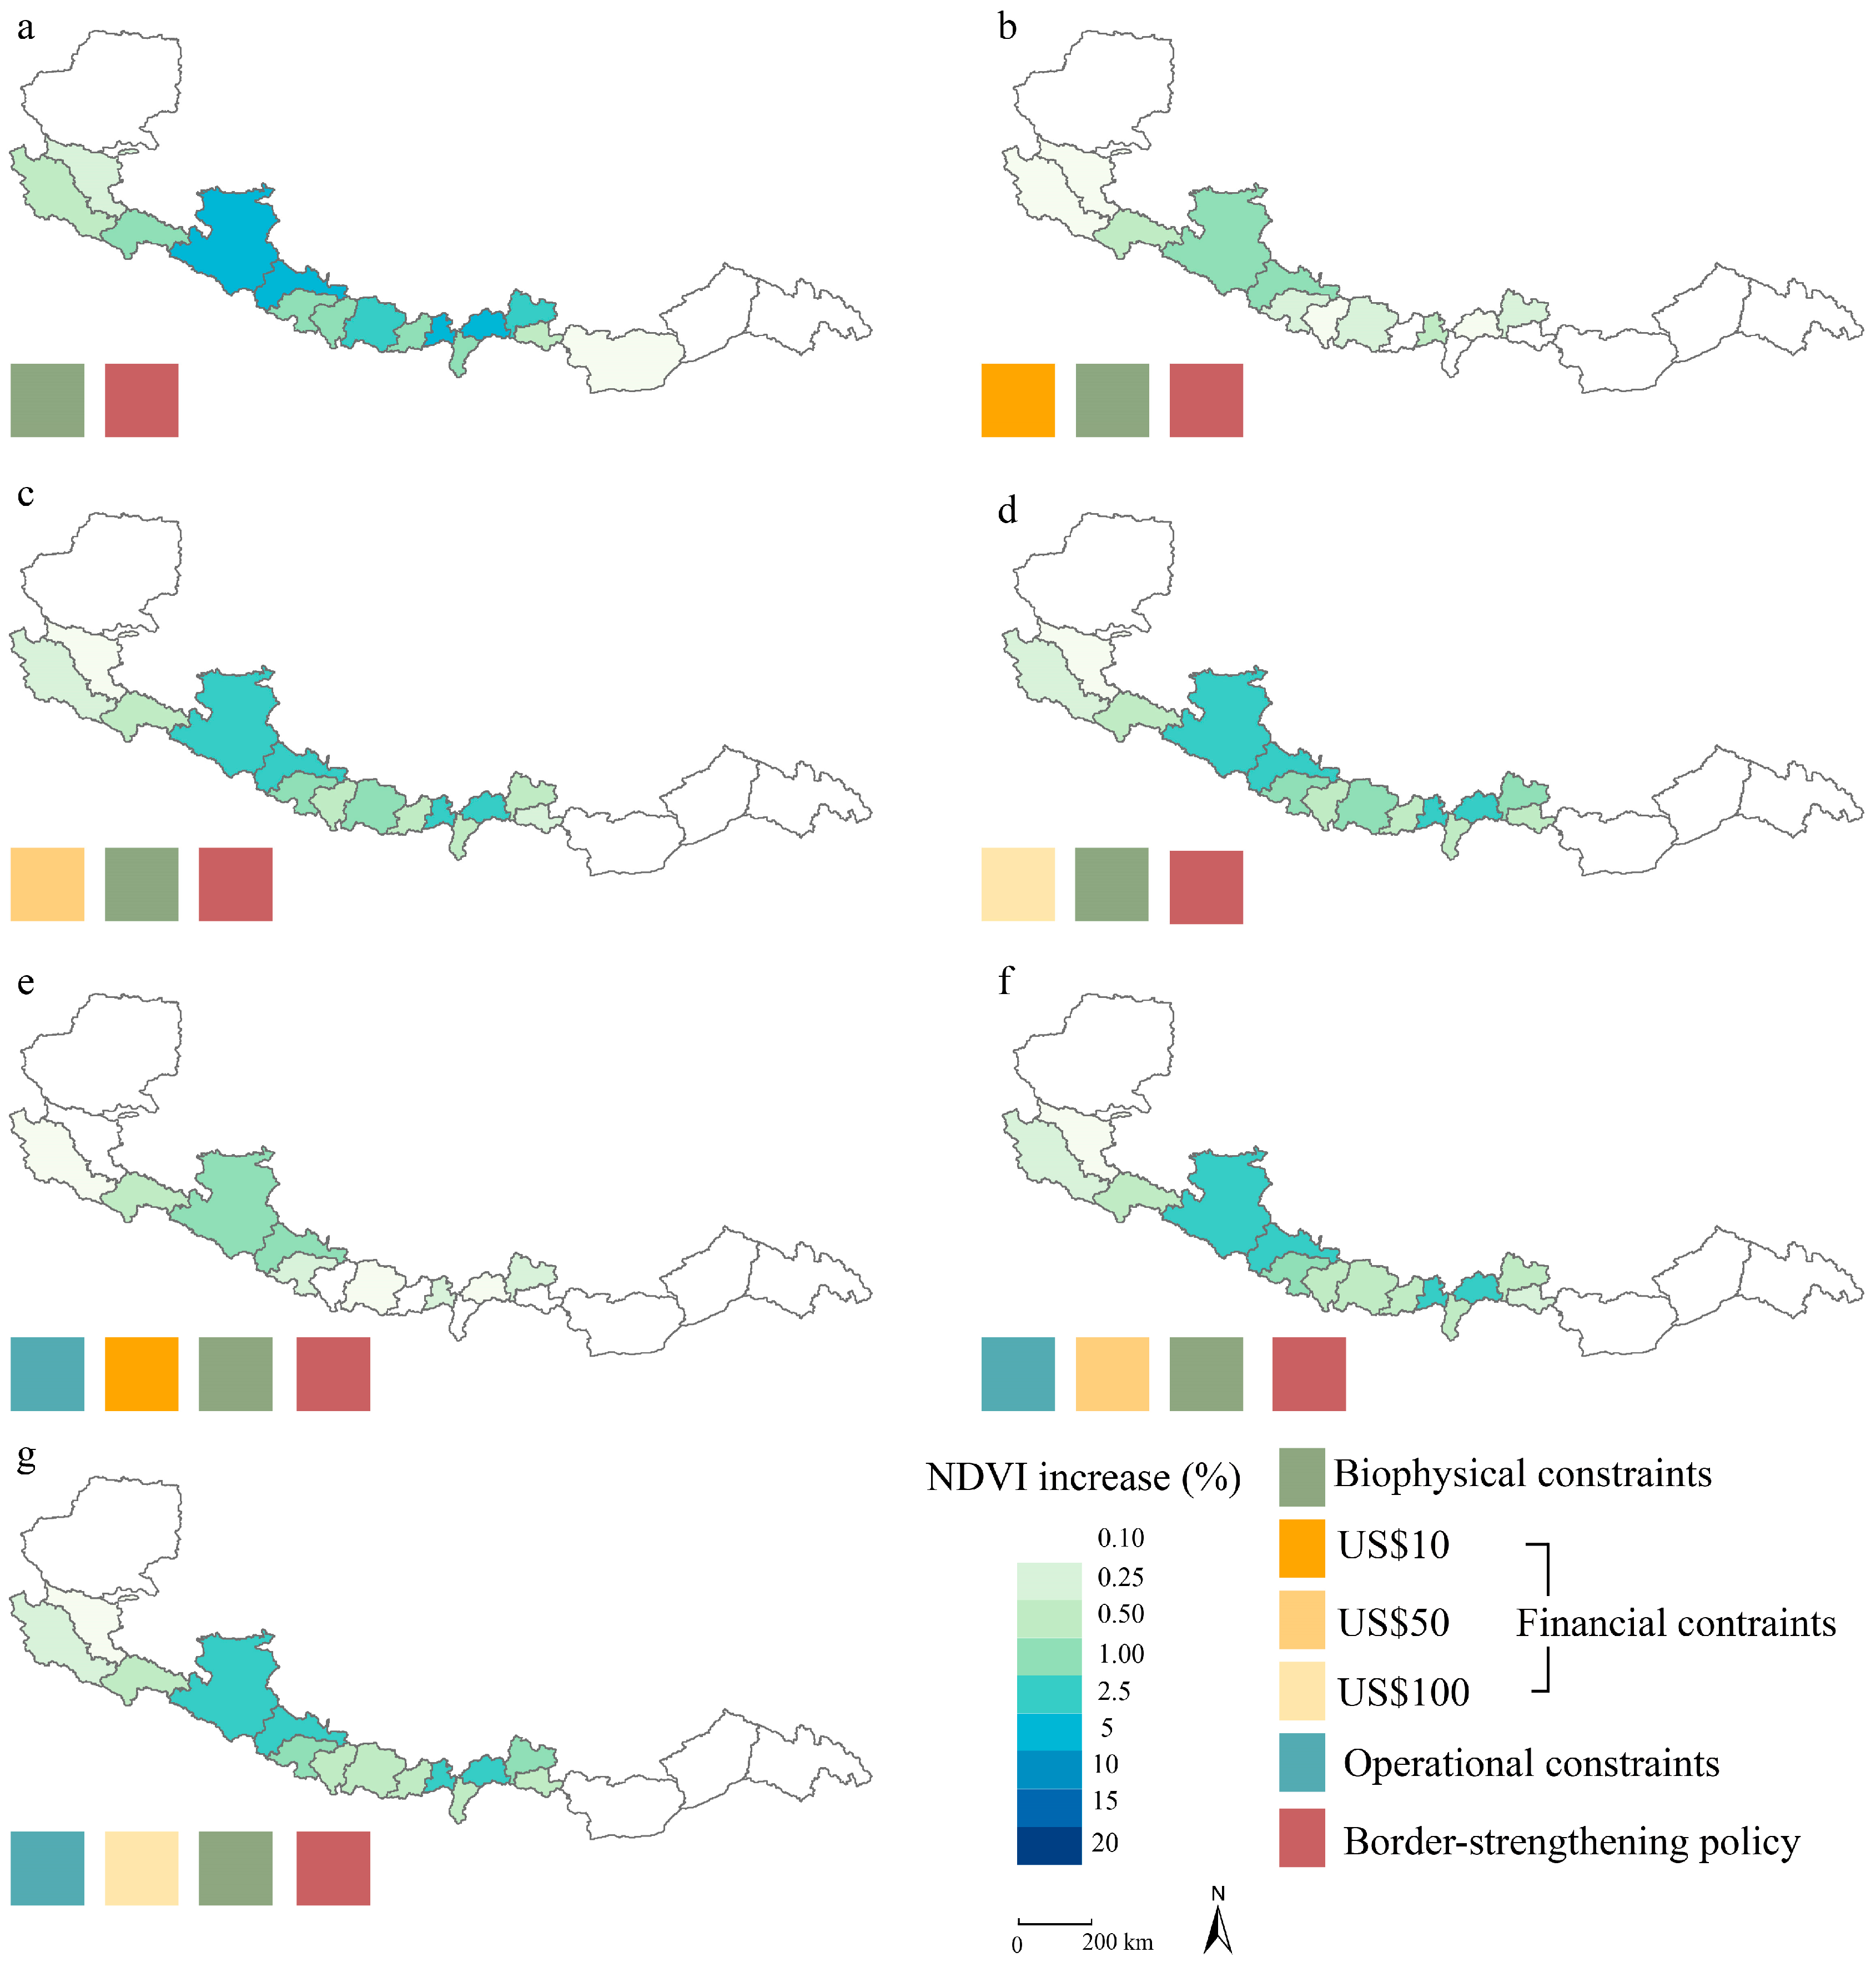
Ecological restoration constrained solely by biophysical factors could increase NDVI in Tibet border counties by nearly 5%, relative to present-day level (Figure 7). However, when varying economic constraints are introduced, the vegetation improvement effect is substantially reduced, with NDVI gains dropping to just 0.41–1.22%, equivalent to only one-tenth to one-fourth of the biophysical-only scenario. Adding operational constraints, such as regulatory feasibility and human activity risk, results in modest NDVI increases of 0.48–1.11% above current levels. In more comprehensive constraint scenarios, however, the negative impact of urban expansion remains limited, generally below 0.3 percentage points. Across all scenarios, the most pronounced NDVI improvements are concentrated in central border counties, particularly Zhongba, Saga, and Gangba. NDVI improvement potential is relatively low in the southeastern border region of Tibet, likely due to dense forest cover and minimal historical deforestation.
Across different scenarios, compared to present-day level, ecological restoration led to modest improvements in ecosystem services, with habitat quality increasing by only 0.16–4.11%, carbon sequestration by 0.03–2.35%, and soil retention by 0.02–0.86% (Figure 8). However, afforestation and grassland restoration also enhanced vegetation evapotranspiration, resulting in a reduction in water yield by approximately 0.66–2.54%. Low carbon pricing (US$10 t−1 CO2) severely constrained restoration outcomes, while the effectiveness achieved under the US$50 pricing scenario was broadly comparable to that under the US$100 scenario. Low carbon pricing fails to compensate for the opportunity cost of abandoning agricultural and pastoral production, making it the primary barrier to effective ecological restoration. When additional operational constraints are considered—such as poor accessibility or locally high grazing intensity—ecosystem service gains are reduced by 40% to 60% compared to scenarios without such limitations. This highlights how limited infrastructure and intensive land use can substantially undermine the outcomes of restoration efforts. Overall, incorporating border strengthening programs into the restoration framework led to a slight reduction in ecosystem service gains. Figures S1–S4 illustrate the dynamics of four key ecosystem services under ecological restoration and border infrastructure expansion scenarios. Across all analyses, the central border counties consistently emerge as hotspots for restoration efforts and potential gains in ecosystem service.

4. Discussion

4.1. Restoration Importance in Tibet’s Border Areas

A comparison of ecosystem services between Tibet’s border and non-border regions highlights the strategic importance of prioritizing restoration and conservation efforts in the border areas. Specifically, three key ecosystem services—carbon sequestration, water yield, and soil conservation—are markedly higher (2–4 times) in the border regions. The cluster forested areas in Tibet are primarily concentrated in low-altitude border areas with warm climate, such as Shannan and Nyingchi, where elevations fall below 3000 m. In addition, several parts of the border have been designated as protected areas, such as the Qomolangma and Medog Nature Reserve [33,56,57]. Therefore, ecological conservation and restoration efforts in these regions are generally more intensive and better enforced. Moreover, the border regions of Tibet are sparsely populated (400,000 people, <20% of the regional total), resulting in minimal anthropogenic disturbance to local ecosystems [58]. These factors collectively explain the elevated ecosystem service observed in Tibet’s border regions. However, the supply of ecosystem services across Tibet’ border regions exhibits a clear east–west gradient. This is consistent with the observations of [47,48,49]. Dominated by alpine desert and alpine grassland ecosystems, the western border of Tibet experiences low rainfall, cold temperatures, and nutrient-poor soils, which collectively hinder vegetation development and reduce restoration potential. These patterns underscore the urgent need for heterogeneity-informed restoration planning.

4.2. Biophysical and Social Constraints on Ecosystem Restoration

Our work highlights that a credible assessment of ecosystem restoration potential must move beyond simplistic maps indicating “where trees or grasses can grow”. Instead, it requires the integration of biophysical constraints, economic feasibility, competing land uses, and operational practicality [19,59,60,61]. Our results confirm how strongly these non-biophysical constraints compress the theoretical potential induced by restoration. Under the full and strict suite of biophysical, economic, and operational constraints, only about 4% of the Tibetan border zone remains cost-effective for restoration at a low carbon price (US$10 t−1 CO2), whereas a higher price (US$50–100 t−1) enlarges the viable footprint to 13–17%. When additional operational constraints are considered—such as poor accessibility or a high local grazing intensity—ecosystem service gains are reduced by 40% to 60% compared to scenarios without such limitations. The implication is clear: restoration targets and carbon-offset baselines for Tibet must be set with these compounding constraints in mind, otherwise projected benefits will be overstated by an order of magnitude. Previous studies also suggest that the most successful reforestation projects often consider multiple constraints simultaneously [19,62,63].
In our study, we considered three types of carbon price levels—US$10, US$50, and US$100 t−1 CO2, based on previous high-impact studies (e.g., [7,19,53]). The sharp increase in the cost-effective restoration area from ~4% under US$10 to 13–17% under US$50 aligns with previous evidence suggesting that forest- and land-based solutions become competitive only once carbon prices exceed the US$50 threshold [7]. Mechanistically, this reflects the point at which the projected carbon revenues begin to offset the opportunity costs associated with cropland conversion and pastoral land compensation. However, this three-tiered pricing scheme is a simplification of real-world carbon market dynamics. It does not fully reflect the following: (1) price volatility driven by energy markets, regulatory changes, and macroeconomic shocks; (2) regional heterogeneity in carbon pricing mechanisms, including compliance markets and voluntary offsets; and (3) interactions with other incentives such as ecological compensation or land tenure reforms [7,64,65].
Border counties have already hosted large-scale ecological restoration and conservation projects for nearly four decades [56,57], so the remaining scope for additional vegetation cover is inherently small [33,66]. This pattern is particularly evident along the southeastern border of Tibet (Shannan and Nyingchi). These findings highlight the dual necessity of reinforcing ecological restoration in vulnerable areas while also maintaining the restoration gains already achieved over broader regions. A clear carbon–water trade-off induced by ecosystem restoration also emerges, which is consistent with previous findings [67,68,69]. One critical mechanistic explanation lies in the role of leaf area [67,68,69]. Vegetation restoration directly increases leaf area, which enhances the ecosystem’s photosynthetic capacity and thus promotes carbon uptake. However, an increase in leaf area also leads to higher canopy evapotranspiration and reduces the amount of precipitation reaching the ground as rainfall or infiltrated soil water. This, in turn, can result in a decline in water yield. Careful species selection and mixed planting designs will therefore be necessary to balance carbon gains with regional water security (see Section 4.3 for details).

4.3. Policy Implications for Restoration and Rural Development

The central border corridor—Langkazi, Zhongba, and Saga—offers the best return on restoration inputs, where moderate slopes and rainfall coincide with road access and relatively low opportunity costs. These counties satisfy cost–benefit and operationality criteria simultaneously, so each restoration investment spent here is more likely to deliver higher gains in carbon storage, soil retention, and habitat quality than in other border areas. Carbon pricing is a key policy lever for unlocking the full potential of ecological restoration. Policy makers should set a carbon price of roughly US$50 t−1 CO2, a level that nearly triples the area where restoration is financially viable compared with today’s price (US$10 t−1). A more spatially differentiated carbon pricing scheme may also be warranted to better balance local opportunity costs and the operational expenses of restoration. However, prices much above US$50 provide marginal benefits while increasing program costs.
The livelihoods of border residents often depend heavily on crops and pastoral production. Under low carbon pricing, the income from carbon sequestration is insufficient to compensate for the losses incurred by abandoning these traditional practices. To address the economic trade-offs faced by border communities, complementary policy tools should be developed [56,57]. One prominent example is the “ecological ranger” (eco-guard) employment model widely adopted in the Sanjiangyuan National Nature Reserve. Under this approach, local pastoralists are employed to monitor grassland and illegal grazing and maintain restoration infrastructure [57,70]. These programs offer stable income opportunities and promote local participation [57,70]. In parallel, several types of “restoration-compatible infrastructure,” such as low-impact housing, solar power, and trail systems, were developed, and have shown positive outcomes for both ecosystem conservation and poverty alleviation [71]. While promising, these programs also highlight the need for long-term institutional support, and adaptive governance. An encouraging signal is that infrastructure development driven by border-strengthening policies exerts relatively minor constraints on restoration potential and ecosystem service outcomes. This suggests that infrastructure projects aimed at improving rural livelihoods can be compatible with ecological restoration goals.
Addressing the potential carbon–water trade-off is an important consideration in the planning of ecological restoration programs. Grass–shrub mixed planting systems, combining native alpine meadow grasses with drought-tolerant shrubs such as Salix spp. and Hippophae rhamnoides were recommended to retain the most carbon gains while curbing evapotranspiration [20,72,73]. This strategy leverages a lower LAI, low-transpiration grasses, and deep-rooted shrubs with carbon sequestration potential and moderate water use [16,74]. Mixed stands of Salix cheilophila and Caragana liouana have demonstrated enhanced ecological stability and soil-protective functions in alpine sandy regions of the Gonghe Basin [75,76,77]. Hippophae rhamnoides plantations further support deeper soil carbon storage and improved soil structure without excessively depleting surface water pools, while Salix shrubs effectively access subsurface water with manageable evapotranspiration rates [78,79]. Thus, in arid, high-elevation zones, these mixed systems can minimize water consumption while maintaining moderate carbon gains. In contrast, in mid- to low-altitude regions with more favorable hydrological regimes, a higher proportion of tree species may be incorporated to enhance carbon sequestration, as water availability permits acceptable water yield levels [80].

4.4. Limitations and Future Work

All datasets used in this study are publicly available, spatially explicit, and have been independently validated in previous peer-reviewed studies (e.g., [81,82]). Due to frequent cloud cover interference, sparse ground calibration sites, and limited hydrometeorological station density, remote sensing and meteorological data over the Tibetan Plateau are subject to considerable uncertainty [81,82]. We harmonized all inputs to a common spatial resolution (i.e., 500 m) and ensured temporal alignment. However, we acknowledge that inherent differences in classification methods, spatial resolution, and remote sensing artifacts (e.g., cloud contamination, mixed pixels) may introduce uncertainties [83,84]. These potential limitations were considered when interpreting our results.
Our estimates are intentionally conservative: we evaluated restoration benefits only within the 4–17% of borderland area that remains feasible after applying all biophysical, economic, and operational constraints. A counterfactual scenario, i.e., extensive, high-density planting across all technically suitable land, would almost certainly deliver larger ecosystem-service gains, but at the expense of much higher costs and a heightened risk of water loss. In addition, we did not model indirect feedback such as increased livestock numbers driven by border-strengthening policies and rising food demand. Higher grazing pressure could erode vegetation gains and further decrease the net benefits of restoration. Carbon revenues from ecological restoration may serve as a key income source for local communities, thereby diminishing the economic incentive for expanding grazing intensity. Beyond biophysical, economic, and operational constraints on restoration outcomes, future research should also consider additional factors—such as vegetation restoration technologies and the risk of ecological degradation associated with livelihood transitions.

5. Conclusions

In Tibet’s borderlands, ecosystem services per unit area surpass interior averages by nearly two- to four-fold, yet translating this advantage into additional restoration gains is challenging. Real-world constraints, including carbon-price economics, and operational practicality, sharply reduce restoration feasibility far below what biophysical suitability alone would suggest. While 17% of the area is deemed suitable for restoration based solely on biophysical constraints, the integration of economic and operational limitations significantly reduces the cost-effective restoration potential. Under different constraint scenarios, ecological restoration is projected to increase habitat quality by 0.16–4.11%, carbon sequestration by 0.03–2.35%, and soil retention by 0.02–0.86%. However, both afforestation and grassland restoration also lead to increased evapotranspiration, resulting in a decline in water yield. Carbon price remains a key enabler of restoration potential, but once it rises above roughly US$50 t−1 CO2, further increases add only marginal benefits. Encouragingly, planned infrastructure growth exerts only limited pressure on restoration effectiveness. These results underscore the dual reality of opportunity and constraint in the Tibet border’s restoration, and position carbon pricing as the central mechanism for unlocking its scalable implementation. To support effective action, we recommend three policy directions: prioritize high-return counties such as Langkazi, Zhongba, and Saga; adopt a carbon price around US$50 t−1 CO2 to enhance economic feasibility; and employ complementary measures as required for scalable implementation, including land tenure reform, public education, and infrastructure-compatible restoration frameworks. While this study focuses on biophysical, economic, and operational constraints, future research should also examine additional limiting factors—such as the feasibility of restoration technologies and the ecological risks associated with livelihood transitions.

Supplementary Materials

The following supporting information can be downloaded at https://www.mdpi.com/article/10.3390/land14081601/s1, Figure S1: Change of carbon sequestration caused by ecological restoration under biophysical and social constraints in border regions of Tibet at the county scale; Figure S2: Change of soil conservation caused by ecological restoration under biophysical and social constraints in border regions of Tibet at the county scale; Figure S3: Change of water yield caused by ecological restoration under biophysical and social constraints in border regions of Tibet at the county scale; Figure S4: Change of habitat quality caused by ecological restoration under biophysical and social constraints in border regions of Tibet at the county scale.

Author Contributions

Conceptualization, X.Z. and T.H.; methodology, L.J. and T.H.; formal analysis, L.J., X.Z. and T.H.; investigation, S.L. and X.Z.; data curation, X.Z.; writing—original draft preparation, L.J., X.Z. and T.H.; writing—review and editing, L.J., S.L., X.Z. and T.H.; supervision, X.Z.; project administration, X.Z. and L.J.; funding acquisition, X.Z. and L.J. All authors have read and agreed to the published version of the manuscript.

Funding

This research was funded by the Science and Technology Projects of Xizang Autonomous Region, China (XZ202303ZY0003G, XZ202401ZY0089, and XZ202501ZY0034).

Data Availability Statement

The data presented in this study are available on request from the corresponding author.

Acknowledgments

During the preparation of this manuscript, the authors used ChatGPT-4o for the purposes of language refinement. The authors have reviewed and edited the output and take full responsibility for the content of this publication.

Conflicts of Interest

The authors declare no conflicts of interest.

References

  1. Ouyang, Z.; Zheng, H.; Xiao, Y.; Polasky, S.; Liu, J.; Xu, W.; Wang, Q.; Zhang, L.; Xiao, Y.; Rao, E.M.; et al. Improvements in ecosystem services from investments in natural capital. Science 2016, 352, 1455–1459. [Google Scholar] [CrossRef] [PubMed]
  2. Costanza, R.; dArge, R.; deGroot, R.; Farber, S.; Grasso, M.; Hannon, B.; Limburg, K.; Naeem, S.; ONeill, R.V.; Paruelo, J.; et al. The value of the world’s ecosystem services and natural capital. Nature 1997, 387, 253–260. [Google Scholar] [CrossRef]
  3. Millennium Ecosystem Assessment. Ecosystems and Human Well-Being: Synthesis; Island Press: Washington, DC, USA, 2005. [Google Scholar]
  4. Gourevitch, J.D.; Alonso-Rodríguez, A.M.; Aristizábal, N.; de Wit, L.A.; Kinnebrew, E.; Littlefield, C.E.; Moore, M.; Nicholson, C.C.; Schwartz, A.J.; Ricketts, T.H. Projected losses of ecosystem services in the US disproportionately affect non-white and lower-income populations. Nat. Commun. 2021, 12, 3511. [Google Scholar] [CrossRef] [PubMed]
  5. Kong, L.Q.; Wu, T.; Xiao, Y.; Xu, W.H.; Zhang, X.B.; Daily, G.C.; Ouyang, Z.Y. Natural capital investments in China undermined by reclamation for cropland. Nat. Ecol. Evol. 2023, 7, 1771–1777. [Google Scholar] [CrossRef]
  6. Zeng, J.; Cui, X.Y.; Chen, W.X.; Yao, X.W. Impact of urban expansion on the supply-demand balance of ecosystem services: An analysis of prefecture-level cities in China. Environ. Impact Assess. Rev. 2023, 99, 107003. [Google Scholar] [CrossRef]
  7. Griscom, B.W.; Adams, J.; Ellis, P.W.; Houghton, R.A.; Lomax, G.; Miteva, D.A.; Schlesinger, W.H.; Shoch, D.; Siikamäki, J.V.; Smith, P.; et al. Natural climate solutions. Proc. Natl. Acad. Sci. USA 2017, 114, 11645–11650. [Google Scholar] [CrossRef]
  8. Maes, J.; Jacobs, S. Nature-Based Solutions for Europe’s Sustainable Development. Conserv. Lett. 2017, 10, 121–124. [Google Scholar] [CrossRef]
  9. Ellis, P.W.; Page, A.M.; Wood, S.; Fargione, J.; Masuda, Y.J.; Denney, V.C.; Moore, C.; Kroeger, T.; Griscom, B.; Sanderman, J.; et al. The principles of natural climate solutions. Nat. Commun. 2024, 15, 547. [Google Scholar] [CrossRef]
  10. United Nations Environment Programme (UNEP). UN Decade on Ecosystem Restoration. Available online: https://www.unep.org/explore-topics/ecosystems-and-biodiversity/what-we-do/decade-ecosystem-restoration (accessed on 7 June 2025).
  11. Wang, X.M.; Ge, Q.S.; Geng, X.; Wang, Z.S.; Gao, L.; Bryan, B.A.; Chen, S.Q.; Su, Y.A.; Cai, D.W.; Ye, J.S.; et al. Unintended consequences of combating desertification in China. Nat. Commun. 2023, 14, 1139. [Google Scholar] [CrossRef]
  12. Hou, M.Y.; Zhong, S.B.; Xi, Z.L.; Yao, S.B. Does large-scale ecological restoration threaten food security in China? A moderated mediation model. Ecol. Indic. 2022, 143, 109372. [Google Scholar] [CrossRef]
  13. Goldstein, J.H.; Caldarone, G.; Duarte, T.K.; Ennaanay, D.; Hannahs, N.; Mendoza, G.; Polasky, S.; Wolny, S.; Daily, G.C. Integrating ecosystem-service tradeoffs into land-use decisions. Proc. Natl. Acad. Sci. USA 2012, 109, 7565–7570. [Google Scholar] [CrossRef]
  14. Zheng, H.; Robinson, B.E.; Liang, Y.C.; Polasky, S.; Ma, D.C.; Wang, F.C.; Ruckelshaus, M.; Ouyang, Z.Y.; Daily, G.C. Benefits, costs, and livelihood implications of a regional payment for ecosystem service program. Proc. Natl. Acad. Sci. USA 2013, 110, 16681–16686. [Google Scholar] [CrossRef] [PubMed]
  15. Zheng, H.; Wang, L.J.; Peng, W.J.; Zhang, C.P.; Li, C.; Robinson, B.E.; Wu, X.C.; Kong, L.Q.; Li, R.N.; Xiao, Y.; et al. Realizing the values of natural capital for inclusive, sustainable development: Informing China’s new ecological development strategy. Proc. Natl. Acad. Sci. USA 2019, 116, 8623–8628. [Google Scholar] [CrossRef]
  16. Arkema, K.K.; Verutes, G.M.; Wood, S.A.; Clarke-Samuels, C.; Rosado, S.; Canto, M.; Rosenthal, A.; Ruckelshaus, M.; Guannel, G.; Toft, J.; et al. Embedding ecosystem services in coastal planning leads to better outcomes for people and nature. Proc. Natl. Acad. Sci. USA 2015, 112, 7390–7395. [Google Scholar] [CrossRef] [PubMed]
  17. Lu, N.; Tian, H.Q.; Fu, B.J.; Yu, H.Q.; Piao, S.L.; Chen, S.Y.; Li, Y.; Li, X.Y.; Wang, M.Y.; Li, Z.D.; et al. Biophysical and economic constraints on China’s natural climate solutions. Nat. Clim. Chang. 2022, 12, 847–853. [Google Scholar] [CrossRef]
  18. Sarira, T.V.; Zeng, Y.W.; Neugarten, R.; Chaplin-Kramer, R.; Koh, L.P. Co-benefits of forest carbon projects in Southeast Asia. Nat. Sustain. 2022, 5, 393–396. [Google Scholar] [CrossRef]
  19. Zeng, Y.W.; Sarira, T.V.; Carrasco, L.R.; Chong, K.Y.; Friess, D.A.; Lee, J.S.H.; Taillardat, P.; Worthington, T.A.; Zhang, Y.C.; Koh, L.P. Economic and social constraints on reforestation for climate mitigation in Southeast Asia. Nat. Clim. Chang. 2020, 10, 842–844. [Google Scholar] [CrossRef]
  20. Yu, Y.; Hua, T.; Chen, L.D.; Zhang, Z.Q.; Pereira, P. Divergent Changes in Vegetation Greenness, Productivity, and Rainfall Use Efficiency Are Characteristic of Ecological Restoration Towards High-Quality Development in the Yellow River Basin, China. Engineering 2024, 34, 109–119. [Google Scholar] [CrossRef]
  21. Konings, A.G.; Saatchi, S.S.; Frankenberg, C.; Keller, M.; Leshyk, V.; Anderegg, W.R.L.; Humphrey, V.; Matheny, A.M.; Trugman, A.; Sack, L.; et al. Detecting forest response to droughts with global observations of vegetation water content. Glob. Change Biol. 2021, 27, 6005–6024. [Google Scholar] [CrossRef]
  22. Cook-Patton, S.C.; Leavitt, S.M.; Gibbs, D.; Harris, N.L.; Lister, K.; Anderson-Teixeira, K.J.; Briggs, R.D.; Chazdon, R.L.; Crowther, T.W.; Ellis, P.W.; et al. Mapping carbon accumulation potential from global natural forest regrowth. Nature 2020, 585, 545–550. [Google Scholar] [CrossRef] [PubMed]
  23. Brooks, T.M.; Mittermeier, R.A.; da Fonseca, G.A.B.; Gerlach, J.; Hoffmann, M.; Lamoreux, J.F.; Mittermeier, C.G.; Pilgrim, J.D.; Rodrigues, A.S.L. Global biodiversity conservation priorities. Science 2006, 313, 58–61. [Google Scholar] [CrossRef]
  24. Feng, X.M.; Fu, B.J.; Piao, S.; Wang, S.H.; Ciais, P.; Zeng, Z.Z.; Lü, Y.H.; Zeng, Y.; Li, Y.; Jiang, X.H.; et al. Revegetation in China’s Loess Plateau is approaching sustainable water resource limits. Nat. Clim. Chang. 2016, 6, 1019–1022. [Google Scholar] [CrossRef]
  25. Li, C.J.; Fu, B.J.; Wang, S.; Stringer, L.C.; Wang, Y.P.; Li, Z.D.; Liu, Y.X.; Zhou, W.X. Drivers and impacts of changes in China’s drylands. Nat. Rev. Earth Environ. 2021, 2, 858–873. [Google Scholar] [CrossRef]
  26. Wuepper, D.; Borrelli, P.; Finger, R. Countries and the global rate of soil erosion. Nat. Sustain. 2020, 3, 51–55. [Google Scholar] [CrossRef]
  27. Yue, Z.L.; Xiao, C.W.; Feng, Z.M.; Wang, Y.; Yan, H.M. Accelerating decline of habitat quality in Chinese border areas. Resour. Conserv. Recycl. 2024, 206, 107665. [Google Scholar] [CrossRef]
  28. Bryan, B.A.; Gao, L.; Ye, Y.Q.; Sun, X.F.; Connor, J.D.; Crossman, N.D.; Stafford-Smith, M.; Wu, J.G.; He, C.Y.; Yu, D.Y.; et al. China’s response to a national land-system sustainability emergency. Nature 2018, 559, 193–204. [Google Scholar] [CrossRef] [PubMed]
  29. Li, X.Y.; Long, D.; Scanlon, B.R.; Mann, M.E.; Li, X.D.; Tian, F.Q.; Sun, Z.L.; Wang, G.Q. Climate change threatens terrestrial water storage over the Tibetan Plateau. Nat. Clim. Chang. 2022, 12, 801–807. [Google Scholar] [CrossRef]
  30. Yao, T.D.; Bolch, T.; Chen, D.L.; Gao, J.; Immerzeel, W.; Piao, S.; Su, F.G.; Thompson, L.; Wada, Y.; Wang, L.; et al. The imbalance of the Asian water tower. Nat. Rev. Earth Environ. 2022, 3, 618–632. [Google Scholar] [CrossRef]
  31. Yang, J.H.; Kang, S.C.; Chen, D.L.; Zhao, L.; Ji, Z.M.; Duan, K.Q.; Deng, H.J.; Tripathee, L.; Du, W.T.; Rai, M.; et al. South Asian black carbon is threatening the water sustainability of the Asian Water Tower. Nat. Commun. 2022, 13, 7360. [Google Scholar] [CrossRef]
  32. Hansen, M.C.; Potapov, P.V.; Moore, R.; Hancher, M.; Turubanova, S.A.; Tyukavina, A.; Thau, D.; Stehman, S.V.; Goetz, S.J.; Loveland, T.R.; et al. High-Resolution Global Maps of 21st-Century Forest Cover Change. Science 2013, 342, 850–853. [Google Scholar] [CrossRef]
  33. Hua, T.; Zhao, W.W.; Cherubini, F.; Hu, X.P.; Pereira, P. Continuous growth of human footprint risks compromising the benefits of protected areas on the Qinghai-Tibet Plateau. Glob. Ecol. Conserv. 2022, 34, e02053. [Google Scholar] [CrossRef]
  34. Sun, Y.X.; Liu, S.L.; Liu, Y.X.; Dong, Y.H.; Li, M.Q.; An, Y.; Shi, F.N. Grazing intensity and human activity intensity data sets on the Qinghai-Tibetan Plateau during 1990–2015. Geosci. Data J. 2022, 9, 140–153. [Google Scholar] [CrossRef]
  35. Grogan, D.; Frolking, S.; Wisser, D.; Prusevich, A.; Glidden, S. Global gridded crop harvested area, production, yield, and monthly physical area data circa 2015. Sci. Data 2022, 9, 15. [Google Scholar] [CrossRef]
  36. Funk, C.; Peterson, P.; Landsfeld, M.; Pedreros, D.; Verdin, J.; Shukla, S.; Husak, G.; Rowland, J.; Harrison, L.; Hoell, A.; et al. The climate hazards infrared precipitation with stations-a new environmental record for monitoring extremes. Sci. Data 2015, 2, 150066. [Google Scholar] [CrossRef]
  37. Renard, K.G.; Foster, G.R.; Weesies, G.A.; McCool, D.K.; Yoder, D.C. Predicting Soil Erosion by Water: A Guide to Conservation Planning with the Revised Universal Soil Loss Equation (Rusle); U.S. Department of Agriculture: Washington, DC, USA, 1997; Volume 703.
  38. Sharpley, A.N.; Williams, J.R. EPIC—Erosion/Productivity Impact Calculator: 1. Model Documentation; Technical Bulletin; U.S. Department of Agriculture: Washington, DC, USA, 1990; Volume 1768.
  39. Moore, I.D.; Burch, G.J. Physical Basis of the Length-Slope Factor in the Universal Soil Loss Equation. Soil. Sci. Soc. Am. J. 1986, 50, 1294–1298. [Google Scholar] [CrossRef]
  40. Liu, B.Y.; Nearing, M.A.; Shi, P.J.; Jia, Z.W. Slope length effects on soil loss for steep slopes. Soil. Sci. Soc. Am. J. 2000, 64, 1759–1763. [Google Scholar] [CrossRef]
  41. Yu, X.; Xie, G.; An, K. The function and economic value of soil conservation of ecosystems in Qinghai-Tibet Plateau. Acta Ecol. Sin. 2003, 23, 2367–2378. [Google Scholar]
  42. Potter, C.S.; Randerson, J.T.; Field, C.B.; Matson, P.A.; Vitousek, P.M.; Mooney, H.A.; Klooster, S.A. Terrestrial Ecosystem Production—A Process Model-Based on Global Satellite and Surface Data. Glob. Biogeochem. Cycles 1993, 7, 811–841. [Google Scholar] [CrossRef]
  43. Zhang, L.; Hickel, K.; Dawes, W.R.; Chiew, F.H.S.; Western, A.W.; Briggs, P.R. A rational function approach for estimating mean annual evapotranspiration. Water Resour. Res. 2004, 40, W02502. [Google Scholar] [CrossRef]
  44. Ma, R.M.; Lü, Y.H.; Fu, B.J.; Lü, D.; Wu, X.; Sun, S.Q.; Zhang, Y.L. A modified habitat quality model to incorporate the effects of ecological restoration. Environ. Res. Lett. 2022, 17, 104029. [Google Scholar] [CrossRef]
  45. Sharp, R.T.; Tallis, H.T.; Ricketts, T.; Guerry, A.D.; Wood, S.A.; Chaplin-Kramer, R.; Daily, G.C. Invest 3.10.2 User’s Guide. 2020. Available online: https://storage.googleapis.com/releases.naturalcapitalproject.org/invest-userguide/latest/en/index.html (accessed on 9 January 2024).
  46. Xu, W.H.; Xiao, Y.; Zhang, J.J.; Yang, W.; Zhang, L.; Hull, V.; Wang, Z.; Zheng, H.; Liu, J.G.; Polasky, S.; et al. Strengthening protected areas for biodiversity and ecosystem services in China. Proc. Natl. Acad. Sci. USA 2017, 114, 1601–1606. [Google Scholar] [CrossRef]
  47. Hou, Y.Z.; Zhao, W.W.; Liu, Y.X.; Yang, S.Q.; Hu, X.P.; Cherubini, F. Relationships of multiple landscape services and their influencing factors on the Qinghai-Tibet Plateau. Landsc. Ecol. 2021, 36, 1987–2005. [Google Scholar] [CrossRef]
  48. Fan, F.F.; Liu, Y.X.; Chen, J.X.; Dong, J.Q. Scenario-based ecological security patterns to indicate landscape sustainability: A case study on the Qinghai-Tibet Plateau. Landsc. Ecol. 2021, 36, 2175–2188. [Google Scholar] [CrossRef]
  49. Hua, T.; Zhao, W.W.; Cherubini, F.; Hu, X.P.; Pereira, P. Sensitivity and future exposure of ecosystem services to climate change on the Tibetan Plateau of China. Landsc. Ecol. 2021, 36, 3451–3471. [Google Scholar] [CrossRef]
  50. Wang, J.F.; Zhang, T.L.; Fu, B.J. A measure of spatial stratified heterogeneity. Ecol. Indic. 2016, 67, 250–256. [Google Scholar] [CrossRef]
  51. Sun, J.; Liu, M.; Fu, B.J.; Kemp, D.; Zhao, W.W.; Liu, G.H.; Han, G.D.; Wilkes, A.; Lu, X.Y.; Chen, Y.C.; et al. Reconsidering the efficiency of grazing exclusion using fences on the Tibetan Plateau. Sci. Bull. 2020, 65, 1405–1414. [Google Scholar] [CrossRef]
  52. Hua, T.; Zhao, W.W.; Cherubini, F.; Hu, X.P.; Pereira, P. Effectiveness of protected areas edges on vegetation greenness, cover and productivity on the Tibetan Plateau, China. Landsc. Urban. Plan. 2022, 224, 104421. [Google Scholar] [CrossRef]
  53. Fargione, J.E.; Bassett, S.; Boucher, T.; Bridgham, S.D.; Conant, R.T.; Cook-Patton, S.C.; Ellis, P.W.; Falcucci, A.; Fourqurean, J.W.; Gopalakrishna, T.; et al. Natural climate solutions for the United States. Sci. Adv. 2018, 4, eaat1869. [Google Scholar] [CrossRef]
  54. Li, Y.F.; Luo, Y.Z.; Zheng, H.; Yang, S.S.; Ouyang, Z.Y.; Luo, Y.C. Standard of payments for ecosystem services in Sanjiangyuan Natural Reserve. Acta Ecol. Sin. 2013, 33, 0764–0770. [Google Scholar] [CrossRef]
  55. Zhang, T.Y.; Cheng, C.X.; Wu, X.D. Mapping the spatial heterogeneity of global land use and land cover from 2020 to 2100 at a 1 km resolution. Sci. Data 2023, 10, 748. [Google Scholar] [CrossRef]
  56. Zhao, H.; Wei, D.; Wang, X.D.; Hong, J.T.; Wu, J.B.; Xiong, D.H.; Liang, Y.L.; Yuan, Z.R.; Qi, Y.H.; Huang, L. Three decadal large-scale ecological restoration projects across the Tibetan Plateau. Land. Degrad. Dev. 2024, 35, 22–32. [Google Scholar] [CrossRef]
  57. Hua, T.; Zhao, W.; Pereira, P. Opinionated Views on Grassland Restoration Programs on the Qinghai-Tibetan Plateau. Front. Plant Sci. 2022, 13, 861200. [Google Scholar] [CrossRef] [PubMed]
  58. National Bureau of Statistics of China. China Statistical Yearbook 2023. National Bureau of Statistics. Available online: https://www.stats.gov.cn/sj/ndsj/2023/indexch.htm (accessed on 28 July 2025).
  59. Bastin, J.F.; Finegold, Y.; Garcia, C.; Mollicone, D.; Rezende, M.; Routh, D.; Zohner, C.M.; Crowther, T.W. The global tree restoration potential. Science 2020, 369, 1066. [Google Scholar] [CrossRef]
  60. Chazdon, R.; Brancalion, P. Restoring forests as a means to many ends. Science 2019, 365, 24–25. [Google Scholar] [CrossRef]
  61. Luedeling, E.; Börner, J.; Amelung, W.; Schiffers, K.; Shepherd, K.; Rosenstock, T. Forest restoration: Overlooked constraints. Science 2019, 366, 315. [Google Scholar] [CrossRef] [PubMed]
  62. Barr, C.M.; Sayer, J.A. The political economy of reforestation and forest restoration in Asia-Pacific: Critical issues for REDD+. Biol. Conserv. 2012, 154, 9–19. [Google Scholar] [CrossRef]
  63. Brancalion, P.H.S.; Niamir, A.; Broadbent, E.; Crouzeilles, R.; Barros, F.S.M.; Zambrano, A.M.A.; Baccini, A.; Aronson, J.; Goetz, S.; Reid, J.L.; et al. Global restoration opportunities in tropical rainforest landscapes. Sci. Adv. 2019, 5, eaav3223. [Google Scholar] [CrossRef]
  64. Ji, C.J.; Hu, Y.J.; Tang, B.J. Research on carbon market price mechanism and influencing factors: A literature review. Nat. Hazards 2018, 92, 761–782. [Google Scholar] [CrossRef]
  65. Yan, L.L.; Chen, X.L.; Yang, Y.; He, Y. Influencing Factors and Prediction of Carbon Trading Market Prices in China via Elliptical Factor Analysis. J. Syst. Sci. Complex. 2024, 37, 2680–2696. [Google Scholar] [CrossRef]
  66. Dai, E.R.; Zhao, Z.X.; Jia, L.Z.; Jiang, X.T. Contribution of ecosystem services improvement on achieving Sustainable development Goals under ecological engineering projects on the Qinghai-Tibet Plateau. Ecol. Eng. 2024, 199, 107146. [Google Scholar] [CrossRef]
  67. Yuan, X.; Jiao, L.; Che, X.C.; Wu, J.J.; Zhu, X.L.; Li, Q. Study on the water-carbon coupling coordination function on the eastern edge of the Qinghai-Tibet plateau. Ecol. Model. 2024, 487, 110572. [Google Scholar] [CrossRef]
  68. Lü, Y.H.; Wang, Y.; Yin, L.C.; Lü, D.; Wang, X.F. Climate and scale are critical for illustrating the links between carbon and water services across Qinghai-Tibet plateau. Catena 2023, 231, 107379. [Google Scholar] [CrossRef]
  69. Wang, Y.; Lü, Y.H.; Lü, D.; Wang, C.; Wu, X.; Yin, L.C.; Wang, X.F. Carbon and water relationships change nonlinearly along elevation gradient in the Qinghai Tibet Plateau. J. Hydrol. 2024, 628, 130529. [Google Scholar] [CrossRef]
  70. Ma, T.; Swallow, B.; Foggin, J.M.; Zhong, L.S.; Sang, W.G. Co-management for sustainable development and conservation in Sanjiangyuan National Park and the surrounding Tibetan nomadic pastoralist areas. Hum. Soc. Sci. Commun. 2023, 10, 321. [Google Scholar] [CrossRef]
  71. Ma, T.; Swallow, B.; Foggin, J.M.; Sang, W.G.; Zhong, L.S. Developing co-management for conservation and local development in China’s national parks: Findings from focus group discussions in the Sanjiangyuan Region. Front. Conserv. Sci. 2023, 4, 903788. [Google Scholar] [CrossRef]
  72. Jackson, R.B.; Jobbágy, E.G.; Avissar, R.; Roy, S.B.; Barrett, D.J.; Cook, C.W.; Farley, K.A.; le Maitre, D.C.; McCarl, B.A.; Murray, B.C. Trading water for carbon with biological sequestration. Science 2005, 310, 1944–1947. [Google Scholar] [CrossRef]
  73. Brockerhoff, E.G.; Barbaro, L.; Castagneyrol, B.; Forrester, D.I.; Gardiner, B.; González-Olabarria, J.R.; Lyver, P.O.; Meurisse, N.; Oxbrough, A.; Taki, H.; et al. Forest biodiversity, ecosystem functioning and the provision of ecosystem services. Biodivers. Conserv. 2017, 26, 3005–3035. [Google Scholar] [CrossRef]
  74. Kim, J.H.; Jobbagy, E.G.; Jackson, R.B. Trade-offs in water and carbon ecosystem services with land-use changes in grasslands. Ecol. Appl. 2016, 26, 2767. [Google Scholar] [CrossRef]
  75. Yu, Y.; Jia, Z.Q. Changes in soil organic carbon and nitrogen capacities of Salix cheilophila Schneid along a revegetation chronosequence in semi-arid degraded sandy land of the Gonghe Basin, Tibet Plateau. Solid Earth 2014, 5, 1045–1054. [Google Scholar] [CrossRef]
  76. Zhang, J.P.; Jia, Z.Q.; Li, Q.X.; He, L.X.Z.; Zhao, X.B.; Wang, L.; Han, D. Determine the Optimal Vegetation Type for Soil Wind Erosion Prevention and Control in the Alpine Sandy Land of the Gonghe Basin on the Qinghai Tibet Plateau. Forests 2023, 14, 2342. [Google Scholar] [CrossRef]
  77. Zhu, Y.J.; Wang, G.J. Rainwater Use Process of in Semi-Arid Zone, Tibetan Plateau. Front. Earth Sci. 2020, 8, 231. [Google Scholar] [CrossRef]
  78. Zhang, H.W.; Tian, L.H.; Hasi, E.; Zhang, D.S.; Wu, W.Y. Vegetation-soil dynamics in an alpine desert ecosystem of the Qinghai Lake watershed, northeastern Qinghai-Tibet Plateau. Front. Env. Sci. 2023, 11, 1119605. [Google Scholar] [CrossRef]
  79. Tian, L.H.; Wu, W.Y.; Zhou, X.; Zhang, D.S.; Yu, Y.; Wang, H.J.; Wang, Q.Y. The Ecosystem Effects of Sand-Binding Shrub in Alpine Semi-Arid Desert in the Northeastern Qinghai-Tibet Plateau. Land 2019, 8, 183. [Google Scholar] [CrossRef]
  80. Hua, F.Y.; Bruijnzeel, L.A.; Meli, P.; Martin, P.A.; Zhang, J.; Nakagawa, S.; Miao, X.R.; Wang, W.Y.; McEvoy, C.; Peña-Arancibia, J.L.; et al. The biodiversity and ecosystem service contributions and trade-offs of forest restoration approaches. Science 2022, 376, 839–844. [Google Scholar] [CrossRef]
  81. Feng, Y.Q.; Qi, Y.C.; Chen, D.L.; Li, D.H.; Li, Z.; Xu, X.F. Multi-scale analysis of satellite, reanalysis and muti-source precipitation estimates over the Tibetan Plateau. Atmos. Res. 2024, 309, 107484. [Google Scholar] [CrossRef]
  82. Li, N.; Zhan, P.; Pan, Y.Z.; Zhu, X.F.; Li, M.Y.; Zhang, D.J. Comparison of Remote Sensing Time-Series Smoothing Methods for Grassland Spring Phenology Extraction on the Qinghai-Tibetan Plateau. Remote Sens. 2020, 12, 3383. [Google Scholar] [CrossRef]
  83. Hua, T.; Zhao, W.W.; Liu, Y.X.; Wang, S.; Yang, S.Q. Spatial Consistency Assessments for Global Land-Cover Datasets: A Comparison among GLC2000, CCI LC, MCD12, GLOBCOVER and GLCNMO. Remote Sens. 2018, 10, 1846. [Google Scholar] [CrossRef]
  84. Yang, Y.K.; Xiao, P.F.; Feng, X.Z.; Li, H.X. Accuracy assessment of seven global land cover datasets over China. ISPRS J. Photogramm. Remote Sens. 2017, 125, 156–173. [Google Scholar] [CrossRef]
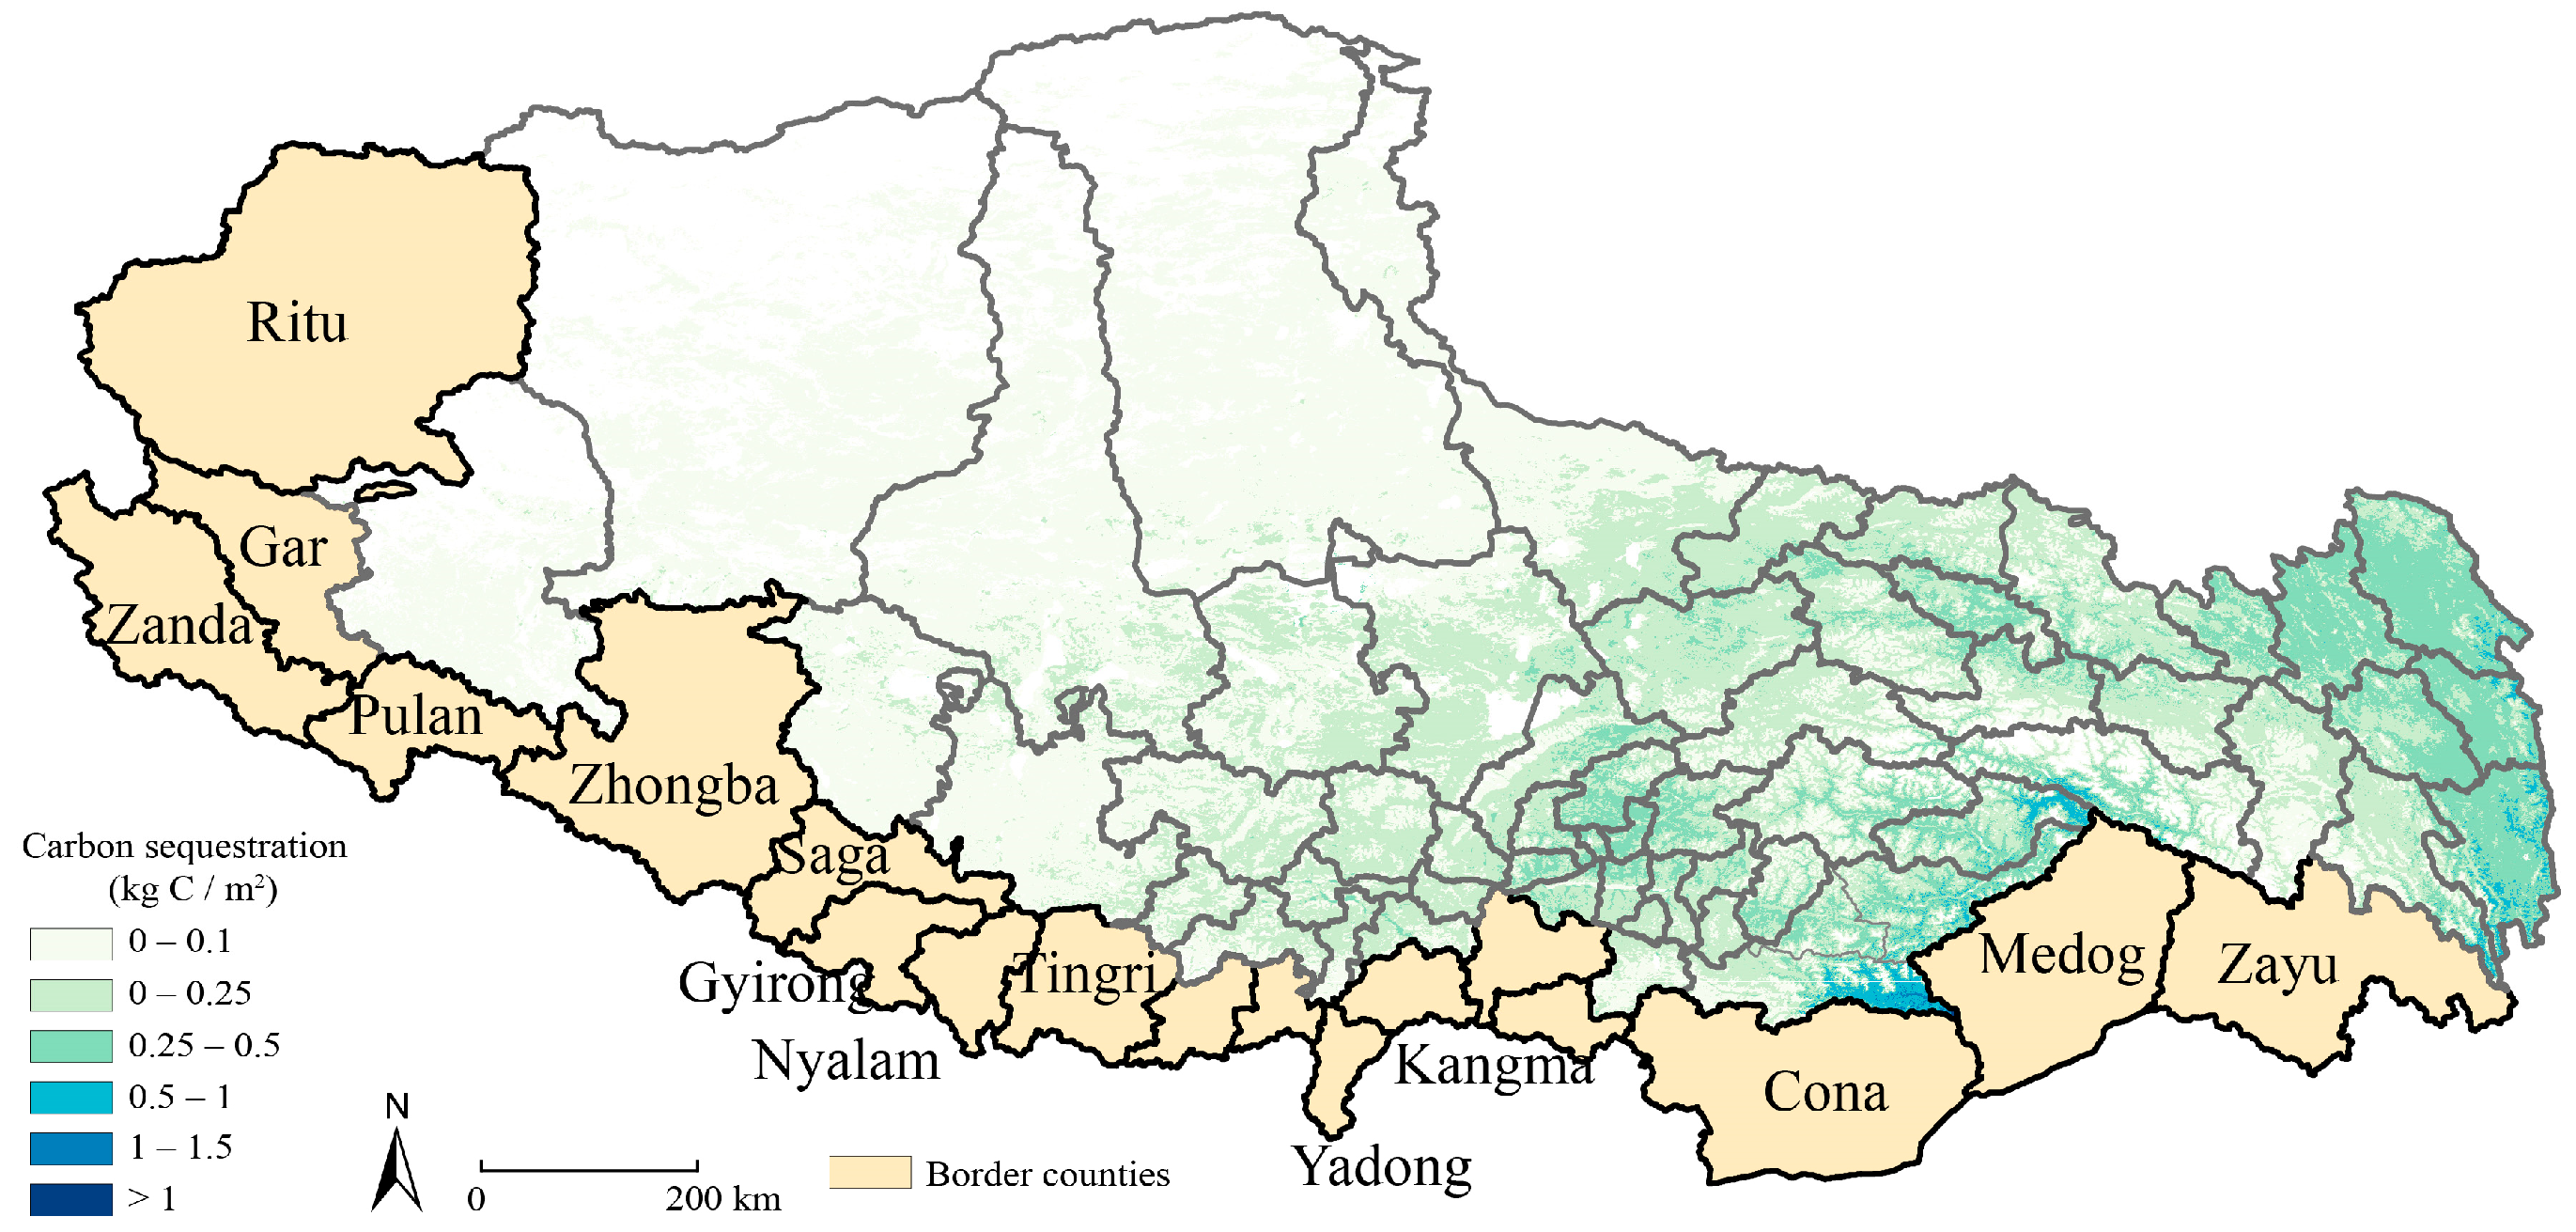
Figure 1. Study area. The border regions are marked yellow, and the basemap represents net primary productivity (NPP).
Land 14 01601 g001
Figure 2. Technical pathway of this study.
Land 14 01601 g002
Figure 3. Ecosystem services in Tibet: (a,b) carbon sequestration service, (c,d) soil retention service, (e,f) water retention service, and (g,h) habitat quality. The first column shows the ecosystem services in 2001 and the second column shows the ecosystem services in 2020. The subfigure on the bottom shows the difference of ecosystem service per unit area between border areas (yellow) and non-border areas (green) in Tibet.
Land 14 01601 g003
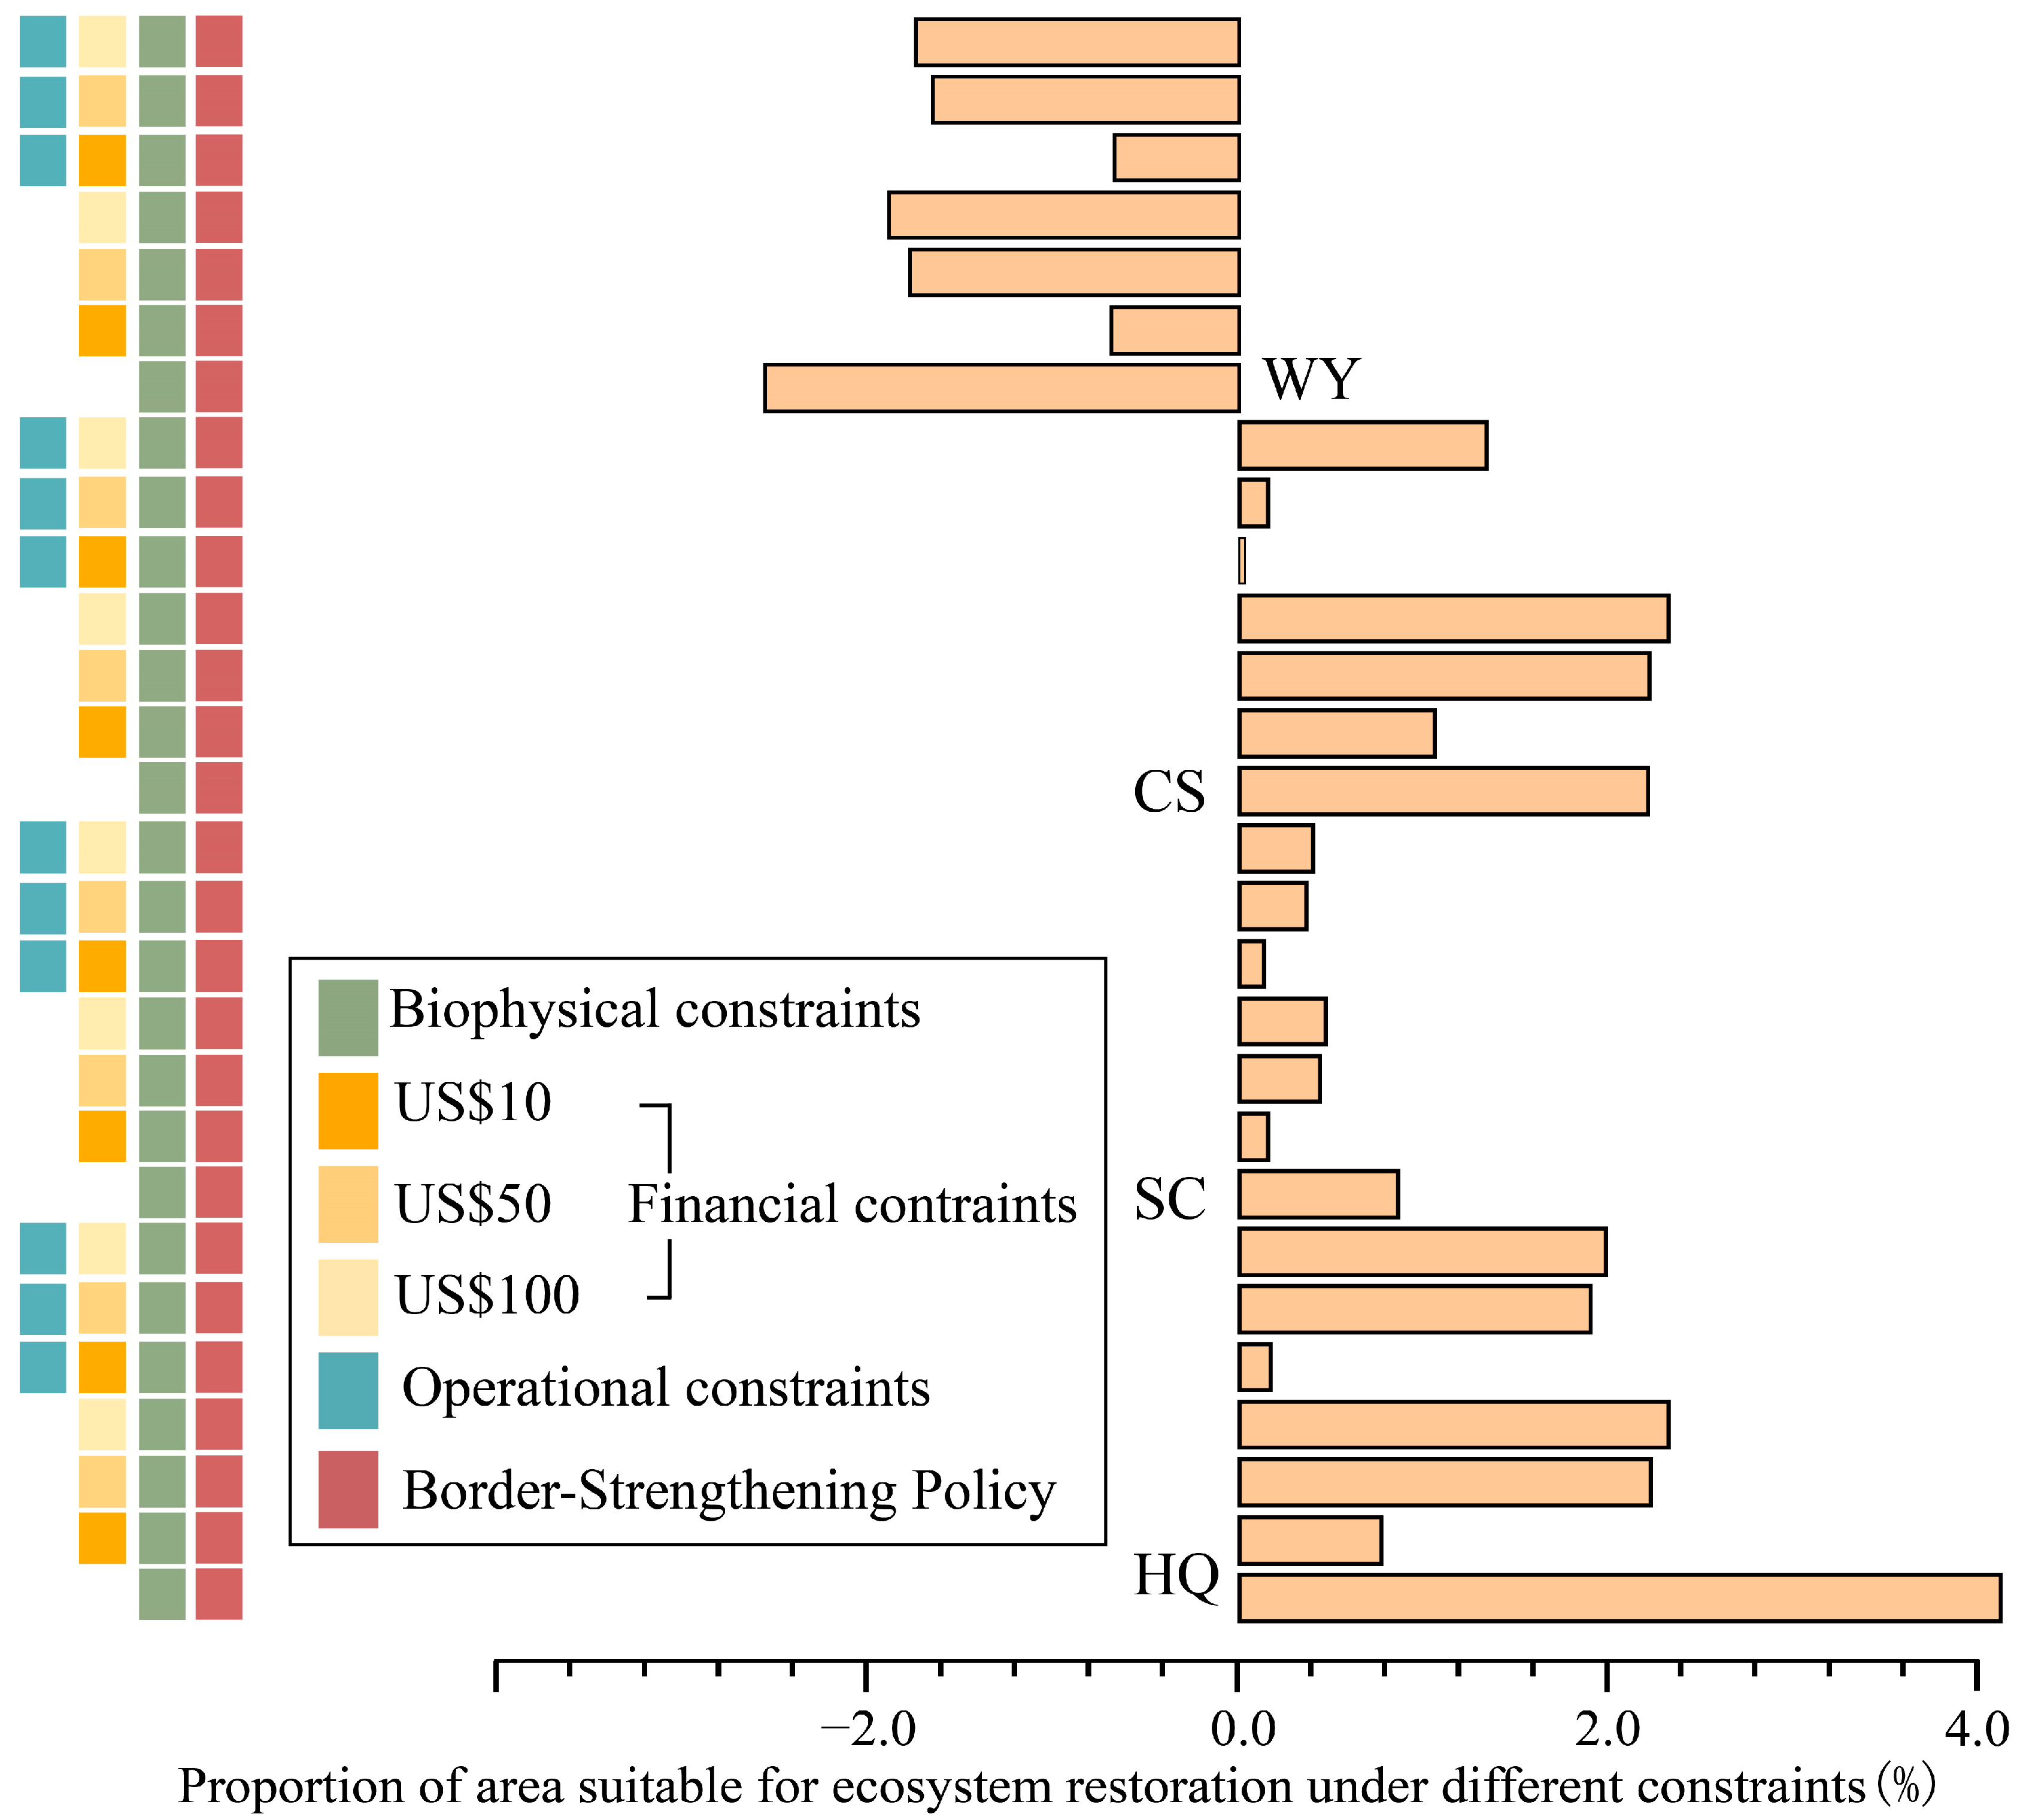
Figure 4. Ecosystem services’ trends in Tibet at the county scale. The first to fourth rows are carbon sequestration, soil conservation, water yield, and habitat quality. The first column is a significant increase, the second column is an increase, the third column is a decrease, and the fourth column is a significant decrease. The color shade is the area proportion of the trend state (%). The bottom subfigure shows the comparison between border and non-border counties. The statistical unit is the area percentage (%). CS: carbon sequestration; SC: soil conservation; WY: water yield; HQ: habitat quality. Statistical significance was determined using a threshold of p < 0.05.
Land 14 01601 g004
Figure 5. Biophysical and social constraints on ecological restoration in border regions of Tibet. (a) Biophysical constraint; (b,d,f) represent three carbon trading pricing schemes at US$10 t−1 CO2, US$50 $t−1 CO2, and 100 US$100$t−1 CO2, respectively, compared to the opportunity costs of agricultural and livestock production, illustrating the financial constraints of ecological restoration. (c,e) denote two operational constraints for ecological restoration: human activity risks and regulatory feasibility. (g) presents the simulated locations of infrastructure expansion under the context of border-strengthening policies. (i,ii) are close-up views of representative areas within subfigure (g).
Land 14 01601 g005
Figure 6. Area proportion suitable for ecological restoration under the background of strengthening development and ecological restoration in border regions of Tibet. The combination of differently colored boxes represents different combinations of ecological restoration constraints and infrastructure expansion driven by “Border Strengthening Programs”.
Land 14 01601 g006
Figure 7. Increasement of NDVI caused by ecological restoration under the background of strengthening development and ecological restoration in border regions of Tibet at the county scale. The combination of different colored boxes represents different combinations of ecological restoration constraints and urban expansion. Subfigures (ag) show the NDVI increments under different combinations of ecological restoration constraints. For example, subfigure (a) is the NDVI increments under the biophysical constraints and border-strengthening policy.
Land 14 01601 g007
Figure 8. Increasement of ecosystem services caused by ecological restoration in border regions of Tibet at the county scale. Ecological restoration considers the biophysical constraints, economic constraints, and operationality constraints. Four types of ecosystem services were considered: water yield, carbon sequestration, soil conservation, and habitat quality. The combination of differently colored boxes represents different combinations of ecological restoration constraints and urban expansion. CS: carbon sequestration; SC: soil conservation; WY: water yield; HQ: habitat quality.
Land 14 01601 g008
Table 1. Data sources and introductions.
DataTime PeriodResolutionData Sources
Land use2001–2020500 mMCD12Q1
Forest cover2000–202030 mGlobal Forest Change (GFC) dataset [32]
Human footprint20201 km[33]
Grided grazing intensity20201 km[34]
Grided population density20201 kmWorldpop
Grided crop production20205 minGAEZ [35]
DEM-90 mSRTM3
Soil-1 kmISRIS Soil Grid
Normalized difference vegetation index (NDVI)2001–2020500 mMOD13A2
Precipitation2000–20200.05°CHIRPS (Climate Hazards Group InfraRed Precipitation with Station data) [36]
Actual Evapotranspiration2001–2020500 mMOD16A3
Table 2. Explanatory power of influencing factors for ecosystem services in Tibet.
Habitat QualityCarbon SequestrationSoil ConservationWater Yield
BorderNon-BorderBorderNon-BorderBorderNon-BorderBorderNon-Border
Soil organic carbon (SOC)0.470.480.280.470.270.160.070.14
NDVI0.810.720.820.800.620.240.270.16
Population density0.040.090.080.190.050.020.080.00
Temperature0.610.370.820.500.560.260.370.02
Slope0.120.140.120.170.170.130.170.02
Precipitation0.420.360.330.430.280.110.120.14
Altitude0.570.280.870.400.630.340.490.03
Grazing intensity0.270.110.180.070.150.090.040.02
An underline signifies that the factor’s explanatory strength is not statistically significant. Statistical significance was determined using a threshold of p < 0.05.
Disclaimer/Publisher’s Note: The statements, opinions and data contained in all publications are solely those of the individual author(s) and contributor(s) and not of MDPI and/or the editor(s). MDPI and/or the editor(s) disclaim responsibility for any injury to people or property resulting from any ideas, methods, instructions or products referred to in the content.