Assessing the Land Surface Temperature Trend of Lake Drūkšiai’s Coastline
Abstract
1. Introduction
2. Materials and Methods
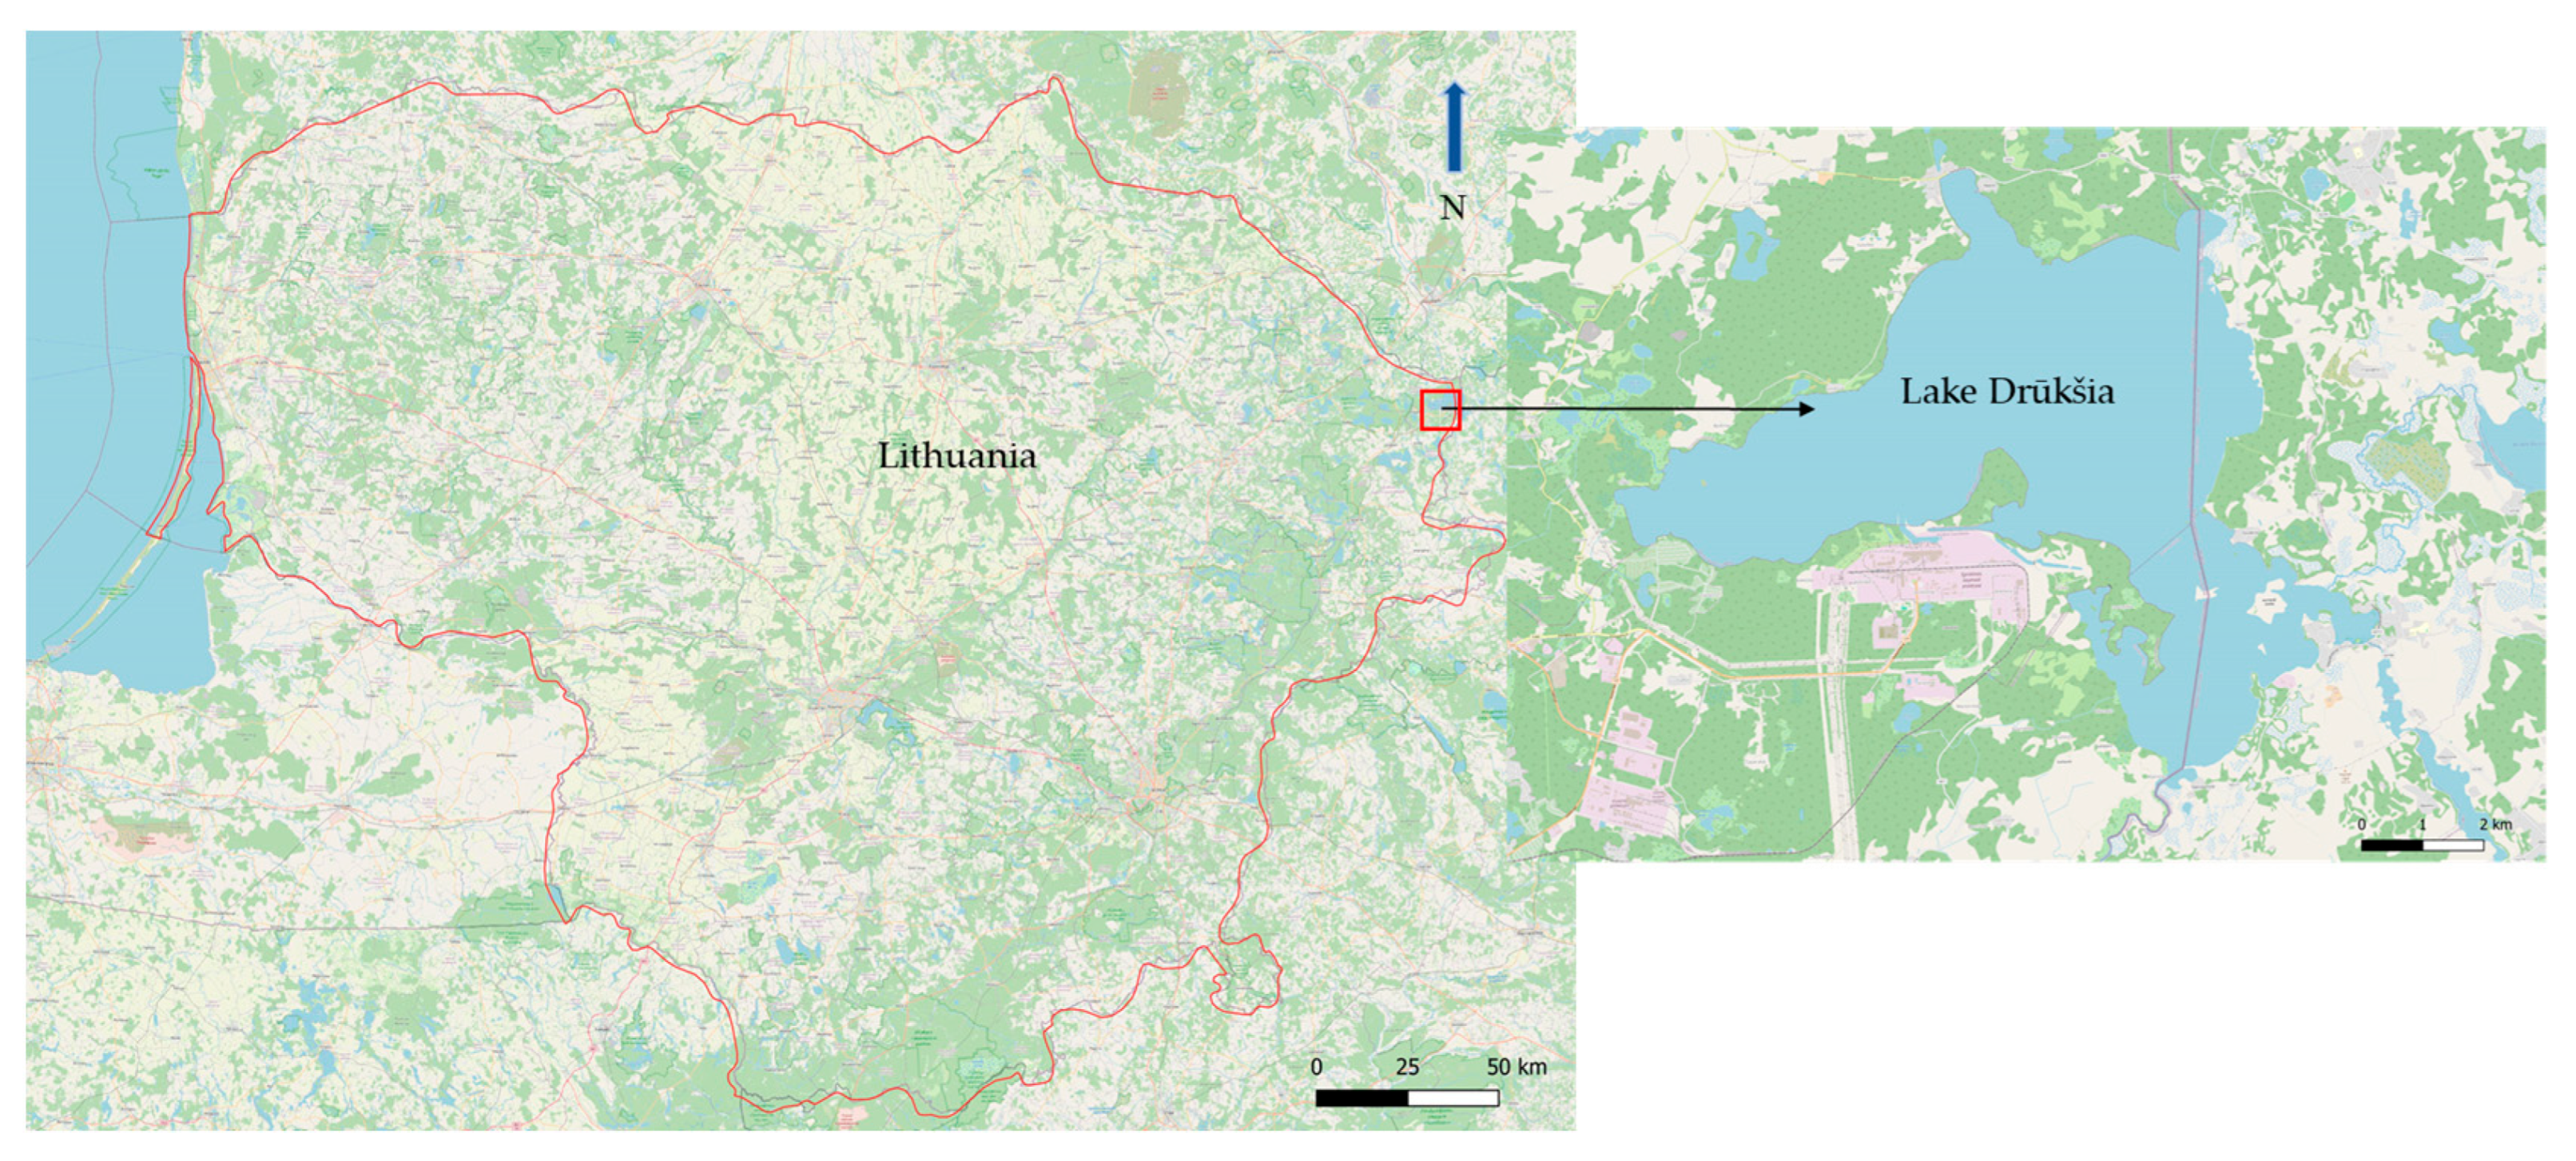
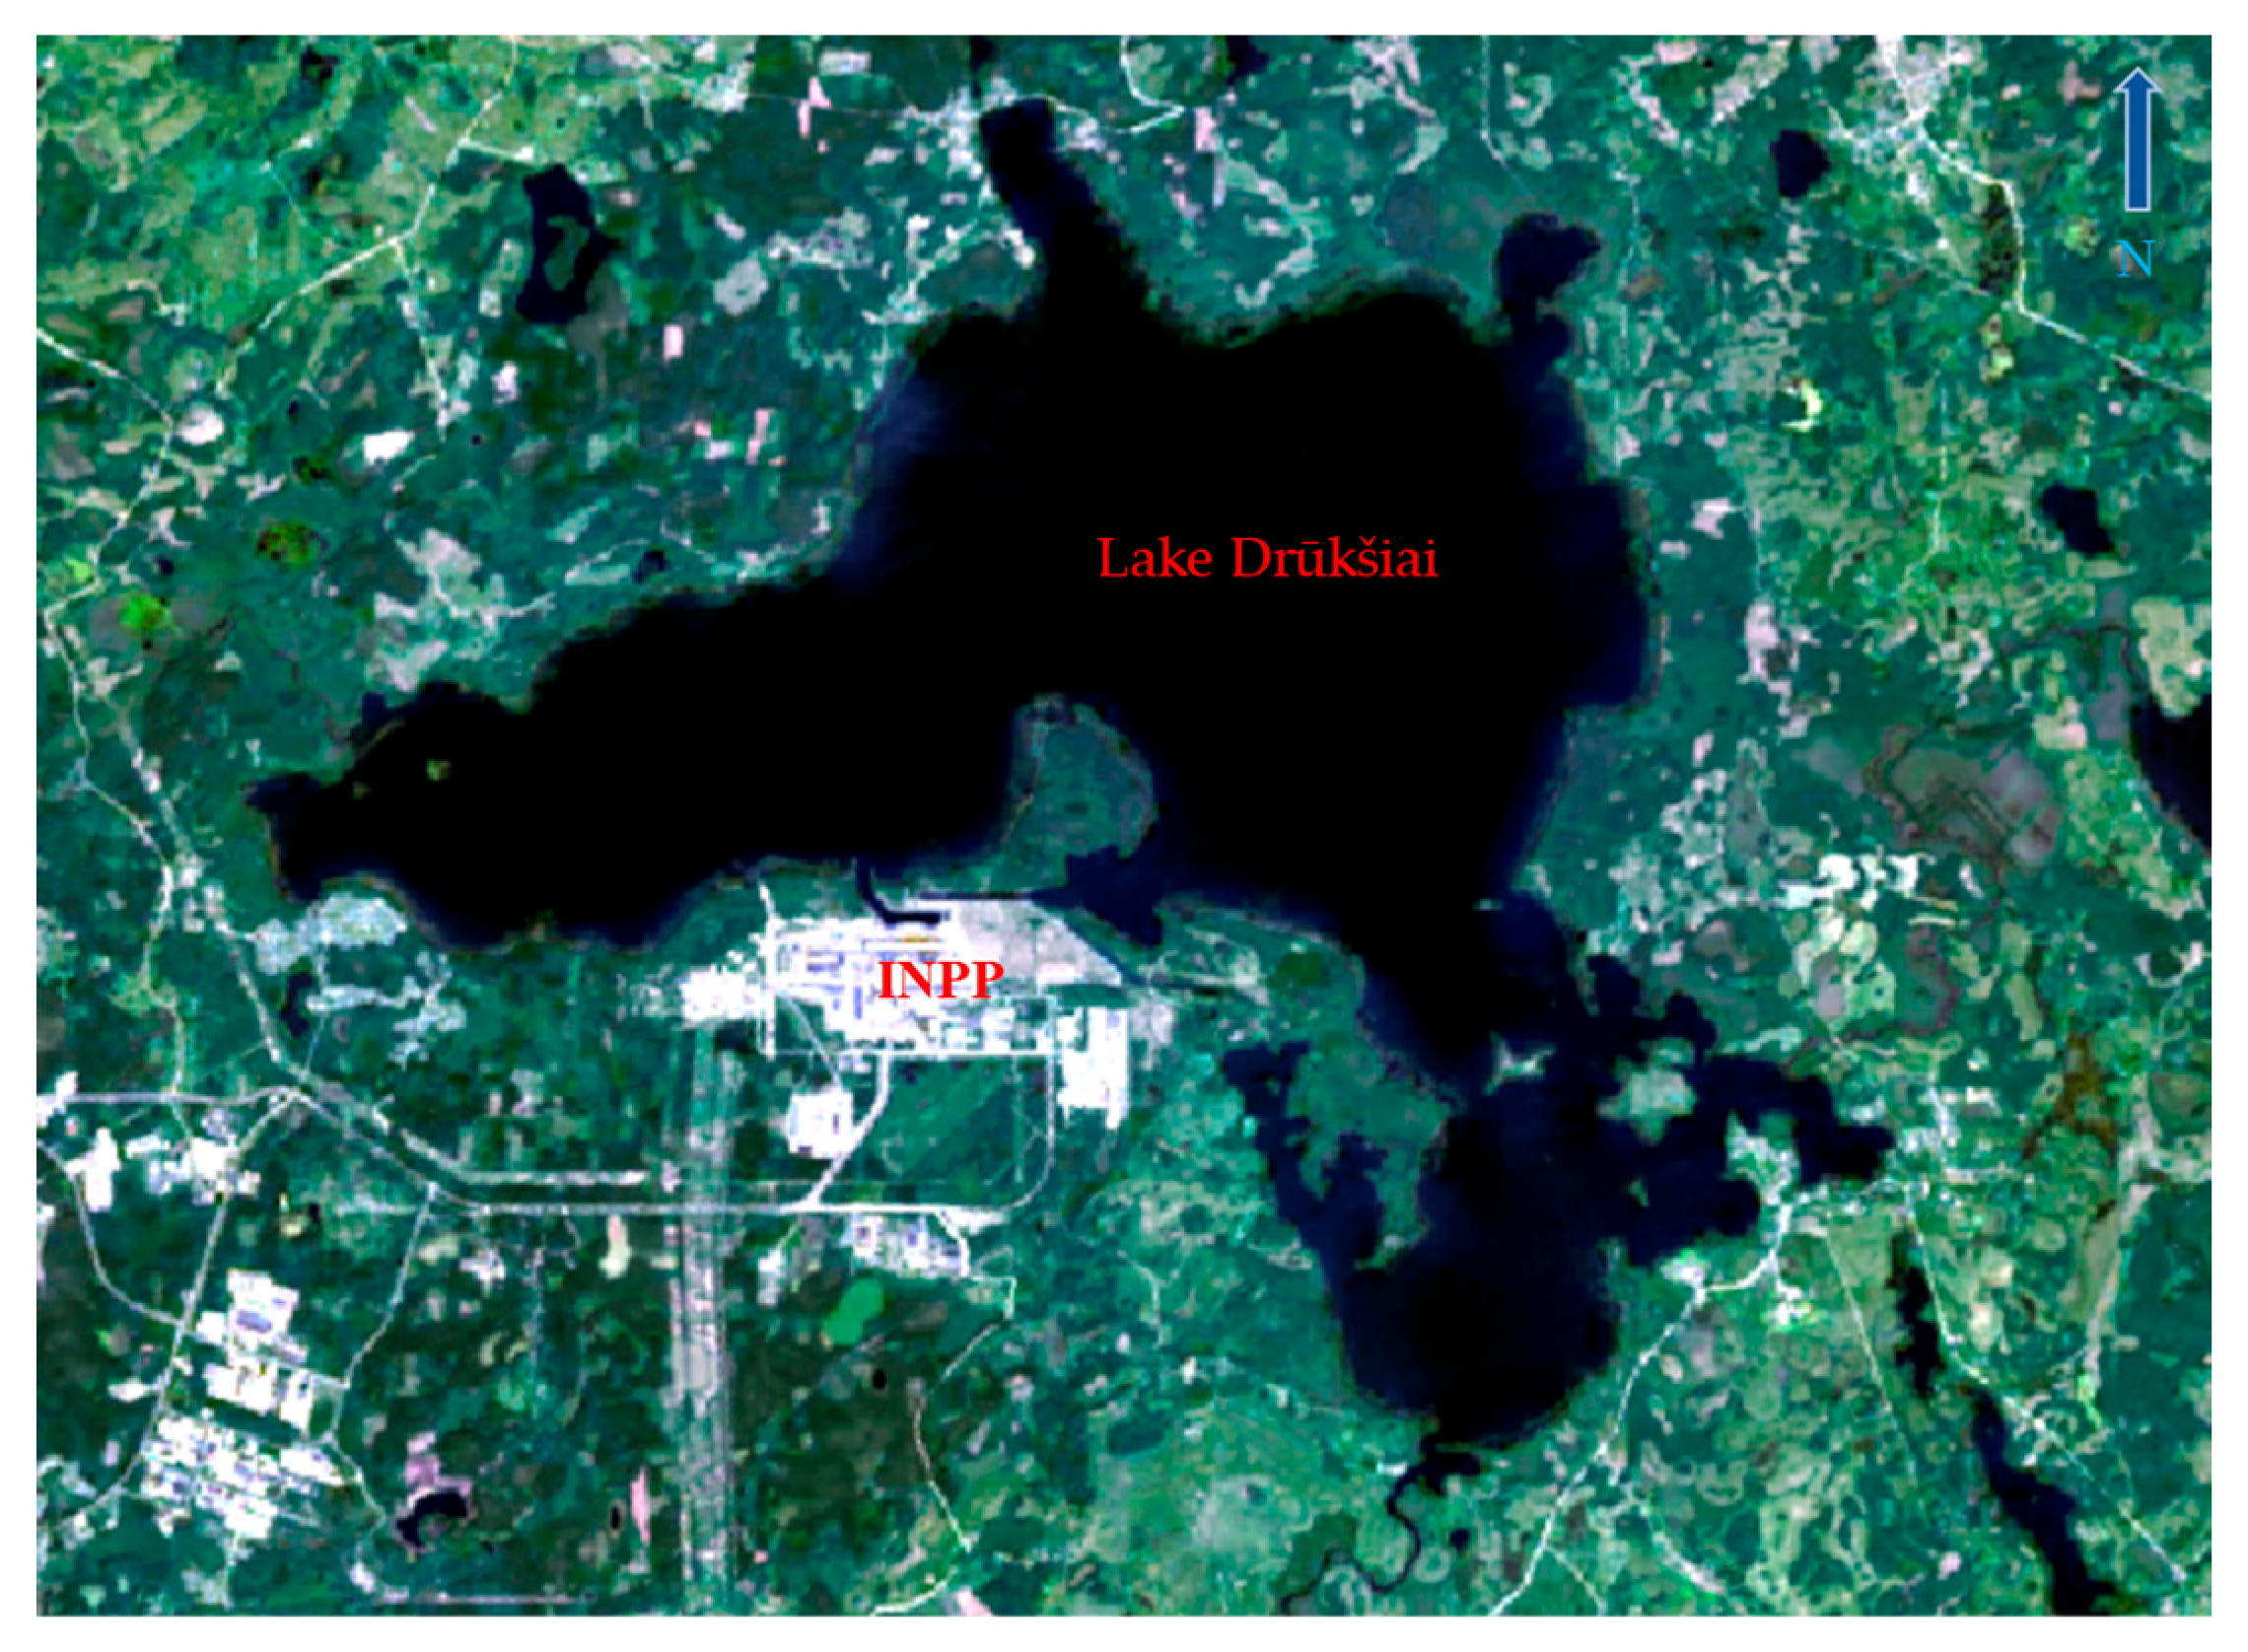
2.1. Description of the Study Area
2.2. Processing of Landsat 8 Data
- First, the NDVI is calculated using the red (Band 4) and NIR (Band 5) bands from the Landsat 8 imagery. NDVI values are essential for estimating surface emissivity, which is a key parameter for accurate LST retrieval. The relationship between NDVI and emissivity is based on the assumption that vegetation cover significantly influences the thermal emission properties of the surface.
- Next, surface emissivity is estimated based on the NDVI values. Pixels with NDVI values less than 0.2 are classified as bare soil, while those with values greater than 0.5 are considered fully vegetated. For mixed pixels (NDVI between 0.2 and 0.5), emissivity is calculated as a weighted average, reflecting the proportion of vegetation cover [23,24].
- Finally, LST is calculated using the previously derived surface emissivity and brightness temperature values. For this purpose, the SC algorithm, developed by Jiménez-Muñoz et al. (2009), is employed [13]. This algorithm utilises thermal infrared data acquired by satellite and applies atmospheric corrections to account for the influence of atmospheric conditions on the observed temperature.
- The processing workflow ensures that surface emissivity is accurately estimated across diverse land cover types, which is essential for enhancing the precision of LST retrievals from satellite observations. All methods applied in this study are well-established and have been appropriately cited to acknowledge the contributions of the original authors [10,13,22,24,25].
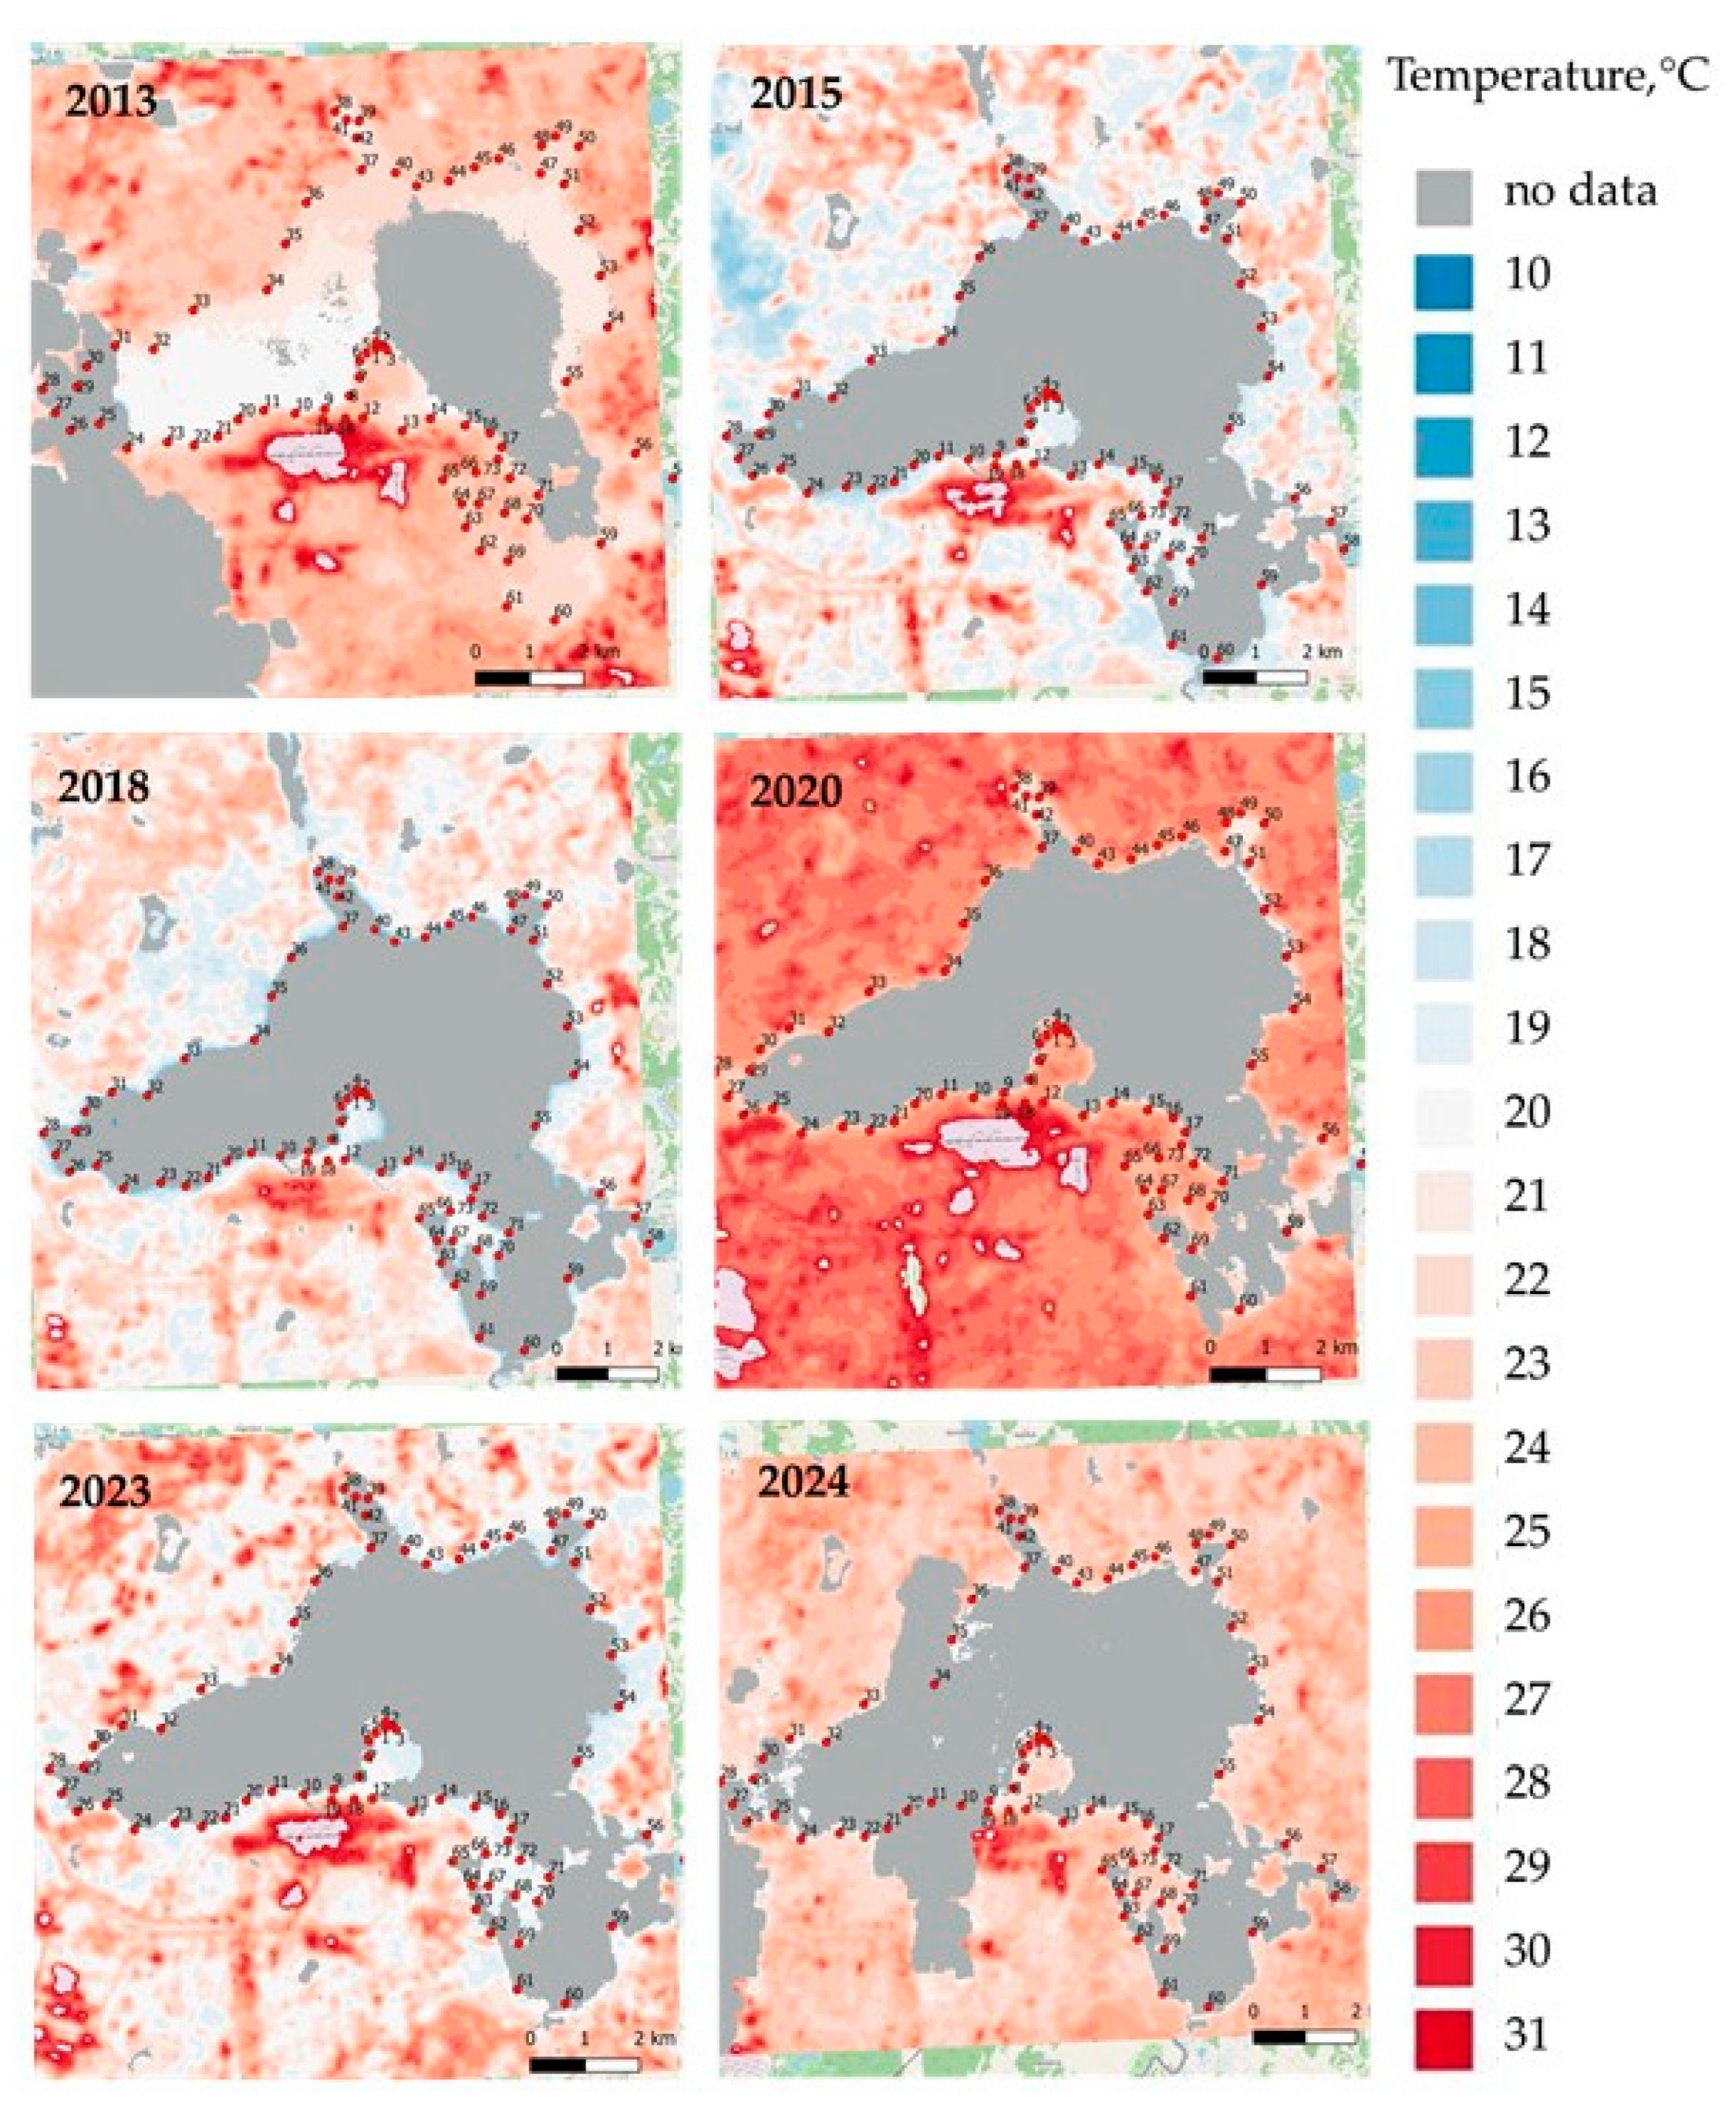
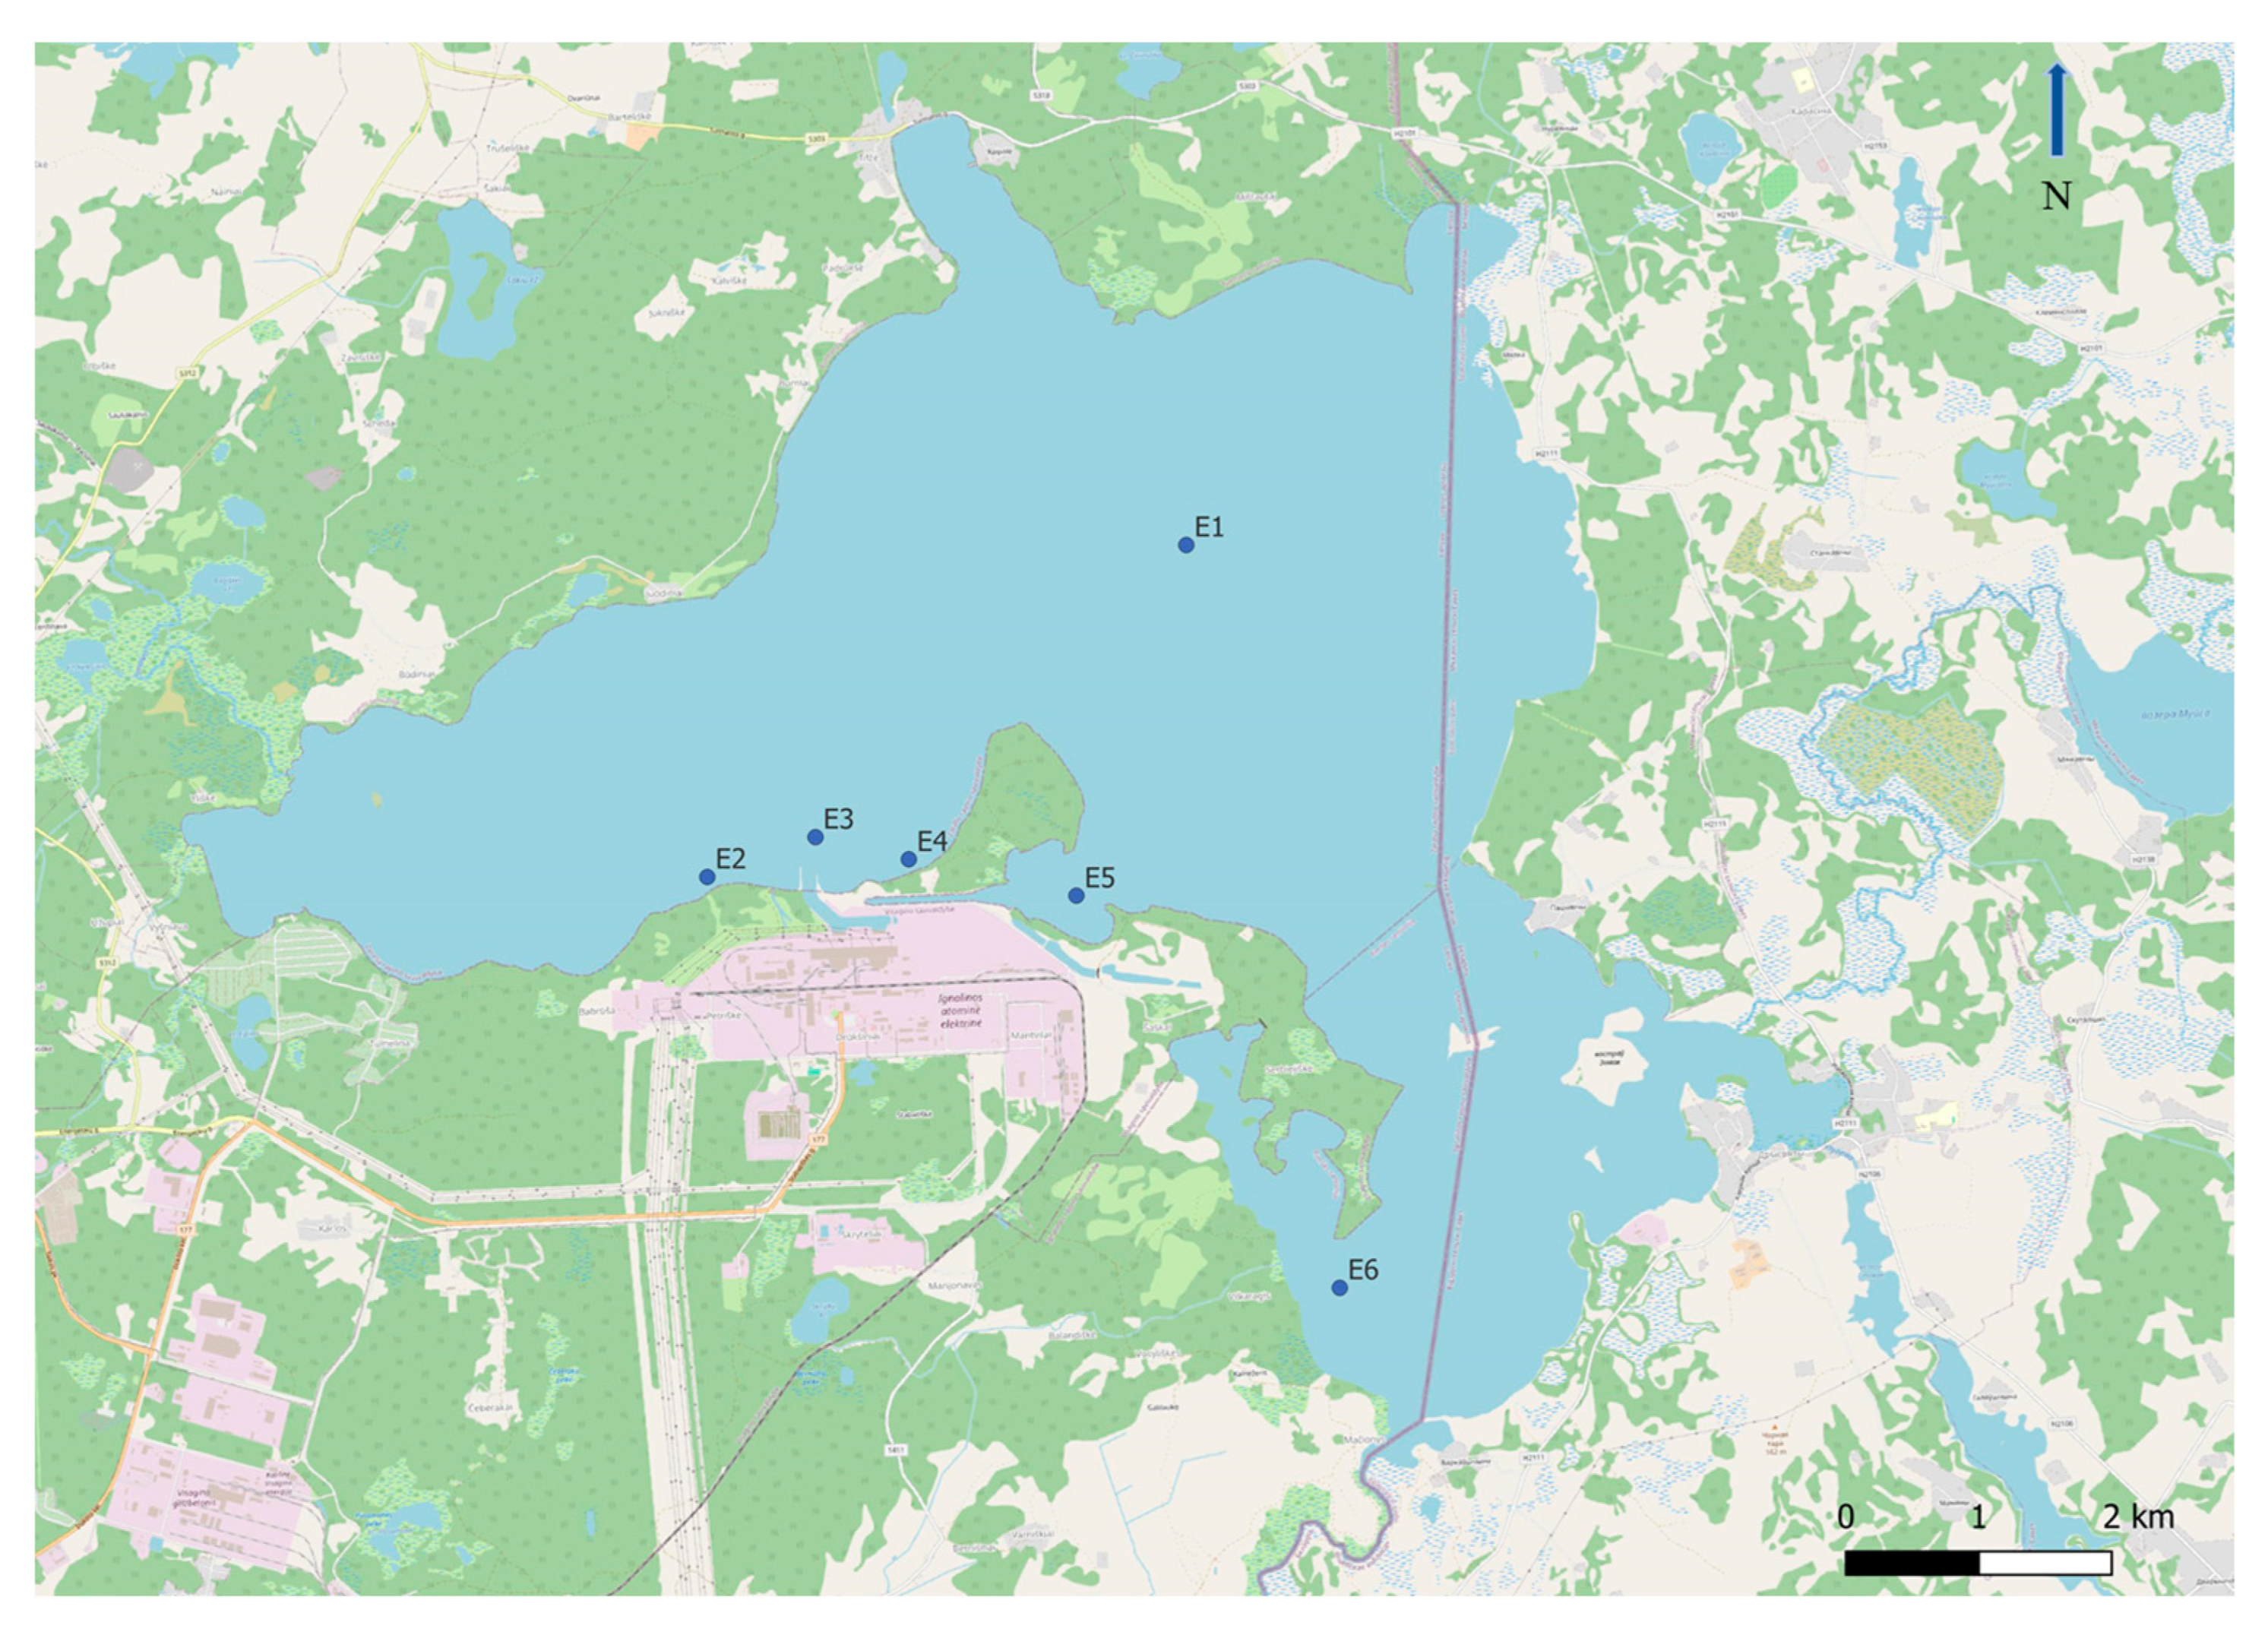
- Due to the limited availability of cloud-free Landsat 8 imagery over Lake Drūkšiai, only six representative acquisition dates between 2013 and 2024 were selected for analysis. These dates were chosen based on low cloud cover, seasonal consistency, and alignment with in situ measurements conducted by INPP environmental specialists, enabling partial validation of satellite-derived LST values.

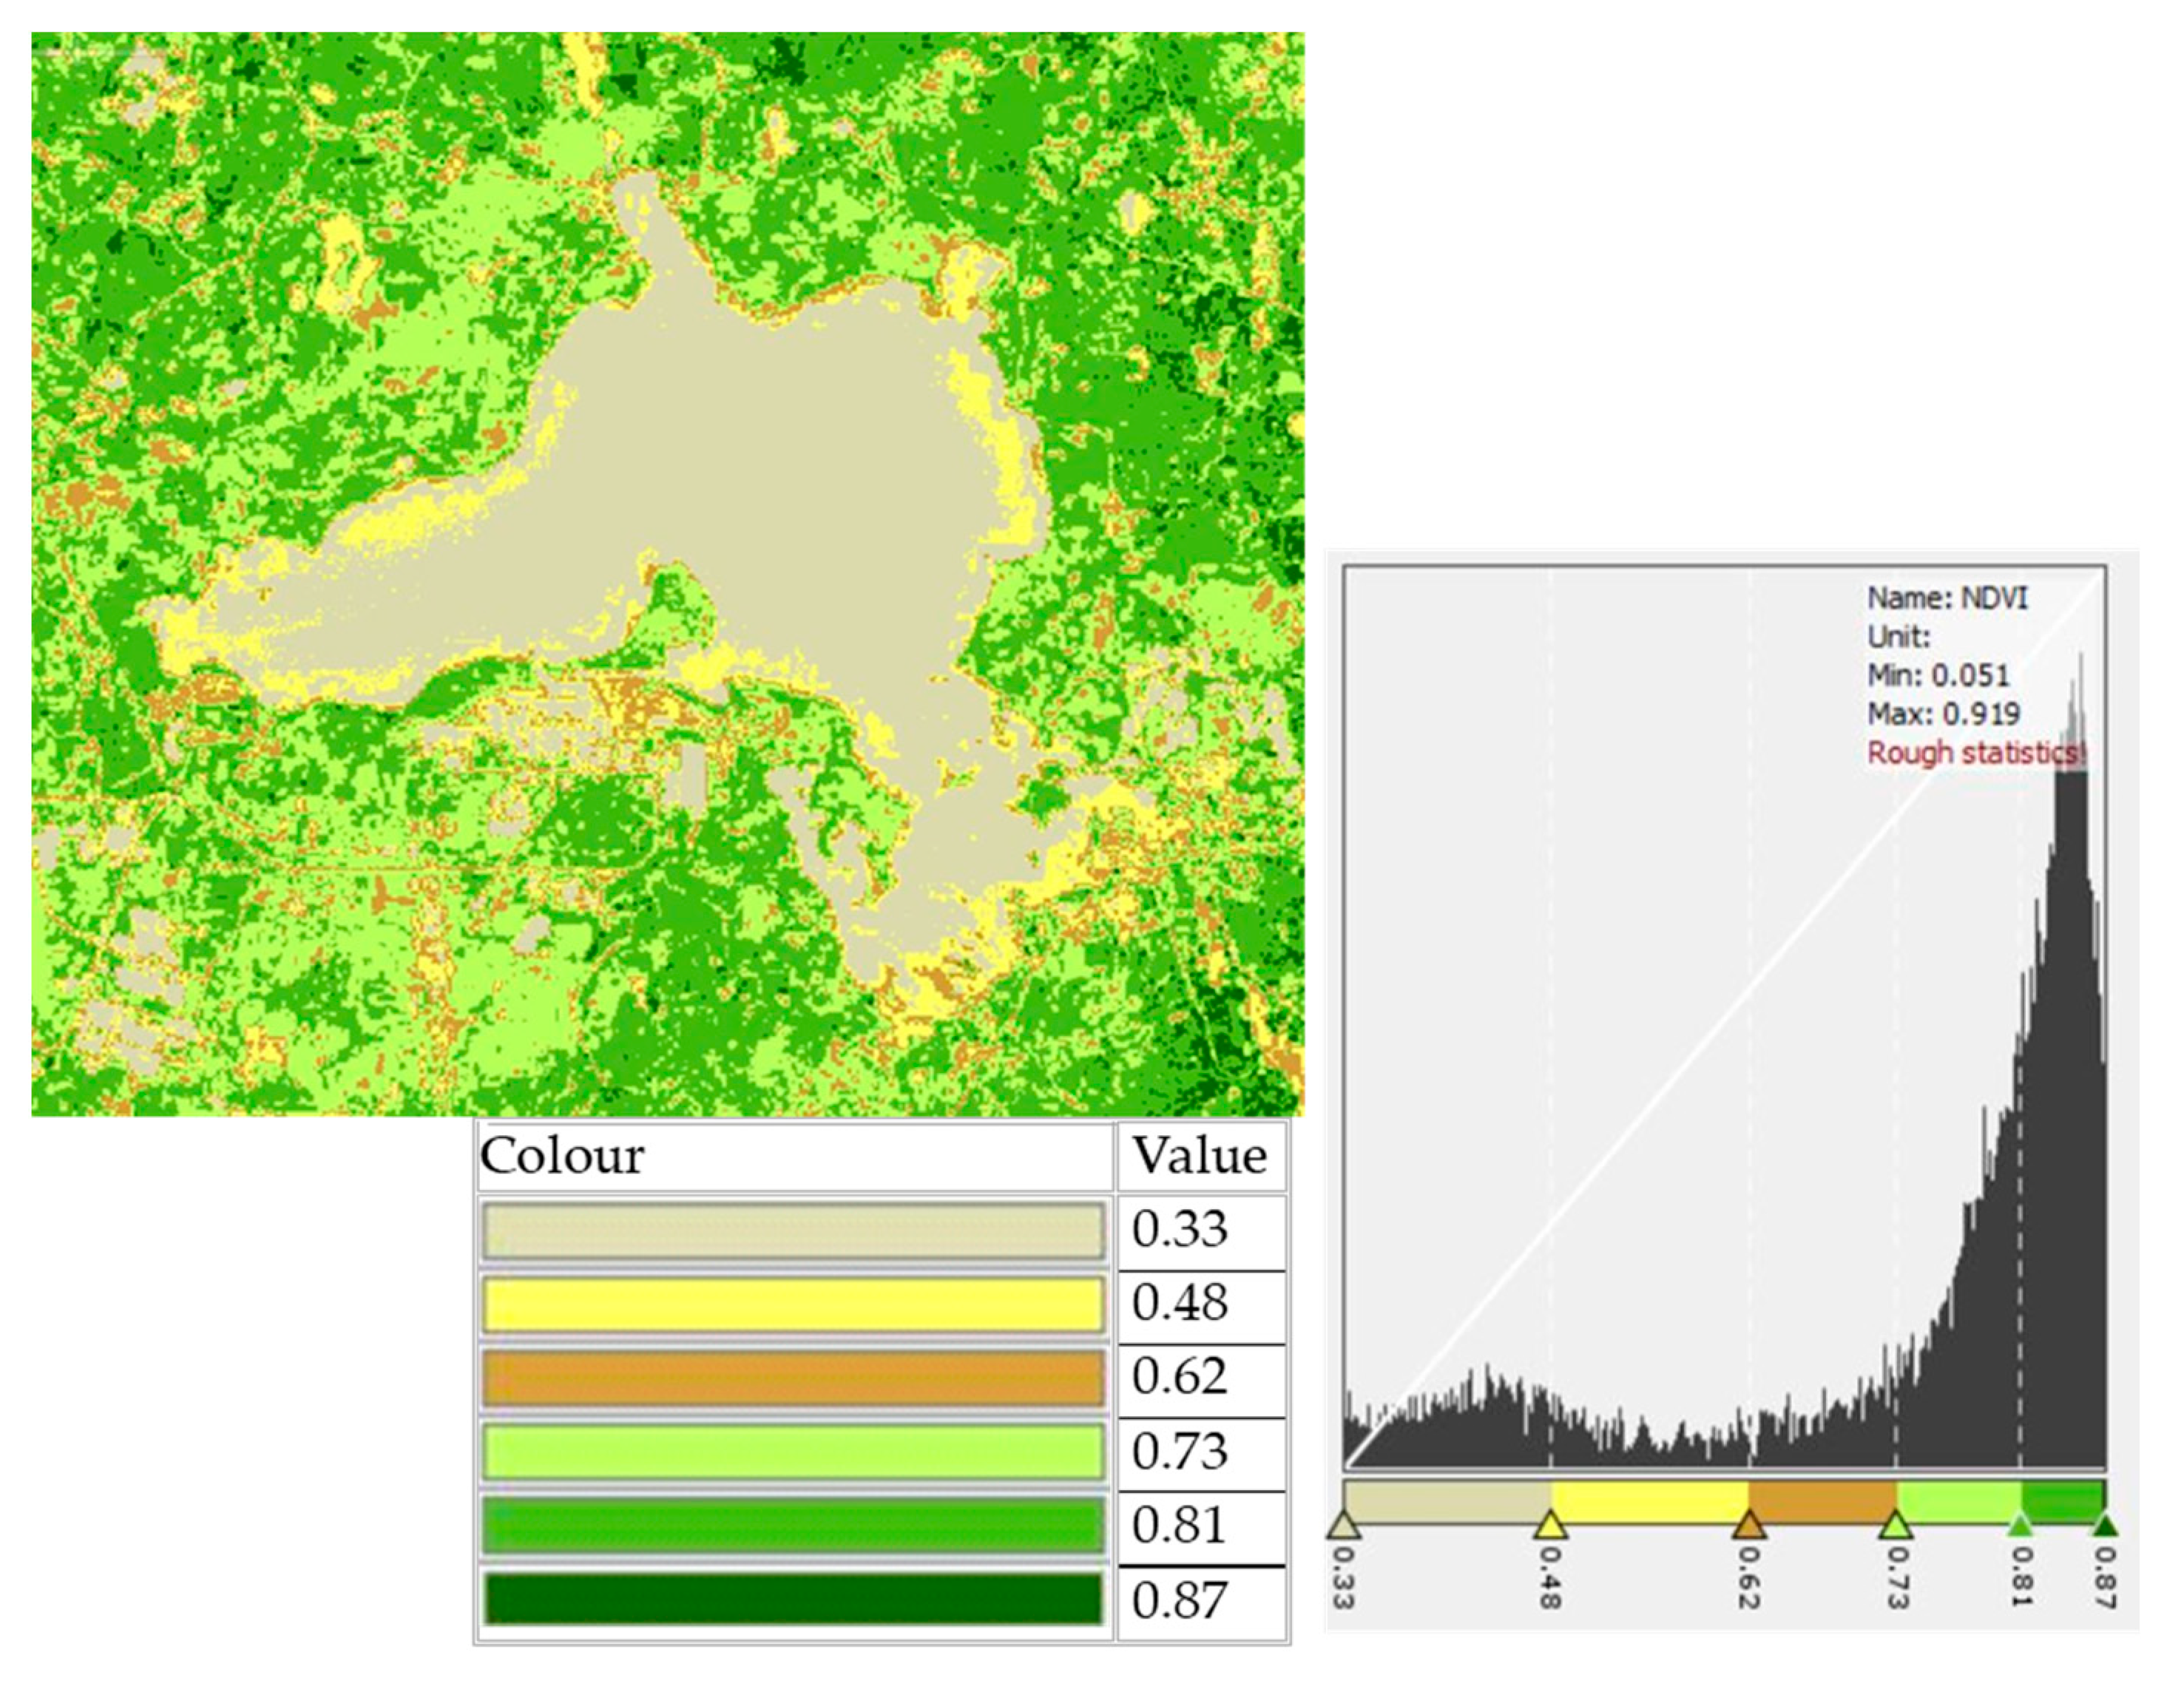
- NDVI < 0.2—pixels are considered bare soil, and emissivity is derived from soil reflectance values.
- NDVI > 0.5—pixels are considered fully vegetated, and a typical constant emissivity value is assumed (approximately 0.99).
- 0.2 ≤ NDVI ≤ 0.5—pixels are classified as mixed (soil and vegetation), and emissivity is calculated as a weighted average based on the proportion of vegetation.
3. Results
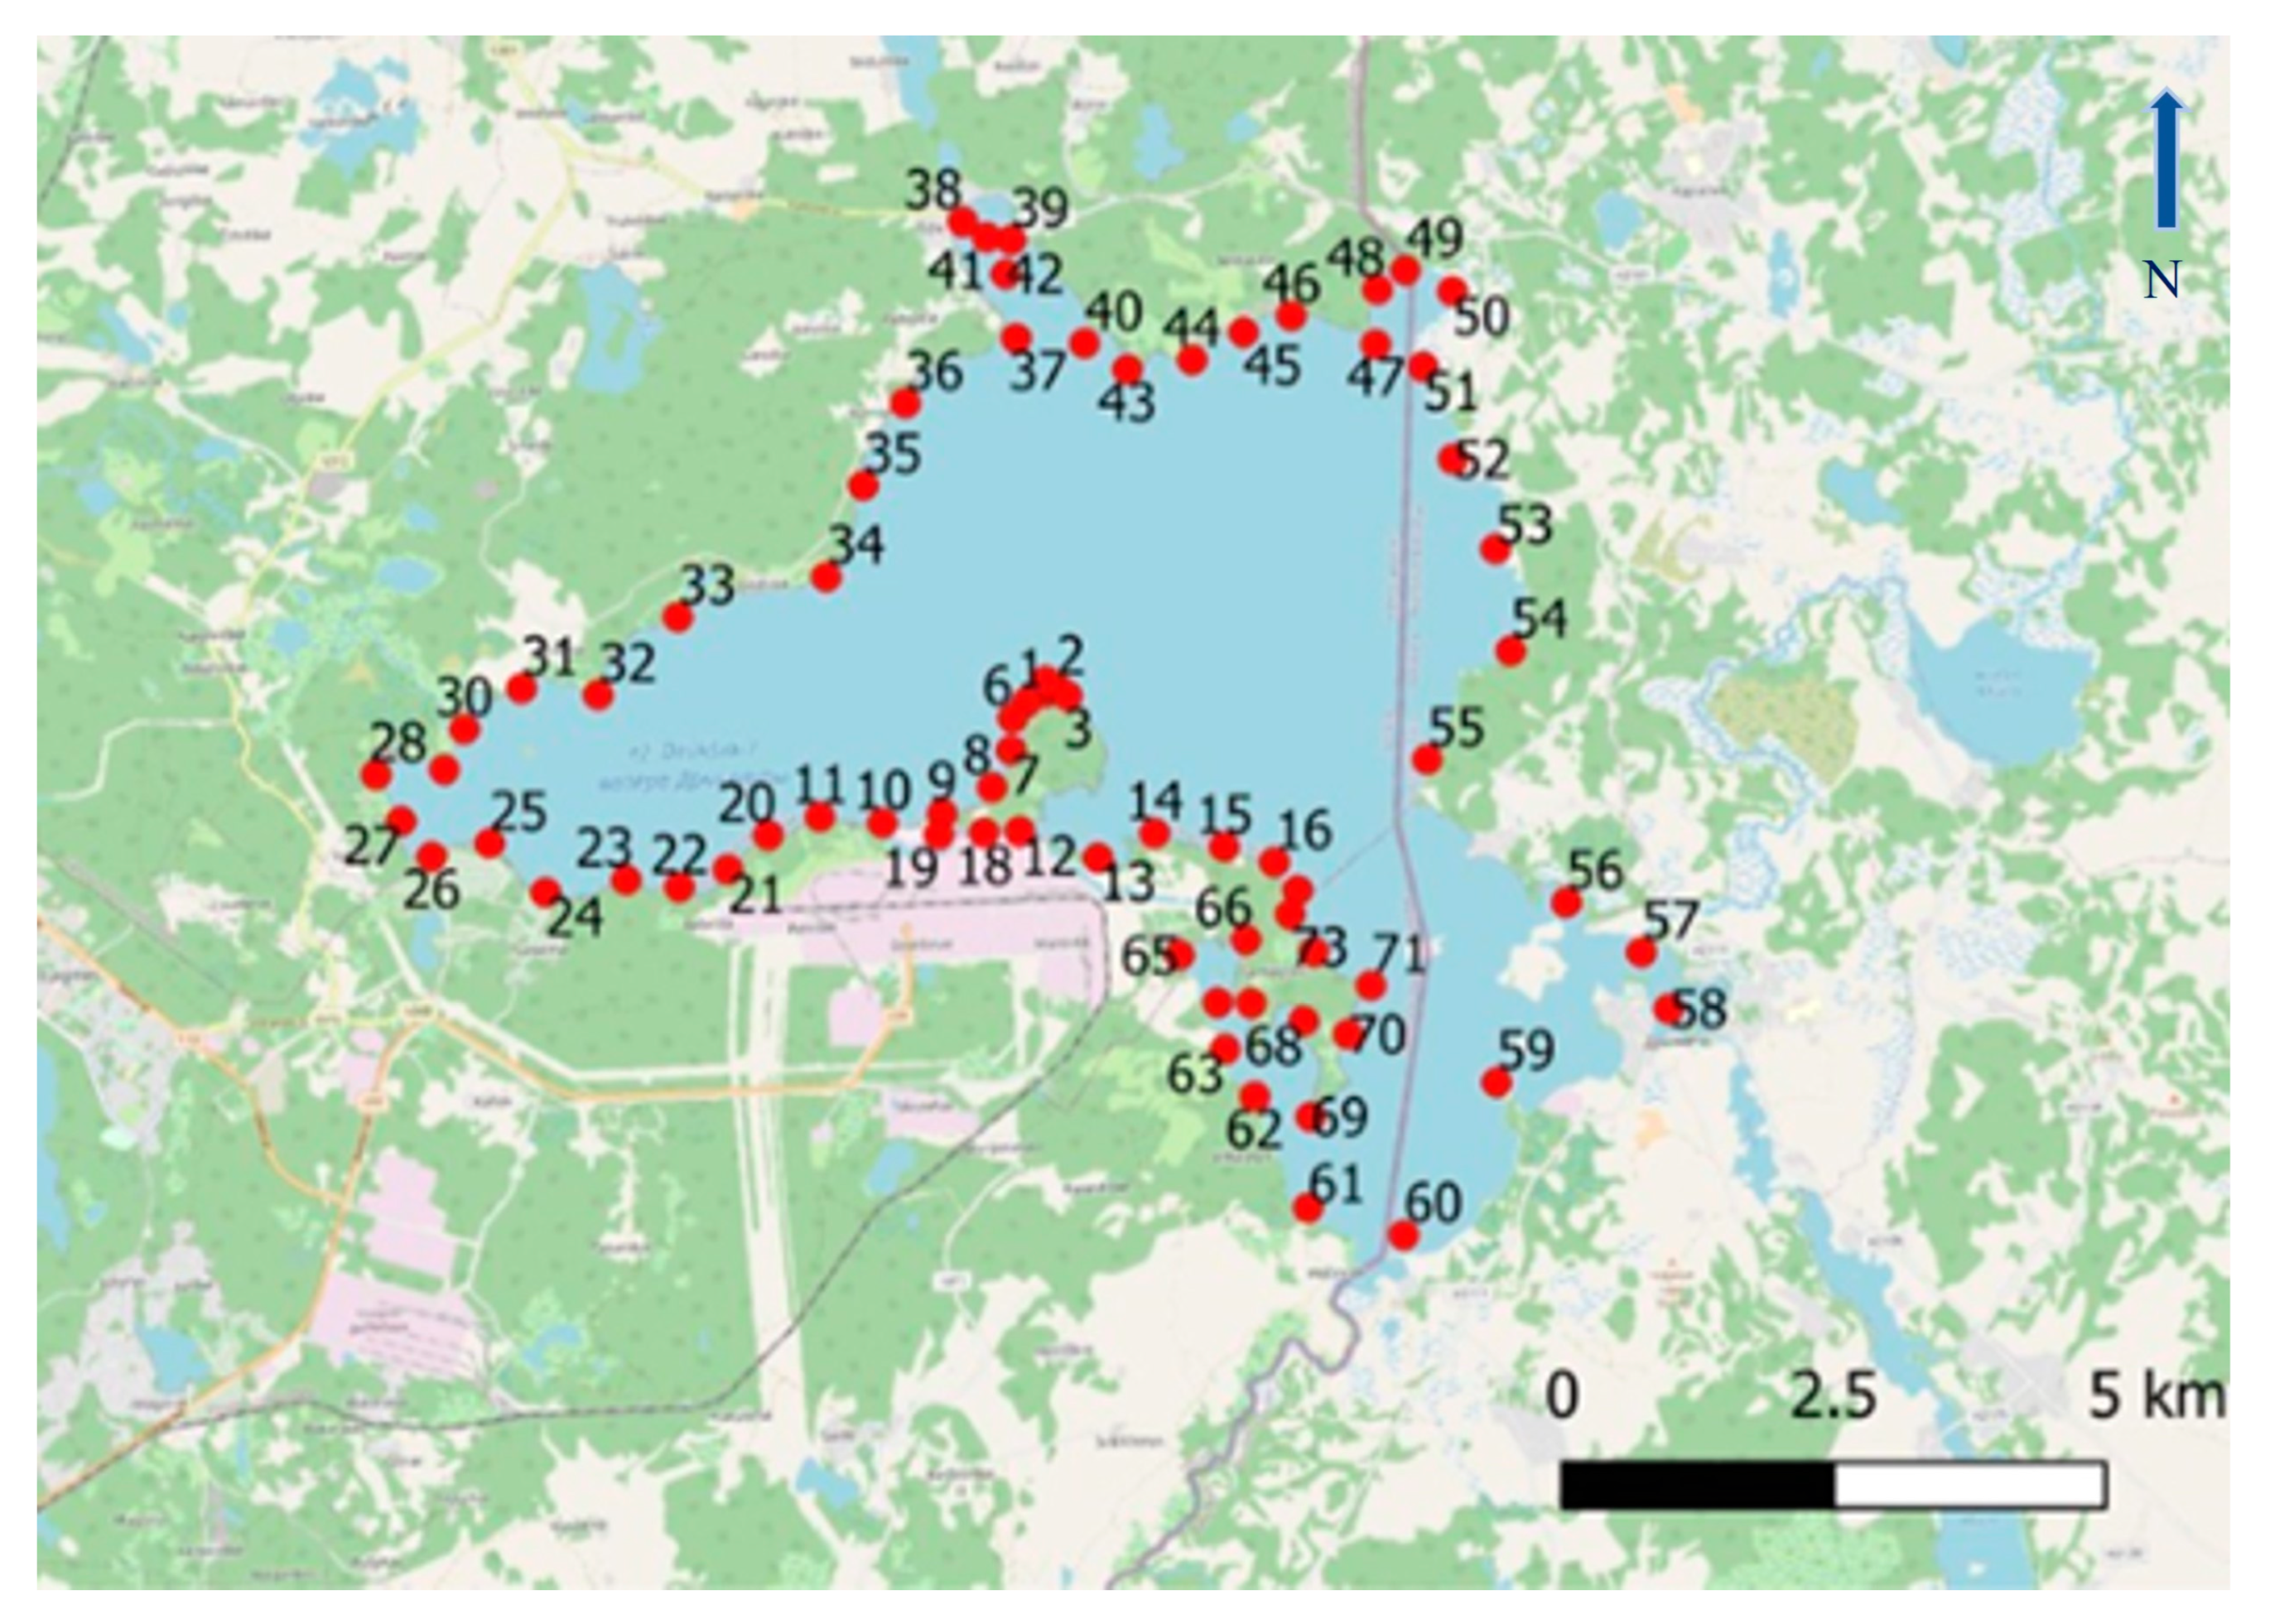
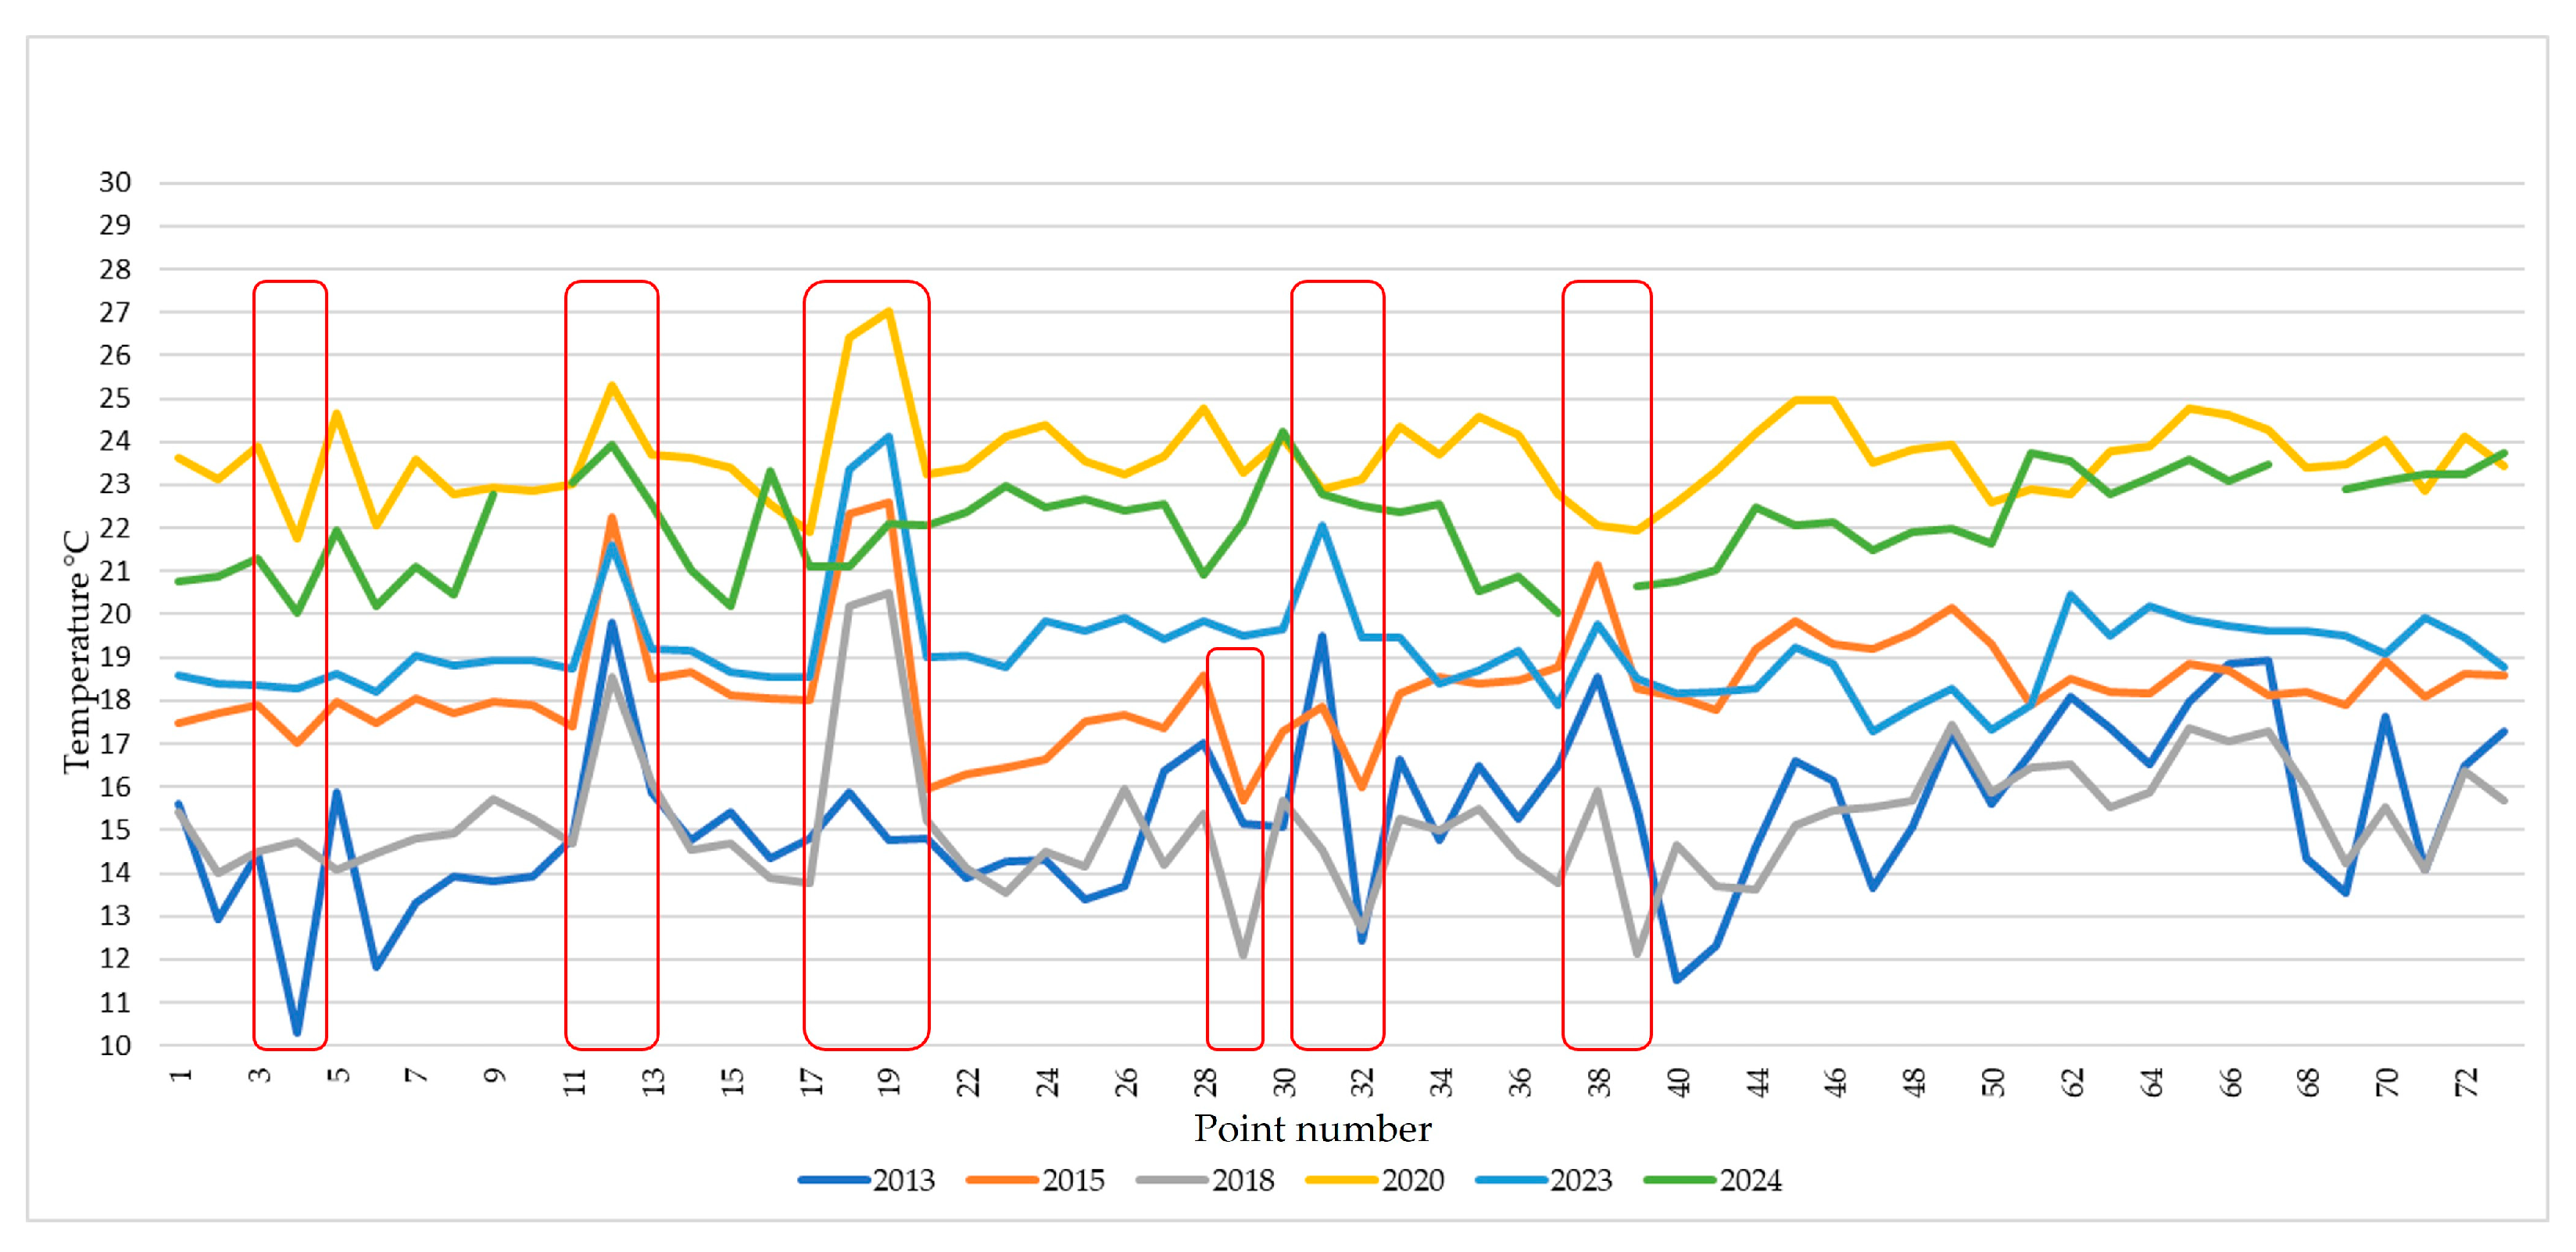
- Areas distant from the INPP;
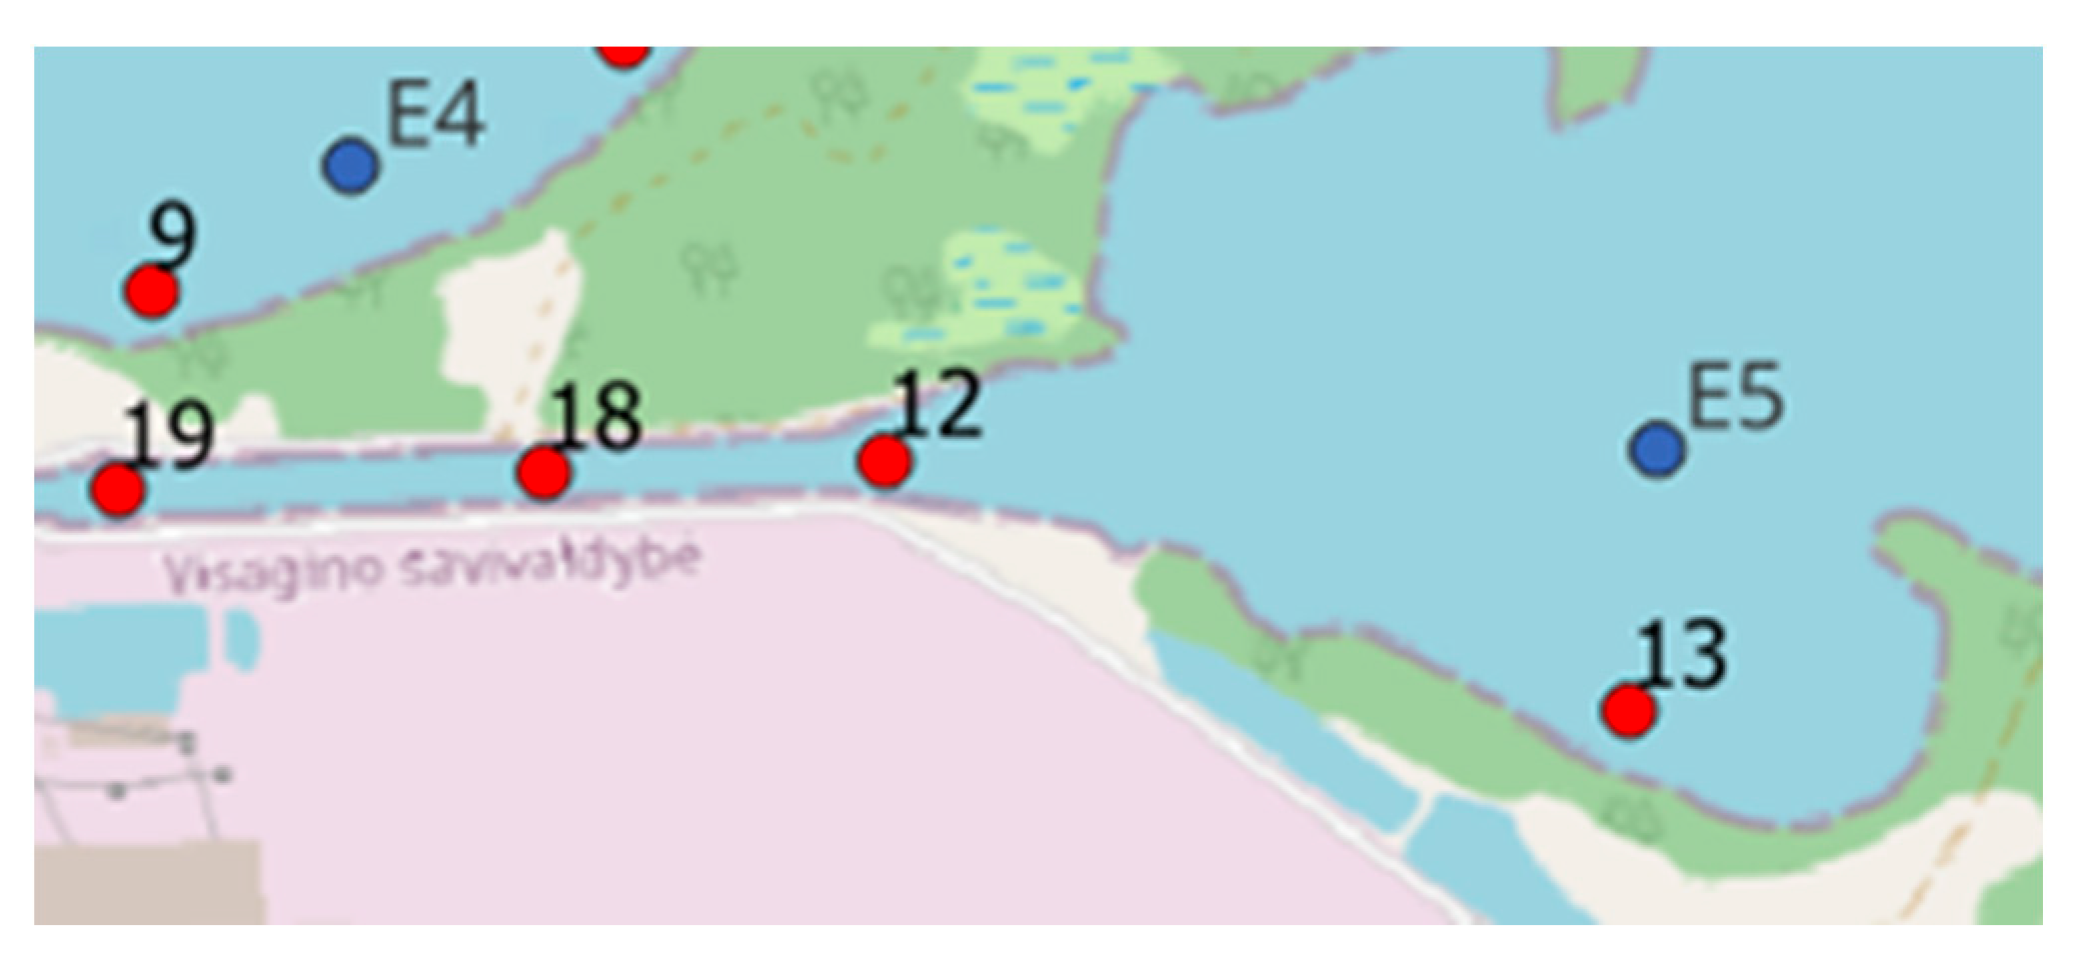
- Cooling water intake zones;
- Technological water discharge zones.
4. Discussion
5. Conclusions
Supplementary Materials
Author Contributions
Funding
Institutional Review Board Statement
Informed Consent Statement
Data Availability Statement
Conflicts of Interest
Abbreviations
| ASTER | Advanced Spaceborne Thermal Emission and Reflection Radiometer |
| DNs | Digital Numbers |
| ERDAS | Earth Resource Development Assessment System |
| ESA | Europe Space Agency |
| ETM+ | Enhanced Thematic Mapper Plus |
| QGIS | Quantum Geographic Information System |
| INPP | Ignalina Nuclear Power Plant |
| LaSRC | Land Surface Reflectance Code |
| LSE | Land Surface Emissivity |
| LST | Land Surface Temperature |
| L2SPs | Level-2 Science Products |
| LEDAPS | Landsat Ecosystem Disturbance Adaptive Processing System |
| MODIS | Moderate Resolution Imaging Spectroradiometer |
| NDVI | Normalised Difference Vegetation Index |
| NIR | Near-Infrared |
| OLI | Operational Land Imager |
| PSC | Practical Single-Channel |
| PV | Proportion of Vegetation |
| RBMK | Reaktor Bolshoy Moshchnosty Kanalny |
| RGB | Red, Green, and Blue |
| RSLab | Remote Sensing Laboratory |
| QA | Quality Assessment |
| SNAP | SeNtinel’s Application Platform |
| SC | Single Channel |
| SR | Surface Reflectance |
| ST | Surface Temperature |
| TIRS | Thermal Infrared Sensor |
| TOA | Top of Atmospheric (Spectral Radiance) |
| TM | Thematic Mapper |
| USGS | U.S. Geological Survey |
References
- Zhong, H.; Li, P.; Xu, X.; Ma, M.; Zhang, C.; Du, L.; Guo, X. Spatial Distribution and Driving Factors of Nitrogen Cycle Genes in Urban Landscape Lake. Sustainability 2025, 17, 186. [Google Scholar] [CrossRef]
- National Centers for Environmental Information (NCEI). U.S. Climate Extremes Index (CEI). Available online: https://www.ncei.noaa.gov/access/monitoring/cei/ (accessed on 18 April 2024).
- Bidault, O. The Impact of Global Warming on Water. Available online: https://www.waterlogic.com/en-gb/resources/blog/the-impact-of-global-warming-on-water/ (accessed on 3 March 2025).
- Zhao, D.; He, H.S.; Wang, W.J.; Liu, J.; Du, H.; Wu, M.; Tan, X. Distribution and Driving Factors of Forest Swamp Conversions in a Cold Temperate Region. Int. J. Environ. Res. Public Health 2018, 15, 2103. [Google Scholar] [CrossRef]
- Chislock, M.F.; Doster, E.; Zitomer, R.A.; Wilson, A.E. Eutrophication: Causes, Consequences, and Controls in Aquatic Ecosystems. Nat. Educ. Knowl. 2013, 4, 10. [Google Scholar]
- Liu, H.; Zhou, X. Assessing Temperature Change Impact in the Wake of Ongoing Land Use Change: A Case Study at Lake Dianshan. Sustainability 2025, 17, 28. [Google Scholar] [CrossRef]
- Bonansea, M.; Ferrero, S.; Ferral, A.; Ledesma, M.; German, A.; Carreño, J.; Rodriguez, C.; Pinotti, L. Assessing Water Surface Temperature from Landsat Imagery and Its Relationship with a Nuclear Power Plant. Hydrol. Sci. J. 2021, 66, 50–58. [Google Scholar] [CrossRef]
- Qin, Z.; Ruan, B.; Yang, J.; Wei, Z.; Song, W.; Sun, Q. Long-Term Dynamics of Chlorophyll-a Concentration and Its Response to Human and Natural Factors in Lake Taihu Based on MODIS Data. Sustainability 2022, 14, 16874. [Google Scholar] [CrossRef]
- Wei, J.; Feng, L.; Tong, Y.; Xu, Y.; Shi, K. Long-Term Observation of Global Nuclear Power Plants Thermal Plumes Using Landsat Images and Deep Learning. Remote Sens. Environ. 2023, 295, 113707. [Google Scholar] [CrossRef]
- Parastatidis, D.; Mitraka, Z.; Chrysoulakis, N.; Abrams, M. Online Global Land Surface Temperature Estimation from Landsat. Remote Sens. 2017, 9, 1208. [Google Scholar] [CrossRef]
- RSLab. Landsat Land Surface Temperature. Available online: https://rslab.gr/Landsat_LST.html (accessed on 22 January 2025).
- Du, C.; Ren, H.; Qin, Q.; Meng, J.; Zhao, S. A Practical Split-Window Algorithm for Estimating Land Surface Temperature from Landsat 8 Data. Remote Sens. 2015, 7, 647–665. [Google Scholar] [CrossRef]
- Jiménez-Muñoz, J.C.; Cristobal, J.; Sobrino, J.A.; Soria, G.; Ninyerola, M.; Pons, X. Revision of the Single-Channel Algorithm for Land Surface Temperature Retrieval from Landsat Thermal-Infrared Data. IEEE Trans. Geosci. Remote Sens. 2009, 47, 339–349. [Google Scholar] [CrossRef]
- Peng, C.; Xie, Z.; Jin, X. Using Ensemble Learning for Remote Sensing Inversion of Water Quality Parameters in Poyang Lake. Sustainability 2024, 16, 3355. [Google Scholar] [CrossRef]
- Poskas, P.; Poskas, R.; Zujus, R. Planning for Decommissioning of Ignalina Nuclear Power Plant Unit-1. Available online: https://inis.iaea.org/records/h8scg-1e032 (accessed on 25 January 2025).
- Ignalina Nuclear Power Plant. History. Available online: https://www.iae.lt/en/about-us/history/137 (accessed on 2 March 2025).
- Marčiulionienė, D.; Montvydienė, D.; Kazlauskienė, N.; Kesminas, V. Changes in Macrophytes and Fish Communities in the Cooler of Ignalina Nuclear Power Plant (1988–2008). J. Environ. Eng. Landsc. Manag. 2011, 19, 21–33. [Google Scholar] [CrossRef]
- Kirillin, G.; Shatwell, T.; Kasprzak, P. Consequences of Thermal Pollution from a Nuclear Plant on Lake Temperature and Mixing Regime. J. Hydrol. 2013, 496, 47–56. [Google Scholar] [CrossRef]
- Šarauskienė, D. Thermal Regime Database of Ignalina Nuclear Power Plant Cooler–Lake Druksiai. Environ. Monit. Assess. 2002, 79, 4119. [Google Scholar] [CrossRef] [PubMed]
- Lithuanian State Service for Protected Areas Under the Ministry of Environment. Buveinių Apsaugai Svarbių Teritorijų Atrankos Kriterijus Atitinkančios Vietovės „Drūkšių Ežeras” [Areas Meeting the Criteria for the Selection of Areas Important for Habitat Protection “Drūkšiai Lake”, Conservation Assessment Report]. Available online: https://vstt.lrv.lt/uploads/vstt/documents/files/Druksiu%20ezeras_apsaugos%20ivertinimo%20ataskaita.pdf (accessed on 28 February 2025).
- U.S. Geological Survey. Landsat Collection 2 Level-2 Science Products. Available online: https://www.usgs.gov/landsat-missions/landsat-collection-2-level-2-science-products (accessed on 3 March 2025).
- Saputra, R. Mapping Land Surface Temperature (LST) Using Landsat-8 Imagery in ArcMAP. Available online: https://riski-saputra.medium.com/mapping-land-surface-temperature-lst-using-landsat-8-imagery-in-arcmap-99bd64f2c3fa (accessed on 4 March 2025).
- Li, Z.-L.; Wu, H.; Wang, N.; Qiu, S.; Sobrino, J.A.; Wan, Z.; Tang, B.-H.; Yan, G. Land Surface Emissivity Retrieval from Satellite Data. Int. J. Remote Sens. 2013, 34, 3084–3127. [Google Scholar] [CrossRef]
- Sobrino, J.A.; Jimenez-Munoz, J.C.; Soria, G.; Romaguera, M.; Guanter, L.; Moreno, J.; Plaza, A.; Martinez, P. Land Surface Emissivity Retrieval from Different VNIR and TIR Sensors. IEEE Trans. Geosci. Remote Sens. 2008, 46, 316–327. [Google Scholar] [CrossRef]
- Van De Griend, A.A.; Owe, M. On the Relationship Between Thermal Emissivity and the Normalized Difference Vegetation Index for Natural Surfaces. Int. J. Remote Sens. 1993, 14, 1119–1131. [Google Scholar] [CrossRef]
- Yakar, İ.; Bilgi, S. Land Surface Temperature Mapping by the Use of Remote Sensing and GIS: Case Study of Istanbul Metropolitan Area. In Proceedings of the X. Turkish National Photogrammetry and Remote Sensing Association Technical Symposium, Aksaray, Turkey, 25–27 April 2019. [Google Scholar]
- Amantai, N.; Ding, J. Analysis on the Spatio-Temporal Changes of LST and Its Influencing Factors Based on VIC Model in the Arid Region from 1960 to 2017: An Example of the Ebinur Lake Watershed, Xinjiang, China. Remote Sens. 2021, 13, 4867. [Google Scholar] [CrossRef]
- Sobrino, J.A.; Jiménez-Muñoz, J.C.; Paolini, L. Land Surface Temperature Retrieval from LANDSAT TM 5. Remote Sens. Environ. 2004, 90, 3. [Google Scholar] [CrossRef]
- Sobrino Rodríguez, J.A. Desarrollo de un Modelo Teorico para Interpretar la Medida de Temperatura Realizada Mediante Teledeteccion. Aplicacion a un Campo de Naranjos. Ph.D. Thesis, University of Valencia, Valencia, Spain, 1990. [Google Scholar]
- Jet Propulsion Laboratory, California Institute of Technology. ECOSTRESS Spectral Library Version 1.0. Available online: https://speclib.jpl.nasa.gov (accessed on 14 March 2025).
- NASA (MODIS Characterization Support Team). Emissive Bands. Available online: https://mcst.gsfc.nasa.gov/calibration/emissive-bands (accessed on 22 January 2025).
- NASA. MODIS Land Surface Temperature and Emissivity (MOD11). Available online: https://modis.gsfc.nasa.gov/data/dataprod/mod11.php (accessed on 12 February 2025).
- QGIS Python Plugins Repository. RS&GIS. Available online: https://plugins.qgis.org/plugins/NITK_RS-GIS_17/ (accessed on 24 January 2025).
- Wang, M.; Zhang, Z.; Hu, T.; Liu, X. A Practical Single-Channel Algorithm for Land Surface Temperature Retrieval: Application to Landsat Series Data. J. Geophys. Res. D Atmos. 2019, 124, 299–316. [Google Scholar] [CrossRef]
- Nill, L.; Ullmann, T.; Kneisel, C.; Sobiech-Wolf, J.; Baumhauer, R. Assessing Spatiotemporal Variations of Landsat Land Surface Temperature and Multispectral Indices in the Arctic Mackenzie Delta Region Between 1985 and 2018. Remote Sens. 2019, 11, 2329. [Google Scholar] [CrossRef]

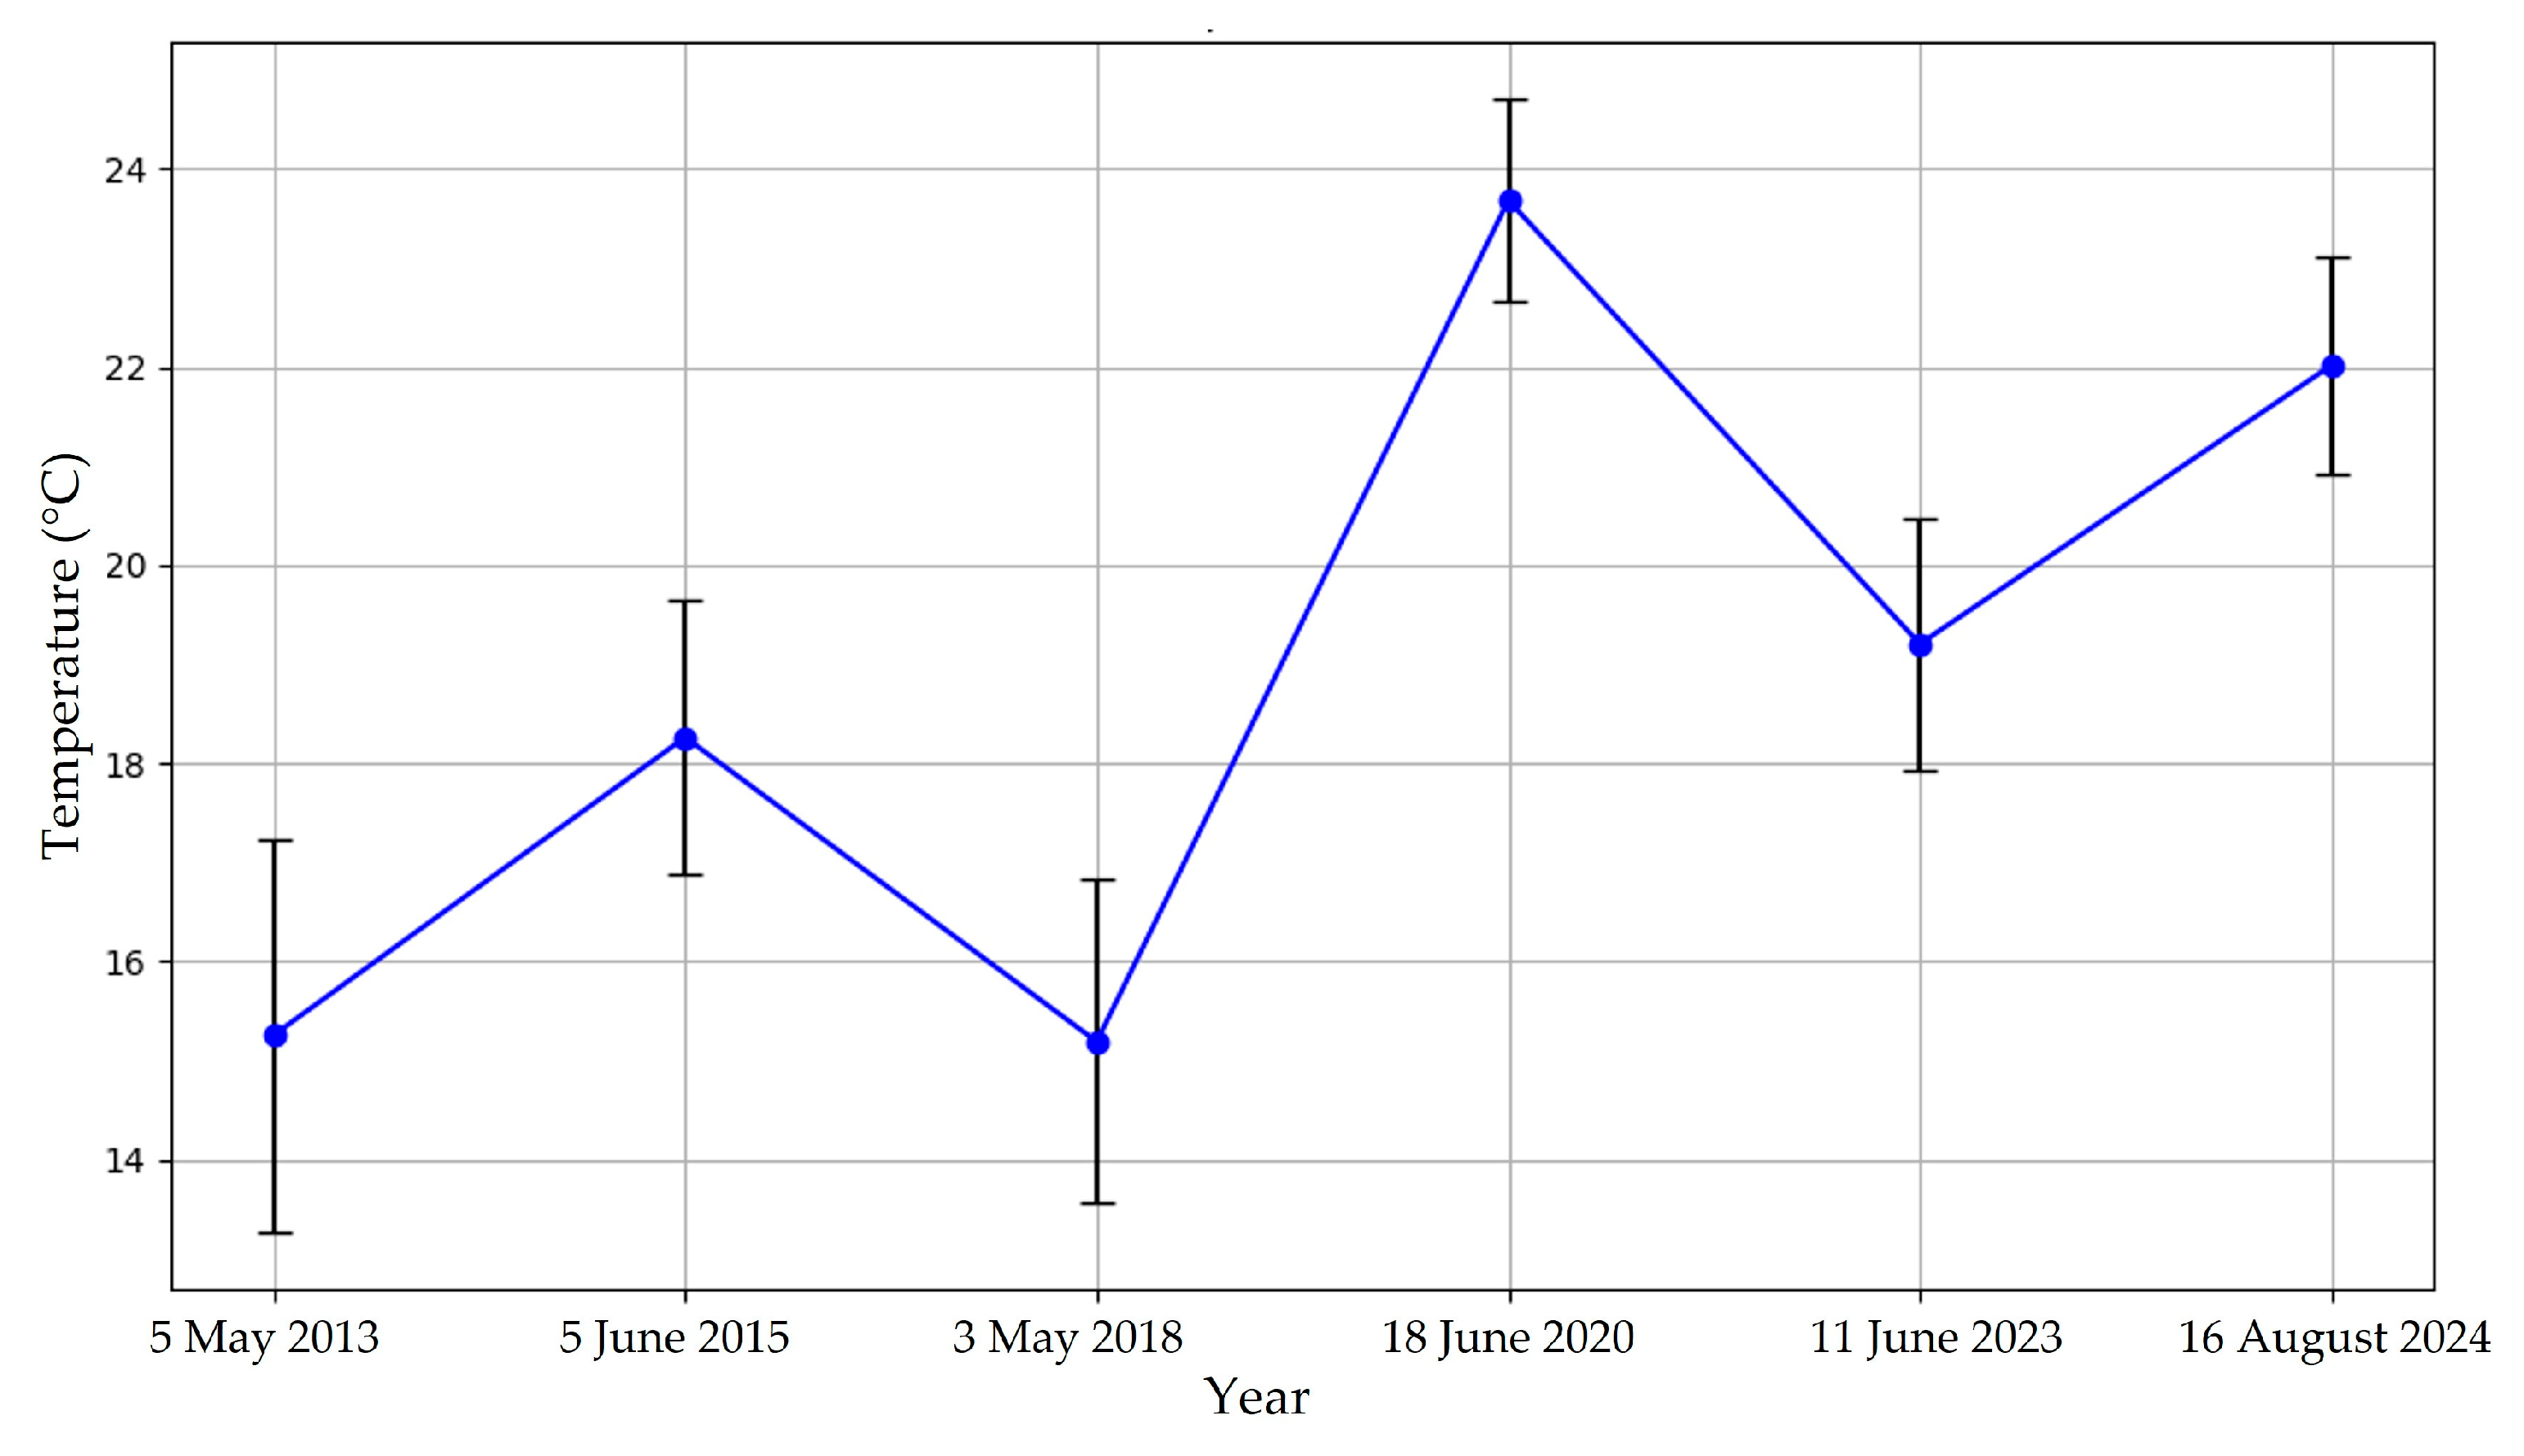
| Temperature, °C | ||||||
|---|---|---|---|---|---|---|
| Point | 5 May 2013 | 5 June 2015 | 3 May 2018 | 18 June 2020 | 11 June 2023 | 16 August 2024 |
| E5 | 19 | 19 | 18 | 26 | 19 | 22 |
| 12 | 20 | 22 | 18 | 25 | 22 | 24 |
| 13 | 16 | 18 | 16 | 24 | 19 | 23 |
| 18 | 16 | 22 | 20 | 26 | 23 | 21 |
| 19 | 15 | 22 | 20 | 27 | 24 | 22 |
Disclaimer/Publisher’s Note: The statements, opinions and data contained in all publications are solely those of the individual author(s) and contributor(s) and not of MDPI and/or the editor(s). MDPI and/or the editor(s) disclaim responsibility for any injury to people or property resulting from any ideas, methods, instructions or products referred to in the content. |
© 2025 by the authors. Licensee MDPI, Basel, Switzerland. This article is an open access article distributed under the terms and conditions of the Creative Commons Attribution (CC BY) license (https://creativecommons.org/licenses/by/4.0/).
Share and Cite
Sužiedelytė Visockienė, J.; Tumelienė, E.; Birvydienė, R. Assessing the Land Surface Temperature Trend of Lake Drūkšiai’s Coastline. Land 2025, 14, 1598. https://doi.org/10.3390/land14081598
Sužiedelytė Visockienė J, Tumelienė E, Birvydienė R. Assessing the Land Surface Temperature Trend of Lake Drūkšiai’s Coastline. Land. 2025; 14(8):1598. https://doi.org/10.3390/land14081598
Chicago/Turabian StyleSužiedelytė Visockienė, Jūratė, Eglė Tumelienė, and Rosita Birvydienė. 2025. "Assessing the Land Surface Temperature Trend of Lake Drūkšiai’s Coastline" Land 14, no. 8: 1598. https://doi.org/10.3390/land14081598
APA StyleSužiedelytė Visockienė, J., Tumelienė, E., & Birvydienė, R. (2025). Assessing the Land Surface Temperature Trend of Lake Drūkšiai’s Coastline. Land, 14(8), 1598. https://doi.org/10.3390/land14081598


