Article

Decoding the Spatial–Temporal Coupling Dynamics of Land Use Intensity and Balance in China’s Chengdu–Chongqing Economic Circle: A 1 km Grid-Based Analysis

College of Resources, Sichuan Agricultural University, Chengdu 611130, China
*
Author to whom correspondence should be addressed.
Land 2025, 14(8), 1597; https://doi.org/10.3390/land14081597
Submission received: 1 June 2025 / Revised: 31 July 2025 / Accepted: 31 July 2025 / Published: 5 August 2025
(This article belongs to the Special Issue Integration of Remote Sensing and GIS for Land Use Change Assessment)

Abstract

Amid China’s national strategic prioritization of the Chengdu–Chongqing Economic Circle and accelerated territorial spatial planning, this study deciphered the synergistic evolution of Land Use Intensity (LUI) and Balance Degree of Land Use Structure (BDLUS) during rapid urbanization. Leveraging 1 km grid units and integrating emerging spatiotemporal hotspot analysis, BFAST, and geographic detectors, we systematically analyzed spatiotemporal patterns and drivers of LUI, BDLUS, and their Coupling Coordination Degree (CCD) from 2000 to 2022. Key findings: (1) LUI strongly correlated with economic growth, with core areas reaching high-intensity development (average > 2.96) versus ecologically constrained marginal zones (<2.42), marked by abrupt changes during 2011–2014; (2) BDLUS improvements covered 82.22% of the study area, driven by the Yangtze River Economic Belt strategy (21.96% hotspot concentration), yet structural imbalance persisted in transitional zones (18.81% cold spots); (3) CCD exhibited center-edge dichotomy, contrasting high-value cores (CCD > 0.68) with ecologically sensitive edges (9.80% cold spots), peaking in regulatory shifts around 2010; (4) terrain constraints and intensified human activities (the interaction effect between nighttime lighting and population density increased by 219.49% after 2020) jointly governed coupling mechanisms, with urbanization and industrial transition becoming dominant drivers. This research advances an “intensity–structure–coordination” framework and elucidates “dual-core resonance” dynamics, offering theoretical foundations for spatial optimization and ecological civilization.

1. Introduction

With the continuous promotion of the national new urbanization strategy, China’s urbanization process has entered a phase of accelerated transformation [1]. Statistical data indicate that between 2010 and 2022, the urbanization rate of China’s permanent population climbed from 49.95% to 65.22% (National Bureau of Statistics of China, 2023), with an average annual growth of 1.2 percentage points, reflecting the largest-scale population migration and land development activities in the world. As a core hub at the intersection of China’s “Belt and Road Initiative” and the Yangtze River Economic Belt Strategy, as well as an important economic growth pole in western China, the Chengdu–Chongqing Economic Circle is undergoing profound changes characterized by rapid urbanization and the reconfiguration of land space [2]. The urban agglomeration centered around the main urban districts of Chongqing and the Chengdu Plain exhibits characteristics of high-intensity contiguous development [3]. However, the spatial development in the Chengdu–Chongqing region faces prominent issues, including disorderly expansion of urban and rural construction land leading to significant “non-agriculturalization” of arable land [4], degradation of ecological service functions in certain areas [5], and a complex predicament characterized by significant gradient imbalance in spatial resource allocation [6,7]. The contradiction between this high-intensity development model and the coordination with land use systems highlights deep-seated governance challenges such as the failure of spatial expansion control, intensified ecological-agricultural space competition, and disorder in the allocation of urban and rural resources. Previous studies have shown that the synergistic evolution of land use intensity and balance has had a profound impact on regional ecological security, resource carrying capacity, and sustainable development [8,9]. Therefore, studying the temporal and spatial coupling mechanisms of land use intensity and balance is of significant importance for promoting the refinement and intelligent transformation of land resource management.
In recent years, the coupled study of land use intensity and balance has gradually become a frontier hotspot in the field of human-environment systems science. Currently, land use intensity is primarily characterized by indicators such as the proportion of built-up land, land development density, and the population economic carrying index [10,11]. Existing research emphasizes that high land use intensity is often accompanied by landscape fragmentation and a decline in ecosystem services [12]. However, a single strength indicator is insufficient to reflect the diverse demand matching of land resource utilization and needs to be analyzed in conjunction with other indicators. The balance of land use is typically measured through characteristics such as multi-dimensional benefit coupling, spatial resource allocation efficiency, and functional stability [13,14]. This approach allows for precise quantification and assessment of the comprehensive effectiveness of land use systems, revealing the interaction mechanisms among various subsystems. The theory of coupling originates from physical sciences, and its essential characteristic lies in revealing the dynamic association mechanisms formed by nonlinear interactions between heterogeneous systems [15]. Current research is gradually focusing on the interaction effects between land use intensity and balance, exploring their spatiotemporal coupling mechanisms, and analyzing the relationship between the dynamic evolution of land use and spatial heterogeneity [16,17]. In recent years, the introduction of multi-scale dynamic simulation [18] and spatial autocorrelation analysis [19] has revealed the spatial differentiation patterns of urban expansion hotspots and uneven cold spots.
However, despite some exploration of the topic, existing research largely focuses on a single indicator, such as the spatiotemporal differentiation of landscape fragmentation [20], lacking sufficient analysis of the “intensity-balance” nonlinear coupling mechanism. Moreover, most studies adopt traditional administrative perspectives, such as provincial, urban cluster, and county levels [21,22], making it difficult to capture the fine-grained differences in land cover change, particularly the gradient differentiation between mountainous cities (like Chongqing) and plain cities (like Chengdu), and there is a lack of multi-scale refined analysis. To overcome the aforementioned scale limitations, this study innovatively employs a 1 km spatial resolution grid as the basic unit of analysis. Compared to the traditional scales mentioned above, the 1 km grid offers significant advantages: (1) it can more accurately reflect the high spatial variability of land use within the Chengdu–Chongqing Economic Circle, revealing local extreme values or gradient changes that may have been overlooked in previous studies [23,24]; (2) it provides sufficiently fine spatial correlation, making the relationship between driving factors and land use changes more direct and reliable [25,26]; (3) the generated high-resolution results can directly support refined decision-making in urban planning [24,27]. Currently, research on land use change trends primarily relies on linear trend analysis methods [28,29] to extract trend characteristics, but linear trend analysis has clear limitations in capturing complex nonlinear features. To deeply reveal the evolution patterns of land use intensity, structural balance, and their coupling coordination in the Chengdu–Chongqing Economic Circle, it is urgent to introduce nonlinear trend analysis methods. Among these, the Breaks For Additive Seasonal and Trend (BFAST) method, as a typical nonlinear trend analysis technique [30,31], has been widely used due to its advantages in effectively identifying structural change points in time series, decomposing trend components, and quantifying the magnitude of changes.
Based on this, the study innovatively employs a refined grid with a resolution of 1 km, focusing on the Chengdu–Chongqing Economic Circle. It examines the Land Use Intensity (LUI), the Balance Degree of Land Use Structure (BDLUS), and the Coupling Coordination Degree (CCD) between them. We propose a core research hypothesis: there is an inverted U-shaped coupling relationship between LUI and BDLUS. Specifically, as LUI initially increases, BDLUS may tend to optimize (rising phase), but once LUI exceeds a certain threshold, BDLUS may begin to decline (falling phase). To verify this hypothesis and further explore its spatiotemporal characteristics and driving mechanisms, this study will conduct emerging spatiotemporal hotspot analysis by constructing spatiotemporal cubes, continuously track change trends on a grid-by-grid basis using the advanced BFAST method, and perform quantitative factor analysis on five key factors—slope, elevation, population density, nighttime light, and GDP—using the geographic detector method. The research aims to: (1) verify the existence of an inverted U-shaped coupling relationship between LUI and BDLUS and analyze its spatiotemporal evolution patterns; (2) clarify how the aforementioned factors influence LUI, BDLUS, and CCD in the Chengdu–Chongqing Economic Circle. By deeply analyzing the complex interactions between land use dynamic changes and socio-economic effects, this study aims to reveal the core pathways for the efficient allocation of land resources and to build a future pattern of harmonious coexistence between humans and nature. This will provide solid scientific support for regional sustainable development strategies, promoting the enhancement of comprehensive competitiveness in the Chengdu–Chongqing area and other urban agglomerations globally, as well as advancing the process of ecological civilization construction.

2. Materials and Methods

2.1. Study Area

The Chengdu–Chongqing Economic Circle is located at the intersection of the ecological barrier of the upper Yangtze River and the economic corridor of southwestern China. Its geographical range spans from 101°30′ E to 109°20′ E and from 27°10′ N to 32°40′ N, making it the largest urban agglomeration in western China. The study area includes the central urban districts of Chongqing as well as 27 districts (counties) such as Wanzhou and Fuling, along with 15 prefecture-level cities in Sichuan Province, including Chengdu and Zigong, covering a total area of 185,000 km2. In 2022, the regional GDP reached 7.8 trillion yuan, accounting for 6.4% of China’s total economy, with a permanent population of over 96 million and an urbanization rate of 64.5%, presenting a spatial pattern characterized by “dual-core drive and multi-polar support” [32].
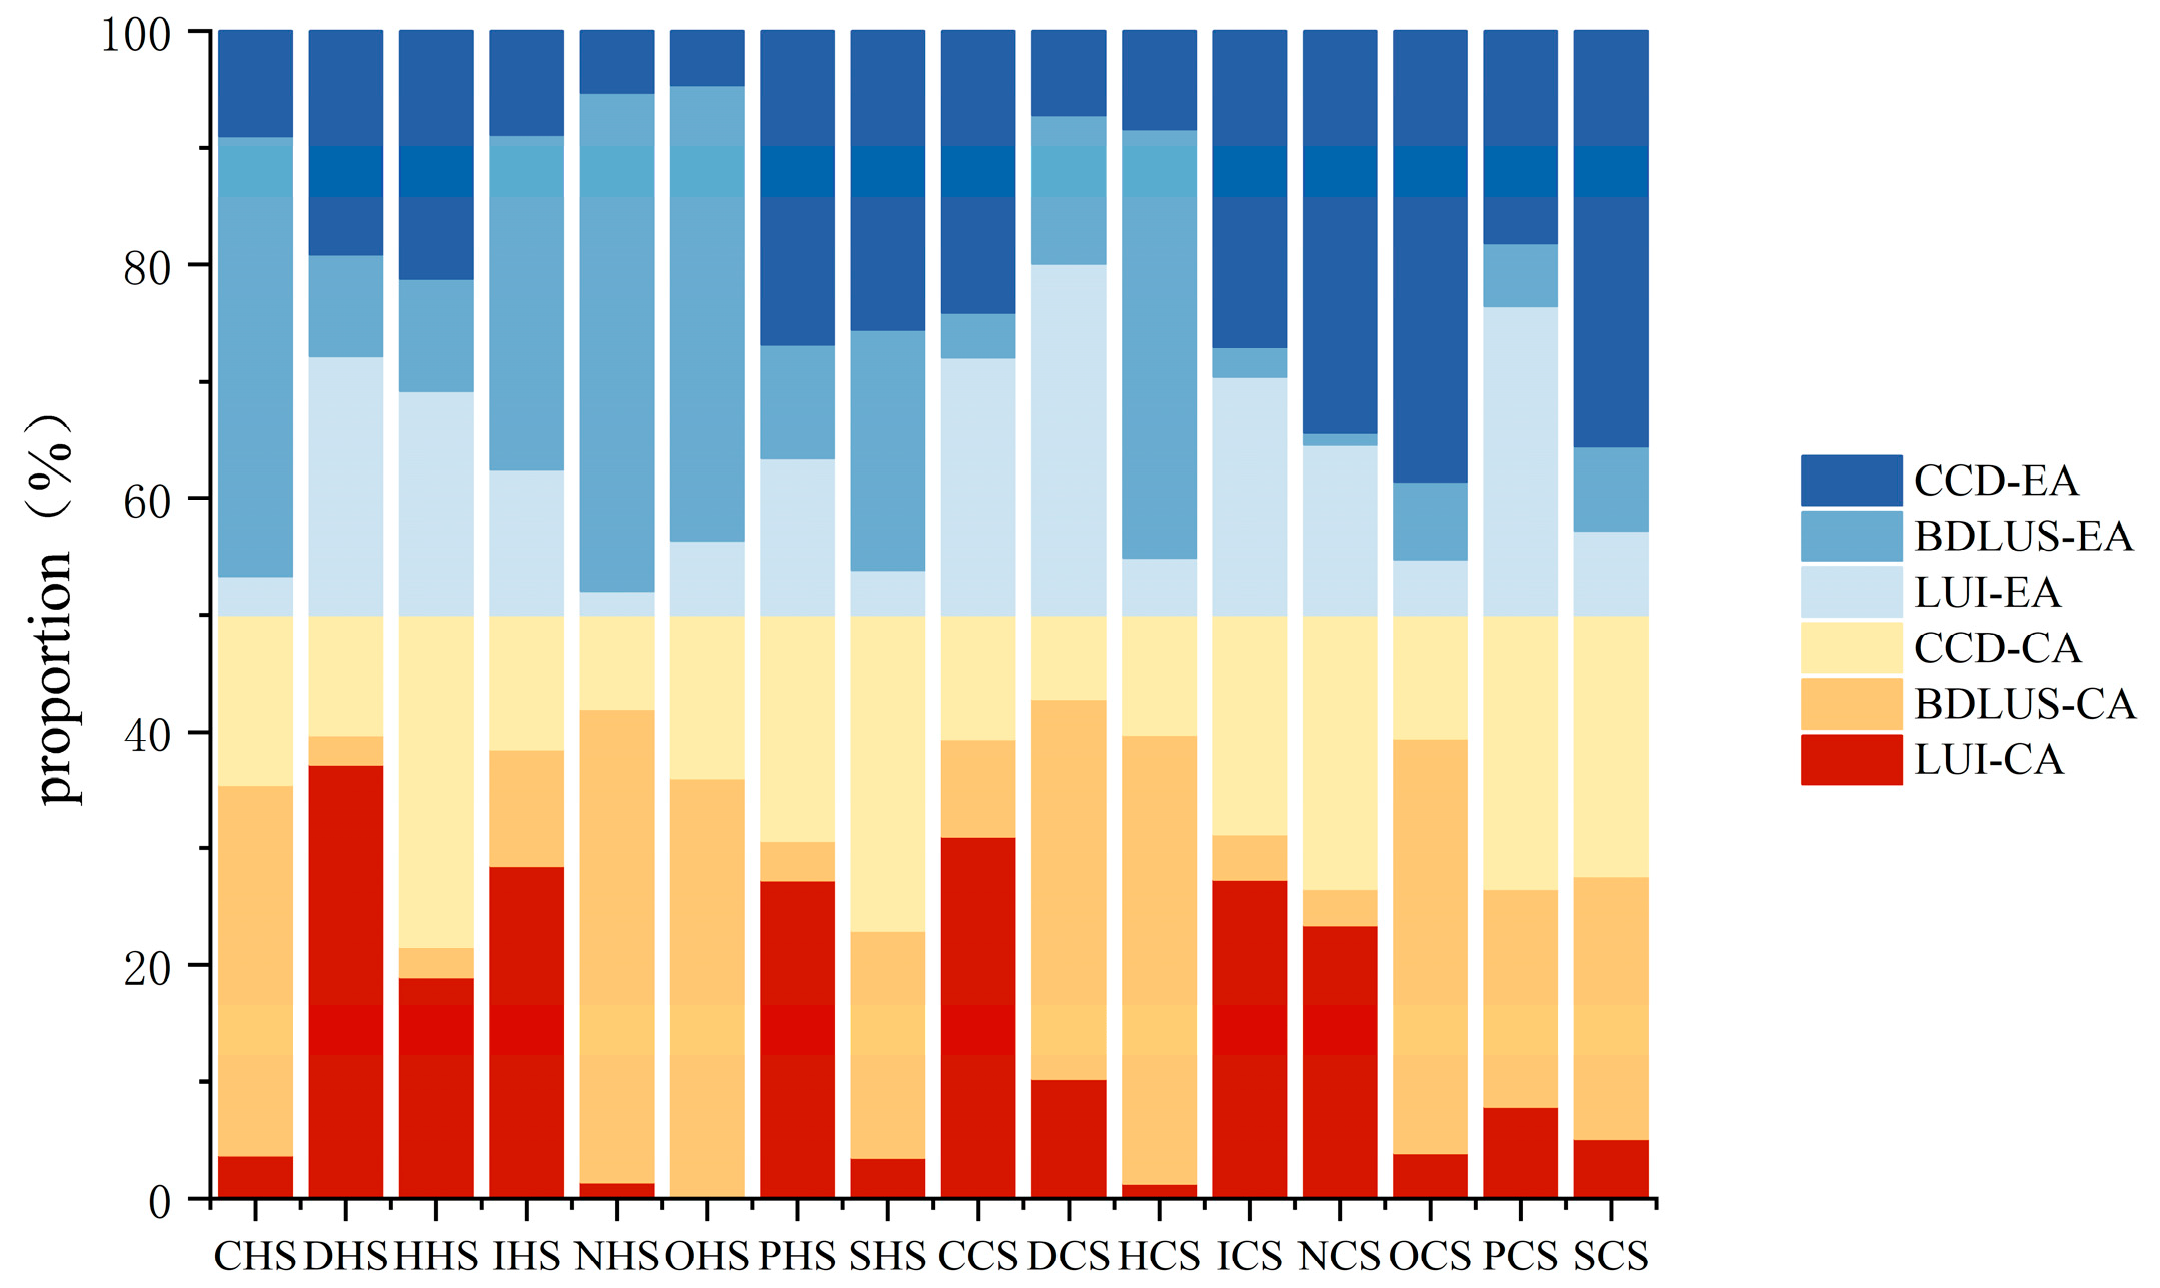
The research area is located in the southwestern part of China, surrounded by the Tibetan Plateau, Daba Mountains, Huaying Mountains, and Yungui Plateau. Influenced by the tectonic movements at the eastern edge of the Tibetan Plateau, it has formed a typical basin-mountain landform system. The western Chengdu Plain serves as the main agricultural base, the central Sichuan hilly area supports the transitional function between urban and rural areas, and the eastern parallel ridge valleys constitute an ecological barrier. The main stream of the Yangtze River runs through the entire region, with tributaries such as the Min River and Tuo River forming a dense water network, shaping the landform pattern of “three rivers converging and mountains surrounding the basin” [33]. This study is based on DEM data and takes into account the topographical features of the study area. To ensure administrative integrity, data integration is conducted at the county and district levels as the smallest unit. The study area is divided into the central basin area of the research area (Central area of the research area, CA) with an average elevation of 992.13 m and the mountainous hilly area at the edge of the research area (Edge of the research area, EA) with an average elevation of 2071.58 m, as shown in Figure 1.
The Chengdu–Chongqing Economic Circle primarily consists of agricultural land and ecological land, including forest, grass, and water areas, with the remainder being urban settlement land and unused land. In 2022, the spatial area proportions of these four categories were 56.35%, 37.02%, 5.00%, and 1.63%, respectively. Compared to the year 2000, the expansion of construction land was 1.94%, mainly encroaching upon arable land resources (a decrease of 2.32%), confirming the “arable land-construction land” exchange feature during the process of urbanization [34]. The study area, which accounts for less than 2% of China’s land area, contributes 6.5% of the GDP, yet its land development intensity exhibits characteristics of “double core polarization and gradient decay.” Through the LUI-BDLUS coupling mechanism analysis, it can help optimize the three-tier spatial structure of “central cities-metropolitan areas-urban agglomerations” and contribute to the establishment of a new pattern of coordinated development.

2.2. Data Sources and Processing

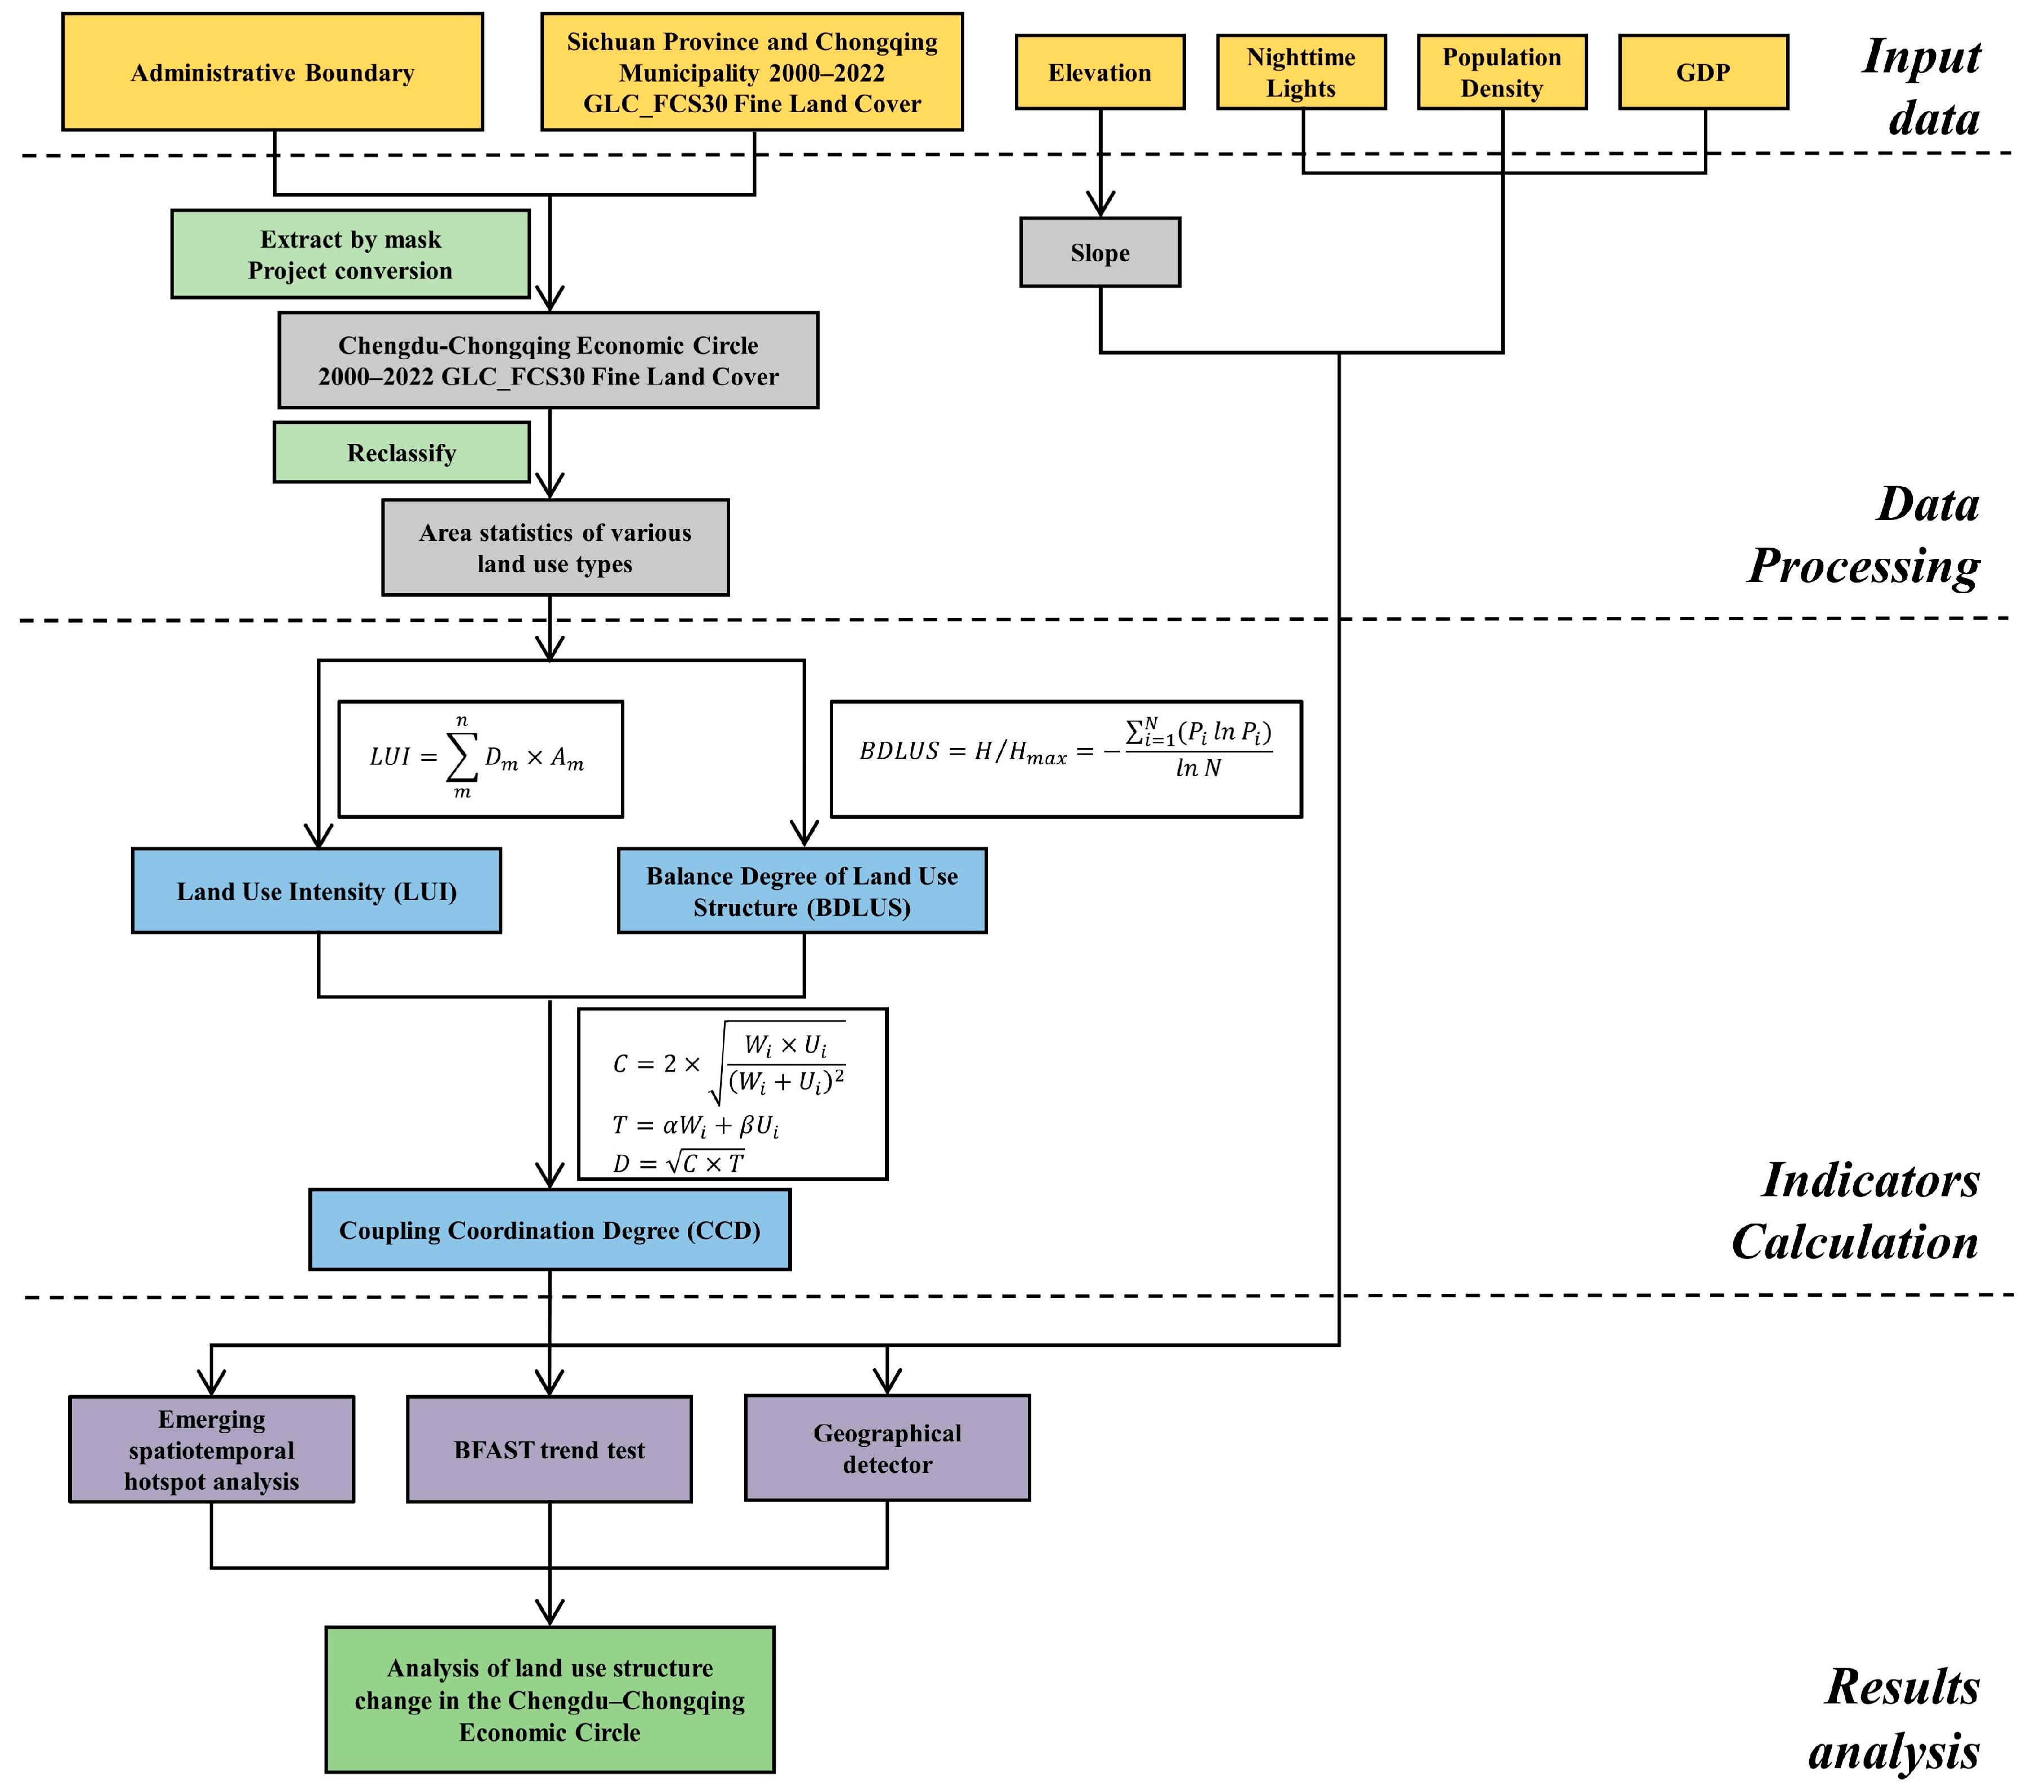
This study primarily used data from land use, human activities, terrain, and administrative boundaries (Table 1). To meet the requirements of data analysis, various data types were unified to the Albers projection coordinate system, and the raster resolution was uniformly resampled to the mainstream scale for land use change analysis 1 km × 1 km, balancing data processing efficiency and spatial detail representation, totaling 187,419 grids [25,35]. On this basis, land use data was reclassified using the Google Earth Engine (GEE) cloud platform. This study utilized the GLC_FCS30 (Global Land Cover with Fine Classification System at 30 m) land cover data from 2000 to 2022 [36]. As the world’s first dynamic land cover product with a 30 m resolution that integrates continuous change detection, it covers the period from 1985 to 2022 and employs a detailed classification system with 35 categories. Based on continuous change detection methods, a locally adaptive updating model, and a spatiotemporal optimization algorithm using dense time series Landsat imagery, it achieves an overall classification accuracy of 80.88%. The relationship between specific land cover types and land use types is shown in Table 2. In this study, the dataset was used for the calculation of the LUI indicator and the BDLUS indicator. We generated slope data as terrain data using elevation data on the ArcGIS Pro 3.0 platform and combined it with human activity data to serve as input factors for the geographic detector quantitative analysis.

2.3. Methodology

The overall workflow of the research is shown in Figure 2.

2.3.1. Land Use Indicators Calculation

(1)
Land Use Intensity indicator (LUI)
This study built a multi-scale land use intensity quantification model based on the response characteristics of land cover types to human activity disturbances, referencing the grading system proposed by Zhuang et al. [37,38]. According to the ability of ecosystems to maintain natural balance, GLC_FCS30 land cover data was categorized into four levels of intensity gradient (Table 3), with unused land exhibiting the highest stability (LUI = 1) and urban settlement land experiencing the greatest ecological disturbance (LUI = 4).
The land use intensity indicator of spatial units was calculated using a weighted sum method:
L U I = m n D m × A m
In the formula: LUI [ 1 ,   4 ] , which represents the intensity of human activity’s intervention in natural systems; n is the total number of land cover types; D m   is the grading index of the m -th type of land; A m is the proportion of the m -th type of land area. By introducing area weight parameters, this model can effectively quantify the comprehensive development intensity under heterogeneous landscape patterns.
(2)
Balance Degree of Land Use Structure indicator (BDLUS)
Based on Shannon’s information entropy theory [39], this study introduced land use structure information entropy to characterize the diversity and balance of regional land use types. To mitigate the impact of differences in the number of land use types on the comparability of entropy values, we further introduced the balance degree of land use structure indicator (BDLUS):
B D L U S = H / H m a x = i = 1 N ( P i ln P i ) / ln N
In the formula: H is the information entropy of land use structure;   P i is the proportion of the area of the i -th land use type to the total land area of the region; N is the total number of land use types. When the areas of all types are equal, the information entropy reaches its theoretical maximum value H m a x = ln N , reflecting a state of complete balance in land use structure. This indicator quantifies the balance of land use structure by normalization, scaling it to the range of [0, 1]. When BDLUS = 1 , it indicates that the distribution of land area among the various types is completely balanced; when BDLUS = 0 , it indicates the existence of only a single land use type. This study effectively characterized the dynamic balance features and spatial heterogeneity of regional land use structure through the ratio of the actual entropy value H to the theoretical maximum entropy H m a x .
(3)
Coupling Coordination Degree indicator (CCD)
This study quantitatively evaluated the synergistic development relationship between LUI and BDLUS using a coupling coordination degree model. First, LUI and BDLUS were standardized to eliminate dimensional differences, and then, based on the binary system coupling model [40], the interaction intensity between LUI and BDLUS was calculated:
C = 2 × W i × U i / W i + U i 2 T = α W i + β U i D = C × T
In the formula, C is the degree of coupling, where C [ 0, 1 ] . A larger value indicates a more significant interaction between the two systems. W i and U i are the standardized LUI and BDLUS, respectively. Next, a weight coefficient was introduced to represent the contribution of the two systems [41]. T is the comprehensive coordination index, and given that LUI and BDLUS are equally important for regional sustainable development, we took α = β = 0.5 . Finally, the coupling degree and coordination indicator were integrated to represent the level of coordinated development between the systems [42]. D indicates the degree of interaction between the systems, where D [ 0, 1 ] , and a value closer to 1 signifies optimal collaborative development between the two systems.
(4)
Computing platform
This study used Google Earth Engine (GEE) as the core computing platform. This platform is a globally leading geospatial analysis system built on Google’s cloud infrastructure, effectively supporting high-precision gridded calculations for LUI, BDLUS, and CCD indicators. It addresses the data storage and computational bottlenecks faced by traditional methods in cross-scale and long-term temporal analyses [43].

2.3.2. Emerging Spatiotemporal Hotspot Analysis

Emerging spatiotemporal hotspot analysis is a geographic computing method that integrates spatial statistics with temporal analysis. Its core principle lies in the collaborative application of spatiotemporal cube modeling and the Getis-Ord Gi* statistical model, revealing the dynamic evolution patterns of geographic phenomena across temporal and spatial dimensions. The algorithm integrates a two-dimensional spatial grid with a one-dimensional time series to create a three-dimensional data structure (spatiotemporal cube). It uses the spatial grid as the basic unit and the time step as the dynamic division criterion, quantifying local spatial autocorrelation to identify statistically significant (p < 0.05) hotspots (high-value clusters) and cold spots (low-value clusters). Its advantage lies in not only being able to capture spatial heterogeneity but also in tracking the migration trajectory of hotspots/cold spots through time series analysis, providing a dynamic analytical framework for the study of the coupling mechanism between land use intensity (LUI) and balance degree of land use structure (BDLUS).
(1)
Spatiotemporal cube modeling
By integrating two-dimensional geographic spatial coordinates with one-dimensional time series, a three-dimensional spatiotemporal data structure has been constructed, achieving visual representation and quantitative analysis of the spatiotemporal evolution of geographic phenomena. This model takes spatial grids as the basic unit and divides dynamic sequences based on time intervals, effectively capturing the temporal evolution characteristics of spatial patterns [44,45].
This study, based on 23 years of LUI and BDLUS data, constructed a three-dimensional spatiotemporal cube containing 4.32 × 10⁶ grid cells, systematically characterized the coupled evolution process of LUI and BDLUS with a time step interval of one year.
(2)
Getis-Ord Gi* spatiotemporal statistical model
Emerging spatiotemporal hotspot analysis uses the Getis-Ord Gi* statistic to quantify local spatial autocorrelation features through a spatial weighting matrix [46], identifying statistically significant hotspot (high-value clustering) and cold spot (low-value clustering) areas [44,47]. The computational model is as follows:
G i * = j = 1 n w i j x j x ¯ j = 1 n w i j S n j = 1 n w i j 2 ( j = 1 n w i j ) 2 / n 1
x ¯ = j = 1 n x j / n
S = j = 1 n x j 2 / n x ¯ 2
In the formula, x j is the attribute values of spatial and temporal neighboring elements, J is the spatial–temporal weight between elements i and j , and n is the total number of neighboring elements. When the result of G i *   is positive and significant, a higher value indicates that LUI, BDLUS, and CCD are closer to high values (hotspots); conversely, when G i *   is negative and significant, a lower value indicates that LUI, BDLUS, and CCD are closer to low values (cold spots). This method not only identifies spatial heterogeneity but also reveals the dynamic migration patterns of hotspots and cold spots through time series analysis.

2.3.3. BFAST Test

BFAST is an iterative algorithm that decomposes time series into trend components, seasonal components, and residual components, as well as a method for detecting structural changes in trend and seasonal components. It identifies breakpoints in the trend through an iterative optimization process, thereby capturing the nonlinear change characteristics in the time series [30,48]. It is assumed that an additive decomposition model can iteratively derive a piecewise linear model that corresponds to the trend [49], and the algorithmic form of this model is:
Y t = T t + S t + e t   ,   t = 1 , , n
In the formula, Y t is the value observed at time t , T t   is the trend component, S t is the seasonal component, and e t   is the residual component. Given that the LUI, BDLUS, and CCD time series analyzed in this study all have annual resolution data and do not contain seasonal components, this study applied the BFAST method to annual LUI, BDLUS, and CCD time series analyses without seasonal characteristics, considered only the trend component and the residual component, and employed different structural change tests to detect trends and abrupt changes. If any of the tests indicated significant structural change (p < 0.05), it could be identified as a trend breakpoint, thus extending the traditional application of the BFAST algorithm beyond seasonal data.
To further demonstrate the effectiveness of BFAST in detecting changes in LUI, BDLUS, and CCD, this study focused on the characteristics of trend change points and the trends before and after these points. A classification analysis of the pixel calculation results was conducted, ultimately categorizing the change trend types detected by BFAST into six categories [50,51], as shown in Table 4.

2.3.4. Geographical Detector

This study employed the Geographic Detector model proposed by Wang and Xu [52] to reveal the driving mechanisms of LUI, BDLUS, and CCD by quantifying spatial differentiation. The core indicator of the model was the differentiation degree q value, which was calculated using the following expression:
q = 1 N σ 2 1 · h = 1 L N h σ h 2
In the formula, q [ 0, 1 ] represents the explanatory power of the independent variable on the spatial heterogeneity of the dependent variable; a larger q value indicates a more significant spatial differentiation effect of the driving factor. L is the number of classification levels of the variables; N h   and N is the number of sample units in the h -th sub-region and the entire region, respectively; σ h 2   and   σ 2   correspond to the variance of the sub-region and the entire region.
To analyze the mechanism of multi-factor interactions, an interaction detector was introduced to analyze the nonlinear relationships between variables (Table 5). By calculating the explanatory power q ( X 1 X 2 ) after the superposition of two factors and comparing it with the individual factors q X 1 , q X 2 , the type of interaction can be determined:
This study selected two major driving factor categories: terrain and geomorphology, and human activities, to systematically analyze their impacts on the temporal and spatial differentiation of LUI, BDLUS, and CCD [53]. Among these, terrain and geomorphic factors include elevation and slope: elevation is characterized by DEM data to represent the vertical differentiation patterns of the surface, reflecting the characteristics of topographical relief in the region; slope describes the complexity of the surface form, directly influencing land development suitability and ecological sensitivity. Together, these two factors constitute the constraints of the natural substrate. Human activity factors encompass multiple-dimensional indicators: the nighttime light index quantifies regional economic development intensity through satellite data; the spatial distribution kilometer grid dataset of China’s GDP uses a multi-factor weight distribution method to extend GDP data, based on administrative regions as basic statistical units, to grid cells [54,55]; population density, on the other hand, reveals the intensity of human activity per unit area through spatially gridded data, forming a multidimensional analysis of human-driven forces [56]. This factor system takes into account natural background limitations and human interference effects, providing a multi-scale analytical framework to reveal the coupling mechanism of LUI-BDLUS. In the data processing stage, the Natural Breaks Classification Method (Jenks) was used to standardize and discretize data from the years 2000, 2010, and 2020, effectively retaining the original data distribution characteristics. The Natural Breaks Classification Method (Jenks) was then applied again to reclassify each driving factor into five levels. Based on a 1 km × 1 km grid system, central point values were extracted, while invalid values were removed to ensure the continuity of spatial analysis and the comparability of data.

3. Results

3.1. Analysis of the Spatial and Temporal Characteristics of Land Use

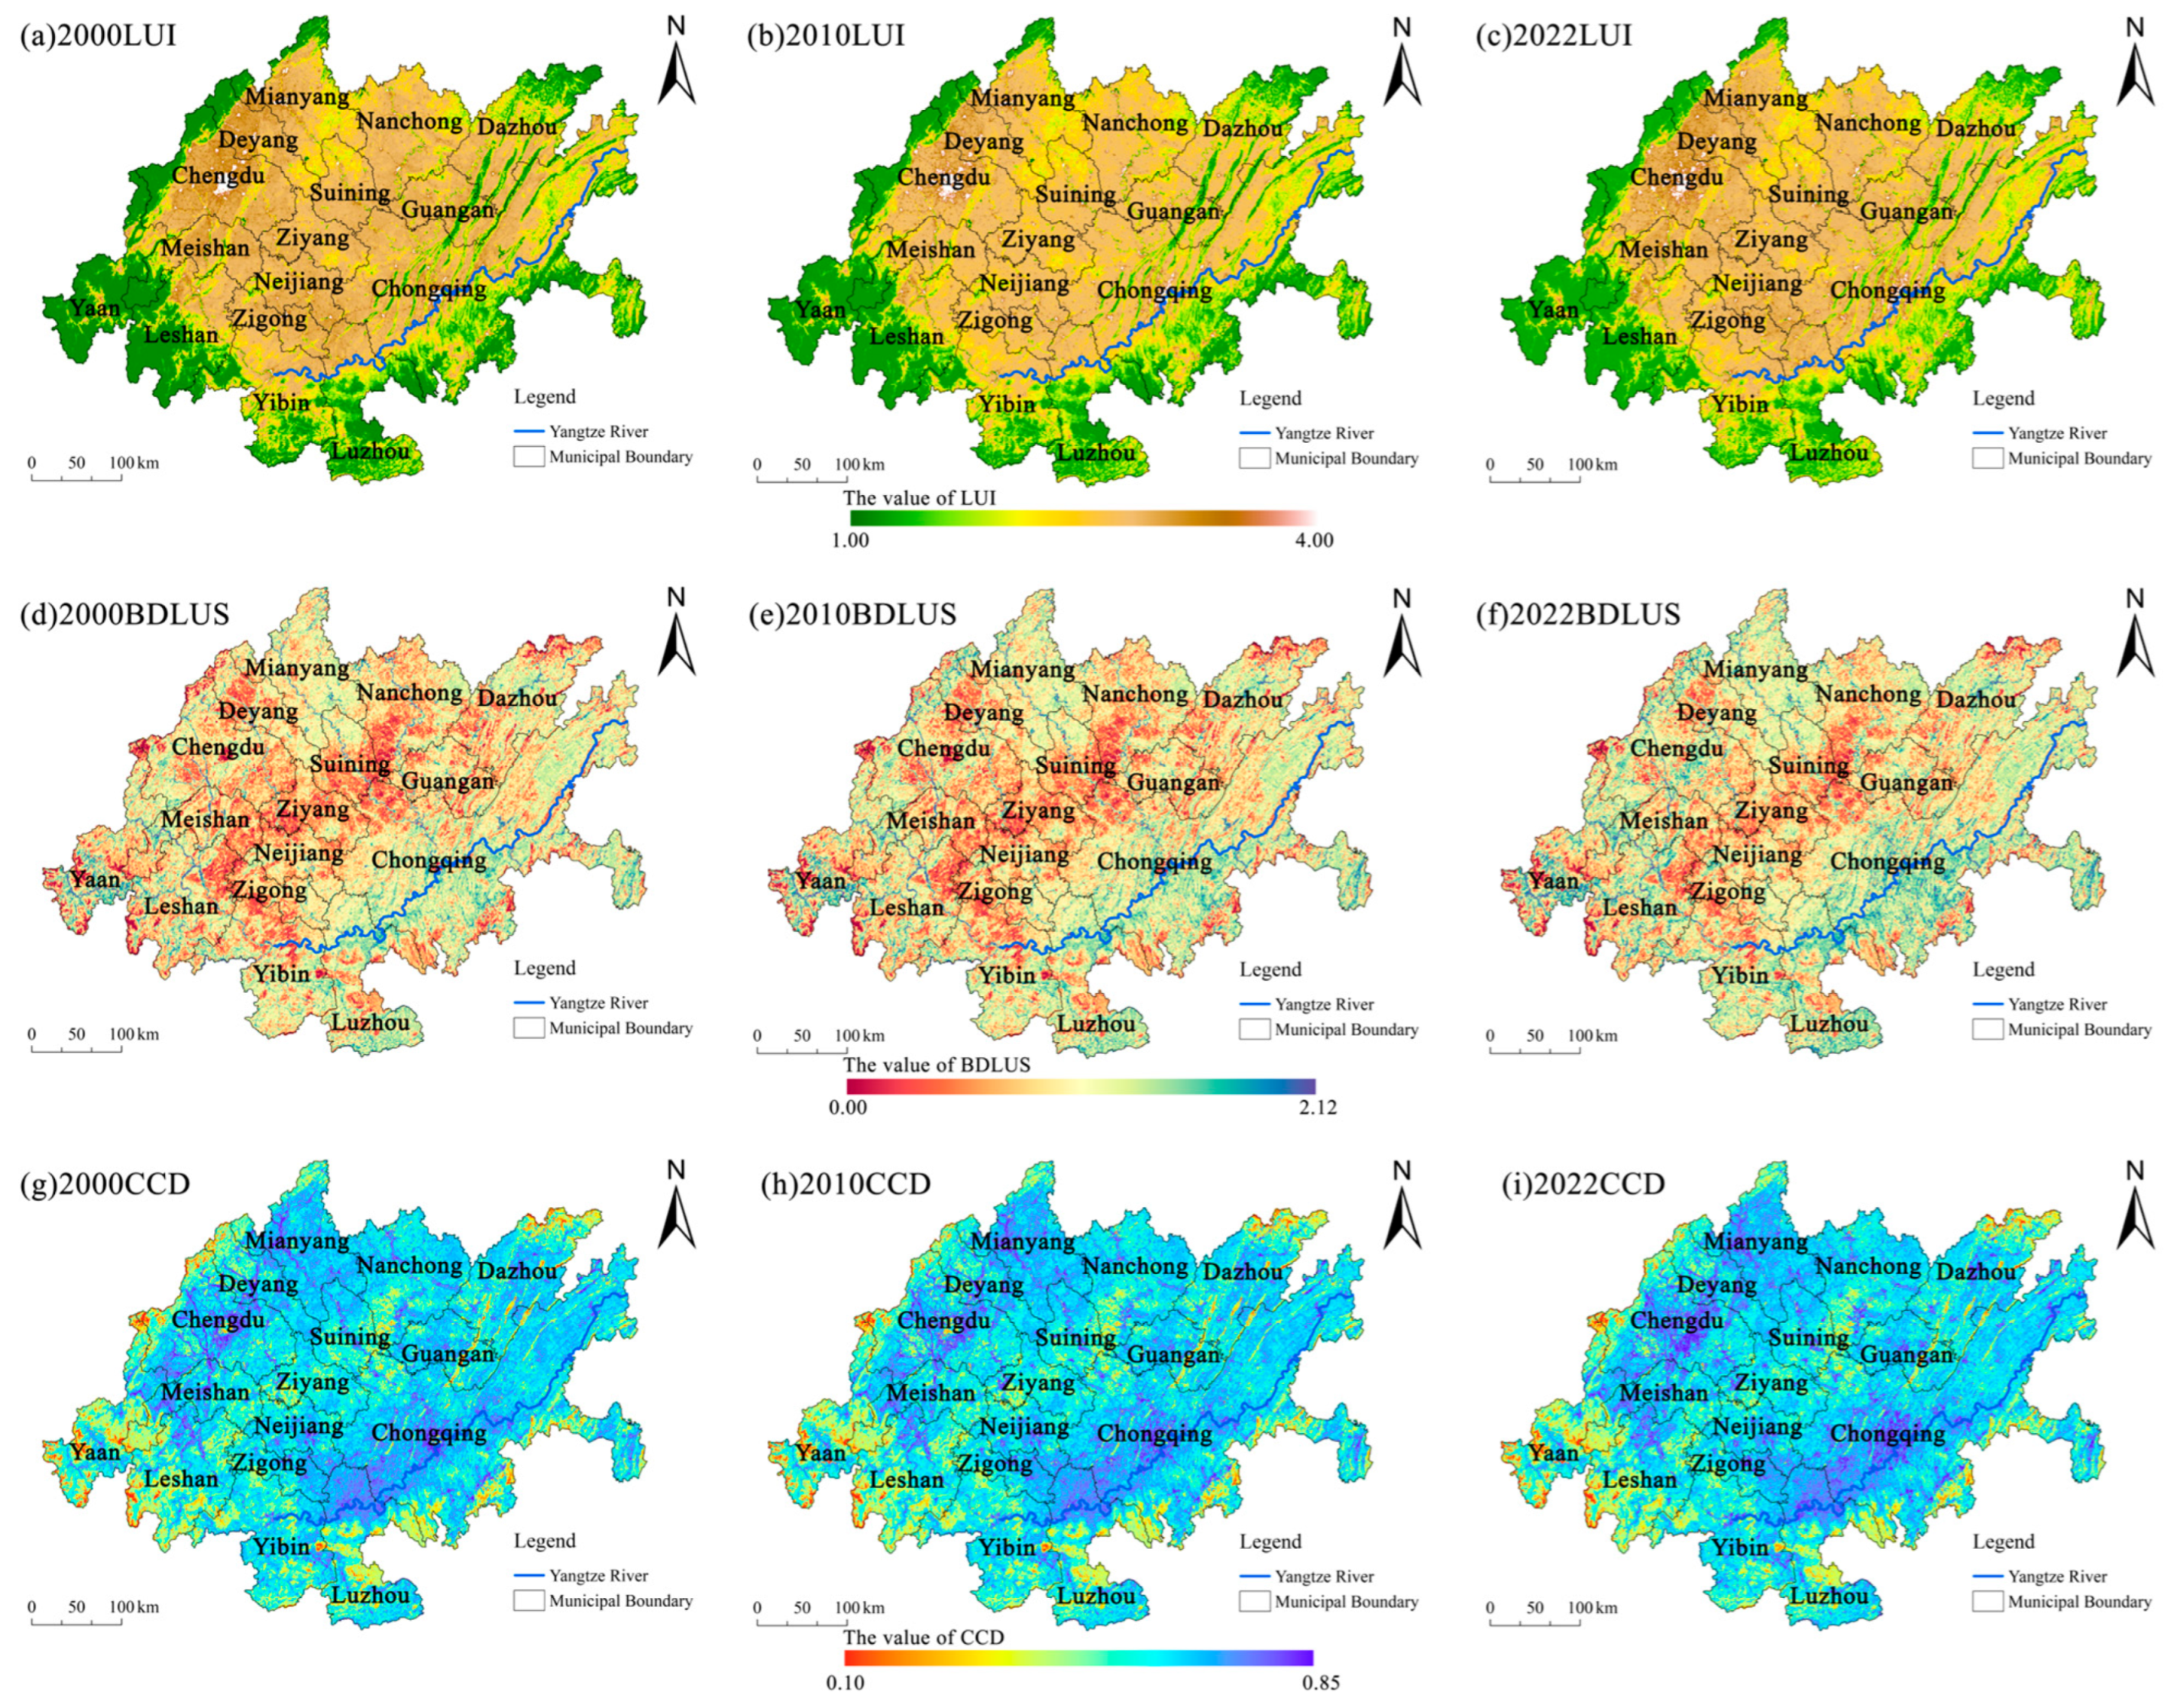
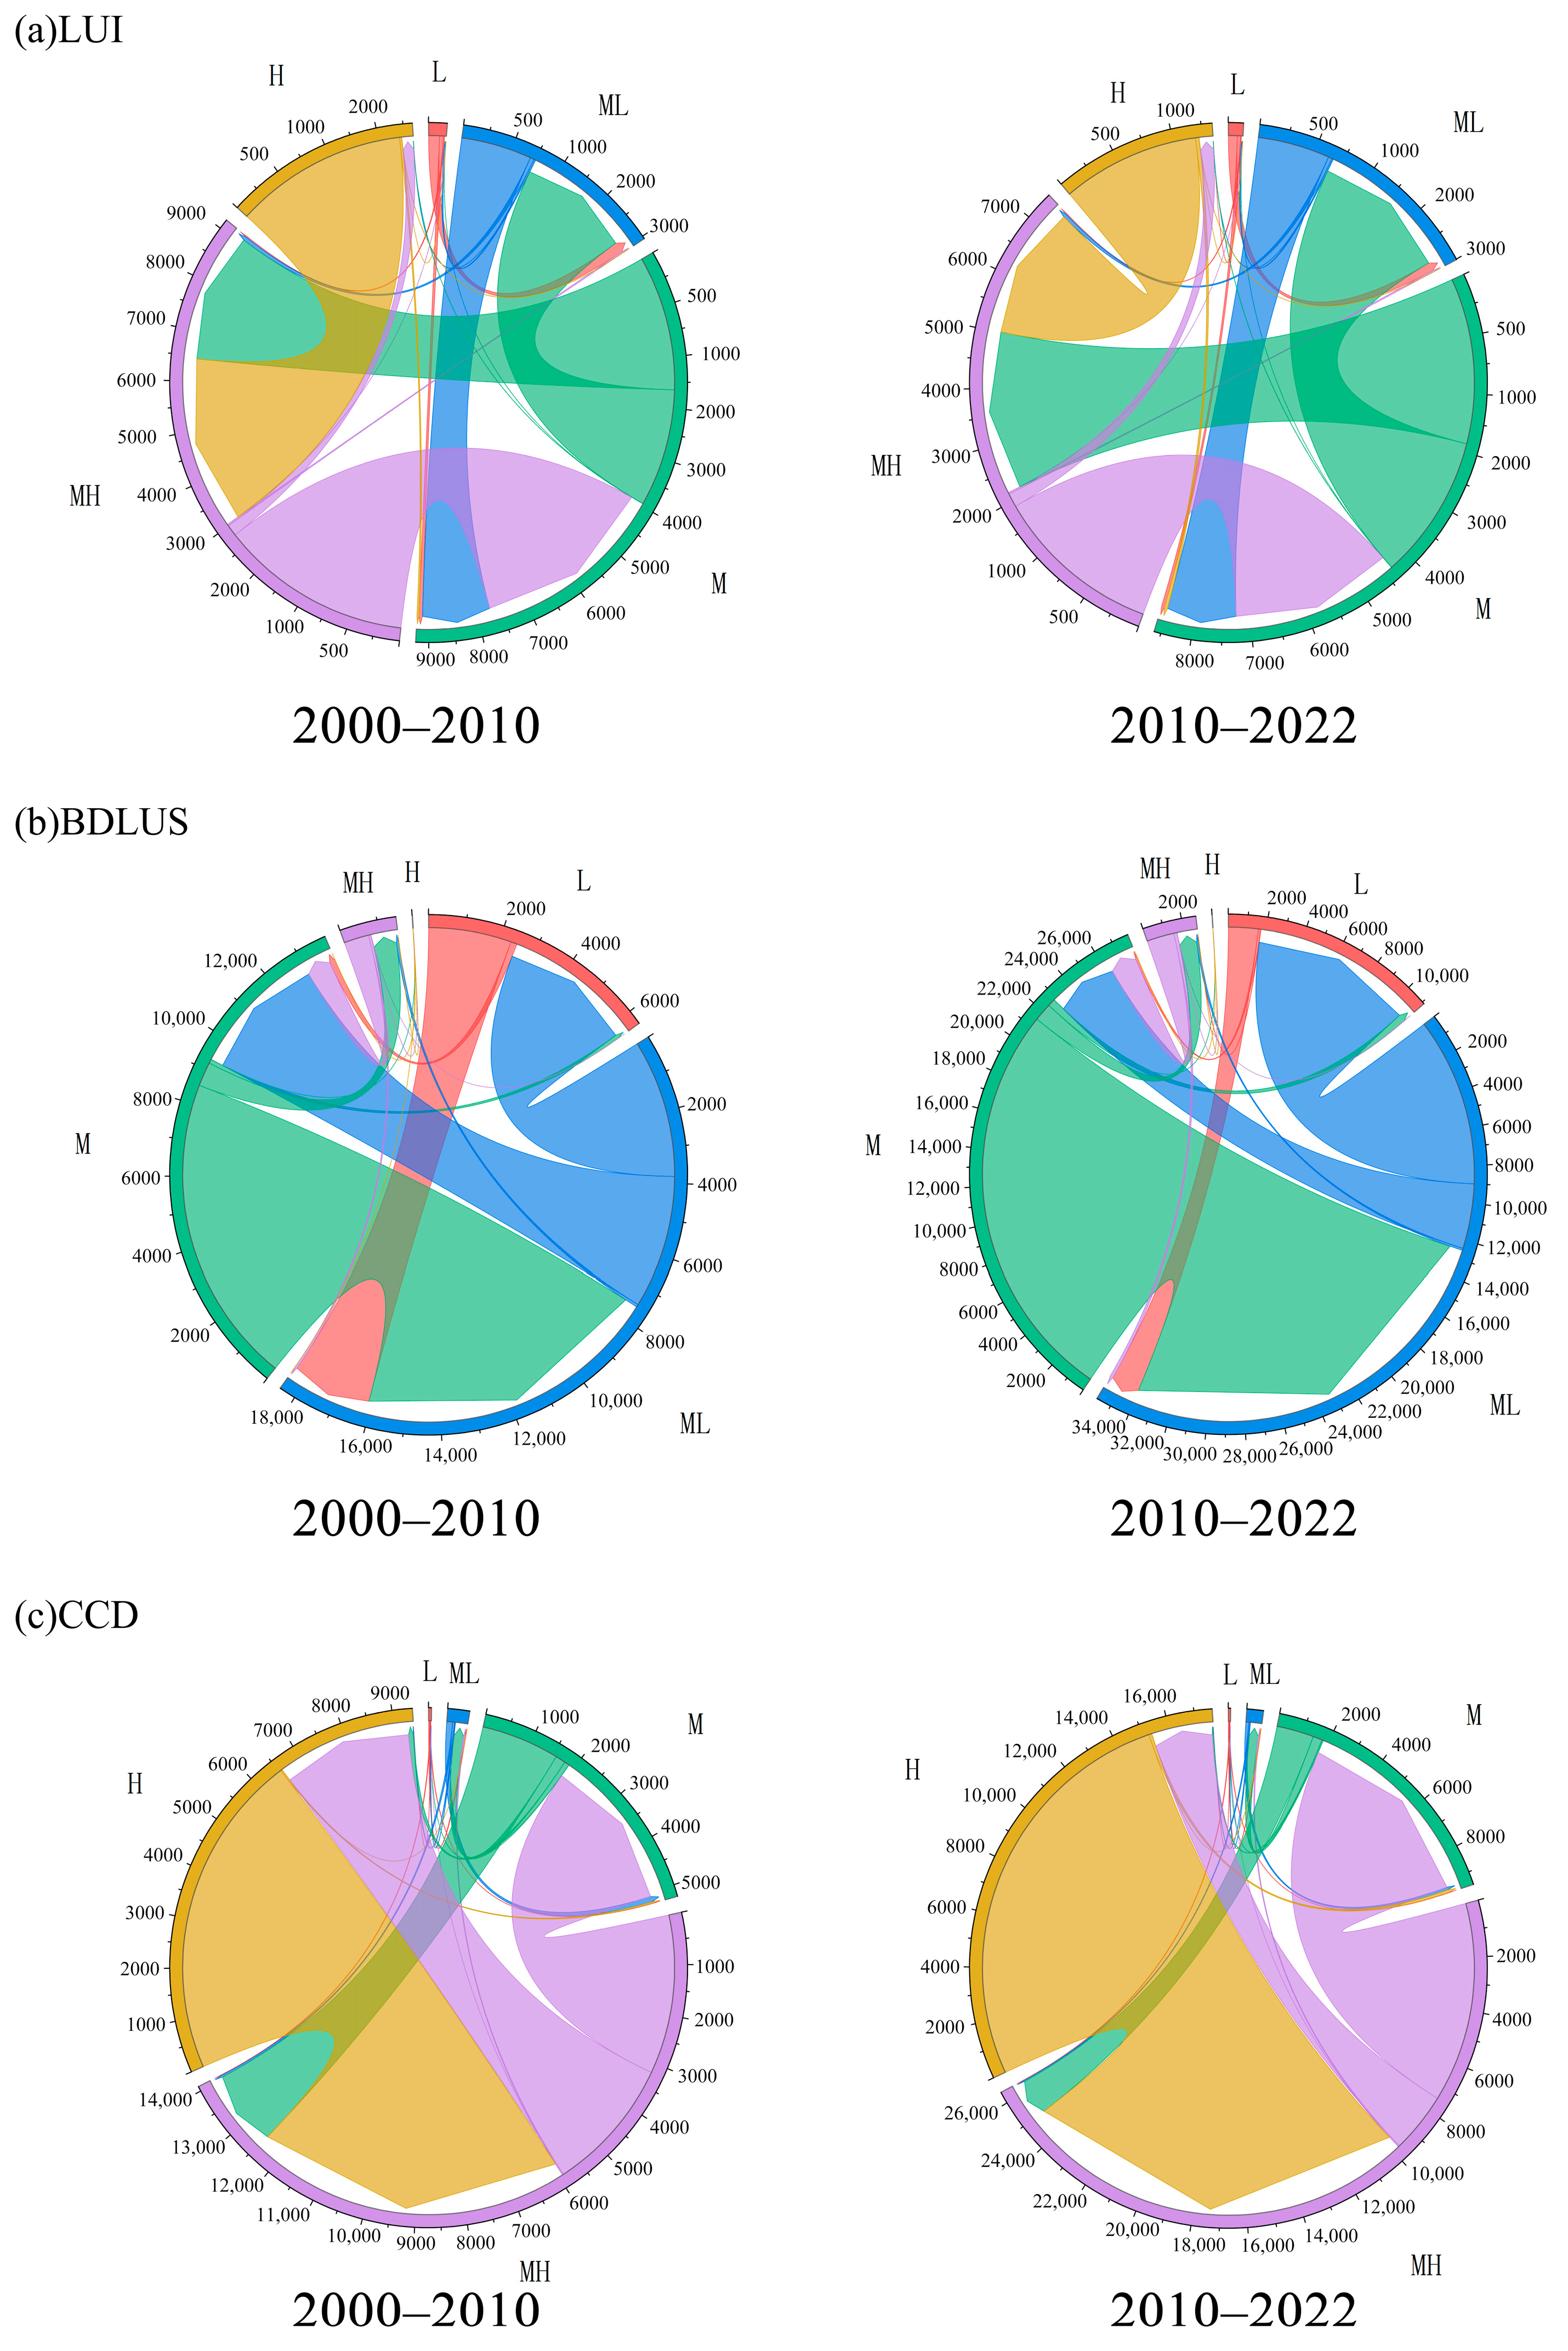
Based on the spatiotemporal evolution analysis of LUI, BDLUS, and CCD in the Chengyu Region’s Twin City Economic Circle from 2000 to 2020 (Figure 3), the study found that all three indicators exhibited significant spatiotemporal heterogeneity characteristics. To quantify their dynamic evolution patterns and reveal the mechanisms of spatial differentiation, this research employed the Equal Interval Classification method to grade the three sets of indicators into five levels (Table 6). The method eliminates the impact of dimensional differences on the comparability of multiple indicators by standardizing the threshold range, while also taking into account the continuity of spatial patterns and the abrupt characteristics of hierarchical transitions [57]. Statistical data analysis indicates (Figure 4): (1) The area of LUI enhancement reached 7667.85 km2, accounting for 63.28% of the total area of change. Notably, the adjacent two levels of transition from medium-low intensity to high intensity showed significant growth. Phase observations indicate that the growth rate of LUI from 2000 to 2010 (with enhanced area accounting for 67.39%) was significantly higher than that from 2010 to 2020 (54.47%), confirming the ongoing urbanization process in the Chengdu–Chongqing Economic Circle. This trend is coupled with the leap in the total economic output of the Chengdu–Chongqing region, which rose from 6.3 trillion yuan in 2019 to 7.8 trillion yuan in 2022, reflecting a positive correlation between land development intensity and economic growth. (2) The enhanced area of BDLUS reached 30,190.34 km2, accounting for 82.22% of the area of change, predominantly shifting from a medium-low degree of coordination to a medium degree. The growth rate from 2010 to 2020 (with the enhanced area accounting for 80.19%) was significantly higher than that of the previous decade (65.75%), indicating an acceleration in the optimization of the regional land use structure, closely related to institutional innovations such as the “moderate separation reform between economic zones and administrative districts” in the Chengdu–Chongqing region. This phenomenon resonates with the strategic deployment to “optimize the layout of major productive forces” outlined in the “Construction Plan Outline for the Chengdu–Chongqing Economic Circle.” (3) Data from 2022 indicates that the core area (the five traditional central districts of Chengdu + six nearby districts + the nine traditional main urban districts of Chongqing) exhibits typical characteristics of a high land use intensity (LUI) (mean > 2.96) and a low balance degree of land use structure (BDLUS) (mean < 0.92). Its land development has entered a stage dominated by high intensity and single function, confirming the high concentration of population and economic elements under the “dual-core leadership” spatial pattern. In contrast, the edge of the economic circle shows areas of low LUI (mean < 2.42) and high BDLUS (mean > 1.01), reflecting a diversity of land use characterized by ecological protection and agricultural dominance, which spatially maps to the region’s “ecological priority” development strategy.
The spatial and temporal pattern of CCD exhibits a binary characteristic of “center stability-edge optimization”: the center area maintains a stable state due to the initial high coordination between LUI and BDLUS (CCD > 0.68); meanwhile, the CCD in the peripheral region experienced a slight decline from 2000 to 2010, followed by a recovery of 4.40% from 2010 to 2020, closely related to the improvement of the regional transportation network, industrial gradient transfer, and other collaborative development measures [58].

3.2. Analysis of Cold and Hot Spot Spatial Patterns

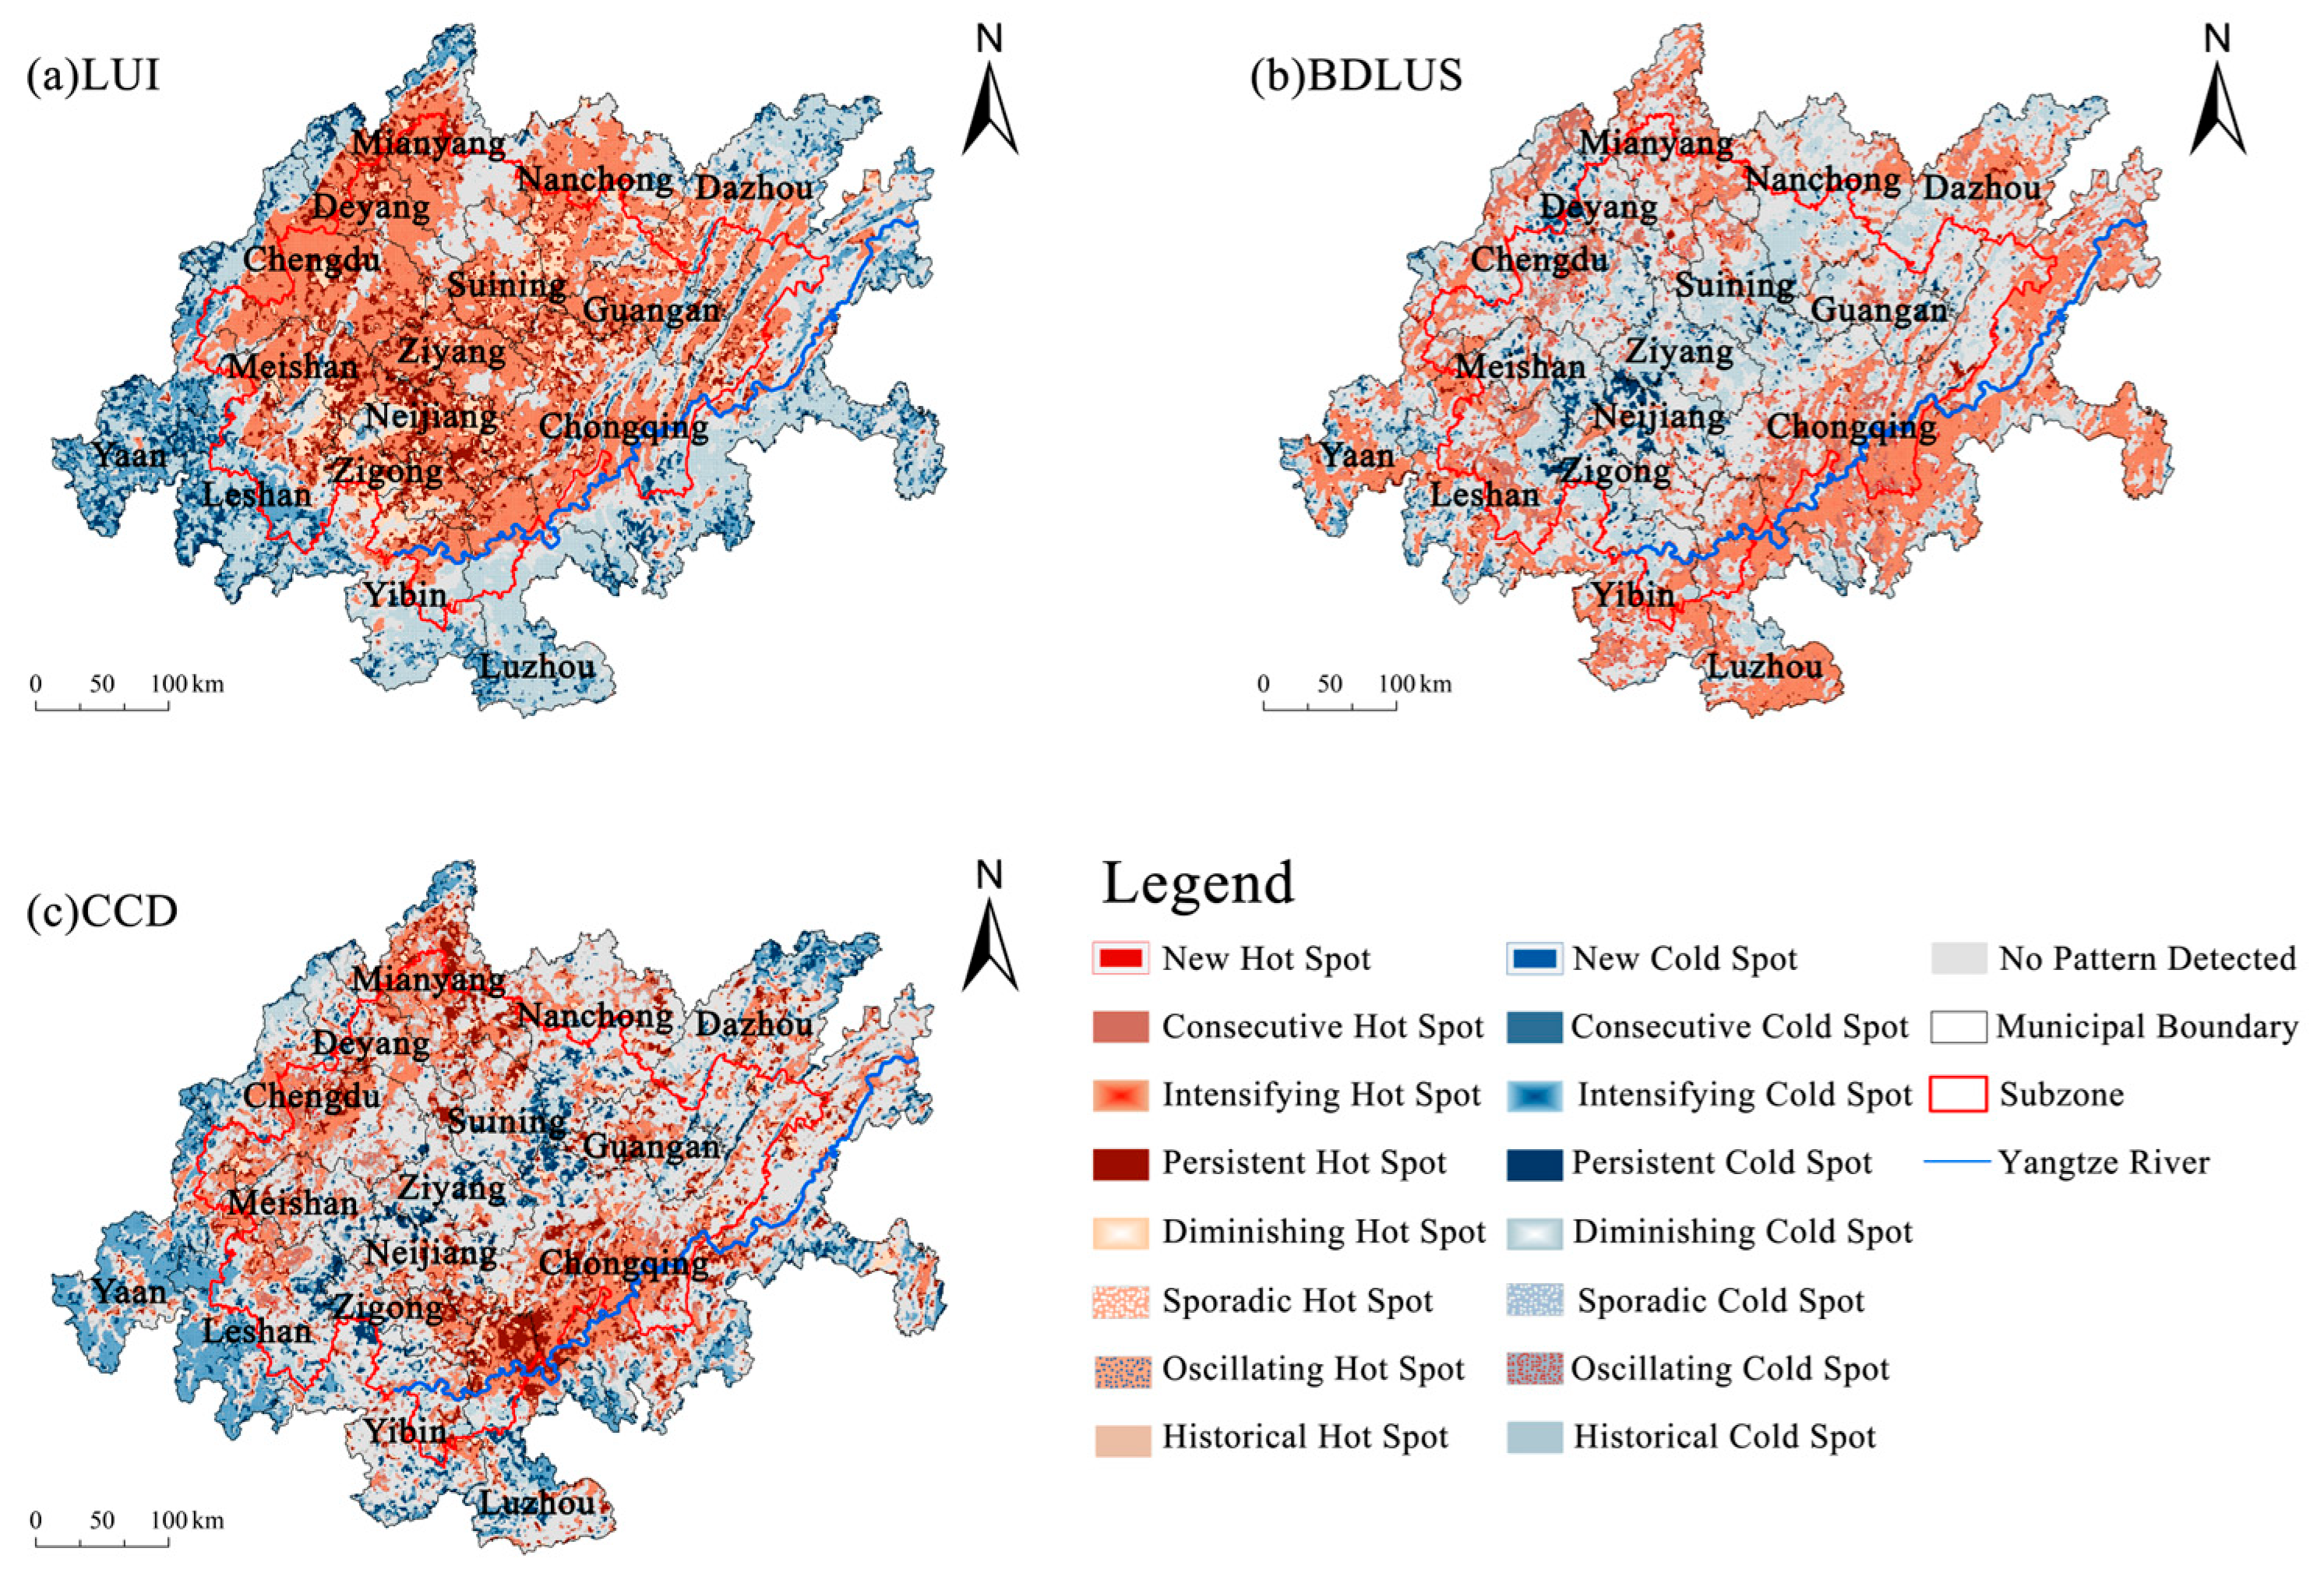
Between 2000 and 2022, the spatiotemporal evolution patterns of LUI, BDLUS, and CCD exhibited significant spatial heterogeneity (Figure 5). Analysis at the global scale shows that the area of hot spot regions for the three types of indicators is significantly larger than that of cold spot regions, demonstrating a “hotspot-dominated” spatial structure. Specifically, the LUI hot zone accounts for 46.94%, while the cold zone accounts for 35.75%; the BDLUS hot zone makes up 38.44%, with the cold zone at 24.27%; the areas of CCD hot and cold zones represent 40.48% and 28.88%, respectively (Figure 6). The hot zone areas for the three indicators exhibit a spatial advantage of 11 to 14 percentage points relative to cold zones, indicating a significant spatial polarization in the processes of urban expansion and the balancing of land use structures. This collectively validates the three-dimensional collaborative mechanism of “land intensive development-structural optimization-system coordination.”

3.2.1. Spatial Dfferentiation Characteristics of the Central Region

The central area of the research area displays a composite differentiation pattern of LUI-BDLUS cold spots and CCD hot spots, along with some cold spots, reflecting the dynamic game relationship between urban expansion and structural optimization:
The LUI hot zone is primarily distributed in the core urban belt of the Sichuan Basin (including nine cities like Chengdu, Mianyang, Deyang, Nanchong, etc.) and the northwest of Chongqing. Most of these areas are classified as intensifying hot spots (27.06%), indicating that the LUI in these regions has shown ongoing enhancement over the years, and this trend is further intensifying. Persistent hot spots (10.75%) are exhibiting an axial expansion trend, particularly evident in the urbanization corridor of the Chengdu Plain. In contrast, diminishing hot spots (7.59%) are concentrated in the core urban area of Chengdu (in districts such as Jinjiang and Jinniu), where the growth rate of LUI has slowed, suggesting that the siphoning effect of the central core city is gradually transitioning to a radiating effect.
The cold zone core of the BDLUS is concentrated in the central transitional area of Chengyu (including five cities such as Nanchong and Guang’an), where the proportion of diminishing cold spots is the highest at 18.81%, indicating a slowdown in the imbalance of land use structure in this region. Persistent cold spots (3.51%) are sparsely distributed among secondary urban nodes, revealing that the structural optimization process in some county units is relatively lagging behind.
The CCD hot zone forms a dual-core structure between the northwest (Chengdu-Deyang-Mianyang metropolitan area) and the southeast (Chongqing main urban area), with the intensifying hot spots accounting for the highest proportion at 15.88%, indicating a sustained strengthening of regional collaborative development effects. Persistent hot spots (12.08%) exhibit a contiguous distribution pattern, demonstrating that the coupling and coordination level of these areas is steadily increasing, validating the spatial spillover effects of coordinated development. Notably, local cold zones (9.80%) are embedded in the boundary area between Nanchong and Suining, reflecting the obstruction phenomenon of resource element flow across administrative boundaries.

3.2.2. Edge Zone Spatial Response Pattern

The edge zone exhibits a reverse response characteristic between the LUI-CCD cold zones and the BDLUS hot zones, highlighting the adaptive adjustments of the human-environment system under the constraints of topography.
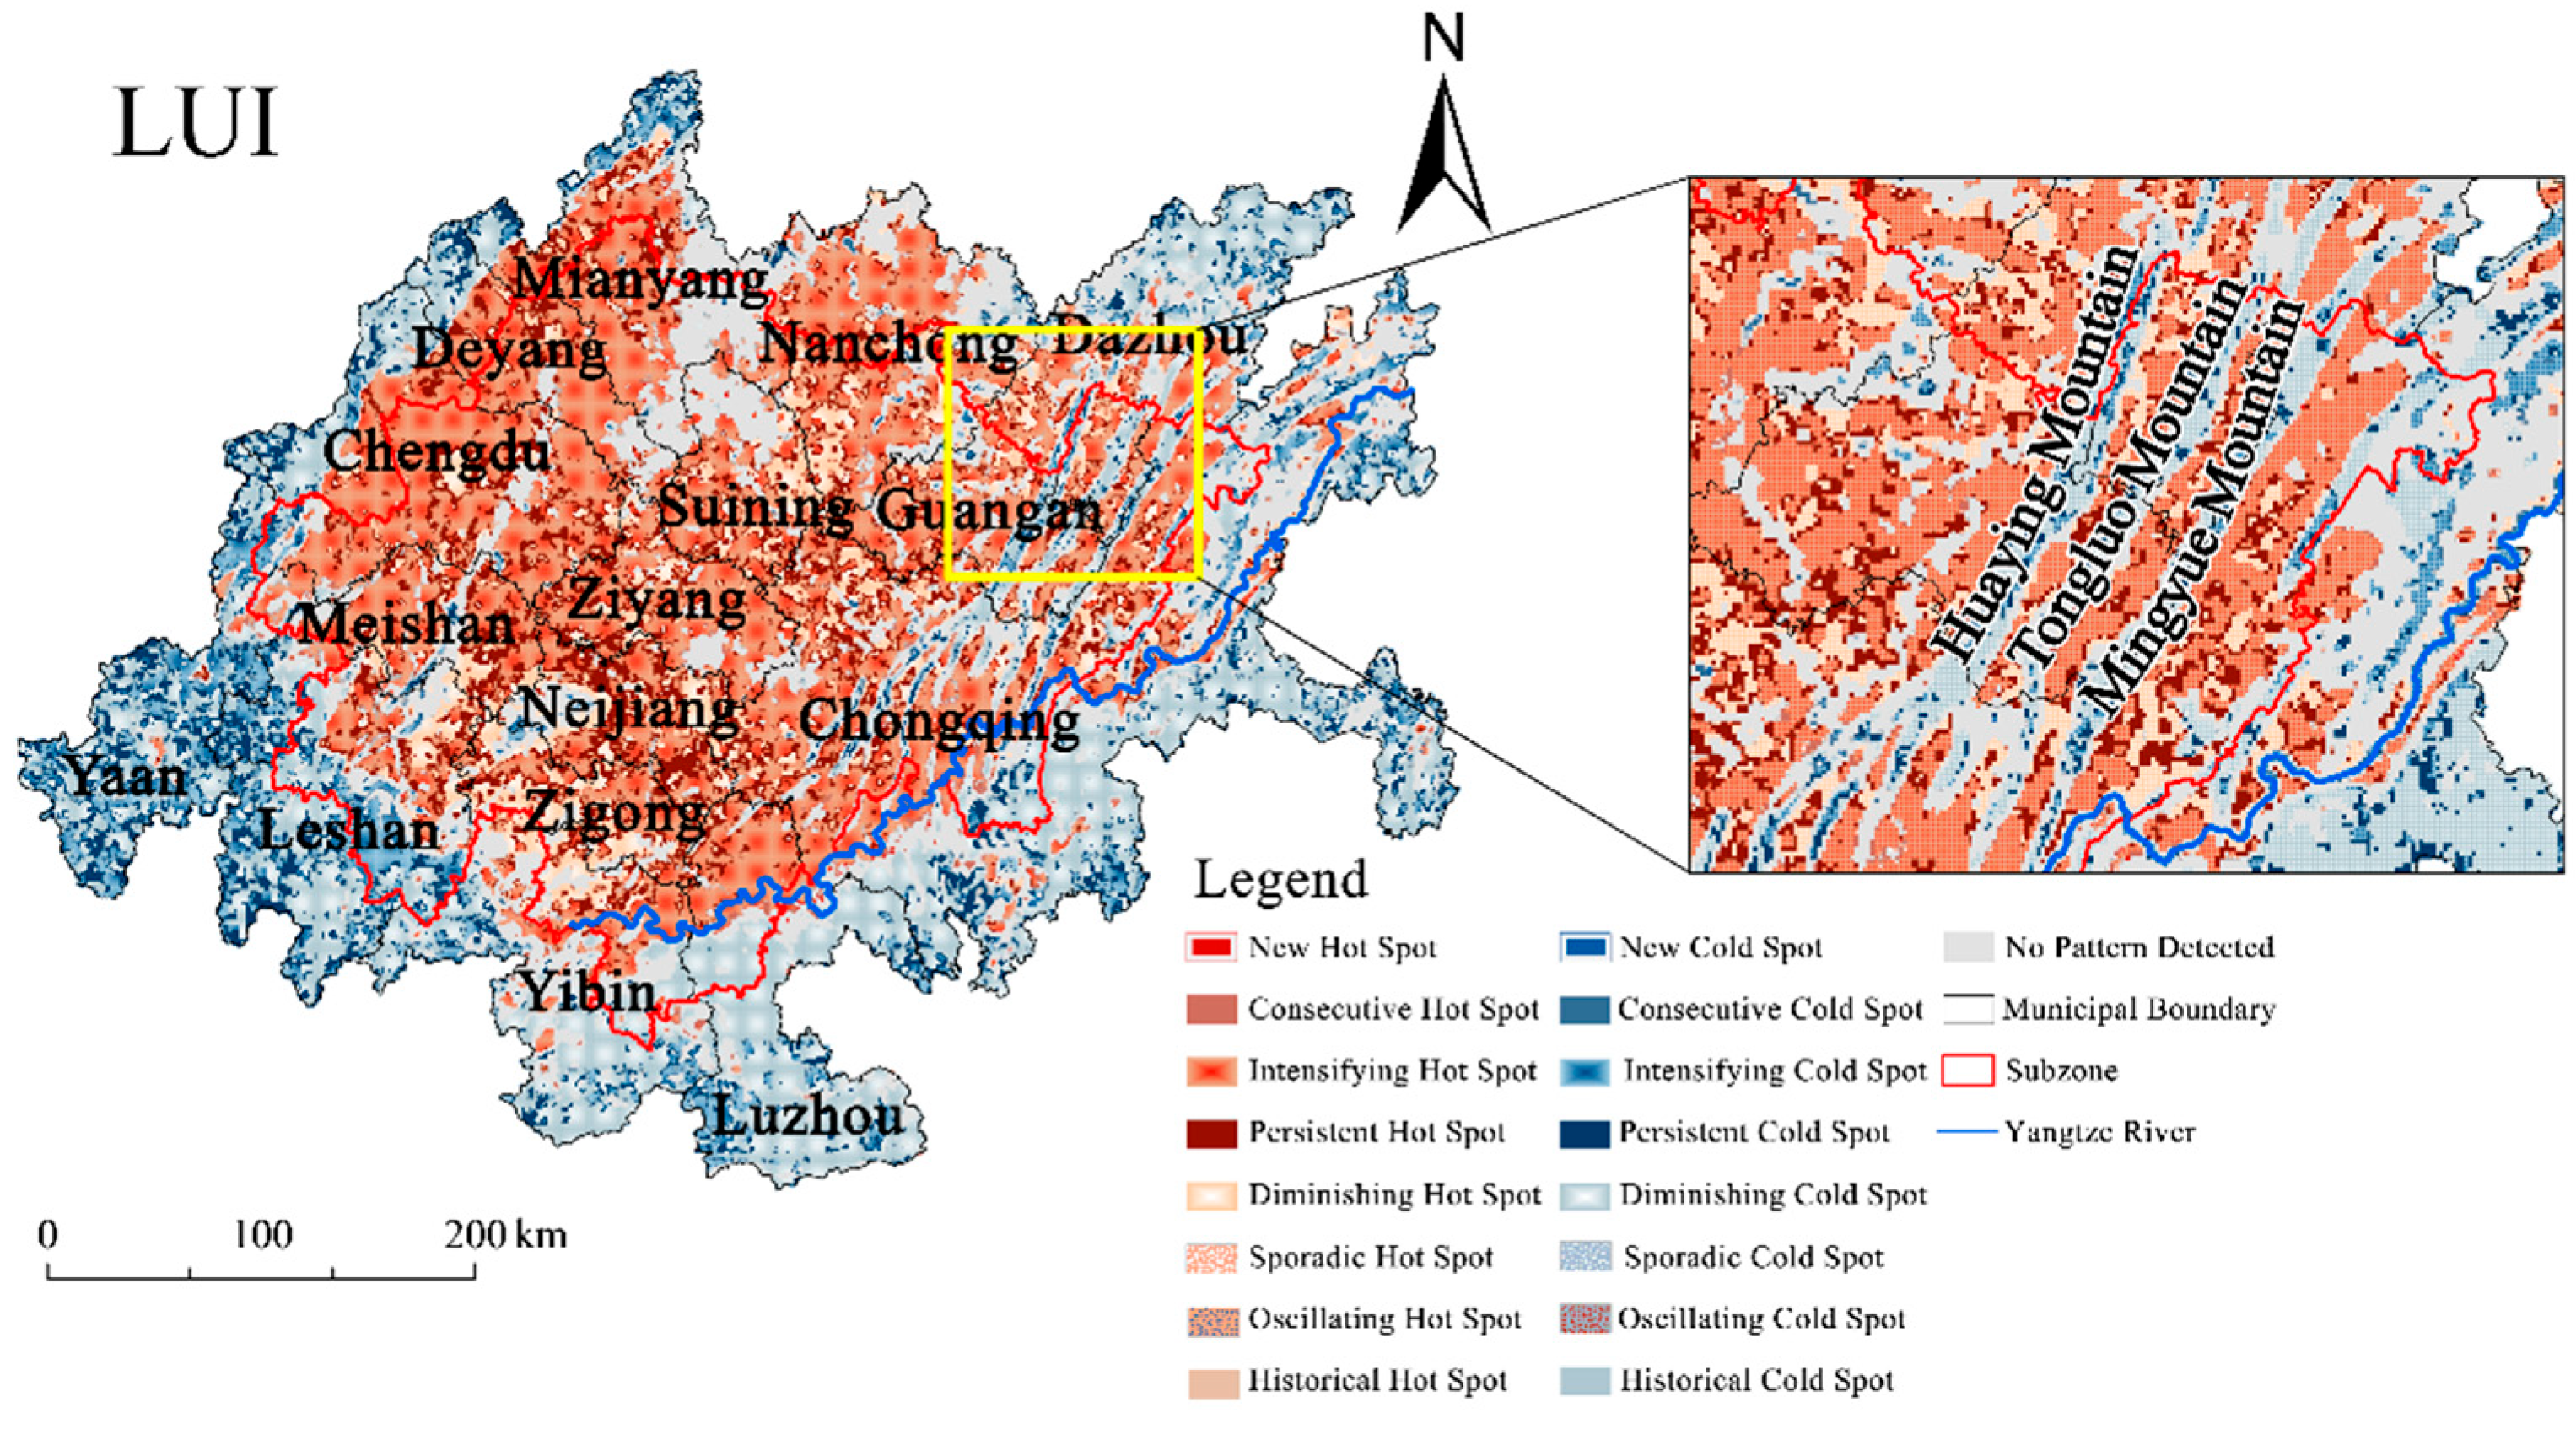
The proportion of intensifying cold spots in the LUI is the highest (21.73%), and its spatial distribution exhibits a significant regional differentiation pattern: this type of cold spot is notably concentrated in the eastern Sichuan hilly areas, particularly in the typical regions of Yibin City, Luzhou City, Mianyang City, and the Jiangjin District and Nanchuan District of Chongqing. This trend indicates that land use intensity in these areas is continuously decreasing, with the rate of decline showing a characteristic of marginal convergence. Further analysis shows that the spatial distribution pattern of time-space cold spots of LUI at the boundary of Dazhou and Guang’an in Sichuan Province and Chongqing City exhibits significant spatial coupling with the structural belt of the eastern Sichuan parallel ridge-valley area. The northeast-southwest trending fold mountains, as a typical geomorphological unit of the eastern Sichuan arcuate structural belt, form a “three mountains encircle two troughs” structural landform. Through the effects of topographical barriers and vertical zonal differentiation, this landform significantly constrains the land development intensity in surrounding areas, thereby shaping a spatial heterogeneity pattern characterized by the band-like distribution of cold spots. Apart from the major diminishing cold spots, the LUI persistent cold spots account for 7.13%, mainly distributed in the karst landforms of Fuling District and Fengdu County in the southeastern part of Chongqing within the study area. This reflects that the land use intensity in this region has long maintained a low-value steady state.
The CCD edge cold zones are dominated by intensifying cold spots (9.80%), forming a significant low-value pole in the southern part of Ya’an–Leshan and the northeastern part of Dazhou, substantiating the system imbalance caused by restrictions on development rights in ecologically sensitive areas. Diminishing cold spots (8.52%) are distributed along the Yangtze River’s main and tributary systems, reflecting the mitigating effect of ecological compensation policies on the declining trend of coordination. Persistent cold spots (8.70%) are less densely distributed than the gradually diminishing cold spots, but their general locations are roughly comparable.
The BDLUS ring-shaped thermal zone exhibits a “center-edge” gradient optimization feature, with intensifying hot spots (21.96%) extending southward from the main urban area of Chongqing to the Luzhou-Yibin urban agglomeration along the Yangtze River. This confirms the positive impact of the Yangtze River Economic Belt strategy on the functional restructuring of riverside cities. Consecutive hot spots (9.23%) are interspersed within, revealing that the coordination process of land use structure is notably driven by policies. It is noteworthy that the spatial distribution of BDLUS temporal and spatial hotspots shows a significant negative correlation with the spatial pattern of LUI cold spots. This reverse response mechanism reveals the collaborative pathway through which the human-environment system in the ring-edge area achieves adaptive optimization adjustments under terrain constraints, via the “dimensional reduction in land use intensity-dimensional elevation of land use sustainability” [59].

3.3. Analysis of Trends in Land Use Changes

3.3.1. Nonlinear Trend Feature Analysis

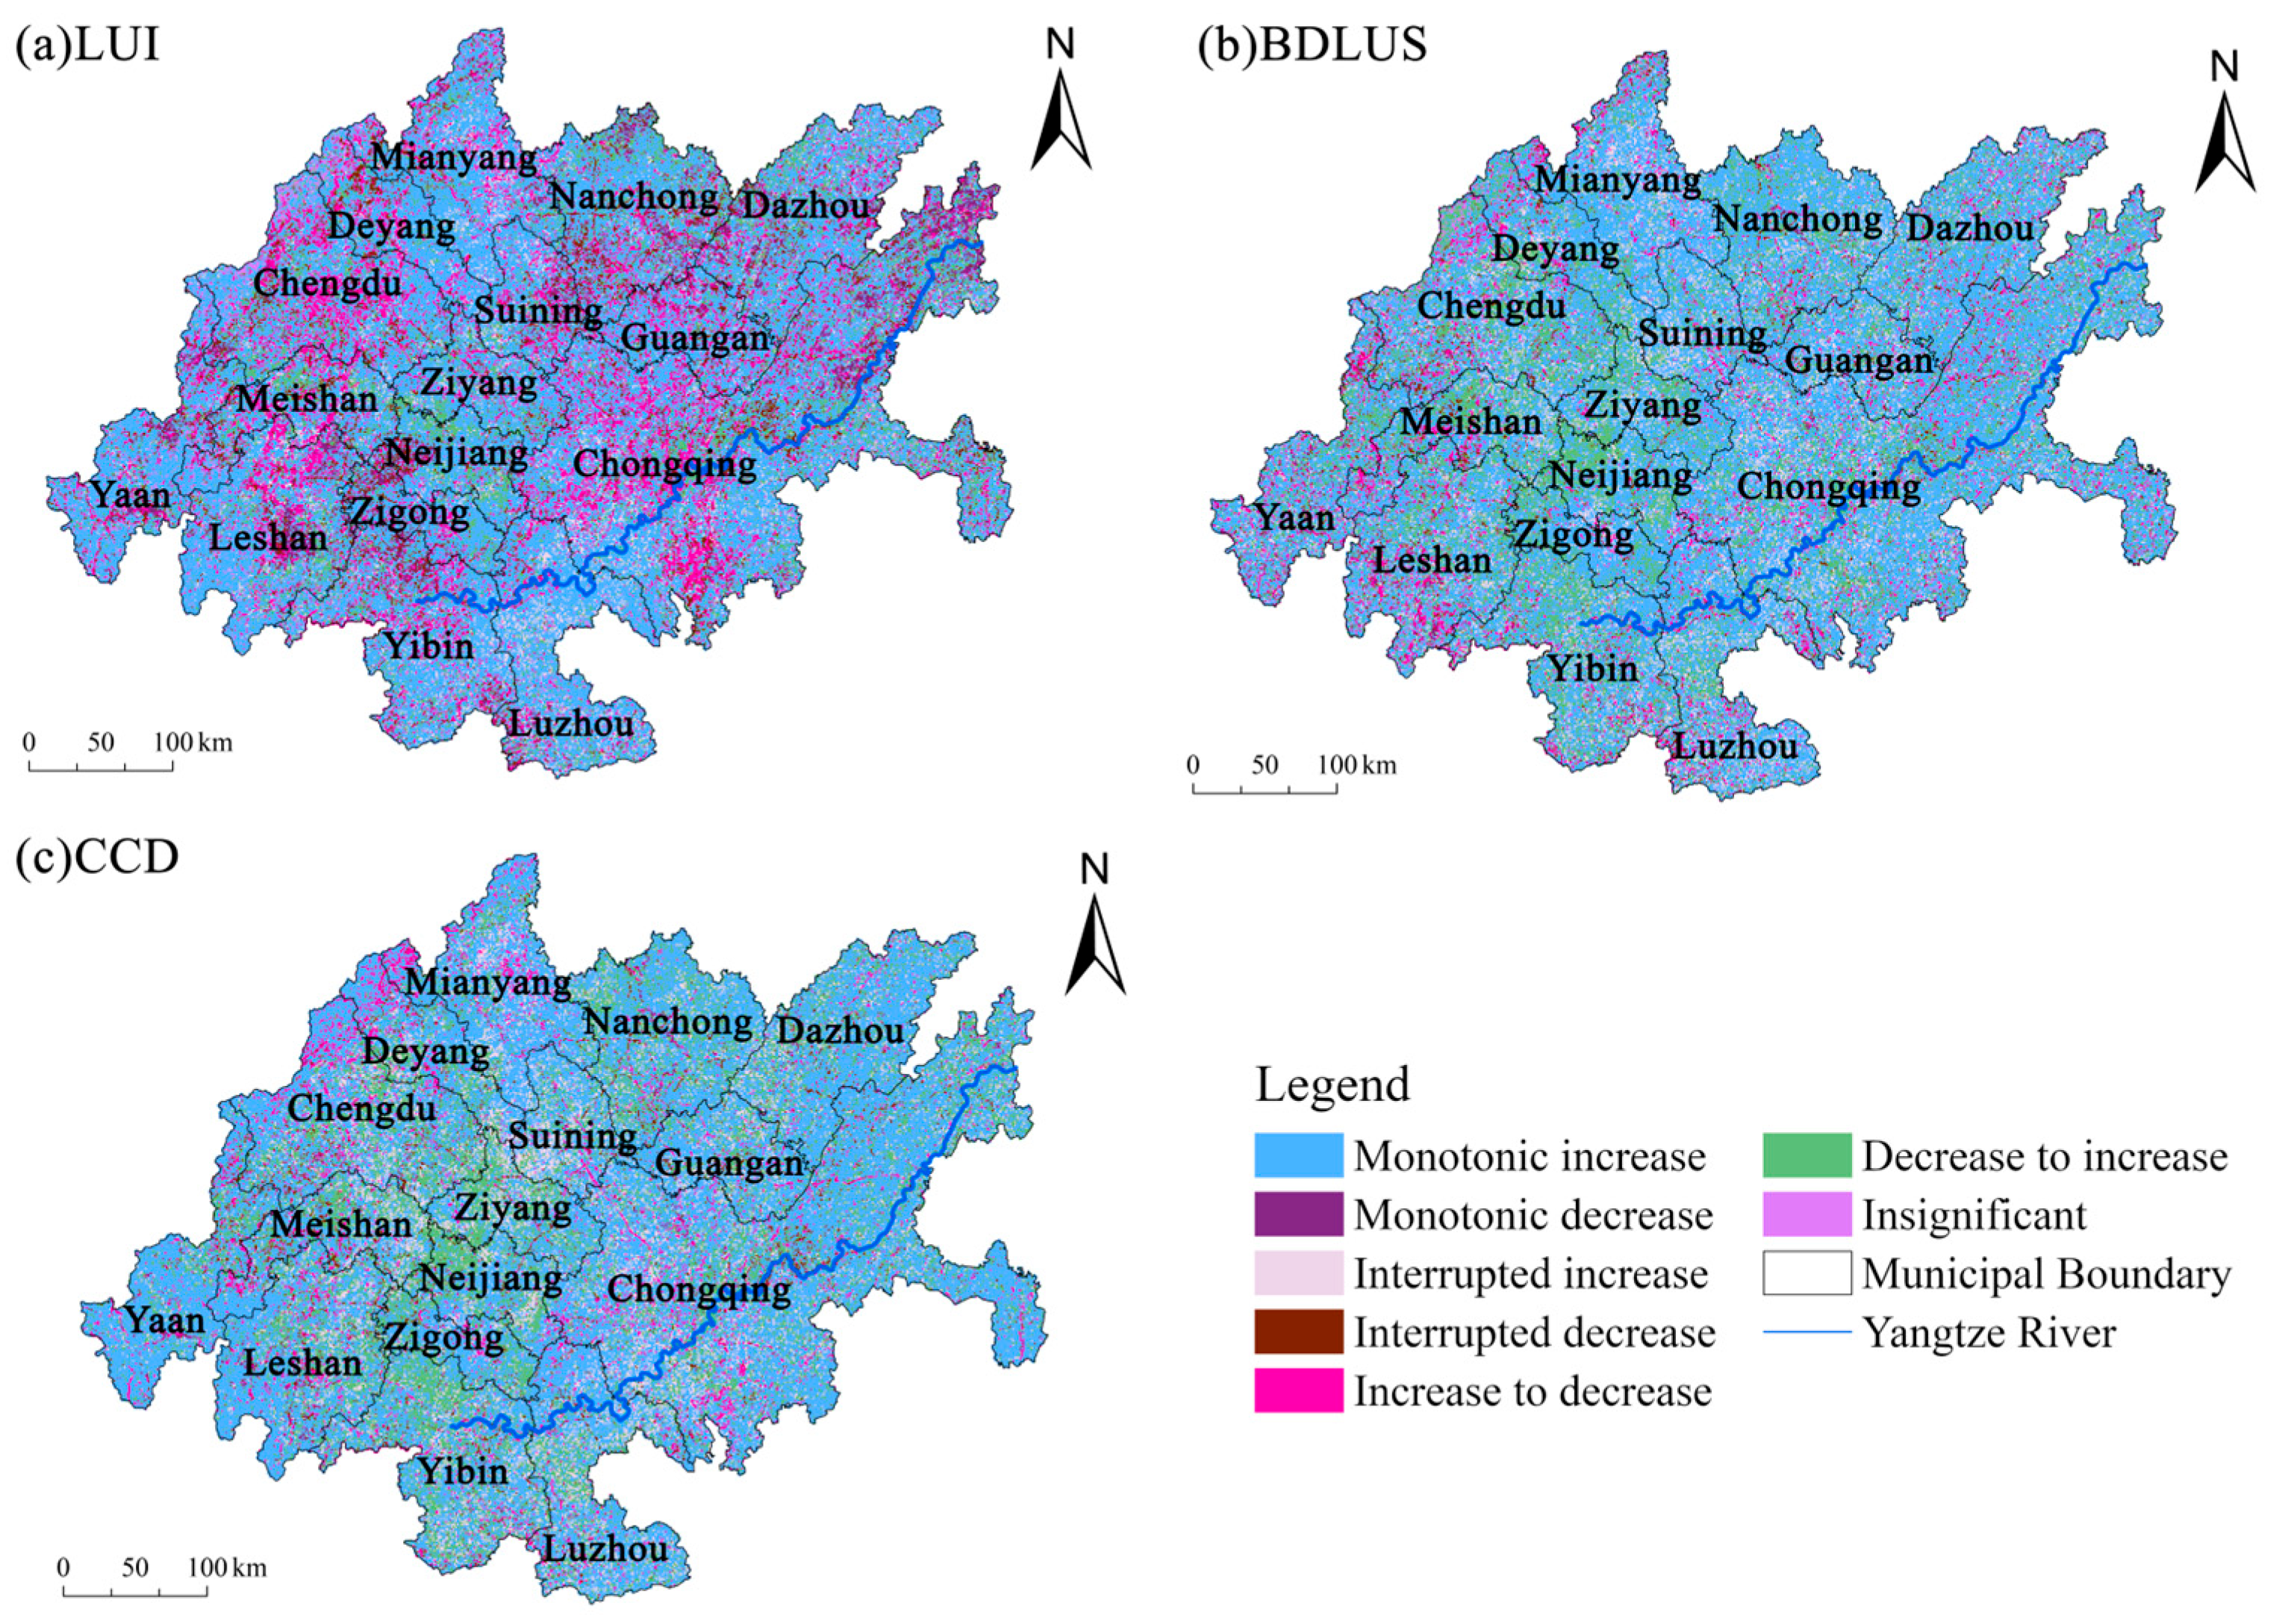
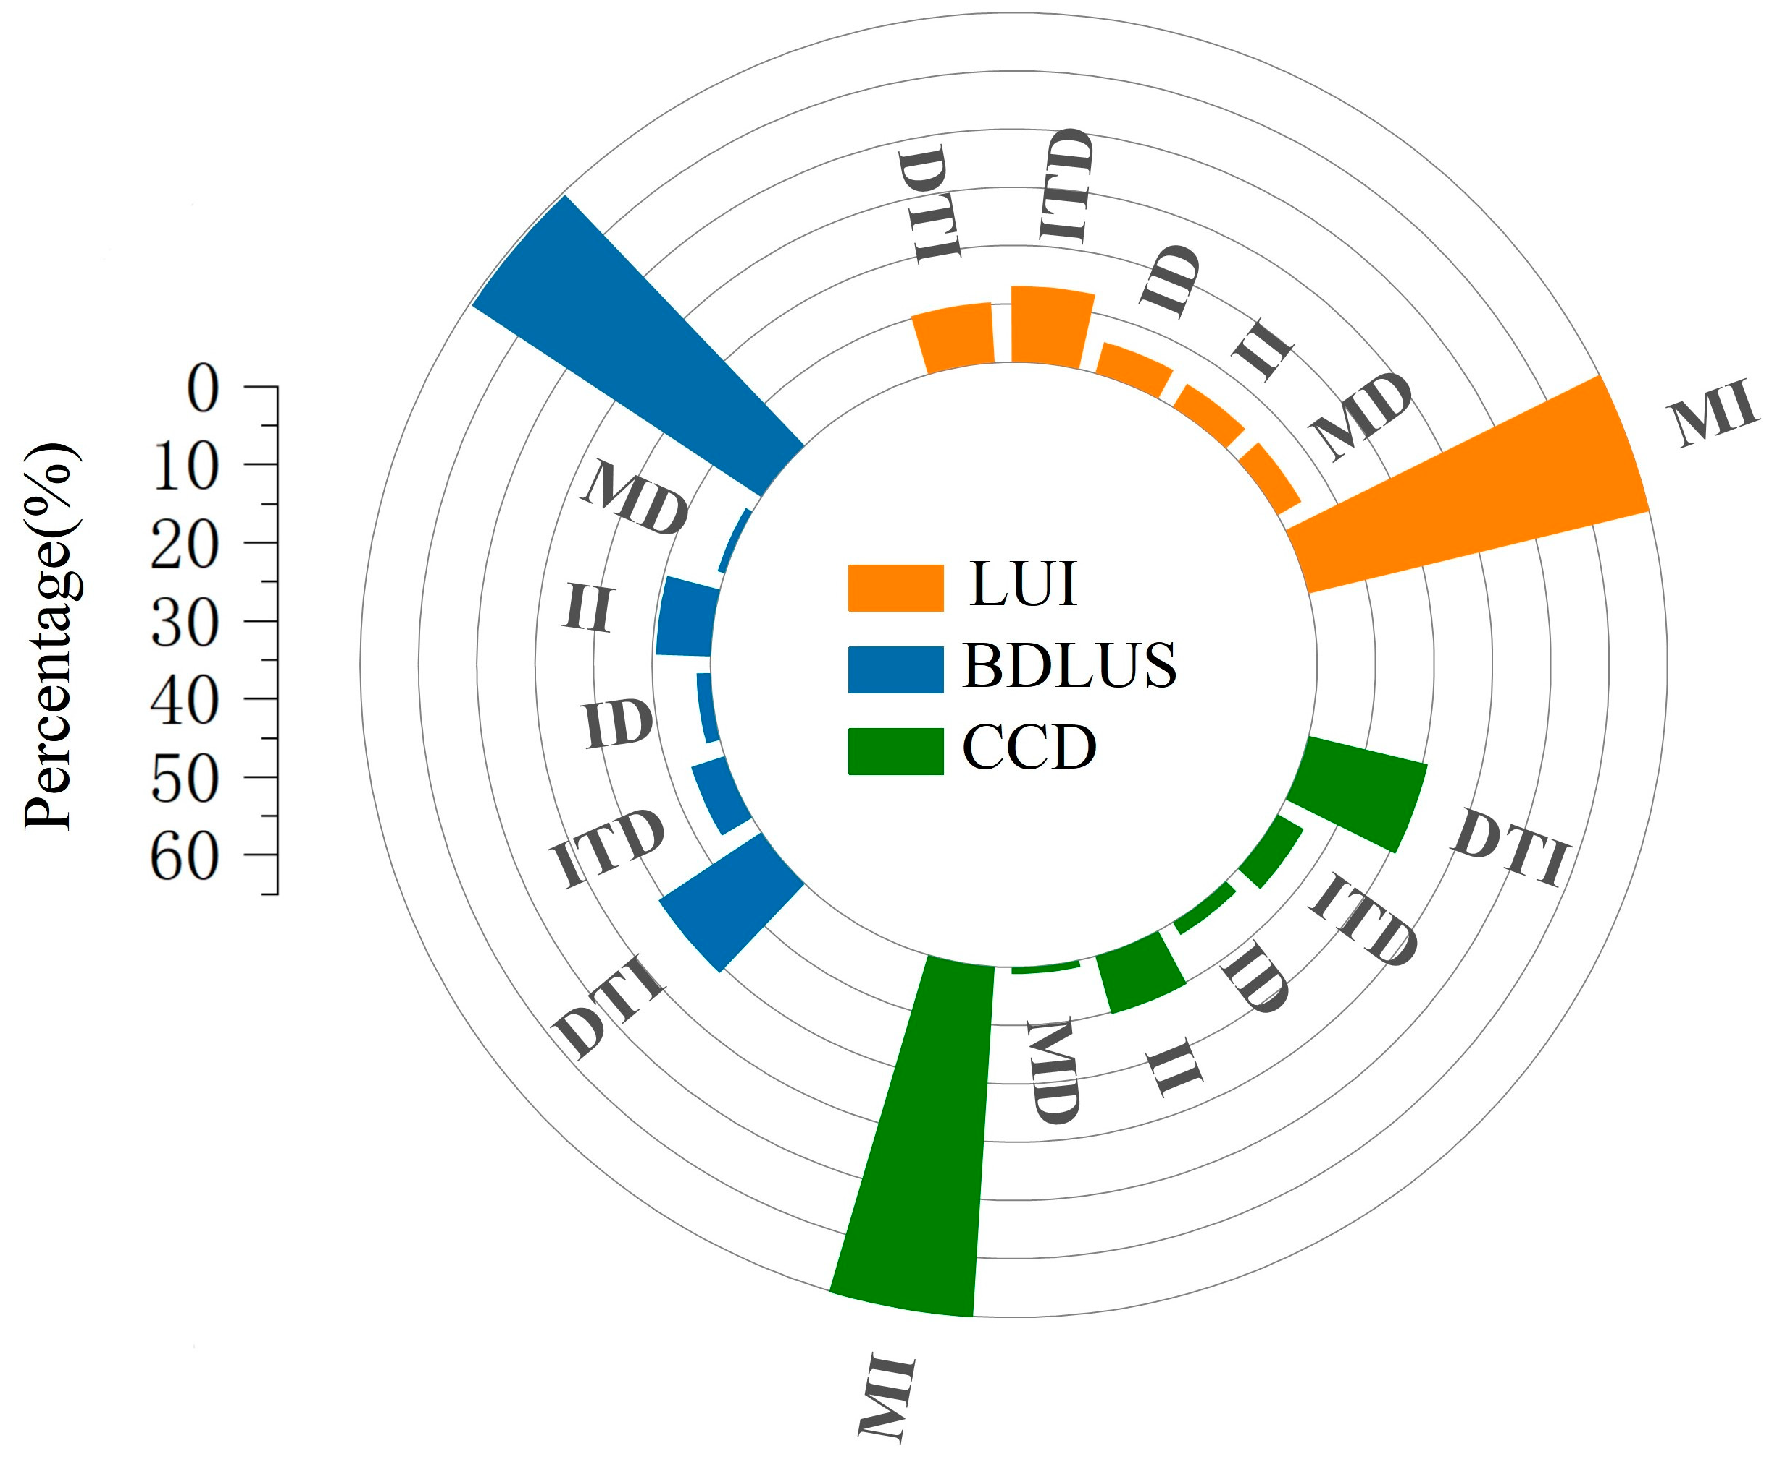
Based on the BFAST algorithm, a test and classification of the nonlinear trends of LUI, BDLUS, and CCD in the Chengyu region’s twin city economic circle from 2000 to 2022 was conducted, revealing significant heterogeneity in the spatiotemporal evolution of the three (Figure 7). The dominant trend types of LUI, BDLUS, and CCD are all monotonic increasing, with proportions of 60.04%, 59.47%, and 60.12%, respectively. This indicates that the study area has been in a stage of continuous development and structural optimization enhancement for nearly 23 years. There are significant differences in the types of secondary trends: LUI primarily exhibits “increase–decrease” turning points (13.03%) and “decrease–increase” turning points (10.36%), while BDLUS and CCD both show “decrease–increase” turning points (21.05%, 20.94%) and interrupted increase (9.29%, 10.26%) as their secondary dominant types. It is worth noting that the proportion of decreasing trends (interrupted decrease and monotonic decrease) among the three is below 5.51%. Among them, the decreasing area of the CCD accounts for only 3.57%, indicating that the overall resilience of the balanced-development system in the study area is relatively strong (Figure 8).
The spatial differentiation characteristics indicate: (1) Monotonically increasing core area: high-value zones of LUI exhibit a “dual-core, multi-center” distribution, concentrated in the Yibin-Luzhou-Mianyang urban cluster, the southwestern region of Ya’an–Leshan, and the eastern part of the Chengdu–Chongqing dual-city core area, closely aligning with regional industrial agglomeration belts; the monotonically increasing areas of BDLUS and CCD are uniformly distributed across the entire region, reflecting an overall trend of balanced land use structure and coordinated development, showing significant spatial coupling with the topographic gradient [60]. (2) Transitional Evolution Zones: The “increase–decrease” transitional zones identified by LUI are primarily concentrated in the central urban areas of the Chengdu–Chongqing dual city region and northern Leshan, suggesting that high-intensity urbanized areas may be approaching a development threshold. In contrast, the “decrease–increase” transitional zones of BDLUS and CCD are mainly located in the border region of Meishan, Ziyang, and Neijiang, which may be related to the timing of ecological restoration projects such as returning farmland to forest. (3) Localized decreasing anomaly areas: The LUI decreasing areas are distributed in points within the hilly transitional zone of Muchuan, Rongxian, and Weiyuan, overlapping with historical mineral development zones; the BDLUS decreasing areas appear sporadically in Mabiang Yi Autonomous County, possibly related to changes in traditional livelihoods in minority ethnic communities; the CCD decreasing areas are distributed discretely along the Yangtze River in Yunyang and Changshou, perhaps influenced by periodic water level fluctuations in the Three Gorges Reservoir area. (4) Interruption-type fluctuation zones: The interrupted increasing of LUI forms continuous strips in the southern region of Chengdu–Chongqing, showing a spatial correlation with the construction cycle of transportation corridors; the interrupted increasing of BDLUS and CCD forms a cluster area in Suining-Nanchong, which may reflect the phased effects of agricultural intensification and ecological compensation policies.

3.3.2. Analysis of Temporal Features During Trend Breaks

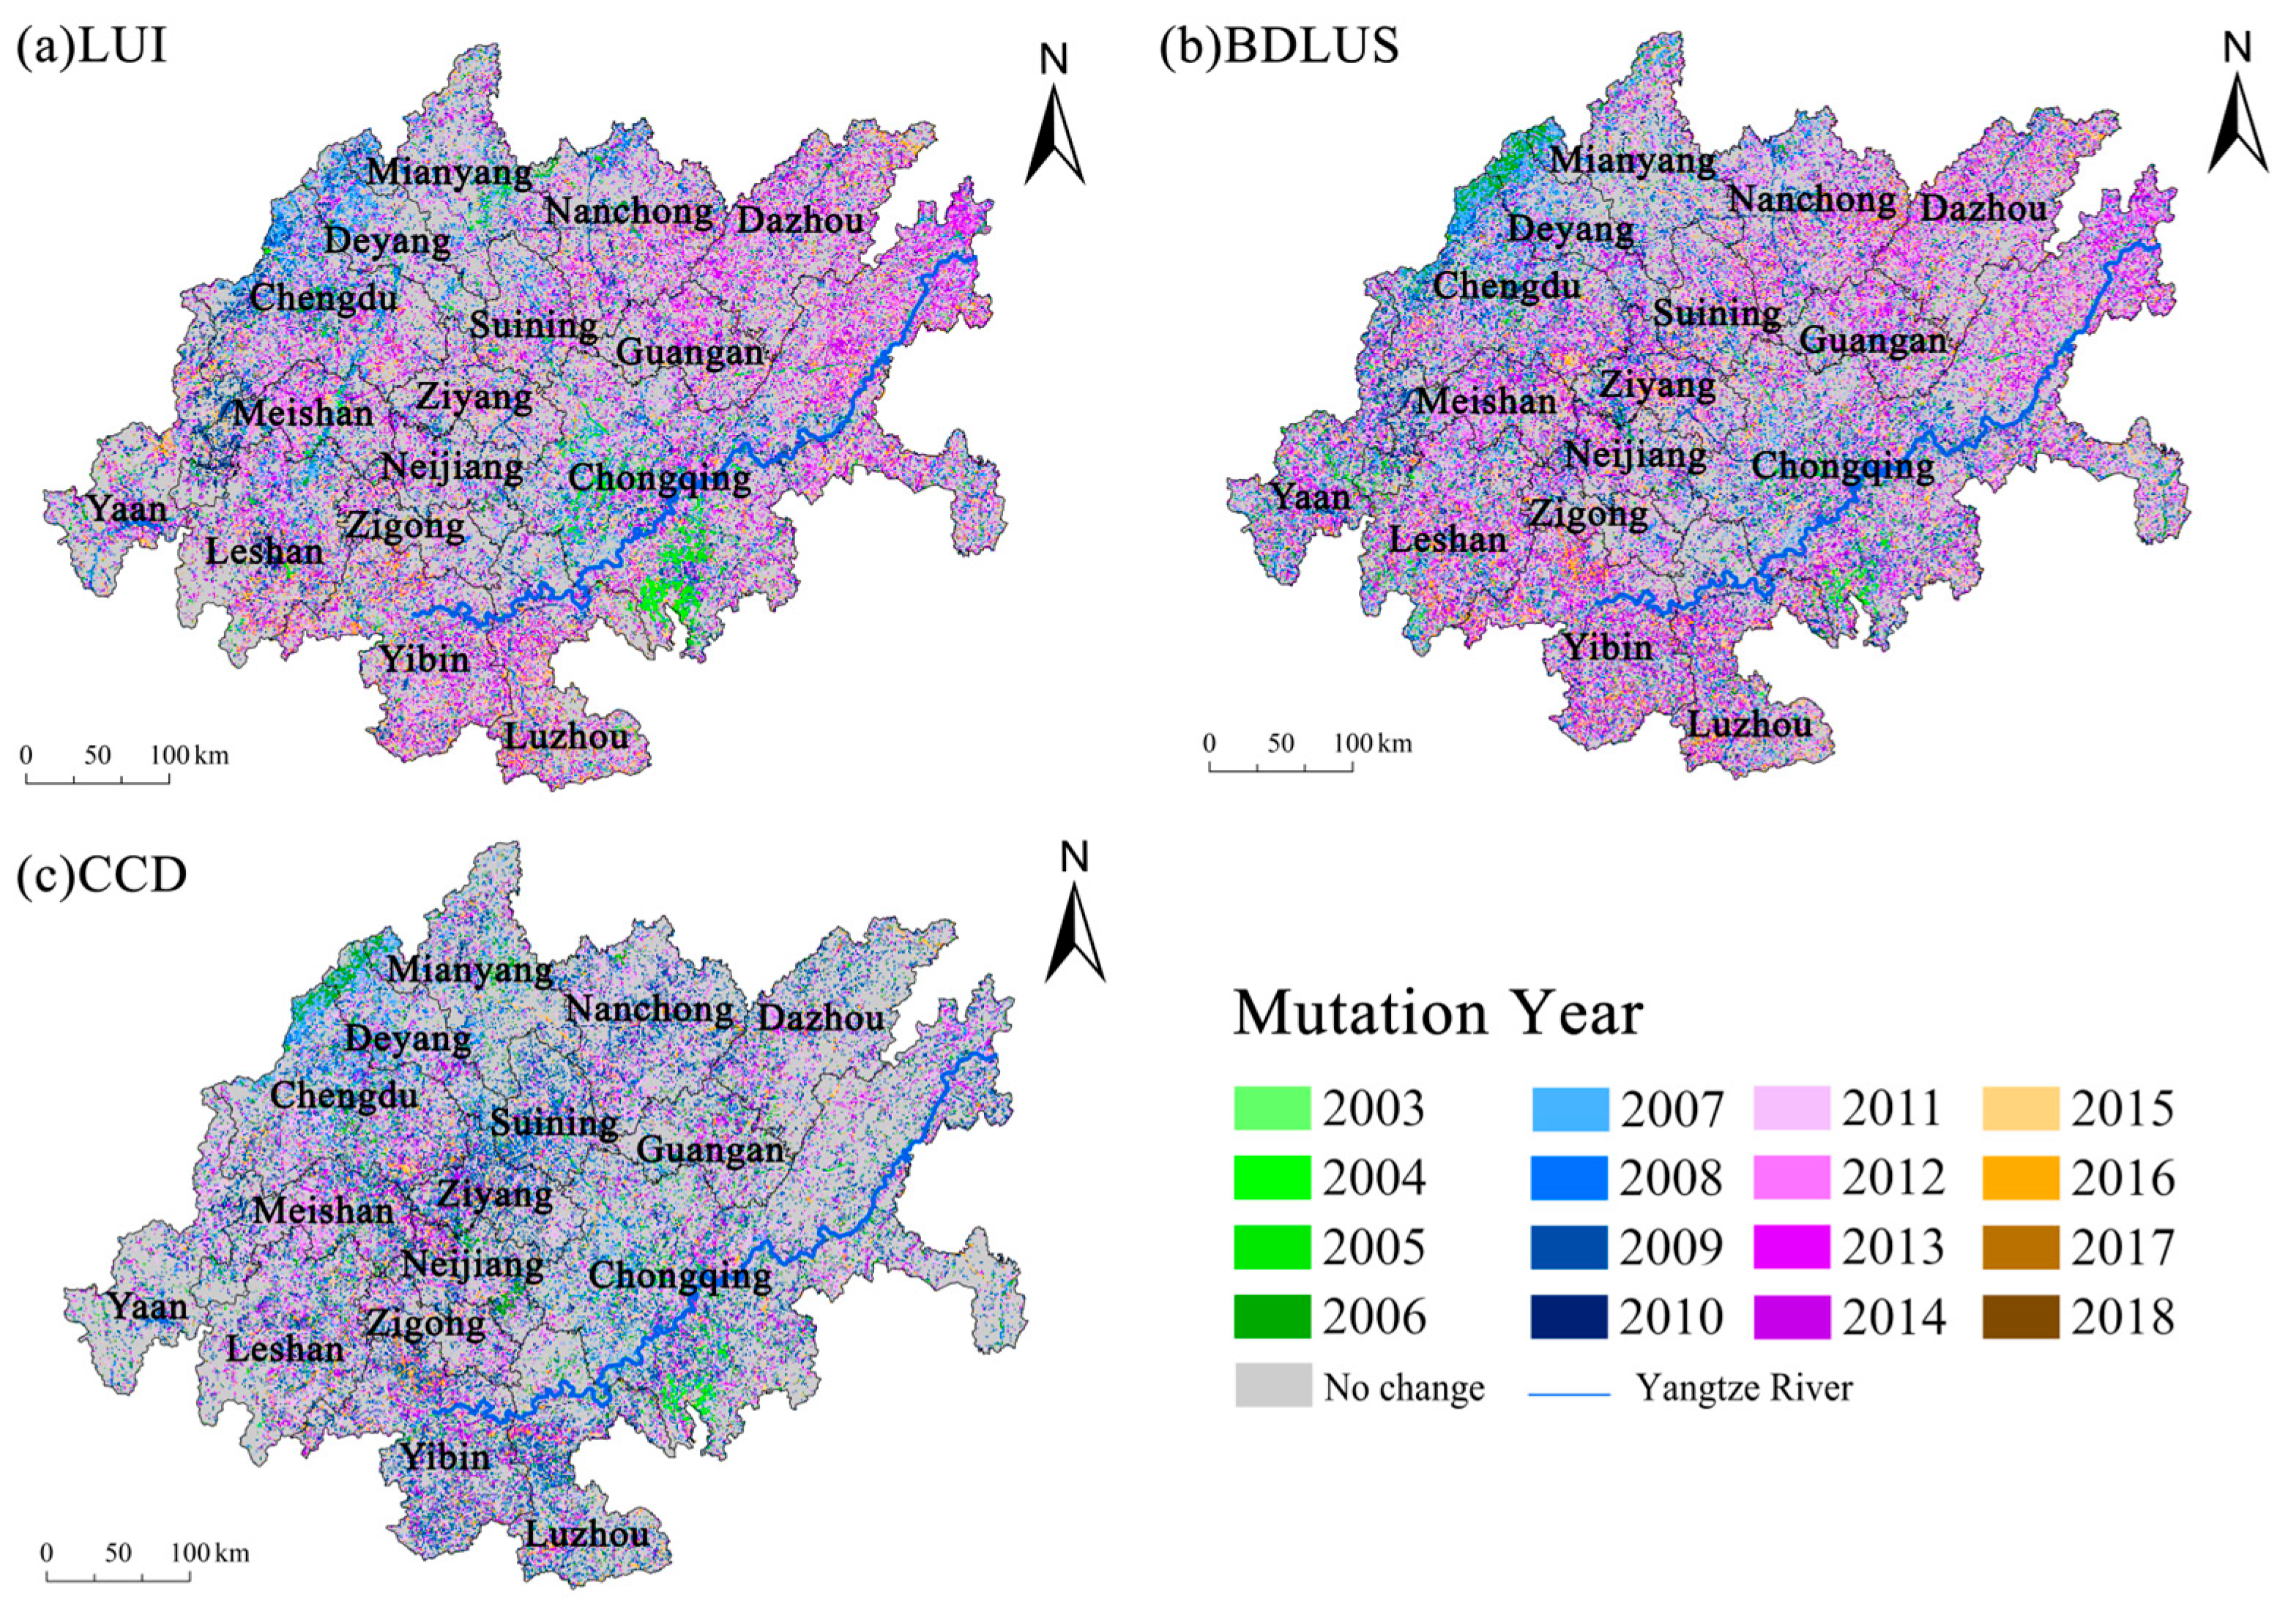
Based on the nonlinear trend detection results of the LUI, BDLUS, and CCD time series for Chengdu–Chongqing Economic Circle from 2000 to 2022, the study extracted trend change points and conducted an analysis of temporal characteristic patterns. The results indicate that the timing of various index trends in the study area exhibits significant spatiotemporal heterogeneity (Figure 9).
From the perspective of spatial distribution patterns, trend mutations exhibit a characteristic of temporal aggregation: the trend mutations in the border areas of Jiangjin, Qijiang, and Banan in Chongqing, the southeastern region of Chongqing, the urban agglomeration in the northern part of Chengdu and Mianyang, as well as the border area between Neijiang and Rongchang (longitude 105.2–105.7°) were mainly concentrated between 2003 and 2006; Chengdu-Deyang, the abrupt changes in the northwestern corridor mainly occurred in the late 2000s (2007–2010); from 2011 to 2014, a large-scale trend reconstruction was observed across the region, with the area affected accounting for 46.34% (average of three indicators), particularly significant in the southwest inland; from 2015 to 2018, the areas of change clearly shrank, scattered in the Suining-Ziyang transition zone.
The trend types of each indicator show significant differentiation in mutation sequences. The monotonic increasing mutations of LUI exhibit a bimodal characteristic, with the primary peak occurring between 2011 and 2014 (accounting for 48.26%), while the secondary peak is concentrated from 2007 to 2010 (25.01%); its decreasing mutations primarily took place after 2015 (75.69%). The evolution of the BDLUS trend shows temporal continuity, with significant changes in monotonic increasing/decreasing trends concentrated in 2011–2014 (51.20%) and 2007–2014 (71.25%), reflecting a continuous optimization process in land structure regulation. The CCD monotonically increasing mutation control period was from 2011 to 2014 (41.69%), while the decreasing mutation type was more prevalent from 2007 to 2010 (55.64%), suggesting the threshold response characteristics of coordinated regional development.
In terms of phase transition, the increase–decrease/decrease–increase transitions of LUI and BDLUS mainly occurred at two key nodes after 2006 and 2010, corresponding to the period of accelerated urban expansion and the period of strengthened ecological protection, respectively. Among them, the interrupted trends of increase/decrease concentrated from 2007 to 2014 (LUI: 91.16%/83.21%; BDLUS: 89.05%/85.33%), while the interrupted increases in CCD were more common before 2010 (91.91%), and the decrease events were delayed until after 2011 (79.14%). The quantitative analysis of trend conversion intensity shows that the proportion of anomaly variables for LUI and BDLUS reached 49.83% and 50.42%, respectively, from 2011 to 2014, indicating that this period was a critical window for the transformation of the regional land use system. In comparison, the mutations in the CCD are distributed more evenly over time; however, the total number of changes before 2010 (52.83%) is slightly higher than in the later period (47.17%), revealing a potential lag in the phased regulation of regional coordinated development.

3.4. Quantitative Analysis of Land Use Change

Based on the interaction detection results of LUI, BDLUS, and CCD, the dominant driving factors in the study area for each year show significant characteristics. Specifically:
(1)
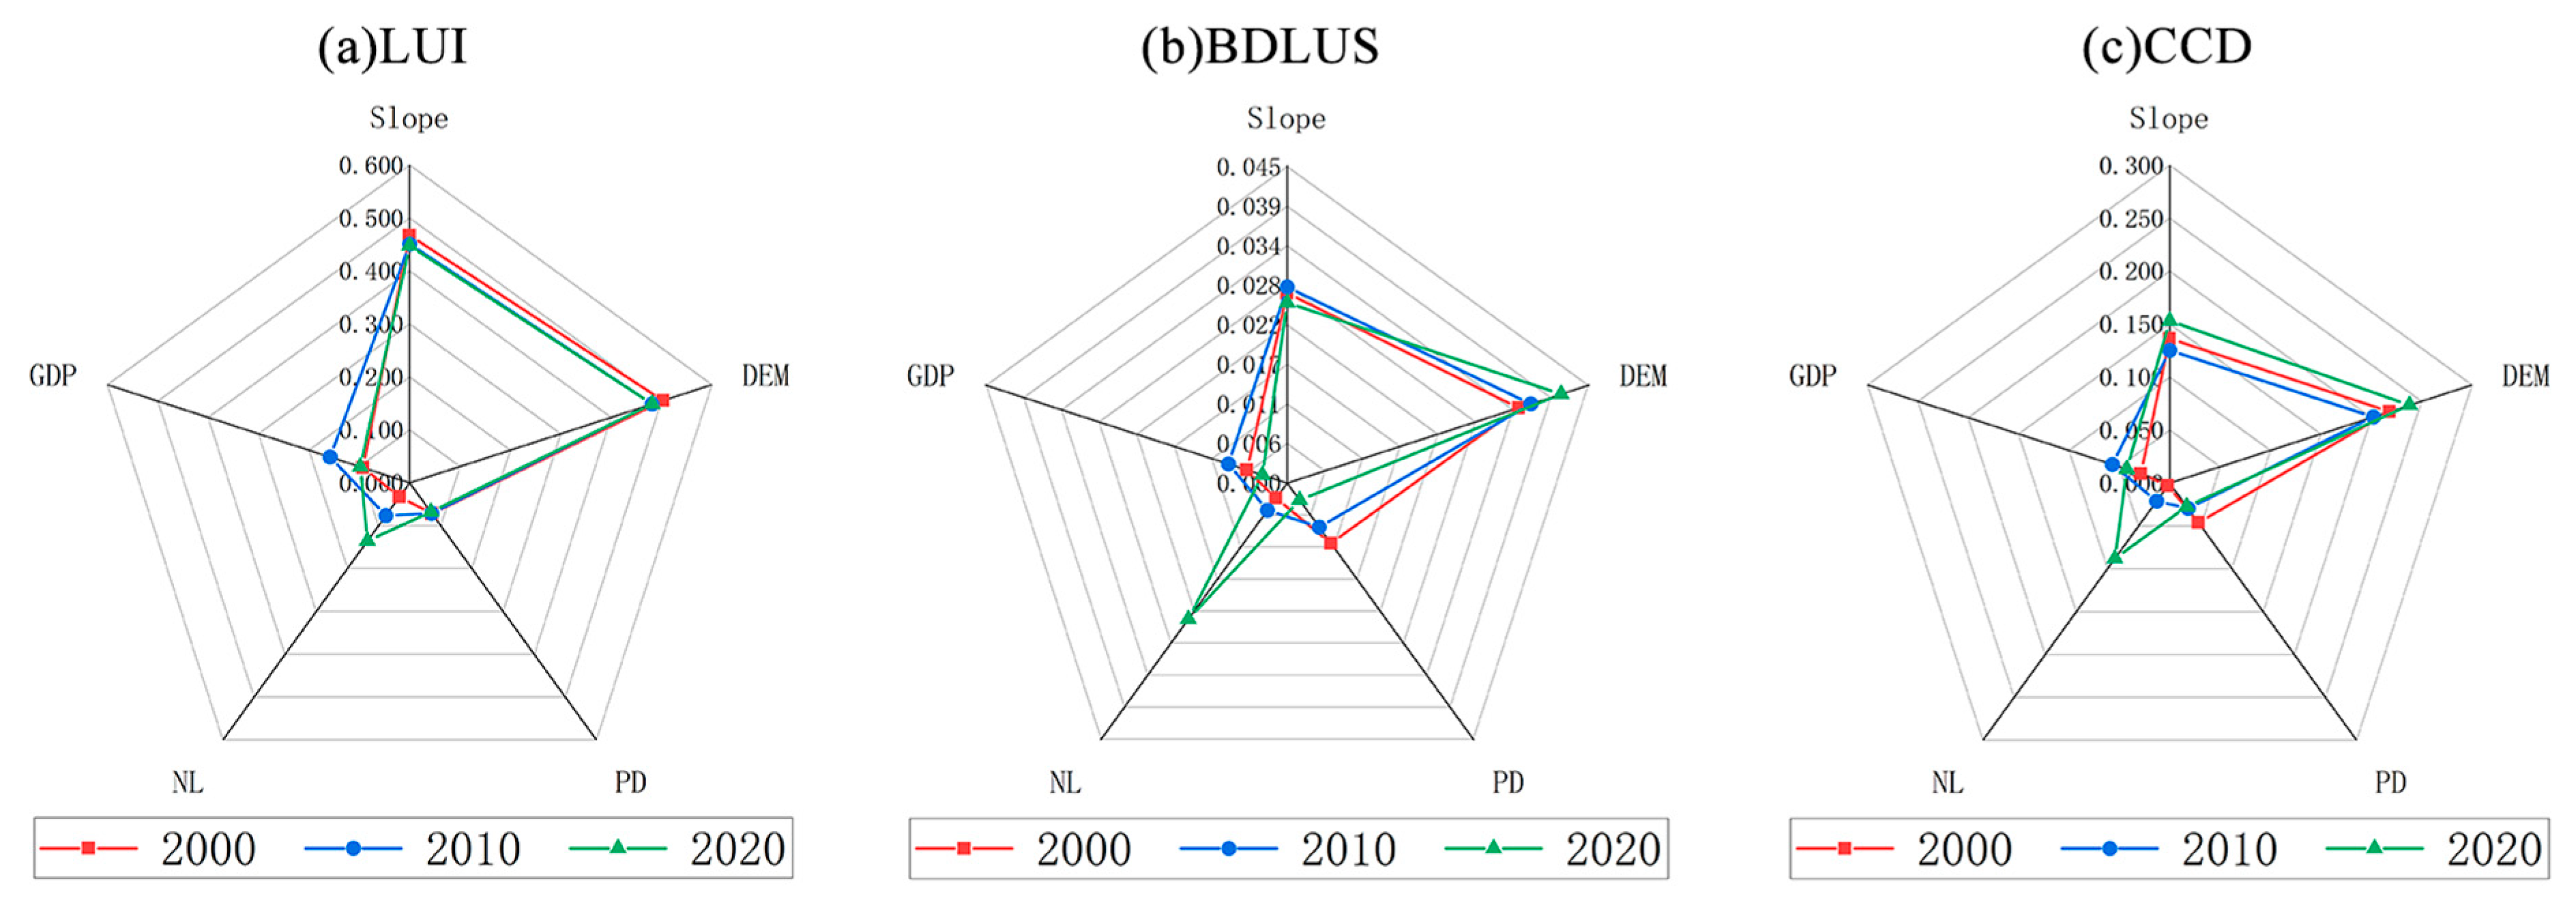
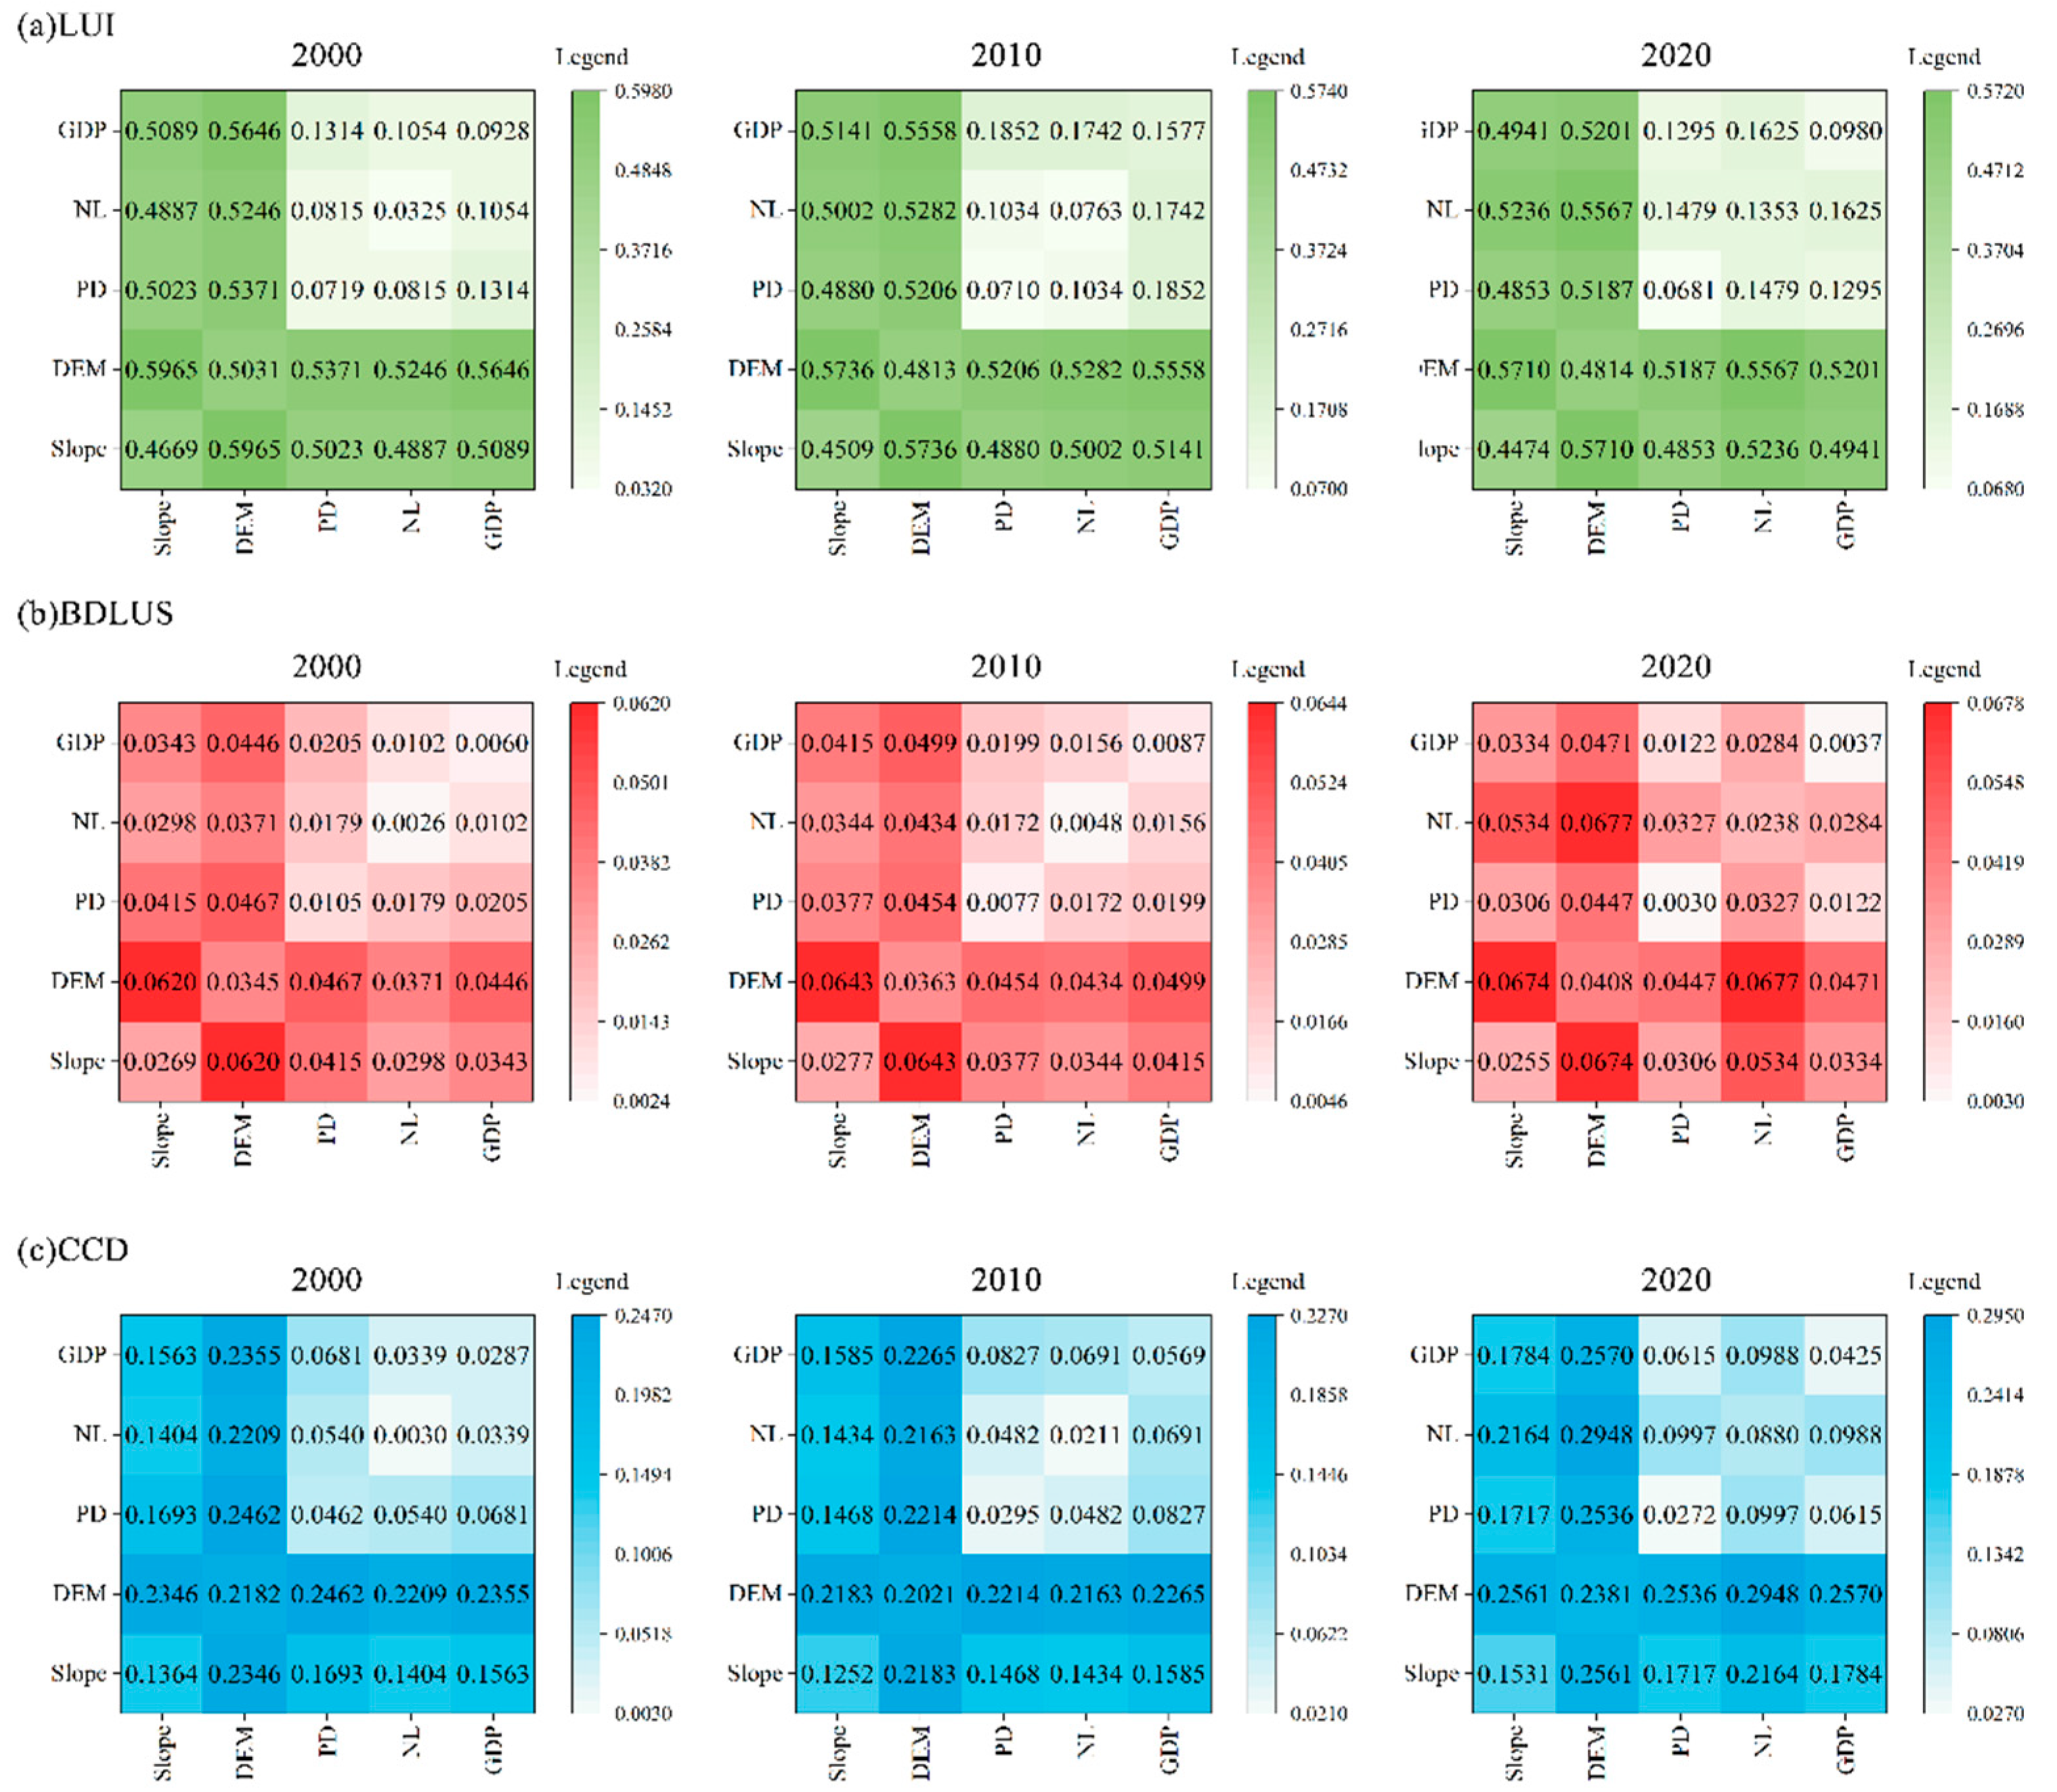
In terms of single-factor explanatory power (Figure 10), elevation is dominant among the three indicators. The elevation explanation power of LUI reached 0.503, 0.481, and 0.481 in 2000, 2010, and 2020, respectively (BDLUS: 0.034–0.041; CCD: 0.202–0.238), significantly higher than that of other factors. Through the comparison of the mean q-values of various factors, the driving factor ranking for LUI is elevation (0.489) > slope (0.455) > GDP (0.116) > nighttime light (0.081) > population density (0.070). For BDLUS, the ranking is elevation (0.037) > slope (0.027) > nighttime light (0.010) > population density (0.007) > GDP (0.006). In the case of CCD, the ranking is elevation (0.219) > slope (0.138) > GDP (0.043) > nighttime light (0.037) > population density (0.034). This indicates that topographic elements (elevation, slope) have a fundamental controlling effect on the evolution of land systems in the study area.
(2)
The two-factor interaction effect shows (Figure 11) that all indicators exhibit significant nonlinear enhancement characteristics. Between 2000 and 2020, the interaction of the nighttime light with other factors increased the explanatory power for LUI, BDLUS, and CCD by 11.18% to 219.49%, demonstrating a typical synergetic amplification effect. Among these, the interaction combinations of slope and elevation have the highest explanatory power for LUI and BDLUS (LUI: 0.571–0.596; BDLUS: 0.062–0.067). The dominant interaction combination of CCD evolves over time: in 2000, it was elevation × population density (0.246), in 2010 it shifted to elevation × GDP (0.227), and by 2020, it was represented as elevation × nighttime lights (0.295). It is noteworthy that the independent effect of terrain factors shows a decreasing trend, while the explanatory power of the interaction between nighttime lights and population density significantly increases, even reaching 219.49%. In 2020, the interactive effects with elevation contributed to the explanatory power of BDLUS and CCD, reaching 0.068 and 0.295, respectively. This phenomenon reveals that the factors of human activity (represented by nighttime light) are gradually becoming the core driving force behind the evolution of land systems, which may be closely related to the accelerated urbanization process and industrial restructuring in the study area.

4. Discussion

4.1. Theoretical Analysis of the Spatiotemporal Coupling Mechanism of Land Use

This study revealed the complex spatiotemporal coupling mechanisms of land use intensity (LUI), balance degree of land use structure (BDLUS), and their coupling coordination degree (CCD) in Chengdu–Chongqing Economic Circle through a fine grid scale analysis. The research found that the three components exhibit significant “center-edge” gradient differentiation characteristics, which align with classical regional spatial structure theory. The reverse combination of high LUI and low BDLUS in the core area (with mean values of >2.96 and <0.92, respectively) verified the hypothesis of an inverted U-shaped relationship between “urban land development intensity and functional diversity” [61]. This means that when the development intensity exceeds a threshold [62], the phenomenon of single-function dominance intensifies. This finding provided empirical evidence for the applicability of Alonso’s (1964) monocentric city model [63] in polycentric urban agglomerations.
It was noteworthy that the “LUI-CCD cold zone and BDLUS hot zone” inverse response pattern observed in the marginal areas revealed the adaptive adjustment mechanisms of the human-environment system under the constraints of the terrain. The “three mountains and two valleys” geomorphology formed by the structural belt of the eastern Sichuan parallel ridge-gully area (Figure 12) had shaped a patterned distribution of cold spots through terrain barrier effects. This discovery expanded the application boundaries of Forman’s (1995) landscape ecology theory in complex terrain areas [64]. Meanwhile, the marginal areas achieved system optimization through the collaborative path of “intensity dimensionality reduction-sustainability dimensionality elevation” [61], providing a new theoretical perspective for sustainable development in mountainous regions.

4.2. Interacting Effects of Multi-Scale Driving Mechanisms

Factor analysis indicates that the evolution of land use in the study area exhibits a dual driving characteristic of “topographical constraints-dominance of human activities.” The topographic elements formed by elevation (q = 0.489) and slope (q = 0.455) explained 40.33% to 37.56% of the variance in LUI) However, more noteworthy is the nonlinear enhancement effect of human activity factors: the interaction between nighttime light index and population density resulted in a 219.49% increase in explanatory power for CCD. First, higher population density signifies a significant increase in space demands for housing, employment, commerce, transportation, public services, and more. This directly creates a core driving force for converting natural or agricultural land into construction land. Population clusters naturally become centers of economic and social activities, which require corresponding spatial carriers. Second, the intensity of nighttime light strongly reflects the region’s level of economic activity, energy consumption, as well as the density and maturity of built-up infrastructure. Lastly, the synergistic effect of both factors amplifies the driving force behind land use changes. The massive spatial demand brought by high population density drives infrastructure construction and economic development (manifested by enhanced nighttime lighting). At the same time, bright nighttime lights (representing good economic opportunities and infrastructure) attract more people to migrate or gather, further increasing population density. This positive feedback loop of “population concentration—enhanced economic activity/infrastructure improvement (increased nighttime lighting)—attracting more population/investment” is at the core of their synergy. This synergistic amplification effect was particularly significant in 2020 (q = 0.295), indicating that the urbanization process in the Chengdu–Chongqing area has entered a new phase of “elemental collaborative agglomeration”.
Time series analysis reveals that the years 2011–2014 were a critical window for system transformation, with the mutation proportions of LUI and BDLUS reaching 49.83% and 50.42%, respectively. This phenomenon is highly synchronized with the implementation of major policies such as the “Chengyu Economic Zone Regional Planning” (2011), confirming the leverage effect of institutional factors in the transformation of regional land use. Unlike traditional understanding, the mutations in CCD exhibit a characteristic of “lag in policy response” (with 52.83% of changes occurring before 2010), suggesting that the cumulative effects of coordinated development require a longer transition period.

4.3. Policy Implications of Spatial Governance

The core area of the “high intensity-low balance” dilemma identified by the research has significant warning implications for the spatial governance of megacities. The growth rate of LUI in the core urban areas of Chengdu and Chongqing has slowed down (with a decrease of 2.08% in growth from 2000–2010 to 2010–2022), while the improvement in BDLUS is significant (with an increase of 11.65% in growth from 2000–2010 to 2010–2022), indicating that controlling development intensity is beneficial for structural optimization. Chengdu and Chongqing, as core cities, exhibit a significant “dual-core resonance” characteristic in their LUI and BDLUS. This corresponds with the “dual-headed structure” identified in urban resilience research [65], indicating that dual-core cities create a dynamic coupling effect through economic radiation, resource allocation, and policy coordination. At the same time, this dual-core interaction model is also seen in other international polycentric urban agglomerations, such as the Randstad region in the Netherlands (a networked area composed of cities like Amsterdam, Rotterdam, The Hague, and Utrecht). It achieves balanced regional development through functional complementarity and efficient transportation connections [66], providing valuable global experience for the collaborative mechanism of the Chengdu–Chongqing dual cores. After the implementation of the “Chengyu Urban Agglomeration Development Plan” in 2016, the infrastructure connectivity between the two core cities increased by 23%, leading to an average annual growth of 4.7% in the land use balance of surrounding cities [67]. It is recommended to draw on the experience of the “Tokyo Bay Area Functional Relief” [68] and promote a multi-centered networked development through industrial gradient transfer (such as diffusion towards the Chengde-Mian urban agglomeration). In addition, the Chicago metropolitan area’s experience in balancing urban expansion with ecological protection is also worth referring to for the Chengdu–Chongqing Economic Circle when coordinating development and conservation [69,70].
To address the bottlenecks in the coordinated development of the central transition zone (with the CCD cold region at the Nanchong-Suining border accounting for 9.80%), it is necessary to break through administrative boundary barriers and establish a cross-regional land quota trading mechanism. Based on the results of environmental resilience assessment, priority zones for ecological restoration should be delineated, development intensity should be restricted, and key initiatives such as returning farmland to forest and geological disaster prevention projects should be implemented to improve land balance. Research has found that the Yangtze River Economic Belt strategy has improved the BDLUS of the cities along the river by 21.96%, providing empirical support for the establishment of the “Yangtze-Chengyu” dual-axis interaction system. The ecological-agricultural dominant characteristics of the marginal areas (with an LUI mean of <2.42) indicate the need for differentiated management and control. It is recommended to establish a “topography-adaptive development” model in the Eastern Sichuan Parallel Ridge Valley area, adopting dynamic adaptive management, setting thresholds for land expansion, and coordinating development. For the plain aggregation areas (Chengdu Plain and Western Chongqing Hills), a compact development model should be implemented to ensure land is utilized intensively and economically while maintaining system stability.
This study reveals the unique patterns and challenges of land use in Chengdu–Chongqing Economic Circle, particularly in the core areas (the five traditional central districts of Chengdu + six nearby districts + the nine traditional main urban districts of Chongqing), the “high intensity–low balance” dilemma is evident (average high LUI > 2.96, average low BDLUS < 0.92), which confirms the highly concentrated characteristics of population and economic factors under the “dual-core leading” spatial pattern. At the same time, the study also reveals a significant “dual-core resonance” effect. Through comparative analysis with typical international cases, we find that the Chengdu–Chongqing model not only reflects the core challenges commonly faced by mega city clusters—such as unusually high development intensity in the core area, relatively homogeneous functions, and insufficient regional coordination, manifested by a stark contrast between the low average LUI (<2.42) and high average BDLUS (>1.01) in the peripheral zones—but also highlights its uniqueness as a “dual-core driven” city cluster in China’s inland region. These international experiences offer important insights for optimizing spatial governance in the Chengdu–Chongqing area: strengthening a multi-center network structure, implementing differentiated zoning regulations (potentially informed by techniques such as GIS buildout analysis [71]), establishing effective inter-regional coordination mechanisms, and balancing development intensity with ecological protection. Future research can further deepen systematic comparative studies of the Chengdu–Chongqing model with other global city clusters regarding evolutionary trajectories, governance effectiveness, and sustainability, and explore practical applications like conducting GIS buildout analyses to quantitatively assess development potential and inform differentiated zoning strategies within the region.

5. Conclusions

This study broke through the traditional research paradigm dominated by macro units such as counties and cities [72,73] and innovatively constructed a 1 km grid-based analysis unit. Utilizing land use data from the Chengdu–Chongqing Economic Circle from 2000 to 2022, it calculated the overall land use intensity (LUI), balance degree of land use structure (BDLUS), and coupling coordination degree (CCD). Through emerging spatiotemporal hotspot analysis and BFAST decomposition, it conducted an in-depth exploration of the coupling and coordination mechanism between land use intensity (LUI) and balance degree (BDLUS) in the Chengdu–Chongqing Economic Circle. This successfully revealed the differential spatial patterns of “multi-centered cluster expansion” in the main urban area of Chongqing and “axial spread” in the Chengdu Plain, forming a spatial correspondence with the “ center-edge” transportation economic pattern [74]. The main conclusions are as follows:
(1)
Multidimensional coupling assessment system evaluation results
① The strong correlation between land use intensity (LUI) and economic development: From 2000 to 2020, the proportion of the LUI in the Chengdu–Chongqing Economic Circle increased to 63.28%, showing a significant positive correlation with the growth of the regional economy (from 6.3 trillion yuan in 2019 to 7.8 trillion yuan in 2022). Data from 2022 shows that the LUI average in the core area (main urban areas of Chengdu and Chongqing) is greater than 2.96, indicating a transition into a high-intensity development phase, which confirms the gathering effect of factors under the “dual-core leadership”. In contrast, the low LUI values in the peripheral area (average less than 2.42) reflect the spatial mapping of the ecological priority strategy. Time series analysis shows that the period from 2011 to 2014 was a crucial time for LUI mutations, accounting for 49.83%, reflecting the combined impact of accelerated urbanization and policy regulation.
② Institutional driving characteristics of balance degree of land use structure (BDLUS): The share of BDLUS in the increased region is 82.22%, and the growth rate from 2010 to 2020 has significantly increased (80.19% vs. 65.75%), closely related to institutional innovations such as the “moderate separation of economic zones and administrative zones reform.” In terms of space, the BDLUS hot spots in the Yangtze River city cluster (Luzhou-Yibin) account for 21.96%, highlighting the role of the Yangtze River Economic Belt strategy in promoting functional restructuring. However, the central transitional zone between Chengdu and Chongqing (Nanchong, Guang’an) still faces structural imbalances with cold spots (accounting for 18.81%), necessitating a strengthening of cross-regional collaborative governance.
③ Dual differentiation of the “center-edge” in coupling coordination degree (CCD): The CCD enhancement area accounts for 84.02%, with significant progress in overall collaboration; however, the center area (CCD > 0.68) and the edge areas (Ya’an-Lei Shan, northeastern Dazhou) exhibit a “stable-imbalance” differentiation. The cold spots in marginal areas (accounting for 9.80%) are related to restricted development rights in ecologically sensitive areas, while the reduction in cold spots in the main and tributary streams of the Yangtze River (8.52%) reflects the effectiveness of ecological compensation policies. Time-series anomaly analysis indicates that around 2010 is a critical period for CCD regulatory thresholds, highlighting the need to pay attention to policy lag effects.
(2)
Analysis of the composite driving mechanism of terrain and human activities
Quantitative factor analysis shows that elevation explains 0.489, 0.037, and 0.219 of the variances in LUI, BDLUS, and CCD, respectively, indicating a significant terrain constraint effect. However, the interactive effect of human activity factors (nighttime light) leads to an increase in explanatory power by 219.49%, making it the dominant driving force for CCD in 2020 (the explanatory power of elevation × nighttime light is 0.295), revealing the deep impacts of urbanization and industrial transformation.
① The fundamental control effect of topographical factors is significant but shows a decreasing trend: the explanatory power of elevation for LUI remains at a high level of 0.481–0.503, while slope has an explanatory power of 0.455, confirming the basic applicability of “topographic determinism” in mountain urban agglomerations. It is noteworthy that the independent explanatory power of topographical factors has shown a systematic decline over time (the q-value of elevation in 2022 decreased by 3.96% compared to 2000), and this attenuation effect is significantly negatively correlated with the increasing intensity of human activities, indicating that technological advancements and engineering measures are partially breaking through the constraints of natural topography.
② The nonlinear enhancement effect of human activity factors stands out: the interaction between nighttime light index and population density accounts for an increase of 219.49% in the explanatory power of CCD, with this synergistic effect peaking in 2020 (q = 0.295). This indicates that their contribution to land use change will surpass that of terrain factors, marking that the study area has entered a “human-dominated” development phase.
③ The driving mechanism exhibits dynamic evolutionary characteristics: In 2000, the dominant interactive combination was elevation × population density (q = 0.246); by 2010, it shifted to elevation × GDP (q = 0.227); and by 2020, it was represented by elevation × nighttime lights (q = 0.295). This evolutionary path of “population agglomeration → economic development → spatial reconstruction” validates the transformation process of regional coordinated development from factor-driven to innovation-driven.
These findings provide new perspectives on understanding the coupling mechanisms between human and environmental systems in complex terrain areas: during the accelerated phase of urbanization, the constraints of topography exhibit a “diminishing marginal effect,” while human activities achieve “breakthroughs of natural limitations” through technological innovation and spatial restructuring. Future land use planning should establish a dynamic balance framework of “topographic adaptability–human initiative,” formulating differentiated management strategies based on different stages of development and regional types.

Author Contributions

Conceptualization, Z.Y. and H.L.; methodology, Z.Y., C.Z. and H.L.; software, Z.Y., C.Z. and H.L.; validation, Z.Y., C.Z. and Z.T.; formal analysis, Z.Y.; investigation, Z.Y. and C.Z.; resources, H.L.; data curation, Z.Y., C.Z., Z.T. and H.W.; writing—original draft preparation, Z.Y.; writing—review and editing, Z.Y. and H.L.; visualization, Z.Y., C.Z., Z.T. and H.W.; supervision, H.L.; project administration, H.L.; funding acquisition, H.L. All authors have read and agreed to the published version of the manuscript.

Funding

This research was funded by the National Natural Science Foundation of China, grant number 41501291, and the Sichuan Tianfu New District Rural Revitalization Research Institute’s ‘Announce the list and take charge’ Project, grant number XZY1-14. The APC was funded by Hao Li.

Data Availability Statement

The original contributions presented in the study are included in the article, further inquiries can be directed to the corresponding author.

Acknowledgments

We express our gratitude to the anonymous reviewers and editors for their professional comments and suggestions.

Conflicts of Interest

The authors declare no conflicts of interest.

References

  1. Cheng, H. Evaluation and Analysis of High-Quality Development of New Urbanization Based on Intelligent Computing. Math. Probl. Eng. 2022, 2022, 6428970. [Google Scholar] [CrossRef]
  2. Wang, H.; Kong, X.; Luo, J.; Li, P.; Chen, X.; Xie, T. An Approach to Urban System Spatial Planning in Chengdu Chongqing Economic Circle Using Geospatial Big Data. Front. Earth Sci. 2023, 11, 1252597. [Google Scholar] [CrossRef]
  3. Ding, R.; Fu, J.; Zhang, Y.; Zhang, T.; Yin, J.; Du, Y.; Zhou, T.; Du, L. Research on the Evolution of the Economic Spatial Pattern of Urban Agglomeration and Its Influencing Factors, Evidence from the Chengdu-Chongqing Urban Agglomeration of China. Sustainability 2022, 14, 10969. [Google Scholar] [CrossRef]
  4. Wang, M.; Wang, L. Study on Land Use Change and Driving Force in Chengdu-Chongqing Urban Agglomeration. ITM Web Conf. 2022, 47, 03037. [Google Scholar] [CrossRef]
  5. Zeng, C.; He, J.; He, Q.; Mao, Y.; Yu, B. Assessment of Land Use Pattern and Landscape Ecological Risk in the Cheng-du-Chongqing Economic Circle, Southwestern China. Land 2022, 11, 659. [Google Scholar] [CrossRef]
  6. Zhong, Q.; Li, Z.; He, Y. Coupling Evaluation and Spatial-Temporal Evolution of Land Ecosystem Services and Economic-Social Development in a City Group: The Case Study of the Chengdu-Chongqing City Group. Int. J. Environ. Res. Public Health 2023, 20, 5095. [Google Scholar] [CrossRef]
  7. Liu, H.; Lu, G.; Luo, K.; Zong, H. Measurement and Spatio-Temporal Pattern Evolution of Urban-Rural Integration Development in the Chengdu-Chongqing Economic Circle. Land 2024, 13, 942. [Google Scholar] [CrossRef]
  8. Liu, J.; Jin, X.; Xu, W.; Gu, Z.; Yang, X.; Ren, J.; Fan, Y.; Zhou, Y. A New Framework of Land Use Efficiency for the Coordination Among Food, Economy and Ecology in Regional Development. Sci. Total Environ. 2019, 697, 135670. [Google Scholar] [CrossRef]
  9. Hu, J.; Huang, Y.; Du, J. The Impact of Urban Development Intensity on Ecological Carrying Capacity: A Case Study of Ecologically Fragile Areas. Int. J. Environ. Res. Public Health 2021, 18, 7094. [Google Scholar] [CrossRef]
  10. Tan, S.; Liu, Q.; Han, S. Spatial-Temporal Evolution of Coupling Relationship Between Land Development Intensity and Resources Environment Carrying Capacity in China. J. Environ. Manag. 2021, 301, 113778. [Google Scholar] [CrossRef]
  11. Sang, X.; Guo, Q.; Wu, X.; Fu, Y.; Xie, T.; He, C.; Zang, J. Intensity and Stationarity Analysis of Land Use Change Based on CART Algorithm. Sci. Rep. 2019, 9, 12239. [Google Scholar] [CrossRef]
  12. Felipe-Lucia, M.; Soliveres, S.; Penone, C.; Fischer, M.; Ammer, C.; Boch, S.; Boeddinghaus, R.; Bonkowski, M.; Buscot, F.; Fiore-Donno, A.; et al. Land-Use Intensity Alters Networks Between Biodiversity, Ecosystem Functions, and Services. Proc. Natl. Acad. Sci. USA 2020, 117, 28140–28149. [Google Scholar] [CrossRef]
  13. Zheng, W.; Ke, X.; Xiao, B.; Zhou, T. Optimising Land Use Allocation to Balance Ecosystem Services and Economic Benefits—A Case Study in Wuhan, China. J. Environ. Manag. 2019, 248, 109306. [Google Scholar] [CrossRef]
  14. Huo, J.; Shi, Z.; Zhu, W.; Xue, H.; Chen, X. A Multi-Scenario Simulation and Optimization of Land Use with a Markov–FLUS Coupling Model: A Case Study in Xiong′an New Area, China. Sustainability 2022, 14, 2425. [Google Scholar] [CrossRef]
  15. Cui, D.; Chen, X.; Xue, Y.; Li, R.; Zeng, W. An Integrated Approach to Investigate the Relationship of Coupling Coordination Between Social Economy and Water Environment on Urban Scale: A Case Study of Kunming. J. Environ. Manag. 2019, 234, 189–199. [Google Scholar] [CrossRef]
  16. Tepe, E. History, Neighborhood, and Proximity as Factors of Land-Use Change: A Dynamic Spatial Regression Model. Environ. Plan. B Urban Anal. City Sci. 2023, 51, 7–22. [Google Scholar] [CrossRef]
  17. Li, G.; Zhang, X. The Spatial-Temporal Characteristics and Driving Forces of the Coupled and Coordinated Development Between New Urbanization and Rural Revitalization. Sustainability 2023, 15, 16487. [Google Scholar] [CrossRef]
  18. Liu, X.; Liang, X.; Li, X.; Xu, X.; Ou, J.; Chen, Y.; Li, S.; Wang, S.; Pei, F. A Future Land Use Simulation Model (FLUS) for Simulating Multiple Land Use Scenarios by Coupling Human and Natural Effects. Landsc. Urban Plan. 2017, 168, 94–116. [Google Scholar] [CrossRef]
  19. Majumdar, D.; Biswas, A. Quantifying Land Surface Temperature Change from LISA Clusters: An Alternative Approach to Identifying Urban Land Use Transformation. Landsc. Urban Plann. 2016, 153, 51–65. [Google Scholar] [CrossRef]
  20. Fang, C.; Li, G.; Wang, S. Changing and Differentiated Urban Landscape in China: Spatiotemporal Patterns and Driving Forces. Environ. Sci. Technol. 2016, 50, 2217–2227. [Google Scholar] [CrossRef]
  21. Gao, Y.; Wang, Z.; Xu, F. Geospatial Characteristics and the Application of Land Use Functions in the Yangtze River Economic Belt, China: Perspectives on Provinces and Urban Agglomerations. Ecol. Indic. 2023, 155, 110969. [Google Scholar] [CrossRef]
  22. Xue, Y.; Ma, W.; Liu, L.; Yang, Y. Land Use Evolution and Its Driving Factors over the Past 30 Years in Luochuan County. Forests 2024, 15, 1346. [Google Scholar] [CrossRef]
  23. Hoch, J.M.; Sutanudjaja, E.H.; Wanders, N.; van Beek, L.P.H.; Bierkens, M.F.P. Hyper-Resolution PCR-GLOBWB: Opportunities and Challenges from Refining Model Spatial Resolution to 1 km over the European Continent. Hydrol. Earth Syst. Sci. 2023, 27, 1383–1399. [Google Scholar] [CrossRef]
  24. Gao, J.; Pesaresi, M. Downscaling SSP-Consistent Global Spatial Urban Land Projections from 1/8-Degree to 1-km Resolution 2000–2100. Sci. Data 2021, 8, 281. [Google Scholar] [CrossRef]
  25. Li, X.; Chen, G.; Liu, X.; Liang, X.; Wang, S.; Chen, Y.; Pei, F.; Xu, X. A New Global Land-Use and Land-Cover Change Product at a 1-km Resolution for 2010 to 2100 Based on Human-Environment Interactions. Ann. Am. Assoc. Geogr. 2017, 107, 1040–1059. [Google Scholar] [CrossRef]
  26. Luo, M.; Hu, G.; Chen, G.; Liu, X.; Hou, H.; Li, X. 1 km Land Use/Land Cover Change of China Under Comprehensive Socioeconomic and Climate Scenarios for 2020–2100. Sci. Data 2022, 9, s41597-022-01204-w. [Google Scholar] [CrossRef]
  27. Dong, X.; Ye, Y.; Yang, R.; Li, X. Planning for Green Infrastructure Based on Integration of Multi-Driving Factors: A Case Study in Pilot Site of Sponge City. Sustain. Cities Soc. 2023, 102, 104549. [Google Scholar] [CrossRef]
  28. Masroor, M.; Avtar, R.; Sajjad, H.; Choudhari, P.; Kulimushi, L.; Khedher, K.; Komolafe, A.; Yunus, A.; Sahu, N. Assessing the Influence of Land Use/Land Cover Alteration on Climate Variability: An Analysis in the Aurangabad District of Maharashtra State, India. Sustainability 2022, 14, 642. [Google Scholar] [CrossRef]
  29. Chen, Y.; Wang, J.; Xiong, N.; Sun, L.; Xu, J. Impacts of Land Use Changes on Net Primary Productivity in Urban Agglomerations under Multi-Scenarios Simulation. Remote Sens. 2022, 14, 1755. [Google Scholar] [CrossRef]
  30. Verbesselt, J.; Hyndman, R.; Newnham, G.; Culvenor, D. Detecting Trend and Seasonal Changes in Satellite Image Time Series. Remote Sens. Environ. 2010, 114, 106–115. [Google Scholar] [CrossRef]
  31. Hutchinson, J.; Jacquin, A.; Hutchinson, S.; Verbesselt, J. Monitoring Vegetation Change and Dynamics on U.S. Army Training Lands Using Satellite Image Time Series Analysis. J. Environ. Manag. 2015, 150, 355–366. [Google Scholar] [CrossRef]
  32. Sun, F.; Zhang, N.; Hu, Y.; Tang, J. Research on the Urban Network Structure of the Chengdu-Chongqing Economic Circle from the Perspective of “Space of Flows”. World Reg. Stud. 2024, 33, 147–162. (In Chinese) [Google Scholar]
  33. Niu, Z.; Yang, X.; Chen, C.; Liao, X.; Zhang, X. Analysis of Urban Economic Development Characteristics in the Chengdu-Chongqing Urban Agglomeration Using Nighttime Light Remote Sensing. Nat. Resour. Remote Sens. 2024, 36, 272–281. [Google Scholar]
  34. Deng, Y.; Chen, H.; Hai, Y.; Zhou, J.; Ji, Z.; Luo, J.; Li, L. Spatial Pattern of Land Use Carbon Emissions and Carbon Balance Zoning in the Chengdu-Chongqing Twin-City Economic Circle. Bull. Soil Water Conserv. 2024, 44, 337–346. [Google Scholar] [CrossRef]
  35. Zhang, T.; Cheng, C.; Wu, X. Mapping the Spatial Heterogeneity of Global Land Use and Land Cover from 2020 to 2100 at a 1 km Resolution. Sci. Data 2023, 10, 1. [Google Scholar] [CrossRef]
  36. Zhang, X.; Liu, L.; Chen, X.; Gao, Y.; Xie, S.; Mi, J. GLC_FCS30: Global Land-Cover Product with Fine Classification System at 30 m Using Time-Series Landsat Imagery. Earth Syst. Sci. Data 2021, 13, 2753–2776. [Google Scholar] [CrossRef]
  37. Zhuang, D.; Liu, J. Modeling of Regional Differentiation of Land-Use Degree in China. Chin. Geogr. Sci. 1997, 7, 302–309. [Google Scholar] [CrossRef]
  38. Song, X.; Chen, F.; Sun, Y.; Ma, J.; Yang, Y.; Shi, G. Effects of Land Utilization Transformation on Ecosystem Services in Urban Agglomeration on the Northern Slope of the Tianshan Mountains, China. Ecol. Indic. 2024, 162, 112046. [Google Scholar] [CrossRef]
  39. Zhang, L.; Zhang, H.; Xu, E. Information Entropy and Elasticity Analysis of the Land Use Structure Change Influencing Eco-Environmental Quality in Qinghai-Tibet Plateau from 1990 to 2015. Environ. Sci. Pollut. Res. Int. 2022, 29, 18348–18364. [Google Scholar] [CrossRef] [PubMed]
  40. Pan, H.; Du, Z.; Wu, Z.; Zhang, H.; Ma, K. Assessing the Coupling Coordination Dynamics between Land Use Intensity and Ecosystem Services in Shanxi’s Coalfields, China. Ecol. Indic. 2024, 158, 111321. [Google Scholar] [CrossRef]
  41. Luo, S.; Wang, Y.; Huang, Y.; Mao, T. Research on the Coordinated Development of Tourism and Tourism Public Services from the Perspective of Coupling Coordination—A Case Study of 11 Counties in Guilin. J. Soc. Sci. Hunan Univ. Technol. 2023, 28, 42–50. [Google Scholar]
  42. Chen, H.; Wang, Z.; Feng, C.; Luo, Y. Research on Energy-Economy-Environment-Technology Coupling in Resource-Based Cities: A Case Study of Panzhihua. Conserv. Util. Miner. Resour. 2018, 5, 94–105. [Google Scholar]
  43. Gorelick, N.; Hancher, M.; Dixon, M.; Ilyushchenko, S.; Thau, D.; Moore, R. Google Earth Engine: Planetary-Scale Geospatial Analysis for Everyone. Remote Sens. Environ. 2017, 202, 18–27. [Google Scholar] [CrossRef]
  44. Ahmadi, H.; Argany, M.; Ghanbari, A.; Ahmadi, M. Visualized Spatiotemporal Data Mining in Investigation of Urmia Lake Drought Effects on Increasing of PM10 in Tabriz Using Space-Time Cube (2004–2019). Sustain. Cities Soc. 2022, 76, 103399. [Google Scholar] [CrossRef]
  45. Zhao, Y.; Ge, L.; Liu, J.; Liu, H.; Yu, L.; Wang, N.; Zhou, Y.; Ding, X. Analyzing Hemorrhagic Fever with Renal Syndrome in Hubei Province, China: A Space–Time Cube-Based Approach. J. Int. Med. Res. 2019, 47, 3371–3388. [Google Scholar] [CrossRef] [PubMed]
  46. Gao, F.; Li, S.; Tan, Z.; Liao, S. Visualizing the Spatiotemporal Characteristics of Dockless Bike Sharing Usage in Shenzhen, China. J. Geovis. Spat. Anal. 2022, 6, 12. [Google Scholar] [CrossRef]
  47. Yoon, J.; Lee, S. Spatio-Temporal Patterns in Pedestrian Crashes and Their Determining Factors: Application of a Space-Time Cube Analysis Model. Accid. Anal. Prev. 2021, 161, 106291. [Google Scholar] [CrossRef]
  48. Mendes, M.P.; Rodriguez-Galiano, V.; and Aragones, D. Evaluating the BFAST Method to Detect and Characterise Changing Trends in Water Time Series: A Case Study on the Impact of Droughts on the Mediterranean Climate. Sci. Total Environ. 2022, 846, 157428. [Google Scholar] [CrossRef]
  49. Liu, B.; Fang, X.; He, Q.; Rong, Q. Vegetation Change Monitoring Based on MODIS Data and BFAST Method. Remote Sens. Land Resour. 2016, 28, 146–153. [Google Scholar]
  50. Jong, R.D.; Verbesselt, J.; Zeileis, A.; Schaepman, M.E. Shifts in Global Vegetation Activity Trends. Remote Sens. 2013, 5, 1117–1133. [Google Scholar] [CrossRef]
  51. Higginbottom, T.P.; Symeonakis, E. Identifying Ecosystem Function Shifts in Africa Using Breakpoint Analysis of Long-Term NDVI and RUE Data. Remote Sens. 2020, 12, 1894. [Google Scholar] [CrossRef]
  52. Wang, J.F.; Xu, C.D. Geographical Detectors: Principles and Prospects. Acta Geogr. Sin. 2017, 72, 116–134. [Google Scholar] [CrossRef]
  53. Wang, H.; Gao, J.B.; Hou, W. Quantitative Attribution of Soil Erosion in Different Geomorphological Types of Karst Areas Based on Geographical Detector. J. Geogr. Sci. 2019, 29, 271–286. [Google Scholar] [CrossRef]
  54. Ling, Y.I.; Xiong, L.Y.; Yang, X.H. Method of pixelizing GDP data based on the GIS [dataset]. J. Gansu Sci. [CrossRef]
  55. Liu, H.Y.; Jiang, D.; Yang, X.H.; Luo, C. Spatialization Approach to 1km Grid GDP Supported by Remote Sensing. Geoinf. Sci. 2005, 7, 120–123. [Google Scholar]
  56. Zhang, H.; Dong, G.; Wang, J.; Zhang, T.-L.; Meng, X.; Yang, D.; Liu, Y.; Lu, B. Understanding and Extending the Geographical Detector Model under a Linear Regression Framework. Int. J. Geogr. Inf. Sci. 2023, 37, 2437–2453. [Google Scholar] [CrossRef]
  57. Shu, J. Research on the Evolution Characteristics and Influencing Factors of Ecological Land in Chengdu-Chongqing Urban Agglomeration. In Proceedings of the 2021 China Urban Planning Annual Conference (08 Urban Ecological Planning), Huazhong University of Science and Technology, Wuhan, China, 25 September 2021; pp. 56–65. [Google Scholar] [CrossRef]
  58. Zheng, H.; He, Y. How Does Industrial Co-Agglomeration Affect High-Quality Economic Development? Evidence from Chengdu-Chongqing Economic Circle in China. J. Clean. Prod. 2022, 371, 133485. [Google Scholar] [CrossRef]
  59. Xu, Z. Towards Carbon Neutrality in China: A Systematic Identification of China’s Sustainable Land-Use Pathways across Multiple Scales. Sustain. Prod. Consum. 2024, 44, 167–178. [Google Scholar] [CrossRef]
  60. Sun, P.J.; Liu, J.; Luo, N.; Peng, Y.L. Spatial Pattern and Influencing Factors of Shrinking Cities in Chengdu-Chongqing Twin Cities Economic Circle: Analysis Based on the Fifth, Sixth and Seventh National Population Census Data. J. Southwest Univ. (Nat. Sci. Ed.) 2022, 44, 46–56. [Google Scholar] [CrossRef]
  61. Wu, W.; Dang, Y.; Zhao, K.; Chen, Z.; Niu, X. Spatial Nonlinear Effects of Urban Vitality Under the Constraints of Development Intensity and Functional Diversity. Alex. Eng. J. 2023, 77, 645–656. [Google Scholar] [CrossRef]
  62. Chen, W.; Zeng, J.; Li, N. Change in Land-Use Structure Due to Urbanisation in China. J. Clean. Prod. 2021, 322, 128986. [Google Scholar] [CrossRef]
  63. Fosgerau, M.; Kim, J.; Ranjan, A. Vickrey Meets Alonso: Commute Scheduling and Congestion in a Monocentric City. SSRN 2018, 105, 40–53. [Google Scholar] [CrossRef]
  64. Růžička, M.; Mišovičová, R. The General and Special Principles in Landscape Ecology. Ekol. Bratisl. 2009, 28, 1–6. [Google Scholar] [CrossRef]
  65. Guo, Z.; Li, Z.; Lu, C.; She, J.; Zhou, Y. Spatio-Temporal Evolution of Resilience: The Case of the Chengdu-Chongqing Urban Agglomeration in China. Cities 2024, 153, 105226. [Google Scholar] [CrossRef]
  66. Meijers, E. Polycentric Urban Regions and the Quest for Synergy: Is a Network of Cities More than the Sum of the Parts? Urban Stud. 2005, 42, 765–781. [Google Scholar] [CrossRef]
  67. Lu, H.; Zhang, C.; Jiao, L.; Wei, Y.; Zhang, Y. Analysis on the Spatial-Temporal Evolution of Urban Agglomeration Resilience: A Case Study in Chengdu-Chongqing Urban Agglomeration, China. Int. J. Disaster Risk Reduct. 2022, 79, 103167. [Google Scholar] [CrossRef]
  68. Yang, C.; Li, Q.; Hu, Z.; Chen, J.; Shi, T.; Ding, K.; Wu, G. Spatiotemporal Evolution of Urban Agglomerations in Four Major Bay Areas of US, China and Japan from 1987 to 2017: Evidence from Remote Sensing Images. Sci. Total Environ. 2019, 671, 232–247. [Google Scholar] [CrossRef]
  69. Alario, M. Urban and Ecological Planning in Chicago: Science, Policy and Dissent. J. Environ. Plan. Manag. 2000, 43, 489–504. [Google Scholar] [CrossRef]
  70. Li, H.; Farnsworth, A.; Liang, D. Eco-metropolis: Re-interpreting ecological conservation in the context of innovative agglomeration. Environ. Sci. Ecotechnol. 2023, 19, 100342. [Google Scholar] [CrossRef]
  71. Balsas, C.J.L. GIS Buildout Analysis and Urban Planning. Chin. J. Urban Environ. Stud. 2021, 9, 2150006. [Google Scholar] [CrossRef]
  72. Tu, D.; Cai, Y.; Liu, M. Coupling coordination analysis and spatiotemporal heterogeneity between ecosystem services and new-type urbanization: A case study of the Yangtze River Economic Belt in China. Ecol. Indic. 2023, 154, 110535. [Google Scholar] [CrossRef]
  73. Zhao, J.; Zhao, Y. Synergy/trade-offs and differential optimization of production, living, and ecological functions in the Yangtze River Economic Belt, China. Ecol. Indic. 2023, 147, 109925. [Google Scholar] [CrossRef]
  74. Wang, C.X.; Chen, J.; Wan, Y.; Miao, G.H.; Liu, K.L.; Yi, T. Research on the spatial pattern and coupling coordination level of transportation and economic development in the Chengdu-Chongqing Twin Cities Economic Circle. Transp. Res. 2023, 9, 82–90. [Google Scholar] [CrossRef]
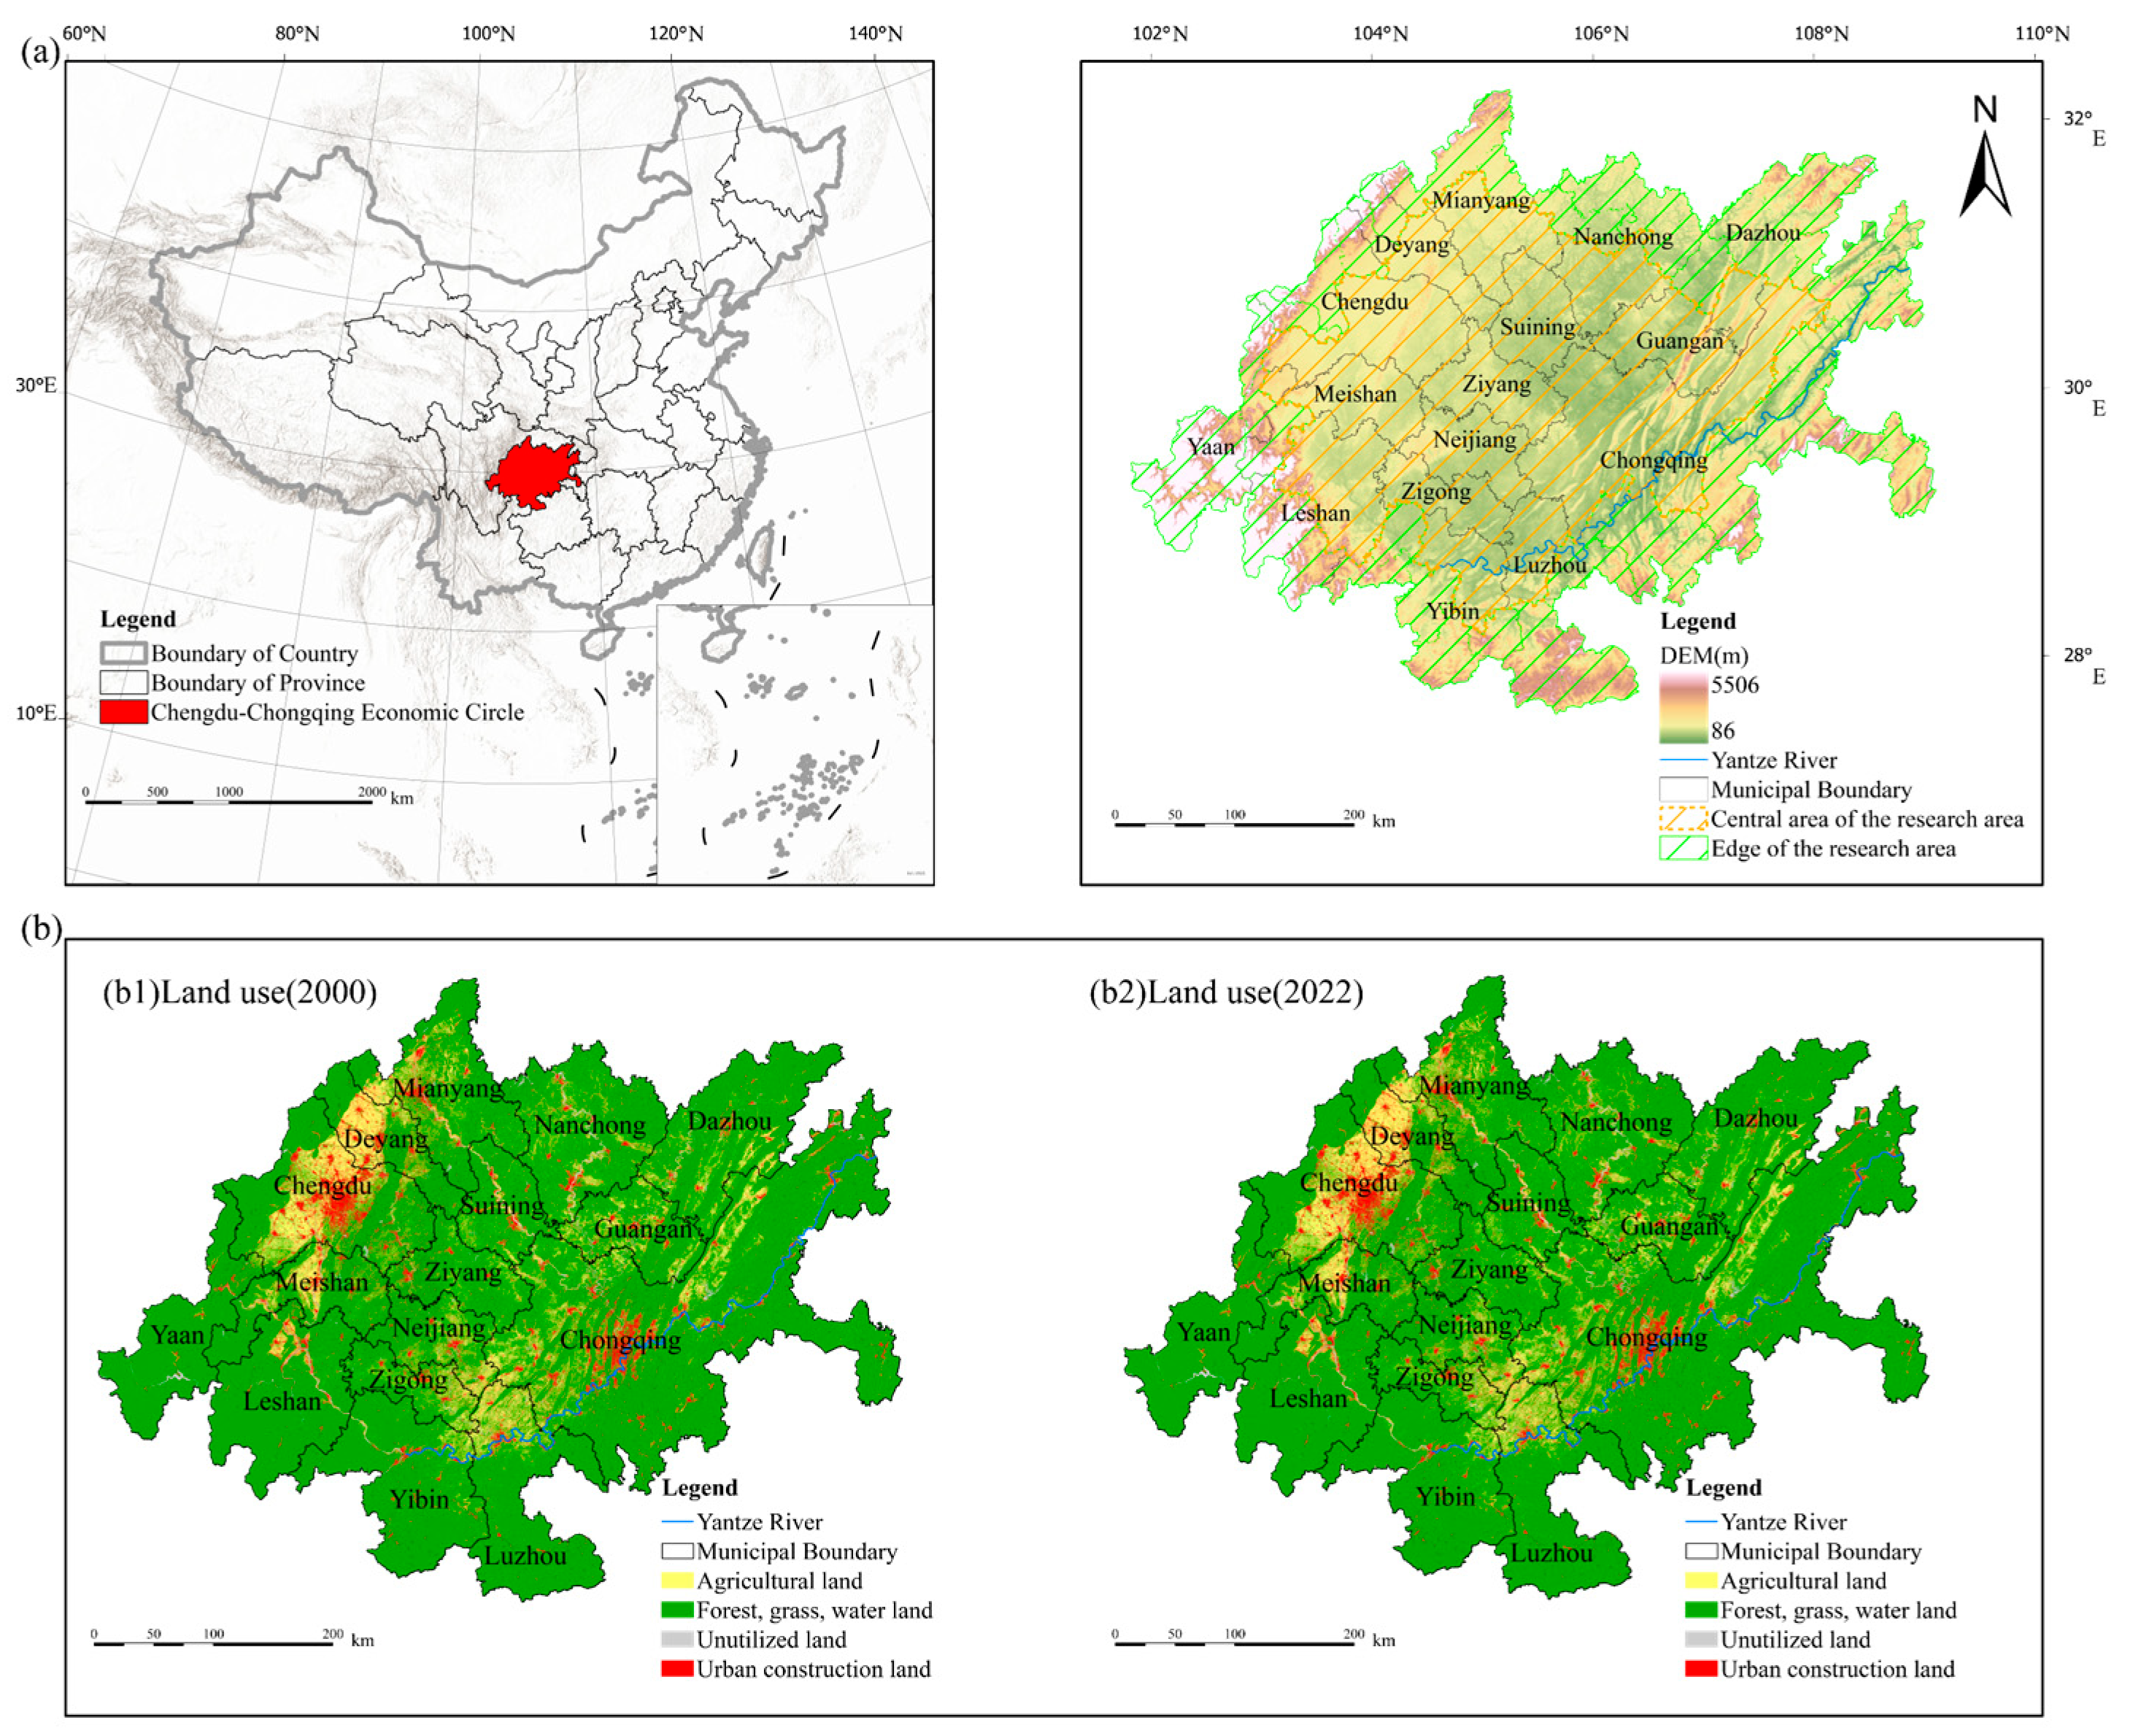
Figure 1. Overview map of the study area. (a) The left map shows the map of the People’s Republic of China, and the right map overlays the topographic elevation and research zoning of the Chengdu–Chongqing Economic Circle; (b) Spatiotemporal evolution map of land use types in the Chengdu–Chongqing Economic Circle, (b1) spatial distribution map of land use types in 2000, (b2) spatial distribution map of land use types in 2022.
Land 14 01597 g001
Figure 2. Overall methodological framework.
Land 14 01597 g002
Figure 3. Spatial–temporal distribution diagram of LUI, BDLUS and CCD. (ac) are the spatiotemporal distribution maps of LUI for 2000, 2010, and 2022, respectively; (df) are the spatiotemporal distribution maps of BDLUS for 2000, 2010, and 2022, respectively; (gi) are the spatiotemporal distribution maps of CCD for 2000, 2010, and 2022, respectively.
Land 14 01597 g003
Figure 4. Land area spatiotemporal variation chord chart of LUI, BDLUS and CCD (km2). (a) Map of land use intensity transfer areas at various LUI levels (km2); (b) Map of land use balance transfer areas at various BDLUS levels (km2); (c) Map of land use coordination transfer areas at various CCD levels (km2).
Land 14 01597 g004
Figure 5. Distribution patterns of LUI, BDLUS, and CCD cold and hot spots from 2000 to 2022. Based on the spatial zoning scheme of the study area in Figure 1, a regional statistical analysis of cold and hot spots was conducted. The red subzone legend represents the Central area of the research area (CA) internally, while the surrounding area indicates the Edge of the research area (EA).
Land 14 01597 g005
Figure 6. Schematic diagram of the area distribution ratio of LUI, BDLUS, and CCD cold and hot spots. CHS is Consecutive Hot Spot; DHS is Diminishing Hot Spot; HHS is Historical Hot Spot; IHS is Intensifying Hot Spot; NHS is New Hot Spot; OHS is Oscillating Hot Spot; PHS is Persistent Hot Spot; SHS is Sporadic Hot Spot; CCS is Consecutive Cold Spot; DCS is Diminishing Cold Spot; HCS is Historical Cold Spot; ICS is Intensifying Cold Spot; NCS is New Cold Spot; OCS is Oscillating Cold Spot; PCS is Persistent Cold Spot; SCS is Sporadic Cold Spot. -CA means the central area of the research area; -EA means the edge of the research area.
Land 14 01597 g006
Figure 7. Spatial distribution of nonlinear change trend of LUI, BDLUS and CCD from 2000 to 2022. This figure illustrates the geospatial patterns of the nonlinear change trends of LUI, BDLUS, and CCD over a 22-year period. Different colors in the figure represent the spatial distribution characteristics of the nonlinear change trends for each of the three indicators.
Land 14 01597 g007
Figure 8. Proportion of area occupied by nonlinear trend variation in LUI, BDLUS and CCD from 2000 to 2022. MI is monotonic increase; MD is monotonic decrease; II is interrupted increase; ID is interrupted decrease; ITD is increase to decrease; DTI is decrease to increase. The orange legend represents LUI, the blue represents BDLUS, and the green represents CCD.
Land 14 01597 g008
Figure 9. Year of change in LUI, BDLUS, CCD nonlinear trend. This figure shows the years in which significant changes in the nonlinear trends of LUI, BDLUS, and CCD were detected.
Land 14 01597 g009
Figure 10. Distribution of explanatory power of different factors of LUI, BDLUS and CCD in each representative year. NL is nighttime lights; PD is population density. This figure illustrates the relative contribution of different driving factors to variations in three key metrics: LUI, BDLUS and CCD in selected representative years.
Land 14 01597 g010
Figure 11. LUI, BDLUS and CCD leading interaction factors in each representative year. This figure uses a heatmap to visually display the strongest two-factor interaction combinations affecting the three key indicators—LUI, BDLUS, and CCD—across different representative years, along with their relative impact strengths. Darker colors indicate a stronger influence of the two-factor interaction on the corresponding indicator in that year, while lighter colors indicate a weaker influence.
Land 14 01597 g011
Figure 12. Distribution pattern map of cold spots in the Eastern Sichuan Parallel Ridge Valley area.
Land 14 01597 g012
Table 1. Basic data sources and descriptions.
Data TypeData NameTime Cross-Section (Year)Spatial ResolutionData Source
Land Use DataGLC_FCS30 Fine Land Cover2000–202230 mCASEarth Thematic Data System (https://data.casearth.cn/thematic/glc_fcs30/314, accessed on 15 March 2024)
Human Activity DataNighttime lights2000–2020500 mNational Earth System Science Data Center, National Science and Technology Infrastructure of China (http://www.geodata.cn)
GDP1 kmResource Environment Science and Data Platform (https://www.resdc.cn)
Population density30 arc secondsGlobPOP Dataset (https://zenodo.org/records/11071404, accessed on 12 July 2024)
Terrain DataElevation202230 mResource Environment Science and Data Platform (https://www.resdc.cn)
Administrative Boundary DataAdministrative boundary20201:1,000,000National Geographic Information Resource Directory Service System (https://www.webmap.cn)
Table 2. GLC_FCS30 land use types and LUI assignment. The relationship between specific land cover types and land use types.
LC IdClassification SystemAssignmentLC IdClassification SystemAssignment
10Rainfed cropland3140Lichens and mosses2
11Herbaceous cover cropland2150Sparse vegetation (fc < 0.15)2
12Tree or shrub cover (Orchard) cropland2152Sparse shrubland (fc < 0.15)2
20Irrigated cropland3153Sparse herbaceous (fc < 0.15)2
51Open evergreen broadleaved forest2181Swamp1
52Closed evergreen broadleaved forest2182Marsh1
61Open deciduous broadleaved forest (0.15 < fc < 0.4)2183Flooded flat1
62Closed deciduous broadleaved forest (fc > 0.4)2184Saline1
71Open evergreen needle-leaved forest (0.15 < fc < 0.4)2185Mangrove2
72Closed evergreen needle-leaved forest (fc > 0.4)2186Salt marsh1
81Open deciduous needle-leaved forest (0.15 < fc < 0.4)2187Tidal flat1
82Closed deciduous needle-leaved forest (fc > 0.4)2190Impervious surfaces4
91Open mixed leaf forest (broadleaved and needle-leaved)2200Bare areas1
92Closed mixed leaf forest (broadleaved and needle-leaved)2201Consolidated bare areas1
120Shrubland2202Unconsolidated bare areas1
121Evergreen shrubland2210Water body1
122Deciduous shrubland2220Permanent ice and snow1
130Grassland20, 250Filled value0
Table 3. Land use intensity classification system.
TypeUnused Land LevelForest, Grassland, and Water Land LevelAgricultural Land LevelTown Settlement Land Level
Land use typeUnused or difficult-to-utilize landWoodland, grassland, water areaArable land, garden land, artificial turfUrban areas, residential areas, industrial and mining land, transportation land
Graded Index1234
Table 4. Results of the trend types of LUI, BDLUS and CCD detected by BFAST.
Type NameMeanings
Monotonic increase (MI)No obvious mutations were detected, or one obvious mutation was detected; the overall trend shows a monotonic increase.
Monotonic decrease (MD)No obvious mutations were detected, or one obvious mutation was detected; the overall trend shows a monotonic decrease.
Interrupted increase (II)A significant mutation was detected, with the trend showing a significant negative disturbance during the increase.
Interrupted decrease (ID)A significant mutation was detected, with the trend showing a significant positive disturbance during the reduction.
Increase to decrease (ITD)Detected one significant mutation, with the trend shifting from an increase to a decrease.
Decrease to increase (DTI)Detected one significant mutation, with the trend shifting from a decrease to an increase.
Table 5. Types of interaction detection.
Criteria for DiscriminationInteraction
q ( X 1 X 2 ) < M i n [ q X 1 ,   q X 2 ] Nonlinear attenuation
M i n [ q X 1 ,   q X 2 ] < q ( X 1 X 2 ) < M a x [ q X 1 ,   q X 2 ] Single-factor nonlinear attenuation
q ( X 1 X 2 ) > M a x [ q X 1 ,   q X 2 ] Dual factor enhancement
q X 1 X 2 = q X 1 + q X 2 Independence
q X 1 X 2 > q X 1 + q X 2 Nonlinear enhancement
Table 6. LUI, BDLUS, and CCD indicator grading standards.
LevelLUIBDLUSCCD
Low (L)1.00–1.600.00–0.500.10–0.26
Medium–Low (ML)1.60–2.200.50–1.000.26–0.42
Middle (M)2.20–2.801.00–1.500.42–0.58
Medium–High (ML)2.80–3.401.50–2.000.58–0.74
High (H)3.40–4.002.00–2.500.74–0.90
Disclaimer/Publisher’s Note: The statements, opinions and data contained in all publications are solely those of the individual author(s) and contributor(s) and not of MDPI and/or the editor(s). MDPI and/or the editor(s) disclaim responsibility for any injury to people or property resulting from any ideas, methods, instructions or products referred to in the content.