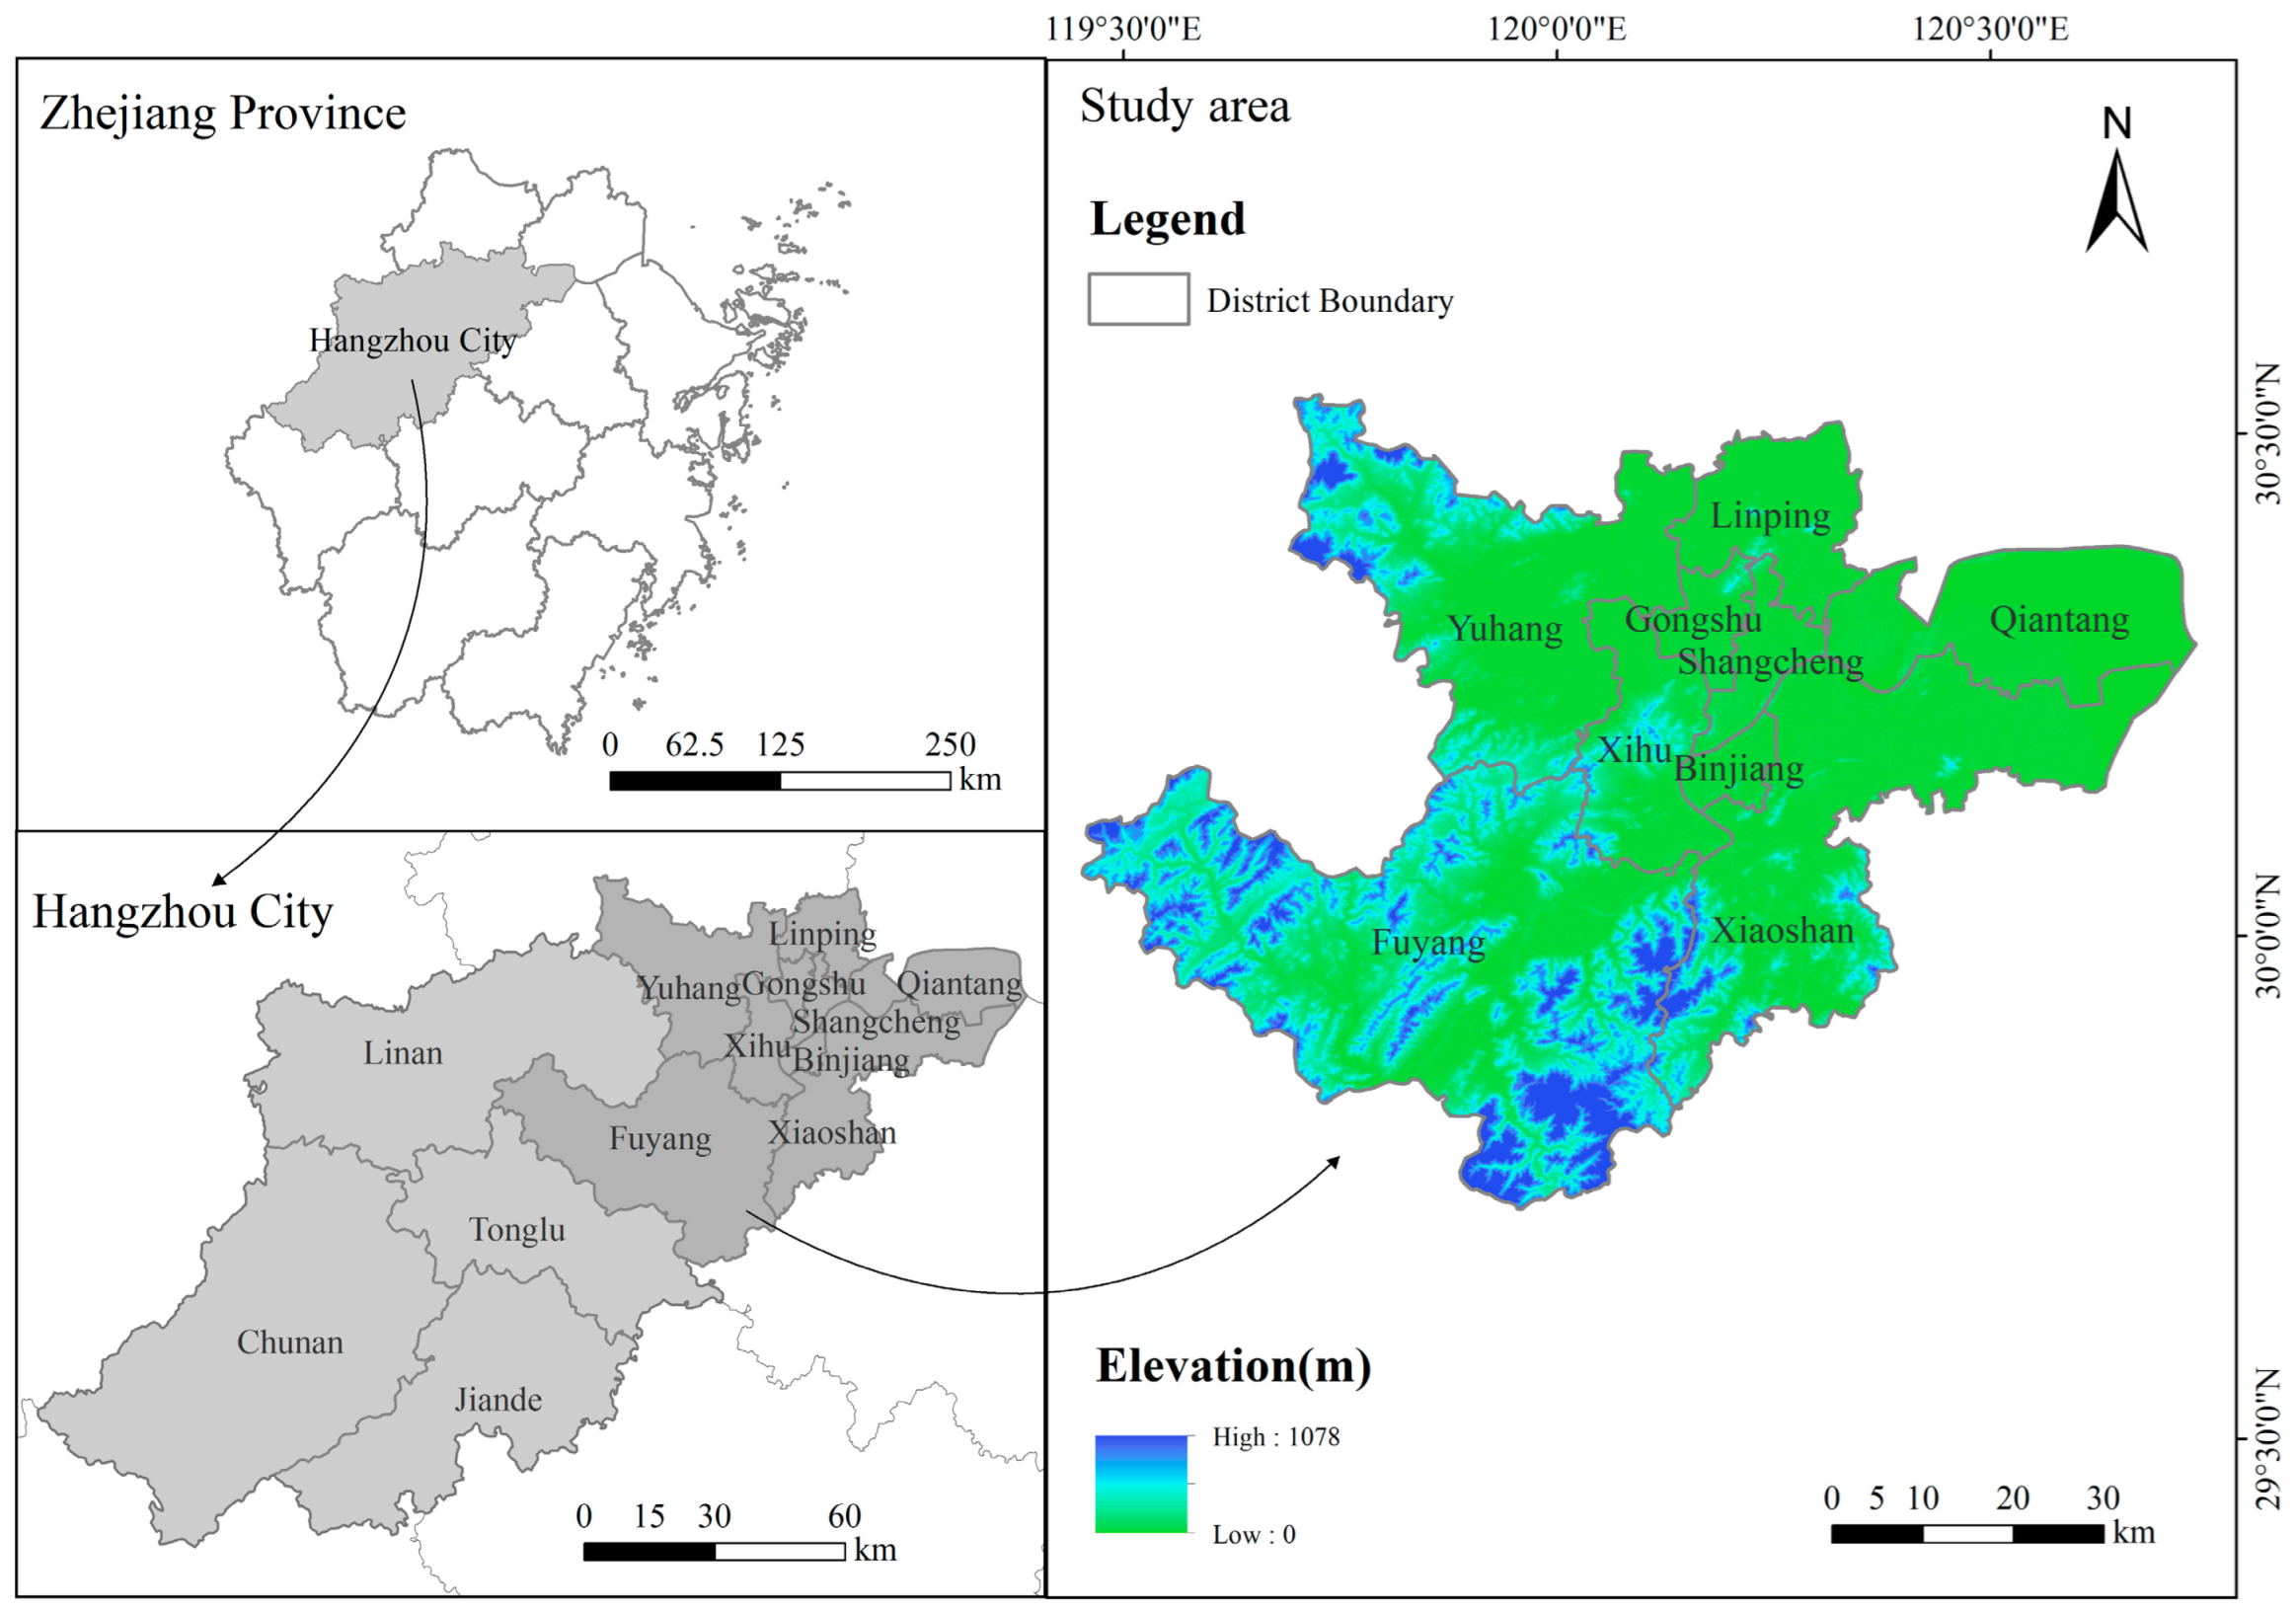
1. Introduction
In the context of ongoing global climate change and carbon neutrality strategies, cities, as major centers of energy consumption and carbon emissions, are facing increasing pressure to reduce carbon emissions [
1]. Integrating ecological principles into urban system research provides a new perspective for understanding the flow and transformation of carbon within cities. Ecosystem service flows focus on the transfer process of ecological services from supply areas (sources) to benefit areas (sinks) [
2]. The source area refers to the region where the ecosystem provides services, while the use area is where humans acquire and utilize these services [
3]. This flow process essentially represents the transfer paths of material and energy flows that are consumed or used by humans within the ecosystem. There is significant spatial heterogeneity in carbon metabolic capacity across different functional zones within the city; high-density, built-up areas exhibit high carbon emission intensity but limited carbon sink capacity, whereas peripheral ecological functional zones have strong carbon absorption capacity but relatively low demand. This spatial mismatch between supply and demand leads to low carbon metabolic efficiency, thereby affecting the overall urban structure and function [
4]. Therefore, studying ecosystem service flows not only helps to reveal the complex spatial processes of urban carbon metabolism but also provides theoretical support for optimizing urban spatial configuration and achieving sustainable development goals [
5].
Among the various types of ecosystem service flows, carbon sequestration represents a key service provided by urban green spaces [
6]. From the perspective of natural processes, carbon sequestration, as an embodiment of ecosystem services, constitutes a direct benefit obtained by humans from natural systems [
7]. Therefore, carbon flow can be regarded as the process through which this service moves from the ecological “source” to the societal “sink” [
8]. To address the spatial flows of ecosystem services, existing studies have proposed theoretical tools, such as the cascade model, the TEEB framework [
9], and the ecosystem service flow and function model [
10]. Although these studies have offered a macro-level understanding of carbon flow, they remain insufficient for capturing the detailed spatial transfer of carbon within urban areas from supply regions to demand regions. Consequently, investigating the spatial processes of carbon emission, sequestration, and transfer within cities from the “source-sink-flow” perspective is expected to provide more refined support for the formulation of effective carbon reduction policies.
Based on this understanding, recent studies on carbon services have attempted to reveal intra-urban carbon flow pathways through approaches like carbon metabolism models and carbon flux analysis [
11,
12,
13]. For example, Zhang et al. [
14] constructed a carbon metabolism model for Beijing from 1990 to 2008 using GIS technology and empirical coefficients, analyzing the carbon flows among 28 socio-economic sectors, including agriculture, industry, and transportation, thereby providing effective empirical guidance for reducing carbon emissions through urban planning. Current carbon metabolism models focus primarily on socio-economic processes [
15,
16], with limited attention to the natural processes among different emission entities. They fail to fully account for the differences in the natural attributes of various emitters within the complex urban system, making it difficult to understand the internal circulation of carbon elements within cities. To address this gap, some studies have attempted to integrate carbon service flows with land use types [
17,
18]. For instance, Xia et al. [
19] combined ecological network analysis with a land use simulation model and proposed a spatially explicit network framework to simulate service flow relationships in urban carbon metabolism. However, in practice, a single land use type often carries multiple functions, making it insufficient as a basic unit for studying carbon flows to comprehensively reflect the actual movement of carbon elements in urban activities. In contrast, the introduction of the “source–sink–flow” network framework, through the classification of urban space based on actual functional zones, enables a methodological shift from static accounting to dynamic process simulation. Unlike previous studies that primarily focused on overall carbon flows between different land use types, such as flows from construction land (carbon sources) to forest land (carbon sinks), while often overlooking the role of green spaces and parks within construction land as carbon sinks, this approach captures the intra-type flows and transformations of carbon sequestration services. By employing a functional zone-based classification, the functional roles of each area within the urban carbon metabolism system—whether as a carbon source, sink, or transmission channel—can be more clearly identified. This allows for a more accurate representation of carbon circulation, transformation, and storage within urban areas, while visually revealing its flow directions and pathways. Therefore, integrating the “source–sink–flow” network framework and shifting the research perspective from conventional land use types to urban functional zones, which can more accurately reflect the complexity of urban activities, is considered essential for accurately assessing urban carbon budgets and carbon flows.
In recent years, the spatial distribution characteristics of urban carbon metabolism have increasingly become a research focus. Various spatial estimation models have been constructed using data from remote sensing [
20], land use [
21], and geospatial data [
22] and other sources to reveal the spatial heterogeneity of urban carbon metabolism. However, current research remains largely at the level of static identification and descriptive characterization [
23,
24], lacking spatial optimization strategies based on carbon metabolism assessment results. This makes it difficult to meet the practical needs of high-carbon cities in emission reduction efforts. By optimizing the spatial structure of high-value carbon metabolism areas, not only can regional carbon reduction potential be explored, but scientific support can also be provided for territorial spatial planning and urban renewal. Therefore, the development of a research framework focused on the spatial pattern optimization of carbon metabolism is of significant theoretical and practical value.
In view of the above research status and challenges, this study develops an integrated analytical framework based on the “source–sink–flow” concept, using urban functional zones as the basic units of analysis to investigate the spatial processes and optimization strategies of intra-urban carbon flows. This framework overcomes the limitations of traditional land use classifications and city-scale carbon accounting by conducting refined analyses at the functional zone level, aiming to comprehensively reveal the complex mechanisms of urban carbon metabolism. Specifically, the study aims to (1) accurately quantify carbon emissions and carbon sequestration capacity within each functional zone based on urban functional zoning and establish a detailed carbon budget inventory; (2) innovatively introduce a network model to explicitly simulate and visualize the spatial flow paths of carbon sequestration services among functional zones, thereby identifying key carbon source areas, carbon sink areas, and weak links within the flow network; and (3) demonstrate how these detailed carbon flow analyses can be utilized to guide and optimize urban spatial configurations, with the goal of enhancing overall urban carbon balance through targeted spatial optimization strategies. This study seeks to fill the gap in macro-level carbon balance research at the intra-urban spatial scale and provide a replicable theoretical and practical reference for other rapidly urbanizing regions.
3. Methodology
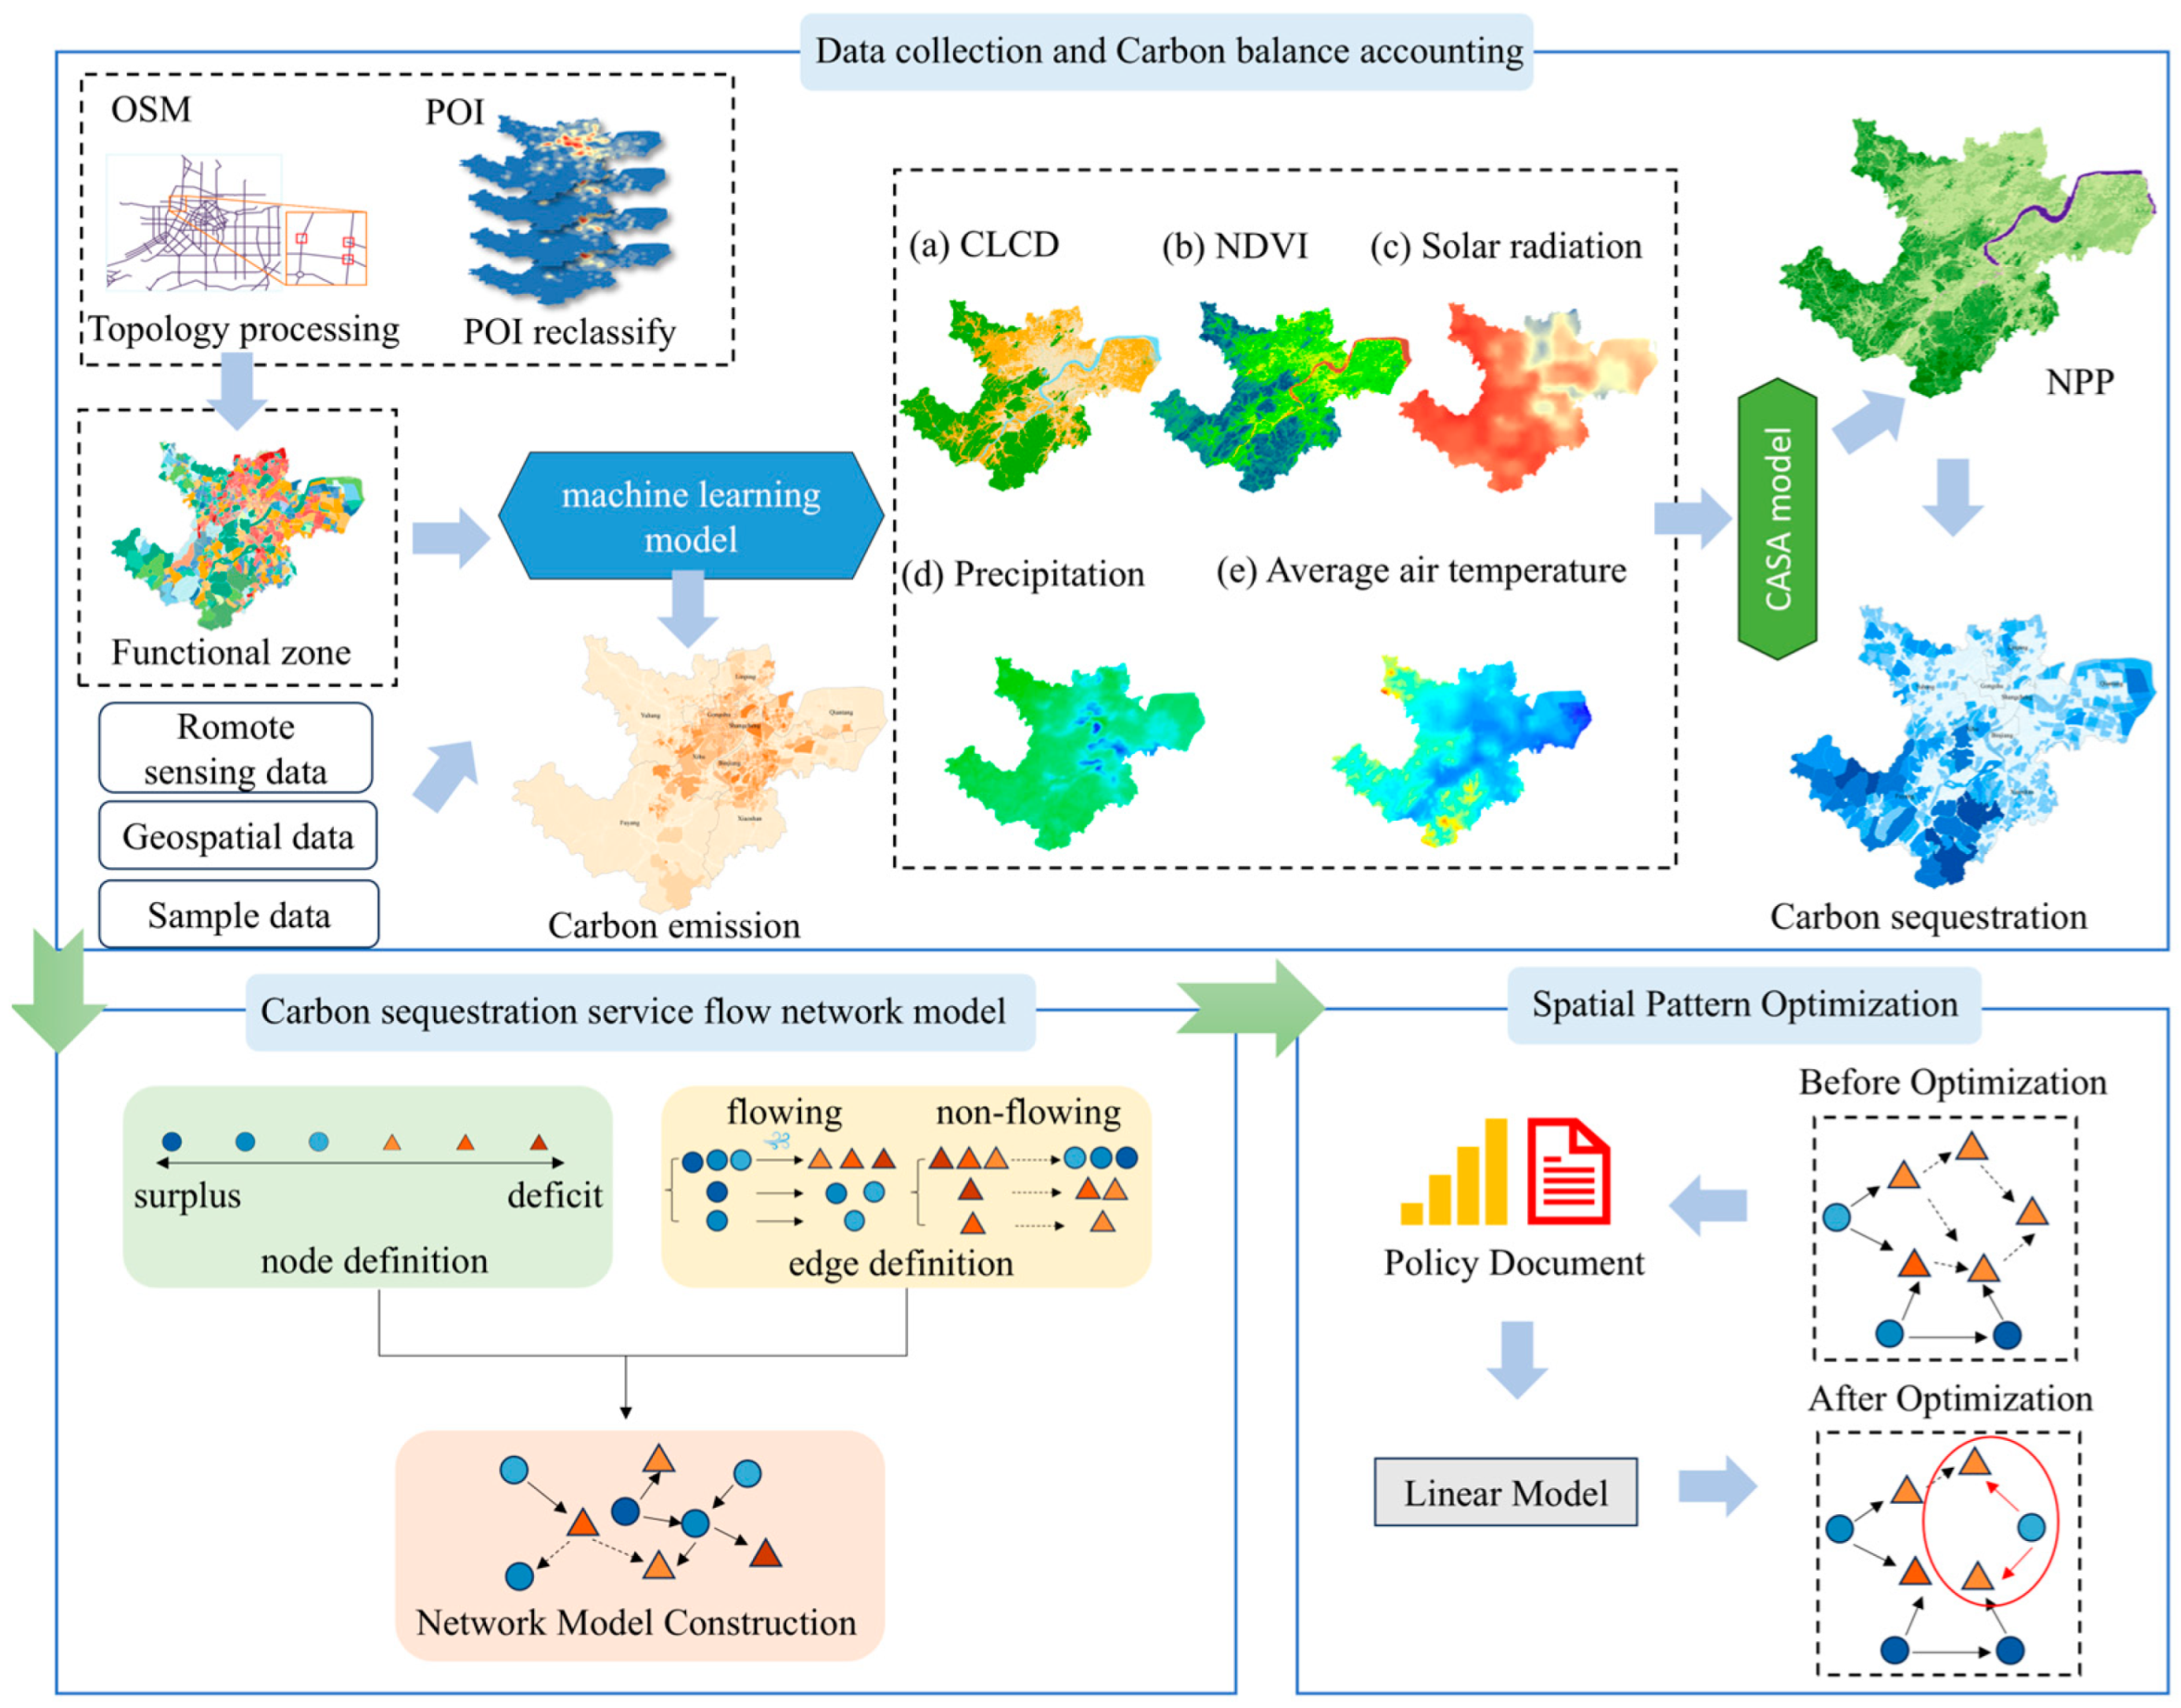
The research framework of this paper consists of three main parts, and the “source-sink-flow” analysis logic is the main line throughout the entire research process. First, based on previous research data and the CASA model, this study evaluated surface carbon fixation and identified the carbon balance at the scale of urban functional zones, thereby clarifying the spatial patterns of “source” and “sink” areas. Second, using a “source–sink–flow” network model, the flow paths of carbon sequestration ecosystem services were quantitatively traced, and key connections and disruptions within the carbon emission process were identified. Finally, a low-carbon land-use structure optimization model was employed to simulate interventions targeting typical deficit nodes, and spatial layout optimization strategies were proposed to support the reconstruction of carbon flow and the balanced regulation of ecosystem service provision across urban functional zones. The specific flow is shown in
Figure 2.
3.1. Functional Zoning and Carbon Emission Accounting
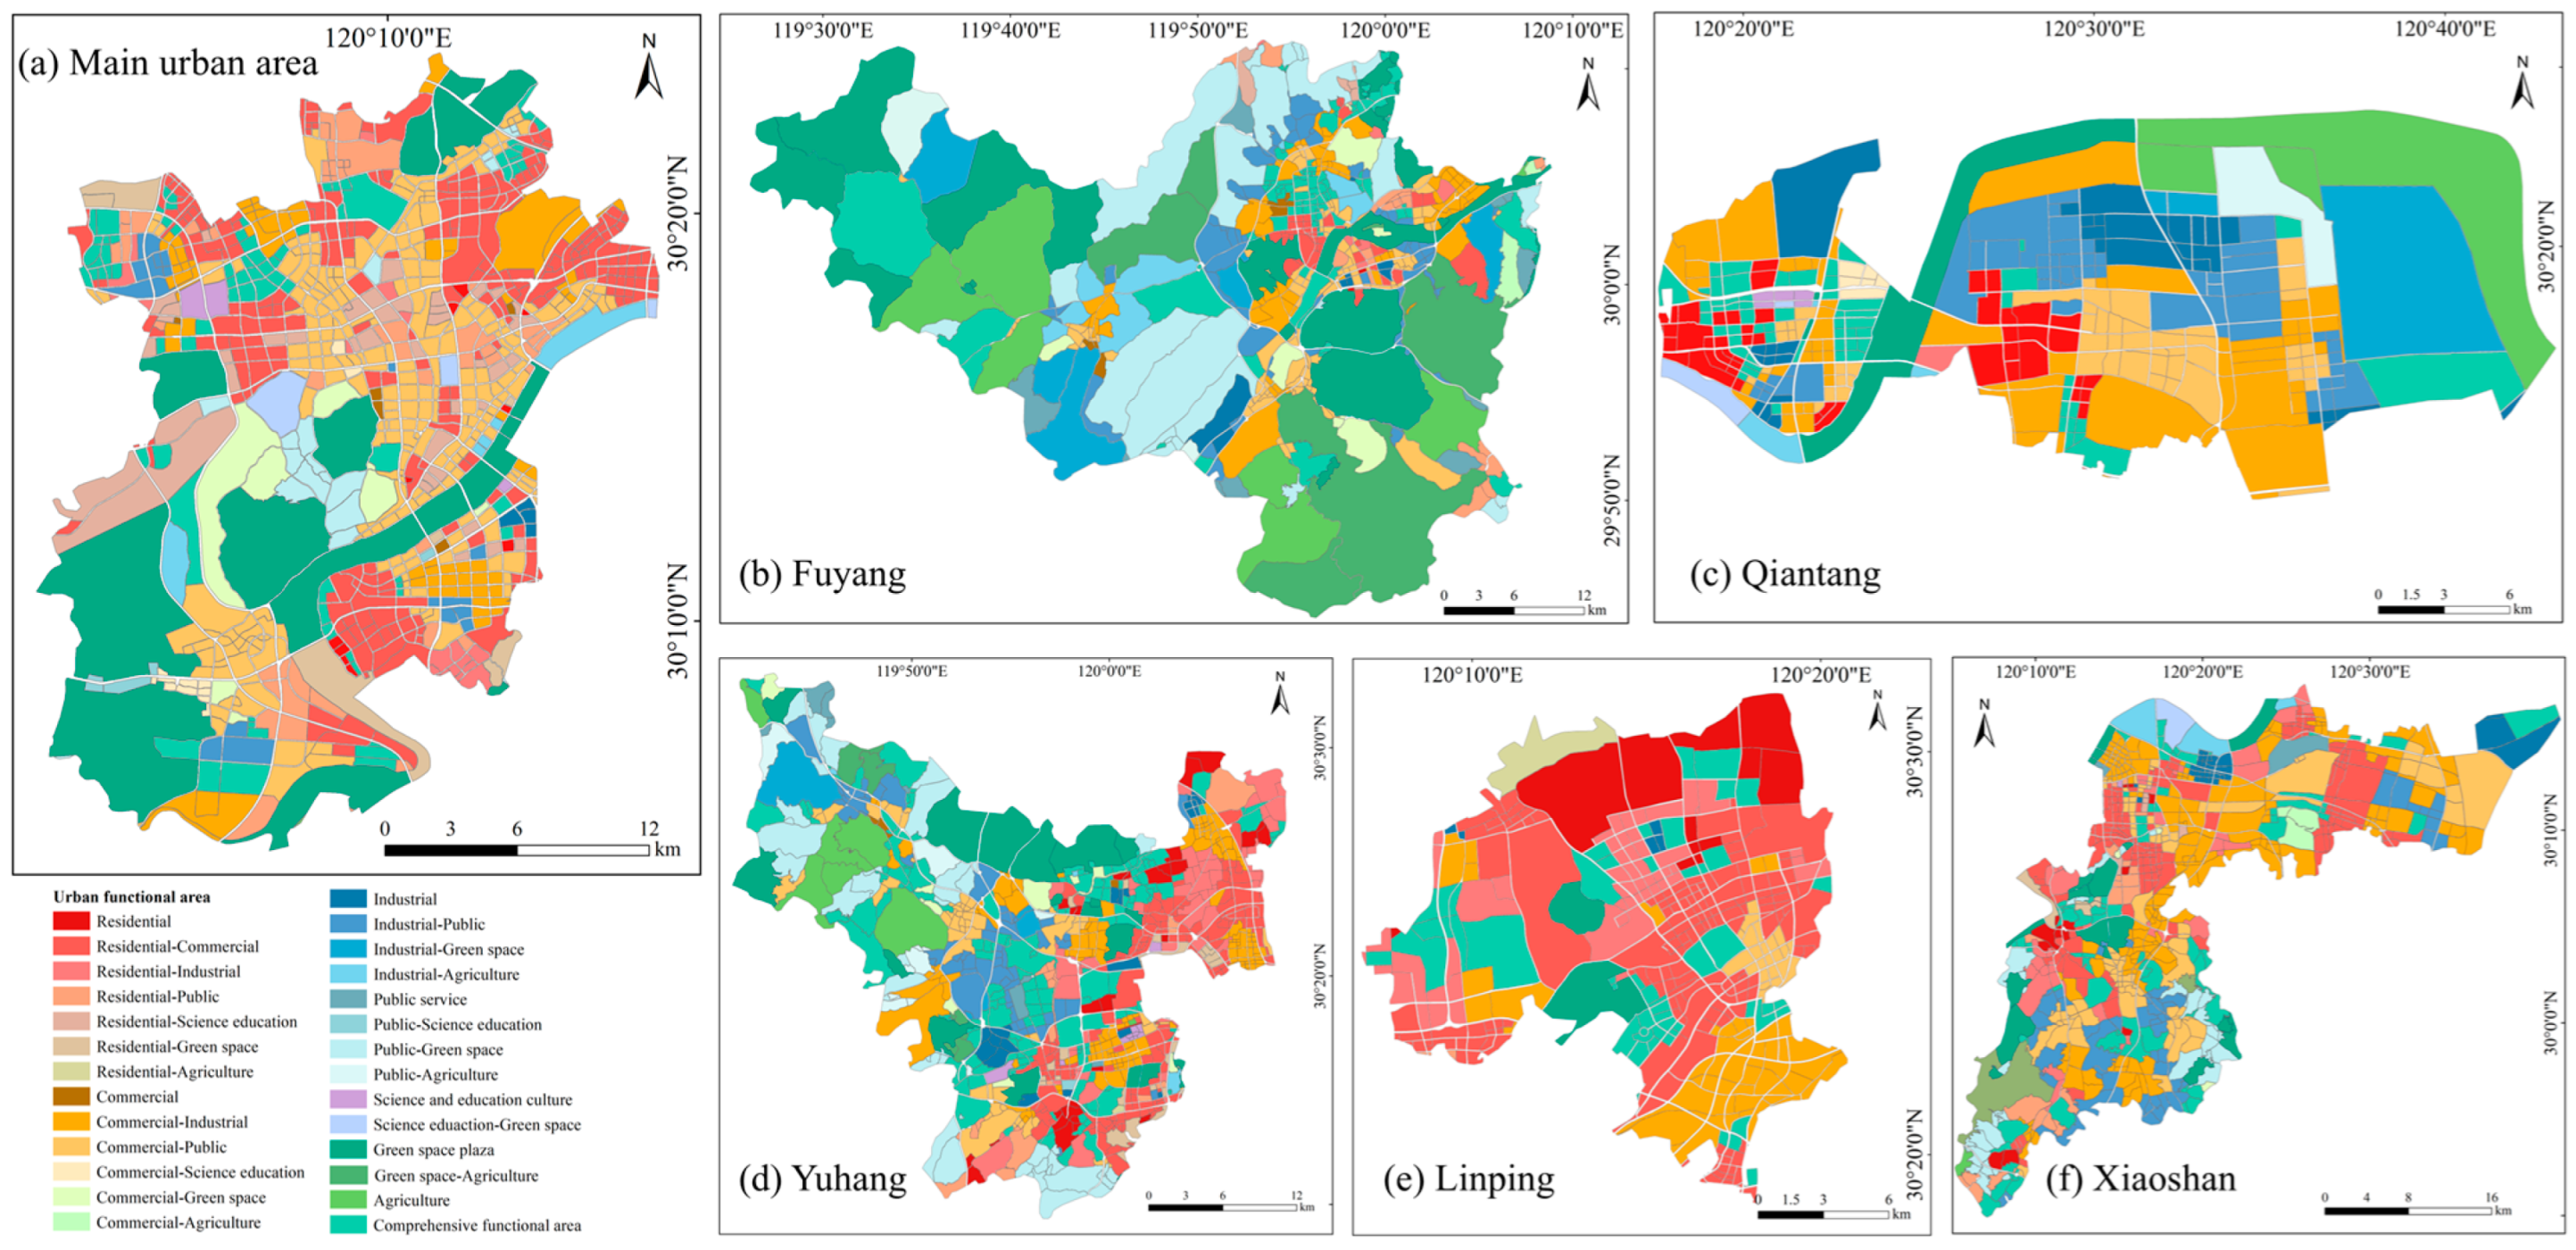
To achieve carbon balance accounting at the scale of urban functional zones, this study adopted urban functional zone carbon emission data from the authors’ previous research [
25] as the basis for carbon flow analysis. In the prior study, OSM road network data were first used to divide the study area into land parcels. Then, Gaode POI data were classified and weighted, and kernel density analysis was applied to identify the types of functional zones and produce a functional zoning map. Subsequently, following the IPCC methodology, carbon emissions for 1602 sample functional zones were calculated based on electricity consumption and natural gas usage data, and the results were used as target variables. On this basis, spatial feature variables, such as VIIRS/NPP nighttime light data, land surface temperature (LST), building area, and building height, were extracted to construct a carbon emission prediction model for urban functional zones. Three machine learning methods—Random Forest (RF), Support Vector Regression (SVR), and XGBoost—were employed for model training and comparison. Samples were randomly divided into a training set (60%), a validation set (20%), and a test set (20%) to ensure independence between model training and evaluation. To enhance model robustness, five-fold cross-validation was applied, and hyperparameter tuning was conducted. Model outputs were compared with the official ODIAC product, demonstrating high accuracy and effectively improving emission estimation in areas with insufficient nighttime light data. Due to space limitations, detailed information on model parameter settings, evaluation metrics, and validation results has been systematically presented in the authors’ previous study [
25] and is only briefly described herein.
3.2. Carbon Sequestration Accounting for Functional Zones
The urban carbon metabolism process involves both carbon emissions and carbon absorption, with carbon flow resulting from differences in the carbon emission and absorption capacities of functional zone nodes [
26]. NPP not only reflects the productivity of vegetation in natural environments but also reveals the carbon sequestration capacity of the land surface [
27]. It is thus commonly used to represent the supply capacity of carbon sequestration services [
28]. NPP was calculated using the CASA model to estimate the carbon sequestration in each functional zone. The CASA model, based on the principle of light use efficiency and combined with GIS and remote sensing technology, can accurately simulate the NPP levels of surface vegetation. Based on this, the NPP values for each functional zone were calculated using the statistical analysis functions of ArcGIS, and further estimations of their carbon dioxide sequestration were made. The formula for calculating carbon sequestration is as follows:
where
represents the amount of carbon sequestration in the
i-th functional zone and the coefficient 44/12 is the molar mass conversion factor used to convert the unit of carbon (C) to carbon dioxide (CO
2).
The CASA model, as proposed by Zhu (2006) [
29], represents the variation in monthly primary productivity of vegetation as the product of absorbed photosynthetically active radiation (APAR) and actual light use efficiency
ε(
x,
t), calculated as follows:
where NPP represents net primary productivity,
APAR(
x,
t) is the photosynthetically active radiation absorbed by pixel
x in month
t (MJ·m
2), and
ε(
x,
t) is the actual light use efficiency of pixel
x in month
t (gC·MJ
−1). The photosynthetically active radiation absorbed by vegetation is calculated based on total solar radiation and the proportion of solar radiation absorbed by vegetation, as shown in the following equation:
where
SOL(
x,
t) is the total solar radiation at pixel
x in month
t (MJ·m
2),
FPAR(
x,
t) represents the proportion of photosynthetically active radiation (PAR) absorbed by the vegetation layer, and the constant 0.5 is the fraction of total solar radiation that is utilized by vegetation as photosynthetically active radiation.
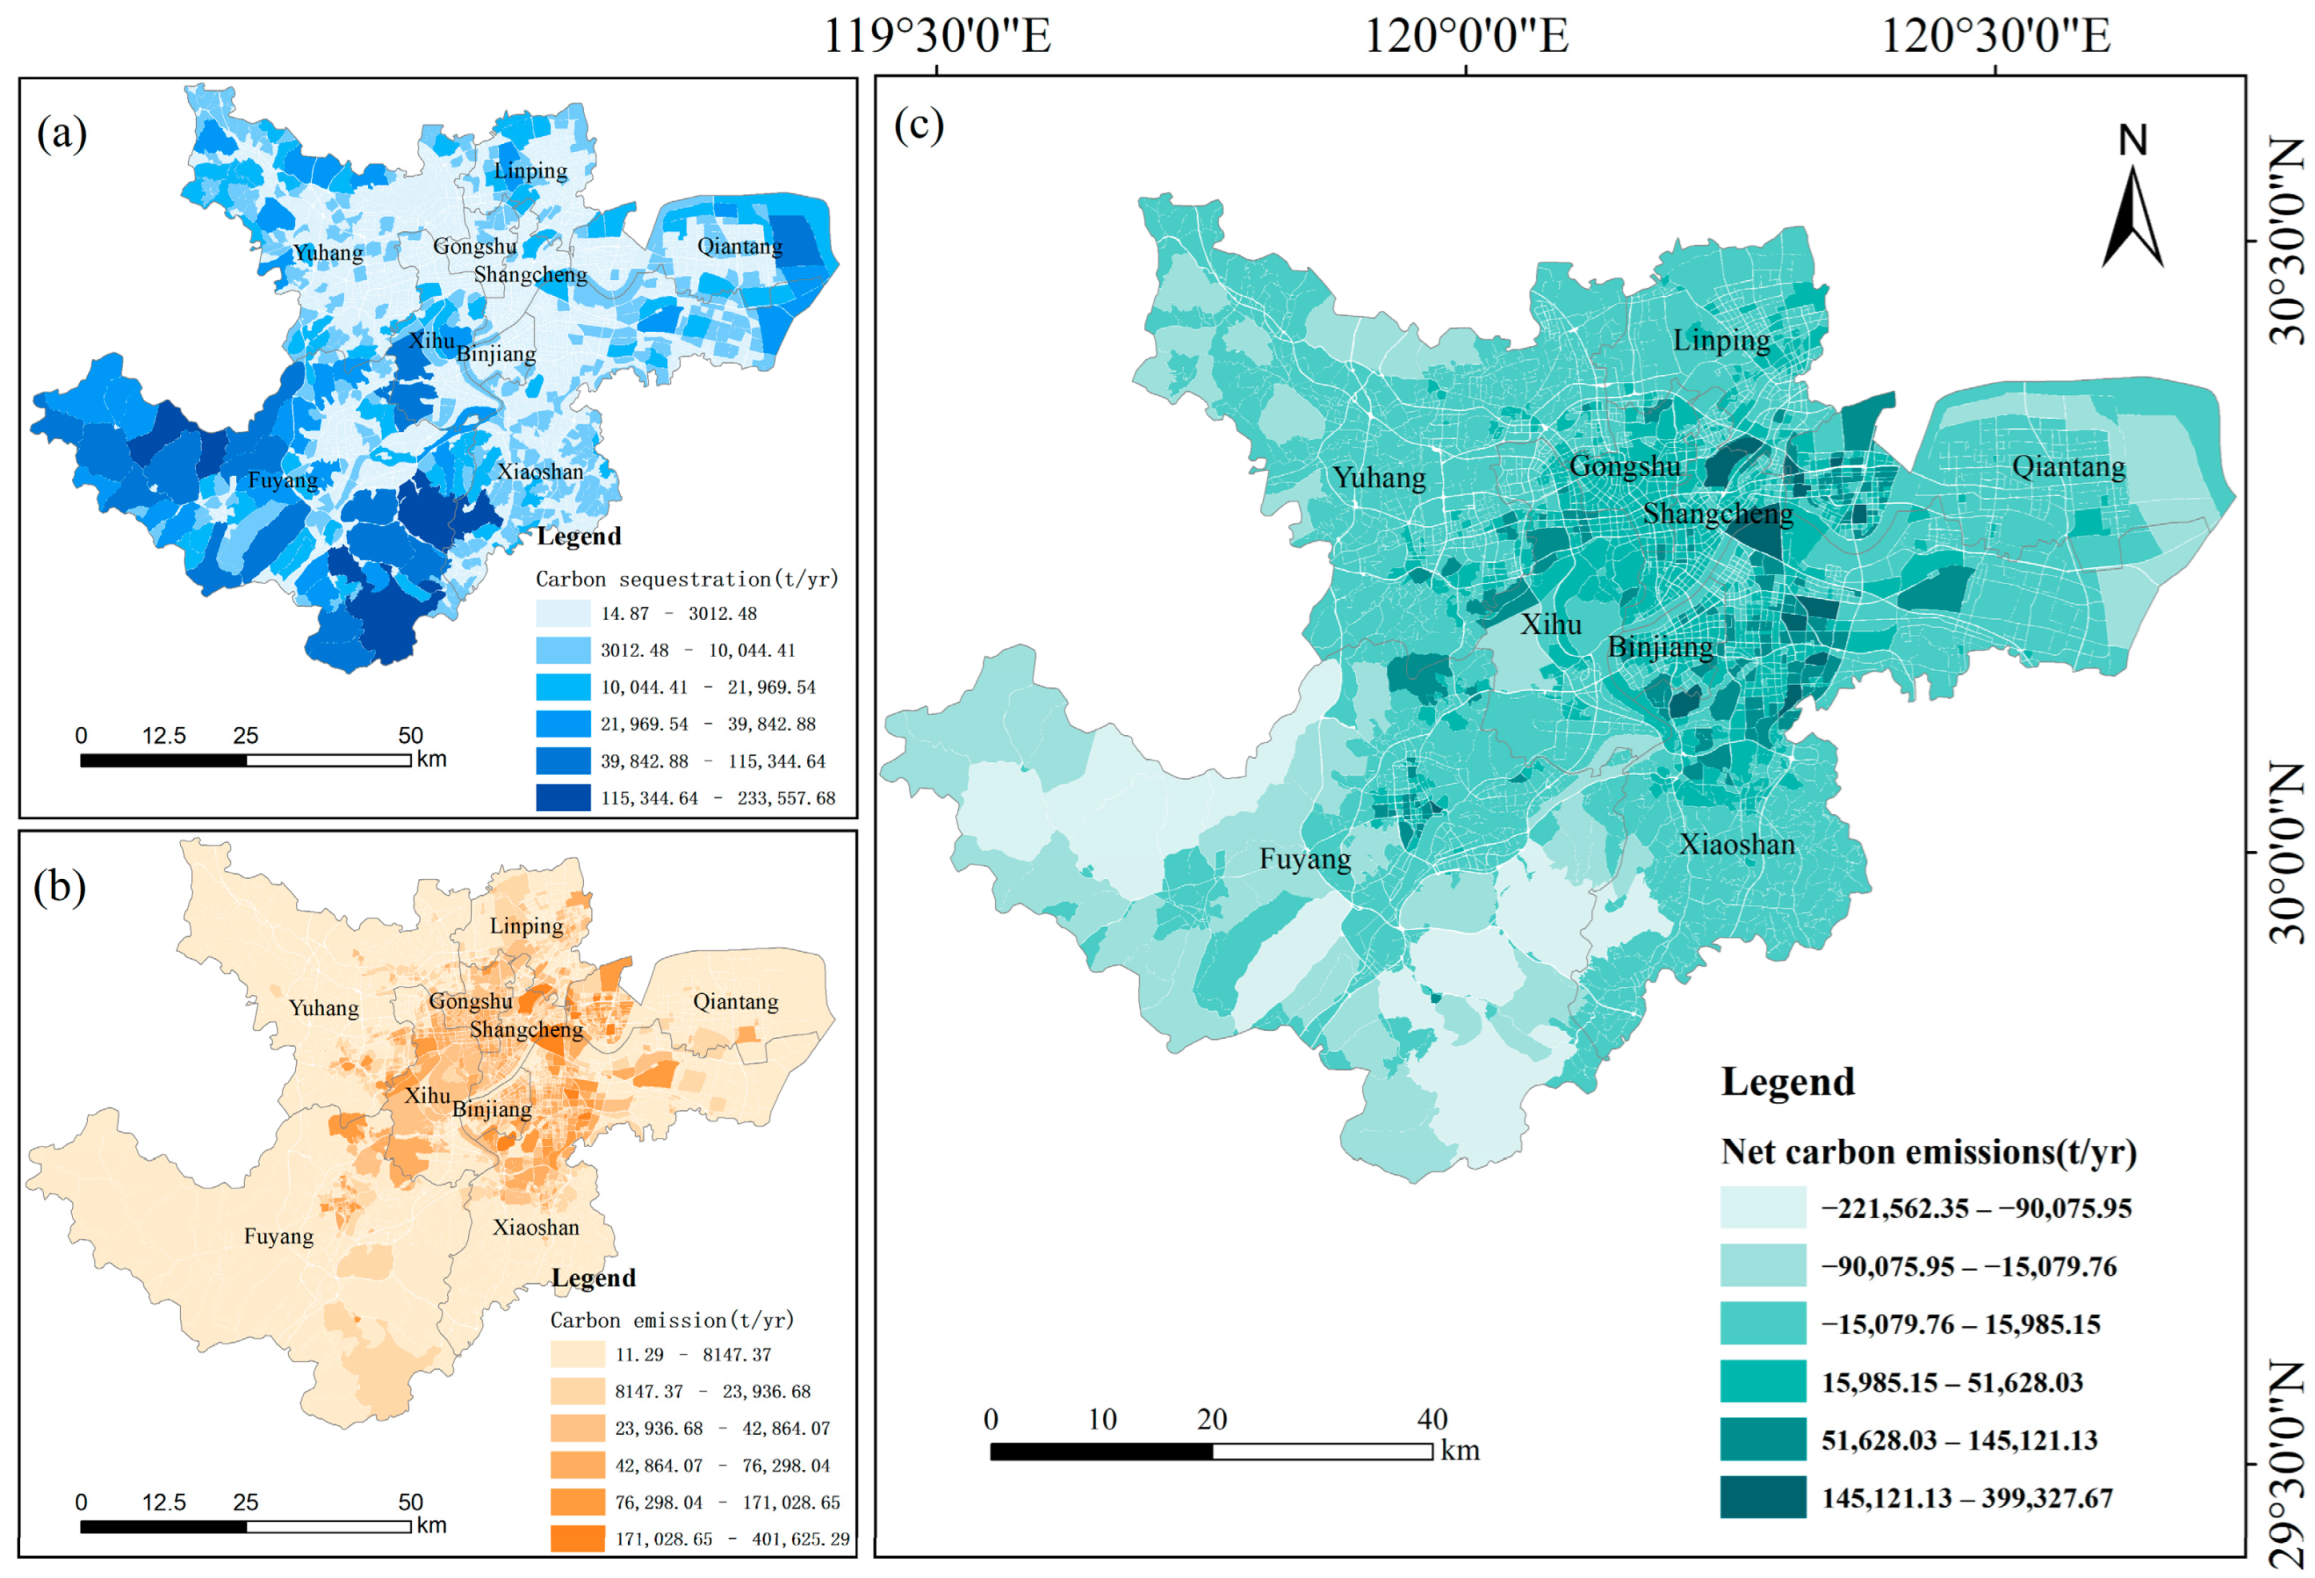
To comprehensively assess the carbon metabolism balance and the supply–demand situation of carbon sequestration services in functional zones, two indicators are introduced: net carbon emissions and the carbon sequestration service supply–demand difference. Among them, net carbon emissions are used to measure the carbon balance within individual functional zones. The calculation formula is as follows:
where
represents the carbon emissions of the functional zone
i, and
represents its carbon sequestration. If
> 0, the functional zone is a carbon source; if
< 0, it is a carbon sink. The carbon sequestration service supply–demand difference is used to assess whether the carbon sequestration capacity of a functional zone is sufficient to meet its own or the surrounding areas’ carbon emission demands. When the carbon sequestration supply exceeds the demand, the functional zone is in a carbon surplus state; conversely, it is in a carbon deficit state when the supply is less than the demand.
3.3. Construction of the Carbon Sequestration Service Flow Network Model
This study quantitatively traced urban carbon flows from the perspective of the “source–sink–flow” framework of ecosystem services. Carbon sequestration services connect supply and demand areas through atmospheric circulation, and the carbon fixation demand in one area can be supplemented by the surplus supply from other regions [
30]. The spatial distribution of carbon deficits and surpluses is primarily influenced by the mismatch between the supply and demand of carbon sequestration services. In this study, a network model was employed to reveal the carbon sequestration service flows in Hangzhou. The specific process is as follows.
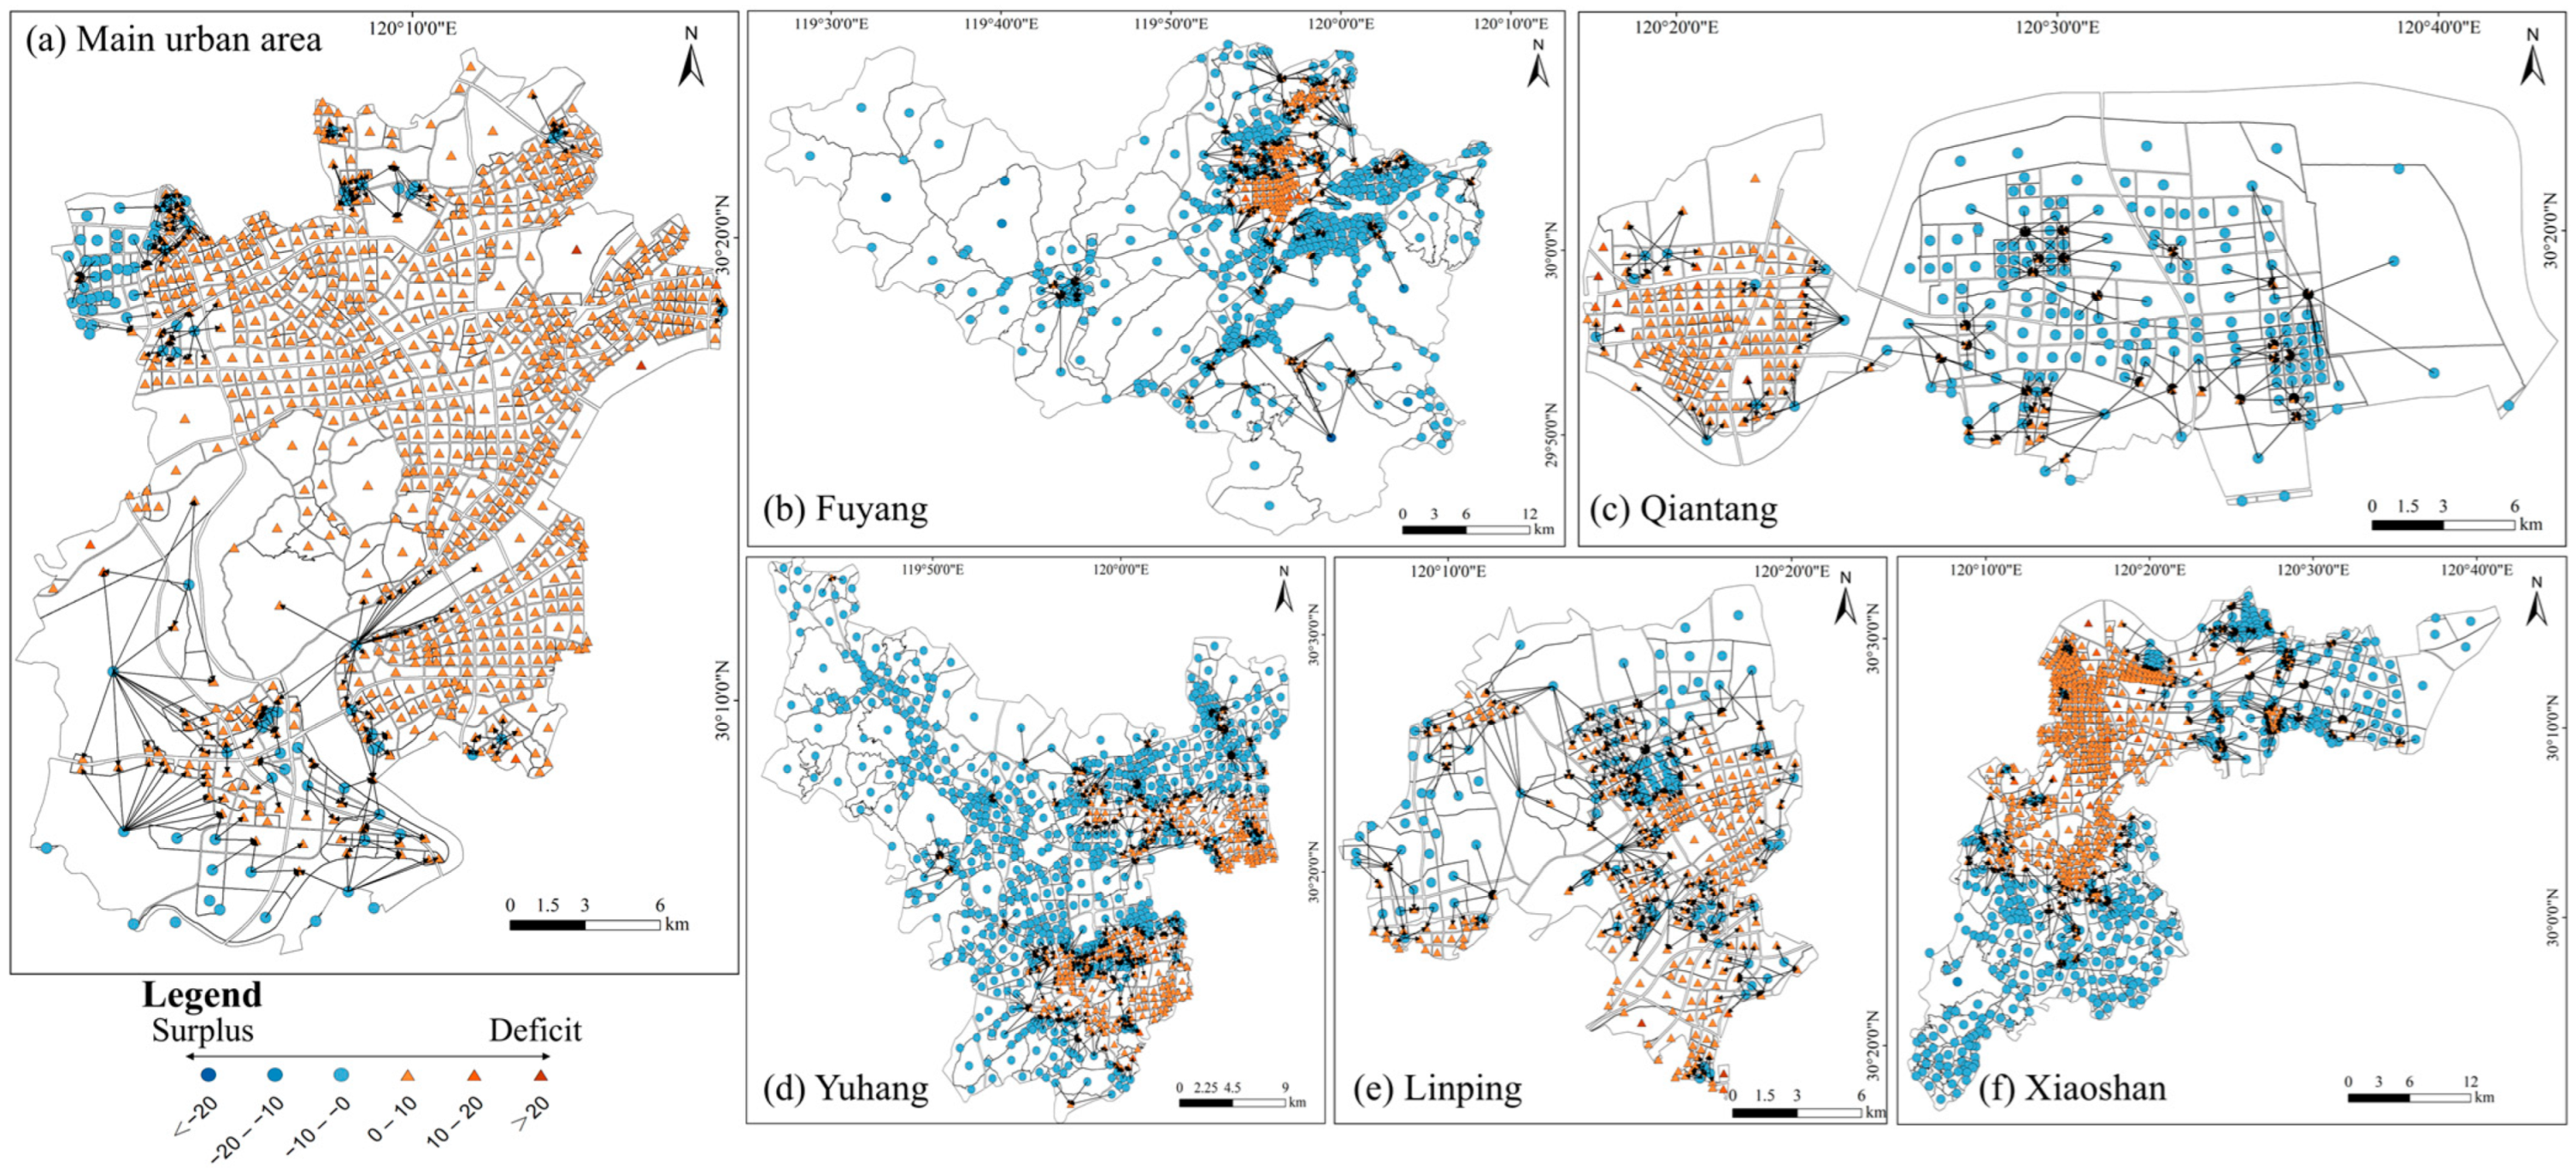
Definition of Nodes: In this study, the geometric centroids of each urban functional zone were extracted using ArcGIS 10.8 and defined as the nodes of the carbon sequestration service flow network model. The weight of each node was defined as the ratio between carbon emissions and carbon sequestration within the corresponding urban functional zone [
31], as expressed in the following formula:
where
represents the carbon emissions of the urban functional zone during a given period and
represents the carbon sequestration amount of the same zone.
indicates the self-sufficiency rate of carbon sequestration services. When
< 1, carbon emissions are less than carbon sequestration, and the zone is identified as a surplus node. When
> 1, the zone is categorized as a deficit node. Different node colors are used to represent the surplus or deficit status and its intensity.
Definition of Edges: A carbon sequestration service flow from one functional zone to another is defined as an edge between nodes. According to the study by Wang et al. (2020) [
32], it is assumed that surplus carbon can flow between nodes. If a node is in a surplus state, carbon service flows are assumed to exist between it and its adjacent nodes. If a node is in a deficit state and its carbon sequestration demand is not supplemented by other nodes, it no longer provides surplus carbon flow to its neighbors, resulting in the disconnection of the corresponding edge. Connected edges are represented by black arrows, indicating the presence of carbon sequestration service flow along the path. Areas without arrows indicate a disconnected edge, meaning that no carbon flow exists along that route. It is important to note that carbon flow supplementation, i.e., flow edges, also exists between adjacent surplus nodes. However, due to the large number of nodes in the study area, the carbon flow connections between these nodes were not visualized in this study.
Network Construction: Based on the above definitions of nodes and edges, the carbon sequestration service flow network was visualized using ArcGIS 10.8. The spatial location of each node was determined by its geographic coordinates, while adjacency in carbon flow paths was identified by calculating the Euclidean distance between grid centroids using the “Generate Near Table” tool in ArcGIS 10.8. Two nodes were considered adjacent if the distance between them did not exceed 100 m.
3.4. Spatial Optimization of Carbon Flow Patterns
A linear programming approach was applied to construct an urban low-carbon land use structure optimization model aiming to minimize urban carbon emissions. The decision variables in the model are the combinations of land area allocated to various functional zones. A total of 13 types of functional zones were defined as decision variables in the carbon metabolism spatial pattern optimization model, namely: residential–green space (), residential–agriculture (), commercial–green space (), commercial–agriculture (), industrial–green space (), industrial–agriculture , public–green space (), public–agriculture (), science and education–green space (), green space plazas (), green space–agriculture (), agricultural land (), and mixed-use zones (). These functional zones possess certain ecological attributes and have significant carbon sink potential through the absorption of atmospheric CO2 via vegetation photosynthesis and soil carbon storage.
The model parameters were set with reference to key indicators, such as arable land retention, total construction land area, and per capita land use, specified in the Master Plan for Land Use of Hangzhou (2021–2035), covering nine administrative units within the study area. At the same time, in accordance with the policy requirements of “optimizing urban development boundaries” and “promoting multifunctional land use,” upper and lower area limits, as well as proportional constraints, were imposed on urban functional zones with ecological composite attributes based on their land use types and spatial distribution characteristics. In this way, the optimization results of the model were kept consistent with current policies and spatial development orientations.
Optimization strategies for different types of functional zones were guided by the Ecological Restoration Plan for Territorial Space of Zhejiang Province (2021–2035) and the Pilot Program for Realizing the Value of Ecological Products in Zhejiang Province, and they included the following. (1) For carbon deficit nodes, the strategy involved increasing the area of green space or agricultural land within ecological composite functional zones (e.g., residential–green space, residential–agriculture), thereby raising the proportion of ecological land to reduce carbon emission intensity. (2) For carbon surplus nodes, the focus was on enhancing their carbon sink capacity, enabling them to play a greater role in ecological regulation and carbon storage within the urban carbon management system. Specifically, this involved moderately reducing the area of surrounding functional zones lacking ecological attributes (e.g., residential, residential–commercial, commercial–industrial) to expand green space or agricultural functional zones and further strengthen the overall carbon sink capacity. The objective function is expressed as follows:
In the formula,
s.t. denotes the constraints;
represents the non-negativity constraint;
A is the constraint coefficient matrix;
B denotes the resource limitations;
is the net carbon emission density of the
i-th type of functional zone;
is the decision variable representing the area of the
i-th functional zone; and
denotes the total net carbon emissions of the city under the low-carbon optimization model. The formula for net carbon emission density is as follows:
where
is the total carbon emissions of the
ith functional zone, and
is the area of the
ith functional zone.
5. Discussion
5.1. Advantages of an Analysis Based on the “Source-Sink-Flow” Model
Conventional studies on urban carbon balance have largely focused on total accounting or macro-regional scales, emphasizing quantitative assessments while neglecting the visualization of spatial carbon flows within complex urban ecosystems [
33,
34]. The network model constructed in this study, based on the “source-sink-flow” framework, not only quantified the carbon budget status (surplus or deficit) of each functional zone node but, more importantly, visually traced the potential flow paths of carbon sequestration services from supply areas (sources) to beneficiary areas (sinks). The identification of “critical nodes” (high-emission or high-carbon-sink points) and “metabolic bottlenecks” (e.g., disconnected edges) provides a foundation for understanding urban carbon cycle efficiency and developing targeted intervention strategies. Compared with conventional methods that use land use types as analytical units [
35,
36], this study, based on the scale of functional zones and integrated with carbon flow network modeling, conducted optimization simulations to explore feasible strategies for repairing fractured edges and transforming deficit nodes, thereby demonstrating enhanced managerial precision and greater policy adaptability.
To further understand the structural characteristics and applicability of the carbon flow network, a preliminary comparative analysis was conducted with reference to the study by Li et al. [
3] on carbon sink service flows in the Guanzhong–Tianshui Economic Zone. Without considering differences in research scale, both cases exhibited an overall pattern in which carbon sink services were continuously supplied from peripheral ecological areas to built-up urban zones. In Hangzhou, carbon-deficit areas were relatively concentrated, mainly located in the densely populated central districts, while the western urban area, Linping, and Qiantang represented typical carbon-surplus zones. Similarly, in the Guanzhong–Tianshui Economic Zone, carbon deficits were also concentrated in core areas with intensive construction land use—particularly the Guanzhong urban agglomeration represented by Xianyang and Xi’an, as well as the northern plains—characterized by high carbon consumption and strong demand for ecosystem services. In contrast, the surrounding hilly and forest-covered regions of Tianshui formed a relatively continuous carbon-surplus ring that supported the central areas with carbon sink services.
However, in terms of network structure, the use of block-scale functional zoning in this study resulted in a highly fragmented spatial pattern. Combined with the high development intensity in the main urban area, carbon flow paths were more prone to fragmentation, short-range multi-source flows, and dispersed connections, leading to weaker overall connectivity. In contrast, the Guanzhong–Tianshui Economic Zone exhibited stronger network continuity and directional flow. Despite these morphological differences, both cases demonstrated the strong adaptability of the “source–sink–flow” framework in capturing urban carbon flow patterns, particularly in identifying local metabolic barriers and pathway disruptions. This supports the development of differentiated carbon flow optimization strategies tailored to different types of cities.
5.2. Spatial Optimization of Carbon Sequestration Service Allocation
This study adopted a bottom–up approach to optimizing carbon flow pathways, overcoming the limitations of traditional research that often remained confined to static assessments of carbon metabolism outcomes. By establishing a complete chain of “identification–diagnosis–intervention,” it offers a more actionable planning tool for urban carbon governance and provides policymakers with practical strategies for spatial optimization. By identifying core carbon-deficit areas, clarifying intervention priorities, and proposing targeted transformation strategies for composite functional zones, this approach supports urban managers in enhancing carbon sink capacity while maintaining functional compatibility within limited space, thereby enabling more refined and differentiated spatial planning and carbon regulation policy design.
The findings reveal that carbon deficit nodes are primarily concentrated in high-density developed areas, which serve as “pressure points” and metabolic bottlenecks in the urban carbon flow system. Functional transformation of these areas not only helps alleviate local carbon imbalances but also significantly enhances the internal self-regulation capacity of the system, reducing reliance on peripheral ecological spaces and promoting a more balanced and sustainable urban carbon balance. Moreover, composite functional zones involving green space and agriculture demonstrate strong carbon sink capacities and high spatial compatibility. These zones can deliver stable carbon sequestration services while maintaining core urban functions, thus forming an “embedded carbon sink” system. Based on the optimization practices for composite zones, such as residential–green space and commercial–green space in this study, targeted spatial transformation strategies can be proposed for key carbon deficit areas in Hangzhou, such as Shangcheng, Gongshu, and Binjiang, by selecting suitable types of composite functional zones.
Although the optimization strategies proposed in this study were designed to be implemented without altering the original functional attributes of urban zones—thus exhibiting strong practical adaptability—they may still face real-world constraints in high-density built-up areas, such as limited spatial availability and challenges in interest coordination. In particular, the expansion of green spaces may conflict with residential density or land-use efficiency. Future research will further explore the feasibility and multi-objective trade-offs associated with such interventions.
5.3. Limitations and Future Work
The methodology proposed in this study provides theoretical support for optimizing urban carbon metabolism and spatial planning, offering strong practical value—particularly for carbon management practices in rapidly urbanizing areas. However, certain limitations remain. In estimating carbon sink supply, NPP was adopted as the core indicator due to its high temporal resolution, broad spatial coverage, and suitability for inter-regional comparisons. Nevertheless, NPP does not include belowground carbon sinks, such as soil carbon pools, nor does it adequately reflect the differences in sequestration capacity of green spaces caused by variations in plant species and maintenance practices, which may lead to an underestimation of carbon sink potential in some areas. Previous studies have indicated that soil organic carbon exhibits long-term stability, with turnover processes typically spanning decades to centuries [
37]. In view of the long-term characteristics of soil carbon stocks and the lack of high-quality monitoring data, such a simplification is considered reasonable at the current stage. Future studies could incorporate high-resolution vegetation classification data and soil carbon flux observations to improve the accuracy of carbon balance estimations.
In addition, the carbon flow simulation did not incorporate intra-urban spatial resistance factors, such as surface continuity, wind field distribution, and anthropogenic disturbances, which may have led to an overestimation of pathway connectivity. Ma and Tian [
38] noted that in areas with dominant wind directions or complex terrain, carbon flows often exhibit pronounced spatial directionality, with pathways not strictly following adjacency principles but instead tending to diffuse along prevailing wind corridors or low-resistance channels. Although the dominant wind directions of Hangzhou were considered in the preliminary analysis of this study, an adjacency-based flow setting with equal weighting and without directional constraints was adopted in the simulation to more robustly reflect overall connectivity potential given the atmospheric diffusion effects of carbon flow services at the block scale. Nevertheless, future studies could integrate wind direction, topography, and land cover continuity into urban resistance modeling. In addition, sensitivity analysis and error propagation methods may be applied to evaluate the impacts of data uncertainty on carbon flow structures and spatial optimization outcomes, thereby enhancing the reliability of carbon source and sink calculations.
6. Conclusions
This study, based on the scale of urban functional zones and incorporating the spatial characteristics of carbon sources and sinks, constructed a carbon sequestration service flow network and optimized the spatial configuration of functional zones with the goal of developing a low-carbon city. The main conclusions are as follows:
(1) The carbon balance in Hangzhou exhibits significant spatial variation, characterized by a pattern of “carbon deficit in the center and carbon surplus in the periphery.” The residential–commercial and commercial–public functional zones in the main urban area show high carbon emission intensity and low carbon sequestration capacity, forming evident carbon-deficit areas. In contrast, green space–agricultural functional zones, such as those in Fuyang and southern Xiaoshan, demonstrate strong carbon sequestration capacity and constitute the main carbon sink regions.
(2) The carbon sequestration service flow network reveals the spatial structure of carbon surplus and deficit across different urban areas. Although peripheral areas, such as Fuyang and Yuhang possess strong carbon sink capacity, the total surplus is insufficient, and the high emission intensity in the main urban area leads to numerous disruptions in the central part of the carbon flow network, limiting the efficiency of carbon transmission.
(3) The spatial optimization results show that by adjusting the types and proportions of functional zones—especially by increasing ecologically composite carbon sink areas—the carbon surplus level in the main urban area has improved. Some original carbon-deficit nodes have been transformed into carbon-surplus nodes, and the overall connectivity of the carbon flow network has been enhanced.
In general, the method proposed in this study provides theoretical support for urban carbon metabolism optimization and spatial planning, with good practical applicability, particularly for carbon management in rapidly urbanizing areas. However, the treatment of data completeness and spatial resistance factors in carbon sink estimation and carbon flow modeling remains relatively simplified, and the related methods require further improvement. In addition, the current optimization strategies are based solely on the existing spatial layout and have not been systematically compared with other spatial adjustment approaches or multi-scenario schemes. Future research should incorporate multi-scenario simulations and evaluation mechanisms to more comprehensively identify optimal directions and implementation pathways for spatial optimization.
