


Estimating Urbanization’s Impact on Soil Erosion: A Global Comparative Analysis and Case Study of Phoenix, USA

Abstract
1. Introduction
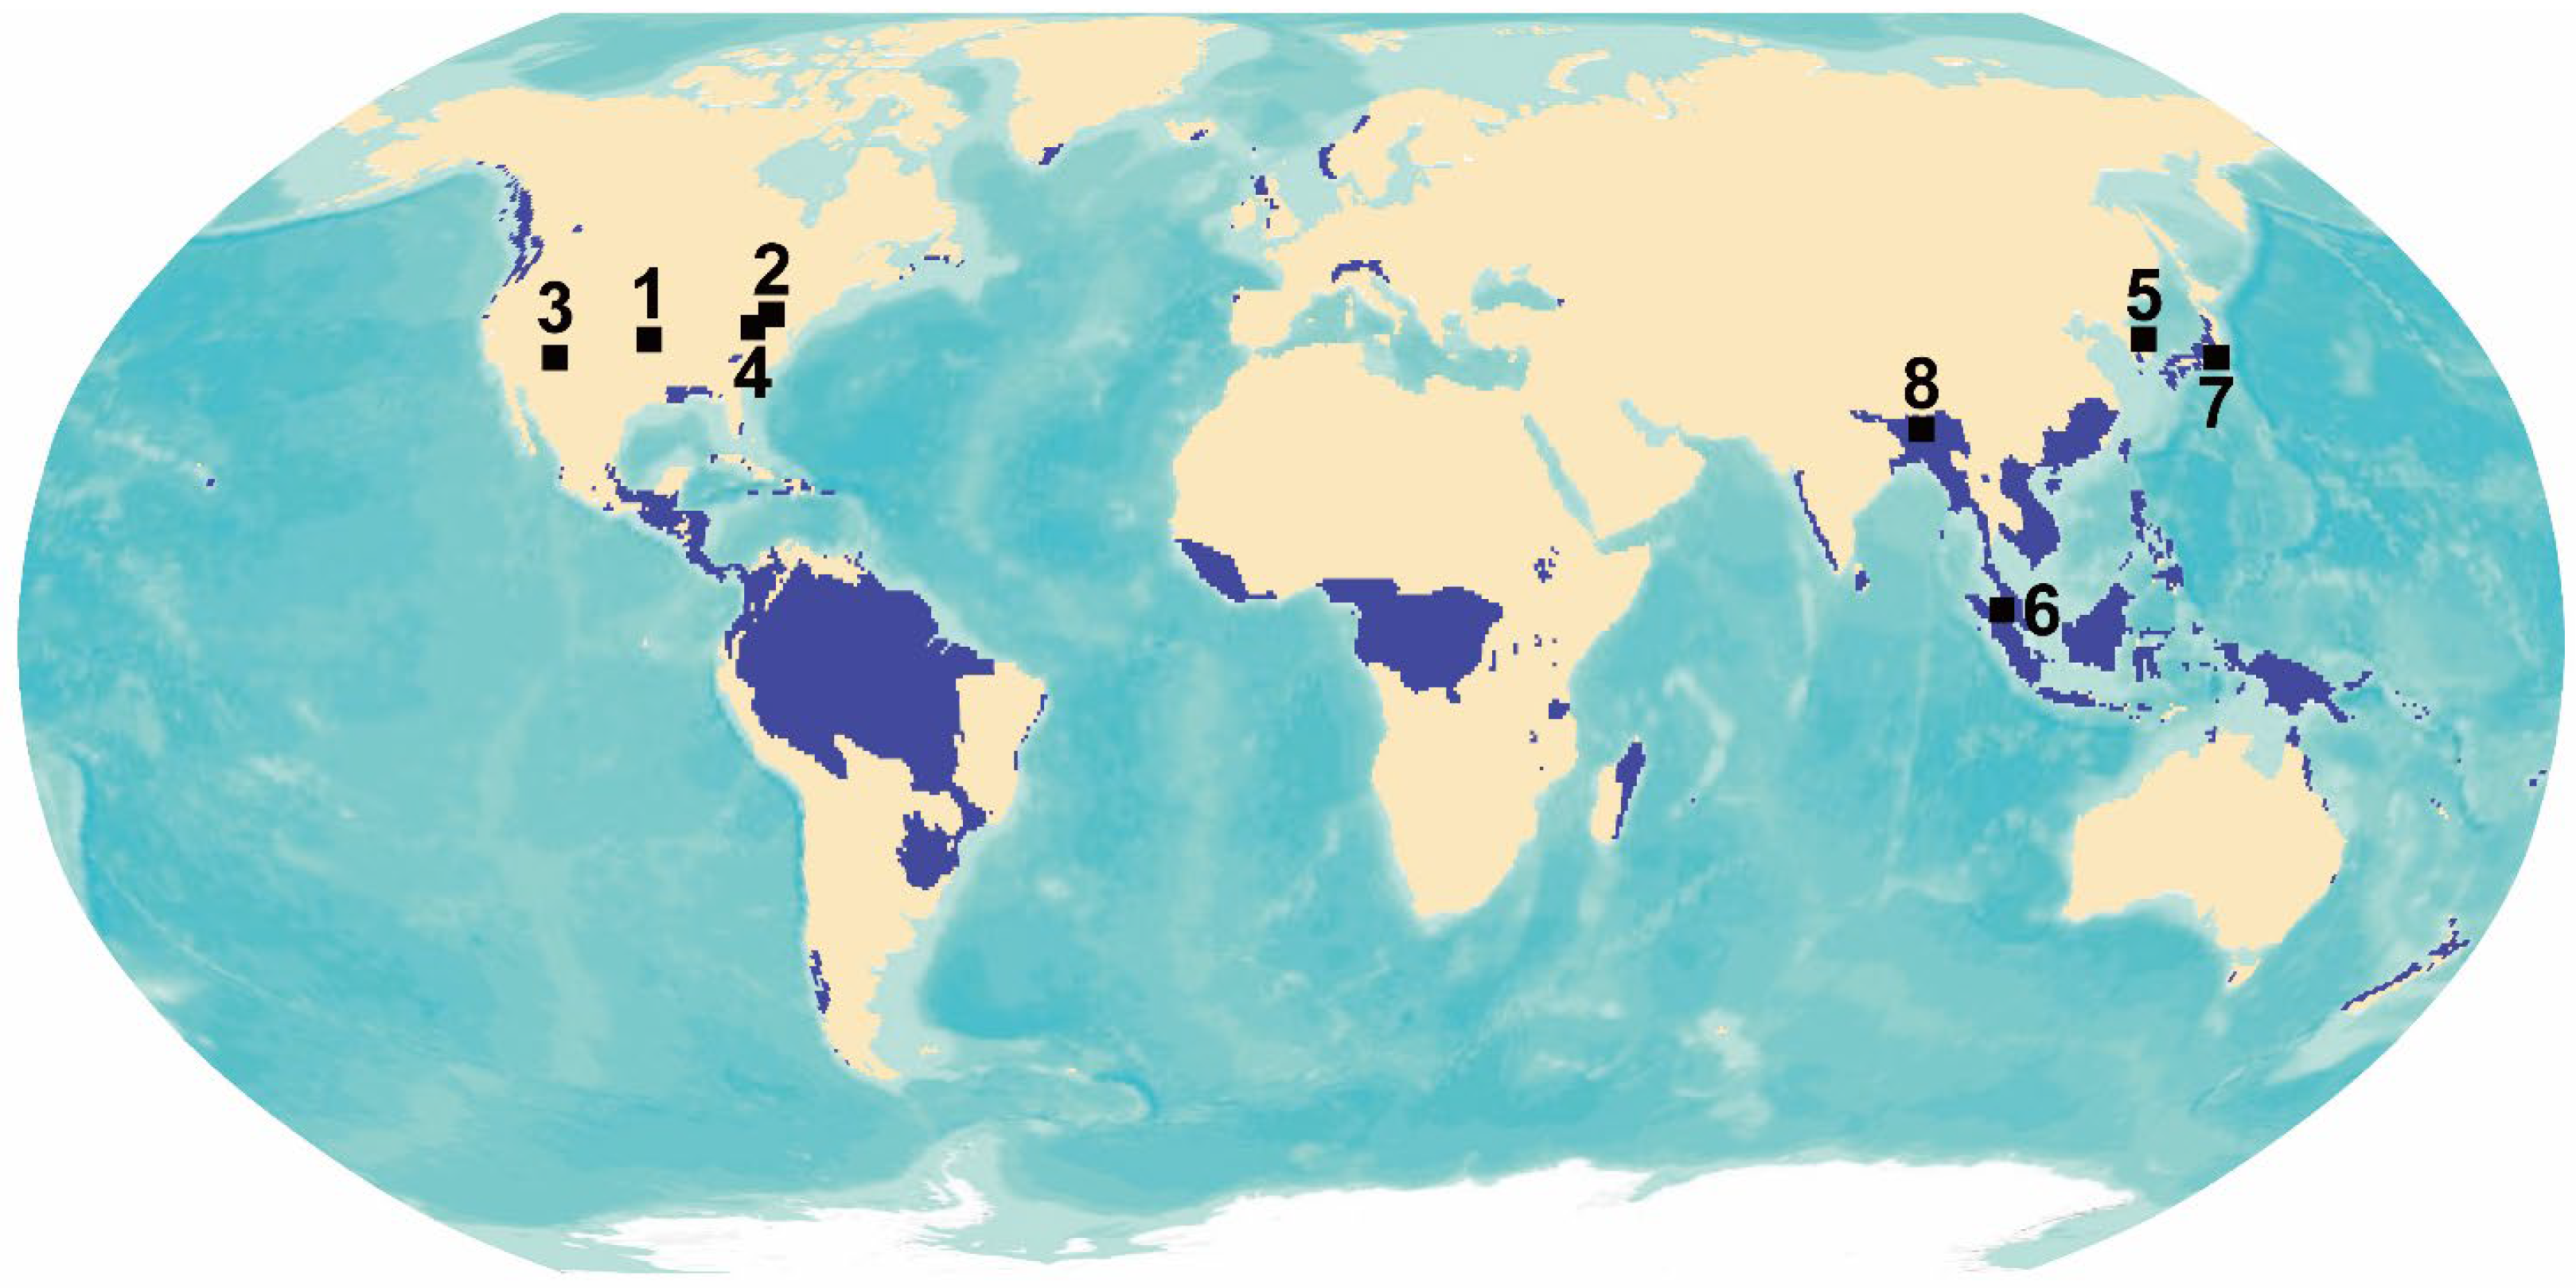
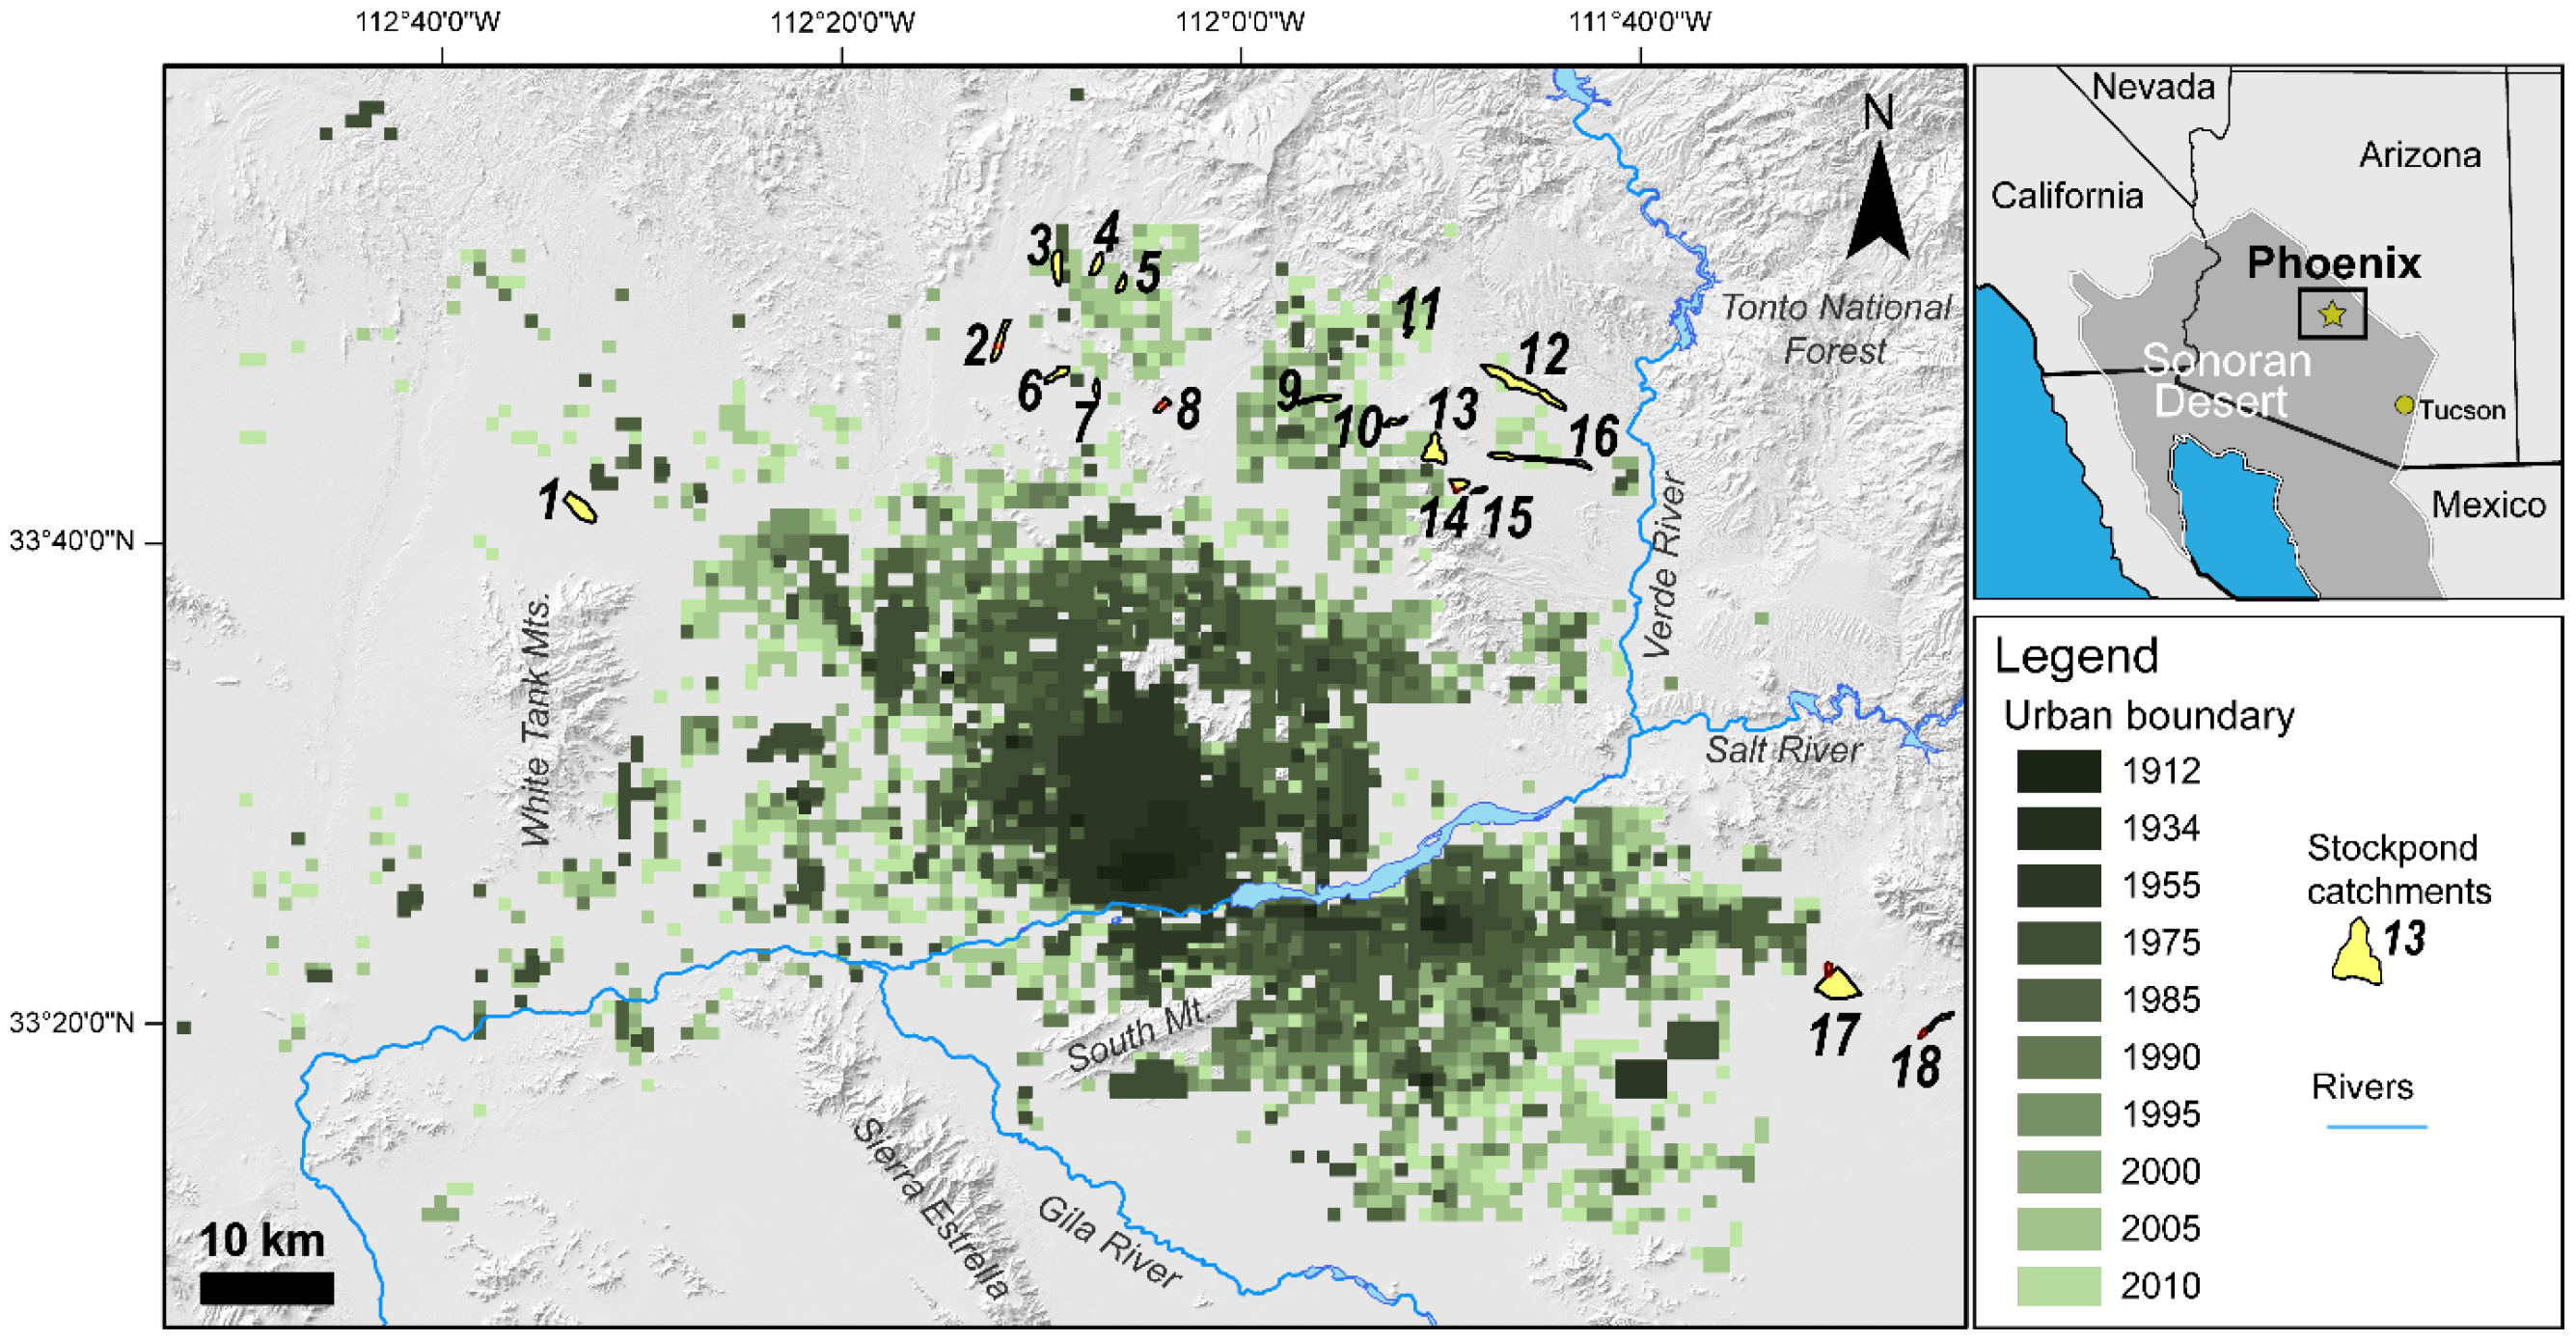
2. Study Areas
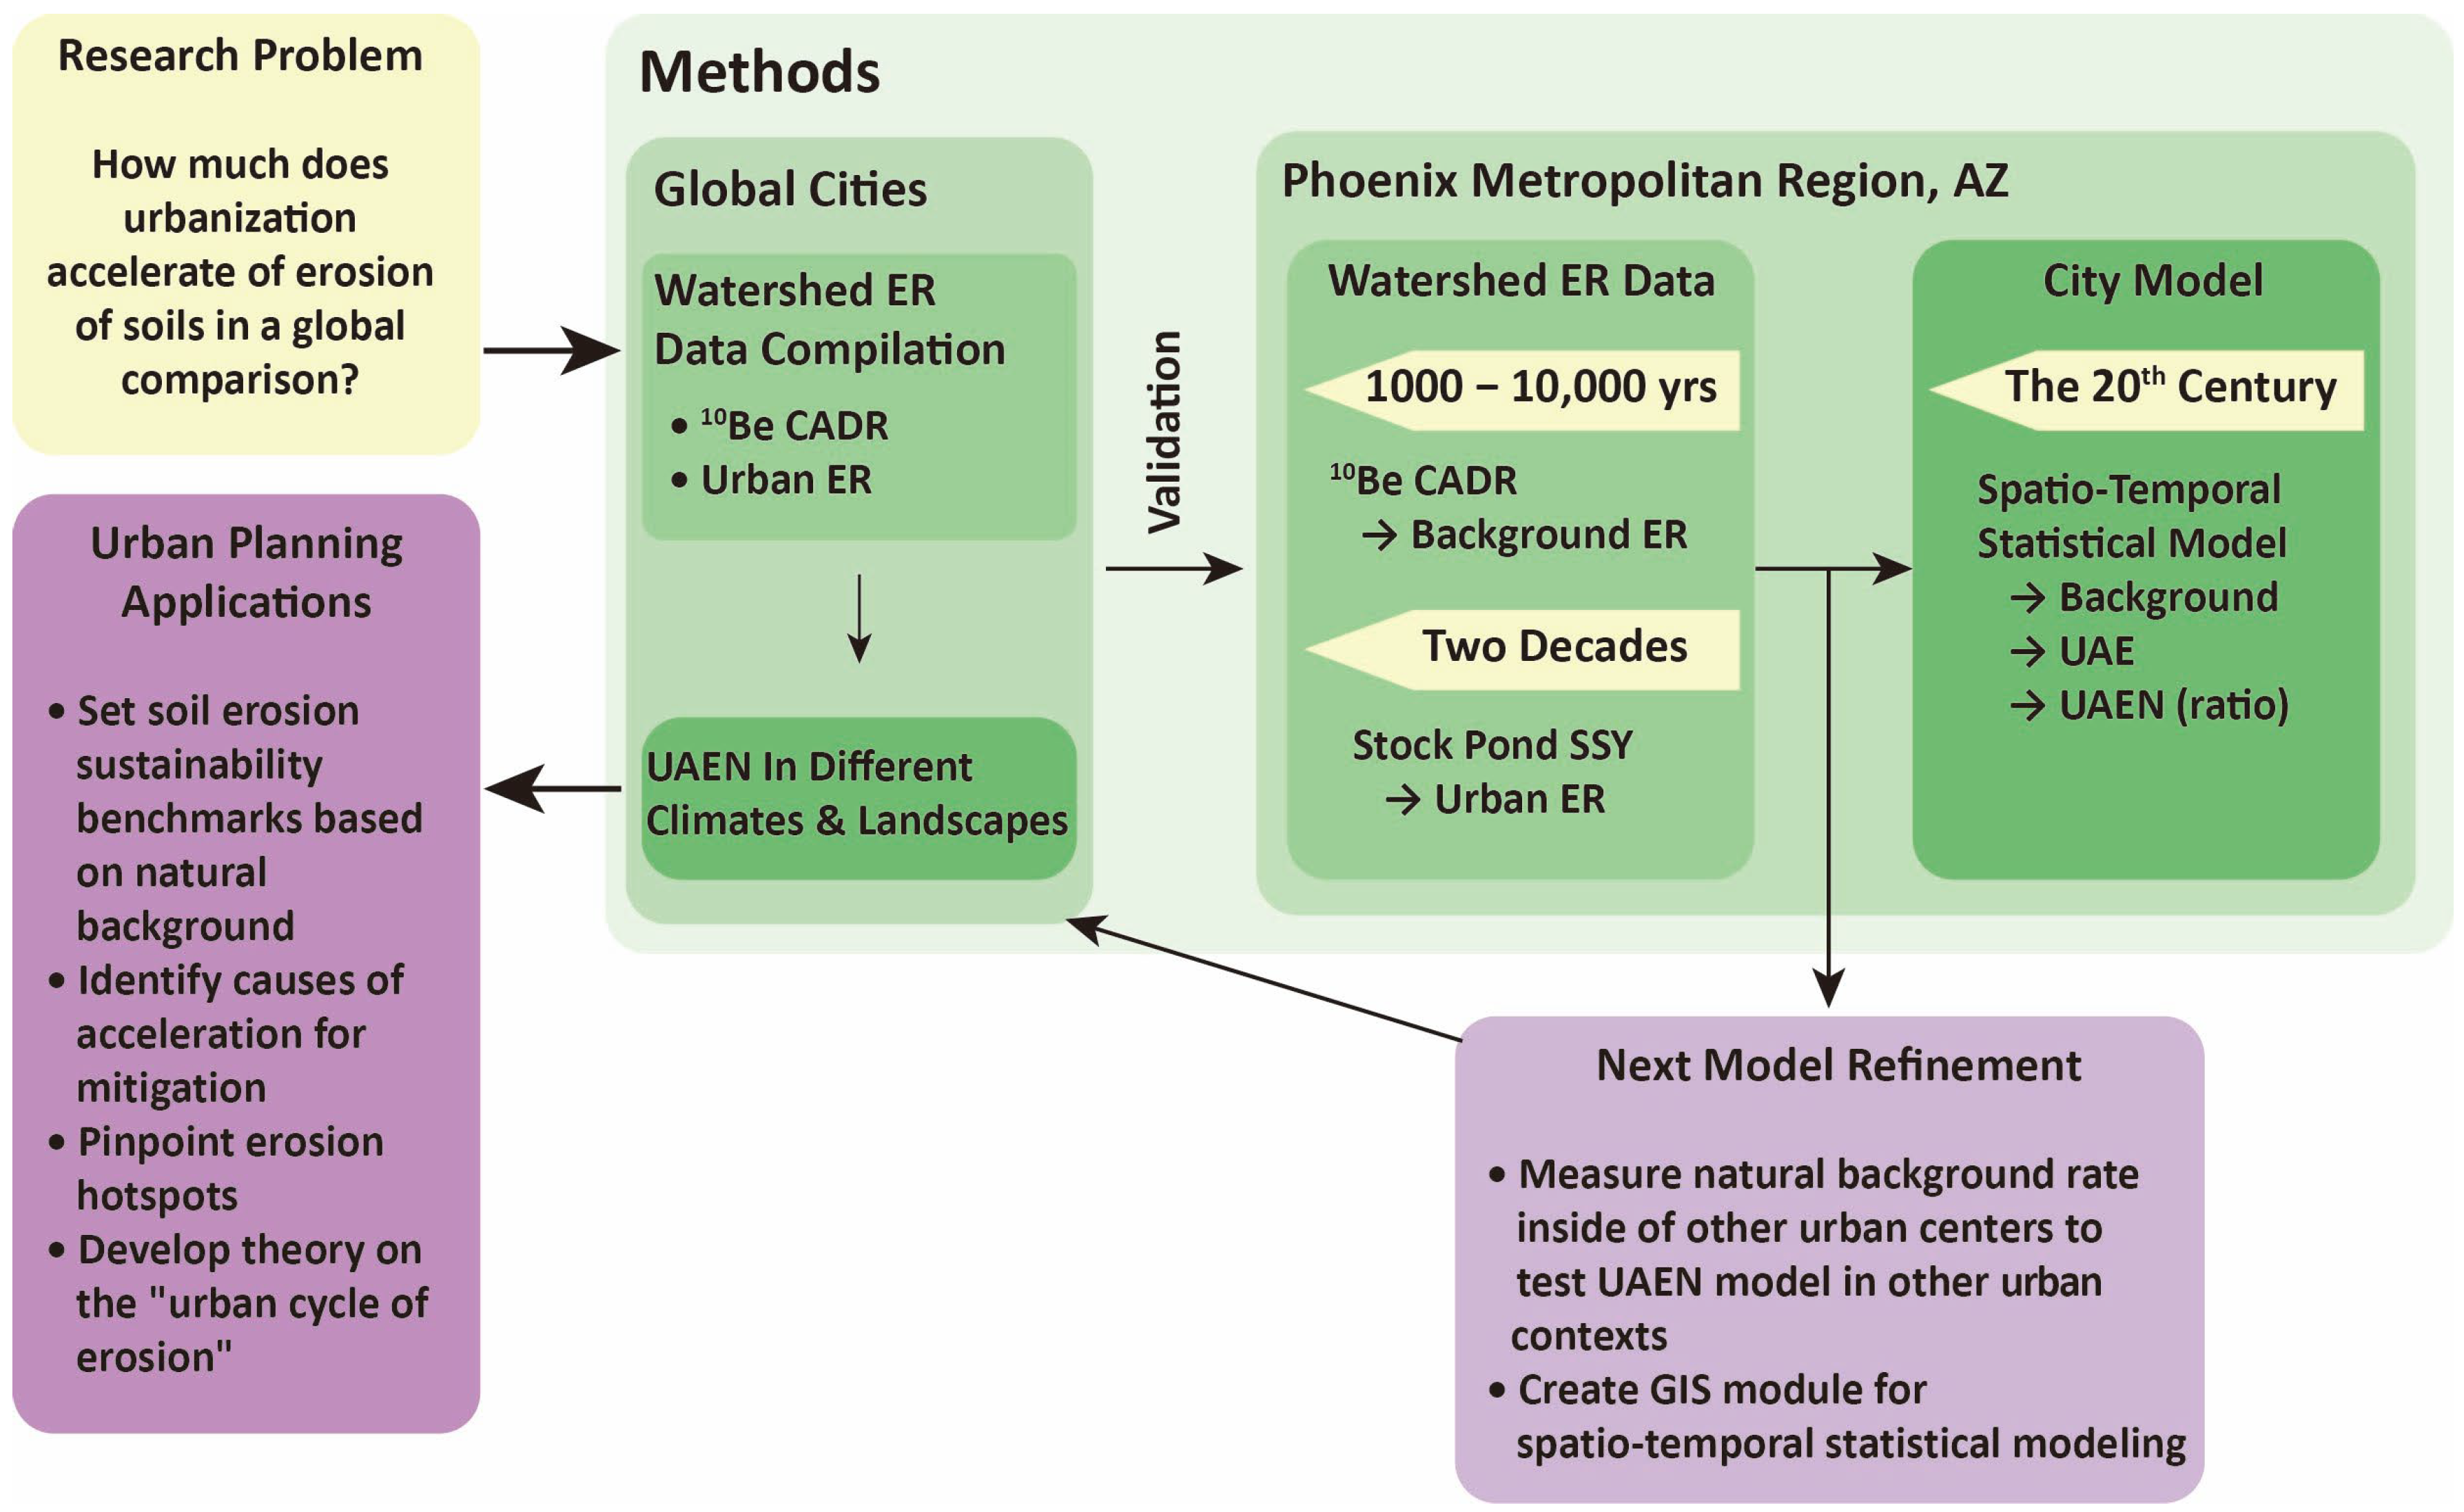
3. Methods
3.1. Comparison of UAEN to Global Cities in Different Environmental Settings
3.2. Natural Background of Soil Erosion Rates
3.3. Modern Rates of Soil Erosion
3.4. Modeling Background Rates of Erosion for the Entire Phoenix Metropolitan Region
3.5. Modeling Urban Acceleration of Erosion for the Entire Phoenix Metropolitan Region
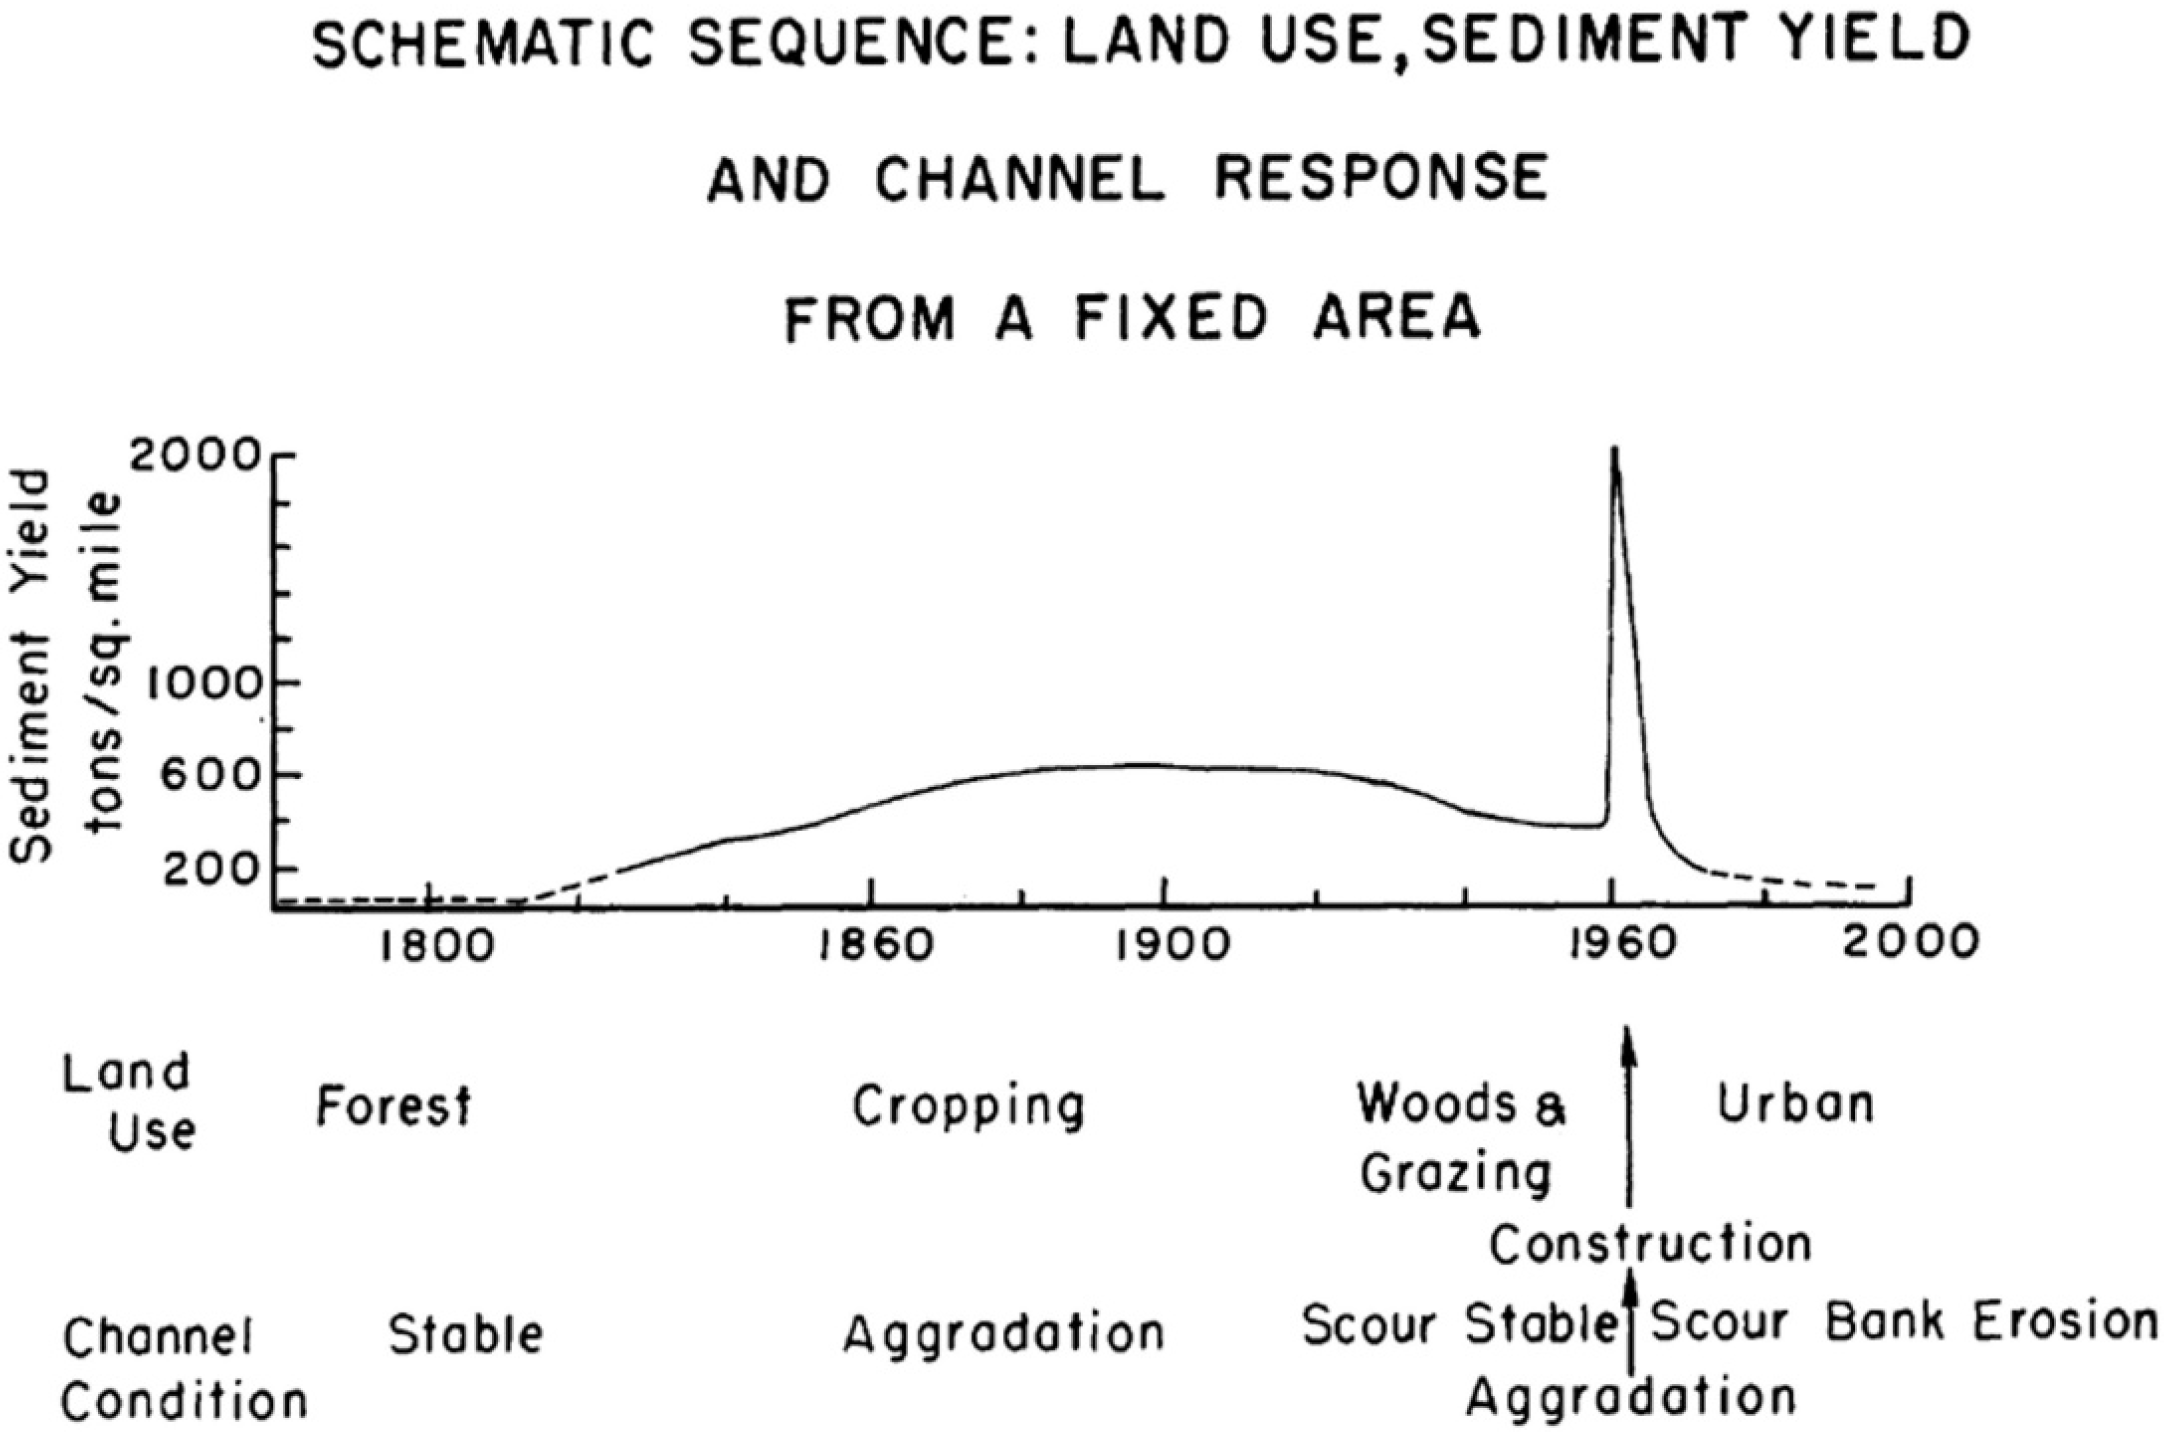
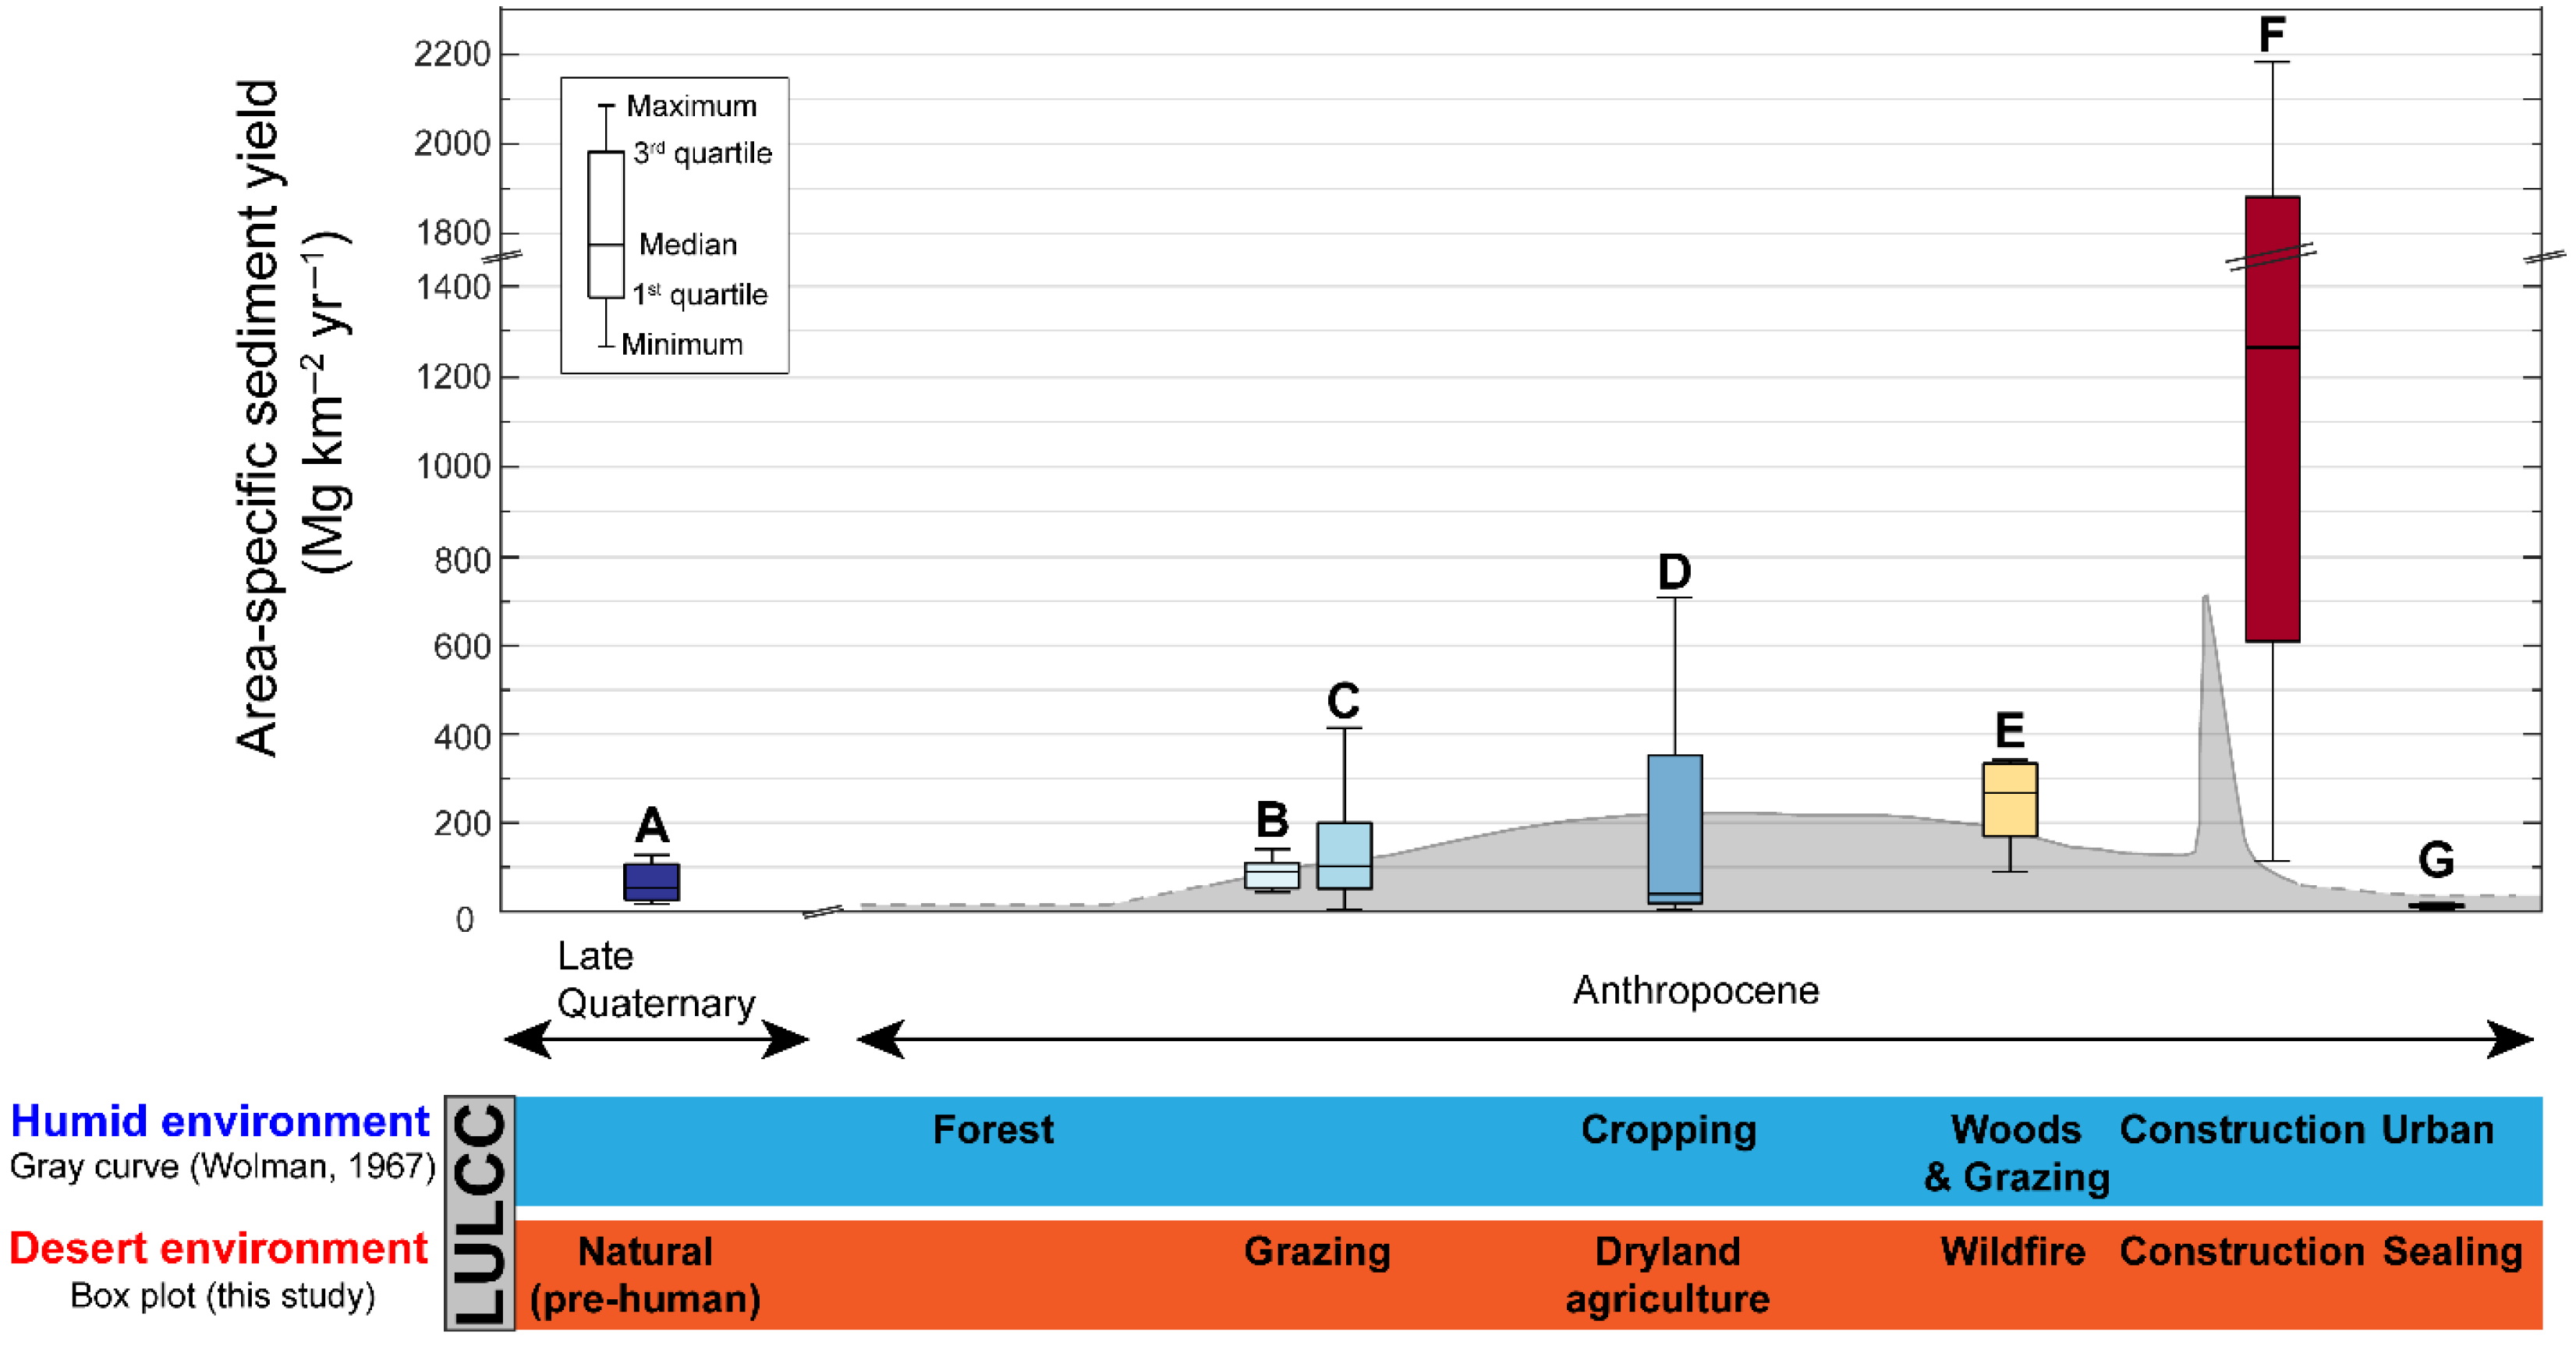
3.6. Urban Cycle of Erosion for an Arid Environment
4. Results
4.1. Modeling of UAEN for Global Cities in Different Environmental Settings
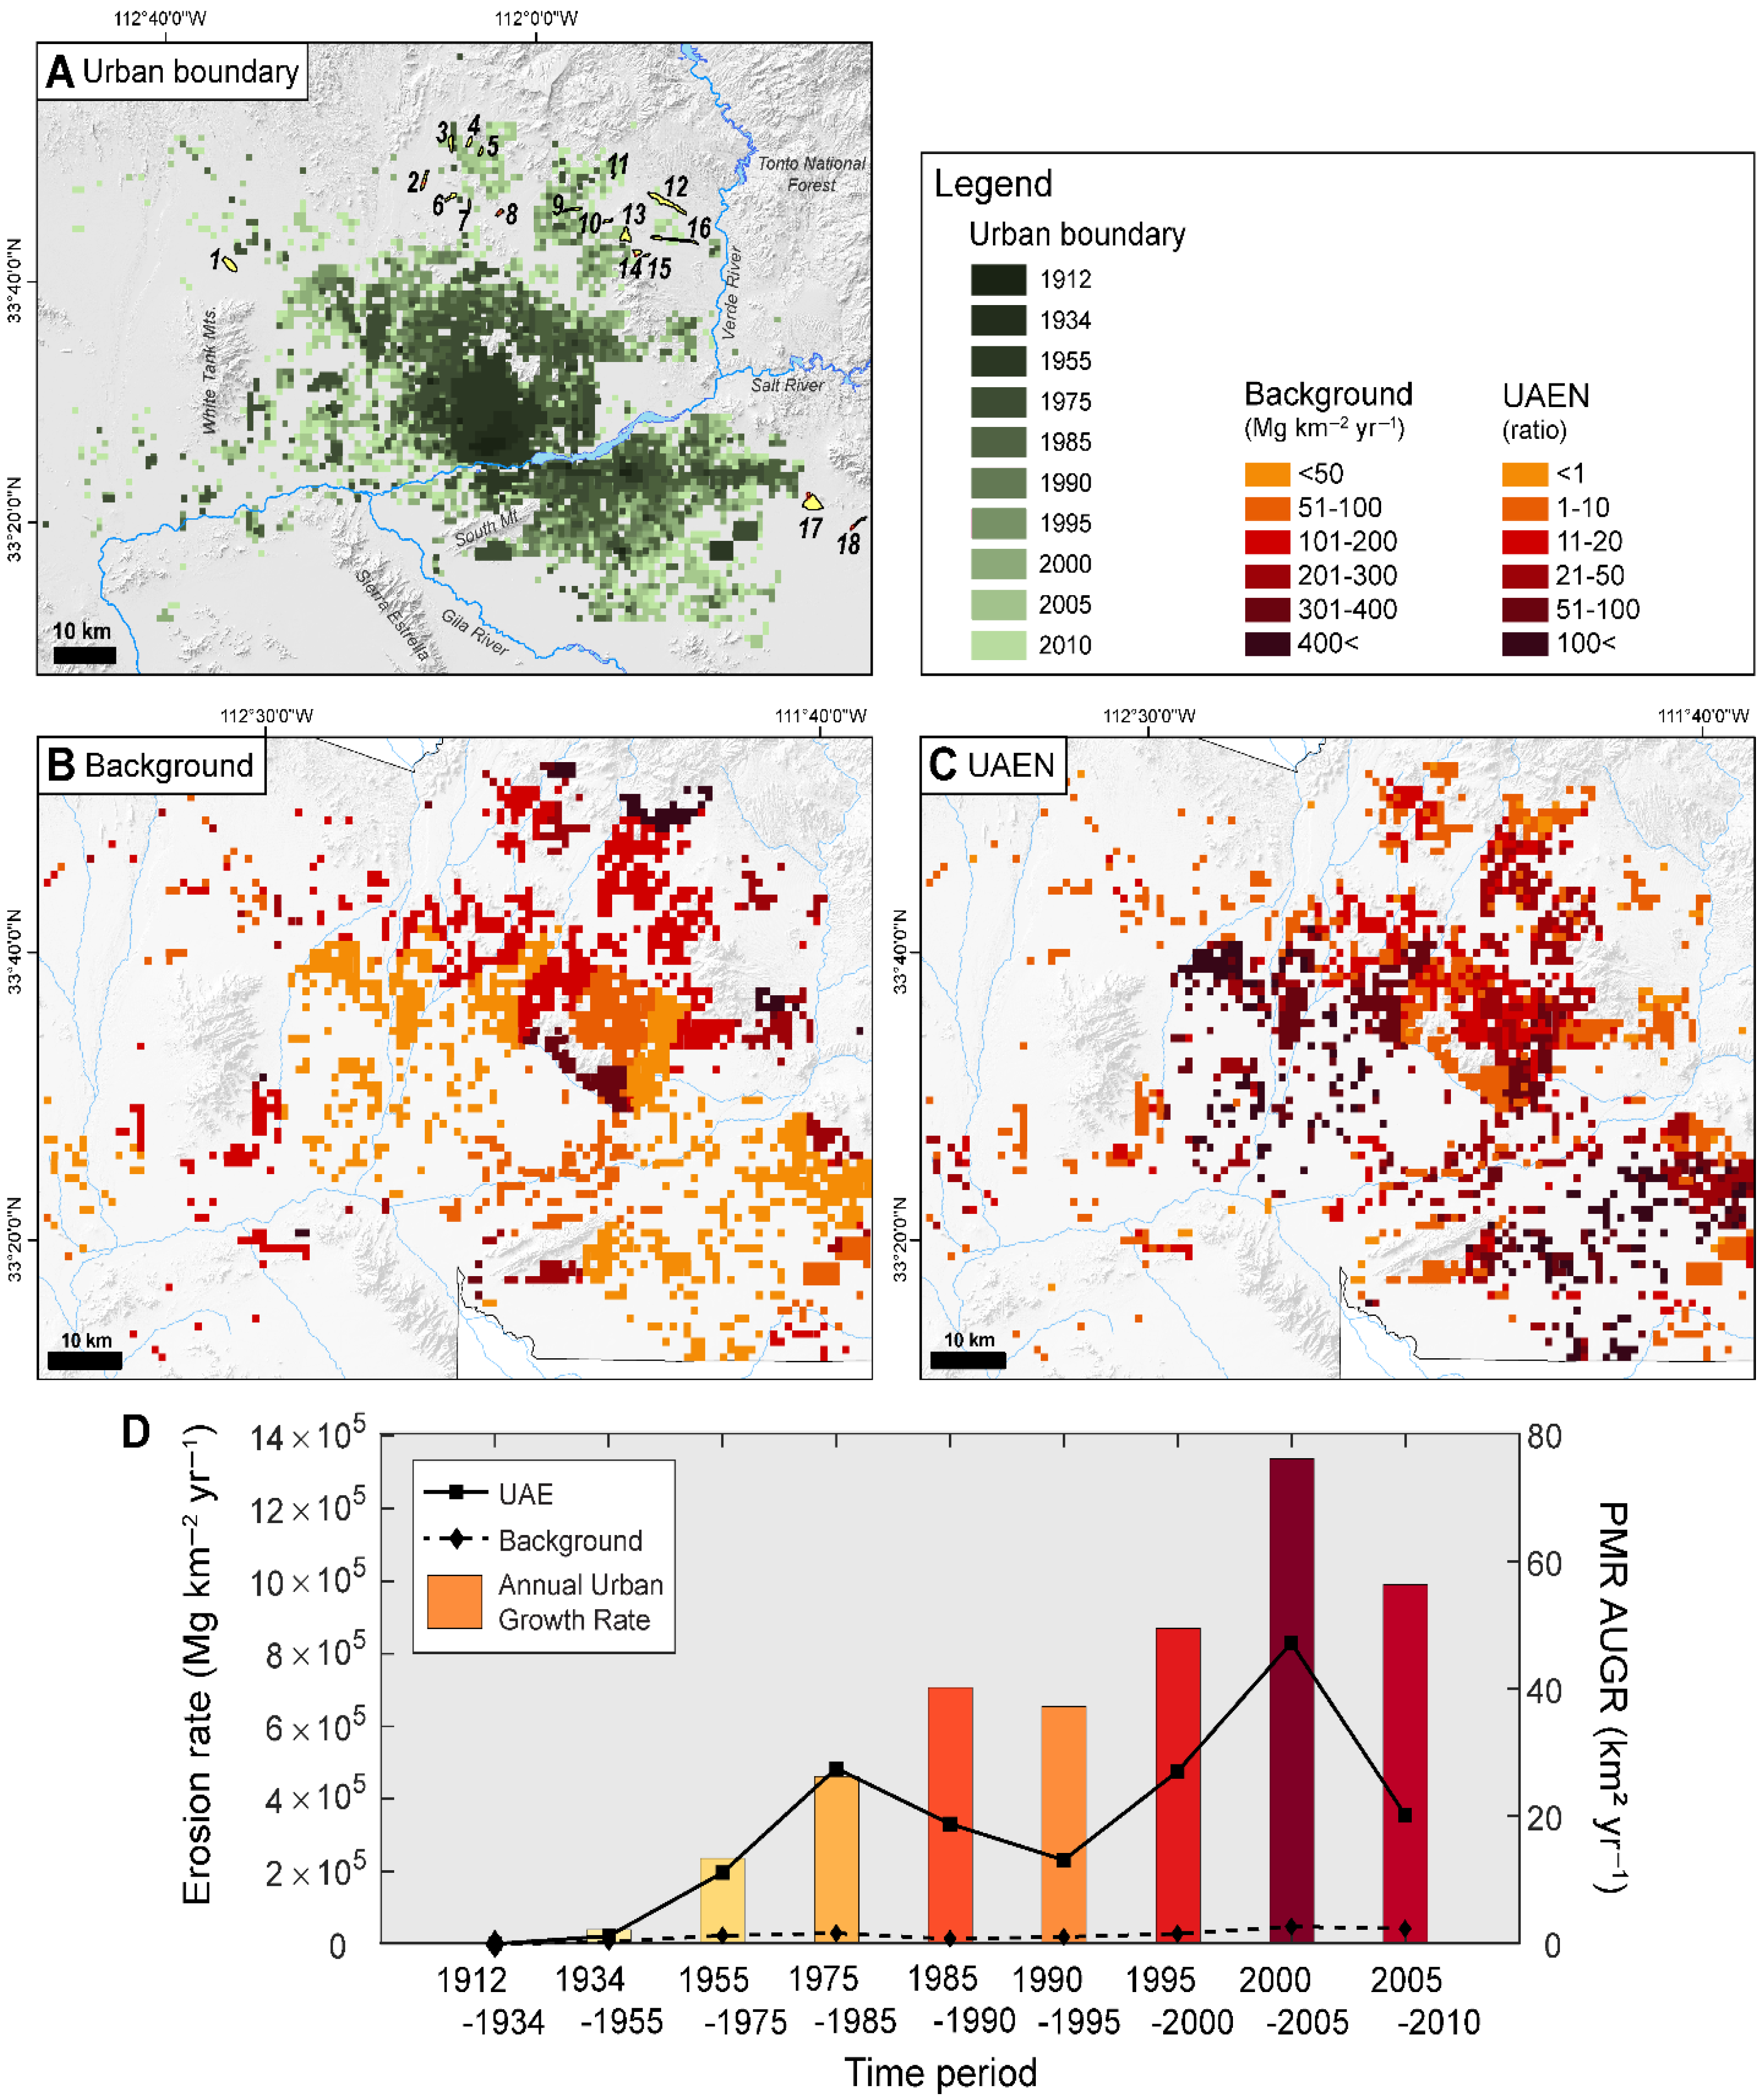
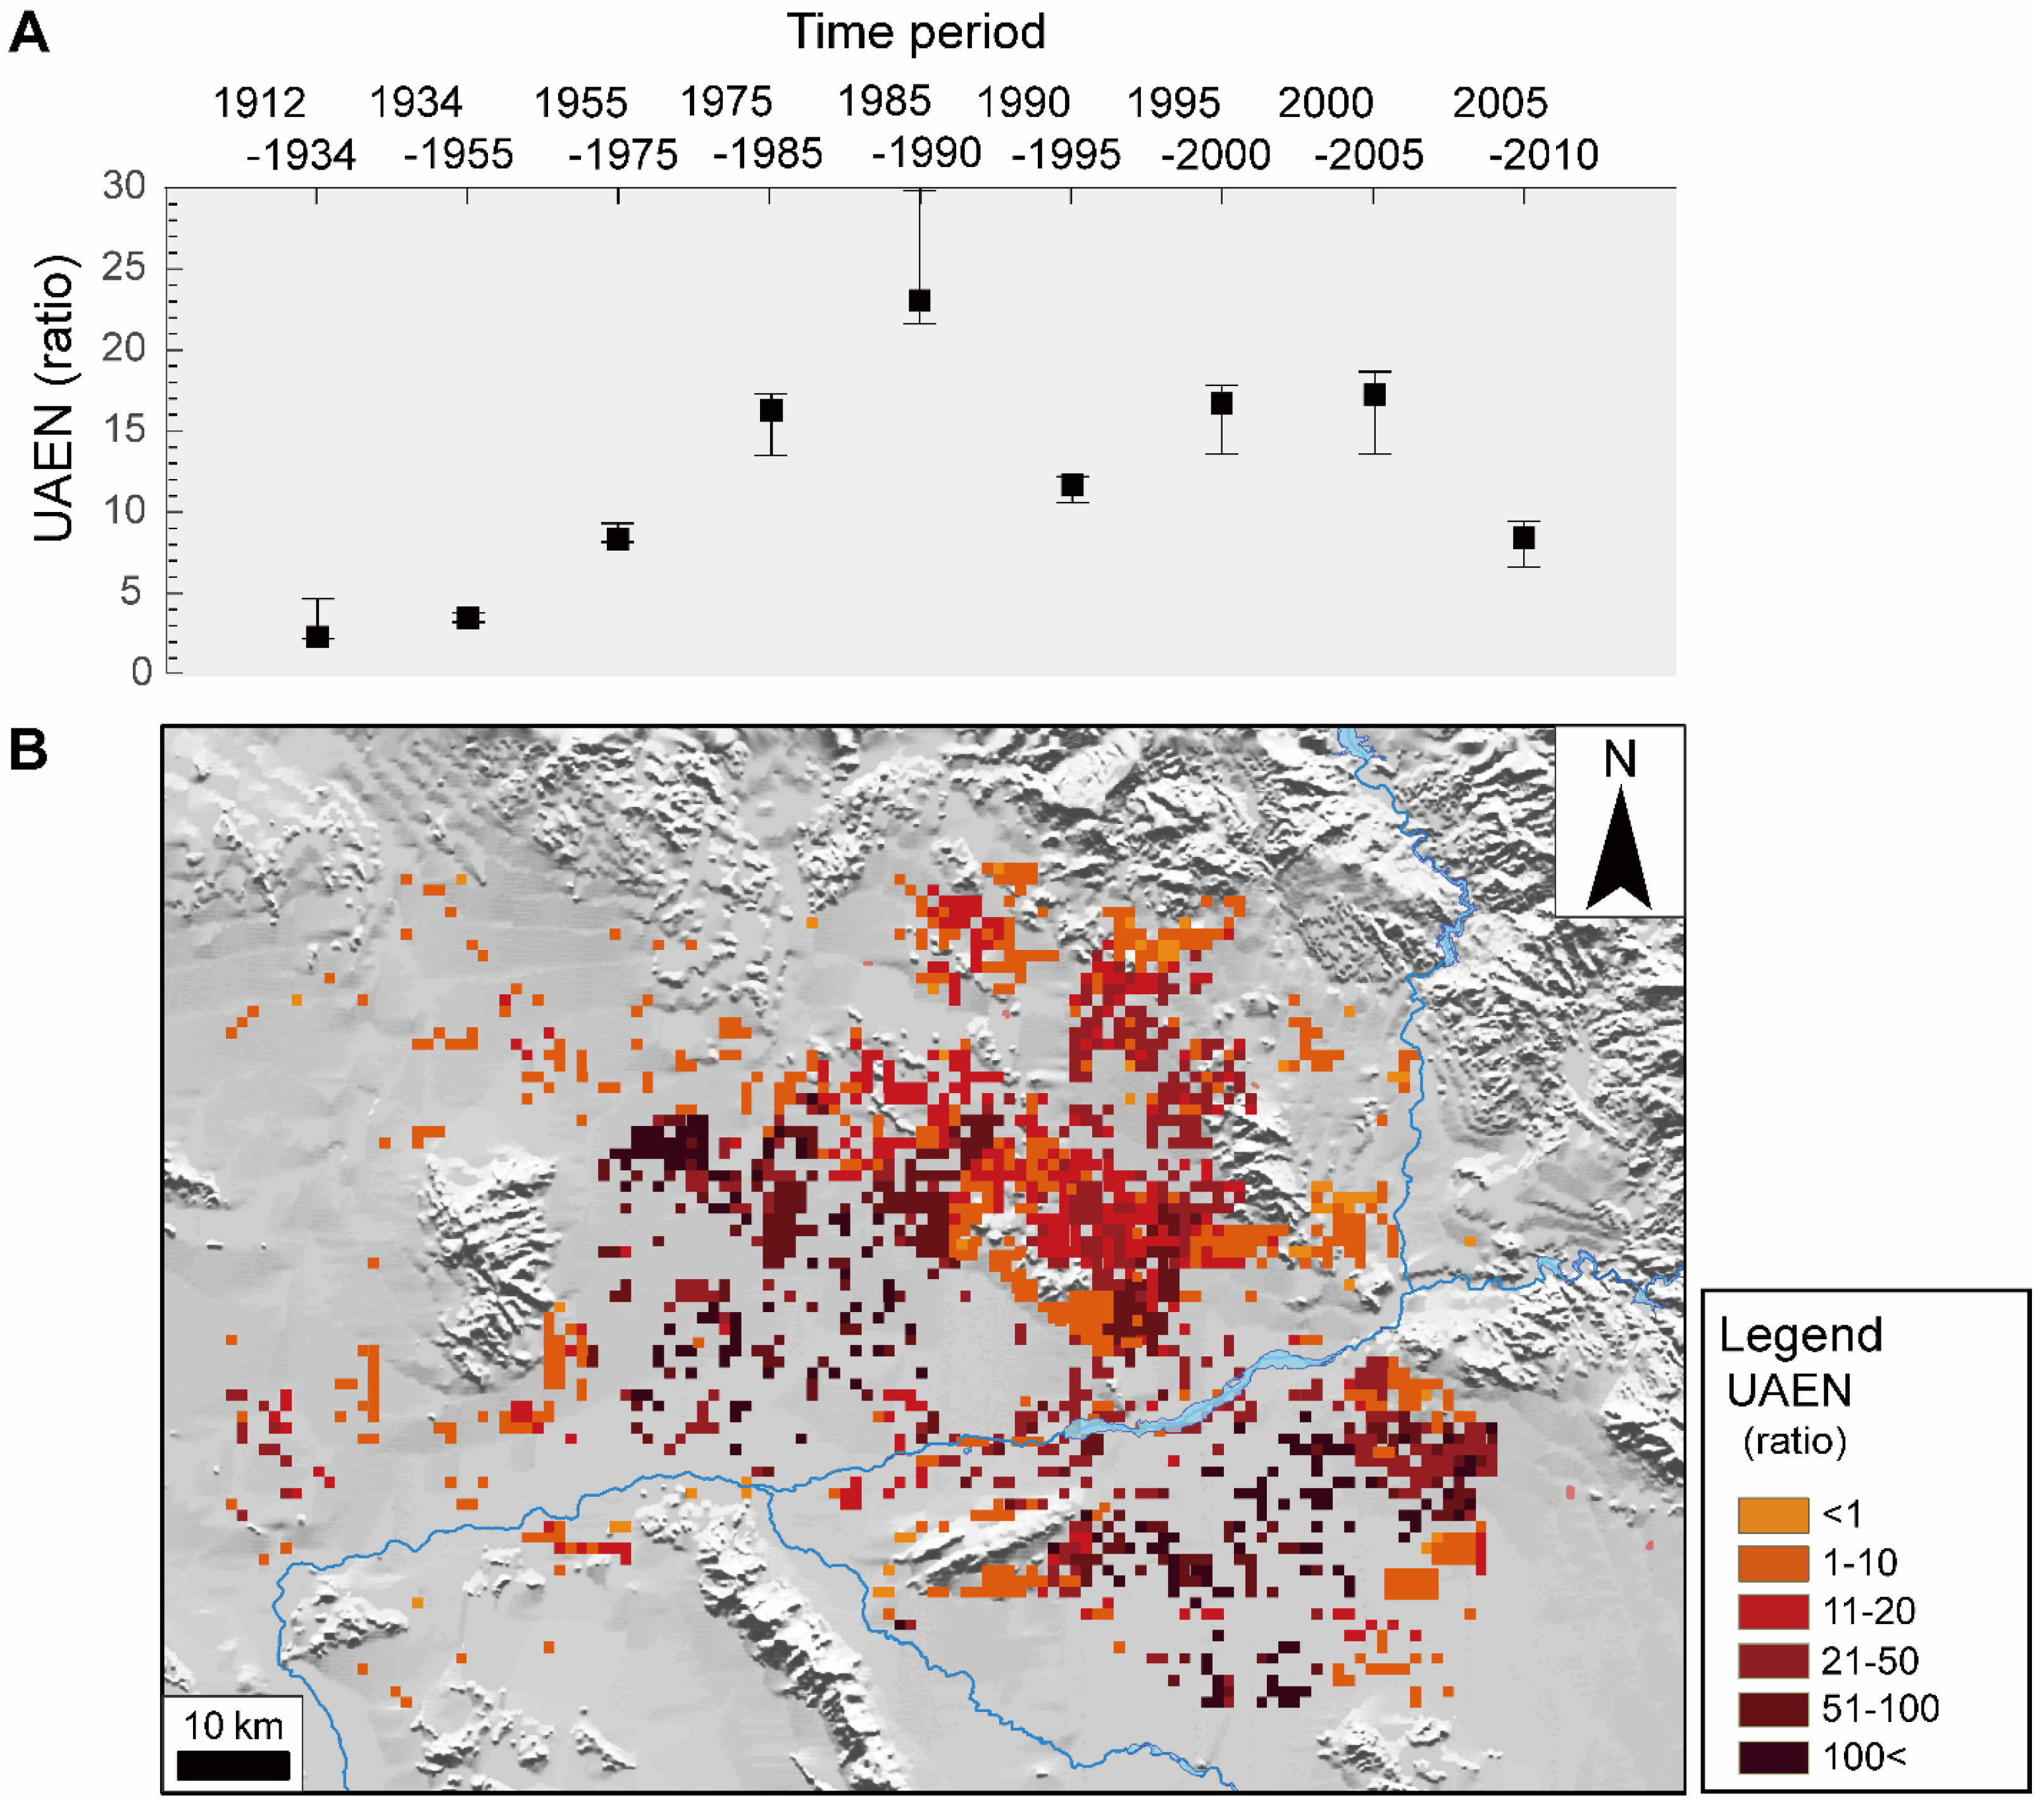
4.2. Modeling Natural Background and Urbanization-Related Erosion in the Metropolitan Phoenix Region
4.3. Urban Cycle of Erosion for Arid Environments
5. Discussion
5.1. Sustainable Landscape Pattern and Urban Soil Sustainability
5.2. Testing Global Cities Model with Phoenix-Region Case Study
5.3. Spatial and Temporal Variability in Soil Sustainability
5.4. Why Precipitation Falling on Urban Construction Sites Is Different from Natural Watersheds: Implication for SLP Serving Spatial Planning
5.5. The Urban Cycle of Erosion and Soil Sustainability
5.6. Broader Impacts of Urban Soil Erosion for Urban Planning
6. Conclusions
Supplementary Materials
Author Contributions
Funding
Data Availability Statement
Acknowledgments
Conflicts of Interest
Abbreviations
| CADR | Catchment-averaged denudation rate |
| PMR | Phoenix Metropolitan Region |
| UAE | Urban-accelerated erosion |
| UAEN | Urbanization’s acceleration of soil erosion above natural background |
| LULCC | Land use and land cover changes |
| SSY | Area-specific sediment yields |
| MAP | Mean annual precipitation |
| SLP | Sustainable landscape pattern |
References
- De Kimpe, C.R.; Morel, J.L. Urban soil management: A growing concern. Soil Sci. 2000, 165, 31–40. [Google Scholar] [CrossRef]
- Kumar, K.; Hundal, L.S. Soil in the City: Sustainably Improving Urban Soils. J. Environ. Qual. 2016, 45, 2–8. [Google Scholar] [CrossRef]
- Louise, A.; Lucas, M.; Adrien, T.; Cyrille, V.; Franck, R. After-sealing life in urban soils: Experimental evidence of resilience and efficiency of ectomycorrhizal inoculation. Landsc. Urban Plan. 2024, 251, 105149. [Google Scholar] [CrossRef]
- Pouyat, R.V.; Yesilonis, I.D.; Nowak, D.J. Carbon Storage by Urban Soils in the United States. J. Environ. Qual. 2006, 35, 1566–1575. [Google Scholar] [CrossRef]
- Vasenev, V.; Kuzyakov, Y. Urban soils as hot spots of anthropogenic carbon accumulation: Review of stocks, mechanisms and driving factors. Land Degrad. Dev. 2018, 29, 1607–1622. [Google Scholar] [CrossRef]
- Johnston, M.R.; Balster, N.J.; Zhu, J. Impact of Residential Prairie Gardens on the Physical Properties of Urban Soil in Madison, Wisconsin. J. Environ. Qual. 2016, 45, 45–52. [Google Scholar] [CrossRef]
- Berland, A.; Shiflett, S.A.; Shuster, W.D.; Garmestani, A.S.; Goddard, H.C.; Herrmann, D.L.; Hopton, M.E. The role of trees in urban stormwater management. Landsc. Urban Plan. 2017, 162, 167–177. [Google Scholar] [CrossRef] [PubMed]
- Edmondson, J.L.; Stott, I.; Davies, Z.G.; Gaston, K.J.; Leake, J.R. Soil surface temperatures reveal moderation of the urban heat island effect by trees and shrubs. Sci. Rep. 2016, 6, 33708. [Google Scholar] [CrossRef]
- Murata, T.; Kawai, N. Degradation of the urban ecosystem function due to soil sealing: Involvement in the heat island phenomenon and hydrologic cycle in the Tokyo metropolitan area. Soil Sci. Plant Nutr. 2018, 64, 145–155. [Google Scholar] [CrossRef]
- da Silva, R.T.; Fleskens, L.; van Delden, H.; van der Ploeg, M. Incorporating soil ecosystem services into urban planning: Status, challenges and opportunities. Landsc. Ecol. 2018, 33, 1087–1102. [Google Scholar] [CrossRef]
- Anne, B.; Geoffroy, S.; Cherel, J.; Warot, G.; Marie, S.; Noël, C.J.; Louis, M.J.; Christophe, S. Towards an operational methodology to optimize ecosystem services provided by urban soils. Landsc. Urban Plan. 2018, 176, 1–9. [Google Scholar] [CrossRef]
- Zhao, J.; Yu, L.; Zhao, L.; Fu, H.; Gong, P. Significant contribution of urban morphological diversity to urban surface thermal heterogeneity. Urban Clim. 2025, 61, 102383. [Google Scholar] [CrossRef]
- Zou, Y.; Chen, W.; Li, S.; Wang, T.; Yu, L.; Zhang, X.; Xu, M.; Jiang, B.; Wu, C.; Singh, R.P.; et al. Assessing vegetation dynamics and human impacts in natural and urban areas of China: Insights from remote sensing data. J. Environ. Manag. 2025, 373, 123632. [Google Scholar] [CrossRef]
- Zhao, J.; Chen, W.; Liu, Z.; Liu, W.; Li, K.; Zhang, B.; Yu, L.; Sakai, T. Urban expansion, economic development, and carbon emissions: Trends, patterns, and decoupling in mainland China’s provincial capitals (1985–2020). Ecol. Indic. 2024, 169, 112777. [Google Scholar] [CrossRef]
- Wolman, M. A cycle of sedimentation and erosion in urban river channels. Geogr. Ann. Ser. A Phys. Geogr. 1967, 49, 385–395. [Google Scholar] [CrossRef]
- Shikangalah, R.N.; Jeltsch, F.; Blaum, N.; Mueller, E.N. A review on urban soil water erosion. J. Stud. Humanit. Soc. Sci. 2016, 5, 163–178. [Google Scholar]
- Russell, K.L.; Vietz, G.J.; Fletcher, T.D. Global sediment yields from urban and urbanizing watersheds. Earth-Sci. Rev. 2017, 168, 73–80. [Google Scholar] [CrossRef]
- von Blanckenburg, F. The control mechanisms of erosion and weathering at basin scale from cosmogenic nuclides in river sediment. Earth Planet. Sci. Lett. 2005, 237, 462–479. [Google Scholar] [CrossRef]
- Talen, E. Zoning for and Against Sprawl: The Case for Form-Based Codes. J. Urban Des. 2013, 18, 175–200. [Google Scholar] [CrossRef]
- Keith, L.; Meerow, S. Planning for urban heat resilience. In Planning Advisory Services (PAS) Report; American Planning Association: Chicago, IL, USA, 2011; Available online: http://www.planning.org/publications/report/9245695/ (accessed on 31 July 2025).
- Jeong, A.; Dorn, R.I.; Seong, Y.-B.; Yu, B.-Y. Acceleration of Soil Erosion by Different Land Uses in Arid Lands above 10Be Natural Background Rates: Case Study in the Sonoran Desert, USA. Land 2021, 10, 834. [Google Scholar] [CrossRef]
- Jeong, A.; Dorn, R.I. Soil erosion from urbanization processes in the Sonoran Desert, Arizona, USA. Land Degrad. Dev. 2019, 30, 226–238. [Google Scholar] [CrossRef]
- U.S. Census Bureau. City and Town Population Totals: 2020–2023. Available online: https://www.census.gov/data/tables/time-series/demo/popest/2020s-total-cities-and-towns.html (accessed on 31 July 2025).
- Arizona State University. Central Arizona–Phoenix Long-Term Ecological Research. Available online: https://sustainability-innovation.asu.edu/caplter/ (accessed on 31 July 2025).
- LTER Network. Baltimore Ecosystem Study. Available online: https://lternet.edu/site/baltimore-ecosystem-study/ (accessed on 31 July 2025).
- Peng, J.; Stuhlmacher, M.; Georgescu, M.; Wang, M.; Turner, B., II. More agglomerations, more polarization? Urban development during the last 20 years in China. Res. Sq. 2022; preprint. [Google Scholar] [CrossRef]
- Reusser, L.; Bierman, P.; Rood, D. Quantifying human impacts on rates of erosion and sediment transport at a landscape scale. Geology 2015, 43, 171–174. [Google Scholar] [CrossRef]
- Portenga, E.W.; Bierman, P.R.; Trodick, C.D., Jr.; Greene, S.E.; DeJong, B.D.; Rood, D.H.; Pavich, M.J. Erosion rates and sediment flux within the Potomac River basin quantified over millennial timescales using beryllium isotopes. GSA Bull. 2019, 131, 1295–1311. [Google Scholar] [CrossRef]
- Harel, M.-A.; Mudd, S.; Attal, M. Global analysis of the stream power law parameters based on worldwide 10Be denudation rates. Geomorphology 2016, 268, 184–196. [Google Scholar] [CrossRef]
- Fekete, B.M.; Vörösmarty, C.J.; Grabs, W. High-resolution fields of global runoff combining observed river discharge and simulated water balances. Glob. Biogeochem. Cycles 2002, 16, 10–15. [Google Scholar] [CrossRef]
- Saiz, A. The geographic determinants of housing supply. Q. J. Econ. 2010, 125, 1253–1296. [Google Scholar] [CrossRef]
- Furbish, D.J.; Hamner, K.K.; Schmeeckle, M.; Borosund, M.N.; Mudd, S.M. Rain splash of dry sand revealed by high-speed imaging and sticky paper splash targets. J. Geophys. Res. Earth Surf. 2007, 112, F01001. [Google Scholar] [CrossRef]
- Deinlein, R.; Böhm, A. Modeling Overland Flow and Soil Erosion for a Military Training Area in Southern Germany BT—Soil Erosion: Application of Physically Based Models; Schmidt, J., Ed.; Springer: Berlin/Heidelberg, Germany, 2000; pp. 163–178. [Google Scholar] [CrossRef]
- Ferreira, C.S.S.; Ferreira, A.J.D.; Pato, R.L.; Magalhăes, M.d.C.; Coelho, C.d.O.; Santos, C. Rainfall-runoff-erosion relationships study for different land uses, in a sub-urban area. Z. Fur. Geomorphol. 2012, 56, 5–20. [Google Scholar] [CrossRef]
- Jeong, A. Sediment accumulation expectations for growing desert cities: A realistic desired outcome to be used in constructing appropriately sized sediment storage of flood control structures. Environ. Res. Lett. 2019, 14, 125005. [Google Scholar] [CrossRef]
- Yao, F.; Wu, J.; Li, W.; Peng, J. Estimating daily PM2.5 concentrations in Beijing using 750-M VIIRS IP AOD retrievals and a nested spatiotemporal statistical model. Remote. Sens. 2019, 11, 841. [Google Scholar] [CrossRef]
- Gellis, A.; Myers, M.; Noe, G.; Hupp, C.; Schenk, E.; Myers, L. Storms, channel changes, and a sediment budget for an urban-suburban stream, Difficult Run, Virginia, USA. Geomorphology 2017, 278, 128–148. [Google Scholar] [CrossRef]
- Verstraeten, G.; Poesen, J. Variability of dry sediment bulk density between and within retention ponds and its impact on the calculation of sediment yields. Earth Surf. Process. Landf. 2001, 26, 375–394. [Google Scholar] [CrossRef]
- Schaller, M.; von Blanckenburg, F.; Hovius, N.; Kubik, P. Large-scale erosion rates from in situ-produced cosmogenic nuclides in European river sediments. Earth Planet. Sci. Lett. 2001, 188, 441–458. [Google Scholar] [CrossRef]
- Bierman, P.R.; Reuter, J.M.; Pavich, M.; Gellis, A.C.; Caffee, M.W.; Larsen, J. Using cosmogenic nuclides to contrast rates of erosion and sediment yield in a semi-arid, arroyo-dominated landscape, Rio Puerco Basin, New Mexico. Earth Surf. Process. Landf. 2005, 30, 935–953. [Google Scholar] [CrossRef]
- Singh, G.; Panda, R.K. Grid-cell based assessment of soil erosion potential for identification of critical erosion prone areas using USLE, GIS and remote sensing: A case study in the Kapgari watershed, India. Int. Soil Water Conserv. Res. 2017, 5, 202–211. [Google Scholar] [CrossRef]
- Pham, T.G.; Degener, J.; Kappas, M. Integrated universal soil loss equation (USLE) and Geographical Information System (GIS) for soil erosion estimation in A Sap basin: Central Vietnam. Int. Soil Water Conserv. Res. 2018, 6, 99–110. [Google Scholar] [CrossRef]
- Didoné, E.J.; Minella, J.P.G.; Piccilli, D.G.A. How to model the effect of mechanical erosion control practices at a catchment scale? Int. Soil Water Conserv. Res. 2021, 9, 370–380. [Google Scholar] [CrossRef]
- Gao, G.; Liang, Y.; Liu, J.; Dunkerley, D.; Fu, B. A modified RUSLE model to simulate soil erosion under different ecological restoration types in the loess hilly area. Int. Soil Water Conserv. Res. 2024, 12, 258–266. [Google Scholar] [CrossRef]
- Aswathy, S.S.; Sindhu, P. Effect of urbanization on soil erosion. Int. J. Innov. Res. Sci. Eng. Technol. 2013, 2, 75–81. [Google Scholar]
- Chicas, S.D.; Omine, K.; Ford, J.B. Identifying erosion hotspots and assessing communities’ perspectives on the drivers, underlying causes and impacts of soil erosion in Toledo’s Rio Grande Watershed: Belize. Appl. Geogr. 2016, 68, 57–67. [Google Scholar] [CrossRef]
- Polovina, S.; Radić, B.; Ristić, R.; Kovačević, J.; Milčanović, V.; Živanović, N. Soil erosion assessment and prediction in urban landscapes: A new G2 model approach. Appl. Sci. 2021, 11, 4154. [Google Scholar] [CrossRef]
- Wu, J.; Li, J.; Peng, J.; Li, W.; Xu, G.; Dong, C. Applying land use regression model to estimate spatial variation of PM2.5 in Beijing, China. Environ. Sci. Pollut. Res. 2015, 22, 7045–7061. [Google Scholar] [CrossRef]
- Dong, J.; Jiang, H.; Gu, T.; Liu, Y.; Peng, J. Sustainable landscape pattern: A landscape approach to serving spatial planning. Landsc. Ecol. 2022, 37, 31–42. [Google Scholar] [CrossRef]
- Wolman, M.G.; Schick, A.P. Effects of construction on fluvial sediment, urban and suburban areas of Maryland. Water Resour. Res. 1967, 3, 451–464. [Google Scholar] [CrossRef]
- Vanmaercke, M.; Poesen, J.; Broeckx, J.; Nyssen, J. Sediment yield in Africa. Earth-Sci. Rev. 2014, 136, 350–368. [Google Scholar] [CrossRef]
- Jeong, A.; Cheung, S.Y.; Walker, I.J.; Dorn, R.I. Urban Geomorphology of an Arid City: Case Study of Phoenix, Arizona. In Urban Geomorphology Landforms and Processes in Cities; Thornbush, M.J., Allen, C.D., Eds.; Elsevier: Amsterdam, The Netherlands, 2018; pp. 177–204. [Google Scholar] [CrossRef]
- D’Antonio, C.M.; Vitousek, P.M. Biological Invasions by Exotic Grasses, the Grass/Fire Cycle, and Global Change. Annu. Rev. Ecol. Syst. 1992, 23, 63–87. [Google Scholar] [CrossRef]
- Séré, G.; Le Guern, C.; Bispo, A.; Layet, C.; Ducommun, C.; Clesse, M.; Schwartz, C.; Vidal-Beaudet, L. Selection of soil health indicators for modelling soil functions to promote smart urban planning. Sci. Total. Environ. 2024, 924, 171347. [Google Scholar] [CrossRef]
- Hutahaean, M.; Sagala, S.; Subrata, S.A.; Zawani, H.; Insan, A.; Noer, I.S.; Wijaya, H.; Putra, D.D. Sustainable Urban Planning through Green Belt in IKN: A Literature Review. IOP Conf. Ser. Earth Environ. Sci. 2025, 1447, 012030. [Google Scholar] [CrossRef]
- Peng, J.; Wang, A.; Luo, L.; Liu, Y.; Li, H.; Hu, Y.; Meersmans, J.; Wu, J. Spatial identification of conservation priority areas for urban ecological land: An approach based on water ecosystem services. Land Degrad. Dev. 2019, 30, 683–694. [Google Scholar] [CrossRef]
- Feng, D.; Bao, W.; Yang, Y.; Fu, M. How do government policies promote greening? Evidence from China. Land Use Policy 2021, 104, 105389. [Google Scholar] [CrossRef]
- Cannavo, P.; Vidal-Beaudet, L.; Grosbellet, C. Prediction of long-term sustainability of constructed urban soil: Impact of high amounts of organic matter on soil physical properties and water transfer. Soil Use Manag. 2014, 30, 272–284. [Google Scholar] [CrossRef]
- Maienza, A.; Ungaro, F.; Baronti, S.; Colzi, I.; Giagnoni, L.; Gonnelli, C.; Renella, G.; Ugolini, F.; Calzolari, C. Biological Restoration of Urban Soils after De-Sealing Interventions. Agriculture 2021, 11, 190. [Google Scholar] [CrossRef]
- Shikangalah, R.N. Soil loss estimation in a semi-arid mountainous cathment environment, City of Windhoek, Namibia. J. Stud. Humanit. Soc. Sci. 2017, 6, 209–222. [Google Scholar]
- O’RIordan, R.; Davies, J.; Stevens, C.; Quinton, J.N.; Boyko, C. The ecosystem services of urban soils: A review. Geoderma 2021, 395, 115076. [Google Scholar] [CrossRef]
- Xu, Z.; Peng, J.; Zhang, H.; Liu, Y.; Dong, J.; Qiu, S. Exploring spatial correlations between ecosystem services and sustainable development goals: A regional-scale study from China. Landsc. Ecol. 2022, 37, 3201–3221. [Google Scholar] [CrossRef]
- Heimsath, A.M.; Dietrich, W.E.; Nishiizumi, K.; Finkel, R.C. The soil production function and landscape equilibrium. Nature 1997, 388, 358–361. [Google Scholar] [CrossRef]
- Verheijen, F.G.; Jones, R.J.; Rickson, R.J.; Smith, C.J. Tolerable versus actual soil erosion rates in Europe. Earth-Sci. Rev. 2009, 94, 23–38. [Google Scholar] [CrossRef]
- Palmer, L. Urban agriculture growth in US cities. Nat. Sustain. 2018, 1, 5–7. [Google Scholar] [CrossRef]
- Thornbush, M. Urban agriculture in the transition to low carbon cities through urban greening. AIMS Environ. Sci. 2015, 2, 852–867. [Google Scholar] [CrossRef]
- Bowler, D.E.; Buyung-Ali, L.; Knight, T.M.; Pullin, A.S. Urban greening to cool towns and cities: A systematic review of the empirical evidence. Landsc. Urban Plan. 2010, 97, 147–155. [Google Scholar] [CrossRef]
- Pereira, P.; Inácio, M.; Karnauskaitė, D.; Bogdzevič, K.; Gomes, E.; Kalinauskas, M.; Barcelo, D. Nature-Based Solutions Impact on Urban Environment Chemistry: Air, Soil, and Water. In The Handbook of Environmental Chemistry; Barceló, D., Kostianoy, A.G., Eds.; Springer: Berlin/Heidelberg, Germany, 2021; pp. 1–59. [Google Scholar] [CrossRef]
- Jakubínský, J.; Pechanec, V.; Cudlín, O.; Purkyt, J.; Cudlín, P. Identification of Surface Runoff Source Areas as a Tool for Projections of NBS in Water Management. In The Handbook of Environmental Chemistry; Barceló, D., Kostianoy, A.G., Eds.; Springer: Berlin/Heidelberg, Germany, 2021; pp. 1–26. [Google Scholar] [CrossRef]
- Seybold, C.A.; Herrick, J.E.; Brejda, J.J. Soil resilience: A fundamental component of soil quality. Soil Sci. 1999, 164, 224–234. [Google Scholar] [CrossRef]
- Stockmann, U.; Minasny, B.; McBratney, A.B. How fast does soil grow? Geoderma 2014, 216, 48–61. [Google Scholar] [CrossRef]
- Smith, M.E.; Lobo, J.; Peeples, M.A.; York, A.M.; Stanley, B.W.; Crawford, K.A.; Gauthier, N.; Huster, A.C. The persistence of ancient settlements and urban sustainability. Proc. Natl. Acad. Sci. USA 2021, 118, e2018155118. [Google Scholar] [CrossRef]
- Braswell, A.E.; Leyk, S.; Connor, D.S.; Uhl, J.H. Creeping disaster along the U.S. coastline: Understanding exposure to sea level rise and hurricanes through historical development. PLoS ONE 2022, 17, e0269741. [Google Scholar] [CrossRef]
- Morrow, S.; Smolen, M.; Stiegler, J.; Cole, J.; Protection, T.; Using Vegetation for Erosion Control on Construction Sites. Oklahoma Cooperative Extension Service BAE-1514. 2003. Available online: http://pods.dasnr.okstate.edu/docushare/dsweb/Get/Document-2264/BAE-1514web.pdf (accessed on 31 July 2025).
- Adewuyi, T.O.; Olofin, E.A.; Olutunmogun, A.K. Examination of the relationship between vegetation cover indices and land degradation in the peri-urban area of Kaduna metropolis, Nigeria. J. Res. For. Wildl. Environ. 2017, 9, 50–60. [Google Scholar]
- Chen, X.; Huang, Y.; Gong, X. The Related Problems in the Construction of the Rainy Season. Reg.—Water Conserv. 2017, 1, 33–41. [Google Scholar] [CrossRef]
- Matsukuma, S.; Sato, S.; Fuubayashi, Y. Demonstration of road improvement by local inhabitants at the Baytsemal Village in the South Omo Zone in southern Ethiopia. Zairaichi 2020, 3, 1–23. [Google Scholar] [CrossRef]
- Liu, L.; Zheng, J.; Guan, J.; Han, W.; Liu, Y. Grassland cover dynamics and their relationship with climatic factors in China from 1982 to 2021. Sci. Total. Environ. 2023, 905, 167067. [Google Scholar] [CrossRef] [PubMed]
- Riebe, C.S.; Kirchner, J.W.; Granger, D.E.; Finkel, R.C. Minimal climatic control on erosion rates in the Sierra Nevada, California. Geology 2001, 29, 447–450. [Google Scholar] [CrossRef]
- Reiners, P.W.; Ehlers, T.A.; Mitchell, S.G.; Montgomery, D.R. Coupled spatial variations in precipitation and long-term erosion rates across the Washington Cascades. Nature 2003, 426, 645–647. [Google Scholar] [CrossRef]
- Mishra, A.K.; Placzek, C.; Jones, R.; Zerboni, A. Coupled influence of precipitation and vegetation on millennial-scale erosion rates derived from 10Be. PLoS ONE 2019, 14, e0211325. [Google Scholar] [CrossRef]
- Jeong, A.; Seong, Y.B.; Dorn, R.I.; Yu, B.Y. Precipitation as a key control on erosion rates in the tectonically inactive northeastern Sonoran Desert, central Arizona, USA. Phys. Geogr. 2024, 45, 53–83. [Google Scholar] [CrossRef]
- Langbein, W.B.; Schumm, S.A. Yield of sediment in relation to mean annual precipitation. Trans. Am. Geophys. Union 1958, 39, 1076–1084. [Google Scholar] [CrossRef]
- Epstein, E.; Grant, W.J. Soil Crust Formation as Affected by Raindrop Impact BT—Physical Aspects of Soil Water and Salts in Ecosystems; Hadas, A., Swartzendruber, D., Rijtema, P.E., Fuchs, M., Yaron, B., Eds.; Springer: Berlin/Heidelberg, Germany, 1973; pp. 195–201. [Google Scholar] [CrossRef]
- Laidlaw, M.A.; Filippelli, G.M.; Brown, S.; Paz-Ferreiro, J.; Reichman, S.M.; Netherway, P.; Truskewycz, A.; Ball, A.S.; Mielke, H.W. Case studies and evidence-based approaches to addressing urban soil lead contamination. Appl. Geochem. 2017, 83, 14–30. [Google Scholar] [CrossRef]
- Rice, G.E. Sending the Spirits Home: The Archaeology of Hohokam Mortuary Practices; University of Utah Press: Salt Lake City, UT, USA, 2015. [Google Scholar] [CrossRef]
- Nagendra, H.; Bai, X.; Brondizio, E.S.; Lwasa, S. The urban south and the predicament of global sustainability. Nat. Sustain. 2018, 1, 341–349. [Google Scholar] [CrossRef]
- Danneels, K. Compensation landscapes. Landsc. Res. 2024, 1–12. [Google Scholar] [CrossRef]
- Baganz, G.F.M.; Baganz, D. Compensating for loss of nature and landscape in a growing city—Berlin case study. Land 2023, 12, 567. [Google Scholar] [CrossRef]
- Rundcrantz, K.; Skärbäck, E. Environmental compensation in planning: A review of five different countries with major emphasis on the German system. Eur. Environ. 2003, 13, 204–226. [Google Scholar] [CrossRef]
- Vanmaercke, M.; Poesen, J.; Govers, G.; Verstraeten, G. Quantifying human impacts on catchment sediment yield: A continental approach. Glob. Planet. Chang. 2015, 130, 22–36. [Google Scholar] [CrossRef]
- Borrelli, P.; Robinson, D.A.; Fleischer, L.R.; Lugato, E.; Ballabio, C.; Alewell, C.; Meusburger, K.; Modugno, S.; Schütt, B.; Ferro, V.; et al. An assessment of the global impact of 21st century land use change on soil erosion. Nat. Commun. 2017, 8, 2013. [Google Scholar] [CrossRef]
- Poesen, J. Soil erosion in the Anthropocene: Research needs. Earth Surf. Process. Landf. 2018, 43, 64–84. [Google Scholar] [CrossRef]
- Baker, D.L.; King, K.A. Environmental Contaminant Investigation of Water Quality, Sediment and Biota of the Upper Gila Riever Basin, Arizona; US Fish and Wildfire Service: Washington, DC, USA; Arizona Ecological Services Field Office: Phoenix, AZ, USA, 1994. Available online: https://azmemory.azlibrary.gov/nodes/view/207618 (accessed on 31 July 2025).
- Issaka, S.; Ashraf, M.A. Impact of soil erosion and degradation on water quality: A review. Geol. Ecol. Landsc. 2017, 1, 1–11. [Google Scholar] [CrossRef]
- Liu, G.; Zhang, Y.; Knibbe, W.-J.; Feng, C.; Liu, W.; Medema, G.; van der Meer, W. Potential impacts of changing supply-water quality on drinking water distribution: A review. Water Res. 2017, 116, 135–148. [Google Scholar] [CrossRef] [PubMed]
- Zhuo, X.; Boone, C.G.; Shock, E.L. Soil lead distribution and environmental justice in the phoenix metropolitan region. Environ. Justice 2012, 5, 206–213. [Google Scholar] [CrossRef]
- Rickson, R.J. Can control of soil erosion mitigate water pollution by sediments? Sci. Total. Environ. 2014, 468-469, 1187–1197. [Google Scholar] [CrossRef] [PubMed]
- Elmqvist, T.; Andersson, E.; Frantzeskaki, N.; McPhearson, T.; Olsson, P.; Gaffney, O.; Takeuchi, K.; Folke, C. Sustainability and resilience for transformation in the urban century. Nat. Sustain. 2019, 2, 267–273. [Google Scholar] [CrossRef]
- Carpenter, S.R.; Bennett, E.M. Reconsideration of the planetary boundary for phosphorus. Environ. Res. Lett. 2011, 6, 014009. [Google Scholar] [CrossRef]
- Steffen, W.; Richardson, K.; Rockström, J.; Cornell, S.E.; Fetzer, I.; Bennett, E.M.; Biggs, R.; Carpenter, S.R.; De Vries, W.; De Wit, C.A.; et al. Planetary boundaries: Guiding human development on a changing planet. Science 2015, 347, 1259855. [Google Scholar] [CrossRef]
- Shikangalah, R.N.; Paton, E.N.; Jeltsch, F. An analysis of stakeholders’ perceptions on urban water erosion in Windhoek, Namibia. J. Stud. Humanit. Soc. Sci. 2019, 89, 3–28. [Google Scholar]
- Li, G.; Sun, G.-X.; Ren, Y.; Luo, X.-S.; Zhu, Y.-G. Urban soil and human health: A review. Eur. J. Soil Sci. 2018, 69, 196–215. [Google Scholar] [CrossRef]
- Pribadi, D.O.; Vollmer, D.; Pauleit, S. Impact of peri-urban agriculture on runoff and soil erosion in the rapidly developing metropolitan area of Jakarta, Indonesia. Reg. Environ. Chang. 2018, 18, 2129–2143. [Google Scholar] [CrossRef]
- Scharenbroch, B.; Day, S.; Trammell, T.; Pouyat, R. Urban soil carbon storage. In Urban Soils; CRC Press: Boca Raton, FL, USA, 2017; pp. 137–154. [Google Scholar] [CrossRef]
- Sanderman, J.; Berhe, A.A. The soil carbon erosion paradox. Nat. Clim. Chang. 2017, 7, 317–319. [Google Scholar] [CrossRef]
- Herrmann, D.L.; Schifman, L.A.; Shuster, W.D. Widespread loss of intermediate soil horizons in urban landscapes. Proc. Natl. Acad. Sci. USA 2018, 115, 6751–6755. [Google Scholar] [CrossRef]
- Leyk, S.; Uhl, J.H.; Connor, D.S.; Braswell, A.E.; Mietkiewicz, N.; Balch, J.K.; Gutmann, M. Two centuries of settlement and urban development in the United States. Sci. Adv. 2020, 6, eaba2937. [Google Scholar] [CrossRef] [PubMed]
- Arnhold, S.; Lindner, S.; Lee, B.; Martin, E.; Kettering, J.; Nguyen, T.T.; Koellner, T.; OK, Y.S.; Huwe, B. Conventional and organic farming: Soil erosion and conservation potential for row crop cultivation. Geoderma 2014, 219, 89–105. [Google Scholar] [CrossRef]
- Balamurugan, G. Tin mining and sediment supply in peninsular malaysia with special reference to the Kelang River Basin. Environmentalist 1991, 11, 281–291. [Google Scholar] [CrossRef]
- De Vente, J.; Poesen, J. Predicting soil erosion and sediment yield at the basin scale: Scale issues and semi-quantitative models. Earth-Sci. Rev. 2005, 71, 95–125. [Google Scholar] [CrossRef]
- Fox, R.L. The urbanizing river: A case study in the Maryland Piedmont. In Geomorphology and Engineering; Coates, D.R., Ed.; Dowden, Hutchinson, and Ross, Inc.: Stroudsburg, PA, USA, 1976; pp. 245–271. [Google Scholar]
- Kinoshita, T.; Yamazaki, Y. Increase of sediment transport due to large-scale urbanization. IAHS Publ. 1974, 113, 130–136. [Google Scholar]
- Leh, M.; Bajwa, S.; Chaubey, I. Impact of land use change on erosion risk: An integrated remote sensing, geographic information system and modeling methodology. Land Degrad. Dev. 2013, 24, 409–421. [Google Scholar] [CrossRef]
- Patowary, S.; Sarma, A.K. GIS-Based Estimation of Soil Loss from Hilly Urban Area Incorporating Hill Cut Factor into RUSLE. Water Resour. Manage. 2018, 32, 3535–3547. [Google Scholar] [CrossRef]
- Pope, I.C.; Odhiambo, B.K. Soil erosion and sediment fluxes analysis: A watershed study of the Ni Reservoir, Spotsylvania County, VA, USA. Environ. Monit. Assess. 2014, 186, 1719–1733. [Google Scholar] [CrossRef] [PubMed]
- Portenga, E.W.; Bierman, P.R. Understanding Earth’s eroding surface with 10Be. GSA Today 2011, 21, 4–10. [Google Scholar] [CrossRef]
- Sarma, A.K.; Chandramouli, V.; Singh, B.; Goswami, P.; Rajbongshi, N. Urban flood hazard mitigation of Guwahati city by Silt monitoring and watershed modeling. In Report Submitted to Ministry of Human Resources Department (MHRD); Department of Civil Engineering, IIT: Guwahati, India, 2005. [Google Scholar]
- Wark, J.W.; Keller, F.J. Preliminary study of sediment sources and transport in the Potomac River basin. In Technical Bulletin; Interstate Commission on the Potomac River Basin: Rockville, MD, USA, 1963; 28p. [Google Scholar]
- Yorke, T.H.; Herb, W.J. Effects of Urbanization on Streamflow and Sediment Transport in the Rock Creek and Anacostia River Basins, Montgomery County, Maryland, 1962-74; U.S. Geological Survey: Washington, DC, USA, 1978. [Google Scholar]


| ID | City Name | Mean slope (°) | Std (°) |
|---|---|---|---|
| 1 | West Fork, Arkansas, USA * | 4.5 | 3.6 |
| 2 | Washington D.C., USA * | 3.7 | 3.0 |
| 3 | Phoenix, Arizona, USA * | 4.0 | 3.2 |
| 4 | Fredericksburg, Virginia, USA * | 3.4 | 3.2 |
| 5 | Haean-myeon, South Korea * | 7.1 | 4.5 |
| 6 | Kuala Lumpur, Malaysia * | 4.5 | 5.0 |
| 7 | Tokyo, Japan * | 2.4 | 2.7 |
| 8 | Guwahati, India * | 2.7 | 4.4 |
| 9 | Bogota, Columbia | 2.8 | 3.7 |
| 10 | Rome, Italy | 3.8 | 3.4 |
| 11 | El Alto-La Paz, Bolivia | 5.1 | 6.8 |
| 12 | Nairobi, Kenya | 3.2 | 2.6 |
| 13 | Addis Ababa, Ethiopia | 4.7 | 3.6 |
| 14 | Mexico City, Mexico | 3.5 | 4.4 |
| 15 | Quito, Ecuador | 8.2 | 7.1 |
| 16 | Santiago, Chile | 1.8 | 1.9 |
| 17 | Sana’a, Yemen | 2.0 | 2.0 |
| 18 | Tehran, Iran | 3.3 | 3.1 |
| 19 | Kabul, Afghanistan | 2.7 | 4.9 |
| 20 | Ankara, Turkey | 5.9 | 4.9 |
| 21 | Chongqing, China | 7.8 | 6.7 |
| 22 | Stockholm, Sweden | 4.1 | 4.2 |
| 23 | Zurich, Switzerland | 4.8 | 4.4 |
| 24 | Berlin, Germany | 1.3 | 1.3 |
| 25 | London, UK | 2.2 | 2.3 |
| 26 | Paris, France | 2.5 | 2.6 |
| 27 | Sydney, Australia | 4.0 | 3.8 |
| 28 | Toronto, Canada | 2.3 | 2.4 |
| 29 | Beijing, China | 2.3 | 3.2 |
| 30 | Seoul, South Korea | 6.0 | 6.3 |
| Time Period | LT 1 (yr) | ABG 2 (km2) | AUGR 3 (km2 yr−1) | Background ± 1σ (Mg) | UAE ± 1σ (Mg) | Background ± 1σ (Mg km−2 yr−1) | UAE ± 1σ (Mg km−2 yr−1) | UAEN 4 Mean | (−1σ) | (+1σ) |
|---|---|---|---|---|---|---|---|---|---|---|
| T1: 1912–1934 | 22 | 0.46 | 0.02 | 503 ± 404 | 1219 ± 789 | 49 ± 40 | 119 ± 77 | 2.4 | 2.2 | 4.3 |
| T2: 1934–1955 | 21 | 44.81 | 2.13 | 10,318 ± 51,516 | 459,435 ± 208,082 | 138 ± 55 | 488 ± 221 | 3.5 | 3.2 | 3.7 |
| T3: 1955–1975 | 20 | 266.79 | 13.34 | 468,878 ± 250,184 | 3,925,647 ± 1,916,566 | 88 ± 47 | 736 ± 359 | 8.4 | 8.1 | 9.2 |
| T4: 1975–1985 | 10 | 262.39 | 26.24 | 296,872 ± 131,363 | 4,838,963 ± 2,589,339 | 113 ± 50 | 1844 ± 987 | 16.3 | 13.6 | 17.3 |
| T5: 1985–1990 | 5 | 200.89 | 40.18 | 71,732 ± 45,628 | 1,655,341 ± 878,108 | 71 ± 45 | 1648 ± 874 | 23.1 | 21.6 | 29.8 |
| T6: 1990–1995 | 5 | 186.06 | 37.21 | 98,353 ± 45,885 | 1,156,408 ± 596,934 | 106 ± 49 | 1243 ± 642 | 11.8 | 10.7 | 12.2 |
| T7: 1995–2000 | 5 | 247.13 | 49.43 | 142,376 ± 61,607 | 2,377,551 ± 1,273,757 | 115 ± 50 | 1924 ± 1031 | 16.7 | 13.7 | 17.9 |
| T8: 2000–2005 | 5 | 380.37 | 76.07 | 240,941 ± 99,622 | 4,147,279 ± 2,235,257 | 127 ± 52 | 2181 ± 1175 | 17.2 | 13.5 | 18.7 |
| T9: 2005–2010 | 5 | 281.70 | 56.34 | 211,366 ± 79,733 | 1,779,401 ± 916,481 | 150 ± 57 | 1263 ± 651 | 8.4 | 6.6 | 9.3 |
| T1–T9: 1912–2010 | 98 | 1870.61 | 19.09 | 1,661,338 ± 765,942 | 20,341,242 ± 10,615,315 | 9 ± 4 | 111 ± 58 | 12.2 | 10.9 | 12.8 |
Disclaimer/Publisher’s Note: The statements, opinions and data contained in all publications are solely those of the individual author(s) and contributor(s) and not of MDPI and/or the editor(s). MDPI and/or the editor(s) disclaim responsibility for any injury to people or property resulting from any ideas, methods, instructions or products referred to in the content. |
© 2025 by the authors. Licensee MDPI, Basel, Switzerland. This article is an open access article distributed under the terms and conditions of the Creative Commons Attribution (CC BY) license (https://creativecommons.org/licenses/by/4.0/).
Share and Cite
Jeong, A.; Connor, D.S.; Dorn, R.I.; Seong, Y.B. Estimating Urbanization’s Impact on Soil Erosion: A Global Comparative Analysis and Case Study of Phoenix, USA. Land 2025, 14, 1590. https://doi.org/10.3390/land14081590
Jeong A, Connor DS, Dorn RI, Seong YB. Estimating Urbanization’s Impact on Soil Erosion: A Global Comparative Analysis and Case Study of Phoenix, USA. Land. 2025; 14(8):1590. https://doi.org/10.3390/land14081590
Chicago/Turabian StyleJeong, Ara, Dylan S. Connor, Ronald I. Dorn, and Yeong Bae Seong. 2025. "Estimating Urbanization’s Impact on Soil Erosion: A Global Comparative Analysis and Case Study of Phoenix, USA" Land 14, no. 8: 1590. https://doi.org/10.3390/land14081590
APA StyleJeong, A., Connor, D. S., Dorn, R. I., & Seong, Y. B. (2025). Estimating Urbanization’s Impact on Soil Erosion: A Global Comparative Analysis and Case Study of Phoenix, USA. Land, 14(8), 1590. https://doi.org/10.3390/land14081590