
Integrated Remote Sensing Evaluation of Grassland Degradation Using Multi-Criteria GDCI in Ili Prefecture, Xinjiang, China


Abstract
1. Introduction
- (1)
- How to construct a regionally adapted, multi-dimensional indicator system that reflects both the state and the drivers of degradation;
- (2)
- How to identify and quantify the dominant natural and anthropogenic drivers of grassland degradation;
- (3)
- How to establish appropriate degradation classification thresholds based on multi-source data and spatial variability.
2. Materials
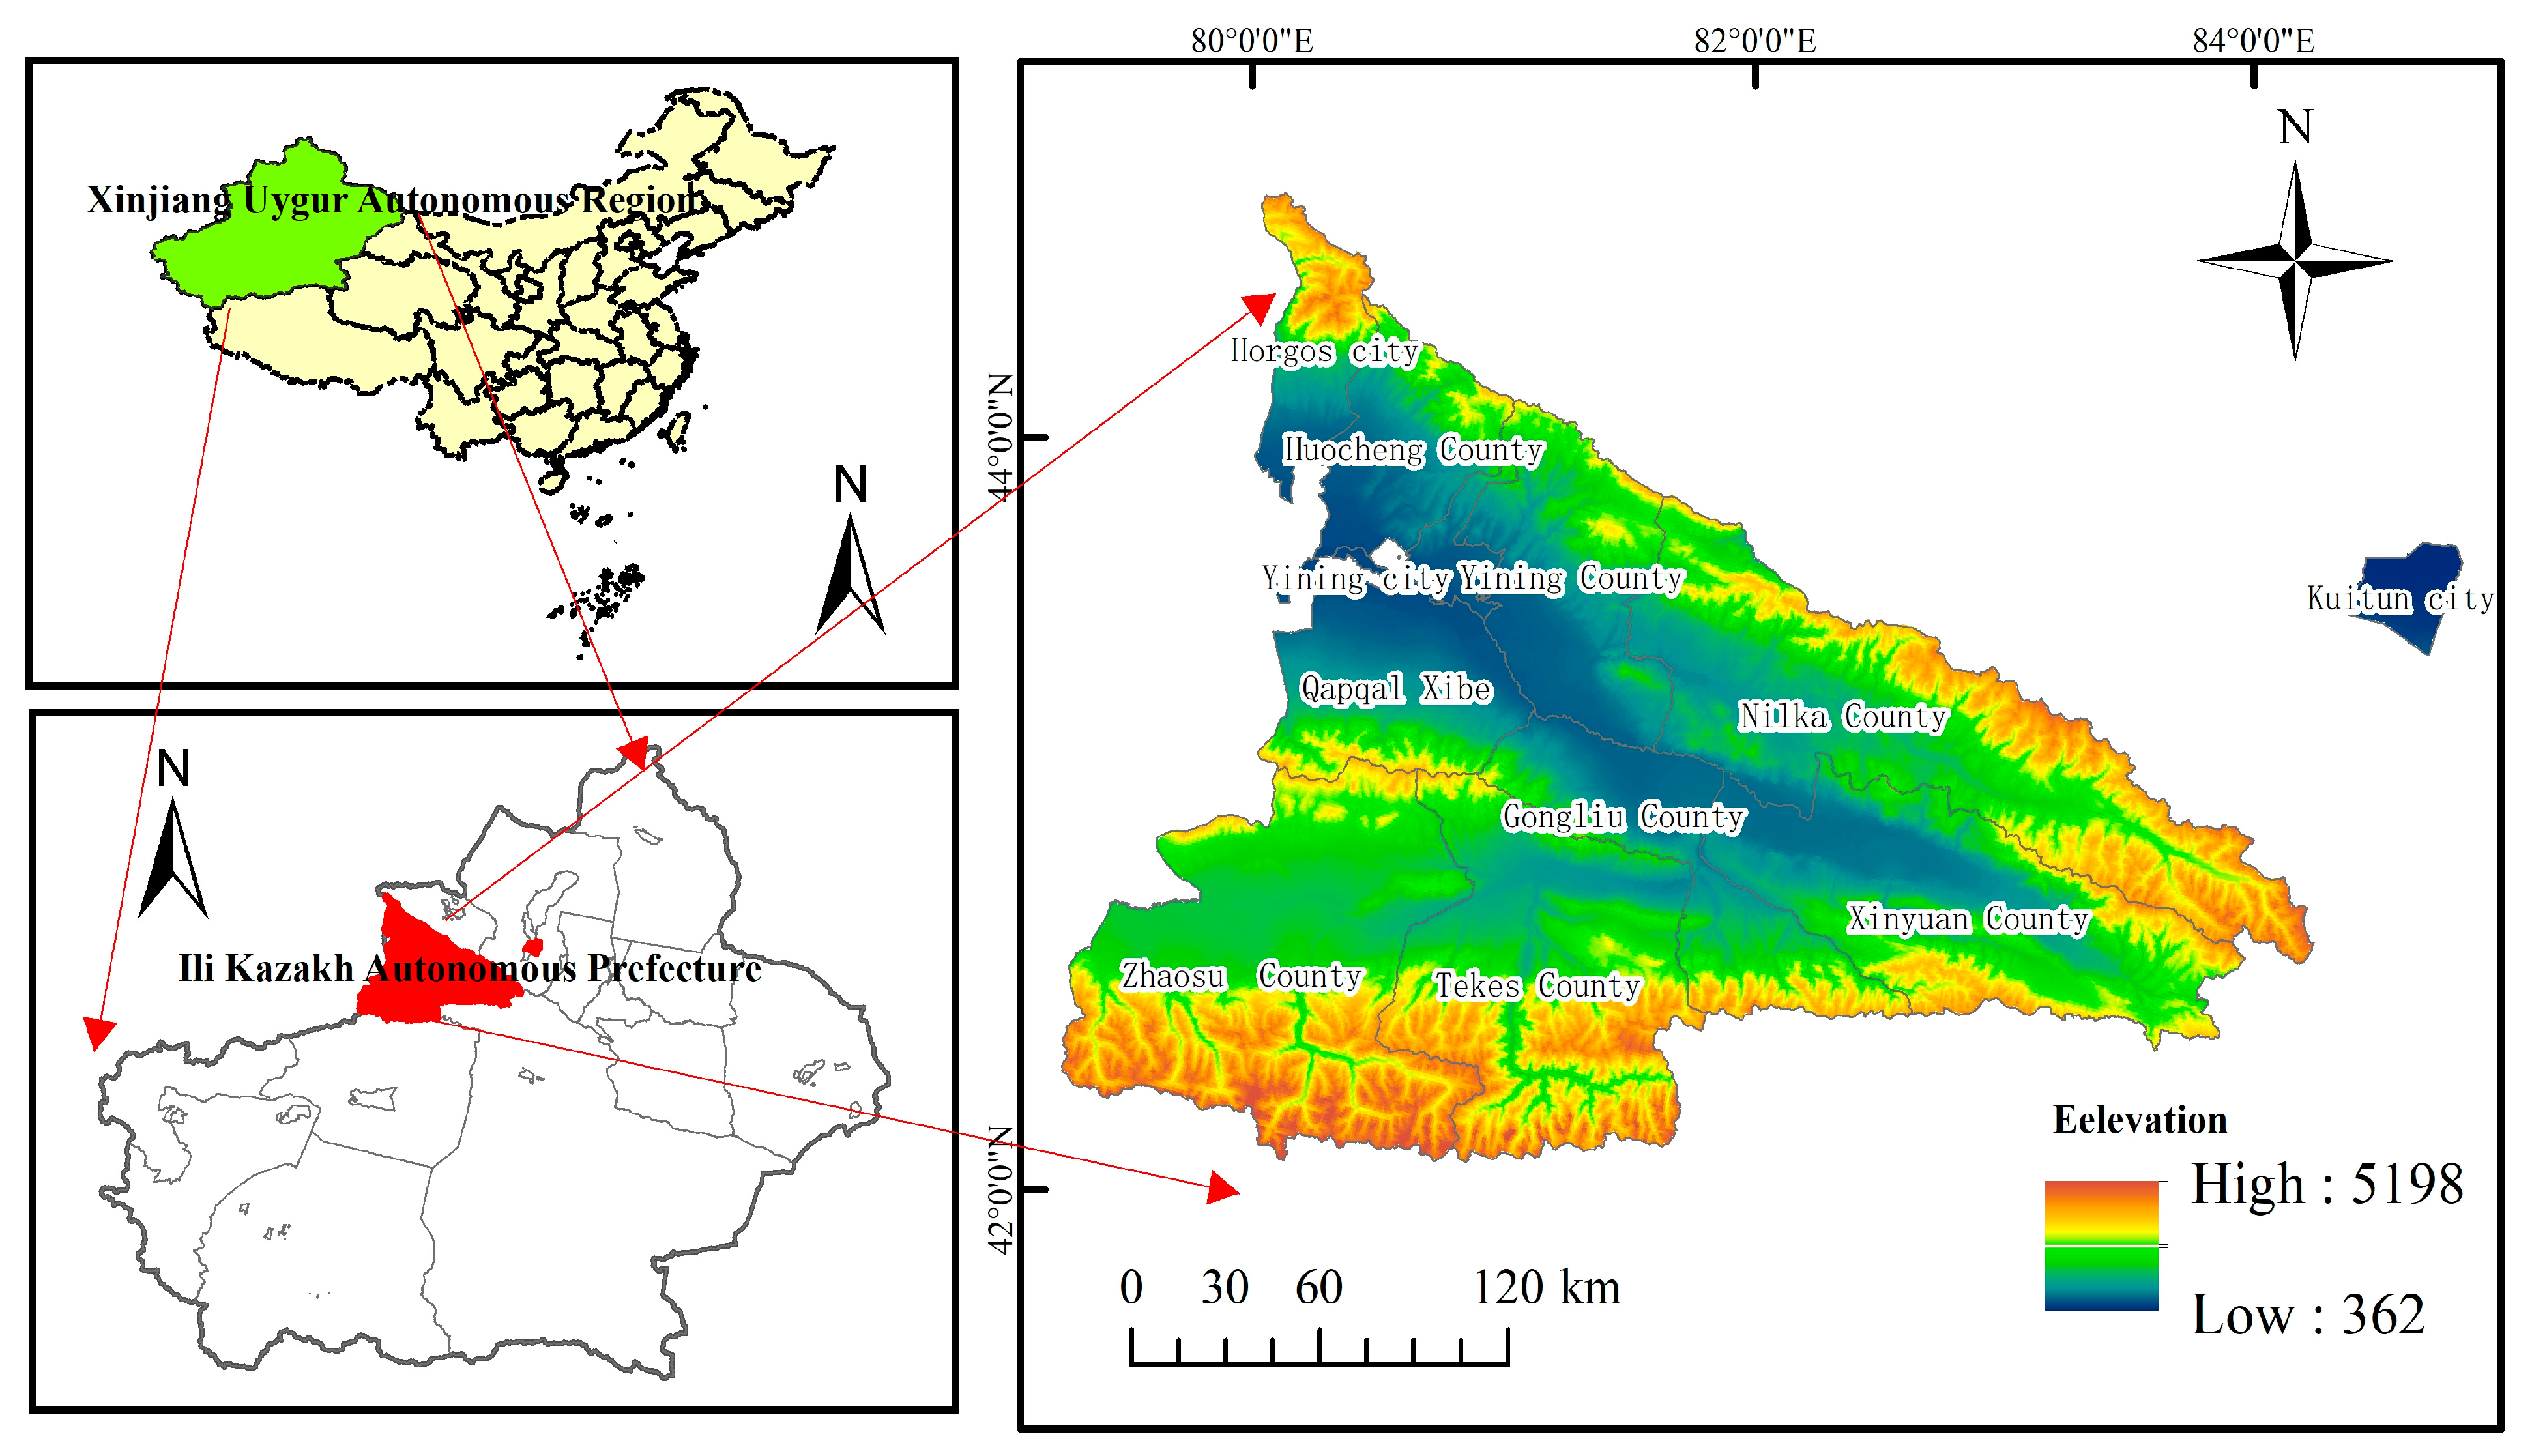
2.1. Study Area
2.2. Data Sources and Procession
3. Methodology
3.1. Indicator System
3.2. Fractional Vegetation Cover
3.3. Soil Erosion Modulus
3.4. Degradation Comprehensive Index Model
3.5. Determination of Grassland Degradation Grade Thresholds
4. Results
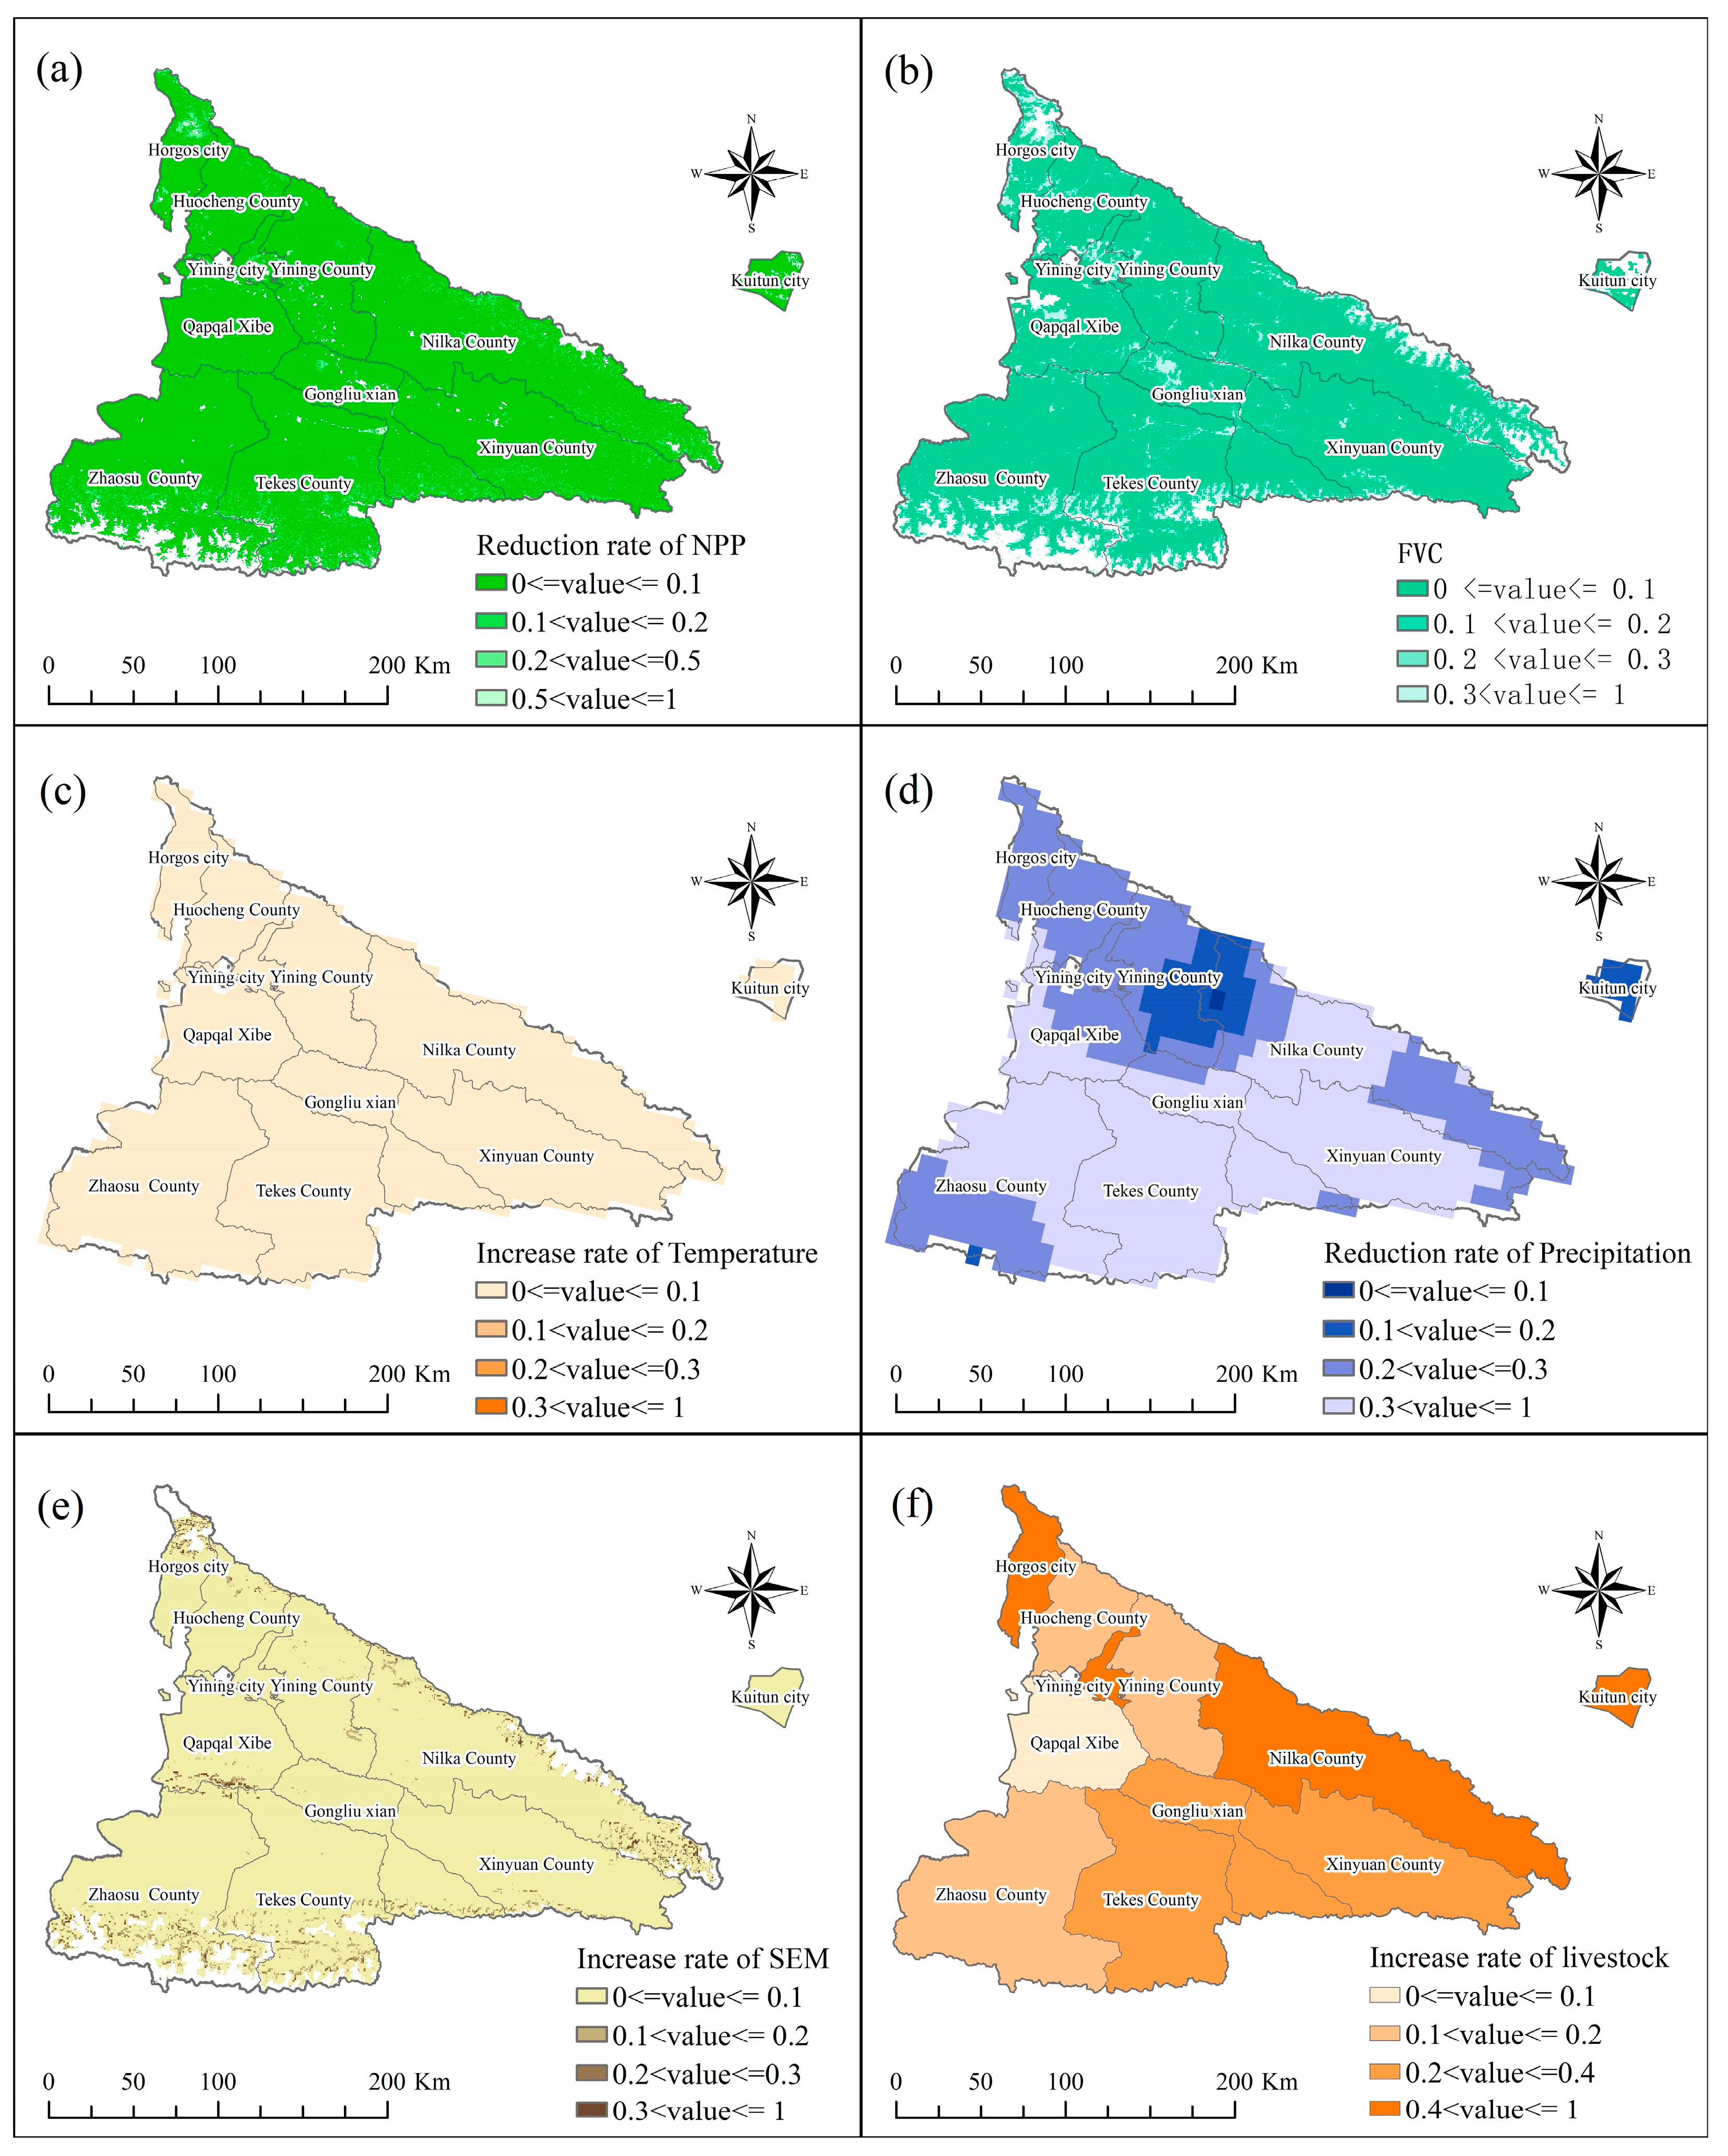
4.1. Spatial Distribution of Grassland Status, Environmental Conditions and Utilization Intensity
4.2. Grassland Degradation Assessment Results and Accuracy Evaluation
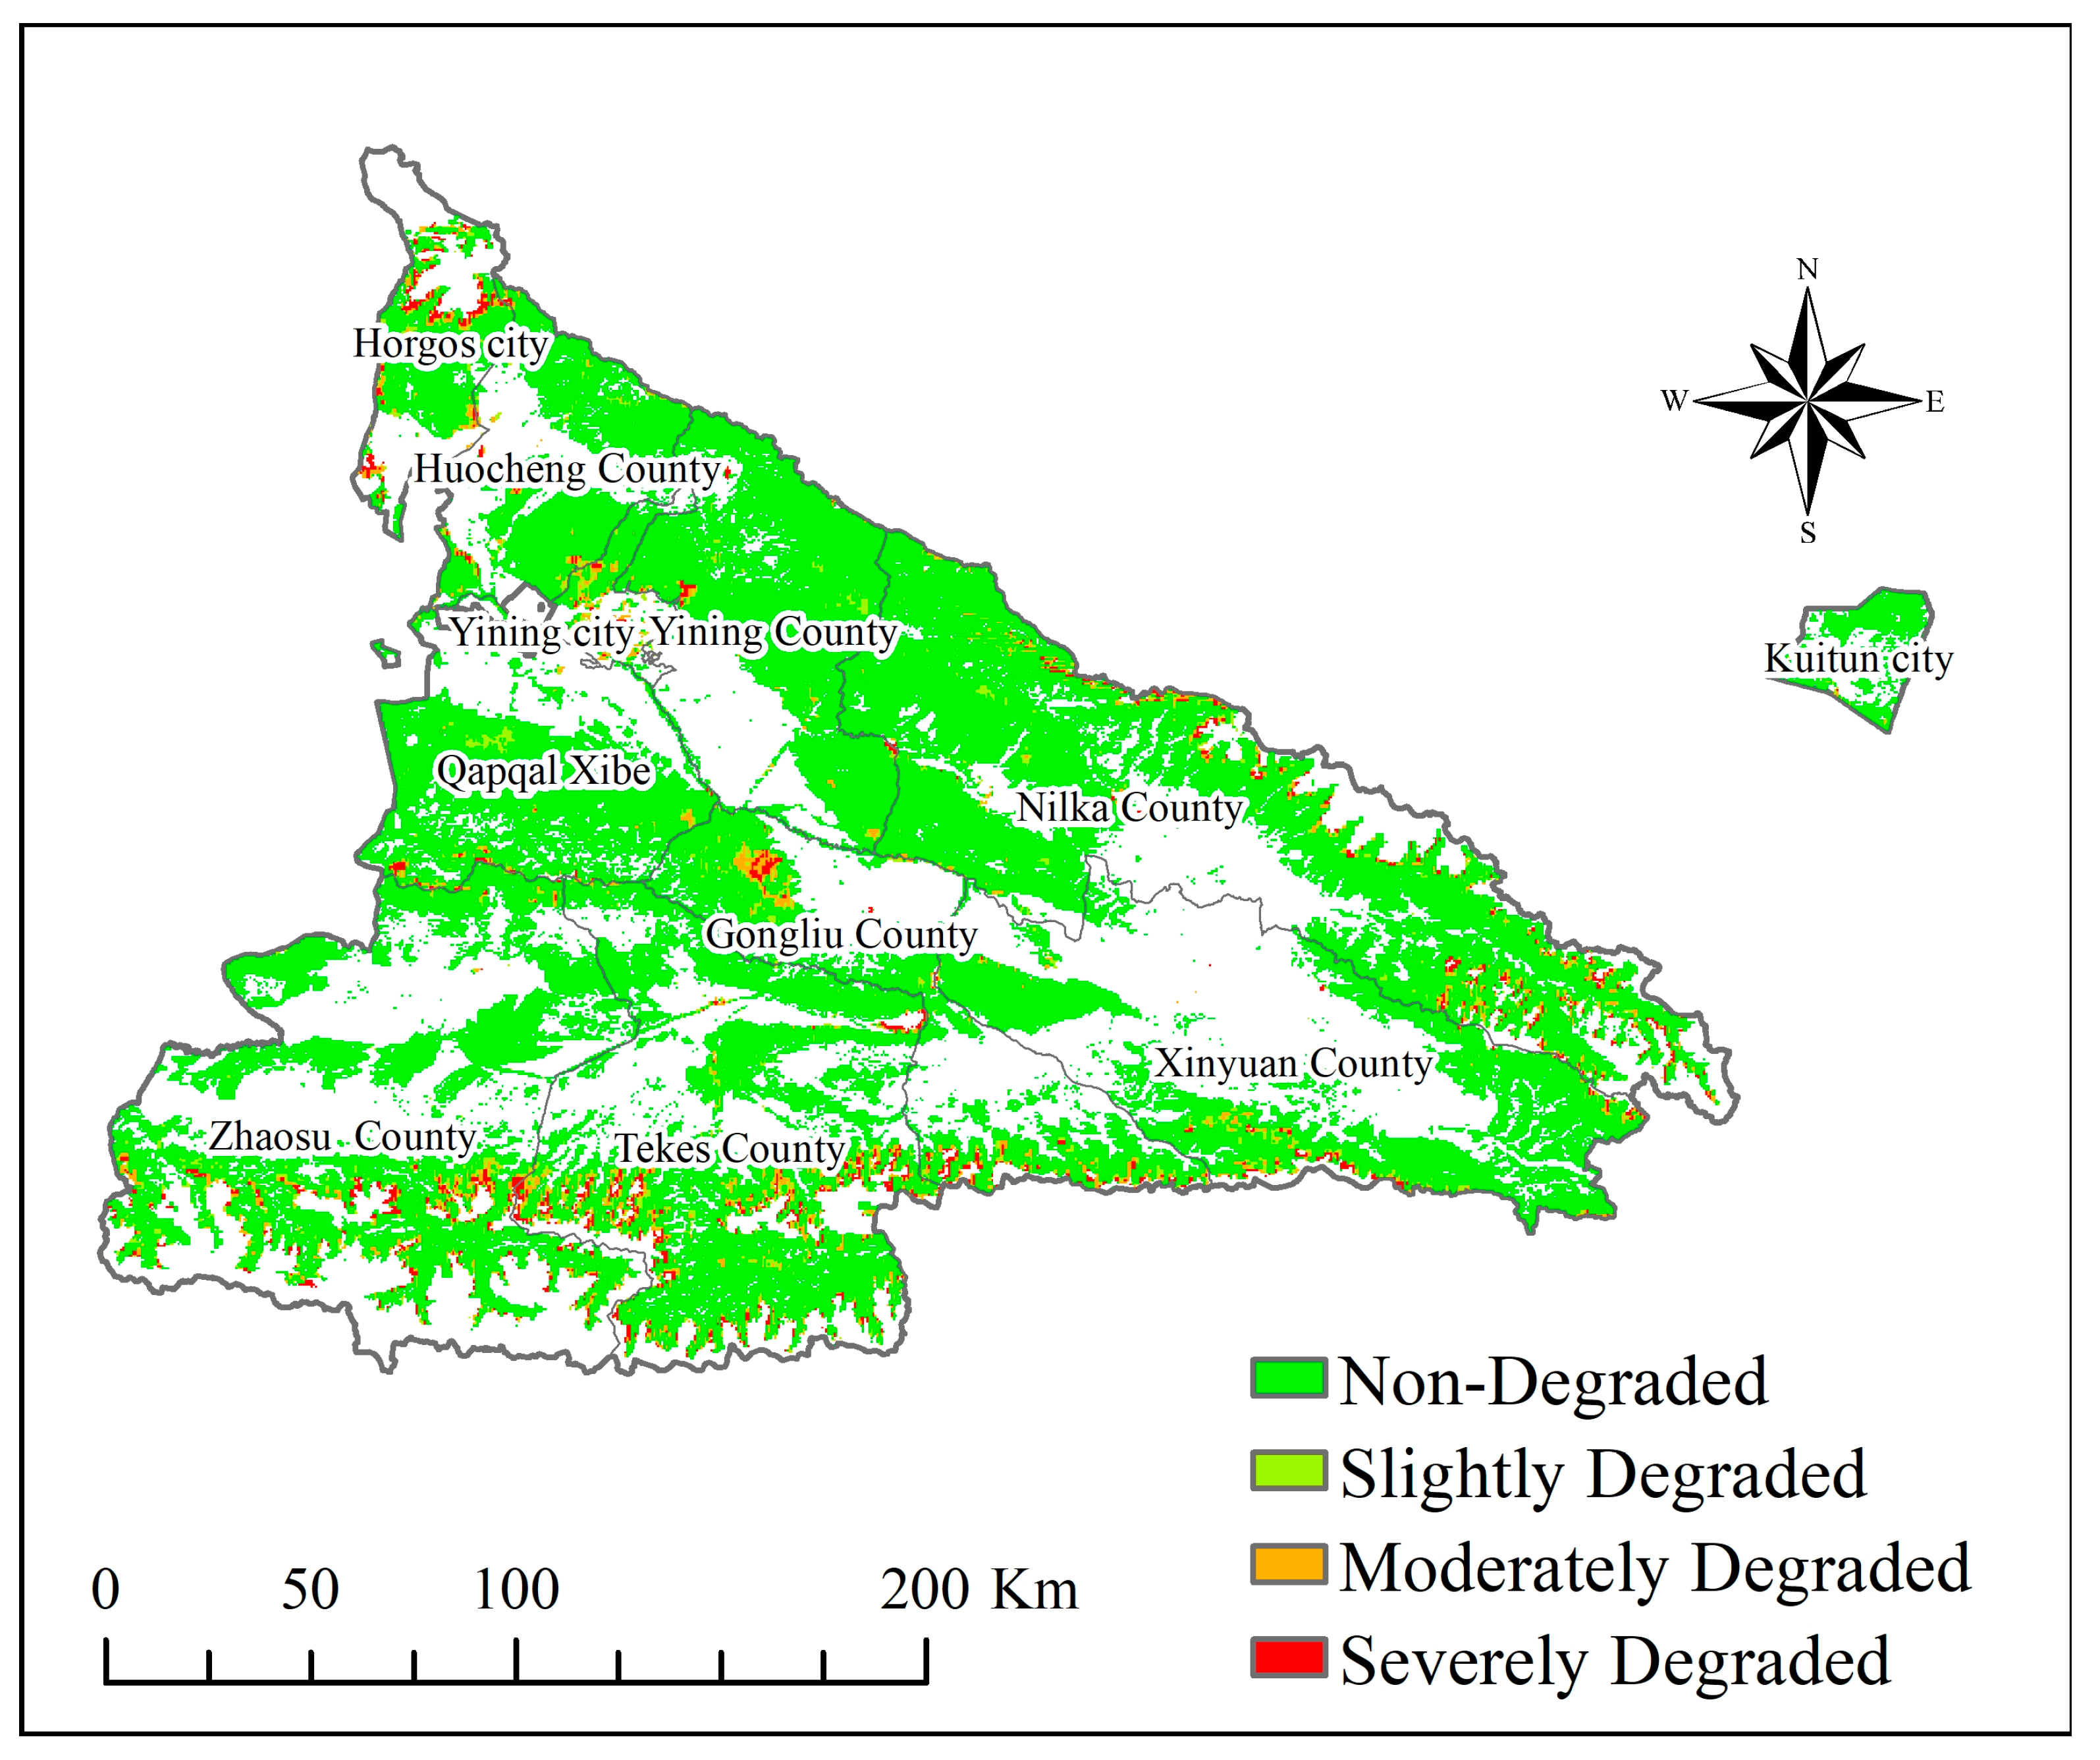
4.3. Spatial Distribution of Grassland Degradation
5. Discussion
6. Conclusions
Author Contributions
Funding
Data Availability Statement
Conflicts of Interest
References
- Jiang, K.; Zhang, Q.; Wang, Y.; Li, H.; Yang, Y.; Reyimu, T. Effects of grazing on the grassland ecosystem multifunctionality of montane meadow on the northern slope of the tianshan mountains, China. Environ. Earth Sci. 2024, 83, 70. [Google Scholar] [CrossRef]
- Lu, X. Degraded grassland vegetation and soil characteristics: Challenges, opportunities, and sustainable development. Adv. Resour. Res. 2024, 4, 205–220. [Google Scholar]
- Li, Y.; Yang, J.; Xia, H.; Wu, J. Spatiotemporal variations of vegetation in the Ili River basin from 2000 to 2022. Arid Land Geogr. 2024, 47, 741–752. [Google Scholar]
- Liu, X.; Liu, W.; Zhang, W.; Hu, G. Effects of supplementary irrigation with harvested rainwater on growth and leaf water use efficiency of Glycyrrhiza uralensis seedling. Water 2024, 16, 2989. [Google Scholar] [CrossRef]
- Jiang, A.; Dong, Y.; Asitaiken, J.; Zhou, S.; Nie, T.; Wu, Y.; Liu, Z.; An, S.; Yang, K. Response of soil fungal communities and their co-occurrence patterns to grazing exclusion in different grassland types. Front. Microbiol. 2024, 15, 1404633. [Google Scholar] [CrossRef]
- Zhu, S.; Chen, X.; Zhang, C.; Fang, X.; Cao, L. Carbon variation of dry grasslands in central Asia in response to climate controls and grazing appropriation. Environ. Sci. Pollut. Res. 2022, 29, 32205–32219. [Google Scholar] [CrossRef]
- Fang, Y.; Zhao, X.; Liu, N.; Zhang, W.; Shi, W. Analyzing spatiotemporal variations and driving factors of grassland in the arid region of northwest China surrounding the tianshan mountains. Remote Sens. 2024, 16, 1952. [Google Scholar] [CrossRef]
- Lu, Y.; Zhao, J.; Qi, J.; Rong, T.; Wang, Z.; Yang, Z.; Han, F. Monitoring the spatiotemporal dynamics of habitat quality and its driving factors based on the coupled Ndvi-invest model: A case study from the Tianshan mountains in Xinjiang, China. Land 2022, 11, 1805. [Google Scholar] [CrossRef]
- Ren, H.; Liu, Y.; Wen, Z.; Shi, H.; Zhou, R.; Wang, Z.; Kareem, H.A.; Zhang, W. Untangling the effects of climate variation and human interference on grassland dynamics in north China. Land Degrad. Dev. 2024, 35, 467–483. [Google Scholar] [CrossRef]
- Wang, G.; Li, Y.; Fan, L.; Ma, X.; Liang, Y.; Hui, T.; Zhang, W.; Li, W.; Mao, J. Assessment of grassland carrying capacity drivers and evaluation of pasture-livestock balance: A case study of Xinjiang, China. Glob. Ecol. Conserv. 2024, 55, e03203. [Google Scholar] [CrossRef]
- Xu, Y.; Xiao, F.; Liao, Y. Assessment of grassland ecosystem service value in response to climate change in China. Diversity 2022, 14, 160. [Google Scholar] [CrossRef]
- Zhang, N.; Li, Z.; Feng, Y.; Li, X.; Tang, J. Development and application of a vegetation degradation classification approach for the temperate grasslands of northern China. Ecol. Indic. 2023, 154, 110857. [Google Scholar] [CrossRef]
- Gcayi, S.R.; Adelabu, S.A.; Nduku, L.; Chirima, J.G. A bibliometric analysis for remote sensing applications in bush encroachment mapping of grassland and savanna ecosystems. Appl. Geomat. 2024, 16, 881–896. [Google Scholar] [CrossRef]
- Hua, R.; Ye, G.; De Giuli, M.; Zhou, R.; Bao, D.; Hua, L.; Niu, Y. Decreased species richness along bare patch gradient in the degradation of Kobresia pasture on the Tibetan plateau. Ecol. Indic. 2023, 157, 111195. [Google Scholar] [CrossRef]
- Wiethase, J.H.; Critchlow, R.; Foley, C.; Foley, L.; Kinsey, E.J.; Bergman, B.G.; Osujaki, B.; Mbwambo, Z.; Kirway, P.B.; Redeker, K.R.; et al. Pathways of degradation in rangelands in northern tanzania show their loss of resistance, but potential for recovery. Sci. Rep. 2023, 13, 2417. [Google Scholar] [CrossRef]
- Ayvazyan, G.; Muradyan, V.; Medvedev, A.; Khlghatyan, A.; Asmaryan, S. Exploring multisource remote sensing for assessing and monitoring the ecological state of the mountainous natural grasslands in Armenia. Appl. Sci. 2024, 14, 10205. [Google Scholar] [CrossRef]
- Gao, S.-h.; Yan, Y.-z.; Yuan, Y.; Ning, Z.; Le, M.; Qing, Z. Comprehensive degradation index for monitoring desert grassland using Uav multispectral imagery. Ecol. Indic. 2024, 165, 112194. [Google Scholar] [CrossRef]
- Li, M.; Wang, J.; Li, K.; Liu, Y.; Ochir, A.; Davaasuren, D. Assessment of grazing livestock balance on the eastern Mongolian plateau based on remote sensing monitoring and grassland carrying capacity evaluation. Sci. Rep. 2024, 14, 32151. [Google Scholar] [CrossRef] [PubMed]
- Zhang, T.; Bi, Y.; Xuan, C. Convolutional transformer attention network with few-shot learning for grassland degradation monitoring using Uav hyperspectral imagery. Int. J. Remote Sens. 2024, 45, 2109–2135. [Google Scholar] [CrossRef]
- Afzali, A.; Hadian, F.; Sabri, S.; Yaghmaei, L. Investigating net primary production in climate regions of Khuzestan province, Iran using casa model. Int. J. Biometeorol. 2024, 68, 1357–1370. [Google Scholar] [CrossRef]
- Barreirinha, A.M.L. Monitoring of Vegetation Productivity in Areas of Higher Susceptibility to Severe Fires in Mainland Portugal. Master’s Thesis, Universidade de Aveiro, Aveiro, Portugal, 2022. [Google Scholar]
- Li, Z.; Shen, Q.; Fan, W.; Dong, S.; Wang, Z.; Xu, Y.; Ma, T.; Cao, Y. Nature-based solutions vs. Human-induced approaches for alpine grassland ecosystem: "Climate-help" overwhelms "human act" to promote ecological restoration in the three-river-source region of Qinghai-Tibet plateau. Remote Sens. 2024, 16, 1156. [Google Scholar] [CrossRef]
- Wang, Z.; Ma, Y.; Zhang, Y.; Shang, J. Review of remote sensing applications in grassland monitoring. Remote Sens. 2022, 14, 2903. [Google Scholar] [CrossRef]
- Zhao, L.; Jia, K.; Liu, X.; Li, J.; Xia, M. Assessment of land degradation in inner mongolia between 2000 and 2020 based on remote sensing data. Geogr. Sustain. 2023, 4, 100–111. [Google Scholar] [CrossRef]
- Niu, W.; Ding, J.; Fu, B.; Zhao, W.; Eldridge, D. Global effects of livestock grazing on ecosystem functions vary with grazing management and environment. Agric. Ecosyst. Environ. 2025, 378, 109296. [Google Scholar] [CrossRef]
- Bai, Y.; Wu, J.; Clark, C.M.; Naeem, S.; Pan, Q.; Huang, J.; Zhang, L.; Han, X. Tradeoffs and thresholds in the effects of nitrogen addition on biodiversity and ecosystem functioning: Evidence from inner Mongolia grasslands. Glob. Change Biol. 2010, 16, 358–372. [Google Scholar] [CrossRef]
- Li, T.; Cui, L.; Scotton, M.; Dong, J.; Xu, Z.; Che, R.; Tang, L.; Cai, S.; Wu, W.; Andreatta, D.; et al. Characteristics and trends of grassland degradation research. J. Soils Sediments 2022, 22, 1901–1912. [Google Scholar] [CrossRef]
- Evstatiev, B.; Valova, I.; Kaneva, T.; Valov, N.; Sevov, A.; Stanchev, G.; Komitov, G.; Zhelyazkova, T.; Gerdzhikova, M.; Todorova, M. Identification of pasture degradation using remote sensing data and machine learning: A case study of Obichnik. Appl. Sci. 2024, 14, 7599. [Google Scholar] [CrossRef]
- Song, X.; Mi, N.; Mi, W.; Li, L. Spatial non-stationary characteristics between grass yield and its influencing factors in the Ningxia temperate grasslands based on a mixed geographically weighted regression model. J. Geogr. Sci. 2022, 32, 1076–1102. [Google Scholar] [CrossRef]
- Rukhovich, D.I.; Koroleva, P.V.; Rukhovich, D.D.; Kalinina, N.V. The use of deep machine learning for the automated selection of remote sensing data for the determination of areas of arable land degradation processes distribution. Remote Sens. 2021, 13, 155. [Google Scholar] [CrossRef]
- Liu, L.; Guan, J.; Han, W.; Ju, X.; Mu, C.; Zheng, J. Quantitative assessment of the relative contributions of climate and human factors to net primary productivity in the Ili River basin of China and Kazakhstan. Chin. Geogr. Sci. 2022, 32, 1069–1082. [Google Scholar] [CrossRef]
- Min, Y.; Huang, W.; Ma, M.; Zhang, Y. Simulations in the topography effects of Tianshan mountains on an extreme precipitation event in the Ili River valley, China. Atmosphere 2021, 12, 750. [Google Scholar] [CrossRef]
- Jiang, Z.; Yang, M.; Yang, L.; Su, W.; Liu, Z. Spatial–temporal evolution characteristics and driving mechanism analysis of the “three-zone space” in China’s Ili River basin. Land 2024, 13, 1530. [Google Scholar] [CrossRef]
- Su, C.; Cheng, Z.; Zhang, P.; Chen, Z.; Jiang, X.; Li, Y. Characterizing Groundwater Flow Pattern and Groundwater/Surface Water Interaction Using Isotopic Tracers in the Ili Valley, Arid Central Asia. Available online: https://ssrn.com/abstract=4747911 (accessed on 20 November 2024).
- Hang, S.; Abbas, A.; Imin, B.; Kasim, N.; Zunun, Z. Trends and spatiotemporal patterns of the meteorological drought in the Ili river valley from 1961 to 2023: An spei-based study. Atmosphere 2025, 16, 43. [Google Scholar] [CrossRef]
- Pan, R.; Yan, J.; Xia, Q.; Jin, X. Enhancing ecological security in Ili River valley: Comprehensive approach. Water 2024, 16, 1867. [Google Scholar] [CrossRef]
- Yang, Y.; Chen, Y.; Li, W.; Chen, Y. Distribution of soil organic carbon under different vegetation zones in the Ili River valley, Xinjiang. J. Geogr. Sci. 2010, 20, 729–740. [Google Scholar] [CrossRef]
- Liu, Y.; Liu, R.; Qi, L.; Chen, J.; Dong, J.; Wei, X. Global mapping of fractional tree cover for forest cover change analysis. ISPRS J. Photogramm. Remote Sens. 2024, 211, 67–82. [Google Scholar] [CrossRef]
- Román, M.; Justice, C.; Devadiga, S. Achieving Dynamic Continuity Between Modis Collection 6.1, Viirs Collection 2, and Sentinel 3a/b Land Science Products; Copernicus Meetings: Brussels, Belgium, 2024. [Google Scholar]
- Wang, C.; Jiao, Z.; Feng, Y.; Guo, J.; Li, Z.; Gao, G.; Tan, Z.; Yang, F.; Chen, S.; Dong, X. Evaluation of modis and viirs brdf parameter differences and their impacts on the derived indices. Remote Sens. 2025, 17, 1803. [Google Scholar] [CrossRef]
- Pandey, V.; Harde, S.; Rajasekaran, E.; Deb Burman, P.K. Gross primary productivity of terrestrial ecosystems: A review of observations, remote sensing, and modelling studies over south Asia. Theor. Appl. Climatol. 2024, 155, 8461–8491. [Google Scholar] [CrossRef]
- Wang, P.; Xue, Y.; Yan, Z.; Yin, W.; He, B.; Li, P. Study of regional spatial and temporal changes of net ecosystem productivity of crops from remotely sensed data. Land 2024, 13, 155. [Google Scholar] [CrossRef]
- Keune, J.; Di Giuseppe, F.; Barnard, C.; Damasio da Costa, E.; Wetterhall, F. Era5–drought: Global drought indices based on ecmwf reanalysis. Sci. Data 2025, 12, 616. [Google Scholar] [CrossRef]
- Lopes, F.M.; Dutra, E.; Boussetta, S. Evaluation of daily temperature extremes in the ecmwf operational weather forecasts and era5 reanalysis. Atmosphere 2024, 15, 93. [Google Scholar] [CrossRef]
- Moulik, A.; Majhi, T. Chapter-4 comparative analysis of Digital Elevation Models (DEM). Innov. Chall. Mod. Agric. 2024, 37–46. [Google Scholar]
- Raufu, I.O. Evaluation of different digital elevation models (dems) for geospatial applications: A case study of Ibadan, Nigeria. Afr. J. Land Policy Geospat. Sci. 2024, 7, 1137–1154. [Google Scholar]
- Kiribou, I.A.R.; Nikiema, T.; Dimobe, K.; Zoungrana, B.J.-B.; Ouedraogo, V.; Yang, H.; Santika, T.; Dejene, S.W. Climate change and variability as drivers of vegetation dynamics in Bontioli Natural Reserve, west African drylands. Environ. Chall. 2025, 20, 101175. [Google Scholar] [CrossRef]
- Song, D.; Hu, Z.; Zeng, J.; Sun, H. Influence of mining on vegetation in semi-arid areas of western China based on the coupling of above ground and below ground—A case study of Daliuta Coalfield. Ecol. Indic. 2024, 161, 111964. [Google Scholar] [CrossRef]
- Naqvi, S.A.A.; Tariq, A.; Shahzad, M.; Khalid, S.; Tariq, Z.; Salma, U.; Haseeb, M.; Soufan, W. Predicting soil erosion risk using the revised universal soil loss equation (rusle) model and geo-spatial methods. Hydrol. Process. 2024, 38, e15248. [Google Scholar] [CrossRef]
- Jaman, M.H.; Roy, S.; Chatterjee, J.; Das, S.; Sengupta, S. Modelling soil erosion risk in the Kumari River basin, India: A revised universal soil loss equation (RUSLE)-based empirical approach. J. Indian Geomorphol. 2024, 12, 17719–17740. [Google Scholar]
- Zhang, W.; Xie, Y.; Liu, Y. Rainfall erosivity estimation using daily rainfall amounts. Sci. Geogr. Sin. 2002, 22, 705–711. [Google Scholar]
- Williams, J.; Nearing, M.; Nicks, A.; Skidmore, E.; Valentin, C.; King, K.; Savabi, R. Using soil erosion models for global change studies. J. Soil Water Conserv. 1996, 51, 381–385. [Google Scholar] [CrossRef]
- Cai, C.; Shuwen, D.; Zhihua, S.; Li, H.; Guangyuan, Z. Study of applying Usle and geographical information system idrisi to predict soil erosion in small watershed. J. Soil Water Conserv. 2000, 14, 19–24. [Google Scholar]
- GB 19377-2003; Parameters for Degradation, Sandification and Salification of Rangelands. Standards Press of China: Beijing, China, 2004.
- Bardgett, R.D.; Bullock, J.M.; Lavorel, S.; Manning, P.; Schaffner, U.; Ostle, N.; Chomel, M.; Durigan, G.; L Fry, E.; Johnson, D. Combatting global grassland degradation. Nat. Rev. Earth Environ. 2021, 2, 720–735. [Google Scholar] [CrossRef]
- Dong, S.; Shang, Z.; Gao, J.; Boone, R.B. Enhancing sustainability of grassland ecosystems through ecological restoration and grazing management in an era of climate change on Qinghai-Tibetan Plateau. Agric. Ecosyst. Environ. 2020, 287, 106684. [Google Scholar] [CrossRef]
- Shipley, J.R.; Frei, E.R.; Bergamini, A.; Boch, S.; Schulz, T.; Ginzler, C.; Barandun, M.; Bebi, P.; Bolliger, J.; Bollmann, K. Agricultural practices and biodiversity: Conservation policies for semi-natural grasslands in Europe. Curr. Biol. 2024, 34, R753–R761. [Google Scholar] [CrossRef]
- Chen, P.; Wang, S.; Liu, Y.; Wang, Y.; Song, J.; Tang, Q.; Yao, Y.; Wang, Y.; Wu, X.; Wei, F. Spatio-temporal dynamics of aboveground biomass in China’s oasis grasslands between 1989 and 2021. Earth’s Future 2024, 12, e2023EF003944. [Google Scholar] [CrossRef]
- Ma, Z.; Gao, J.; Liang, T.; He, Z.; Feng, S.; Zhang, X.; Zhang, D. Comprehensive ecological risk changes and their relationship with ecosystem services of alpine grassland in Gannan prefecture from 2000–2020. Remote Sens. 2024, 16, 2242. [Google Scholar] [CrossRef]
- Ma, L.; Zheng, J.; Pen, J.; Xiao, X.; Liu, Y.; Liu, L.; Han, W.; Li, G.; Zhang, J. Monitoring and influencing factors of grassland livestock overload in Xinjiang from 1982 to 2020. Front. Plant Sci. 2024, 15, 1340566. [Google Scholar] [CrossRef] [PubMed]

| Criterion Level | Sub-Criterion Level | Indicator Level | Data Sources |
|---|---|---|---|
| Vegetation Characteristics | Community Scale | Net Primary Productivity (NPP) | MOD17A3H |
| Fractional vegetation cover (FVC) | MOD09Q1 and MOD09A1 | ||
| Environmental Characteristics | Climatic Conditions | Annual Mean Temperature | ERA5 global climate reanalysis dataset |
| Total Precipitation | ERA5 global climate reanalysis dataset | ||
| Soil Conditions | Soil Erosion Modulus (SEM) | SMCD12Q, MOD09Q1, MOD09A1, SRTM DEM, ERA5 global climate reanalysis dataset and so on | |
| Utilization Characteristics | Grazing Conditions | Livestock Quantities | Xinjiang Statistical Yearbook |
| Primary Indicator | Secondary Indicator | Non-Degraded | Slightly Degraded | Moderately Degraded | Severely Degraded |
|---|---|---|---|---|---|
| Vegetation Characteristics | Reduction rate of relative percentage of Net Primary Productivity (NPP) (%) | 0–10 | 11–20 | 21–50 | >50 |
| Reduction rate of relative percentage of fractional vegetation cover (FVC) (%) | 0–10 | 11–20 | 21–30 | >30 | |
| Environmental Characteristics | Increase rate of relative percentage of annual average temperature (%) | 0–10 | 11–20 | 21–30 | >30 |
| Reduction rate of relative percentage of total precipitation (%) | 0–10 | 11–20 | 21–30 | >30 | |
| Increase rate of soil erosion modulus (SEM) (%) | 0–10 | 11–20 | 21–30 | >30 | |
| Utilization Characteristics | Increase rate of relative percentage of livestock quantities (%) | 0–10 | 11–20 | 21–40 | >40 |
| Grassland Degradation Level | GDCI Change Rate (X) |
|---|---|
| Severely Degraded | >37.66% |
| Moderately Degraded | 20% < X ≤ 37.66% |
| Slightly Degraded | 10% < X ≤ 20% |
| Non-Degraded | ≤10% |
| Grassland Degradation Level | Number of Validation Points | Correct Classifications | Accuracy |
|---|---|---|---|
| Severely Degraded | 13 | 9 | 69.23% |
| Moderately Degraded | 11 | 7 | 63.64% |
| Slightly Degraded | 25 | 19 | 76.00% |
| Non-Degraded | 62 | 44 | 70.97% |
| Overall | 111 | 79 | 71.17% |
Disclaimer/Publisher’s Note: The statements, opinions and data contained in all publications are solely those of the individual author(s) and contributor(s) and not of MDPI and/or the editor(s). MDPI and/or the editor(s) disclaim responsibility for any injury to people or property resulting from any ideas, methods, instructions or products referred to in the content. |
© 2025 by the authors. Licensee MDPI, Basel, Switzerland. This article is an open access article distributed under the terms and conditions of the Creative Commons Attribution (CC BY) license (https://creativecommons.org/licenses/by/4.0/).
Share and Cite
Xing, L.; Jin, D.; Shen, C.; Zhu, M.; Wu, J. Integrated Remote Sensing Evaluation of Grassland Degradation Using Multi-Criteria GDCI in Ili Prefecture, Xinjiang, China. Land 2025, 14, 1592. https://doi.org/10.3390/land14081592
Xing L, Jin D, Shen C, Zhu M, Wu J. Integrated Remote Sensing Evaluation of Grassland Degradation Using Multi-Criteria GDCI in Ili Prefecture, Xinjiang, China. Land. 2025; 14(8):1592. https://doi.org/10.3390/land14081592
Chicago/Turabian StyleXing, Liwei, Dongyan Jin, Chen Shen, Mengshuai Zhu, and Jianzhai Wu. 2025. "Integrated Remote Sensing Evaluation of Grassland Degradation Using Multi-Criteria GDCI in Ili Prefecture, Xinjiang, China" Land 14, no. 8: 1592. https://doi.org/10.3390/land14081592
APA StyleXing, L., Jin, D., Shen, C., Zhu, M., & Wu, J. (2025). Integrated Remote Sensing Evaluation of Grassland Degradation Using Multi-Criteria GDCI in Ili Prefecture, Xinjiang, China. Land, 14(8), 1592. https://doi.org/10.3390/land14081592