Article

Soil Sealing, Land Take, and Demographics: A Case Study of Estonia, Latvia, and Lithuania

1
Institute of Forestry and Engineering, Estonian University of Life Sciences, 51006 Tartu, Estonia
2
Faculty of Engineering Economics and Management, Riga Technical University, 1048 Riga, Latvia
*
Author to whom correspondence should be addressed.
Land 2025, 14(8), 1586; https://doi.org/10.3390/land14081586
Submission received: 19 June 2025 / Revised: 29 July 2025 / Accepted: 1 August 2025 / Published: 3 August 2025
(This article belongs to the Special Issue Efficient Land Use and Sustainable Development in European Countries)

Abstract

Soil sealing and land take are increasingly recognised as critical environmental and land use planning challenges across Europe. Although these issues have received limited attention in Baltic policymaking and the academic literature to date, available data indicate ongoing land consumption despite population decline. This study aims to analyse soil sealing patterns in Estonia, Latvia, and Lithuania between 2018 and 2021 using CLC+ Backbone data, linking them to demographic shifts and local planning frameworks. Results reveal that soil sealing increased in nearly all municipalities across the Baltic states, regardless of population trends. The analysis highlights that shrinking municipalities, constrained by limited resources and declining populations, are structurally disadvantaged in terms of land use efficiency, particularly when measured by sealed area per capita. Moreover, this study discusses emerging policy tensions, including the narrowing conceptual gap between land take and soil sealing in the proposed EU Soil Monitoring and Resilience Directive, as well as the risk of overlooking broader land artificialisation. The findings underscore the need for context-sensitive, multi-scalar approaches to land use monitoring and governance, particularly in sparsely populated and demographically imbalanced regions, such as the Baltic states.

1. Introduction

Soil sealing and land take have emerged as pressing environmental and land use planning issues across Europe in recent years [1,2,3,4,5,6,7,8]. The Roadmap to a Resource Efficient Europe [9] set forth the non-binding objective of achieving “no net land take by 2050” (NNLT) over a decade ago. However, despite this ambition, built-up areas continue to expand at a rate that outpaces population growth throughout Europe [10]. In the Baltic countries, these topics are only beginning to surface in political discourse and the scientific literature [11,12,13]. Nevertheless, concerns about uncontrolled development [14,15] and the need to identify and protect valuable agricultural land [16,17] have been raised previously.
For setting binding steps towards the NNLT goal, the European Directive on Soil Monitoring and Resilience [18] is in progress, which would make it mandatory to monitor land take, the status of soils and soil sealing—a form of permanent land take—and set mitigation principles. The draft of the directive defines land take as a process “that transforms natural and semi-natural areas (including agricultural and forestry land, gardens and parks) into artificial land development”. This definition contradicts the initial one from the European Commission, as urban parks and gardens are not consistently considered [1]. The initial definition encompassed areas sealed by construction and urban infrastructure, as well as urban green paces, sports, and leisure facilities [19]. The European Environment Agency (EEA) calculates land take indicator for European countries as a whole from the CORINE land cover (CLC) dataset [20] and for functional urban areas (FUA) of larger cities from the Urban Atlas (UA) dataset according to the initial definition [21]. The EEA monitors soil sealing through the high-resolution imperviousness layer [22], and its new land cover product, CLC+, also enables monitoring soil sealing [23]. Meanwhile, the United Nations (UN) tracks land use efficiency to support the attainment of Sustainable Development Goal 11, which aims to achieve sustainable cities and communities [24]. Currently, the Baltic countries lack national frameworks for monitoring land take and soil sealing.
The NNLT, as outlined in official documents, is defined exclusively at a single spatial scale: the European Union as a whole [1]. There is no mention of the specific responsibilities that individual territories must undertake to achieve this collective objective [25]. France is the only EU country with a binding NNLT goal. The French Parliament passed a law in 2021 specifying that by 2031, the rate of land take should be halved [26]. Many densely populated nations with a high degree of soil sealing, such as Luxembourg, Germany, and Belgium, are actively seeking solutions to meet this goal [27]. In contrast, land take is not as pressing an issue in less densely populated and less sealed countries, such as the Baltic and some Nordic nations, where the concept of NNLT remains relatively unfamiliar. Between 2012 and 2018, most EU cities underwent densification, whereas more peripheral cities, such as those in the Baltic countries, experienced de-densification [4].
It is argued that if NNLT remains a non-binding target at the national level, implementation at lower planning levels risks becoming optional [5]. At the same time, for land take policies to gain traction at the local level, they must be perceived as fair and proportionate by both urban and rural communities [1]. Imposing identical obligations on demographically and economically diverse areas risks undermining political support and compliance. The burden of adaptation should be equitably distributed across territories, with planning tools tailored to local capacity and conditions [1,4,25,28]. Moreover, the effectiveness of any land take regulation depends on the clarity of its definitions [5,12]—an issue that remains unresolved, as evidenced by inconsistencies and ambiguities in how artificial land is defined in European strategic and legislative documents. Amidst these uncertainties, soil sealing—as observed through the CLC+ Backbone (BB) dataset—provides a consistent and up-to-date indicator that enables detailed and comparable monitoring of land consumption across the entire territory.
This paper aims to map recent trends in soil sealing at the municipal level in Estonia, Latvia, and Lithuania. Using CLC+ data and official population statistics, the analysis focuses on the relationship between population change and sealed surface expansion from 2018 to 2021. While the study does not attempt to define optimal policy instruments, it highlights the spatial and demographic diversity that any future land take regulation must take into consideration. By situating local soil sealing patterns within broader trends of demographic decline, metropolisation, and uneven development, this paper aligns with recent calls for multi-scalar, context-sensitive approaches to land take reduction rather than imposing generic “one size fits all” standards [1,24]. While the draft EU Soil Monitoring and Resilience Directive increasingly treats soil sealing as a proxy for land take, the two indicators should not be functionally interchangeable. To better understand the implications of shifting definitions, this study includes a comparative analysis of land take and soil sealing within Urban Atlas (UA) covered regions.
The remainder of this paper is structured as follows: Section 2 provides background on demographic and spatial development trends in the Baltic states, along with relevant literature on soil sealing, land take, and planning frameworks. Section 3 outlines the data sources and methodological approach used to analyse soil sealing and population change at the municipal level. Section 4 presents the empirical findings, beginning with demographic and soil sealing patterns (Section 4.1), followed by an analysis of land use efficiency (Section 4.2), and a comparison of different land-cover datasets (Section 4.3). Section 5 discusses the implications of the results for land use planning. Section 6 concludes.

2. Understanding Land Use Dynamics in the Baltic Region

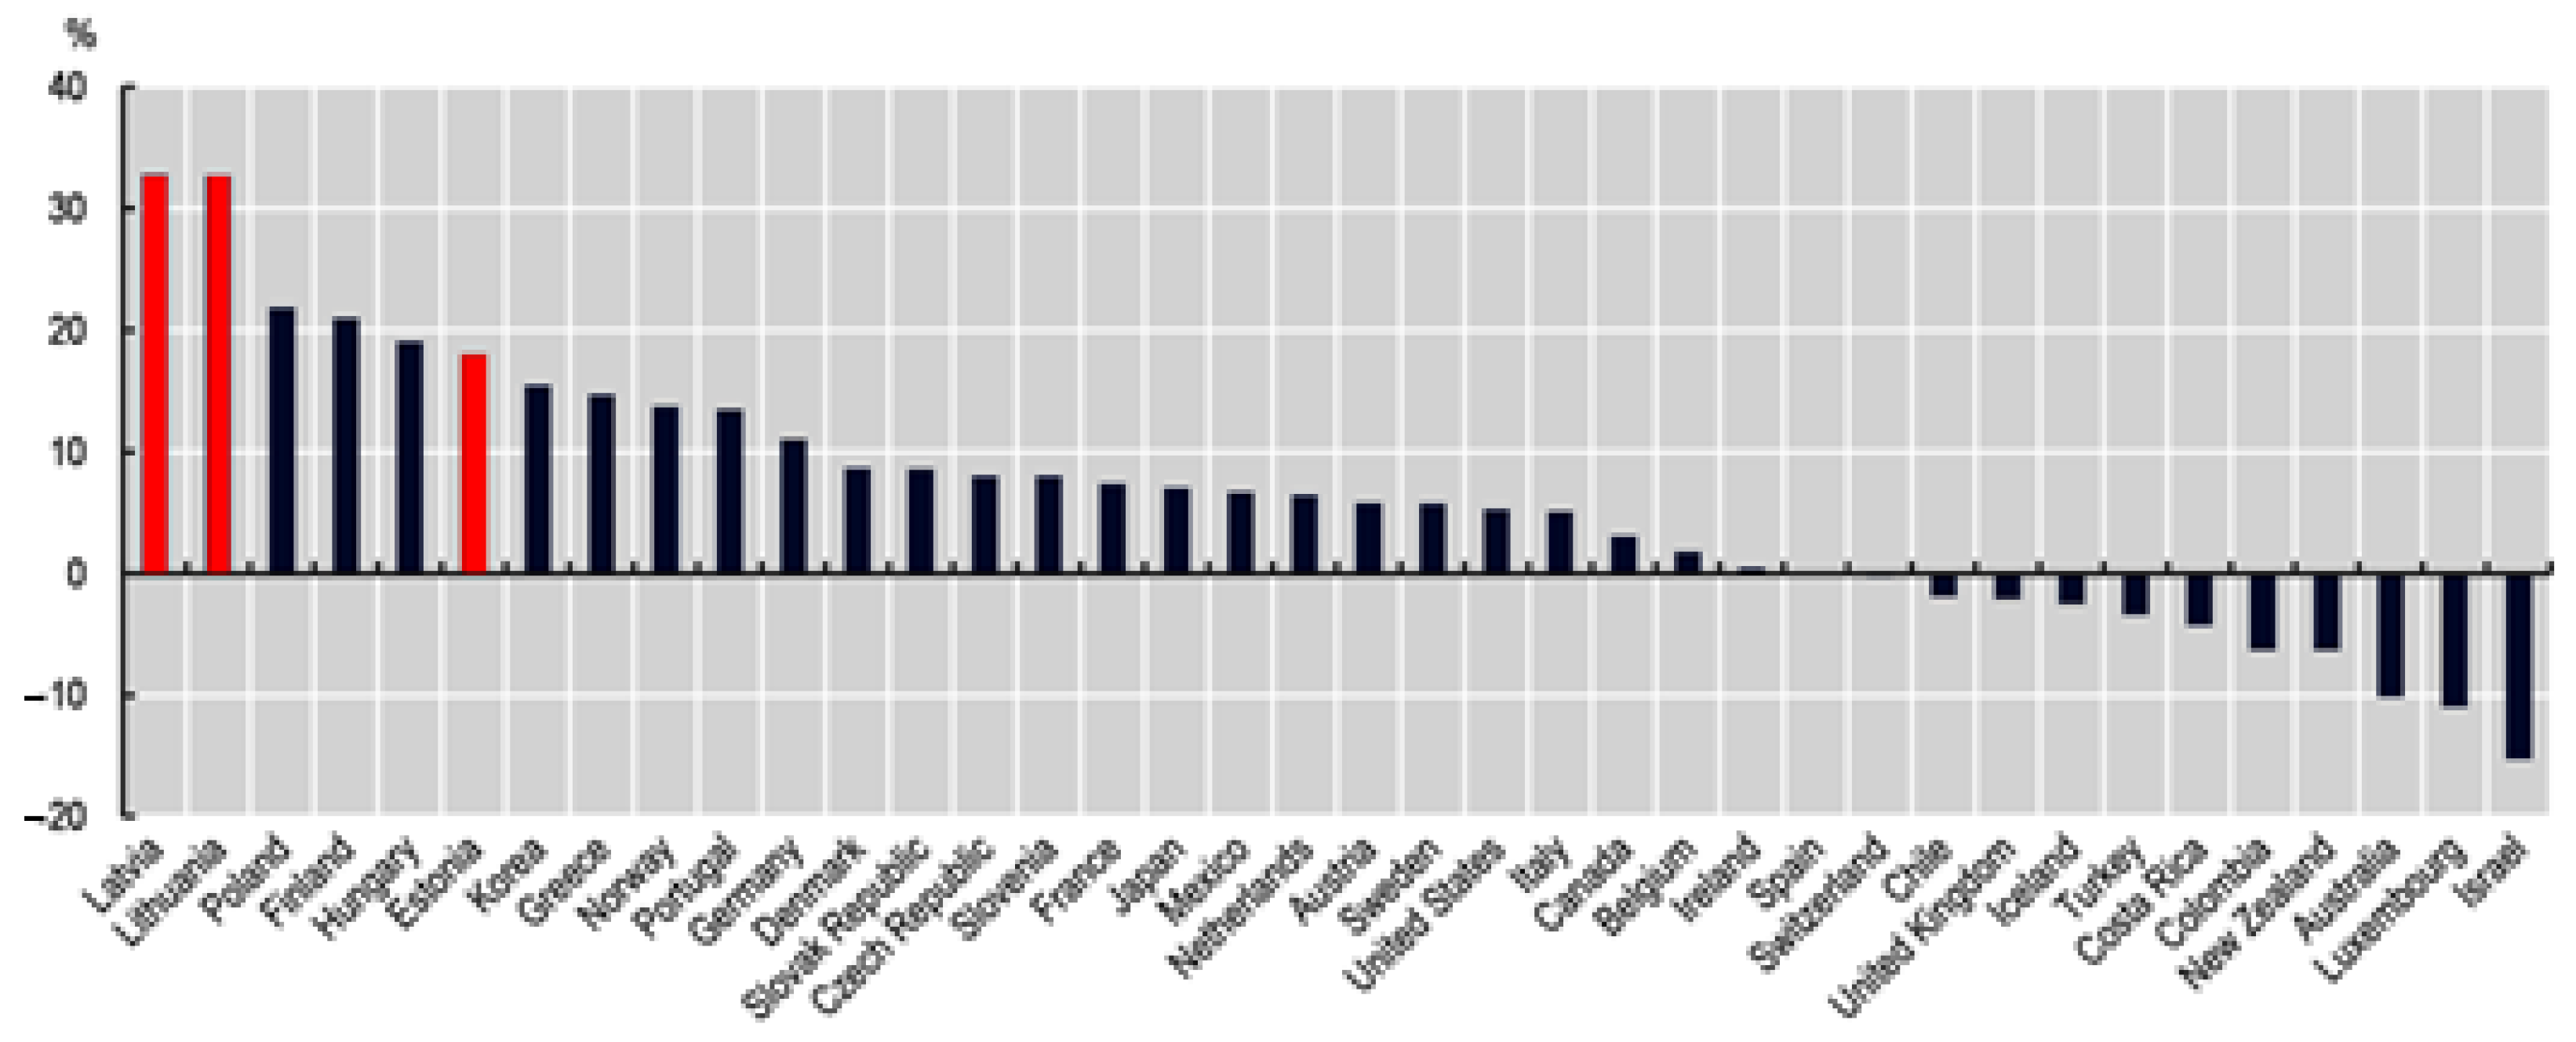
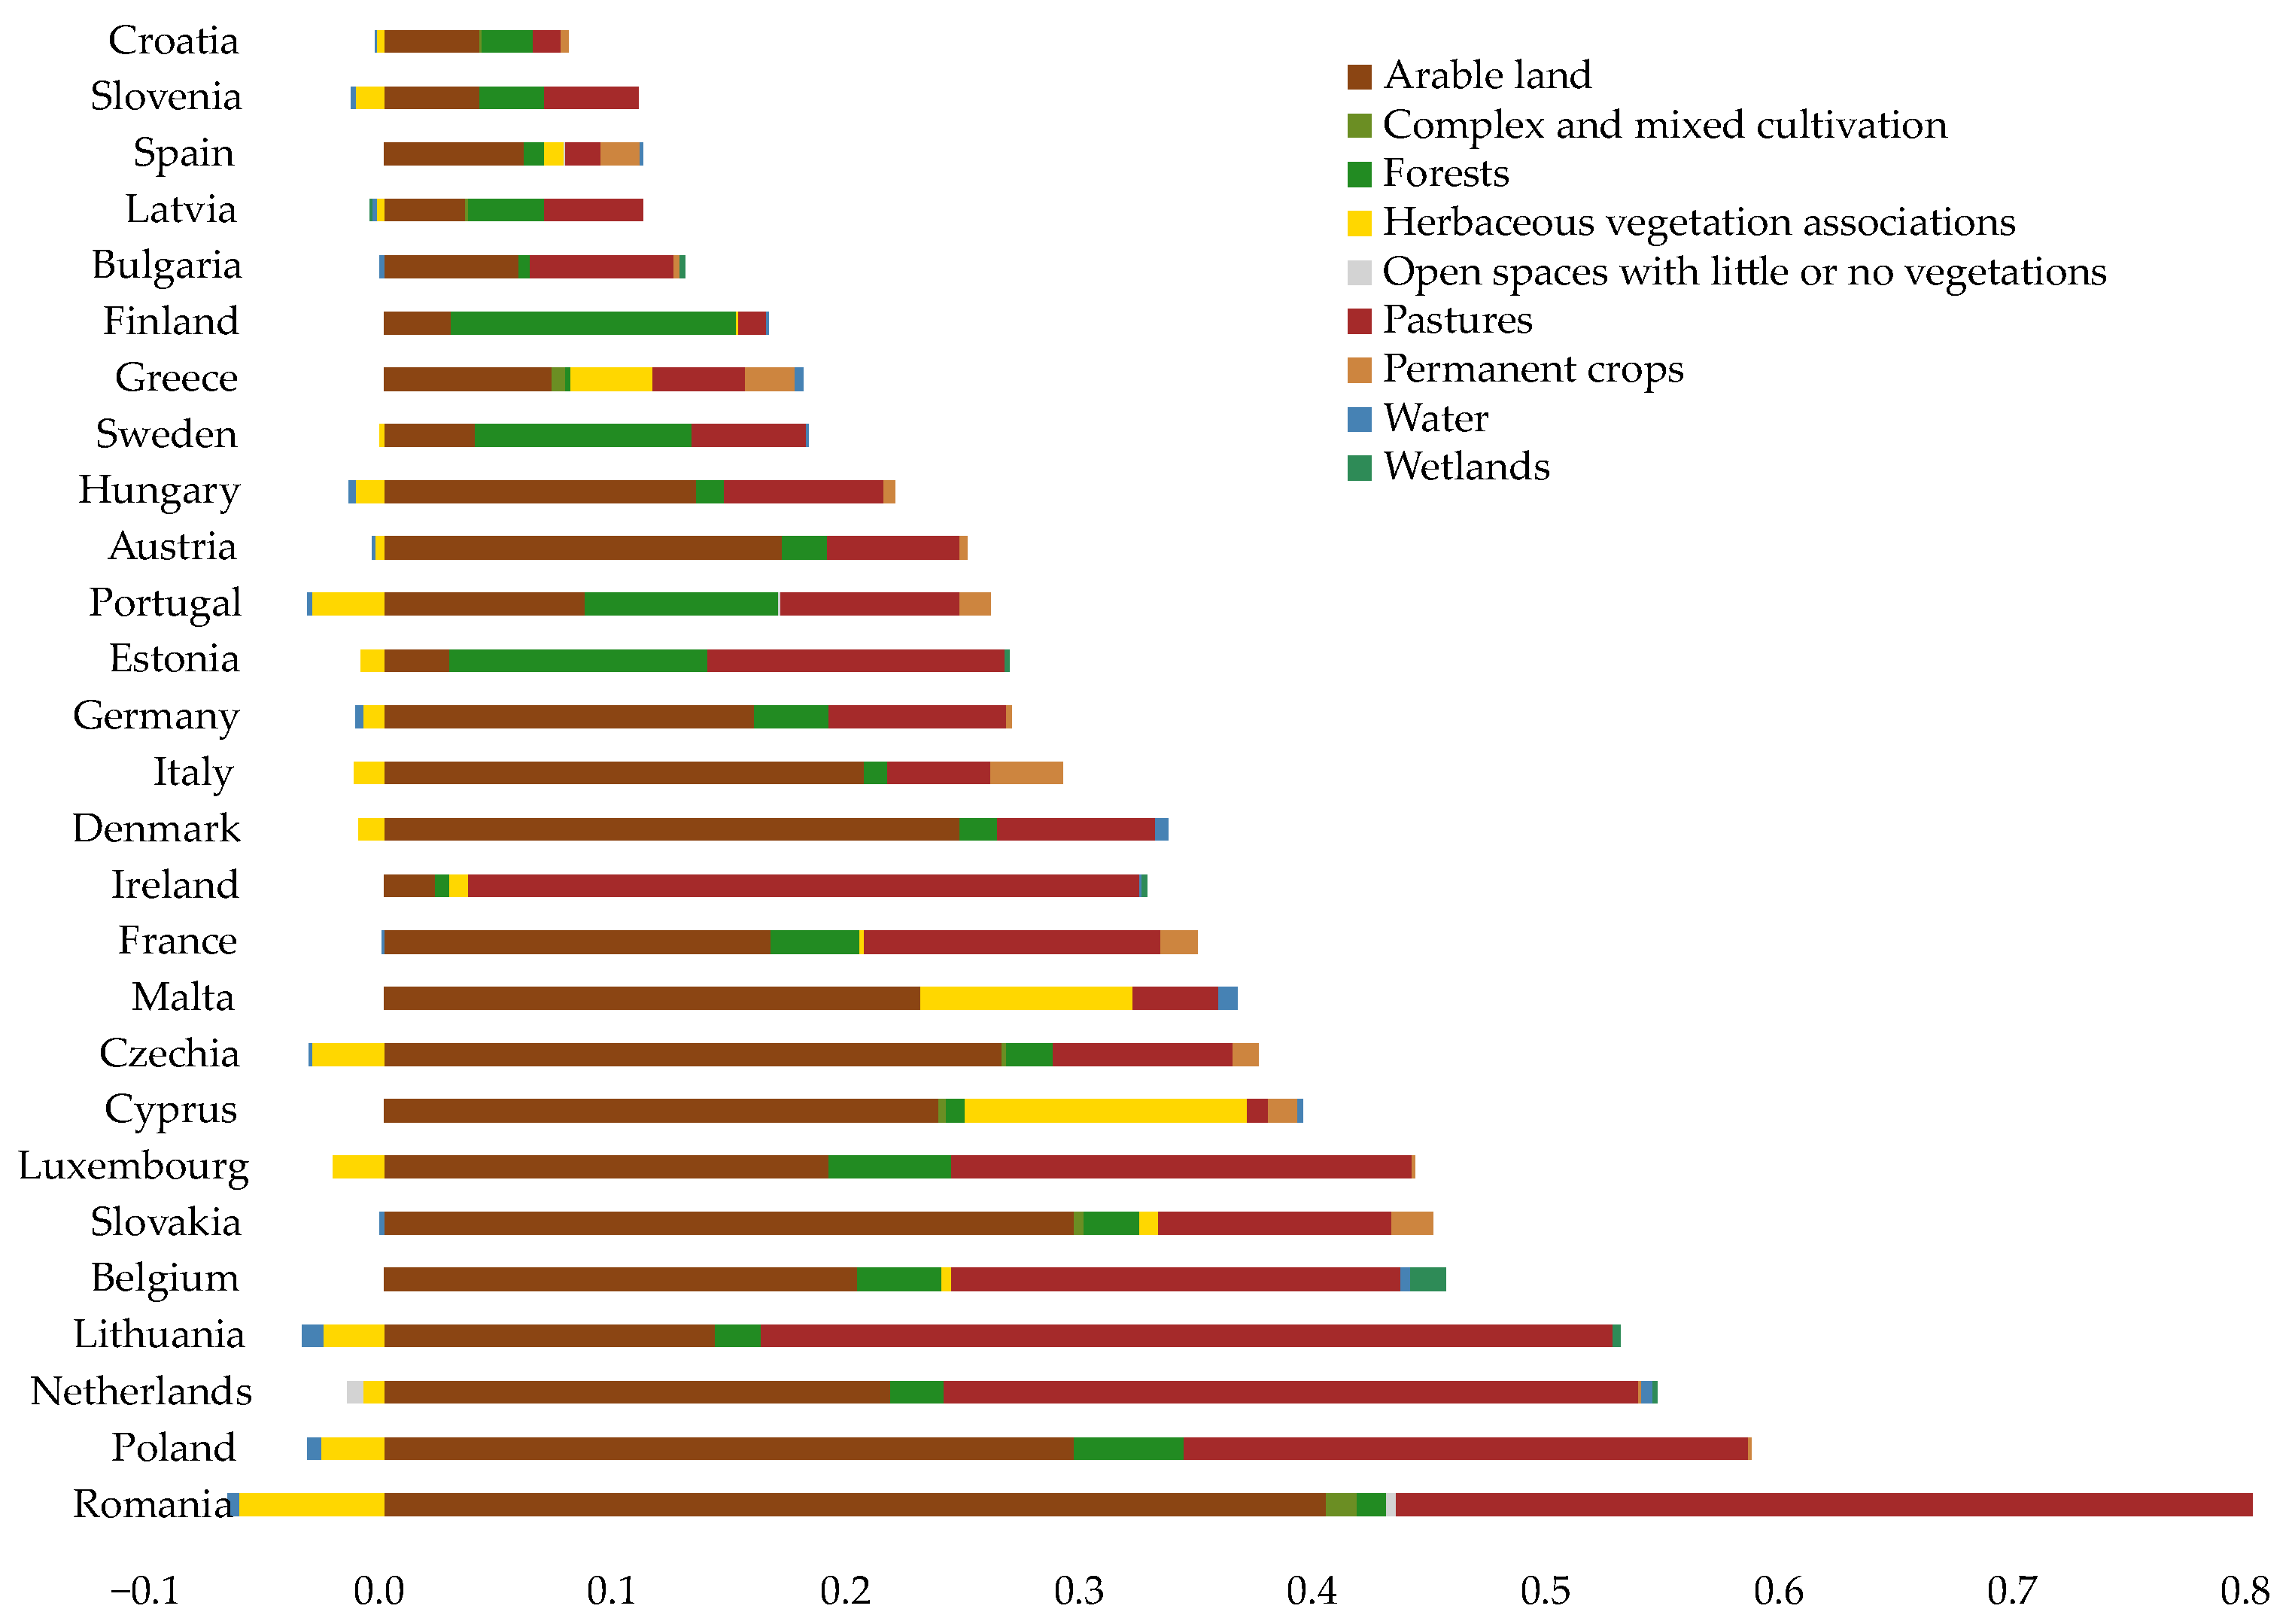
2.1. Baltic Land Take and Soil Sealing Situation from a European Perspective

Estonia, Latvia and Lithuania are among Europe’s 10 most sparsely populated countries. While the EU average in 2022 was 109 persons per km2, Latvia’s population was 29.7 persons per km2, Estonia’s 31.0 persons per km2 and Lithuania’s 45.2 persons per km2 [29]. When comparing land use and population changes, the need to regulate land take becomes clear. Between 2000 and 2014, the growth of the built-up area per capita in Lithuania, Latvia and Estonia was among the six highest in OECD countries (Figure 1). Latvia and Lithuania experienced the highest growth, with the built-up area per capita increasing by more than 30% in these countries. In Estonia, the growth was around 18%. An increase in built-up area per capita typically signals low land use efficiency; however, in the Baltic context, this trend is driven not only by land consumption but also by population decline, which is discussed in more detail in the following sub-chapter.
The land take situation in Estonia, Latvia, and Lithuania is not uniform. According to the EEA land take indicator, from 2012 to 2018, the net land take in Lithuania was more than 0.5% of the total functional urban areas (FUA) surface in the country, which was higher than in most of the EU countries (Figure 2). At the same time, it was less than 0.3% in Estonia and around 0.1% in Latvia [21]. However, land take does not pressure arable land as much as in many other countries. According to Aksoy et al. [31], in Estonia, Latvia and Lithuania, less than 0.20% of arable land was impacted by the land take, and from 1990 to 2006, the potential yield lost due to loss of agricultural land in Estonia, Latvia, and Lithuania was less than 0.25%. More recent data from 2012 to 2018 corroborate this trend, as Figure 2 reveals that within FUAs, land take primarily affected pastureland in all Baltic states.
The EEA imperviousness product shows a slight increase in sealed areas across all Baltic countries between 2006 and 2015. In Latvia, sealed areas accounted for 0.37% of the total land area in 2006, increasing to 0.38% by 2015. In Estonia, the proportion of sealed areas rose slightly from 0.41% in 2006 to 0.43% in 2015. Similarly, in Lithuania, sealed areas increased from 0.73% in 2006 to 0.75% in 2015 [22]. Rates of soil sealing in the areas already in artificial use remain lower than in many urban areas of Western Europe [1].
The UN land use efficiency indicator considers the land consumption rate compared to the population growth rate. Unlike UA, which operates within set FUA boundaries, the UN sustainable development goal indicator 11.3.1 takes a more dynamic approach by redefining built-up areas for each reporting period based on actual land use patterns using the Global Human Settlement Layer [32]. A study utilising this methodology [33] classifies land use efficiency (LUE) values as follows: LUE ≤ −1 (significant spatial expansion despite sharp population decline), −1 ≤LUE ≤ 0 (moderate expansion with population decline), 0 ≤ LUE ≤ 1 (balanced growth with densification), 1 ≤ LUE ≤ 2 (spatial expansion exceeding population growth), and LUE ≥ 2 (land consumption at least twice the rate of population growth). For the period 1990 to 2015, the study finds that in Estonia, Latvia, and Lithuania, moderate expansion occurs despite population decline (−1 ≤ LUE ≤ 0). At the same time, most European countries fall into the category where the land consumption rate is at least double the population growth rate [33].

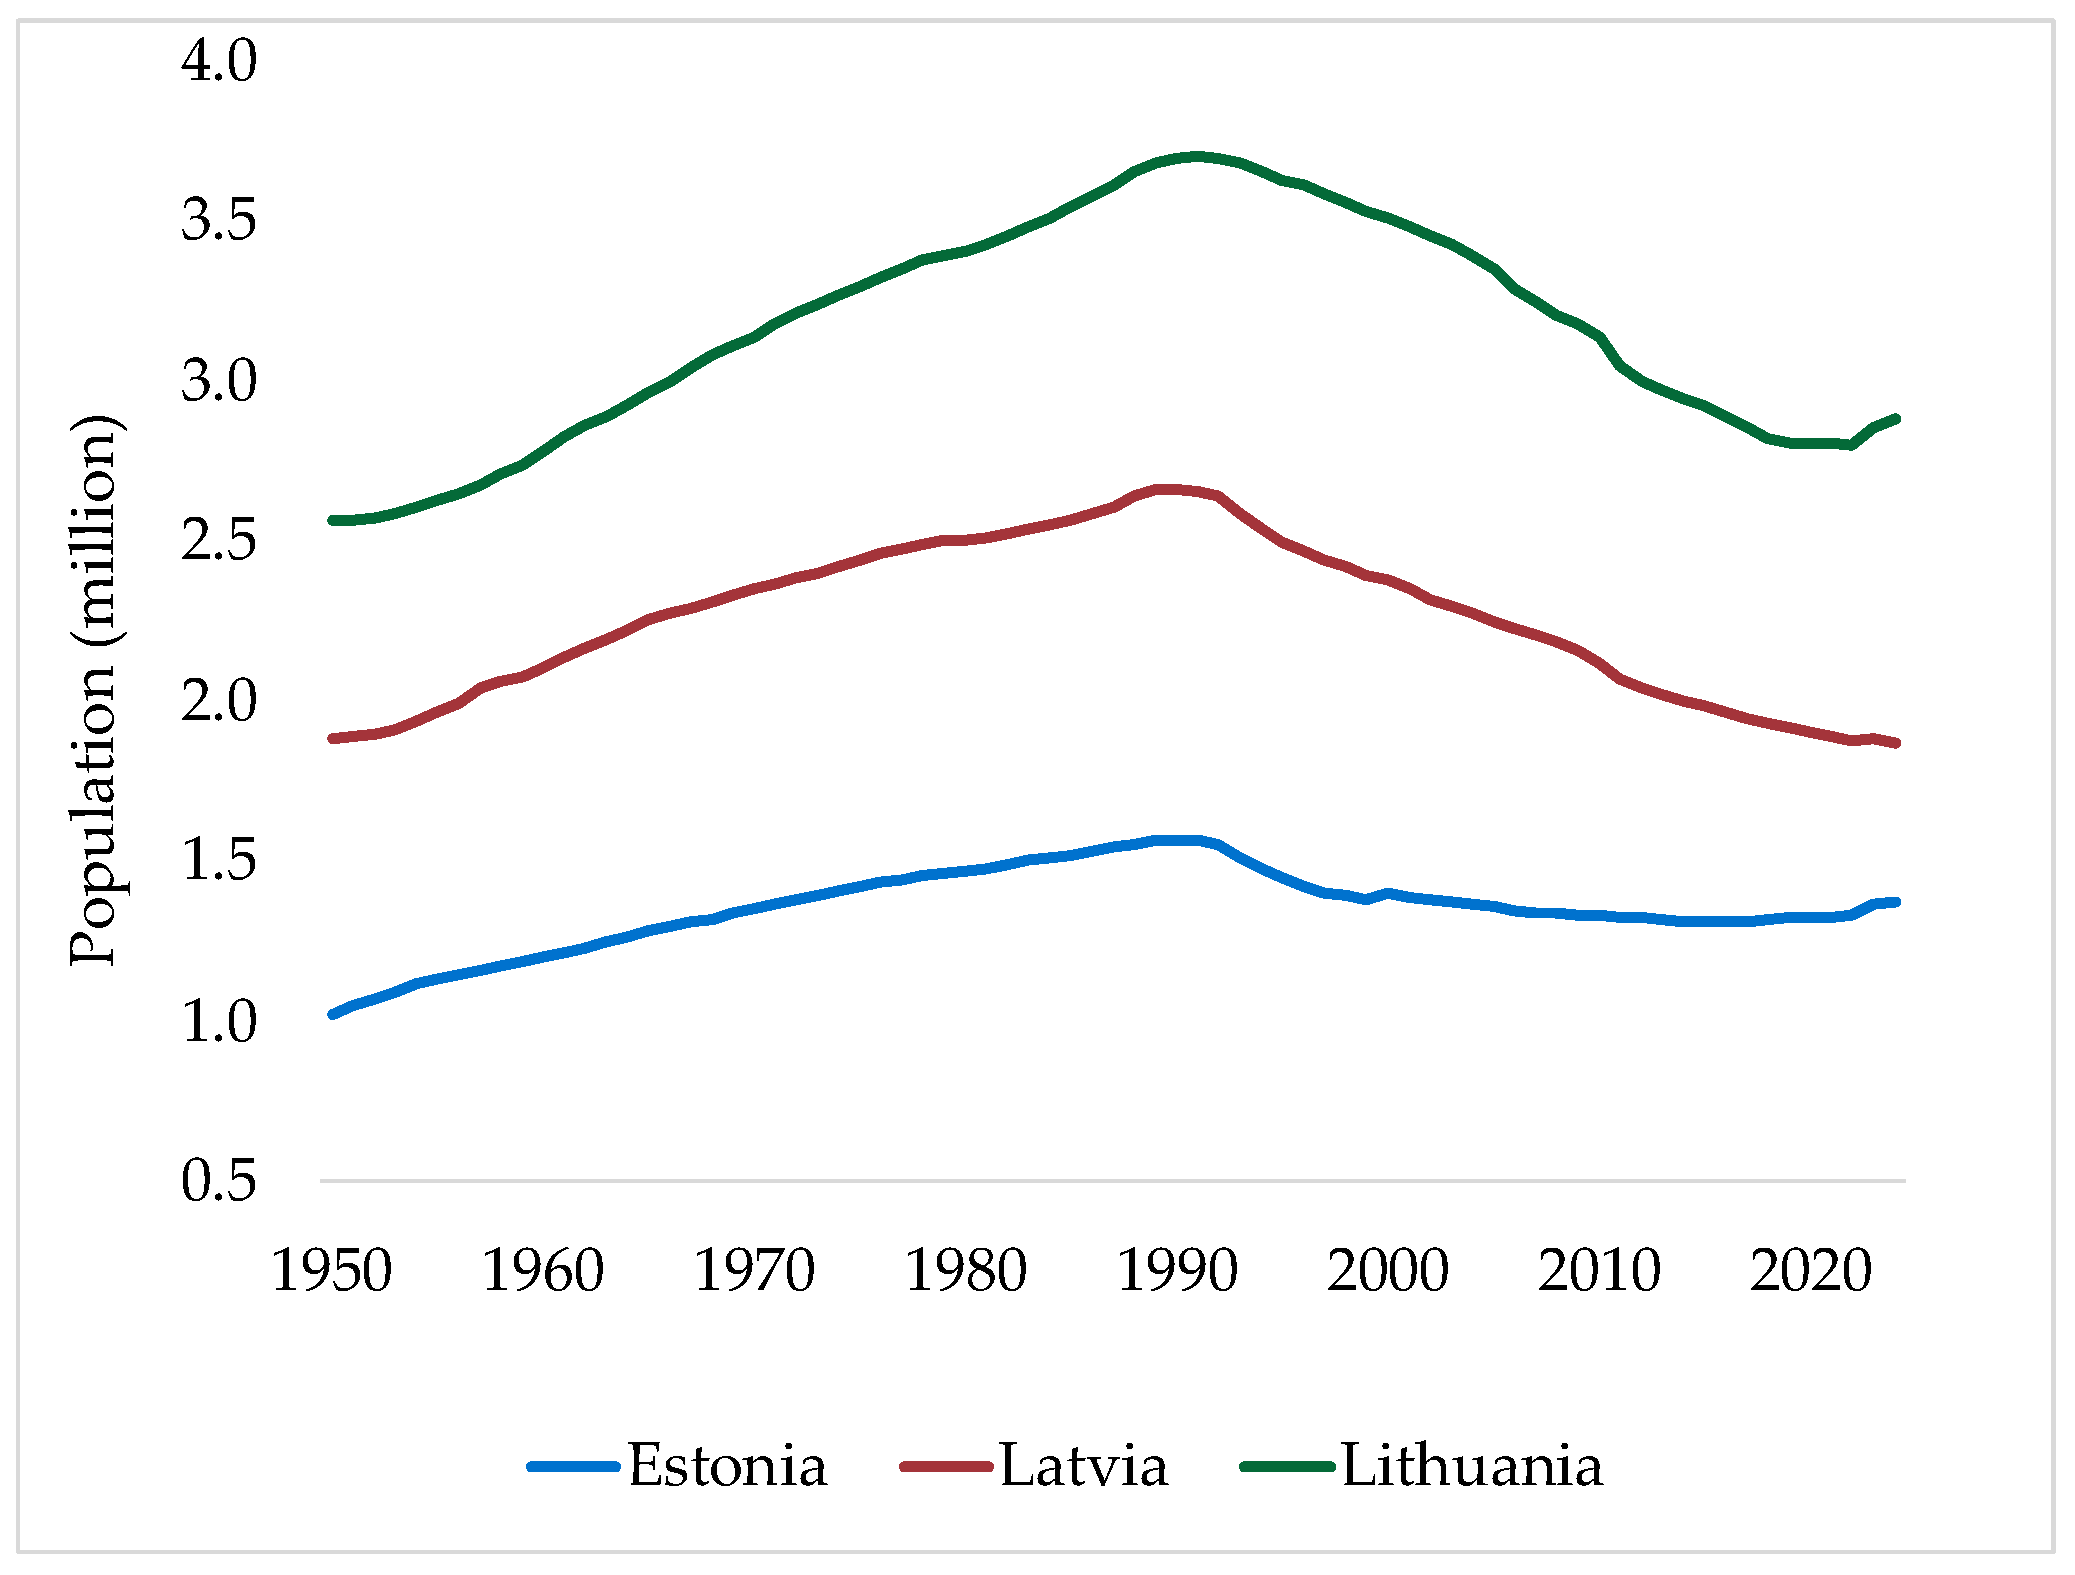
2.2. Long-Term Demographic Changes and Population Distribution in the Baltic States

Although the three Baltic countries share a common historical trajectory spanning over two centuries, their current spatial structures have been most strongly shaped by the post–World War Two era, marked by rapid urbanisation and industrialisation [34]. The demographic trends have followed broadly similar trajectories since the mid-20th century (Figure 3). During the Soviet era, all three countries experienced steady population growth driven by both natural increase and significant in-migration from other parts of the USSR [35]. The population was stable or grew also in rural areas, where quality of life was relatively high, from the late 1960s onwards [34,36].
This trend reversed sharply in the early 1990s following the restoration of independence. Birth rates declined, Soviet troops and their families departed, and migration patterns shifted [37]. Consequently, Estonia, Latvia, and Lithuania transitioned from net immigration to net emigration countries [38,39,40]. Since 2022, net migration in the Baltic states has temporarily turned positive due to the influx of refugees from Ukraine; however, it remains uncertain whether and when these displaced persons will be able to return, making the long-term demographic impact of this migration difficult to assess.
Figure 3. Population trends in Estonia, Latvia, and Lithuania, 1950–2023. Data from Statistics Estonia, Central Statistical Bureau of Latvia, Statistics Lithuania [39,40,41].
Land 14 01586 g003
Since the early 2000s, Estonia’s population decline gradually slowed and turned into modest growth from 2015 onwards, primarily driven by immigration and the remigration of Estonians returning from abroad [38]. By contrast, Latvia and Lithuania continued to experience steady population decline throughout the 2000s and 2010s, with emigration remaining a key factor. The population of both Latvia and Lithuania has declined more than 20% between 2001 and 2022, making it the most significant drop in OECD countries [42]. Furthermore, the Baltic States are among the most ageing countries in the world, and this process has been accelerated by the emigration of their predominately younger working-age population [43].
In addition to emigration abroad, all three Baltic countries have undergone significant internal population shifts since the 1990s [44]. Economic and spatial development became increasingly uneven, with populations and job opportunities concentrating around the capital cities—Tallinn, Riga, and Vilnius—while rural regions and mono-industrial towns experienced persistent decline [44,45,46]. Although deindustrialisation, automation, and the decline of the agricultural sector are global trends [47], the dismantling of local economic structures has been particularly rapid in post-Soviet context. This has triggered a vicious cycle of peripheralisation [48], as the capital cities proved more successful in transitioning to a service-based economy. Between 1995 and 2002, GDP per capita in the capitals grew substantially faster than the national average: in Tallinn, by 97% (compared to the country average of 14%); in Riga, by 129% (country average 48%); and in Vilnius, by 113% (country average 40%) [45].
Suburban areas around the capitals have been among the few regions with population growth since the 1990s, whereas the most peripheral rural and urban regions have seen the sharpest declines [46,47]. Many of these peripheral areas still bear the legacy of the Soviet period, during which extensive military installations, industrial complexes, and agricultural facilities were established across Estonia, Latvia, and Lithuania. Following the collapse of the USSR, numerous such sites were abandoned, resulting in widespread brownfield areas that continue to pose environmental and redevelopment challenges [49,50,51,52].
Starting from 2015, in Estonia, the previous polarisation of the last 25 years began to reverse partially, and the population is growing not only in the suburbs of Tallinn but also in functional urban areas of Tartu and Pärnu [47,53]. Outmigration from peripheral counties has slowed, and some remote rural localities have become popular amongst young professionals with children [47].
In Latvia, at the end of the Soviet period in 1989, Daugavpils—the second-largest city—was 7.3 times smaller than Riga [46], laying the foundation for ongoing metropolisation trends in which Riga remains the dominant urban centre. Population within the city borders continues to decline, with growth concentrated in suburban areas.
In Lithuania, Vilnius was never as dominant as Riga and Tallinn, accounting for only 15.7% of the total population in 1989 [46]. This was influenced by historical factors, such as Kaunas serving as the temporary capital during the interwar period, Vilnius’s geographical position near the Belarusian border and its lack of seaport access, and Soviet-era urban planning [44,46]. Between 1989 and 2015, Vilnius’s share of the total population increased to 18.2%, and the population ratio between Vilnius and the second-largest city grew significantly [46].
Despite some differences in urban settlement and population patterns across the Baltic states, all three countries have faced challenges related to metropolisation since regaining independence [34]. The population is concentrated within and around capital regions; remote rural areas and smaller towns are generally ageing, shrinking, and have exceptionally few job opportunities [34,46,47]. As a result, these regions are strongly motivated to attract new residents and create jobs at any cost, even if the outcome is disproportionate to the amount of land consumed.

2.3. Local Planning Level as the Primary Regulator of Land Use

None of the Baltic states has a comprehensive land policy document [10]. The Soil Monitoring Directive and the Nature Restoration Law encourage EU member states, including the Baltic countries, to adopt a unified terminology and establish monitoring frameworks for soil sealing, land take, and ecosystem restoration. In Estonia, efforts are underway through a research and development (R&D) project focused on soil and land use [13]. In Latvia, policymakers discuss terminology adaptation (e.g., land consumption, land take, soil sealing) and participate in European-level initiatives to shape the directive and its monitoring criteria. The Lithuanian Ministry of Environment requested a study from ESPON Sustainable Urbanization and Land Use Practices in European Regions (SUPER) project to find better ways to integrate sustainable land use principles, such as compact development and urban containment, into the Comprehensive Plan of the Republic of Lithuania [54].
In Estonia, spatial planning is conducted on four levels: national, regional, comprehensive, and detailed. It is mandatory to cover all the areas of Estonia with the national spatial plan, regional plans, and comprehensive spatial plans. The areas and cases in which a detailed spatial plan must be prepared are specified in legislation or the comprehensive plans. Thematic plans, such as maritime spatial plans, can be prepared at any level and designated spatial plans are created for developments with significant impacts that are not foreseen in existing plans. Comprehensive spatial plans define land use guidelines, including the principal land use purpose, building conditions, and environmental requirements [55]. Development strategy documents also complement these plans at various levels.
In Latvia, spatial planning occurs exclusively at the local level, with three types of plans: local government spatial plans (covering the entire municipality), local plans (specific areas), and detailed plans (specific land parcels). These plans establish functional zoning, public infrastructure guidelines, and land use regulations [56]. National and regional development programmes provide additional long-term and mid-term sustainable development goals.
In Lithuania, spatial planning operates on three levels: national, municipal, and local. The national general plan outlines strategies for the entire country, while municipal-level general plans guide local development. Comprehensive plans at the local level address zoning and land use specifics [57]. Land use changes, such as converting agricultural land to built-up areas, are only permitted in designated urbanisation zones and require approval from municipal councils or authorised officials.
In all three countries, land use decisions are predominantly handled locally, with similar tools under different names. For instance, Latvia and Lithuania employ “functional zoning” [54,55] while Estonia uses “principal purpose of land use” [53] in municipal-level spatial plans. Local spatial plans typically include maps outlining intended land use, building requirements, and public infrastructure guidelines. Decision-making on land use regulation is primarily the responsibility of local governments. Although new planning systems were formally introduced in the Baltic states during the 1990s, the development of strategic spatial awareness at the municipal level is still relatively recent [30,58], and the full impact of local-level spatial planning is only now beginning to take shape.
The early post-independence period was marked by deregulation and planning uncertainty—a counterreaction to the formerly centralised Soviet model [59], which, while largely successful in containing suburbanisation, failed to resolve the chronic housing shortage that had accumulated throughout the socialist period [60]. In the first half of the 1990s, the political and administrative priority was to implement land reform, rather than spatial planning [61]. In Estonia, for example, nearly all regulatory frameworks were abandoned during the abrupt transition to a liberal market economy [62], resulting in a near-total legal vacuum that persisted until the Planning and Building Act came into force in 1995 [12]. In the intervening years, planning activity relied on outdated Soviet-era general plans and technical norms. The normative approach endured until it was replaced by extreme liberalism at the beginning of the 2000s [62]. As discussed in Section 2.2, regional polarisation has shaped development patterns across the Baltic states; significantly, it has also contributed to disparities in local and regional administrative capacity, which in turn continue to hamper strategic planning efforts [59]. One of the most visible consequences of this unregulated development environment was the conversion of agricultural land for suburban residential use [14,17]. Previous research has shown a correlation between planning systems and the management of land take [2,63]. However, implementing the NNLT target is a top-down process that can conflict with local land use plans and planning practices [4,8]. As spatial plans at the local level serve as a fundamental instrument of spatial planning [64], effectively reducing land use relies on the support and active involvement of the local planning level [4].
In France, where a law to reduce land take by half was passed in 2021, regions must present an action plan on how they intend to meet the target [65]. It is considered feasible to reduce land take at the national level, but achieving this goal in every individual region is more challenging. The legislation has sparked criticism, particularly from municipalities concerned about losing planning sovereignty [4]. At times, local objectives come into conflict with national strategic goals (such as large infrastructure projects), and certain regions need to be granted exceptions [65].
An analysis by France Stratégie [65] points out that assessing regional performance in limiting land take depends heavily on how land take is defined and measured. Rural municipalities may appear modest in terms of absolute land consumption, but when land use efficiency is assessed relative to demographic or economic outputs, such as population or job growth, they often perform poorly [26,65]. It underscores the importance of considering territorial demographic and economic dynamics when interpreting land use efficiency and highlights the need for clear, context-sensitive expectations for local planning levels.

3. Materials and Methods

This research examines local-level soil sealing changes in relation to demographic trends across the three Baltic states—Estonia, Latvia, and Lithuania (Figure 4). These countries were chosen due to their comparable size in both area and population, as well as their shared historical and institutional background, allowing for meaningful comparison.
While the study considers national-level frameworks, the analysis is conducted at the municipal level, as land use decisions are primarily made at this scale. Estonia has 79 municipalities, whereas Latvia has 43 municipalities, and Lithuania has 60 municipalities. Unlike Estonia, Latvia and Lithuania also feature administrative subdivisions within municipalities. In Latvia, municipalities are divided into parishes and towns, while in Lithuania, they are divided into elderships; however, spatial plans are typically not developed on these levels.
The analysis employs quantitative methods, utilising Copernicus Land Monitoring Service (CLMS) products (CLC+ BB, UA) and national population statistics data. CLC+ BB was chosen over High-Resolution Imperviousness Layer for several reasons. Firstly, CLC+ BB provides 11 clearly defined land cover classes, with each pixel assigned to a single class, making it easier to interpret than imperviousness density, representing a continuous scale of sealing intensity. Secondly, while imperviousness density offers a more extended time series, with data available every three years from 2006 to 2018, CLC+ BB provides data for the most recent three-year period possible (reference years 2018 and 2021), making it the most up-to-date dataset in the CLMS portfolio. Additionally, since the 2015 reporting year, the input data for producing the imperviousness dataset transitioned from mixed data sources to imagery from the European Sentinel satellites. While this shift improved spatial resolution from 20 m to 10 m, it also introduced a break in the time series, making the 2018 update incompatible with previous reference years [22].
In addition to CLMS products, other land cover and settlement datasets are available, including the Global Human Settlement Layer (GHSL) [66] and Meta/CIESIN’s High-Resolution Settlement Layer (HRSL) and Global Urban Areas dataset, released along with the latter [67]. GHSL provides long-term built-up area data from 1975 to 2015 using Landsat imagery, with more recent products incorporating Sentinel data. Some layers also include projections up to 2030. GHSL 10 m product (GHS-BUILT-S2) currently covers only a single reference year (2018) at high resolution [68]. HRSL provides detailed population distribution based on 2015 satellite imagery and census data, with urban area polygons covering over 37,000 regions globally [69]. However, neither GHSL nor HRSL was chosen for this study due to their limited temporal coverage at high resolution, inconsistent alignment with administrative units, and lack of a clearly defined sealed surface class compatible with our methodology.
Spatial data processing and analysis were conducted using QGIS, employing zonal histograms and the Semi-Automatic Classification Plugin [70] to extract the necessary data for each municipality. Only changes from and to CLC+ BB Class 1 (sealed surfaces) were considered, while changes between natural land cover classes were excluded from the analysis. It is acknowledged that some detected changes may result from classification errors rather than actual changes in land cover. However, given that the reported accuracies of both raster products are comparable—with an overall accuracy of 91.6% ± 1.4% for Estonia, Latvia, and Lithuania in 2018 and 93.1% ± 1.3% in 2021 [71]—the datasets are treated consistently. The classification accuracy for the sealed surface class across the entire product area is 86% and 88%, respectively. Therefore, it is assumed that potential misclassifications are balanced across both datasets, minimising systematic bias in the analysis.
Calculations were performed using QGIS to analyse sealed areas and population changes in municipalities. For each unit, the total area of sealed surfaces in 2018 and 2021 was calculated using the CLC+ Backbone raster, alongside the change in sealed surface area, expressed in both absolute (km2) and relative (%) terms. Population data for the same years were compiled from national statistics, with corresponding changes calculated in absolute and percentage terms.
To jointly assess the relationship between soil sealing and demographic change, a combined change indicator was developed. This indicator classifies each municipality along two dimensions:
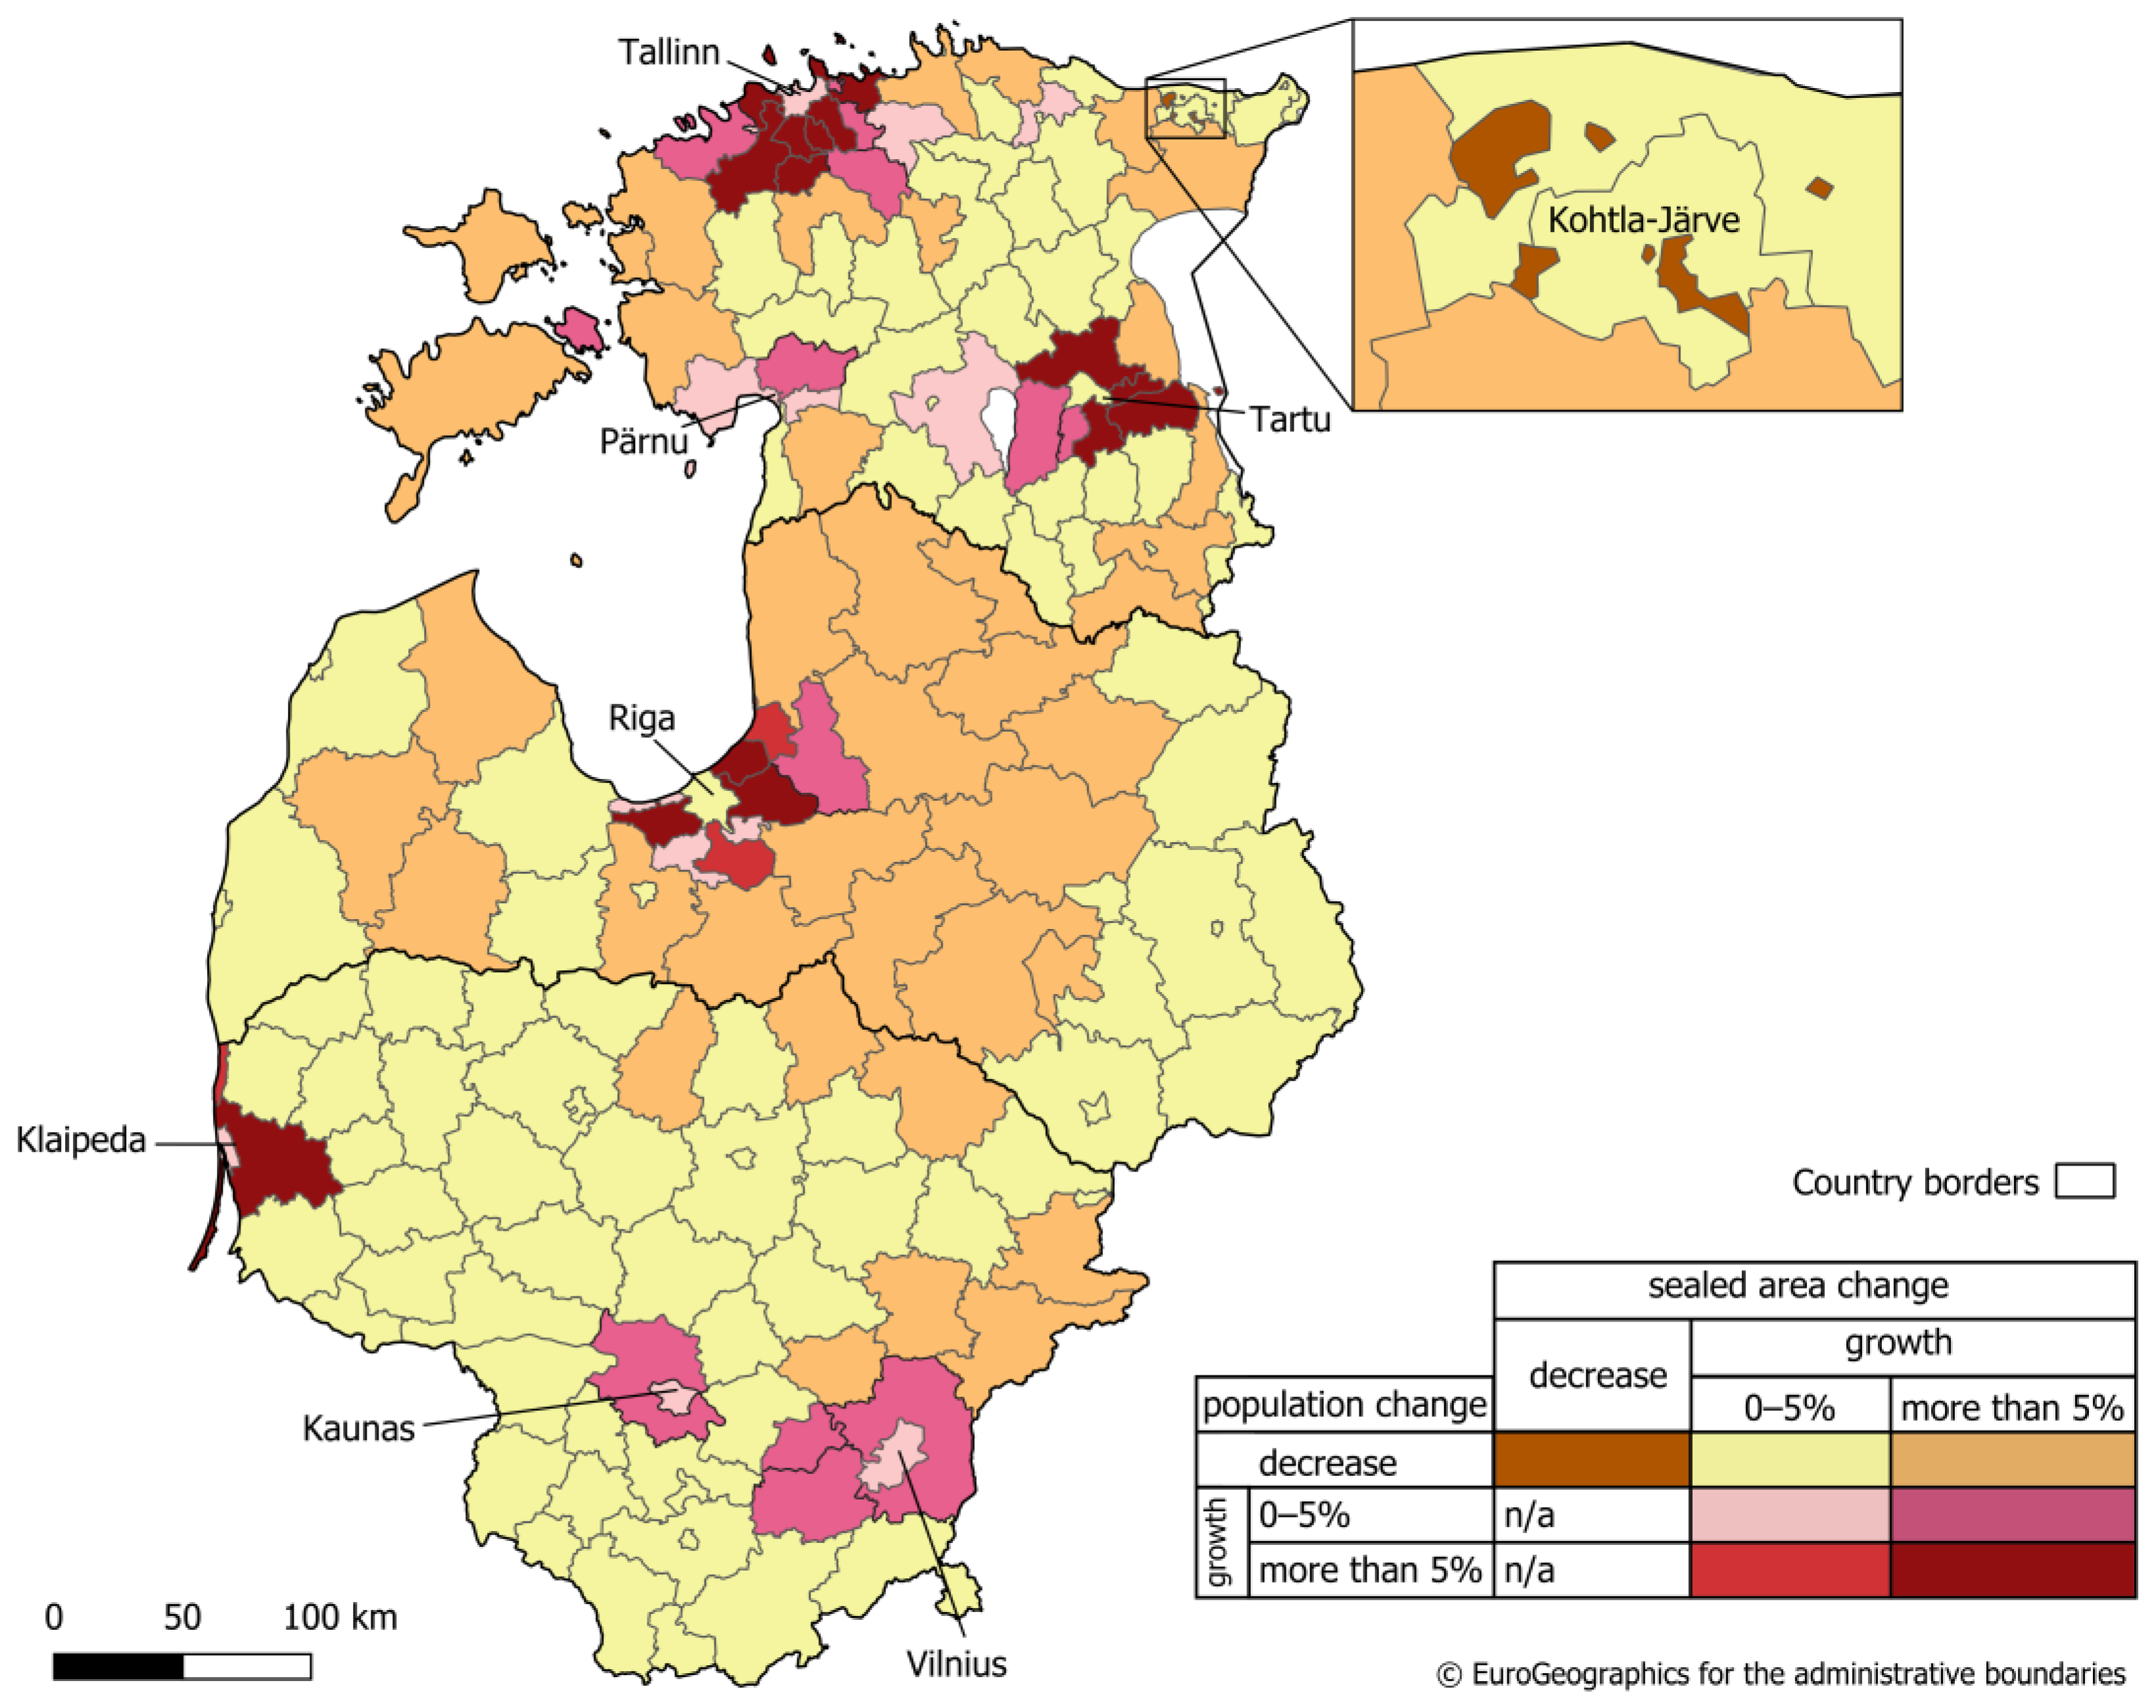
  • Soil sealing change: (1) decrease, (2) moderate increase (0–5%), and (3) high increase (>5%). Classification began by isolating the only municipality where sealing declined. Among the remaining municipalities, the mean change (5.15%) and median (4.39%) were used to inform the 5% threshold distinguishing moderate from high increases.
  • Population change: (1) decrease, (2) moderate increase (0–5%), and (3) high increase (>5%). Municipalities were first grouped by overall increase or decrease. To differentiate within the group of growing municipalities, the top decile was identified. A 5.85% increase marked this threshold, which was rounded to 5% for the classification.
This 3 × 3 classification matrix yields nine theoretical categories; however, in practice, only seven were observed, as no municipalities simultaneously experienced a decrease in sealed area alongside population growth. The result is illustrated in the bivariate thematic map presented in Section 4.1.
A separate analysis was conducted to calculate the sealed area per capita indicator for each municipality by dividing the total sealed area by the population in 2018 and 2021. Since this metric already reflects the combined effect of land use change and population dynamics, it does not allow their contributions to be disentangled. It closely resembles the OECD built-up per capita indicator discussed in Section 2.1. This measure was included alongside the combined change indicator, which keeps population and sealing trends separate, to highlight how per capita metrics can produce a skewed or seemingly unjust picture, particularly in shrinking municipalities where sealed surfaces may remain constant or grow slightly, while the population declines.
To visualise this, a thematic map was created. Municipalities were classified into three categories based on the percentage change in sealed area per capita: (1) Decrease, (2) Moderate increase (0–5%), (3) High increase (>5%). The 5% threshold was retained to ensure consistency with the classification used in the combined change indicator, offering an intuitive and comparable scale for interpreting municipal-level trends.
To show the impact of shifting definitions by which policy frameworks inrceasingly treat soil sealing and land take as synonymous, areas with (1) sealed surfaces and (2) land in artificial use were compared in regions covered by the UA dataset. Data on sealed soils were derived from the CLC+ BB 2018 dataset, while data on land in artificial use were derived from the UA 2018 dataset. In UA, artificial land use is classified into 17 subclasses, and for this analysis, only the first-level classification (Class 1) was considered. All artificial land use categories, including green urban areas (UA class 14100) and sports and leisure facilities (UA class 14200), were treated uniformly as a single category representing artificial land use. Since the datasets used in this study share only one overlapping reference year, the analysis focused on the state of land cover and land use rather than dynamic changes in land take and soil sealing. However, to provide insight into land take trends, urban land take from 2012 to 2018 was calculated by identifying all conversions from UA rural classes to UA urban classes and vice versa, thereby capturing net land take.
Data were downloaded from CLMS [72], population data were obtained from official statistics portals of all three countries [39,40,41], and municipality borders were sourced from Eurostat as of 2023 [73]. The latter was used to ensure a seamless dataset, as utilising national mapping data from the three countries resulted in inconsistencies.

4. Results

4.1. Combined Change Indicator for Soil Sealing

Between 2018 and 2021, soil sealing increased in all but one municipality across the Baltic states, irrespective of demographic trends. Population growth has been concentrated around capital cities and a few other towns, while population decline has been observed in all other municipalities. This decline includes Riga, the capital of Latvia, Tartu in Estonia, and Klaipėda in Lithuania, suggesting a pattern of urban sprawl around these cities (Figure 5), where people are increasingly moving from the urban core to suburban areas. A similar trend is observed around Tallinn, the capital of Estonia, where population growth in the surrounding municipalities surpasses the more modest increase within the city limits, indicating ongoing suburbanisation.
Vilnius, the capital city, and Kaunas in Lithuania are growing similarly to the surrounding municipalities. However, the faster growth of sealed areas in suburban areas—exceeding 5% compared to the 2018 reference year—suggests inefficient land use, where land consumption increases disproportionately relative to population growth. This trend likely reflects ongoing urban sprawl as new developments continue to extend beyond the urban core.
The only exception to this pattern of soil sealing growth throughout the Baltic states is Kohtla-Järve, a municipality in north-eastern Estonia composed of five separate districts. In Kohtla-Järve, population and soil sealing, as measured by CLC+ BB raster layers, declined between 2018 and 2021. The decline in soil sealing was relatively minor, amounting to only 3800 m2, and cannot be considered a success of local-level planning. The city’s spatial plans date back to 2008–2011, and no new plans have been deemed necessary, as the existing ones are still considered up-to-date by the local government [74]. Instead, the observed decrease is more likely due to classification errors in the CLC+ dataset rather than deliberate planning decisions. The areas where soil sealing was recorded as decreasing are scattered across the municipality, suggesting that these changes reflect data inconsistencies rather than actual renaturation. Figure 6 provides an example of a classification error in the CLC+ BB raster product, where a road correctly classified as sealed in the 2018 dataset was misclassified as natural land in the 2021 dataset and appears as re-naturalisation on a change detection map.
The figure includes Estonian orthophoto maps from the respective years, showing that soil sealing increased after a pedestrian and cycling path was added northwest of the road. The fact that this addition is not detectable from satellite data is expected, given the limitations of the resolution and classification methods used in large-scale land cover datasets.

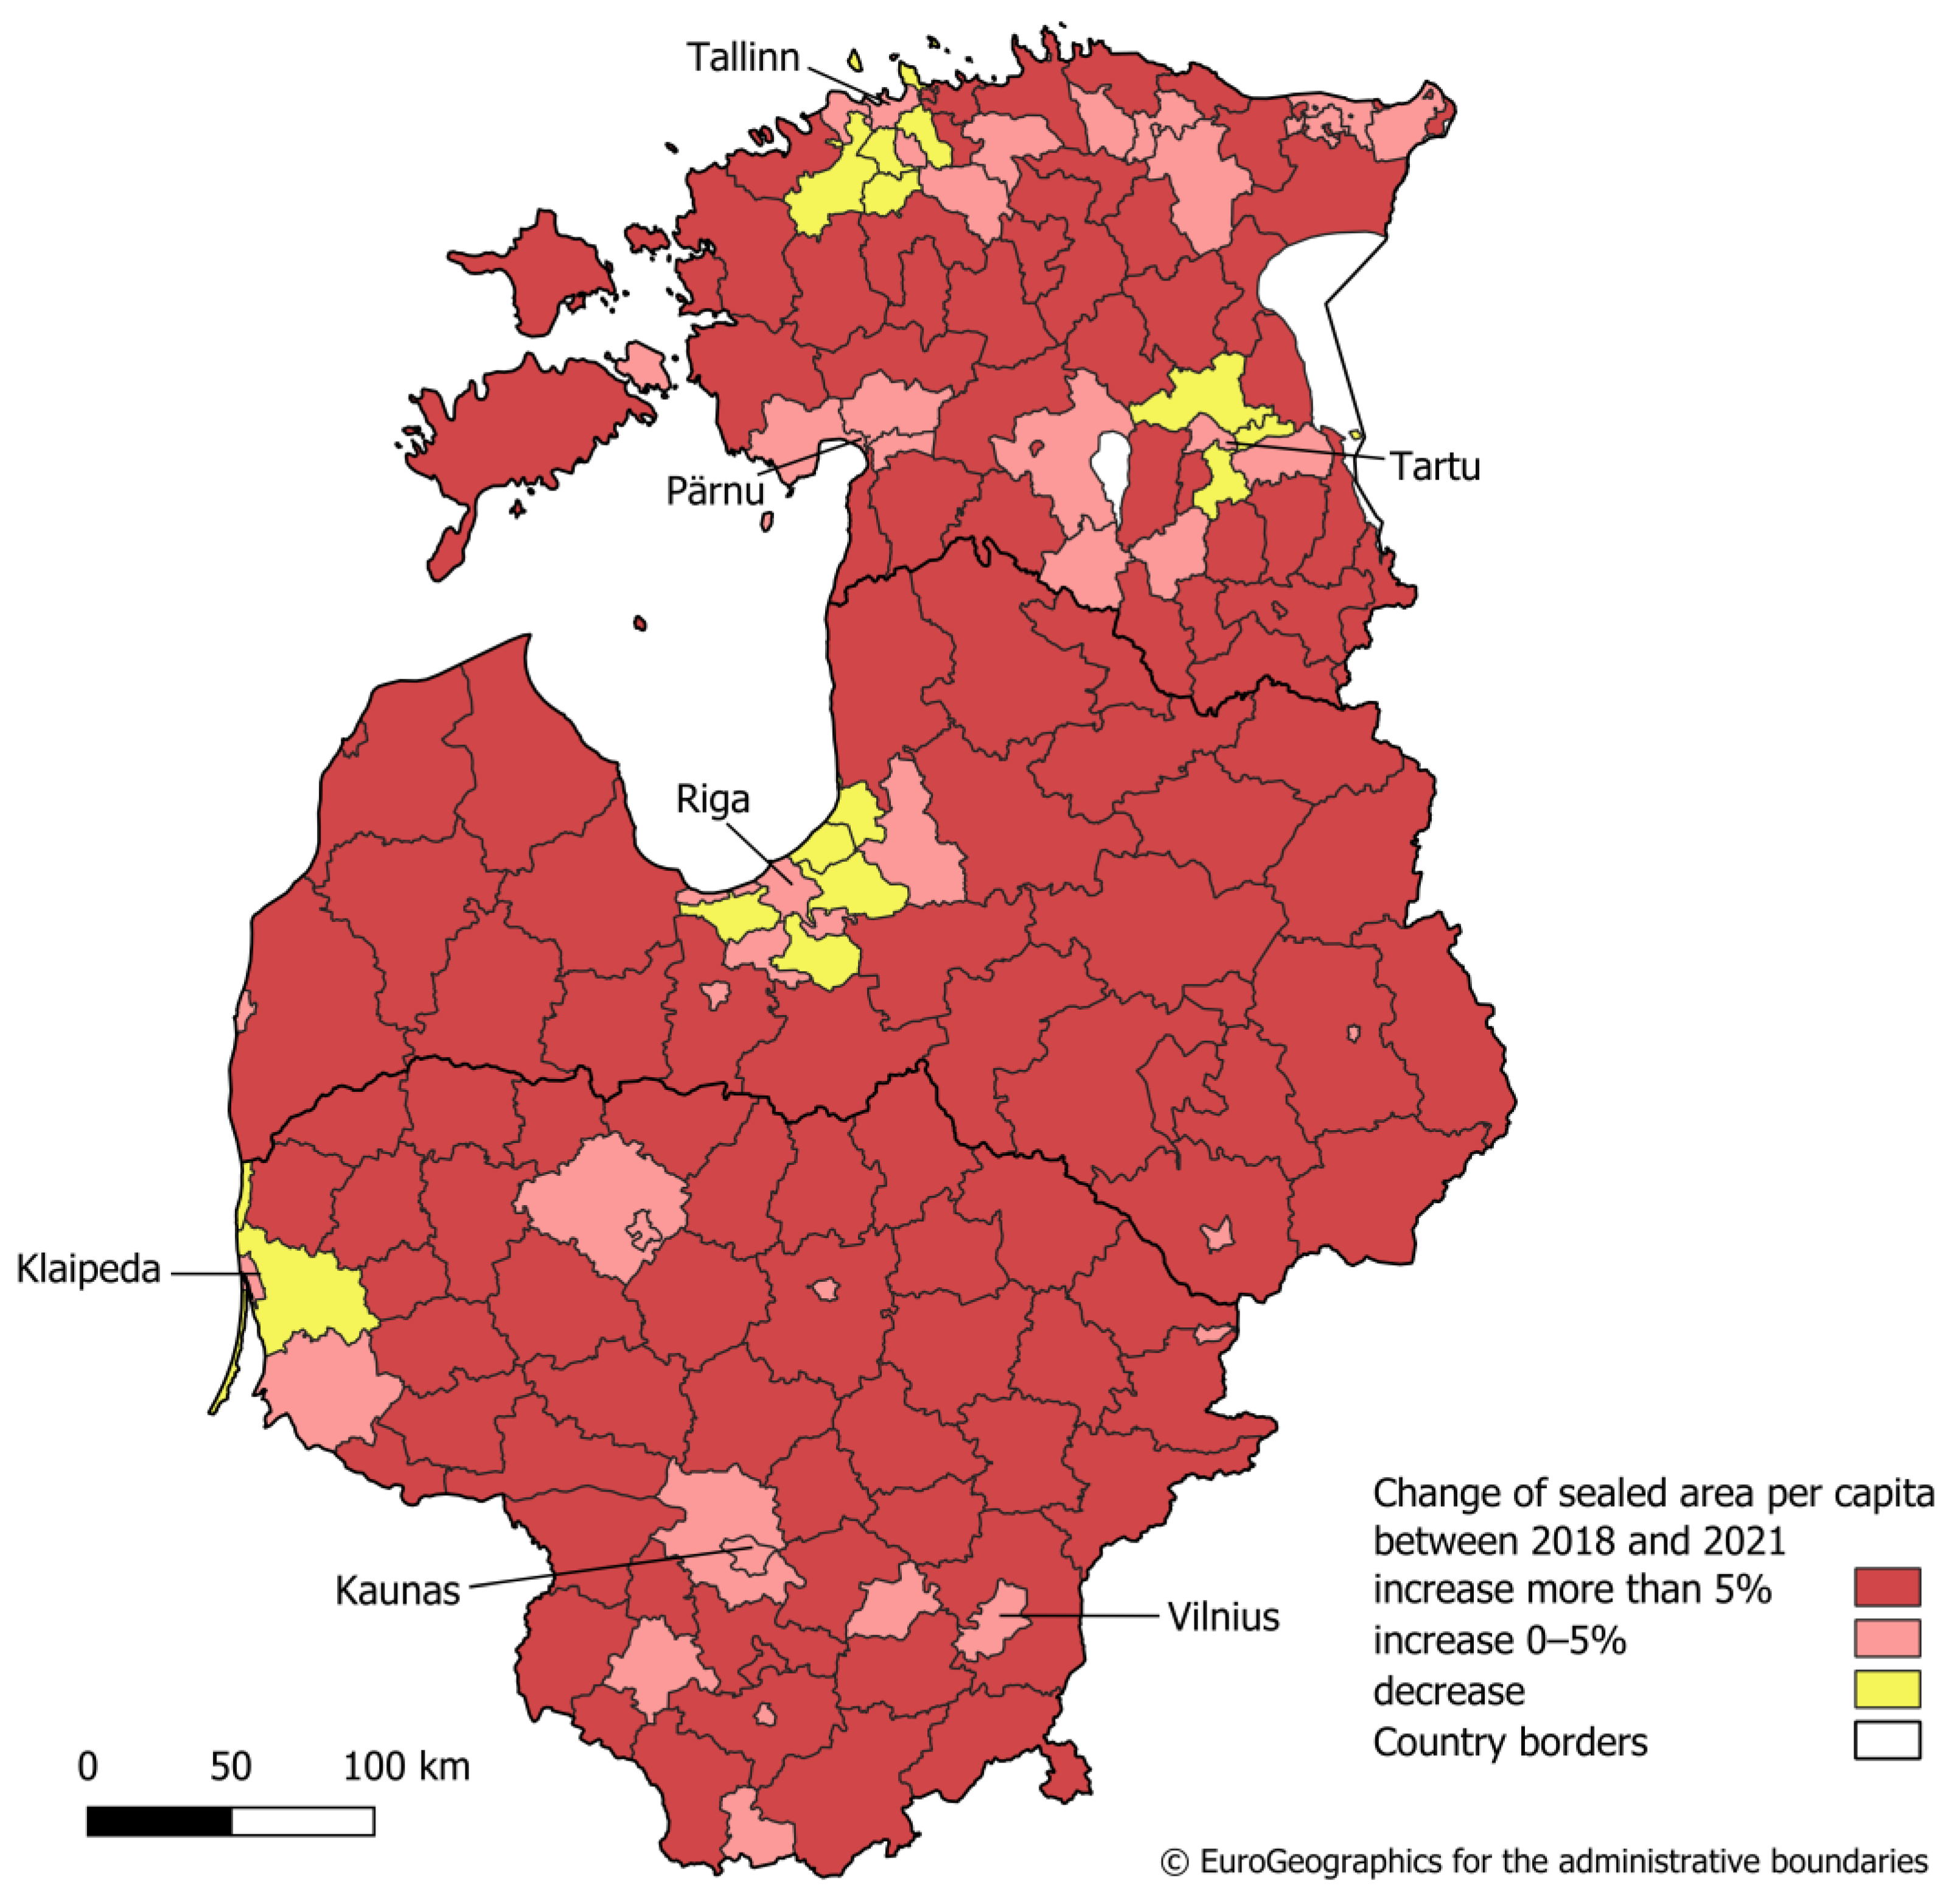
4.2. Sealed Area per Capita Indicator

Regarding land use efficiency, even if soil sealing did not increase in Kohtla-Järve, the municipality’s population decline led to a slight rise in soil sealing per capita between 2018 and 2021. The increase in sealed areas and sealed area per capita observed in most Baltic municipalities (Figure 7) appears to be mainly unrelated to local land demand, as there is no correlation (correlation value of 0.37) between population growth and the expansion of sealed areas. However, a few municipalities have experienced population growth outpacing soil sealing, primarily in the vicinity of major cities—Tallinn (Rae, Saku, Kohila municipalities and town of Keila) and Tartu (Kambja and Luunja municipalities) in Estonia, Klaipėda (Neringa and Palanga municipalities) in Lithuania, and Riga (Ķekava, Mārupe, Saulkrastu municipalities) in Latvia.
For example, in the Rae municipality near Tallinn, Estonia, soil sealing per capita decreased from 730 m2 in 2018 to 658 m2 in 2021. In the Kambja and Luunja municipalities near Tartu, Estonia, soil sealing per capita declined from 900 m2 to 849 m2 and 758 m2 to 722 m2, respectively, over the same period. Similarly, in the Mārupe municipality near Riga, Latvia, soil sealing per capita decreased from 515 m2 in 2018 to 497 m2 in 2021. In Lithuania, Klaipėda district municipality saw a decrease from 677 m2 in 2018 to 664 m2 in 2021, while in Neringa, the figure fell from 277 m2 to 260 m2, and in Palanga, from 424 m2 to 410 m2. Despite the decrease in soil sealing per capita, the initial levels in most of the abovementioned municipalities were relatively high.
Relatively, the sealed area per capita decreased by 10% in Saulkrastu municipality, Latvia, 9.8% in Rae municipality, Estonia, and 6.3% in Neringa municipality, Lithuania. The most significant increases were observed in Vormsi (26.64%) and Hiiumaa (19.44%) island municipalities in Estonia, Jēkabpils municipality (16.94%) in Latvia, and Švenčionių municipality (15.68%) in Lithuania.
The EU population is projected to decline at an average annual rate of 0.04% between 2023 and 2040. This decline is primarily driven by population loss in intermediate (−0.11%) and rural regions (−0.35% near cities, −0.46% in remote areas), which exceeds the growth in urban regions (+0.18%) [76]. The demographic changes in the Baltic states discussed in Section 2.2 reflect similar—if not more pronounced—trends of rural depopulation and urban concentration. As a result, even in the absence of additional sealing, the soil sealing per capita value is expected to continue increasing in the future in most municipalities across all three Baltic states.

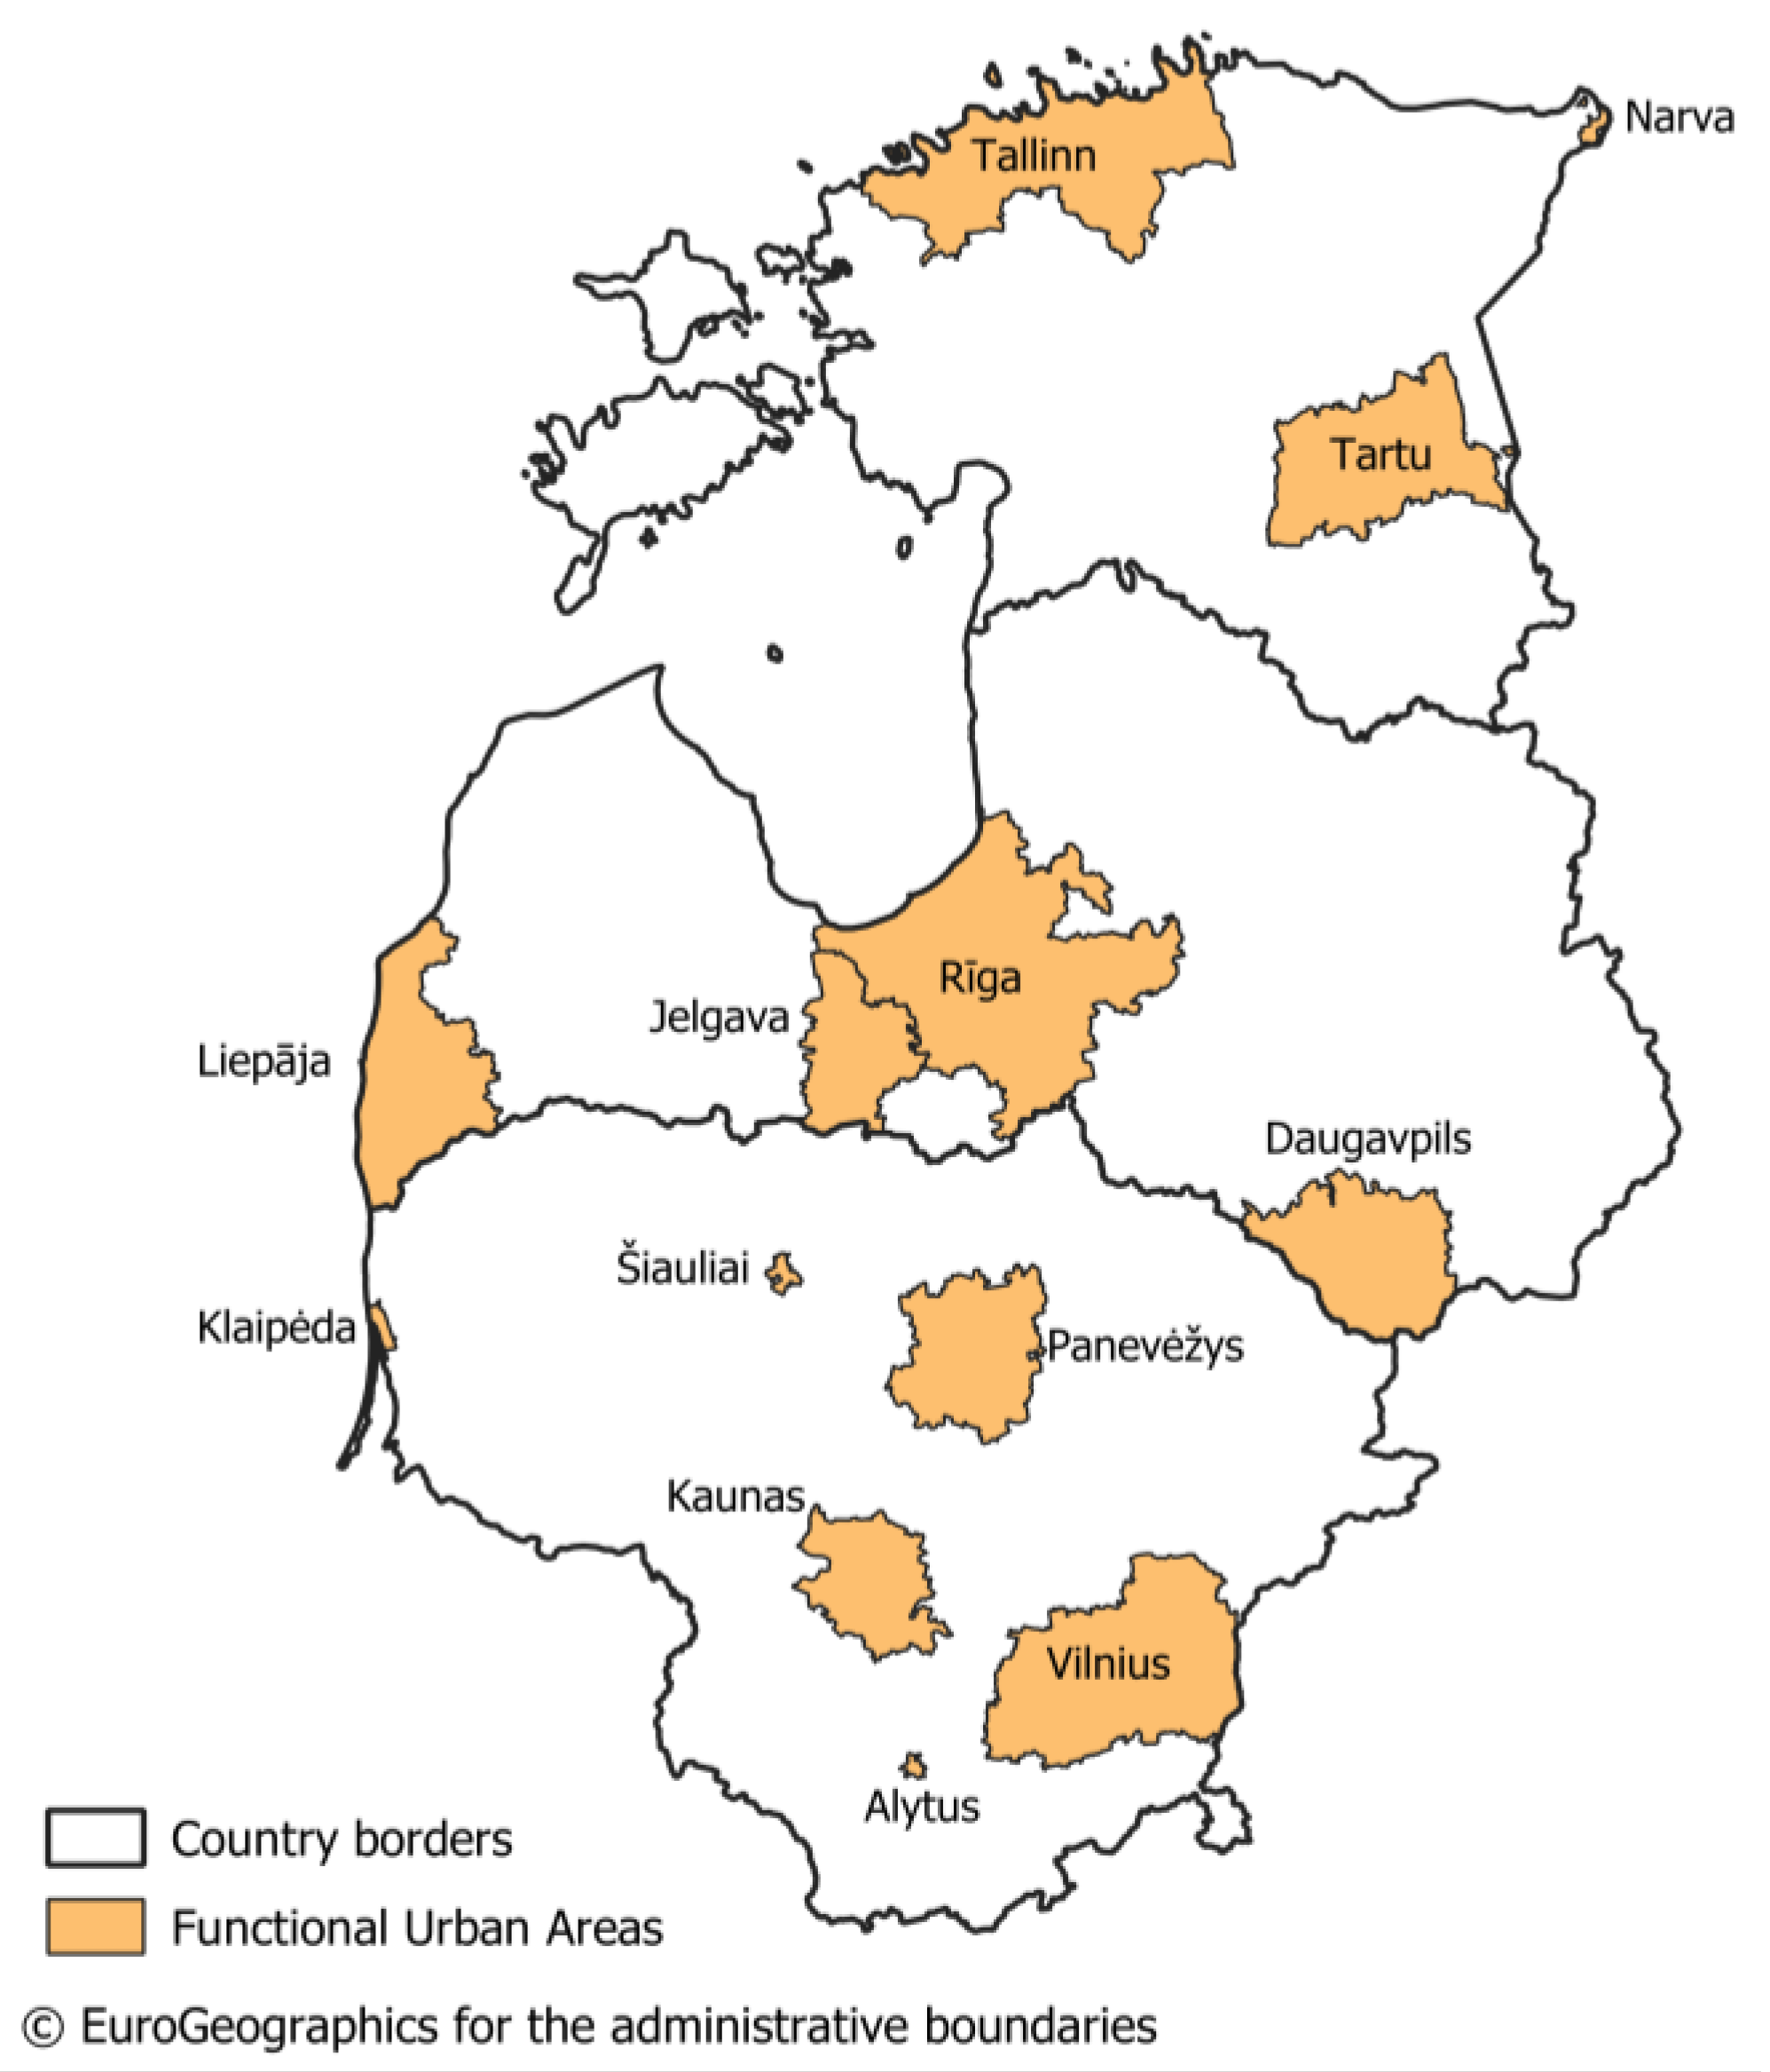
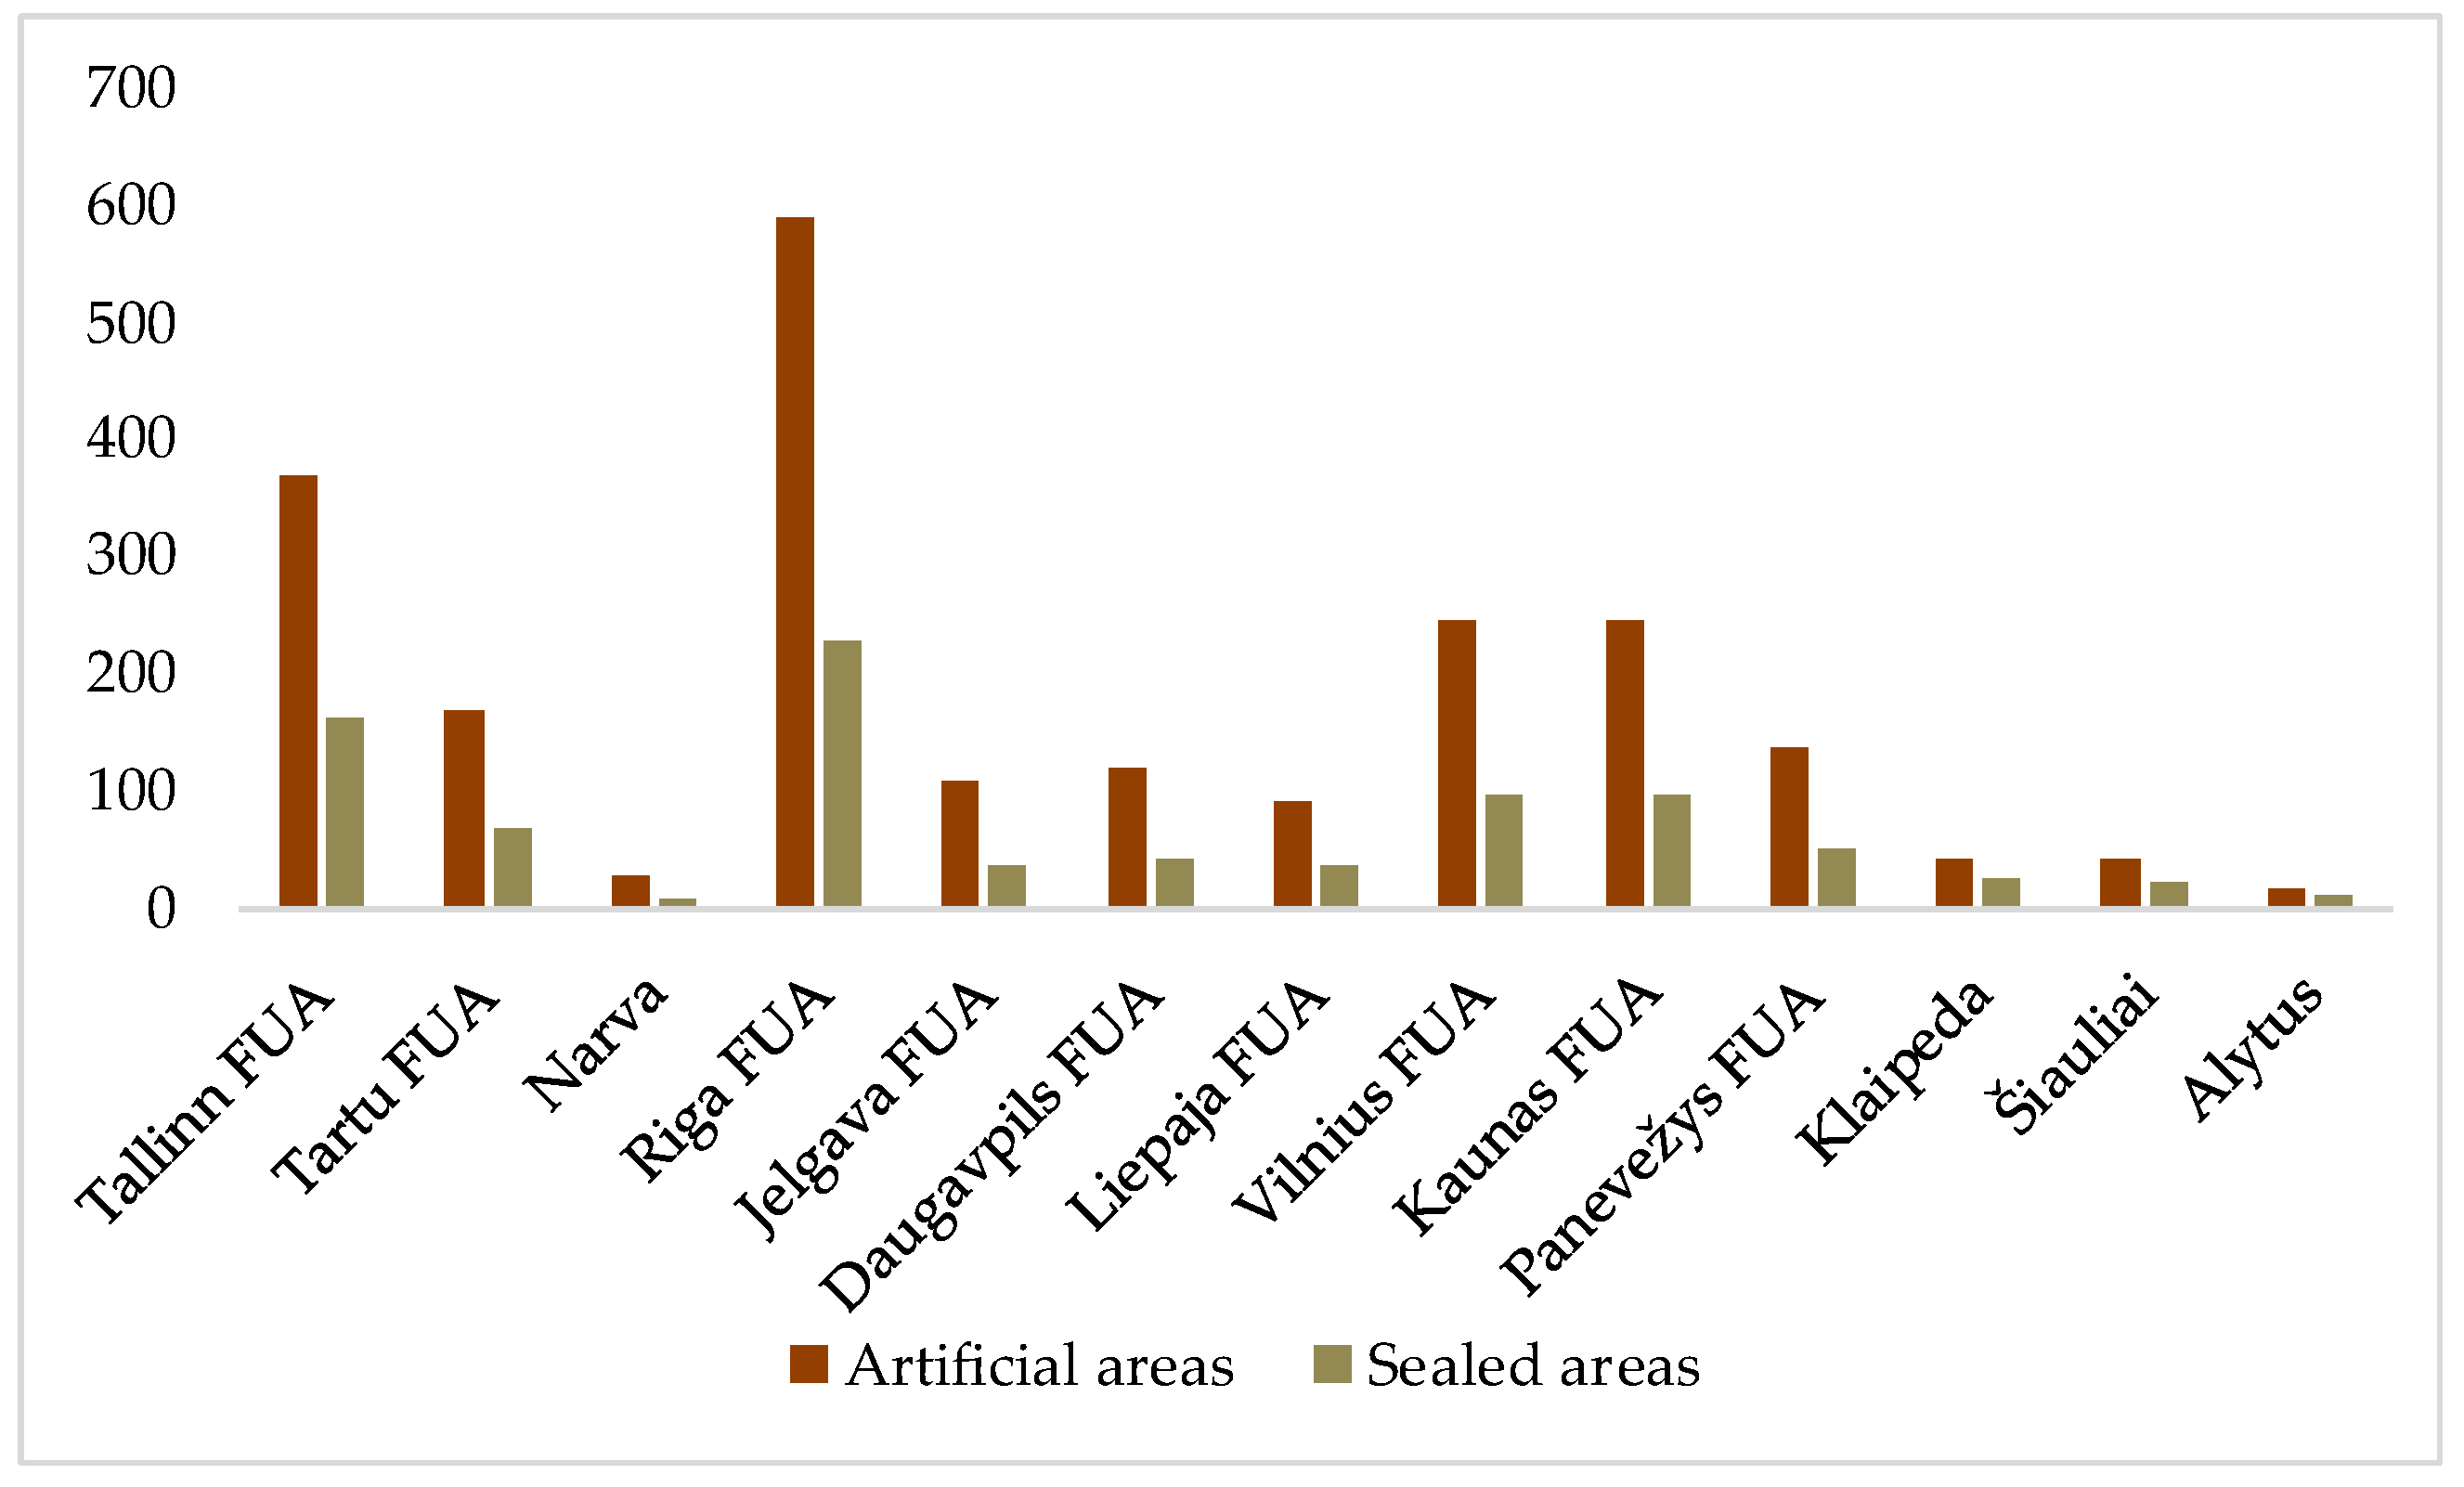
4.3. Land in Artificial Use and Sealed Soils in UA-Covered Regions

Currently, the EEA monitors net land take using the UA dataset, which prioritises areas where land take is most concentrated—78% of land take occurs within Functional Urban Areas (FUAs) [21]. The UA dataset specifically covers cities with 50,000 or more inhabitants and their surrounding FUAs. For defining the FUA-s, the approach developed by the Directorate General Regional and Urban Policy (REGIO) of the European Commission is implemented [77]. UA covers three areas in Estonia, four in Latvia and six in Lithuania (Figure 8).
It is essential to note that, while the UA dataset offers thematic detail and high accuracy in urban contexts, it still reflects certain methodological constraints. As a vector-based dataset with a minimum mapping unit of 0.25 ha for urban classes and 1 ha for rural classes [77], it may overlook small-scale land take or sealing events, particularly in rural or fragmented urban peripheries. These generalisations must be considered when comparing UA-based artificial land with raster-based sealing data from CLC+ BB, which assigns a single dominant land cover class per 10 m pixel.
When the Baltic-wide map depicting soil sealing increase alongside population trends is compared with the UA dataset, it becomes evident that UA struggles to accurately identify land take and soil sealing hotspots in the Baltic states. Although UA is designed for monitoring land take rather than soil sealing, these two processes are closely linked. The UA becomes less suitable for monitoring land take—understood as land artificialisation—if the definition of artificial land from the draft Soil Monitoring and Resilience Directive is adopted. According to the directive, “artificial land” means “land used as a platform for constructions and infrastructure or as a direct source of raw material or as an archive for historic patrimony, at the expense of the capacity of soils to provide other ecosystem services” [18] (art 3(16)).
This definition brings land take and soil sealing closer than ever before, potentially blurring the distinction between the two. Previously, land take encompassed a broader category of artificial land, including green urban areas and leisure spaces that were not necessarily sealed, and urban fabric was treated as whole, regardless of the land cover (be it green gardens, houses, or pawed streets). On average, the extent of artificial areas in UA-covered regions of the Baltic states was approximately 2.5 times greater than the area classified as sealed by the CLC+ BB dataset according to data from the 2018 reference year (Figure 9). Relying solely on sealing data may present land-consuming suburban development in a more favourable light than compact urban growth, as it overlooks the extensive land take associated with low-density expansion where large areas are converted without being fully sealed.
In Estonia, UA covers approximately 16% of the country’s area, including Tallinn and its surrounding Harju County, Tartu City and Tartu County, and Narva (only within city limits). Narva, however, is a declining city with minimal land take, meaning it does not contribute significantly to the overall indicator [12]. Pärnu and Viljandi, where population and soil sealing levels are increasing, would deserve more attention. However, since they do not meet the criteria for 50,000 inhabitants, these areas are not included in the UA. In absolute numbers, Tallinn FUA experienced 16.8 km2 of land take between 2012 and 2018, Tartu FUA 4.9 km2, and Narva 0.8 km2.
In Latvia, UA covers approximately 20% of the country’s area, including Riga and its surrounding region (Saulkrasti, Ādaži, Ropaži, Salaspils, Ogre, Ķekava, part of Sigulda, and part of Bauska municipalities), Jelgava City and Jelgava Municipality, Daugavpils and its surrounding Augšdaugava Municipality, and Liepāja with its surrounding area (part of South Kurzeme). Jelgava, Liepāja, and Daugavpils are all shrinking cities. In Liepaja and Daugavpils, soil sealing has increased by less than 5%. In contrast, Jelgava and several other municipalities in central Latvia have seen increases of over 5%. Since the FUAs of Daugavpils and Liepāja together account for 8% of Latvia’s total area—just under half of the entire UA-covered area in the country—their low land take offsets the high land take in the Riga FUA. As a result, summary statistics paint a more optimistic picture of the land take situation than the actual intensity of urban sprawl, which is heavily concentrated around Riga. In absolute numbers, Riga FUA experienced 10.4 km2 of land take between 2012 and 2018, Jelgava FUA 4.2 km2, Liepaja FUA 1.7 km2, and Daugavpils FUA 0.9 km2.
In Lithuania, Urban Atlas covers approximately 13% of the country’s area, including Vilnius and its surroundings (Vilnius District, Elektrėnai, and Trakai Municipalities), Kaunas and Kaunas District Municipality, Panevėžys and Panevėžys District Municipality, as well as the cities of Klaipėda, Šiauliai, and Alytus. Panevėžys and Šiauliai are declining areas, where soil sealing increased by up to 5% compared to 2018. However, in Klaipėda, where Urban Atlas covers only the city itself, population growth and soil sealing rates are among the highest in Lithuania, particularly in the municipalities of Neringa, Klaipėda District, and Palanga, which Urban Atlas does not capture. In absolute numbers, Vilnius FUA experienced 24.3 km2 of land take between 2012 and 2018, Kaunas FUA 16.1 km2, Panevežys FUA 3.1 km2. The cities of Klaipėda, Šiauliai, and Alytus had a land take of 1.4 km2, 1.0 km2, and 0.3 km2, respectively.

5. Discussion

Previous studies have shown that while population growth is one of the most evident factors driving land take [78], urban expansion can also occur despite population decline [79]. In addition to demographic trends, socio-cultural and economic factors [78,80,81] play a significant role. Moreover, planning systems [2,63] and planning cultures [82] vary in their effectiveness in restraining land take.
An analysis of German regions suggests that neither a decline nor an ageing population necessarily reduces land consumption for housing and transportation [79]. Similarly, across different measurement frameworks—whether land use efficiency, sealing per capita, or absolute land take—analyses consistently show that land consumption in the Baltic states has continued to grow despite declining populations. One important contextual factor is the housing shortage inherited from the Soviet period, particularly in urban areas, where demand long outpaced supply and housing options have been limited in both quality and diversity [60]. Following independence, this structural deficit was met with a deregulated planning environment, growing popular preference for suburban living, and, from the early 2000s onwards, economic growth and rising household incomes that enabled many families to pursue new housing opportunities [83,84].
Our analysis confirms that soil sealing has increased in nearly all Baltic municipalities, both urban and rural, and largely irrespective of demographic trends. When measured as a per capita value, shrinking regions tend to perform increasingly poorly, as sealed area remains constant or grows while the population decreases. Decoville and Feltgen highlight how such regions face significant challenges in reducing or stabilising artificial land cover. While renaturation of former industrial sites, demolition of abandoned buildings, and infrastructure removal could help reduce sealed surfaces, these processes are often costly, and shrinking municipalities lack the financial capacity to implement them [1,30].
In this context, many peripheral municipalities in the Baltic states have continued to promote greenfield development as a more affordable and politically attractive alternative to complex redevelopment. A combination of limited planning capacity, optimistic growth strategies, and the legacy of uncoordinated land use decisions during the post-socialist transition drives this tendency. Even where population decline is ongoing, new developments are often pursued in hopes of attracting residents or investment, while underused brownfield areas remain unaddressed.
Although the experience of European countries that have successfully limited land take shows that voluntary targets rarely lead to the desired outcomes [4], the historically shaped regional and demographic conditions in the Baltic states make it particularly difficult to introduce binding obligations. A top-down approach to reducing land take or soil sealing may not be perceived as fair—especially by shrinking municipalities—which reflects a broader challenge in environmental governance: the perceived legitimacy of protective measures often hinges on whether the burdens are shared equitably, and the voices of affected communities are meaningfully included [85,86]. The ongoing metropolisation in all three Baltic states further complicates this, as it reinforces territorial disparities. In this context, ensuring that land take reduction strategies are both context-sensitive and perceived as fair is essential for fostering local cooperation and long-term success.
The draft Soil Monitoring and Resilience Directive presents a conceptual challenge to the previously emerging consensus that land take and soil sealing, although related, are distinct processes requiring different monitoring approaches [5,25]. Traditionally, land take has referred to the broader conversion of natural, agricultural, or semi-natural areas into artificial land use—whether fully sealed or not—whereas soil sealing explicitly denotes the covering of soil with impermeable materials. This distinction has been essential for capturing the full scope of land artificialisation and its environmental impacts.
By redefining land take in terms nearly identical to soil sealing—i.e., land used for construction, infrastructure, or other uses that impair ecosystem services—the directive risks narrowing the scope of monitoring and policy attention. If adopted into national frameworks, this shift may not only amplify perceptions of unfairness among shrinking rural municipalities (which appear worse in per capita indicators despite little new land use) but also undermine the visibility of unsustainable land consumption patterns in expanding suburban areas. Such a shift could allow policymakers to focus narrowly on sealing metrics and lose sight of broader land artificialisation, including greenfield development and landscape fragmentation, which pose serious risks to biodiversity, food security [8], and regional cohesion [87]. As shown in the French case, the outcomes of local performance evaluations are strongly shaped by how land take is defined and measured. In France, the use of detailed national land use registers includes private gardens in land take statistics [65], reflecting a broader understanding of artificialisation than that proposed in the draft directive.
Since no Baltic state has yet developed a national framework for monitoring land take and soil sealing, all three are dependent on CLMS data. The CLC+ BB covers entire countries with accurate soil sealing data [1,23], while UA provides land take estimates. However, UA only covers selected functional urban areas and overlooks many locations where rapid spatial development occurs. Therefore, the Baltic states must develop national monitoring frameworks that combine consistent, context-aware definitions with comprehensive data coverage, enabling them to accurately assess land use dynamics and design spatial planning policies that are both environmentally and regionally balanced.

6. Conclusions

This study examined recent trends in soil sealing in Estonia, Latvia, and Lithuania in the context of demographic shifts, local planning frameworks, and emerging EU-level policy developments. By analysing CLC+ BB data for 2018–2021 alongside municipal-level demographic statistics, the research highlighted a disconnect between population change and the expansion of sealed surfaces.
The findings underscore that land use dynamics in the Baltic states are shaped by complex factors beyond population growth, including suburbanisation around capital cities, uneven regional development, and local planning practices. In both shrinking and growing municipalities, greenfield development remains a common pattern. However, shrinking municipalities face an additional structural disadvantage: with declining populations, their performance in terms of soil sealing per capita inevitably worsens. At the same time, they typically lack the financial and administrative capacity to reinvest in existing built environments or to re-naturalise disused or degraded areas, many of which are brownfields inherited from the Soviet era. As a result, these areas are caught in a cycle of land use inefficiency that current policy instruments do little to break.
To better understand and address these challenges, future research should incorporate in-depth case studies of municipalities with varying demographic and spatial trends. Such studies should examine the drivers behind land take and soil sealing at the local level and assess the capacity of planning instruments to respond effectively. Additionally, more attention should be given to the perspectives and decisions of landowners and land users, as their engagement is critical in shaping sustainable land use outcomes.
As the EU moves toward binding measures to reduce land take and monitor soil health, the evolving definitions—particularly the convergence of land take and soil sealing—present both conceptual and practical challenges. Without clear and consistent national monitoring frameworks, the Baltic countries rely on pan-European datasets that, while valuable, have notable limitations. For future land policy to be effective and perceived as legitimate, it must be context-sensitive and fair. The burden of land take reduction cannot fall disproportionately on shrinking regions, nor should performance evaluations rely on narrow or inconsistent definitions that obscure broader patterns of landscape transformation. The Baltic states need to establish national monitoring systems that are both accurate and suited to their specific territorial and demographic context.
This paper does not attempt to offer a one-size-fits-all solution but calls for critical attention to the definitions, data tools, and governance mechanisms that shape how land take is understood and managed. By integrating soil sealing data with demographic and planning contexts, the Baltic states can move toward more informed and equitable land use policies—before binding EU targets make such adaptation imperative.

Author Contributions

Conceptualization, K.M., K.P., A.A. and E.J.; methodology, K.M. and K.P.; validation, K.M., K.P., A.A. and E.J.; formal analysis, K.M.; investigation, K.M. and K.P.; resources, A.A. and E.J.; writing—original draft preparation, K.M. and K.P.; writing—review and editing, A.A. and E.J.; visualisation, K.M. and K.P.; supervision, E.J. All authors have read and agreed to the published version of the manuscript.

Funding

This research received no external funding.

Data Availability Statement

All data used in this study are publicly available through official databases.

Conflicts of Interest

The authors declare no conflicts of interest.

Abbreviations

The following abbreviations are used in this manuscript:
NNLTNo net land take
EEAEuropean Environment Agency
GDPGross domestic product
CLMSCopernicus Land Monitoring Service
CLC+ BBCorine Land Cover Plus Backbone
UAUrban Atlas

References

  1. Decoville, A.; Feltgen, V. Towards a Credible, Relevant and Legitimate Implementation Framework for the EU No Net Land Take Objective. J. Environ. Plan. Manag. 2025, 2024, 1–21. [Google Scholar] [CrossRef]
  2. Berisha, E.; Cotella, G.; Janin Rivolin, U.; Solly, A. Spatial Governance and Planning Systems Vis-à-Vis Land Consumption in Europe. Eur. Plan. Stud. 2024, 32, 553–568. [Google Scholar] [CrossRef]
  3. Decoville, A.; Schneider, M. Can the 2050 Zero Land Take Objective of the EU Be Reliably Monitored? A Comparative Study. J. Land Use Sci. 2016, 11, 331–349. [Google Scholar] [CrossRef]
  4. Lacoere, P.; Decoville, A.; Delattre, R.; Melot, R.; Grimski, D.; Schamann, M.; Halleux, J.-M. National Introduction of No Net Land Take: A Comparative Study of Five Pioneering Countries Seeking to Limit Their Land Consumption. Town Plan. Rev. 2025, 96, 347–371. [Google Scholar] [CrossRef]
  5. Marquard, E.; Bartke, S.; Gifreu i Font, J.; Humer, A.; Jonkman, A.; Jürgenson, E.; Marot, N.; Poelmans, L.; Repe, B.; Rybski, R.; et al. Land Consumption and Land Take: Enhancing Conceptual Clarity for Evaluating Spatial Governance in the EU Context. Sustainability 2020, 12, 8269. [Google Scholar] [CrossRef]
  6. Sannier, C.; Ivits, E.; Maucha, G.; Maes, J.; Dijkstra, L. Harmonized Pan-European Time Series for Monitoring Soil Sealing. Land 2024, 13, 1087. [Google Scholar] [CrossRef]
  7. Tobias, S.; Conen, F.; Duss, A.; Wenzel, L.M.; Buser, C.; Alewell, C. Soil Sealing and Unsealing: State of the Art and Examples. Land Degrad. Dev. 2018, 29, 2015–2024. [Google Scholar] [CrossRef]
  8. Gradinaru, S.R.; Paraschiv, M.; Iojă, C.I.; Vliet, J.V. Conflicting Interests between Local Governments and the European Target of No Net Land Take. Environ. Sci. Policy 2023, 142, 1–11. [Google Scholar] [CrossRef]
  9. European Commission. Communication from the Commission to The European Parliament, the Council, the European Economic and Social Committee and The Committee of the Regions. Roadmap to a Resource Efficient Europe 2011. Available online: http://eur-lex.europa.eu/legal-content/EN/TXT/?uri=CELEX:52011DC0571 (accessed on 15 February 2025).
  10. Schiavina, M.; Melchiorri, M.; Corbane, C.; Freire, S.; Batista e Silva, F. Built-up Areas Are Expanding Faster than Population Growth: Regional Patterns and Trajectories in Europe. J. Land Use Sci. 2022, 17, 591–608. [Google Scholar] [CrossRef]
  11. Auziņš, A.; Brokking, P.; Jürgenson, E.; Lakovskis, P.; Paulsson, J.; Romanovs, A.; Valciukiene, J.; Viesturs, J.; Weinger, K. Land Resource Management Policy in Selected European Countries. Land 2022, 11, 2280. [Google Scholar] [CrossRef]
  12. Jürgenson, E.; Metsoja, K.; Põdra, K. The Evolution of Land Take in Estonia since 1991: The Need for Regulations and Consistent Data Collection Methods. Town Plan. Rev. 2025, 96, 443–467. [Google Scholar] [CrossRef]
  13. Riik Hakkab Koostöös Teadusasutustega Arendama Kestlikku Maahõive Seire-Ja Juhtimissüsteemi|Keskkonnaagentuur. Available online: https://keskkonnaagentuur.ee/node/1547 (accessed on 30 March 2025).
  14. Maasikamäe, S.; Hass, H.; Jürgenson, E. The Impact of Uncontrolled Development on the Use of Arable Land. In Proceedings of the Fifth International Scientific Conference: Rural Development, Akademija, Lithuania, 24–25 November 2011; Volume 5, book 2. pp. 446–451. [Google Scholar]
  15. Puzulis, A.; Skinkis, P. Suburban Settlements in the Context of Urban Policy: Latvian Example. Eur. Integr. Stud. 2010, 2010, 153–158. [Google Scholar]
  16. Maasikamäe, S.; Jürgenson, E.; Mandel, M.; Veeroja, P. Determination of Valuable Agricultural Land in the Frame of Preparation of Countiwide Spatial Plans: Estonian Experiences and Challenges. In Economic Science for Rural Development; 36, Proceedings of the Economic Science for Rural Development, Jelgava, Latvia, 24–25 April 2014; Mazure, G., Ed.; Latvia University of Agriculture: Jelgava, Latvia, 2014; pp. 77–85. [Google Scholar]
  17. Aleknavičius, P.; Aleknavičius, M. Problems in Managing Agricultural Land in Lithuania. In Proceedings of the Rural Development 2009: 4th International Scientific Conference, Akademija, Lithuania, 15–17 October 2009; Volume 4, pp. 106–110. [Google Scholar]
  18. European Commission. Proposal for a Directive of the European Parliament and of the Council on Soil Monitoring and Resilience (Soil Monitoring Law). COM(2023) 416 Final. 5 July 2023. Available online: https://eur-lex.europa.eu/legal-content/EN/TXT/?qid=1750307385623&uri=CELEX%3A52023PC0416 (accessed on 12 February 2025).
  19. Prokop, G.; Jobstmann, H.; Schönbauer, A. Overview of Best Practices for Limiting Soil Sealing or Mitigating Its Effects in EU-27. Final Report. 2011. Eur. Communities 2011, 227, 24. [Google Scholar]
  20. Spatial Pattern of Land Take in the EEA-39, 2000–2018. Available online: https://www.eea.europa.eu/en/analysis/maps-and-charts/spatial-pattern-of-land-take (accessed on 16 May 2025).
  21. Net Land Take in Cities and Commuting Zones in Europe. Available online: https://www.eea.europa.eu/en/analysis/indicators/net-land-take-in-cities (accessed on 6 March 2025).
  22. European Environment Agency. Imperviousness and Imperviousness Change in Europe. Available online: https://www.eea.europa.eu/en/analysis/indicators/imperviousness-and-imperviousness-change-in-europe (accessed on 20 February 2025).
  23. Maucha, G.; Kerékgyártó, E.; Turos, V.; Sannier, C.; Dufek, J.; Soukup, T.; Ivits, E. Analysis of Usability of Imperviousness and CLC+ Backbone Data for Mapping Sealed Areas. 2024. Available online: https://www.google.com/url?sa=t&source=web&rct=j&opi=89978449&url=https://www.eionet.europa.eu/etcs/etc-di/products/etc-di-products/etc-di-report-2024-3-analysis-of-usability-of-imperviousness-and-clc-backbone-data-for-mapping-sealed-areas/%40%40download/file/REGIND_D1.1_Report_24012024_v1.0_1107.pdf&ved=2ahUKEwjc_aSb0s2OAxXIn2MGHcAGK70QFnoECBwQAQ&usg=AOvVaw1tFxH0Z9I5L9vW5BnSgFpe (accessed on 1 February 2025).
  24. UN-Habitat. SDG Indicator 11.3.1 Training Module: Land Use Efficiency. 2018. Available online: https://unstats.un.org/sdgs/metadata/files/Metadata-11-03-01.pdf (accessed on 15 February 2025).
  25. Evers, D. Exploring the Implications of ‘No Net Land Take’ Policy for Spatial Planning: The Case of the Netherlands. Town Plan. Rev. 2025, 96, 373–394. [Google Scholar] [CrossRef]
  26. Salin, M.; de L’Estoile, E. Who Takes the Land? Quantifying the Use of Built-Up Land by French Economic Sectors to Assess Their Vulnerability to the ‘No Net Land Take’ Policy. Banque de France Working Paper No. 941, 2024. Available online: http://dx.doi.org/10.2139/ssrn.4958846 (accessed on 2 July 2025). [CrossRef]
  27. D’Ascanio, R.; Desjardins, X.; Devos, T.; Dupont, V.; Estèbe, P.; Leclercq, A.; Palazzo, A.; Roose, A.; Sadowy, K.; Siedentop, S.; et al. ESPON “No Net Land Take—Policies and Practices in European Regions”: Main Administrative, Economic, Political or Social Challenges to Implement No Net Land Take; ESPON EGTC: Luxembourg, 2024; p. 88. [Google Scholar]
  28. Cotella, G.; Evers, D.; Janin Rivolin, U.; Solly, A.; Berisha, E. ESPON SUPER—Sustainable Urbanisation and Land-Use Practices in European Regions. A Guide to Sustainable Urbanisation and Land-Use; ESPON EGTC: Luxembourg, 2020; ISBN 978-2-919795-40-6. [Google Scholar]
  29. Eurostat. Population Density by NUTS 3 Region 2022. Available online: https://ec.europa.eu/eurostat/databrowser/view/DEMO_R_D3DENS/default/map?lang=en (accessed on 20 September 2024).
  30. OECD. Shrinking Smartly in Estonia: Prepearing Regions for Demographic Change; OECD: Paris, France, 2022. [Google Scholar]
  31. Aksoy, E.; Gregor, M.; Schröder, C.; Löhnertz, M.; Louwagie, G. Assessing and Analysing the Impact of Land Take Pressures on Arable Land. Solid Earth 2017, 8, 683–695. [Google Scholar] [CrossRef]
  32. Kemper, T.; Politis, P.; Pesaresi, M.; Siragusa, A.; Corbane, C.; European Commission: Joint Research Centre. LUE User Guide—A Tool to Calculate the Land Use Efficiency and the SDG 11.3 Indicator with the Global Human Settlement Layer; Publications Office: Luxembourg, 2017. [Google Scholar]
  33. Schiavina, M.; Melchiorri, M.; Corbane, C.; Florczyk, A.J.; Freire, S.; Pesaresi, M.; Kemper, T. Multi-Scale Estimation of Land Use Efficiency (SDG 11.3.1) across 25 Years Using Global Open and Free Data. Sustainability 2019, 11, 5674. [Google Scholar] [CrossRef]
  34. Lang, T.; Burneica, D.; Noorkõiv, R.; Plüschke-Altof, B.; Pociūtė-Sereikienė, G.; Sechi, G. Socio-Spatial Polarisation and Policy Response: Perspectives for Regional Development in the Baltic States. European Urban and Regional Studies 2022, 29, 21–44. [Google Scholar] [CrossRef]
  35. Eberhardt, P. Ethnic Groups and Population Changes in Twentieth Century Eastern Europe: History, Data and Analysis, 1st ed.; Routledge: London, UK; New York, NY, USA, 2003. [Google Scholar]
  36. Annist, A. The Worshippers of Rules: Defining the Right and Wrong in Local Participatory Project Applications in Estonia. In The Aid Effect: Giving and Governing in International Development; Mosse, D., Lewis, D., Eds.; Pluto Publishers: London, UK, 2005; pp. 150–170. [Google Scholar]
  37. Tiit, E.-M. Eesti Rahvastiku 100 Aastat; Post Factum: Tallinn, Estonia, 2018. [Google Scholar]
  38. Statistics Estonia. RVR03: Migration by Sex, Age Group and Type of Migration. Available online: https://andmed.stat.ee:443/pxweb/en/stat/stat__rahvastik__rahvastikusundmused__ranne/RVR03.px/ (accessed on 11 January 2024).
  39. Oficialiosios Statistikos Portalas. Rodiklių Duomenų Bazė. Available online: https://osp.stat.gov.lt/statistiniu-rodikliu-analize#/ (accessed on 5 June 2025).
  40. Central Statistical Bureauf Latvia. Population at the Beginning of Year, Population Change and Key Vital Statistics 1920–2025. Available online: https://data.stat.gov.lv:443/pxweb/en/OSP_PUB/START__POP__IR__IRS/IRS010/ (accessed on 5 June 2025).
  41. Statistics Estonia. RV0240: Population by Sex, Age and Place of residence. Available online: https://andmed.stat.ee/en/stat/rahvastik__rahvastikunaitajad-ja-koosseis__rahvaarv-ja-rahvastiku-koosseis/RV0240 (accessed on 5 June 2025).
  42. OECD. Shrinking Smartly and Sustainably: Strategies for Action; OECD Rural Studies; OECD Publishing: Paris, France, 2025; p. 94. [Google Scholar]
  43. Berzins, A.; Zvidrins, P. Depopulation in the Baltic States. Liet. Stat. Darb. 2011, 50, 1. [Google Scholar] [CrossRef]
  44. Hirt, S.; Stanilov, K. Twenty Years of Transition: The Evolution of Urban Planning in Eastern Europe and the Former Soviet Union, 1989–2009; Human Settlements Global Dialogue Series; UN-Habitat: Nairobi, Kenya, 2009. [Google Scholar]
  45. Jasmand, S.; Stiller, S. Capital Cities in the New EU States—Economic Status Quo and Current Trends. Intereconomics 2005, 40, 298–304. [Google Scholar] [CrossRef]
  46. Ubarevičienė, R. City Systems in the Baltic States: The Soviet Legacy and Current Paths of Change. Eur. Reg. 2018, 25, 15–29. [Google Scholar]
  47. Raagmaa, G. Estonian Population and Regional Development during the Last 30 Years—Back to the Small Town? Reg. Sci. Policy Pract. 2023, 15, 826–844. [Google Scholar] [CrossRef]
  48. Plüschke-Altof, B.; Loewen, B.; Leetmaa, K. 1.2 Increasing Regional Polarisation in Estonia. In Estonian Human Development Report 2019/2020; Sooväli-Sepping, H., Ed.; Estonian Cooperation Assembly: Tallinn, Estonia, 2020; Available online: https://2020.inimareng.ee/en/increasing-regional-polarisation-in-estonia.html (accessed on 2 July 2025).
  49. Järv, H.; Raukas, A.; Sepp, K.; Raet, J.; Ward, R.D. Soviet Military Heritage: Brown and Green—Recovery and Enhancement. Struct. Stud. Repairs Maint. Herit. Archit. 2013, 131, 579–592. [Google Scholar]
  50. Tintěra, J.; Ruus, A.; Tohvri, E.; Kotval, Z. Urban Brownfields in Estonia: Scope, Consequences and Redevelopment Barriers as Perceived by Local Governments/ Urbánní Brownfieldy v Estonsku: Rozsah, Dopady a Revitalizační Bariéry z Pohledu Městských Samospráv. Morav. Geogr. Rep. 2015, 22, 25–38. [Google Scholar] [CrossRef]
  51. Burinskienė, M.; Bielinskas, V.; Podviezko, A.; Gurskienė, V.; Maliene, V. Evaluating the Significance of Criteria Contributing to Decision-Making on Brownfield Land Redevelopment Strategies in Urban Areas. Sustainability 2017, 9, 759. [Google Scholar] [CrossRef]
  52. Jankava, A.; Parsova, V.; Berzina, M.; Palabinska, A. Role of Brownfields Regeneration in Sustainable Use of Natural Resources. Balt. Surv. 2019, 11, 31–38. [Google Scholar] [CrossRef]
  53. Roose, A. 1.3 The Triumph of Planning Freedom in Suburban Estonia. In Estonian Human Development Report 2019/2020; Sooväli-Sepping, H., Ed.; Estonian Cooperation Assembly: Tallinn, Estonia, 2020; Available online: https://2020.inimareng.ee/en/the-triumph-of-planning-freedom-in-suburban-estonia.html (accessed on 2 July 2025).
  54. Cotella, G.; Berisha, E.; Casavola, D.; Katuric, I.; Gregar, M.; Simov, S.; Lipovac, R.; Gaupp-Berghausen, M.; Andronic, C.; Evers, D. SUPER—Sustainable Urbanization and Land-Use Practices in European Regions Lithuania—Spin-off Final Report; ESPON EGTC: Luxembourg, 2021; ISBN 978-2-919795-75-8. [Google Scholar]
  55. Parliament Planning Act 2015. Available online: https://www.riigiteataja.ee/en/eli/527062016001/consolide (accessed on 1 February 2025).
  56. Saeima. Teritorijas Attīstības Plānošanas Likums. Available online: https://likumi.lv/ta/id/238807-teritorijas-attistibas-planosanas-likums (accessed on 17 June 2025).
  57. Lietuvos Respublikos Seimo Kanceliarija. Republic of Lithuania Law on Territorial Planning. Available online: https://e-seimas.lrs.lt/portal/legalAct/lt/TAD/dde75b13095011e78dacb175b73de379?jfwid=uk68maulc (accessed on 17 June 2025).
  58. Adams, N.; Cotella, G.; Nunes, R. The Engagement of Territorial Knowledge Communities with European Spatial Planning and the Territorial Cohesion Debate: A Baltic Perspective. Eur. Plan. Stud. 2014, 22, 712–734. [Google Scholar] [CrossRef]
  59. Raagmaa, G.; Stead, D. Spatial Planning in the Baltic States: Impacts of European Policies. Eur. Plan. Stud. 2014, 22, 671–679. [Google Scholar] [CrossRef]
  60. Gentile, M. The Rise and Demise of the Soviet-Made Housing Shortage in the Baltic Countries. In Housing Estates in the Baltic Countries: The Legacy of Central Planning in Estonia, Latvia and Lithuania; Hess, D.B., Tammaru, T., Eds.; Springer International Publishing: Cham, Germany, 2019; pp. 51–70. ISBN 978-3-030-23392-1. [Google Scholar]
  61. Auziņš, A.; Jürgenson, E.; Burinskiené, M. Comparative Analysis of Spatial Planning Systems and Practices: Changes and Continuity in Baltic Countries. In Methods and Consepts of land Management; European Academy of Land Use and Development: Stockholm, Sweden, 2020; pp. 13–22. [Google Scholar]
  62. Konsultatsioonid, I.; Rake, T.Ü.; OÜ, H.K. Arengu Ruumiline Ja Strateegiline Kavandamine, Sh Regionaaltasandi Funktsioonid Ruumilise Arengu Suunamisel. 2017. Available online: https://skytte.ut.ee/sites/default/files/2022-08/arengu_ruumiline_ja_strateegiline_kavandamine_aruanne_2017-12-28_viimane.pdf (accessed on 2 June 2025).
  63. Lacoere, P.; Leinfelder, H. Land Oversupply. How Rigid Land-Use Planning and Legal Certainty Hinder New Policy for Flanders. Eur. Plan. Stud. 2023, 31, 1926–1948. [Google Scholar] [CrossRef]
  64. Nowak, M.; Petrisor, A.-I.; Mitrea, A.; Kovács, K.F.; Lukstina, G.; Jürgenson, E.; Ladzianska, Z.; Simeonova, V.; Lozynskyy, R.; Rezac, V.; et al. The Role of Spatial Plans Adopted at the Local Level in the Spatial Planning Systems of Central and Eastern European Countries. Land 2022, 11, 1599. [Google Scholar] [CrossRef]
  65. France Stratégie. Objectif ZAN: Quelles Stratégies Régionales? 2024. Available online: https://www.strategie-plan.gouv.fr/publications/objectif-zan-strategies-regionales (accessed on 21 March 2025).
  66. Pesaresi, M.; Schiavina, M.; Politis, P.; Freire, S.; Krasnodębska, K.; Uhl, J.H.; Carioli, A.; Corbane, C.; Dijkstra, L.; Florio, P.; et al. Advances on the Global Human Settlement Layer by Joint Assessment of Earth Observation and Population Survey Data. Int. J. Digit. Earth 2024, 17, 2390454. [Google Scholar] [CrossRef]
  67. Center for International Earth Science Information Network. Available online: https://www.ciesin.columbia.edu/data/hrsl/ (accessed on 17 July 2025).
  68. Global Human Settlement—GHSL Homepage—European Commission. Available online: https://human-settlement.emergency.copernicus.eu/ (accessed on 17 July 2025).
  69. Global Urban Areas. Available online: https://dataforgood.facebook.com/dfg/tools/globalurbanareas (accessed on 17 July 2025).
  70. Congedo, L. Semi-Automatic Classification Plugin: A Python Tool for the Download and Processing of Remote Sensing Images in QGIS. J. Open Source Softw. 2021, 6, 3172. [Google Scholar] [CrossRef]
  71. European Environment Agency. CLC+ Backbone Product Specification and User Manual for CLC+ Backbone Raster Product 2021. 2024. Available online: https://land.copernicus.eu/en/technical-library/product-user-manual-clc-backbone-2021 (accessed on 20 February 2025).
  72. CLMS Portfolio. Available online: https://land.copernicus.eu/en/products (accessed on 20 February 2025).
  73. Eurostat. Local Administrative Units (LAU)—GISCO. Available online: https://ec.europa.eu/eurostat/web/gisco/geodata/statistical-units/local-administrative-units (accessed on 17 June 2025).
  74. Üldteave—Kohtla-Järve Linnavalitsus. Available online: https://www.kohtla-jarve.ee/uldteave3 (accessed on 15 June 2025).
  75. Estonian Land and Spatial Development Board. X-GIS 2.0. Maainfo. Available online: https://xgis.maaamet.ee/xgis2/page/app/maainfo (accessed on 18 June 2025).
  76. Curtale, R.; Stut, M.; Alessandrini, A.; Deuster, C.; Batista e Silva, F.; Natale, F.; Dijkstra, L.; European Commission: Joint Research Centre. Outlook and Demographic Perspectives for EU’s Rural Regions. A Modelling-Based Exercise; European Commision: Brussels, Belgium, 2025. [Google Scholar]
  77. European Commission. Mapping Guide v6.3 for a European Urban Atlas. Available online: https://land.copernicus.eu/en/technical-library/urban_atlas_2012_2018_mapping_guide (accessed on 12 March 2025).
  78. Colsaet, A.; Laurans, Y.; Levrel, H. What Drives Land Take and Urban Land Expansion? A Systematic Review. Land Use Policy 2018, 79, 339–349. [Google Scholar] [CrossRef]
  79. Kroll, F.; Haase, D. Does Demographic Change Affect Land Use Patterns? A Case Study from Germany. Land Use Policy 2010, 27, 726–737. [Google Scholar] [CrossRef]
  80. Baing, A.S. Containing Urban Sprawl? Comparing Brownfield Reuse Policies in England and Germany. Int. Plan. Stud. 2010, 15, 25–35. [Google Scholar] [CrossRef]
  81. Filion, P.; Kramer, A.; Sands, G. Recentralization as an Alternative to Urban Dispersion: Transformative Planning in a Neoliberal Societal Context. Int. J. Urban Reg. Res. 2016, 40, 658–678. [Google Scholar] [CrossRef]
  82. Valler, D.; Phelps, N.A. Framing the Future: On Local Planning Cultures and Legacies. Plan. Theory Pract. 2018, 19, 698–716. [Google Scholar] [CrossRef]
  83. Krišjāne, Z.; Bērziņš, M.; Sechi, G.; Krūmiņš, J. Residential Change and Socio-Demographic Challenges for Large Housing Estates in Riga, Latvia. In Housing Estates in the Baltic Countries: The Legacy of Central Planning in Estonia, Latvia and Lithuania; Hess, D.B., Tammaru, T., Eds.; Springer International Publishing: Cham, Germany, 2019; pp. 225–245. ISBN 978-3-030-23392-1. [Google Scholar]
  84. Tammaru, T.; Leetmaa, K.; Silm, S.; Ahas, R. Temporal and Spatial Dynamics of the New Residential Areas around Tallinn. Eur. Plan. Stud. 2009, 17, 423–439. [Google Scholar] [CrossRef]
  85. Sterner, T.; Coria, J. Policy Instruments for Environmental and Natural Resource Management, 2nd ed.; RFF Press, Routledge: New York, NY, USA; London, UK, 2012; pp. 26–36. [Google Scholar]
  86. Schlosberg, D. Defining Environmental Justice: Theories, Movements, and Nature; Oxford University Press: Oxford, UK, 2009. [Google Scholar]
  87. Jones, R.; Moisio, S.; Weckroth, M.; Woods, M.; Luukkonen, J.; Meyer, F.; Miggelbrink, J. Re-Conceptualising Territorial Cohesion Through the Prism of Spatial Justice: Critical Perspectives on Academic and Policy Discourses. In Regional and Local Development in Times of Polarisation: Re-thinking Spatial Policies in Europe; Lang, T., Görmar, F., Eds.; Springer Nature: Singapore, 2019; pp. 97–119. ISBN 9789811311901. [Google Scholar]
Figure 1. Built-up area per capita change (%) from 2000 to 2014. Source: [30].
Land 14 01586 g001
Figure 2. Net land take in EU by land cover and country, 2012–2018 (in % of the total FUA surface in the country). Data from EEA [20].
Land 14 01586 g002
Figure 4. The location of Baltic states in Europe (own drawing with country borders from Eurostat).
Land 14 01586 g004
Figure 5. The change in population and sealed areas in municipalities in Estonia, Latvia and Lithuania between 2018 and 2021 (own drawing with country borders from Eurostat).
Land 14 01586 g005
Figure 6. Example of a classification inconsistency in the CLC+ Backbone dataset on the territory of Kohtla-Järve. In both panels, blue pixels from the overlay indicate areas classified in the 2021 dataset as having reverted to natural land cover and red pixels as having reverted from natural to sealed compared to 2018 dataset. Estonian Land and Spatial Development Board orthophotos (a) from 2018; (b) from 2021 [75].
Land 14 01586 g006
Figure 7. Sealed area per capita change between 2018 and 2021 in municipalities in Estonia, Latvia and Lithuania.
Land 14 01586 g007
Figure 8. Urban Atlas Functional Urban Areas in 2018 in Estonia, Latvia and Lithuania.
Land 14 01586 g008
Figure 9. Areas (km2) in artificial use (according to UA dataset) and sealed soils (from CLC+ Backbone) in FUAs of the Baltic countries in 2018.
Land 14 01586 g009
Disclaimer/Publisher’s Note: The statements, opinions and data contained in all publications are solely those of the individual author(s) and contributor(s) and not of MDPI and/or the editor(s). MDPI and/or the editor(s) disclaim responsibility for any injury to people or property resulting from any ideas, methods, instructions or products referred to in the content.

