


Mapping Multi-Crop Cropland Abandonment in Conflict-Affected Ukraine Based on MODIS Time Series Analysis

Abstract
1. Introduction
2. Materials
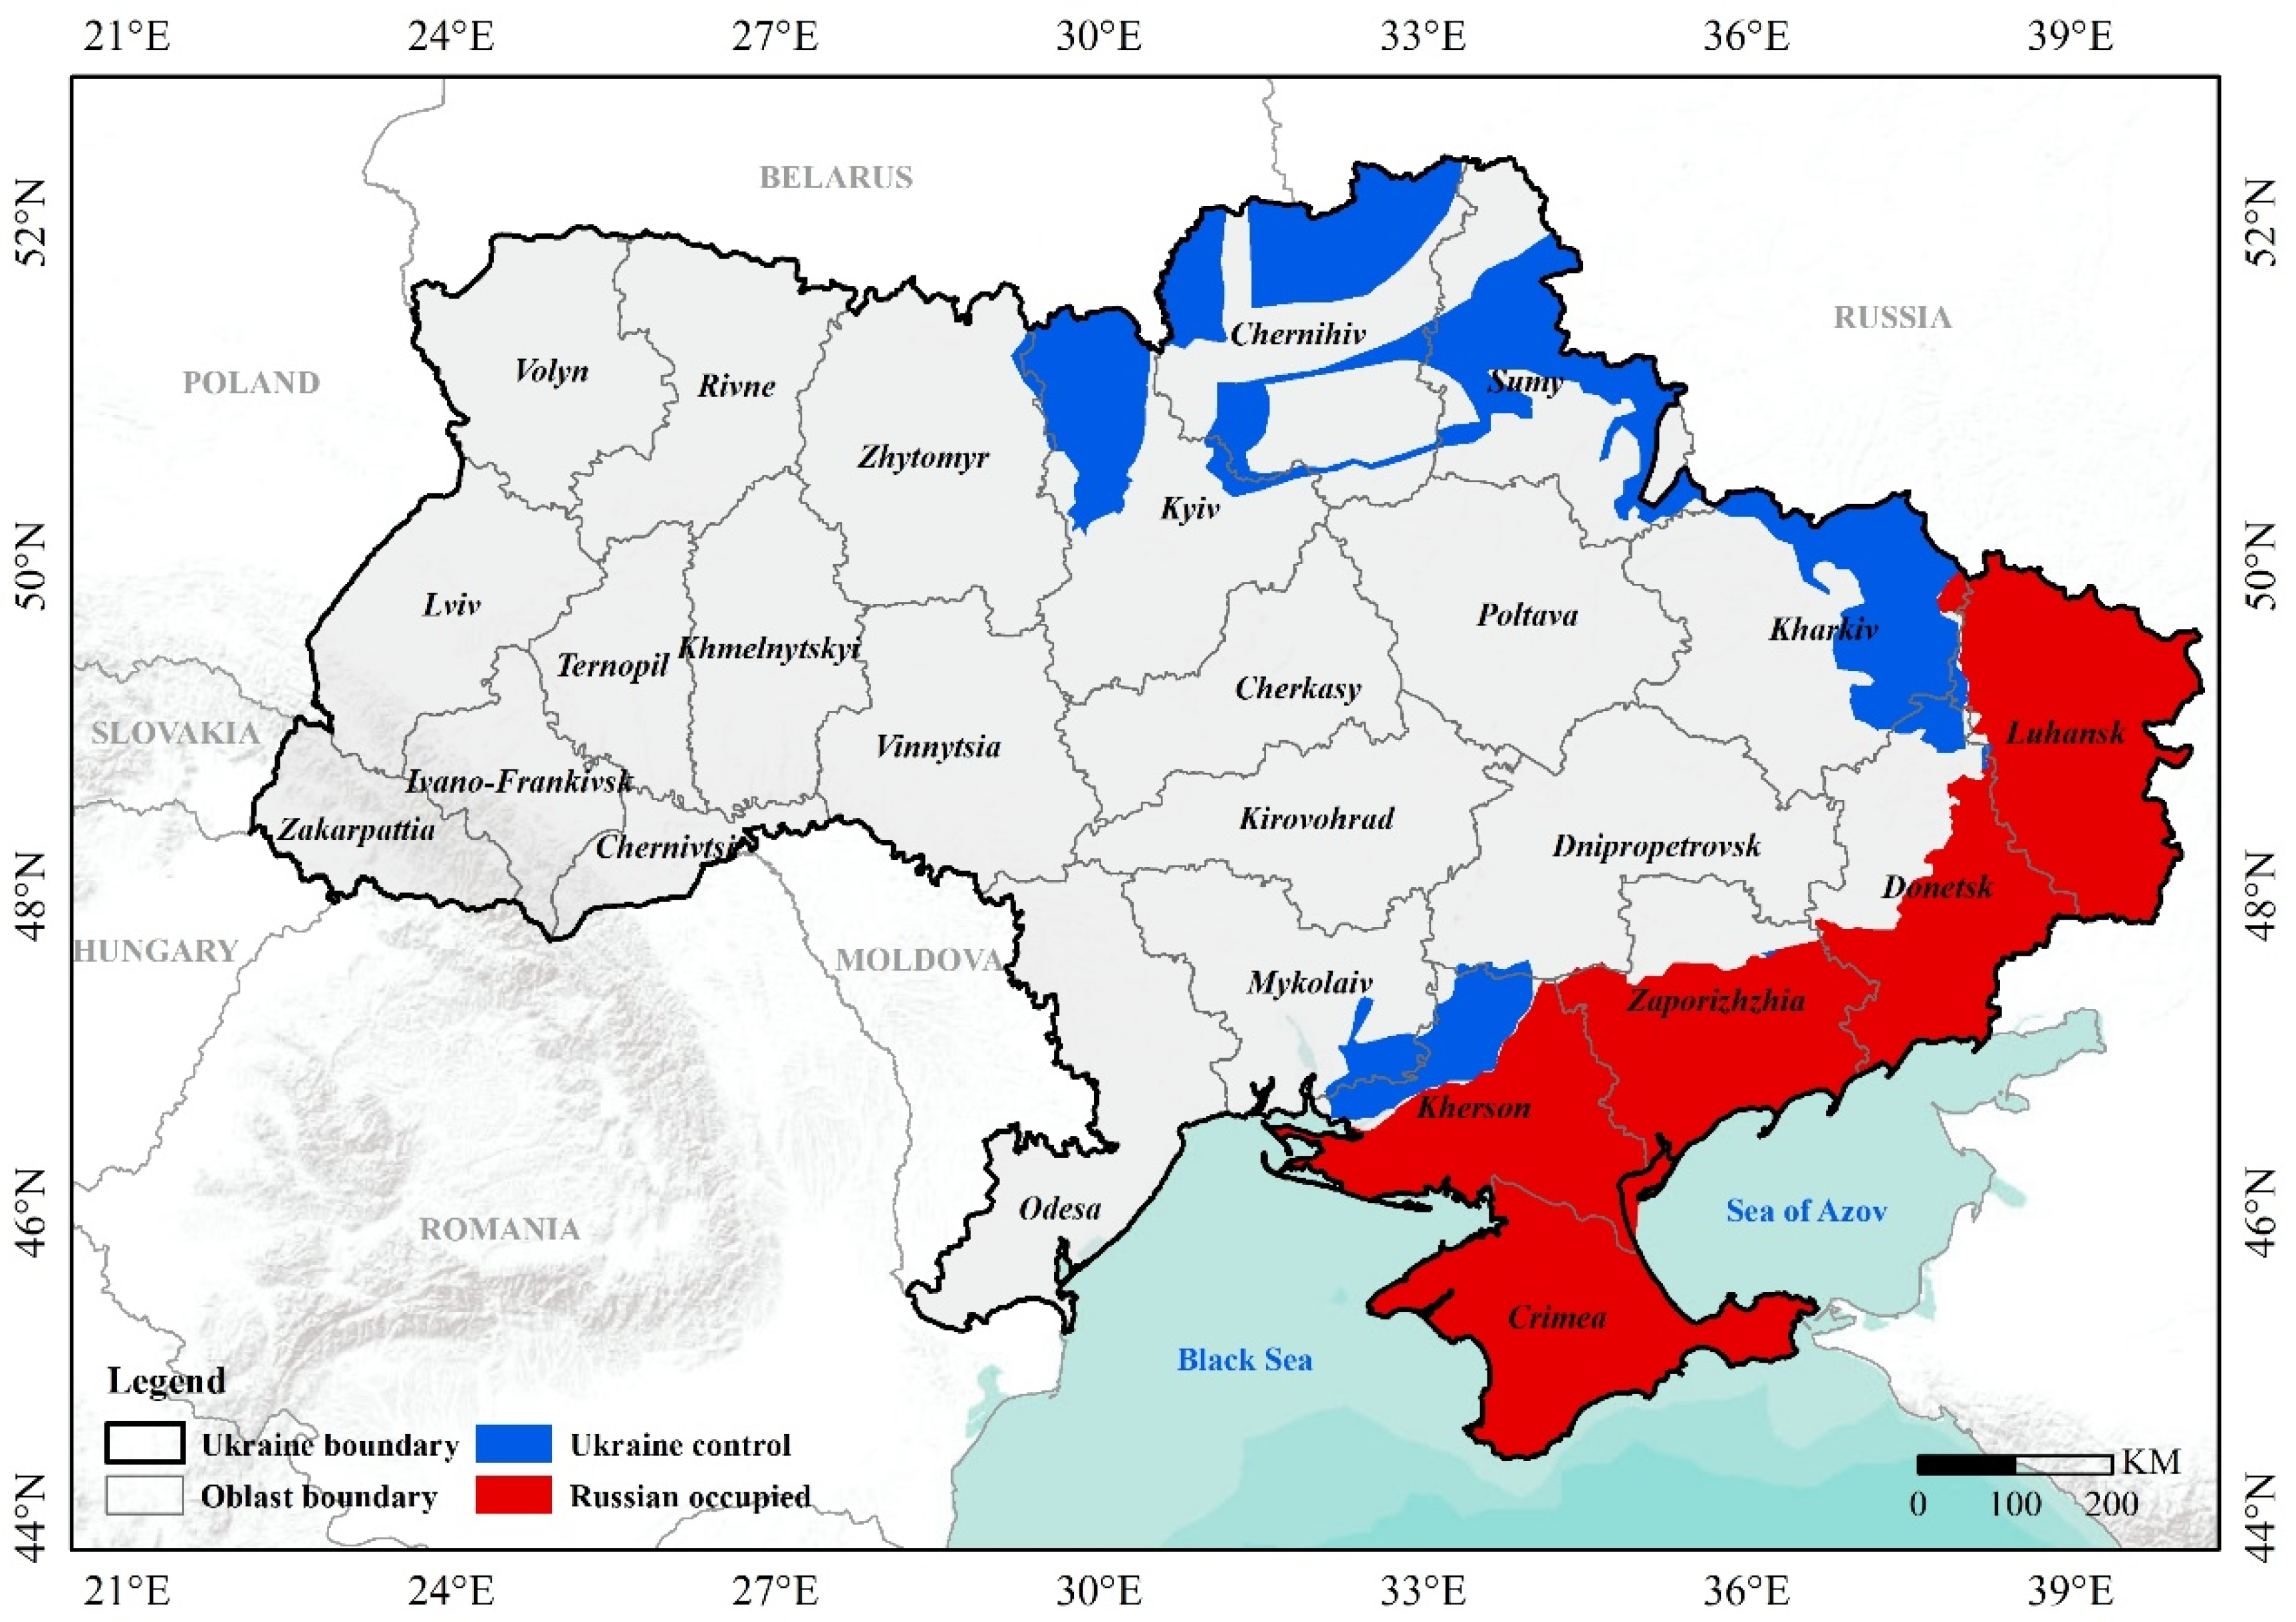
2.1. Study Area
2.2. Data Sources
2.3. Data Preprocessing
2.4. Validation Sample Preparation
3. Methods
3.1. Overview of Research Framework
3.2. Crop Type Classification
3.3. Period Segmentation
3.4. Bias-Weighted Time-Weighted Dynamic Time Warping (BTWDTW)
3.5. Abandoned Cropland Mapping
3.6. Accuracy Assessment
4. Results
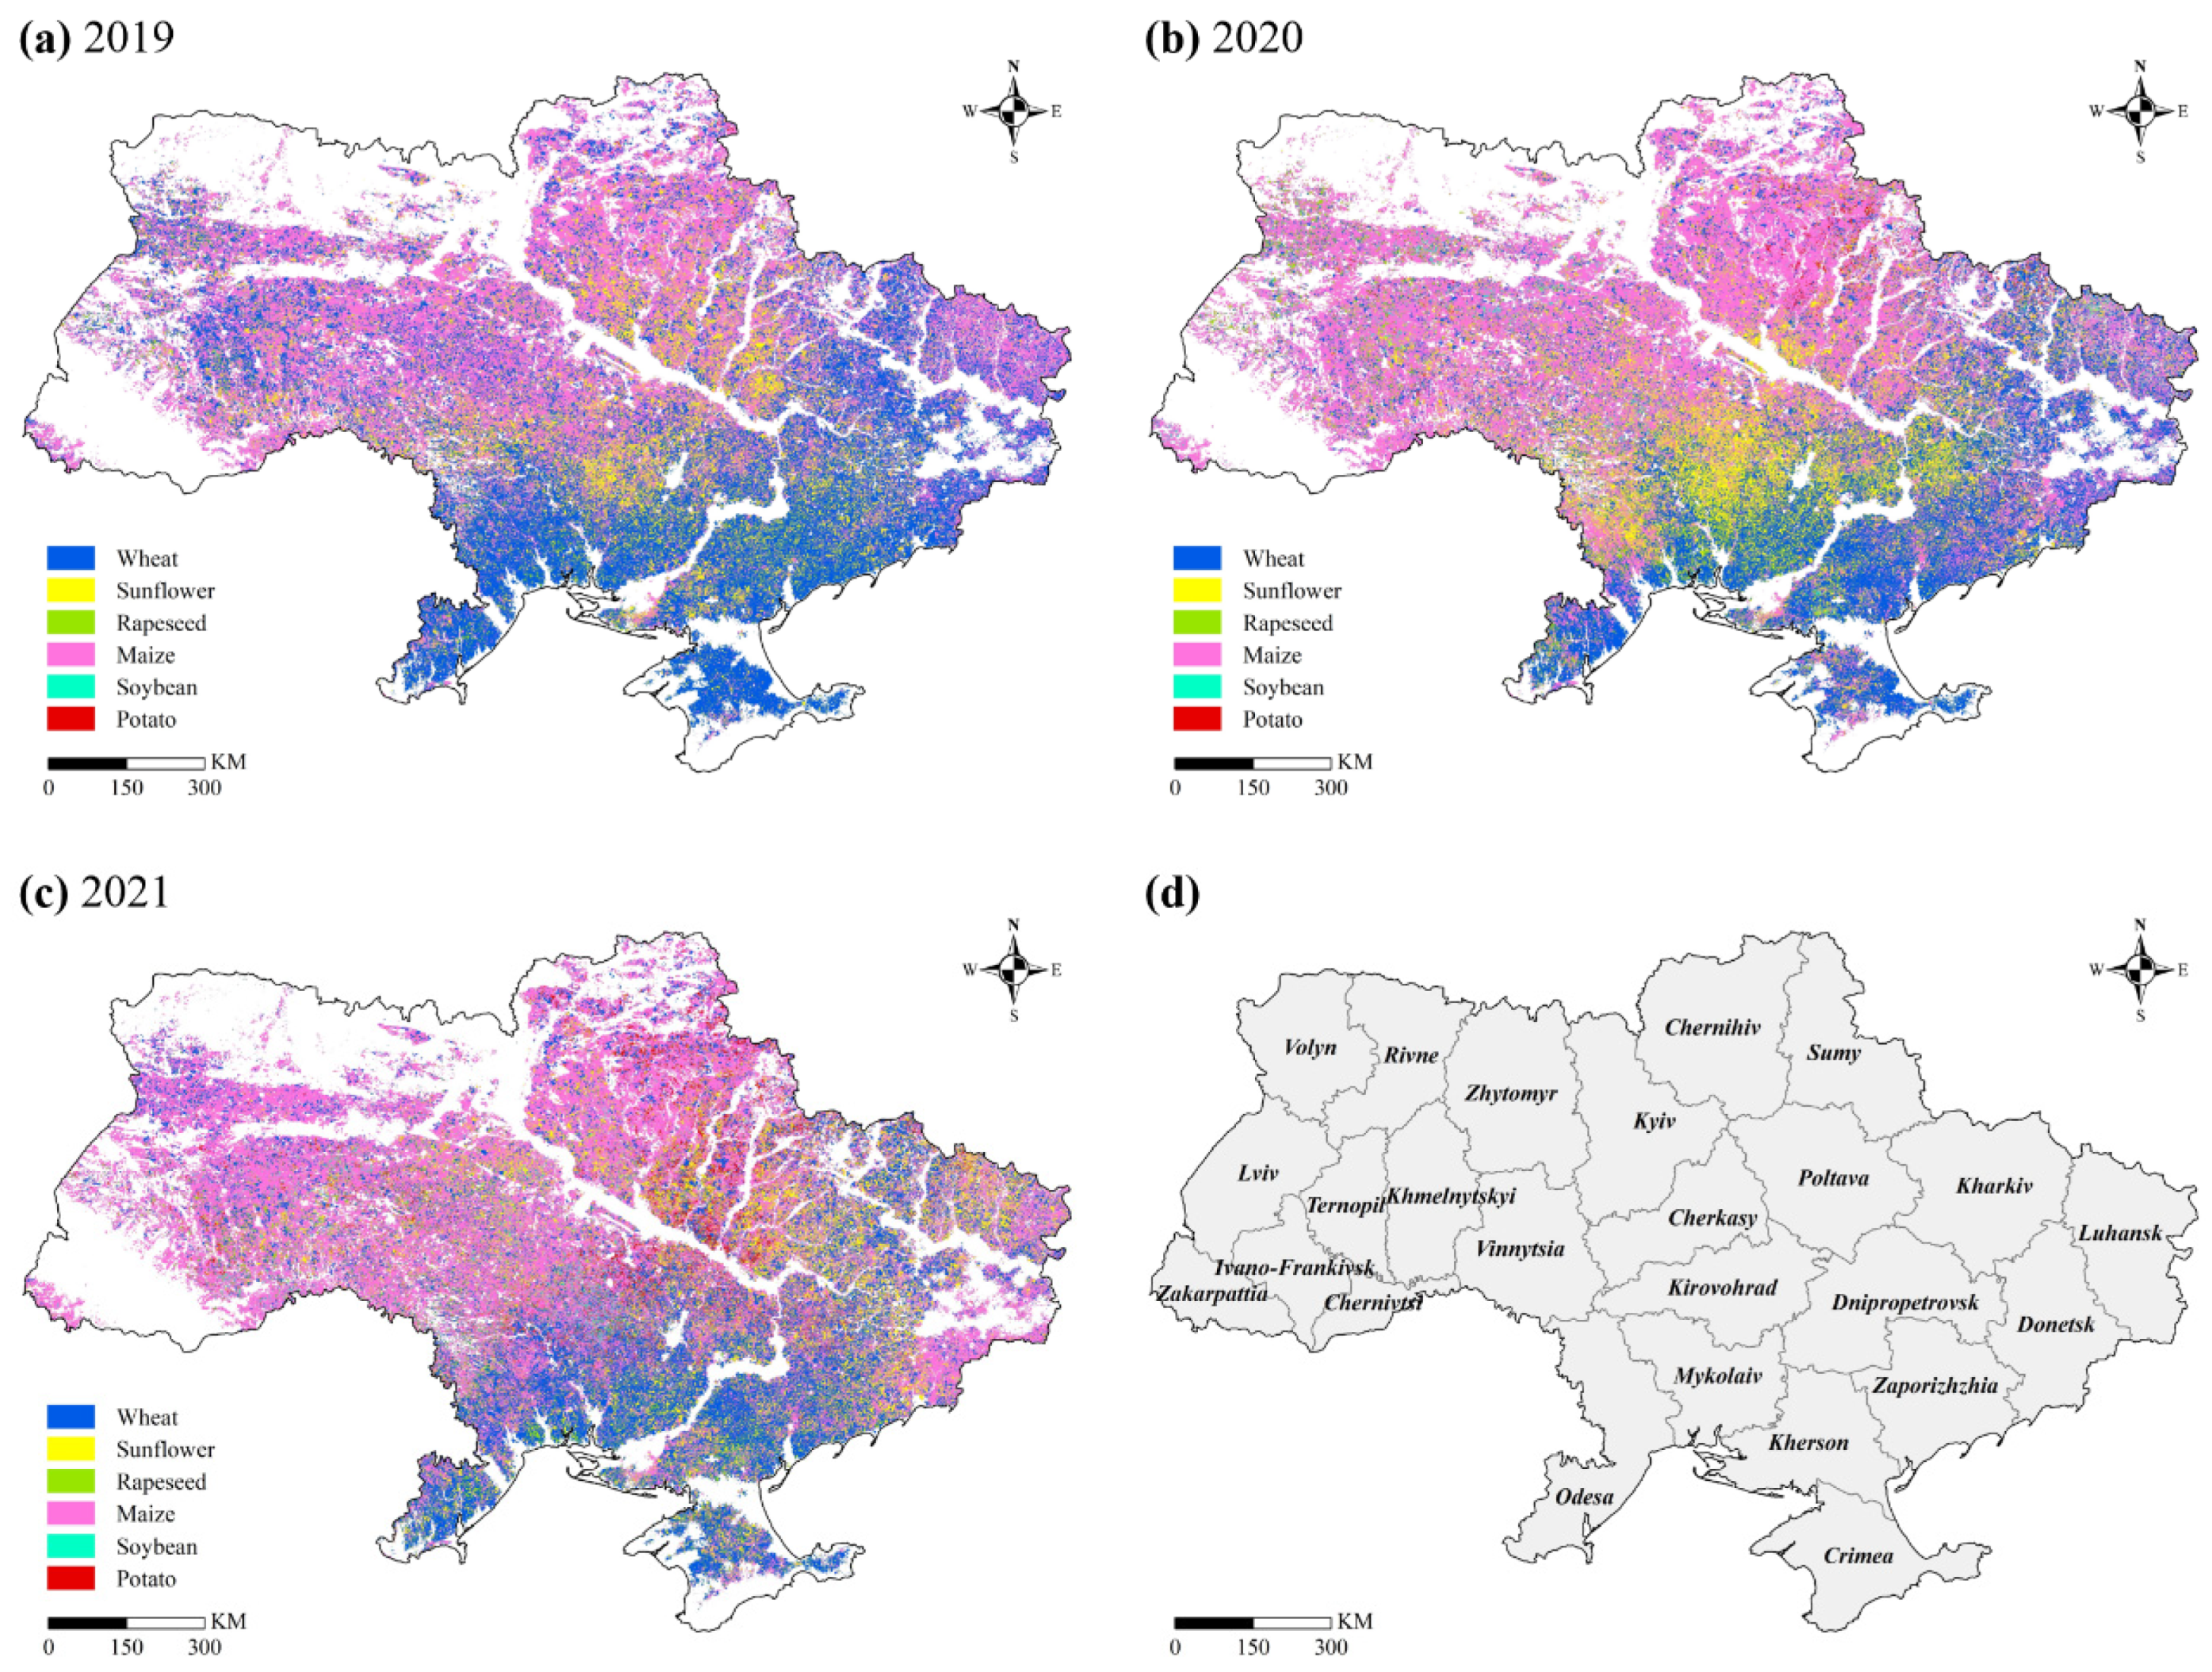
4.1. Pre-Conflict Crop Distribution
4.2. Post-Conflict Abandoned Cropland Distribution
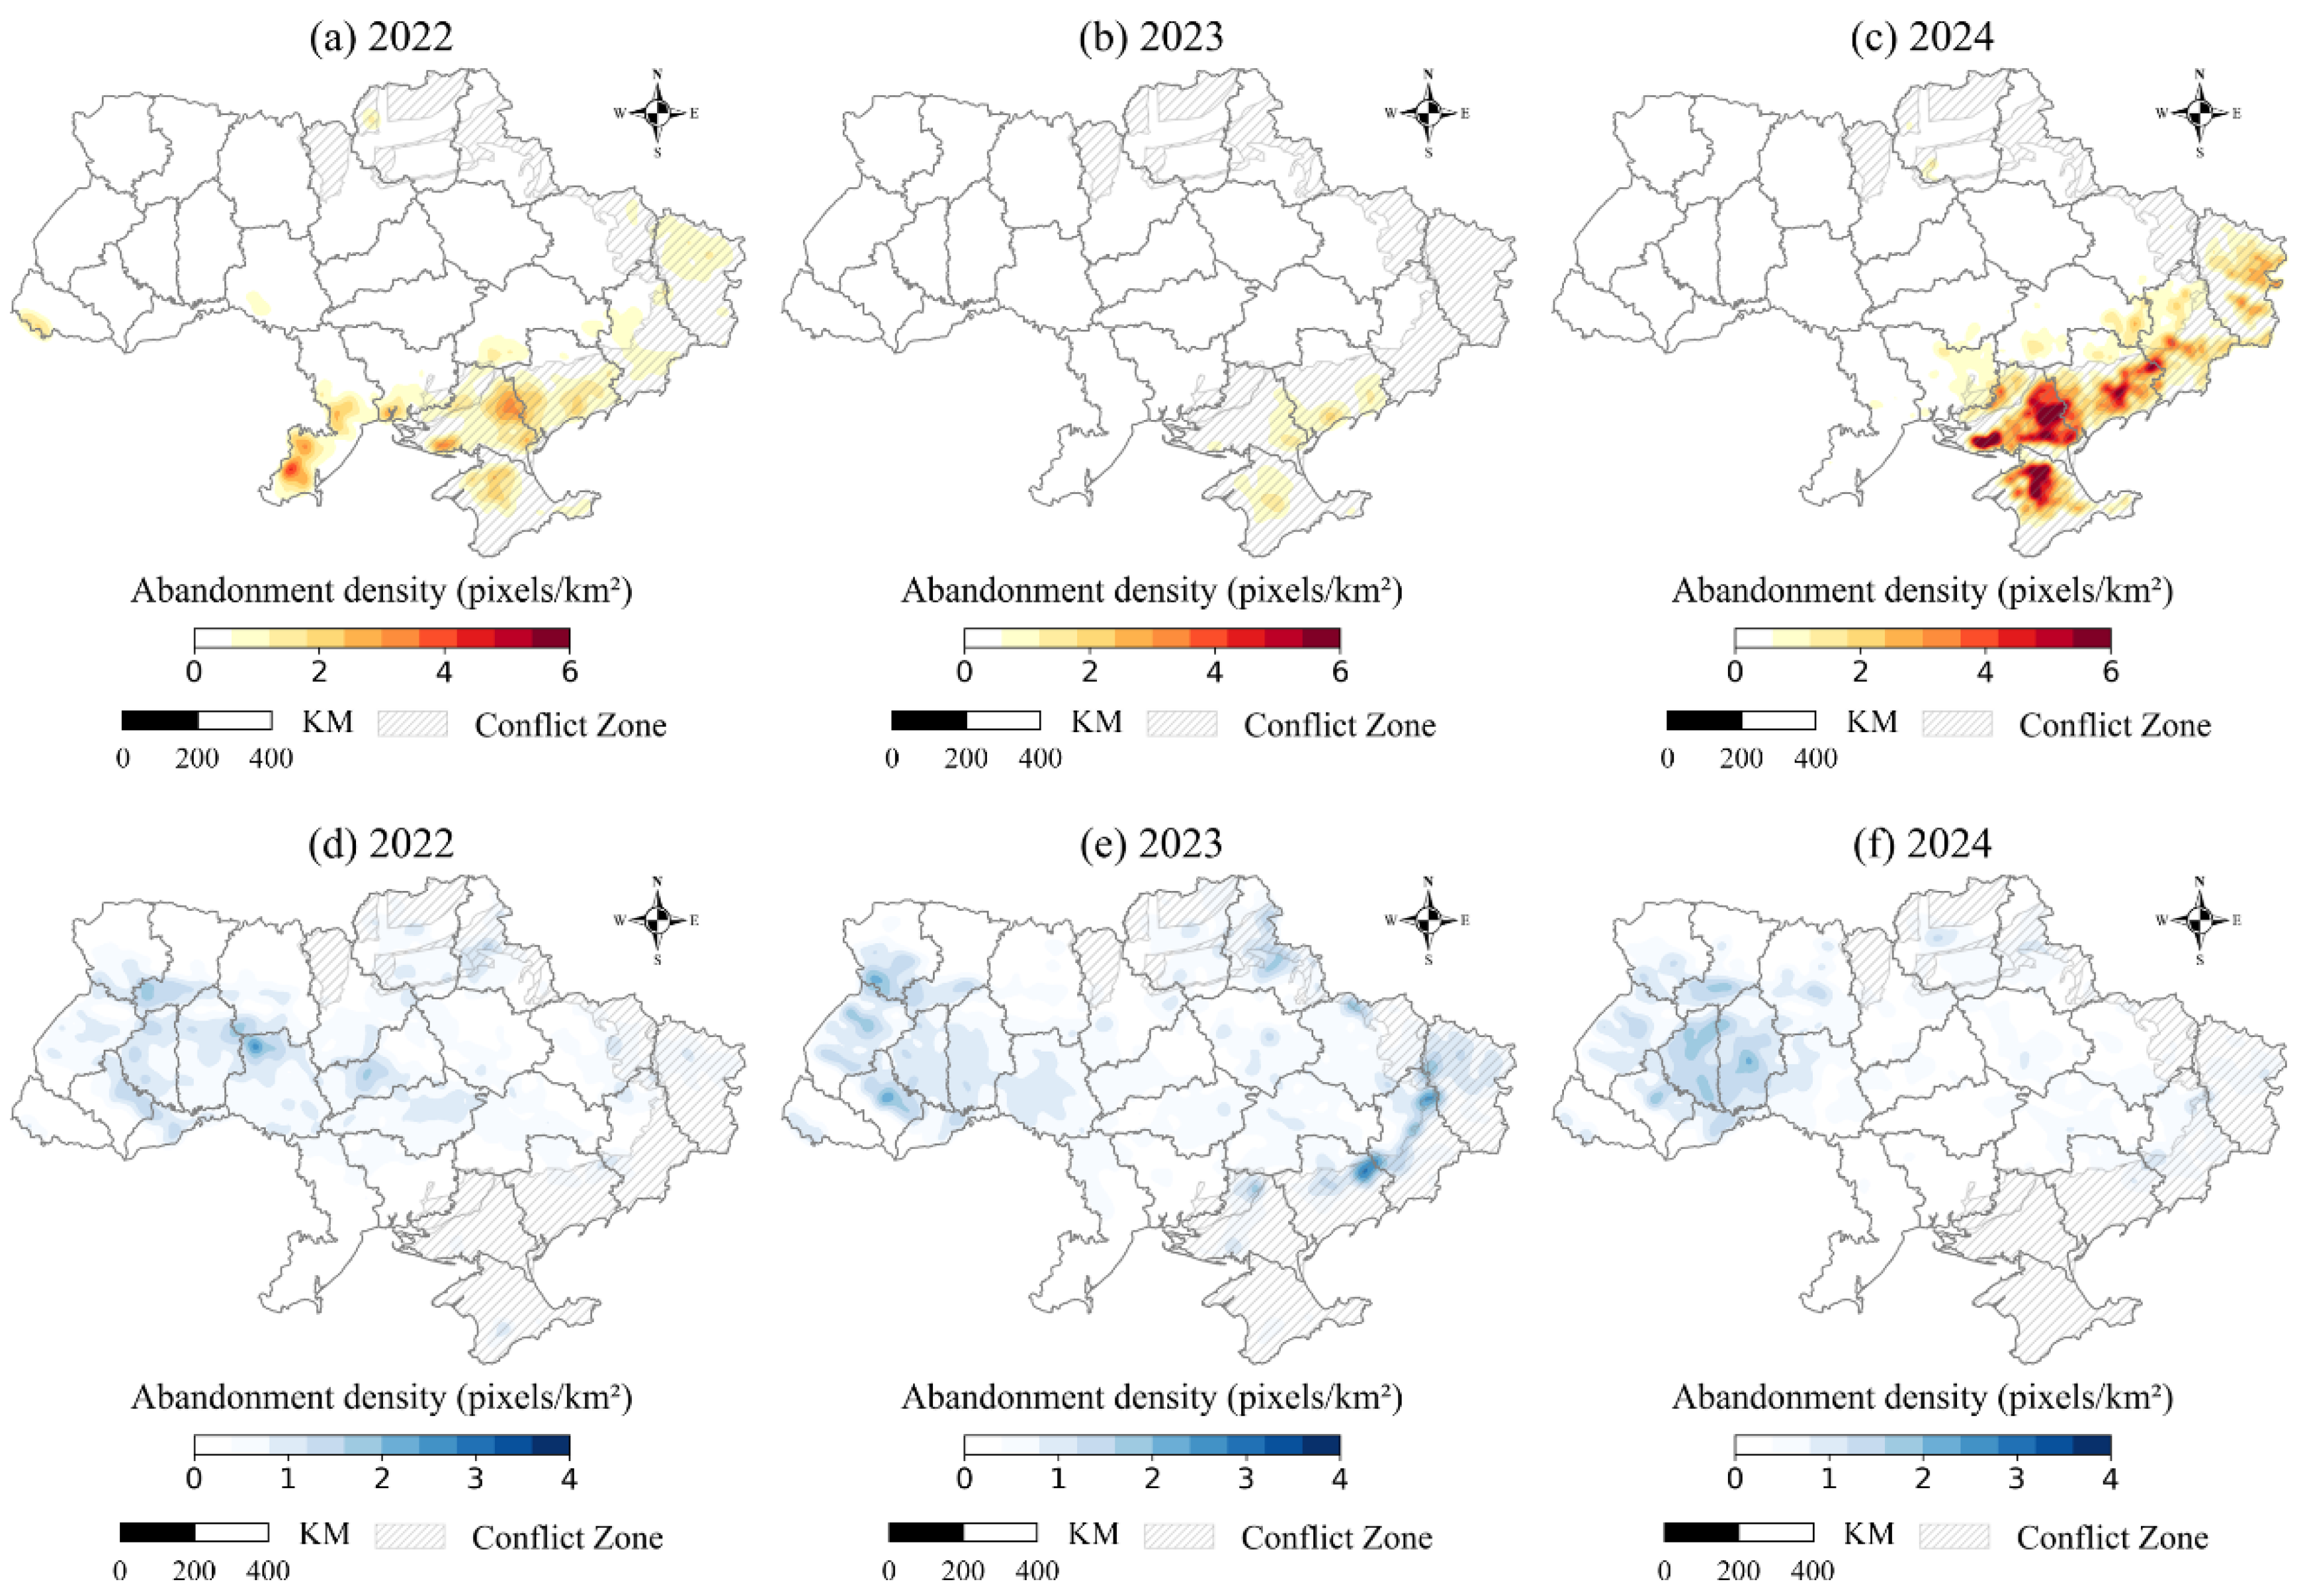
4.3. Spatiotemporal Distribution of Abandoned Cropland
4.4. Abandonment by Crop Type
5. Discussion
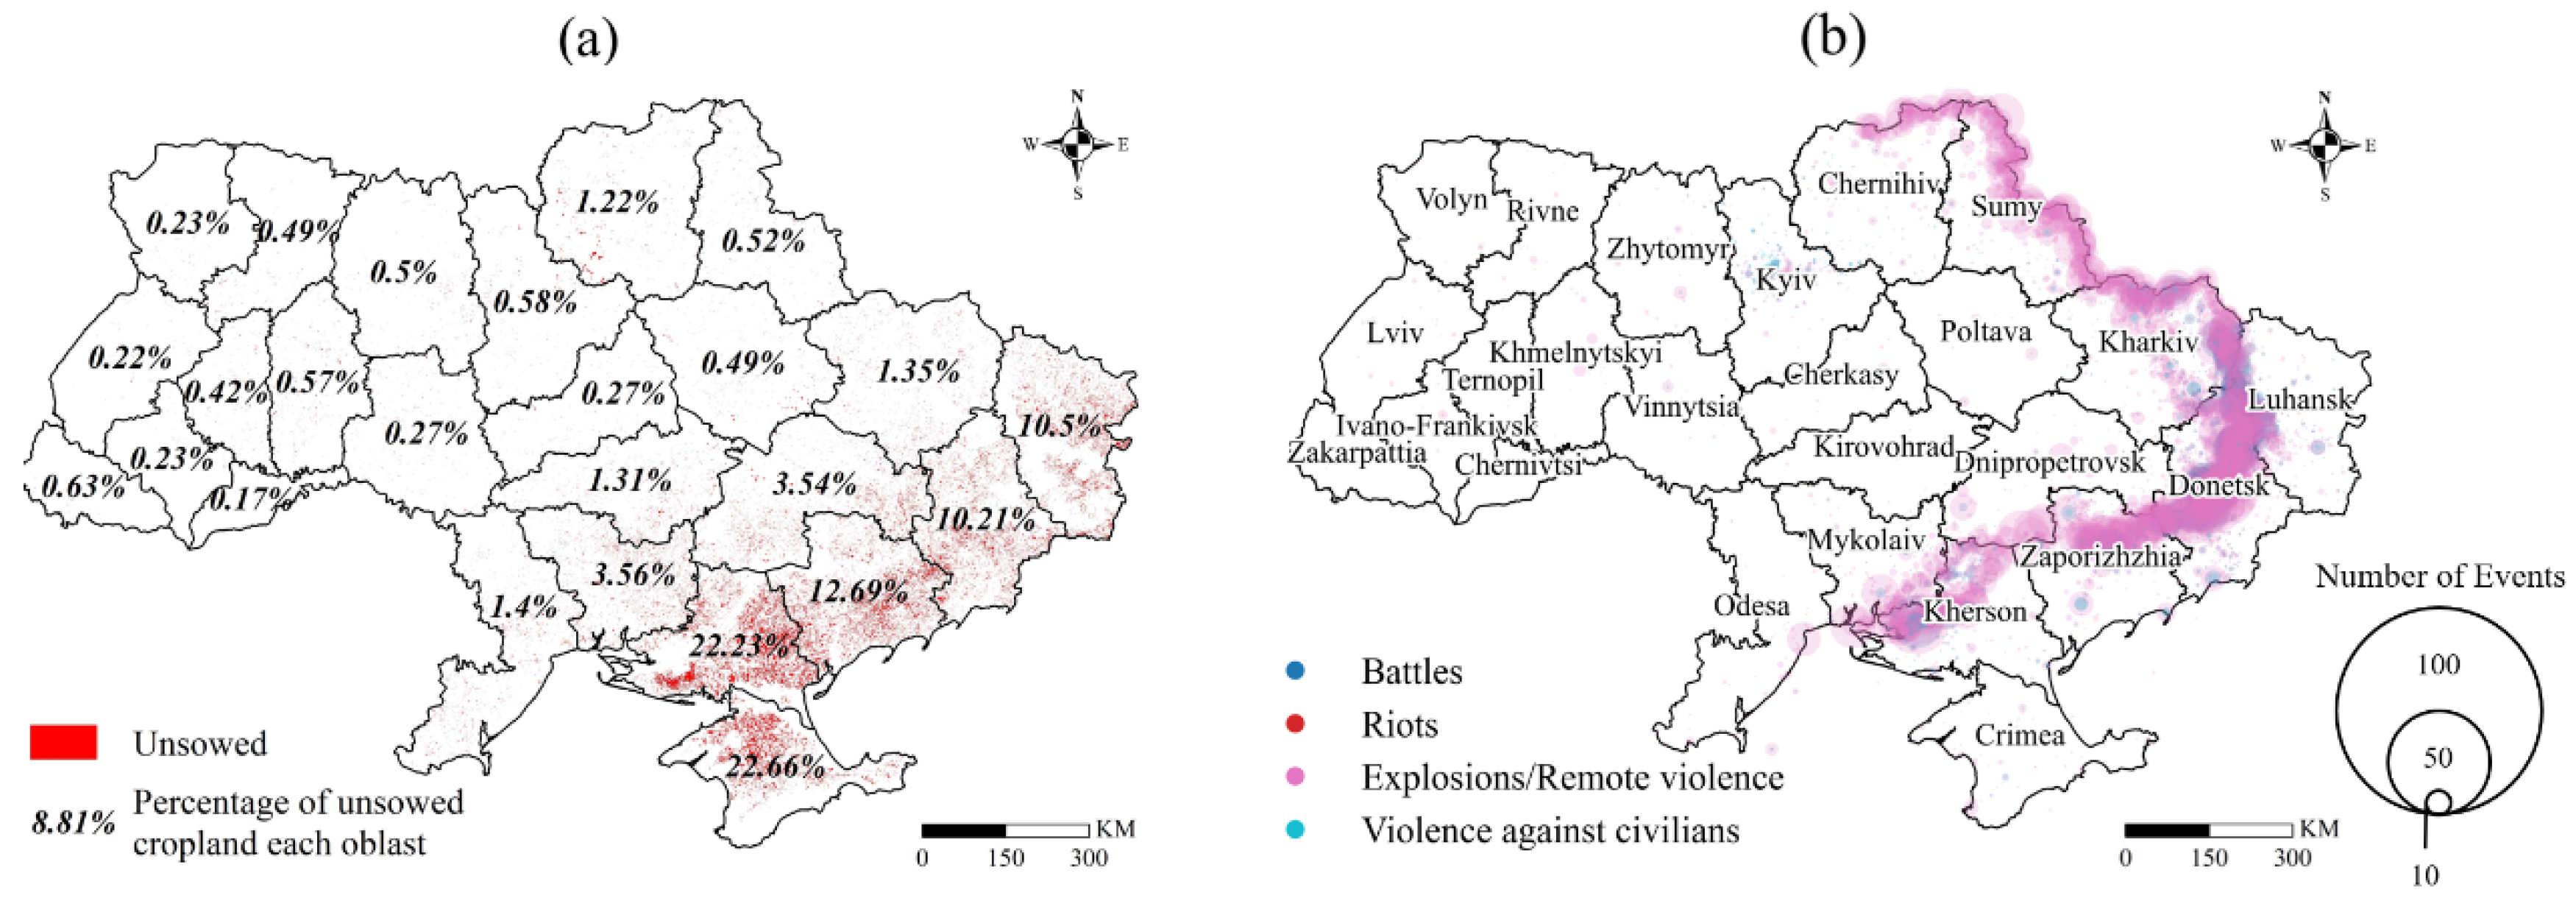
5.1. Conflict Zones and Spatial Correlation with Cropland Abandonment
5.2. Shifts in Abandonment Patterns
5.3. Crop-Specific Abandonment Patterns
5.4. Limitations and Future Work
6. Conclusions
Supplementary Materials
Author Contributions
Funding
Data Availability Statement
Conflicts of Interest
References
- Cheng, L.; Xia, N.; Jiang, P.; Zhong, L.; Pian, Y.; Duan, Y.; Huang, Q.; Li, M. Analysis of Farmland Fragmentation in China Modernization Demonstration Zone since “Reform and Openness”: A Case Study of South Jiangsu Province. Sci. Rep. 2015, 5, 11797. [Google Scholar] [CrossRef]
- Lambin, E.F.; Gibbs, H.K.; Ferreira, L.; Grau, R.; Mayaux, P.; Meyfroidt, P.; Morton, D.C.; Rudel, T.K.; Gasparri, I.; Munger, J. Estimating the World’s Potentially Available Cropland Using a Bottom-up Approach. Glob. Environ. Change 2013, 23, 892–901. [Google Scholar] [CrossRef]
- Schipanski, M.E.; Barbercheck, M.; Douglas, M.R.; Finney, D.M.; Haider, K.; Kaye, J.P.; Kemanian, A.R.; Mortensen, D.A.; Ryan, M.R.; Tooker, J.; et al. A Framework for Evaluating Ecosystem Services Provided by Cover Crops in Agroecosystems. Agric. Syst. 2014, 125, 12–22. [Google Scholar] [CrossRef]
- Beerling, D.J.; Leake, J.R.; Long, S.P.; Scholes, J.D.; Ton, J.; Nelson, P.N.; Bird, M.; Kantzas, E.; Taylor, L.L.; Sarkar, B.; et al. Farming with Crops and Rocks to Address Global Climate, Food and Soil Security. Nat. Plants 2018, 4, 138–147. [Google Scholar] [CrossRef] [PubMed]
- Chai, L.; Liu, A.; Li, X.; Guo, Z.; He, W.; Huang, J.; Bai, T.; Liu, J. Telecoupled Impacts of the Russia–Ukraine War on Global Cropland Expansion and Biodiversity. Nat. Sustain. 2024, 7, 432–441. [Google Scholar] [CrossRef]
- Foley, J.A.; DeFries, R.; Asner, G.P.; Barford, C.; Bonan, G.; Carpenter, S.R.; Chapin, F.S.; Coe, M.T.; Daily, G.C.; Gibbs, H.K.; et al. Global Consequences of Land Use. Science 2005, 309, 570–574. [Google Scholar] [CrossRef]
- Zhang, H.; Jiao, L.; Li, C.; Deng, Z.; Wang, Z.; Jia, Q.; Lian, X.; Liu, Y.; Hu, Y. Global Environmental Impacts of Food System from Regional Shock: Russia-Ukraine War as an Example. Humanit. Soc. Sci. Commun. 2024, 11, 191. [Google Scholar] [CrossRef]
- He, T.; Zhang, M.; Xiao, W.; Zhai, G.; Wang, Y.; Guo, A.; Wu, C. Quantitative Analysis of Abandonment and Grain Production Loss under Armed Conflict in Ukraine. J. Clean. Prod. 2023, 412, 137367. [Google Scholar] [CrossRef]
- Osmolovska, I.; Bilyk, N.; Ukraine and Eastern Europe Programme; GLOBSEC. Cleaning the Augean Stables Demining Ukraine; GLOBSEC: Bratislava, Slovakia, 2024; Available online: https://www.globsec.org/sites/default/files/2024-01/Cleaning%20the%20Augean%20Stables%20Demining%20Ukraine.pdf (accessed on 24 January 2025).
- Li, X.-Y.; Li, X.; Fan, Z.; Mi, L.; Kandakji, T.; Song, Z.; Li, D.; Song, X.-P. Civil War Hinders Crop Production and Threatens Food Security in Syria. Nat. Food 2022, 3, 38–46. [Google Scholar] [CrossRef]
- Olsen, V.M.; Fensholt, R.; Olofsson, P.; Bonifacio, R.; Butsic, V.; Druce, D.; Ray, D.; Prishchepov, A.V. The Impact of Conflict-Driven Cropland Abandonment on Food Insecurity in South Sudan Revealed Using Satellite Remote Sensing. Nat. Food 2021, 2, 990–996. [Google Scholar] [CrossRef]
- Zhang, S.; Zhang, Y.; Zhang, X.; Miao, C.; Liu, S.; Liu, J. Revealing the Distribution and Change of Abandoned Cropland in Ukraine Based on Dual Period Change Detection Method. Sci. Rep. 2025, 15, 5765. [Google Scholar] [CrossRef]
- Kussul, N.; Shelestov, A.; Yailymov, B.; Yailymova, H.; Lemoine, G.; Deininger, K. Assessment of War-Induced Agricultural Land Use Changes in Ukraine Using Machine Learning Applied to Sentinel Satellite Data. Int. J. Appl. Earth Obs. Geoinf. 2025, 140, 104551. [Google Scholar] [CrossRef]
- Ma, Y.; Lyu, D.; Sun, K.; Li, S.; Zhu, B.; Zhao, R.; Zheng, M.; Song, K. Spatiotemporal Analysis and War Impact Assessment of Agricultural Land in Ukraine Using RS and GIS Technology. Land 2022, 11, 1810. [Google Scholar] [CrossRef]
- Chen, B.; Tu, Y.; An, J.; Wu, S.; Lin, C.; Gong, P. Quantification of Losses in Agriculture Production in Eastern Ukraine Due to the Russia-Ukraine War. Commun. Earth Environ. 2024, 5, 336. [Google Scholar] [CrossRef]
- Jiang, Y.; He, X.; Yin, X.; Chen, F. The Pattern of Abandoned Cropland and Its Productivity Potential in China: A Four-Years Continuous Study. Sci. Total Environ. 2023, 870, 161928. [Google Scholar] [CrossRef] [PubMed]
- Lieskovský, J.; Bezák, P.; Špulerová, J.; Lieskovský, T.; Koleda, P.; Dobrovodská, M.; Bürgi, M.; Gimmi, U. The Abandonment of Traditional Agricultural Landscape in Slovakia–Analysis of Extent and Driving Forces. J. Rural. Stud. 2015, 37, 75–84. [Google Scholar] [CrossRef]
- He, S.; Shao, H.; Xian, W.; Yin, Z.; You, M.; Zhong, J.; Qi, J. Monitoring Cropland Abandonment in Hilly Areas with Sentinel-1 and Sentinel-2 Timeseries. Remote Sens. 2022, 14, 3806. [Google Scholar] [CrossRef]
- Zhu, X.; Xiao, G.; Zhang, D.; Guo, L. Mapping Abandoned Farmland in China Using Time Series MODIS NDVI. Sci. Total Environ. 2021, 755, 142651. [Google Scholar] [CrossRef]
- Yin, H.; Prishchepov, A.V.; Kuemmerle, T.; Bleyhl, B.; Buchner, J.; Radeloff, V.C. Mapping Agricultural Land Abandonment from Spatial and Temporal Segmentation of Landsat Time Series. Remote Sens. Environ. 2018, 210, 12–24. [Google Scholar] [CrossRef]
- Yusoff, N.M.; Muharam, F.M. The Use of Multi-Temporal Landsat Imageries in Detecting Seasonal Crop Abandonment. Remote Sens. 2015, 7, 11974–11991. [Google Scholar] [CrossRef]
- Liu, B.; Song, W. Mapping Abandoned Cropland Using Within-Year Sentinel-2 Time Series. CATENA 2023, 223, 106924. [Google Scholar] [CrossRef] [PubMed]
- Estel, S.; Kuemmerle, T.; Alcántara, C.; Levers, C.; Prishchepov, A.; Hostert, P. Mapping Farmland Abandonment and Recultivation across Europe Using MODIS NDVI Time Series. Remote Sens. Environ. 2015, 163, 312–325. [Google Scholar] [CrossRef]
- Löw, F.; Prishchepov, A.V.; Waldner, F.; Dubovyk, O.; Akramkhanov, A.; Biradar, C.; Lamers, J.P.A. Mapping Cropland Abandonment in the Aral Sea Basin with MODIS Time Series. Remote Sens. 2018, 10, 159. [Google Scholar] [CrossRef]
- Smaliychuk, A.; Müller, D.; Prishchepov, A.V.; Levers, C.; Kruhlov, I.; Kuemmerle, T. Recultivation of Abandoned Agricultural Lands in Ukraine: Patterns and Drivers. Glob. Environ. Change 2016, 38, 70–81. [Google Scholar] [CrossRef]
- Dai, K.; Cheng, C.; Kan, S.; Li, Y.; Liu, K.; Wu, X. Impact of Arable Land Abandonment on Crop Production Losses in Ukraine During the Armed Conflict. Remote Sens. 2024, 16, 4207. [Google Scholar] [CrossRef]
- Glauben, T.; Svanidze, M.; Götz, L.; Prehn, S.; Jamali Jaghdani, T.; Durić, I.; Kuhn, L. The War in Ukraine, Agricultural Trade and Risks to Global Food Security. Intereconomics 2022, 57, 157–163. [Google Scholar] [CrossRef]
- Deininger, K.; Ali, D.A.; Kussul, N.; Shelestov, A.; Lemoine, G.; Yailimova, H. Quantifying War-Induced Crop Losses in Ukraine in near Real Time to Strengthen Local and Global Food Security. Food Policy 2023, 115, 102418. [Google Scholar] [CrossRef]
- Han, J.; Luo, Y.; Zhang, Z.; Xu, J.; Chen, Y.; Asseng, S.; Jägermeyr, J.; Müller, C.; Olesen, J.E.; Rötter, R.; et al. Planting Area and Production Decreased for Winter-Triticeae Crops but Increased for Rapeseed in Ukraine with Climatic Impacts Dominating. Geogr. Sustain. 2024, 6, 100226. [Google Scholar] [CrossRef]
- Jagtap, S.; Trollman, H.; Trollman, F.; Garcia-Garcia, G.; Parra-López, C.; Duong, L.; Martindale, W.; Munekata, P.E.S.; Lorenzo, J.M.; Hdaifeh, A.; et al. The Russia-Ukraine Conflict: Its Implications for the Global Food Supply Chains. Foods 2022, 11, 2098. [Google Scholar] [CrossRef]
- Gorelick, N.; Hancher, M.; Dixon, M.; Ilyushchenko, S.; Thau, D.; Moore, R. Google Earth Engine: Planetary-Scale Geospatial Analysis for Everyone. Remote Sens. Environ. 2017, 202, 18–27. [Google Scholar] [CrossRef]
- Jurgens, C. The Modified Normalized Difference Vegetation Index (mNDVI) a New Index to Determine Frost Damages in Agriculture Based on Landsat TM Data. Int. J. Remote Sens. 1997, 18, 3583–3594. [Google Scholar] [CrossRef]
- Sulik, J.J.; Long, D.S. Spectral Indices for Yellow Canola Flowers. Int. J. Remote Sens. 2015, 36, 2751–2765. [Google Scholar] [CrossRef]
- Ghassemi, B.; Izquierdo-Verdiguier, E.; Verhegghen, A.; Yordanov, M.; Lemoine, G.; Moreno Martínez, Á.; De Marchi, D.; van der Velde, M.; Vuolo, F. European Union Crop Map 2022: Earth Observation’s 10-Meter Dive into Europe’s Crop Tapestry. Sci. Data 2024, 11, 1048. [Google Scholar] [CrossRef] [PubMed]
- Lavreniuk, M.; Kussul, N.; Skakun, S.; Shelestov, A.; Yailymov, B. Regional Retrospective High Resolution Land Cover for Ukraine: Methodology and Results. In Proceedings of the 2015 IEEE International Geoscience and Remote Sensing Symposium (IGARSS), Milan, Italy, 26–31 July 2015; pp. 3965–3968. [Google Scholar]
- Shelestov, A.; Lavreniuk, M.; Vasiliev, V.; Shumilo, L.; Kolotii, A.; Yailymov, B.; Kussul, N.; Yailymova, H. Cloud Approach to Automated Crop Classification Using Sentinel-1 Imagery. IEEE Trans. Big Data 2020, 6, 572–582. [Google Scholar] [CrossRef]
- Dempster, A.; Petitjean, F.; Webb, G.I. ROCKET: Exceptionally Fast and Accurate Time Series Classification Using Random Convolutional Kernels. Data Min. Knowl. Discov. 2020, 34, 1454–1495. [Google Scholar] [CrossRef]
- Ruiz, A.P.; Flynn, M.; Large, J.; Middlehurst, M.; Bagnall, A. The Great Multivariate Time Series Classification Bake off: A Review and Experimental Evaluation of Recent Algorithmic Advances. Data Min. Knowl. Discov. 2021, 35, 401–449. [Google Scholar] [CrossRef]
- Middlehurst, M.; Schäfer, P.; Bagnall, A. Bake off Redux: A Review and Experimental Evaluation of Recent Time Series Classification Algorithms. Data Min. Knowl. Discov. 2024, 38, 1958–2031. [Google Scholar] [CrossRef]
- Araya, S.; Ostendorf, B.; Lyle, G.; Lewis, M. CropPhenology: An R Package for Extracting Crop Phenology from Time Series Remotely Sensed Vegetation Index Imagery. Ecol. Inform. 2018, 46, 45–56. [Google Scholar] [CrossRef]
- Petitjean, F.; Inglada, J.; Gancarski, P. Satellite Image Time Series Analysis Under Time Warping. IEEE Trans. Geosci. Remote Sens. 2012, 50, 3081–3095. [Google Scholar] [CrossRef]
- Sakoe, H.; Chiba, S. Dynamic Programming Algorithm Optimization for Spoken Word Recognition. IEEE Trans. Acoust. Speech Signal Process. 1978, 26, 43–49. [Google Scholar] [CrossRef]
- Amare, M.; Abay, K.A.; Berhane, G.; Andam, K.S.; Adeyanju, D. Conflicts, Crop Choice, and Agricultural Investments: Empirical Evidence from Nigeria. Land Use Policy 2025, 148, 107391. [Google Scholar] [CrossRef]
- Lin, F.; Li, X.; Jia, N.; Feng, F.; Huang, H.; Huang, J.; Fan, S.; Ciais, P.; Song, X.-P. The Impact of Russia-Ukraine Conflict on Global Food Security. Glob. Food Secur. 2023, 36, 100661. [Google Scholar] [CrossRef]
- Raleigh, C.; Kishi, R.; Linke, A. Political Instability Patterns Are Obscured by Conflict Dataset Scope Conditions, Sources, and Coding Choices. Humanit. Soc. Sci. Commun. 2023, 10, 74. [Google Scholar] [CrossRef]
- Big-Alabo, T.; MacAlex-Achinulo, E.C. Russia-Ukraine Crisis and Regional Security. Int. J. Political Sci. 2022, 8, 21–35. [Google Scholar]
- IFPRI. Ukraine and Global Agricultural Markets Two Years Later; IFPRI: Washington, DC, USA, 2024; Available online: https://www.ifpri.org/blog/ukraine-and-global-agricultural-markets-two-years-later/ (accessed on 30 June 2024).
- NASA Harvest. Farming Amidst a War: Satellite Data Reveals Productive yet Challenging Season for Ukraine; NASA Harvest: College Park, MD, USA, 2024; Available online: https://www.nasaharvest.org/news/farming-amidst-war-satellite-data-reveals-productive-yet-challenging-season-ukraine (accessed on 19 February 2025).
- FAO. Ukraine: EU-FAO Partnership to Ensure Recovery and Development of Agricultural Value Chains; FAO: Rome, Italy, 2023; Available online: https://www.fao.org/newsroom/detail/ukraine-eu-fao-partnership-for-recovery-of-agricultural-value-chains-040123/en (accessed on 3 April 2025).
- FAO. The 2023 Ukraine Recovery Conference—FAO Delivered Its Statement on the Programme Activities in Ukraine; FAO: Rome, Italy, 2023; Available online: https://www.fao.org/countryprofiles/news-archive/detail-news/zh/c/1643334/ (accessed on 3 April 2025).
- Tomchenko, O.V.; Khyzhniak, A.V.; Sheviakina, N.A.; Zahorodnia, S.A.; Yelistratova, L.A.; Yakovenko, M.I.; Stakhiv, I.R. Assessment and Monitoring of Fires Caused by the War in Ukraine on Landscape Scale. J. Landsc. Ecol. 2023, 16, 76–97. [Google Scholar] [CrossRef]
- Gao, F.; Anderson, M.C.; Zhang, X.; Yang, Z.; Alfieri, J.G.; Kustas, W.P.; Mueller, R.; Johnson, D.M.; Prueger, J.H. Toward Mapping Crop Progress at Field Scales through Fusion of Landsat and MODIS Imagery. Remote Sens. Environ. 2017, 188, 9–25. [Google Scholar] [CrossRef]
- Li, H.; Duvvuri, B.; Borsoi, R.; Imbiriba, T.; Beighley, E.; Erdoğmuş, D.; Closas, P. Online Fusion of Multi-Resolution Multispectral Images with Weakly Supervised Temporal Dynamics. ISPRS J. Photogramm. Remote Sens. 2023, 196, 471–489. [Google Scholar] [CrossRef]
- Huang, Z.; Xie, S. Mixed Pixel Decomposition Based on Improved N-FINDR Algorithm. In Proceedings of the 2022 14th International Conference on Measuring Technology and Mechatronics Automation (ICMTMA), Changsha, China, 14–15 January 2022; IEEE: Piscataway, NJ, USA, 2022; pp. 1081–1084. [Google Scholar]
- Niu, X. An Overview of Image Super-Resolution Reconstruction Algorithm. In Proceedings of the 2018 11th International Symposium on Computational Intelligence and Design (ISCID), Hangzhou, China, 8–9 December 2018; IEEE: Piscataway, NJ, USA; pp. 16–18. [Google Scholar]
- Moldavan, L.; Pimenowa, O.; Wasilewski, M.; Wasilewska, N. Crop Rotation Management in the Context of Sustainable Development of Agriculture in Ukraine. Agriculture 2024, 14, 934. [Google Scholar] [CrossRef]


| Crop | PA | UA | OA | Kappa |
|---|---|---|---|---|
| Wheat | 1.0000 | 0.9798 | 0.9567 | 0.9132 |
| Sunflower | 0.9663 | 0.9149 | ||
| Rapeseed | 0.9545 | 1.0000 | ||
| Maize | 0.9565 | 0.9429 | ||
| Soybean | 0.7797 | 0.9787 | ||
| Potato | 0.8868 | 0.9592 |
| Method | Year | Unsowed | Sowed | OA | Kappa | ||
|---|---|---|---|---|---|---|---|
| PA | UA | PA | UA | ||||
| DTW | 2022 | 0.7214 | 0.8423 | 0.7621 | 0.7519 | 0.7498 | 0.7402 |
| 2023 | 0.7356 | 0.8502 | 0.7984 | 0.7785 | 0.7723 | 0.7841 | |
| 2024 | 0.7872 | 0.8438 | 0.7689 | 0.7942 | 0.7885 | 0.7698 | |
| Total | 0.7481 | 0.8454 | 0.7765 | 0.7749 | 0.7702 | 0.7647 | |
| TWDTW | 2022 | 0.8200 | 0.9101 | 0.8403 | 0.8307 | 0.8398 | 0.8405 |
| 2023 | 0.8237 | 0.9185 | 0.8784 | 0.8579 | 0.8520 | 0.8647 | |
| 2024 | 0.8671 | 0.9119 | 0.8476 | 0.8740 | 0.8681 | 0.8492 | |
| Total | 0.8369 | 0.9135 | 0.8554 | 0.8542 | 0.8533 | 0.8515 | |
| BTWDTW | 2022 | 0.8003 | 0.9407 | 0.9635 | 0.8323 | 0.8852 | 0.8516 |
| 2023 | 0.8405 | 0.9201 | 0.8912 | 0.8793 | 0.8624 | 0.8687 | |
| 2024 | 0.9334 | 0.9291 | 0.8603 | 0.9048 | 0.9201 | 0.9133 | |
| Total | 0.8581 | 0.9300 | 0.9050 | 0.8721 | 0.8892 | 0.8779 | |
Disclaimer/Publisher’s Note: The statements, opinions and data contained in all publications are solely those of the individual author(s) and contributor(s) and not of MDPI and/or the editor(s). MDPI and/or the editor(s) disclaim responsibility for any injury to people or property resulting from any ideas, methods, instructions or products referred to in the content. |
© 2025 by the authors. Licensee MDPI, Basel, Switzerland. This article is an open access article distributed under the terms and conditions of the Creative Commons Attribution (CC BY) license (https://creativecommons.org/licenses/by/4.0/).
Share and Cite
Xu, N.; Zhuang, H.; Chen, Y.; Wu, S.; Liu, R. Mapping Multi-Crop Cropland Abandonment in Conflict-Affected Ukraine Based on MODIS Time Series Analysis. Land 2025, 14, 1548. https://doi.org/10.3390/land14081548
Xu N, Zhuang H, Chen Y, Wu S, Liu R. Mapping Multi-Crop Cropland Abandonment in Conflict-Affected Ukraine Based on MODIS Time Series Analysis. Land. 2025; 14(8):1548. https://doi.org/10.3390/land14081548
Chicago/Turabian StyleXu, Nuo, Hanchen Zhuang, Yijun Chen, Sensen Wu, and Renyi Liu. 2025. "Mapping Multi-Crop Cropland Abandonment in Conflict-Affected Ukraine Based on MODIS Time Series Analysis" Land 14, no. 8: 1548. https://doi.org/10.3390/land14081548
APA StyleXu, N., Zhuang, H., Chen, Y., Wu, S., & Liu, R. (2025). Mapping Multi-Crop Cropland Abandonment in Conflict-Affected Ukraine Based on MODIS Time Series Analysis. Land, 14(8), 1548. https://doi.org/10.3390/land14081548