Article

Assessing Woodland Change in Tanzania’s Eastern Arc Mountains Using Landsat Thematic Mapper Mixed Approaches

1
School of Geosciences, University of South Florida, Tampa, FL 33620, USA
2
Department of Geography, Ohio University, Athens, OH 45701, USA
*
Author to whom correspondence should be addressed.
Land 2025, 14(8), 1546; https://doi.org/10.3390/land14081546
Submission received: 6 June 2025 / Revised: 20 July 2025 / Accepted: 24 July 2025 / Published: 28 July 2025

Abstract

Tanzania’s Eastern Arc Mountains, a hotspot for biodiversity, are seriously threatened by deforestation and the loss of woodland cover. The loss of woodland cover has been associated with decreased access and availability of woodfuel for nearby communities, which may have detrimental effects on household energy security and livelihoods. This study, which employs geospatial techniques, looks at woodland change in the Eastern Arc Mountains region between 2001 and 2020 to prioritize areas that need more sustainable land use practices. We employed a “mixed methods” remote sensing approach linked to Landsat thematic mapper data to assess woodland change. The results showed that the Same District experienced a considerable loss of woodland, making up 37.4% of the total area lost between 2001 and 2020. These results suggest that access to woodfuel may become more difficult for the residents of Same District.

1. Introduction

1.1. Background

The fast rate of forest loss and the significant consequences for climate change and biodiversity loss have drawn research and policy attention to Land Use Land Cover Change (LULCC) in Tanzania’s Eastern Arc Mountains [1,2,3]. According to [4], the Eastern Arc Mountains play a major role in the storage of carbon worldwide. Most of the montane areas of the Eastern Arc are protected because of the richness of biodiversity, while woodlands are not under protected area (PA) status [5]. Ref. [6] analysis of the extent and variation in deforestation in Tanzania’s Eastern Arc Mountains, a biodiversity hotspot in Africa, found that from 1975 to 2000, there was a reduction in the montane forest by 210 km2 (5%), whereas the woodland area declined by 2060 km2 (43%). The study by [6] is significant because it shows that the Eastern Arc Mountains’ woodlands outside of protected areas have a remarkably high rate of land cover change. It also suggests that more research should be performed on woodlands in this region.
Motivated by the belief that the production of charcoal is the main cause of changes in land cover, especially forest loss, Tanzanian policymakers have attempted to decrease deforestation by lowering the demand for charcoal [7]. Other research, however, has demonstrated that agricultural growth, not the production of charcoal, is the main cause of Tanzania’s deforestation [8,9,10,11]. Tanzania’s declining forest cover has affected community access to forests and woodlands for woodfuel energy, especially for rural households, according to [12]. However, not enough research has been performed on the connection between local access to woodfuel and the loss of forest and woodland cover.
Changing forest and woodland landscapes significantly affects the energy resources rural populations depend on for their livelihoods [13]. The terms forest and woodland landscapes are often used interchangeably to describe tree-dominated landscapes, and this is because there is no clear distinction between them [14]. Nonetheless, in Tanzania, the term “woodland” is usually used to refer to regions with trees and related vegetation that are less dense (10–30%) tree cover than what would be regarded as a forest (>30% canopy cover) [15].
In a developing nation like Tanzania, biomass fuels like firewood and charcoal account for a significant amount of household energy use [16,17]. Due to its affordability, accessibility, and dependability, charcoal not only provides energy but also generates income for millions of people in both urban and rural areas [18,19]. Like people in other developing countries, Tanzanian rural dwellers primarily rely on biomass energy sources like firewood and charcoal despite the country’s declining forest and woodland cover [20]. Nearly 90% of Tanzania’s energy consumption, both in rural and urban areas, comes from woodfuel [20]. Additionally, Tanzania’s population and economy are expected to grow, leading to a significant increase in energy demand over the next few decades [21].

1.2. Land Use and Land Cover Change

Land use land cover change (LULCC) is a major cause of environmental and landscape change worldwide and is a cause for concern [22]. The phrase “land use land cover change” has been misused in previous research to describe global environmental change, which encompasses biodiversity loss, soil resource depletion, and global climate change [23]. Although the terms “land use” and “land cover change” have been used interchangeably, there are some differences between the two. These two interrelated terms have different historical backgrounds. Land use has been the focus of social scientists like geographers, planners, anthropologists, and economists, while land cover has been the focus of natural scientists. The term “land use” describes how people use land for things like farming, habitation, pastures, industry, and recreation, while the term “land cover” describes the soil, water, vegetation, and other earthly materials that make up the land’s physical condition [24]. Land use and land cover are therefore an integrated concept to describe interrelated aspects of how land is utilized and managed. Thus, LULCC refers to the interactions between the human and natural environments [25].
Land use and land cover data can be combined to help researchers and policymakers better understand how human activity affects the environment and natural resources [24]. For example, land cover can be greatly impacted by changes in land use, such as urbanization or agricultural activities, which can result in an increase in impervious surfaces or a decrease in forest cover. On the other hand, changes in land cover, like wetlands disappearing or vegetation types changing, can also affect how land is used and managed.
Several economic, demographic, and policy factors have accelerated land use and land-cover change (LULCC), which is reflected in processes like urbanization, extractive industries, and agricultural expansion [23,26]. Findings regarding the primary cause of changes in land use and land cover, however, are not entirely consistent. This research helps to clarify major drivers of such land use change.

1.3. Remote Sensing and Tropical Land Use/Land Cover Change

Using satellite data and field surveys, ref. [11] investigated the primary causes of deforestation in Tanzania. According to the study, between 2000 and 2015, agriculture accounted for about 80% of Tanzania’s forest loss, making it the main cause of deforestation. According to the study, the primary cause of deforestation is small-scale subsistence farming, which is followed by commercial agriculture, which includes large-scale plantations. The study also identified the production of charcoal and logging for woodfuel and timber as additional causes of deforestation. These results imply that tackling the factors that propel agricultural growth, particularly small-scale subsistence farming, should be the top priority in Tanzania’s efforts to combat deforestation.
Tanzanian remote sensing studies have made a significant distinction between two types of woody vegetation: woodland and forest. Several land cover types in Tanzania were categorized by [27,28], including croplands, grasslands, woodland, forest cover, and water bodies. The Tanzania Forest Services (TFS) defines forest cover as high-density trees that cover at least 40% of the ground, while a woodland is “a land area with a tree cover density of between 10% and 40% and includes both open and closed-canopy woodlands”. Because much of the woodland is not covered by protected areas (PAs) and has experienced severe deforestation [6], it is a concern in this study. With grass and herbaceous plants predominating and little to no tree cover, grassland is primarily utilized for cattle grazing. Croplands, which are mostly found in regions with rich soil and sufficient rainfall, are used to grow crops like maize, rice, and beans.
Studying LULCC in Tanzania, especially in the Eastern Arc Mountains, requires the use of remote sensing. Remote sensing techniques such as image differencing, Normalized Difference Vegetation Index (NDVI), classification, object-based change detection, and hybrid approaches have been used in this region by many researchers, including refs. [6,11]. The availability of data, the goals of the study, and the required level of accuracy all influence how appropriate these techniques are [29]. For example [30], a study in the Eastern Arc Mountains used the NDVI as one of the land-cover information parameters to show the vegetation index (density and presence) of the region by calculating the difference between the reflectance of red and near-infrared light.
Even though many other studies in the region focused on the impacts of land cover change on the ecological system [11,31,32,33], none of these studies focused on how woodland loss or LULCC changes, in general, shape the livelihoods of rural dwellers in the region in terms of access to woodfuel. Furthermore, most research has concentrated on the effects of land cover change within protected areas, with no prior studies examining the effects on livelihoods outside of protected areas within the Same District. The objective of this study is to assess woodland change in Tanzania’s Eastern Arc Mountains region between 2001 and 2020 to prioritize areas that need more sustainable land use practices.

1.4. Study Area

We selected Same District (Figure 1) as the study area because it falls within the Eastern Arc Mountains in the South Pare Mountains. According to the literature, deforestation happens in Tanzania’s Eastern Arc Mountains outside of protected areas and can affect people’s ability to make a living. There are seven districts in Tanzania’s Kilimanjaro Region, including the Same District. It shares borders with the Manyara Region to the west, the Tanga Region to the south and southeast, Mwanga District to the north, and Kenya to the northeast. There are many kinds of land cover and use in the Same District, such as woodlands, forests, croplands, grasslands, aquatic bodies, and settlements. The LULCC has had an impact on the Eastern Arc Mountains ecosystems and village communities in the area.
Same District is located 380 east of the prime meridian, 40 south of the equator in latitude, and 37 south in UTM zone. The district is 6221 km2 (2402 mi2) in size and has an average elevation of 1034 m (3392 ft). Shengena Peak, at 2463 m, is the highest point in the district. The South Pare white-eye is a district-specific endemic bird that inhabits the Mkomazi National Park and a few other protected areas, such as Chome Forest Reserve within the district.
In 2012, there were 269,807 people living in the study area; the population density was 43.37/km2, and the annual population growth from 2002 to 2012 was 2.4% [15]. The average household size is 4.5 according to the population census of 2012 [15]. Additionally, the Same District experiences two distinct seasons each year: the rainy and the dry. With an average rainfall of 250 mm, the long rainy season runs from March to May. The short rainy season lasts from October through December, bringing 200 mm of rain. July through October are the driest months of the year. From January through February, there is a short dry season. The average maximum temperature is 29.0 °C [34]. Additionally, beekeeping, small businesses, government, and private sector employment, and crops and animal husbandry are the primary economic activities in the district. Ginger, coffee, bananas, maize, and beans are essential crops. Important livestock include pigs, sheep, goats, donkeys, and cattle [35].

2. Materials and Methods

We examined Landsat thematic mapper satellite image data in the study to identify significant shifts in woodland vegetation. Selecting satellite images and particular sensors with the right radiometric, spectral, temporal, and spatial characteristics was the first step. When conducting research on change detection, the temporal aspect of the satellite image is crucial [36]. Along with temporal considerations, important factors such as cost, the object to be analyzed, weather, resolution, location accuracy, and image accessibility must be considered when choosing a particular satellite image. Compared to other satellite images, Landsat images have several advantages. First, the United States Geological Survey (USGS) Earth Explorer (a new and enhanced version of the USGS Global Visualization Viewer) makes Landsat data publicly available (https://earthexplorer.usgs.gov/ (accessed on 20 July 2025)). Second, because Landsat imagery is available from 1972 to the present, it provides the opportunity to detect longitudinal changes. Third, with a vast collection of images to pick from, Landsat imagery provides flexibility in data selection for periods of change detection.

2.1. Remote Sensing Method Workflow

Several crucial steps were involved in the workflow of the “mixed” remote sensing method of LULCC analysis for the study area. Initially, two Landsat satellite images from 2001 and 2020 were acquired from USGS Earth Explorer and preprocessed using the QA data found in the Landsat image Collection 2 and Level 2 packages. This included removing clouds. Then the two Landsat images were clipped using the Same District boundary shapefile to receive the two images of the study area. After that, a supervised classification of band transformation based on spectral characteristics was used to classify the image into various land cover and land use categories (See Table A1, Appendix A, and Appendix B). Then, using ground truth data, we combined high-resolution Google Earth, European Space Agency World Cover, and Normalized Difference Vegetation Index (NDVI) for the two images to validate and accurately assess the classified images [37,38].
The NDVI is a commonly used metric in remote sensing to evaluate the greenness of vegetation in a particular area, according to the United States Geological Survey (USGS). Numerous real-world uses for NDVI exist, such as tracking crop health, evaluating forest and grassland vegetation cover, and identifying shifts in land use over time [39]. We implemented these NDVI band transformations using ArcGIS Pro (v3.0.3). Lastly, the LULCC of the study area from 2001 to 2020 was determined by comparing the two classified images. Figure 2 shows the multi-dimensional remote sensing analysis workflow approach.

2.2. Remote Sensing Data Collection

Images from Landsat 7 and 8 that satisfied several requirements (27 August 2001 and 23 August 2020) were chosen, including having sufficient time for LULCC analysis to detect any significant changes to the terrain. The main attributes of the two chosen images are compiled in Table 1. In the Same District, July is a dry month with fewer clouds, which is why it was chosen. The cloud cover for both Landsat images was below 6%, which is the minimum required for uncorrected analysis. A single image covered the entire study area.
Table 2 and Table 3 show the bands of the two remote sensing data sources used for this study. The Landsat Enhanced Thematic Mapper is a medium-resolution multispectral sensor that records energy in the reflective infrared, middle infrared, thermal infrared, and visible light portions of the electromagnetic range. It has better spatial, spectral, temporal, and radiometric resolution than the Thematic Mapper sensor. The Enhanced Thematic Mapper (Landsat 7) and Landsat 8 used specific bands with a 30 m resolution.

2.3. Prepossessing of Satellite Images

We used Landsat 7 and Landsat 8 Collection 2 and Level 2 in this study because they offer better processing, geometric accuracy, and radiometric calibration than uncorrected Landsat images. The goal of preprocessing is to produce a corrected image by removing noise and correcting distortions and degradations that occur during image acquisition [45]. Landsat Collection 2 Level 2 (C2 L2) images are geometrically and atmospherically corrected, and the images downloaded directly from USGS Explorer do not need geometric correction. However, the QA data is a part of the Collection 2 Level 2 package during the process of cloud removal.
To improve visualization, we employed Normalized Difference Vegetation Index (NDVI) band transformation as the pre-analysis image processing. The following formula served as the basis for the NDVI:
NDVI = ((IRR)/(IR + R))
where IR = pixel values from the infrared band
R = pixel values from the red band
The NDVI band transformation provided preliminary understanding of LULCC of the study area. In addition, NDVI transformations resulted in a new enhanced image that aided in the classification of land cover types.

2.4. Developing Training Sites

A crucial step in image classification is building training sites and a signature since these factors affect how accurate the classification outcomes are [46]. Training sites are chosen regions of an image where each pixel is identified and given a land cover class by the user. A signature is a statistical depiction of the spectral characteristics of every land cover class—is then created using these training sites [47]. Lastly, the Mean and Variance of the spectral values of the pixels within each training site are computed to create the signature.
The quality of the signature development and training sites has a significant impact on the classification results’ accuracy. For instance, the resulting classification might be skewed or incorrect if the training sites do not accurately reflect the entire spectrum of landscape variability. Likewise, the classification might be incorrect if the signature does not accurately reflect the spectral characteristics of each land cover class [29].
We used an object-based segmentation tool in the Remote Sensing and ArcGIS Pro (v3.0.3) software to create training sites. Training sites and signatures for five land covers—water, forest, woodland, cropland, and other land covers—were produced by the on-screen digitizing features. The on-screen digitization of features helps to develop signatures [48]. To ensure coverage of all land use and land cover classes, using stratified sampling, which produces randomly distributed points within each class, we created more than 100 training sites for the two images.

2.5. Supervised Land Use and Land Cover Classification

The process of image classification involves transforming a multi-band raster image into a single-band raster with multiple categorical classes that correspond to different types of land cover [23]. Supervised and unsupervised classification are the two main methods for classifying a multi-band raster image. By using training samples that represent different land cover categories, supervised classification generates spectral signatures that the user can manually classify [49].
Support Vector Machine and supervised object-based classification were used to create land cover maps for the study area in 2001 and 2020. Using supervised classification, each pixel is assigned to a land cover category according to its spectral characteristics as perceived by the user. Object-based and Support Vector machine supervised classification resulted in a smooth image with no susceptibility to noise since each pixel was assigned to a specific class based on training sites developed for the two images. Research indicates that the object-oriented approach to image classification during image segmentation is more accurate and efficient than the pixel-based approach and is less susceptible to noise influence [50]. Due to its numerous benefits, the Support Vector Machine Classifier has been used in this study. Support Vector Machine is preferred over the other classifiers since it produces classification with higher accuracy even with small training data sites [51,52]. The object-based classification was performed at the object level after segmentation, while the Support Vector Machine outputs were post-processed using object-based rules. The software ArcGIS Pro (v3.0.3) was used for implementing Support Vector Machine and object-based classification.

2.6. Post-Processing of the Classified Images

Post-classification processing refers to techniques for noise elimination and increasing the quality of the classified output [53]. The best possible output result is the primary goal when performing image classification. Despite this, the classification result is not always precise, and it may result in “noise,” whereby misclassified individual pixels or small groups of pixels may appear in the classified result. Therefore, post-classification processing helped to refine misclassified pixels due to factors such as spectral confusion or mixed pixels and improved the accuracy of the classification results.
We sorted, filtered, and generalized similar pixels in this study using ArcGIS Pro (v3.0.3). Filtering removed noise or isolated pixels from the classified output, while smoothing removed the rough edges of class boundaries. This process improves spatial coherency in the classes. Areas that are contiguous and belong to similar pixels may become connected to form a particular land cover class. The generalizations of the classified output remove small, separated areas from a classified image, and the areas that are more extensive than a particular number of pixels remain on the image [53].

2.7. Accuracy Assessment

Any imagery classification process requires an accuracy assessment. The accuracy assessment uses a reference dataset to determine the accuracy of classified image output. It compares the detected image categories obtained through image classification to a reliable data source, such as ground truth data from the field. However, the collection of field-based ground truth data is time-consuming and costly, and was not possible for this study. Because of the challenges of field ground truth data and high-resolution interpreted images, existing classified GIS data layers were used as substitutes for field ground truth data.
To create ground truth data, we utilized the European Space Agency’s World Cover, high-resolution Google Earth imagery, and NDVI. Using stratified sampling, which produces randomly distributed points within each class, we produced a total of 509 random points, with the number of points in each class being proportionate to its relative area. The validation points were spatially well-distributed across the entire study area, including edges and heterogeneous zones. The reference points were verified by manual interpretation using high-resolution imagery. The accuracy of the map was then verified using ArcGIS Pro’s (v3.0.3) confusion matrix tool. The confusion matrix tables (Table 4a,b) show the user’s accuracy (U Accuracy column), the producer’s accuracy (P Accuracy column) for each class, and the overall kappa statistic index. These accuracy rates ranged from 0 to 1, with 1 indicating complete accuracy of 100 percent. The user’s accuracy is equivalent to the error of commission.
User Accuracy = T h e   t o t a l   n u m b e r   o f   c a t e g i z e d   p o i n t s   t h a t   a g r e e   w i t h   r e f e r e n c e   d a t a T h e   t o t a l   n u m b e r   o f   c l a s s i f i e d   p o i n t s   f o r   t h a t   c l a s s
The producer’s accuracy is equivalent to omission errors. It is how much land in each LULC category is accurately classified.
Producer Accuracy = T h e   t o t a l   n u m b e r   o f   c l a s s i f i e d   p o i n t s   t h a t   a g r e e   w i t h   r e f e r e n c e   d a t a T h e   t o t a l   n u m b e r   o f   r e f e r e n c e   p o i n t s   f o r   t h a t   c l a s s
The kappa coefficient calculates how well a modeled situation matches reality. It determines whether the results displayed in an error matrix (Table 4a,b) are better than the outcomes of a random sample [46]. The kappa coefficient is calculated as follows for an error matrix with a certain number of rows and columns:
The Kappa Coefficient = N A B   N 2 B  
where
“N” denotes the total number of observations in the error matrix.
“A” is the total number of correct classifications in the diagonal elements.
“B” is the sum of the products of the row total and the column total.
The accuracy of the classified images for the 2001 Landsat 7 ETM image and the 2020 Landsat 8 image were evaluated using high-resolution Google satellite images, NDVI images, and thematic land covers of the study areas for the same years. A thematic map of the 2020 land cover categories was created using the European Space Agency’s World Cover 2020 Land Cover. The 2001 Landsat image was also evaluated accurately with the aid of the European Space Agency Climate Change Initiative’s Global Land Cover 1992–2019 image. We validated the accuracy of land cover classes by carefully looking at more than 500 stratified randomly selected points for each image and comparing them to high-resolution Google Earth images, NDVI, and reference thematic data for 2001 and 2020. We used 500 stratified randomly selected points to ensure adequate representation of all land cover classes while maintaining a manageable workload for visual interpretation and reference labeling. This number aligns with commonly used sampling guidelines for accuracy assessment in remote sensing studies, which recommend a minimum of 50 samples per class, when possible, to ensure that even less dominant classes are sufficiently represented in the accuracy assessment.

2.8. Land Cover Change Detection

This study used the post-classification comparison change detection method. Post-classification comparison is the most popular method for effectively detecting changes. Furthermore, this method allowed us to use an independent classification of the two images and a GIS overlay operation to acquire the spatial changes in land use and cover. It also creates a thorough matrix of changes between the two images [54]. Additionally, this method provides both the size and distribution of changed areas and the percentages of other land cover classes that share in the change in each land cover class separately, which is the focus of this study [55].
We overlayed the district village shapefile over the district change detection image to visually interpret the patterns of land cover changes for each village. Next, each village’s land cover change was calculated using the Zonal Statistics Table tool, which summarized raster values within the zones of another dataset and presented the results as a table.
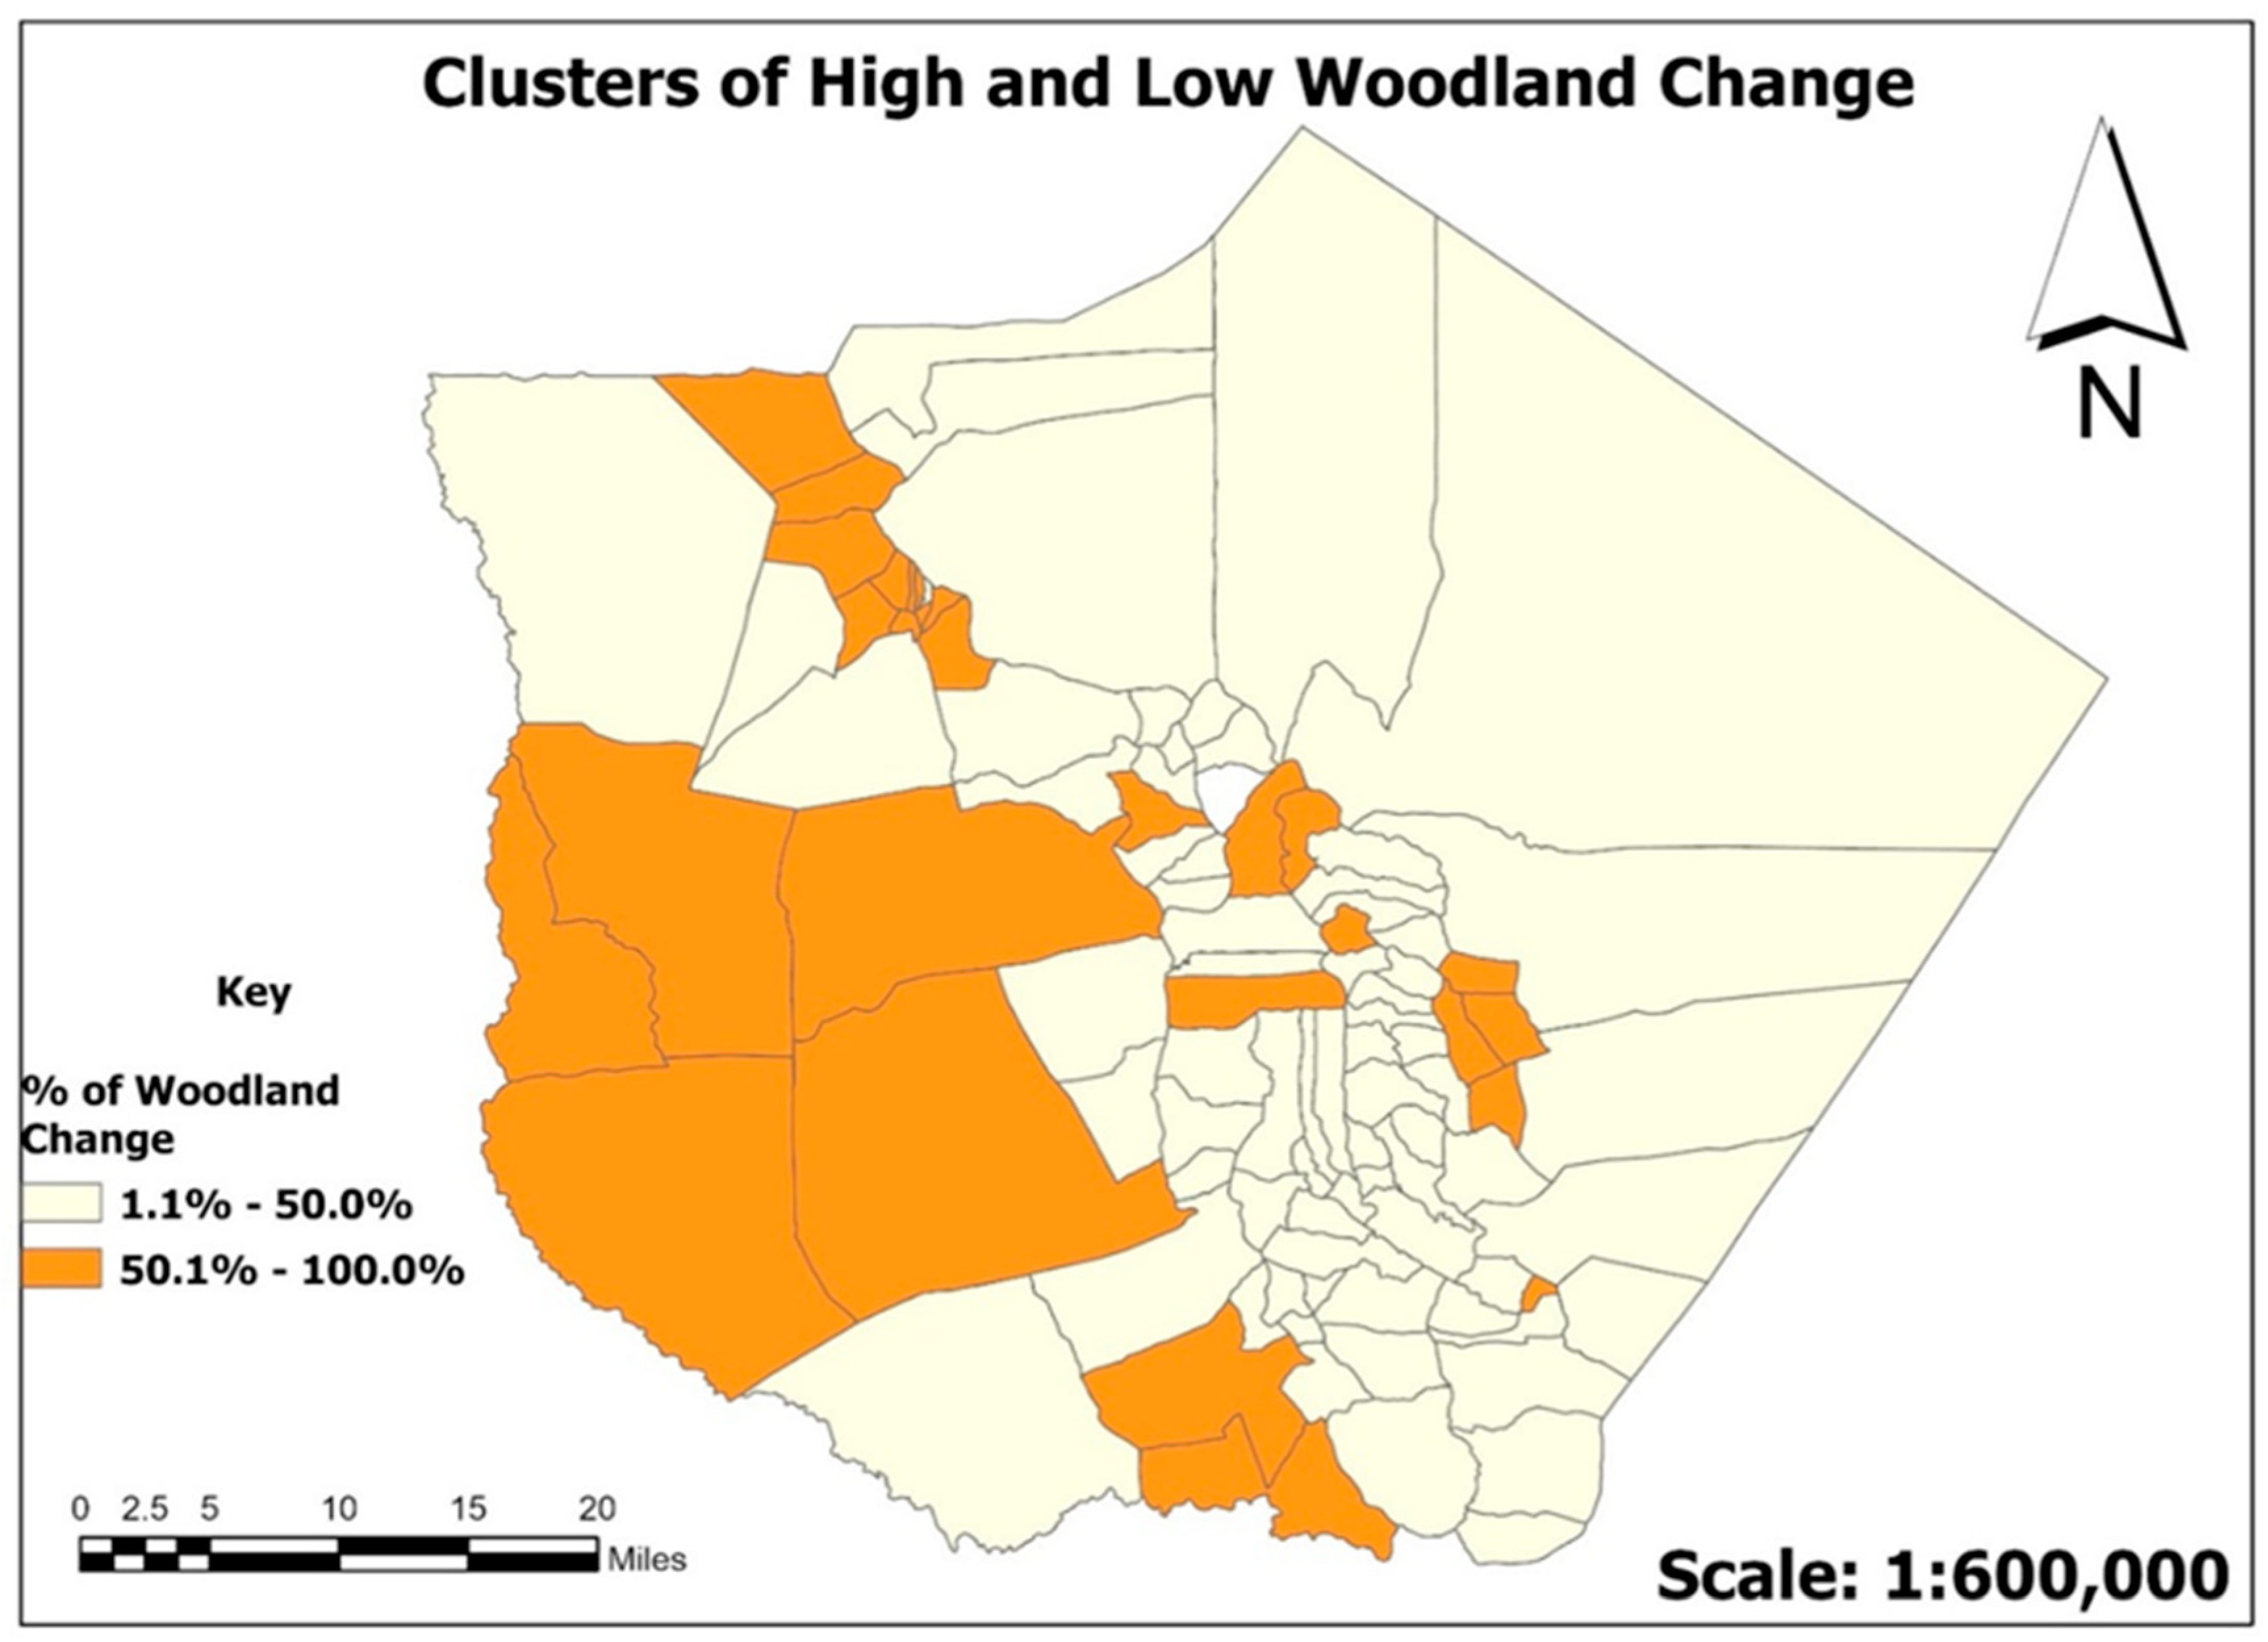
Because this study is focused on woodland change from 2001 to 2020, we used the change detection results to generate a woodland change map of the study area. To determine which villages had significant or minimal woodland change, we utilized ArcGIS Pro’s (v3.0.3). Zonal statistics tool to create a table that linked the woodland change to each of the study area’s 101 villages. This procedure produced statistical values for each village’s woodland change, which were then used to create a study map that displayed the areas with low and significant woodland change. We employed graduated color and symbology in this process, using manual intervals of 50.1–100 (high woodland change) and 0–50 (low woodland change). These thresholds were based on simple binary categorization to distinguish between partial and dominant woodland conversion within each spatial unit, which allows easier visual interpretation and communication of areas with significant change intensity.
The attribute table was also exported to Excel, where we selected one village from a list of a cluster of high woodland change and one village from a cluster of low woodland change using a random sampling technique. Data collection from household surveys is planned in the two selected villages to enhance the woodland change study in Same District. Although the transition table provides valuable insights into the direction and magnitude of land cover changes, the conversions from one category to another may influence the results by leading to overestimation or underestimation of a particular category if there are classification errors from the individual periods. Although this study assessed classification accuracy using an error matrix and reported overall users’ and producers’ accuracy for each classified map, we did not formally calculate uncertainties in the change detection analysis. We suggest a cautious interpretation of the results, and future work could benefit by formally including miscalculation errors.

3. Results

The analysis focused first on determining LULCC using a mixed approach image classification of two Landsat TM images (Figure 3). Secondly, we provide an in-depth description of the woodland cover change in the study area based on the resulting remote sensing data. We then connected the woodland change with villages in Same district to determine a specific quantity and percentage of change for each village. The purpose of quantifying the change for each village is to cluster all villages into two main groups of high and low levels of woodland loss.

3.1. Classified Images

The classified Landsat 7 ETM image of 2001 and the Landsat 8 image of 2020 resulted in five similar land cover categories: water, woodland, forest, cropland, and other land covers (settlements, other developed areas, and barren land). Table 5 shows the distribution of the areas for each land cover category for classified images of 2001 and 2020, while Table 4a,b presents confusion matrices for the classified images.
The visual distribution of the five categories of classified land uses and land cover is displayed in Figure 4. Although the two images belonged to similar categories, there were differences in the visual distribution of the area classes for the classified images. These variations in land cover classes showed that the study area experienced either a gain or a loss for each class between 2001 and 2020.

3.2. Description of LULCC as Used in This Study

In this study, “water” refers to any bodies of surface water that were visible in both Landsat 7 and Landsat 8, including lakes, rivers, and dams. Agricultural activities, including cash crops and subsistence farming, which can be either permanent or shifting, are referred to as “cropland.” The term “forest” referred to closed canopy trees, the majority of which were located within protected areas (PAs), whereas “woodland” referred to any area with open canopy trees, shrubland, thickets, and herbaceous trees. The term “other land covers” referred to land that was covered in grasslands, wetlands, developed areas, and arid regions.

3.3. User Accuracy

The user accuracy for the 2020 image ranged from 81% to 100%. The minimum user accuracy class was for other land covers, which had an accuracy of 81%, followed by croplands with 82%. In comparison, the maximum user accuracy was 100%, which was for the water and forest classes. The user accuracy for woodland was 97%. The lower accuracy for other land covers and cropland classes was most likely caused by spectral reflectance similarities. The 2001 image’s user accuracy ranged from 65% to 100%, with cropland having the lowest class accuracy at only 65%. This was likely misclassified as woodland due to the two land covers’ similar spectral reflectance.

The Producer Accuracy

Our analysis showed that the producer accuracy for the Landsat 7 ETM 2001 ranged from 85% to 100%, with forests having the highest accuracy at 100% and other land covers having the lowest at 85%. Cropland 95%, forest 94%, and woodland 93% were the other class accuracy scores. The 2020 Landsat 8 image accuracy score was between 86% and 100%. The producer accuracy was 86%, 95%, 95%, 100%, and 100% for woodland, cropland, other land covers, water, and forest, respectively.

3.4. Land Cover Change Detection

According to the analysis of the two images, from 2001 to 2020, there was a decrease of 22.1% in the area classified as water bodies, 37.3% in the area classified as woodland, and 45.1% in the area classified as forests (Table 6). Additionally, change detection revealed that over the previous 19 years, cropland and other land covers (developed areas, barren land, and settlements) had increased by 44.2% and 50.6%, respectively. This supported the idea that there had been an increase in land cover for the two land cover categories.
Overall, the analysis of this study revealed that, between 2001 and 2020, certain land covers, such as forests, woodlands, and water cover, were lost. However, Cropland and other land covers saw positive gains, as illustrated in Figure 5.

3.4.1. Woodland Cover and Woodland Cover Change

Findings of the study area’s woodland cover and change between 2001 and 2020 are provided in this section. This study pays particular attention to the woodland land category of land covers because it is a significant source of woodfuel for homes. This study only looked at woodland because the government protects major forests, even though both types of forests are used as sources of woodfuel. The results revealed that the forest decreased by 44.2%, or 191.7963 km2, even though the forest land cover was under protected areas.
Over the past 19 years, the study area’s woodland cover has significantly decreased, as seen in Figure 5. In 2001, the same district’s woodland area was 4136.7 km2, but by 2020, it had shrunk to 3224.8 km2, with 1547.6 km2 (37.3%) of that area shifting to other landcover categories. Additionally, Table 7 indicates that while the woodland changed by nearly 37%, 62.6% of the area stayed the same.
According to the findings, a significant portion of the woodland has been converted to other land cover classes, such as settlement, other developed land, barren land, etc. (Figure 6). Most of the woodland was converted to cropland, as almost 606.5 km2, or 14% of the woodland area, showed agricultural activities. Surprisingly, a small woodland cover of 22.6 km2 (equal to 0.55 percent) changed to forest; this, however, is insignificant as it is a very minimal change compared to the area’s total loss in woodland cover. Figure 7 and Table 7 show the visual distribution and statistics of woodland change for the study area between 2001 and 2020.

3.4.2. Woodlands Change for All Villages in the Study Area

With the help of ArcGIS Pro’s (v3.0.3). Zone Statistics as a Table tool, the study area’s woodland change was summarized for each village. The villages in the study area were overlayed with changes in woodland cover, resulting in both high and low changes. According to Tanzania’s 2012 Census, there are 101 villages in the Same District. Two villages produced non-applicable data. This is because one of the two villages was devoid of woodland cover in both the 2001 and 2020 images, while the other village only featured woodland in the 2020 image. Thus, 99 villages made up the sampling frame for the study area. The study separated the 99 villages into two main groups: those with low changes in woodland cover and those with a high percentage of changes.
Figure 7 demonstrated that all villages with more than 50% woodland loss were included in the high woodland change cluster, whereas villages with less than or equal to 50% woodland loss were included in the low woodland change cluster. Malindi, one of the 71 villages in the low woodland change cluster, was chosen at random to represent all the low woodland change villages, while Njoro, one of the 28 villages in the high woodland change cluster, was chosen at random to represent all the high change villages.

4. Discussion

The 2020 Landsat 8 image had an overall accuracy of 90% and a Kappa coefficient of 85%, while the 2001 Landsat 7 ETM image had an overall accuracy of 93% and a Kappa coefficient of 86%. These percentages show that the two images were correctly classified. The closest perfect agreement between the reference data and the classified image is indicated by the Kappa Coefficient, which ranges from 0.81 to 0.99 [56]. Therefore, the study area’s two classified images displayed the closest perfect agreement with the reference data. Similarly, having overall accuracy of 93% and 90% for Landsat 7 ETM and 2020 Landsat 8 images, respectively, shows that the images were correctly classified because they were above 85%, which is the minimum baseline for overall accuracy that is advised [57]. Other researchers, however, have questioned the accuracy baseline, claiming that it may be lower or higher because a variety of factors can influence the final accuracy [58,59].
The study area saw a high rate of woodland loss between 2001 and 2020, with an annual rate of 2.0%. This rate of change is double that of Tanzania’s woodland loss, which was 0.97% annually between 1990 and 2010 [60]. Another study by [6] found that between 1975 and 2000, there was a 43% decrease in woodland, or a 1.7% change per year. The study area has seen unprecedented woodland change over the past 20 years, which suggests that the rate of woodland loss is higher than the average for Tanzania. This study showed that although the woodland cover changed, so did other land covers, including cropland, forest, and other land covers like built-up areas and bare land. Earlier research on the Eastern Arc Mountains also showed changes in cropland, forest, and settlement [6]. The Ref. [6] study showed that between 1975 and 2000, 5% of the evergreen forest, or closed canopy, which is primarily protected by the government, was lost. These results imply that more research is necessary to identify the factors causing deforestation in the protected forest.
The study revealed that a small portion of the water category was transformed into cropland and other land uses, perhaps because of human activities that have put more strain on the resource. Additionally, as agricultural activities and built-up areas grew, most likely because of an increase in population, a significant portion of the study area’s woodland and forest areas were converted to cropland and other land covers, including settlement. Other studies, such as [61], demonstrate that the primary cause of land cover change in Tanzania’s Eastern Arc Mountains is agricultural expansion. However, agricultural expansion is not limited to the Eastern Arc Mountains region; according to [11], agriculture was identified as the primary cause of land cover change in Tanzania as a whole. Demographic factors associated with the effects of population growth that increased the pressures on natural resources, such as woodland and forest resources, are another factor influencing land cover change in Tanzania [62].
The findings of this study showed that, between 2001 and 2020, the woodland cover lost over 2589.0 km2, or 37.4%, of its land area. However, only a few villages showed a consistent rate of woodland change. This indicates that while some villages in the Same District showed a low loss of woodland, others showed a significant change in woodland above the average. For instance, 71 villages have a change rate of 1% (48.9%), whereas 28 villages have a change rate greater than 50.7% (100%). In this instance, an area was deemed to have a low woodland loss if the change rate was less than 50.7%, and an area with a change rate greater than 50.7% was deemed to have high woodland loss. These results demonstrate that LULCC is both spatial and temporal, meaning that events that occur in one location cannot occur in another or that events that occur over time cannot occur at other times.
Ref. [63] reports that only 30% of the original woodland and forest cover remains in the study area, indicating a significant decrease in forest and woodland cover. While many studies that have measured land cover change have always extrapolated the rate of change to a particular study area, our research was able to quantify the change in woodland across all the study area’s villages, because change rates can differ amongst study areas.
Due to the growth of agricultural activities and other land uses and land cover, including the expansion of the built-up area within the study area, the woodland cover of the area has changed. According to a study by [11], the primary causes of the change in woodland cover were deforestation and agricultural expansion, with small-scale farmers accounting for most of the deforestation. Ref. [11] argues that agriculture has been a primary driver of deforestation in Tanzania. Some academics contend that while shifting cultivation expansion is the main agricultural practice that has been identified as the main driver of woodland decline in many parts of Sub-Saharan Africa, not all forms of agriculture have contributed to the loss of woodlands [11]. Despite cropland being the second driver in this study, the first being other land covers, such as barren land and built-up areas, agricultural activities can still be the main cause of deforestation in woodlands because other land covers, such as built-up areas, have many combined classes. Similar findings were reported in a study conducted in Ethiopia, which showed that woodlands had decreased because of intense pressure from other land uses, especially agriculture [64]. Additionally, it has been suggested that woodfuel, such as firewood and charcoal, contributes to the loss of forests. However, ref. [11] found that charcoal does not significantly contribute to deforestation.
Cropland and other land covers, including built-up areas, replaced woodland in the study area. Numerous detrimental effects on the environment and the community may result from the conversion of woodland to cropland and other land uses. For instance, a study in Ethiopia found that the change in woodland decreased the amount of organic carbon in the soil [65]. High rates of species loss and ecosystem services have also been observed in areas with high woodland decline [66]. The loss of species and ecosystem services, such as woodfuel, food, medicine, timber, carbon storage, and water for a variety of purposes, is linked to the decline of woodland and forest in the Eastern Arc Mountains [63]. Therefore, any change in land cover in the Eastern Arc Mountains study area may have detrimental effects on livelihoods and ecosystems both locally and globally. This is because the Eastern Arc Mountains are known for their remarkable biological diversity, which includes over 550 plant species and about 100 vertebrate species that are unique to the area [63].
Land cover change affects ecosystem services and people’s livelihoods, including woodfuel, as has been shown in other studies conducted in the Eastern Arc Mountains [63].
The loss of the woodland begs the question of whether it has become harder for Same District residents to obtain woodfuel. Woodfuel is becoming scarcer according to other studies on the effects of land cover change in other regions [67], but most rural households continue to rely on it [68]. The results of this study also support the idea that access to woodfuel resources may be impacted by the high rate of woodland loss between 2001 and 2020.

5. Conclusions

This study aimed to evaluate the change in woodland cover in the Same District in Tanzania’s Eastern Arc Mountains. We conducted LULCC detection for the entire Same District using remote sensing analysis of Landsat 7 for 2001 and Landsat 8 for 2020. We replaced traditional ground truth points with high-resolution Google Earth imagery, NDVI, and a 30 m global cover to create training sites. The alternative solution provided cost savings while also expanding accessibility and coverage of the study area. This study recognizes two main limitations of high-resolution Google Earth imagery, including temporal inconstancy and the absence of spectral data. To address these limitations, we adopted NDVI, and a global cover designed for Landsat’s 2020 image.
We classified the study area into five classes for both images: water, woodland, forest, cropland, and other land covers. The study revealed an adverse change in forest and woodland: −45.1% and −37.4%, respectively. While the study area experienced a decrease in woodland and forest, at the same time, there was a gain in cropland and other land cover for the last 20 years. This trend indicates that agricultural activities and urban development are central forest and woodland loss drivers in the study area. The forest loss did not end only in unprotected areas; it was also revealed in protected areas, which suggests illegal activities are going on.
The significant loss of woodland experienced between 2001 and 2020 represents an annual rate of 2.0% and 2.4% for woodland and forest loss, respectively, despite the large area of natural forest cover being under protected area. Forest loss in the protected area may be attributed to illegal agriculture expansion and illegal logging, implying that forest protection is ineffective in the area. In addition, the forest loss in protected areas threatens biodiversity and ecosystem services in the Eastern Arc Mountains. The evidenced loss of woodland and other land covers in the Eastern Arch Mountains may limit the community’s access to resources. The loss of forest and woodland covers, which essentially make up what is known as the Eastern Arch Mountains, means the failure to support the local population’s livelihoods.
Our study recommends future research to assess the woodland change and other land covers at different scale resolutions. Our study was only focused on a 30 m resolution for the Same District level, despite the Eastern Arc Mountains covering a vast area of Tanzania and Kenya. The research offers important findings about woodland reduction in the Eastern Arc Mountains. It advanced knowledge of woodland loss dynamics and spatial variability in the Same District from 2001 to 2020. However, these findings require careful interpretation because the study was limited to a small area of the Eastern Arc Mountains and relied solely on one resolution scale. We also suggest that future research assess the impact of the decline of the Eastern Arc Mountains’ resources on the community’s access to the resources. Future research should address the impact of woodland loss on rural community access to energy resources such as woodfuel. The reason is that most rural communities in sub-Saharan Africa still depend on forest resources for their energy access.

Author Contributions

Conceptualization, F.E.; methodology, F.E.; software, M.D.N.; validation, M.D.N., F.E. and R.M.; formal analysis, F.E.; investigation, F.E.; resources, M.D.N.; data curation, M.D.N.; writing—original draft preparation, F.E.; writing—review and editing, R.M. and M.D.N.; visualization, R.M.; supervision, M.D.N. and R.M. All authors have read and agreed to the published version of the manuscript.

Funding

This research received no external funding.

Data Availability Statement

All data used in this study is provided in this manuscript. Other materials will be made available upon request.

Acknowledgments

The authors are grateful to the United States Geological Survey (USGS) for making Landsat data publicly available.

Conflicts of Interest

The authors declare no conflicts of interest.

Abbreviations

The following abbreviations are used in this manuscript:
LULCCLand use land cover change
PAprotected area
NDVINormalized difference vegetation index
USGSUnited States Geological Survey
ETMEnhanced Thematic Mapper

Appendix A

Table A1. Land Use/Land Cover Classes and Descriptions.
Class NameDescriptionSource/Framework
WaterAreas covered by permanent or seasonal surface water bodies (e.g., lakes, rivers, wetlands).ESA WorldCover 2020 [69]
WoodlandAreas dominated by scattered trees with substantial undergrowth or shrubs, typically with 10–40% canopy cover.A Land Use and Land cover Classification System for Use with Remote Sensor Data [57]; Land Cover Classification System (LCCS) [70]
ForestDensely wooded areas with continuous tree cover, typically with >40% canopy cover. Includes natural and plantation forests.ESA WorldCover 2020 [69]
CroplandAreas under cultivation, including annual and perennial crops, fallow fields, and mixed farming systems.ESA WorldCover 2020 [69]
Other Land CoversIncludes built-up areas, bare land, grasslands, rocky areas, and any land cover not classified into the above categories.ESA WorldCover 2020 [69]

Appendix B

Description of LULCC as Used in This Study

Water in this study refers to all surface water bodies, such as rivers, dams, and lakes that were visible in both Landsat 7 and Landsat 8. Cropland in this study is land used for agricultural activities, whether cash crops or subsistence agriculture, which can be permanent or shifting cultivation. Woodland was used in this study to refer to all areas covered by open canopy trees, shrubland, thickets, and herbaceous trees, while forest referred to closed canopy trees, most of which were under PAs. Other land covers in this study referred to land covered with built-up areas, grassland, barren areas, and wetland areas.

References

  1. Newmark, W.D. Forest area, fragmentation, and loss in the Eastern Arc Mountains: Implications for the conservation of biological diversity. J. East Afr. Nat. Hist. 1998, 87, 29–36. [Google Scholar] [CrossRef]
  2. Maeda, E.E.; Pellikka, P.K.; Siljander, M.; Clark, B.J. Potential impacts of agricultural expansion and climate change on soil erosion in the Eastern Arc Mountains of Kenya. Geomorphology 2010, 123, 279–289. [Google Scholar] [CrossRef]
  3. Finch, J.; Marchant, R.; Courtney Mustaphi, C.J. Ecosystem change in the South Pare Mountain bloc, Eastern Arc Mountains of Tanzania. Holocene 2017, 27, 796–810. [Google Scholar] [CrossRef]
  4. Willcock, S.; Phillips, O.L.; Platts, P.J.; Balmford, A.; Burgess, N.D.; Lovett, J.C.; Ahrends, A.; Bayliss, J.; Doggart, N.; Doody, K.; et al. Correction to: Quantifying and understanding carbon storage and sequestration within the Eastern Arc Mountains of Tanzania, a tropical biodiversity hotspot. Carbon. Balance Manag. 2017, 12, e44795. [Google Scholar] [CrossRef]
  5. Dimitrov, D.; Nogues-Bravo, D.; Scharff, N. Why do tropical mountains support exceptionally high biodiversity? The Eastern Arc Mountains and the drivers of Saintpaulia diversity. PLoS ONE 2012, 7, e48908. [Google Scholar] [CrossRef]
  6. Green, J.M.H.; Larrosa, C.; Burgess, N.D.; Balmford, A.; Johnston, A.; Mbilinyi, B.P.; Platts, P.J.; Coad, L. Deforestation in an African biodiversity hotspot: Extent, variation and the effectiveness of protected areas. Biol. Conserv. 2013, 164, 62–72. [Google Scholar] [CrossRef]
  7. Mwampamba, T.H.; Ghilardi, A.; Sander, K.; Chaix, K.J. Dispelling common misconceptions to improve attitudes and policy outlook on charcoal in developing countries. Energy Sustain. Dev. 2013, 17, 75–85. [Google Scholar] [CrossRef]
  8. Hosonuma, N.; Herold, M.; De Sy, V.; De Fries, R.S.; Brockhaus, M.; Verchot, L.; Angelsen, A.; Romijn, E. An assessment of deforestation and forest degradation drivers in developing countries. Environ. Res. Lett. 2012, 7, 044009. [Google Scholar] [CrossRef]
  9. Willcock, S.; Phillips, O.L.; Platts, P.J.; Swetnam, R.D.; Balmford, A.; Burgess, N.D.; Lewis, S.L.; Bayliss, J.; Doggart, N.; Doody, K.; et al. Land cover change and carbon emissions over 100 years in an African biodiversity hotspot. Glob. Change Biol. 2016, 22, 2787–2800. [Google Scholar] [CrossRef]
  10. Curtis, P.G.; Slay, C.M.; Harris, N.L.; Tyukavina, A.; Hansen, M.C. Classifying drivers of global forest loss. Science 2018, 361, 1108–1111. [Google Scholar] [CrossRef]
  11. Doggart, N.; Morgan-Brown, T.; Lyimo, E.; Mbilinyi, B.; Meshack, C.K.; Sallu, S.M.; Spracklen, D.V. Agriculture is the main driver of deforestation in Tanzania. Environ. Res. Lett. 2020, 15, 034028. [Google Scholar] [CrossRef]
  12. Mwampamba, T.H. Has the woodfuel crisis returned? Urban charcoal consumption in Tanzania and its implications to present and future forest availability. Energy Policy 2007, 35, 4221–4234. [Google Scholar] [CrossRef]
  13. Campbell, J.F.; Fletcher, W.J.; Joannin, S.; Hughes, P.D.; Rhanem, M.; Zielhofer, C. Environmental drivers of Holocene forest development in the Middle Atlas, Morocco. Front. Ecol. Evol. 2017, 5, 113. [Google Scholar] [CrossRef]
  14. Packham, J.R.; Harding, D.J.; Hilton, G.M.; Stuttard, R.A. Functional Ecology of Woodlands and Forests; Springer Science & Business Media: Berlin/Heidelberg, Germany, 1992. [Google Scholar]
  15. URT. United Republic of Tanzania, National Energy Policy (NEP), Ministry of Energy and Minerals, Dar es Salaam. 2015. Available online: https://www.nishati.go.tz/uploads/documents/en-1622283004-National%20Energy%20Policy%20(NEP),%202015.pdf (accessed on 2 June 2025).
  16. Chidumayo, E.N.; Gumbo, D.J. The environmental impacts of charcoal production in tropical ecosystems of the world: A synthesis. Energy Sustain. Dev. 2013, 17, 86–94. [Google Scholar] [CrossRef]
  17. Sander, K.; Gros, C.; Peter, C. Enabling reforms: Analyzing the political economy of the charcoal sector in Tanzania. Energy Sustain. Dev. 2013, 17, 116–126. [Google Scholar] [CrossRef]
  18. Zulu, L.C. The forbidden fuel: Charcoal, urban woodfuel demand and supply dynamics, community forest management and woodfuel policy in Malawi. Energy Policy 2010, 38, 3717–3730. [Google Scholar] [CrossRef]
  19. Zulu, L.C.; Richardson, R.B. Charcoal, livelihoods, and poverty reduction: Evidence from sub-Saharan Africa. Energy Sustain. Dev. 2013, 17, 127–137. [Google Scholar] [CrossRef]
  20. Scheid, A.; Hafner, J.M.; Hoffmann, H.; Kächele, H.; Uckert, G.; Sieber, S.; Rybak, C. Adapting to fuelwood scarcity: The farmers’ perspective. Front. Sustain. Food Syst. 2019, 3, 28. [Google Scholar] [CrossRef]
  21. Hoffmann, H.; Uckert, G.; Rybak, C.; Graef, F.; Sander, K.; Sieber, S. Efficiency scenarios of charcoal production and consumption–a village case study from Western Tanzania. Food Secur. 2018, 10, 925–938. [Google Scholar] [CrossRef]
  22. Mayer, A.L.; Buma, B.; Davis, A.; Gagné, S.A.; Loudermilk, E.L.; Scheller, R.M.; Schmiegelow, F.K.; Wiersma, Y.F.; Franklin, J. How landscape ecology informs global land-change science and policy. BioScience 2016, 66, 458–469. [Google Scholar] [CrossRef]
  23. Li, M.; Zang, S.; Zhang, B.; Li, S.; Wu, C. A review of remote sensing image classification techniques: The role of socio spatial-contextual information. Eur. J. Remote Sens. 2014, 47, 389–411. [Google Scholar] [CrossRef]
  24. Meyer, W.B.; BL Turner, I.I. (Eds.) Changes in Land Use and Land Cover: A Global Perspective; Cambridge University Press: Cambridge, UK, 1994; Volume 4. [Google Scholar]
  25. Pielke Sr, R.A.; Pitman, A.; Niyogi, D.; Mahmood, R.; McAlpine, C.; Hossain, F.; Goldewijk, K.K.; Nair, U.; Betts, R.; de Noblet, N.; et al. Land. use/land cover changes and climate: Modeling analysis and observational evidence. Wiley Interdiscip. Rev. Clim. Change 2011, 2, 828–850. [Google Scholar] [CrossRef]
  26. Basommi, L.P.; Guan, Q.F.; Cheng, D.D.; Singh, S.K. Dynamics of land use change in a mining area: A case study of Nadowli District, Ghana. J. Mt. Sci. 2016, 13, 633–642. [Google Scholar] [CrossRef]
  27. Thonfeld, F.; Steinbach, S.; Muro, J.; Kirimi, F. Long-term land use/land cover change assessment of the Kilombero catchment in Tanzania using random forest classification and robust change vector analysis. Remote Sens. 2020, 12, 1057. [Google Scholar] [CrossRef]
  28. Mauya, E.W.; Mugasha, W.A.; Njana, M.A.; Zahabu, E.; Malimbwi, R. Carbon stocks for different land cover types in Mainland Tanzania. Carbon Balance Manag. 2019, 14, 4. [Google Scholar] [CrossRef]
  29. Jensen, J.R. Remote Sensing of the Environment: An Earth Resource Perspective 2/E; Pearson Education India: Chennai, India, 2009. [Google Scholar]
  30. Maeda, E.E. Downscaling MODIS LST in the East African mountains using elevation gradient and land-cover information. Int. J. Remote Sens. 2014, 35, 3094–3108. [Google Scholar] [CrossRef]
  31. Soini, E. Land use and land cover changes patterns and livelihood dynamics on the slopes of Mt. Kilimanjaro, Tanzania. Agric. Syst. 2005, 85, 306–323. [Google Scholar] [CrossRef]
  32. Hyandye, C.B.; Worqul, A.; Martz, L.W.; Muzuka, A.N. The impact of future climate and land use/cover change on water resources in the Ndembera watershed and their mitigation and adaptation strategies. Environ. Syst. Res. 2018, 7, 7. [Google Scholar] [CrossRef]
  33. Paavola, J. Livelihoods, vulnerability, and adaptation to climate change in Morogoro, Tanzania. Environ. Sci. Policy 2008, 11, 642–654. [Google Scholar] [CrossRef]
  34. Tumbo, S.D.; Kahimba, F.C.; Mbilinyi, B.P.; Rwehumbiza, F.B.; Mahoo, H.F.; Mbungu, W.B.; Enfors, E. Impact of projected climate change on agricultural production in semi-arid areas of Tanzania: A case of the Same district. Afr. Crop Sci. J. 2012, 20, 453–463. [Google Scholar]
  35. Mmasa, J. Impact of ginger farming on smallholder farmers’ income in Tanzania—Case of the same district. Asian J. Agric. Ext. Econ. Sociol. 2017, 20, 1–10. [Google Scholar] [CrossRef]
  36. Warner, T.; Almutairi, A.; Lee, J.Y. Remote Sensing of Land Cover Change; SAGE: London, UK, 2009; pp. 459–472. [Google Scholar]
  37. Agarwal, S.; Rao, P.; Nagendra, H. Fifteen years of fragmentation and land cover change in India’s ten largest cities–A Google Earth Engine analysis. Cities Environ. 2023, 16, 2. [Google Scholar] [CrossRef]
  38. Agarwal, S.; Nagendra, H. Classification of Indian cities using Google Earth Engine. J. Land Use Sci. 2019, 14, 425–439. [Google Scholar] [CrossRef]
  39. Hu, Y.; Raza, A.; Syed, N.R.; Acharki, S.; Ray, R.L.; Hussain, S.; Dehghanisanij, H.; Dehghanisanij, H.; Elbeltagi, A. Land use/land cover change detection and NDVI estimation in Pakistan’s Southern Punjab Province. Sustainability 2023, 15, 3572. [Google Scholar] [CrossRef]
  40. Aroma, R.J.; Raimond, K.; Estrela, V.V.; De Jesus, M.A. A coastal band spectral combination for water body extraction using Landsat 8 images. Int. J. Environ. Sci. Technol. 2024, 21, 1767–1784. [Google Scholar] [CrossRef]
  41. Li, P.; Jiang, L.; Feng, Z. Cross-comparison of vegetation indices derived from Landsat-7 enhanced thematic mapper plus (ETM+) and Landsat-8 operational land imager (OLI) sensors. Remote Sens. 2013, 6, 310–329. [Google Scholar] [CrossRef]
  42. Hais, M.; Hellebrandová, K.N.; Šrámek, V. Potential of Landsat spectral indices in regard to the detection of forest health changes due to drought effects. J. For. Sci. 2019, 65, 70–78. [Google Scholar] [CrossRef]
  43. Boonpook, W.; Tan, Y.; Nardkulpat, A.; Torsri, K.; Torteeka, P.; Kamsing, P.; Sawangwit, U.; Pena, J.; Jainaen, M. Deep learning semantic segmentation for land use and land cover types using Landsat 8 imagery. ISPRS Int. J. Geo-Inf. 2023, 12, 14. [Google Scholar] [CrossRef]
  44. Estoque, R.C.; Murayama, Y. Classification and change detection of built-up lands from Landsat-7 ETM+ and Landsat-8 OLI/TIRS imageries: A comparative assessment of various spectral indices. Ecol. Indic. 2015, 56, 205–217. [Google Scholar] [CrossRef]
  45. Moik, J.G. Digital Processing of Remotely Sensed Images; NASA SP-431; NASA Special Publication: Washington, DC, USA, 1980; p. 431.
  46. Lillesand, T.; Kiefer, R.W.; Chipman, J. Remote Sensing and Image Interpretation; John Wiley & Sons: Hoboken, NJ, USA, 2015. [Google Scholar]
  47. Jensen, J.R. Remote Sensing of the Environment from An Earth Resource Perspective; Prentice Hall: Upper Saddle River, NJ, USA, 2000. [Google Scholar]
  48. Punia, M.; Joshi, P.K.; Porwal, M.C. Decision tree classification of land use land cover for Delhi, India using IRS-P6 AWiFS data. Expert Syst. Appl. 2011, 38, 5577–5583. [Google Scholar] [CrossRef]
  49. Jensen, J.R. Remote Sensing of the Environment, 2nd ed.; Pearson Prentice Hall: Upper Saddle River, NJ, USA, 2007. [Google Scholar]
  50. Huang, L.; Ni, L. Object-oriented classification of high-resolution satellite image for better accuracy. In Proceedings of the 8th International Symposium on Spatial Accuracy Assessment in Natural Resources and Environmental Sciences, Shanghai, China, 25–27 June 2008; pp. 211–218. [Google Scholar]
  51. Mantero, P.; Moser, G.; Serpico, S.B. Partially supervised classification of remote sensing images through SVM-based probability density estimation. IEEE Trans. Geosci. Remote Sens. 2005, 43, 559–570. [Google Scholar] [CrossRef]
  52. Deilmai, B.R.; Ahmad, B.B.; Zabihi, H. Comparison of two classification methods (MLC and SVM) to extract land use and land cover in Johor Malaysia. In IOP Conference Series: Earth and Environmental Science; IOP Publishing: Bristol, UK, 2014; Volume 20, p. 012052. [Google Scholar]
  53. Dong, R.; Dong, J.; Wu, G.; Deng, H. Optimization of post-classification processing of high-resolution satellite image: A case study. Sci. China Ser. E Technol. Sci. 2006, 49, 98–107. [Google Scholar] [CrossRef]
  54. Yuan, F.; Sawaya, K.E.; Loeffelholz, B.C.; Bauer, M.E. Land Cover Classification and Change Analysis of the Twin Cities (Minnesota) metropolitan area by multitemporal Landsat Remote Sensing. Remote Sens. Environ. 2005, 98, 317–328. [Google Scholar] [CrossRef]
  55. El-Hattab, M.M. Applying post-classification change detection technique to monitor an Egyptian coastal zone (Abu Qir Bay). Egypt. J. Remote Sens. Space Sci. 2016, 19, 23–36. [Google Scholar] [CrossRef]
  56. Loosvelt, L.; Peters, J.; Skriver, H.; Lievens, H.; Van Coillie, F.M.; De Baets, B.; Verhoest, N.E. Random Forests as a tool for estimating uncertainty at pixel-level in SAR image classification. Int. J. Appl. Earth Obs. Geoinf. 2012, 19, 173–184. [Google Scholar] [CrossRef]
  57. Anderson, J.R. A Land Use and Land Cover Classification System for Use with Remote Sensor Data; US Government Printing Office: Washington, DC, USA, 1976; Volume 964.
  58. Lu, D.; Mausel, P.; Brondizio, E.; Moran, E. Change detection techniques. Int. J. Remote Sens. 2004, 25, 2365–2401. [Google Scholar] [CrossRef]
  59. Foody, G.M. Status of Land Cover Classification Accuracy Assessment. Remote Sens. Environ. 2002, 80, 185–201. [Google Scholar] [CrossRef]
  60. Kideghesho, J.R. Realities on deforestation in Tanzania—Trends, drivers, implications and the way forward. In Precious Forests-Precious Earth; IntechOpen: London, UK, 2015. [Google Scholar]
  61. Burgess, N.D.; Balmford, A.; Platts, P.; Schaafsma, M.; Doggart, N. Valuing the Arc. Special Edition of the Arc Journal. Arc J. 2014, 29, 1–24. [Google Scholar]
  62. Uisso, A.M.; Tanrıvermiş, H. Driving factors and assessment of changes in the use of arable land in Tanzania. Land Use Policy 2021, 104, 105359. [Google Scholar] [CrossRef]
  63. Fisher, A.C.; Hanemann, W.M.; Roberts, M.J.; Schlenker, W. The economic impacts of climate change: Evidence from agricultural output and random fluctuations in weather: Comment. Am. Econ. Rev. 2012, 102, 3749–3760. [Google Scholar] [CrossRef]
  64. Mesfin, D.; Simane, B.; Belay, A.; Recha, J.W.; Taddese, H. Woodland cover change in the Central Rift Valley of Ethiopia. Forests 2020, 11, 916. [Google Scholar] [CrossRef]
  65. Yimer, F.; Abdelkadir, A. Soil property changes following conversion of acacia woodland into grazing and farmlands in the Rift Valley area of Ethiopia. Land Degrad. Dev. 2011, 22, 425–431. [Google Scholar] [CrossRef]
  66. Jew, E.K.; Dougill, A.J.; Sallu, S.M.; O’Connell, J.; Benton, T.G. Miombo woodland under threat: Consequences for tree diversity and carbon storage. For. Ecol. Manag. 2016, 361, 144–153. [Google Scholar] [CrossRef]
  67. Waswa, F.; Mcharo, M.; Mworia, M. Declining wood fuel and implications for household cooking and diets in tigania Sub- County Kenya. Sci. Afr. 2020, 8, e00417. [Google Scholar] [CrossRef]
  68. Masera, O.R.; Bailis, R.; Drigo, R.; Ghilardi, A.; Ruiz-Mercado, I. Environmental burden of traditional bioenergy use. Annu. Rev. Environ. Resour. 2015, 40, 121–150. [Google Scholar] [CrossRef]
  69. Zanaga, D.; Van De Kerchove, R.; Daems, D.; De Keersmaecker, W.; Brockmann, C.; Kirches, G.; Arino, O. ESA WorldCover 10 m 2021 v200. 2022. Available online: https://zenodo.org/records/5571936 (accessed on 7 July 2025).
  70. Di Gregorio, A.; Jansen, L.J. Land Cover Classification System (LCCS): Classification Concepts and User Manual; FAO: Rome, Italy, 1998. [Google Scholar]
Figure 1. Study Area: Same Districts in Eastern Arc Mountains of Tanzania.
Land 14 01546 g001
Figure 2. Remote Sensing Analysis Workflow.
Land 14 01546 g002
Figure 3. Land Cover Map of Same District for 2001 and 2020.
Land 14 01546 g003
Figure 4. Land Cover Gains and Loss Between the Years 2001–2020 in %.
Land 14 01546 g004
Figure 5. Woodland Cover for the Study Area Between 2001 and 2020.
Land 14 01546 g005
Figure 6. Land Change for the Study Area Between 2001 and 2020.
Land 14 01546 g006
Figure 7. A Cluster of Villages with High and Low Levels of Woodland Change.
Land 14 01546 g007
Table 1. Satellite Images and Multispectral Bands Used in Classification.
YearDaySatellite ImageryPass/RowSpectral ResolutionSpatial Resolution
200127 AugustLandsat 7167/0631 to 5 and 730 m
202023 AugustLandsat 8167/0631 to 7 and 930 m
Table 2. Bands of Landsat Enhanced Thematic Mapper (ETM+).
Wavelength (µm)BandResolutionUses
0.45–0.52Band 130 mWater body detection [40]
0.63–0.69Band 330 mVegetation analysis [41]
0.77–0.90Band 430 mIdentifies vegetation health [42]
1.55–1.75Band 530 mLand cover differentiation [43]
2.08–2.35Band 730 mIdentifies barren land, built-up areas [44]
Table 3. Bands of Landsat 8.
Wavelength (µm)BandResolutionUses
0.45–0.51Band 2—Blue30 mWater body detection
0.64–0.67Band 4—Red30 m Vegetation analysis
0.85–0.88Band 5—Near-infrared (NIR)30 mIdentifies vegetation health
1.57–1.65Band 6—SWIR 130 mLand cover differentiation
2.11–2.29Band 7—SWIR 230 mIdentifies barren land, built-up areas
Table 4. (a) Confusion Matrix for the Landsat Image for 2020. (b) Confusion Matrix for the Landsat Image for 2001.
(a)
ClassesWaterWoodlandForestCroplandOther Land coversTotalUser’s Accuracy
Water10000010100%
Woodland025103525997%
Forest00220022100%
Cropland018082010082%
Other Land covers022019511881%
Total102912286100509
Producer’s Accuracy100%86%100%95%95% 90%
Kappa = 85%
(b)
ClassesWaterWoodlandForestCroplandOther Land coversTotalUser’s Accuracy
Water900011090%
Woodland032602533398%
Forest00340034100%
Cropland01614056265%
Other Land covers0710627089%
Total9349364273509
Producer’s Accuracy100%93%94%95%85% 93%
Kappa = 86%
Table 5. Areas of Land Use and Land Covers for the Years 2001 and 2020.
Class NameArea (km2) 2001Area (km2) 2020Percentage Change (%)
Water8.77.5−13.7
Woodland4136.83224.8−22.0
Forest424.9271.6−36.0
Cropland 776.51244.860.3
Other Land Covers870.51468.768.7
Table 6. Land Use and Land Cover Change Between the Years 2001 and 2020.
Class NameArea (km2) 2001Area (km2)
2020
Area (km2) Change% of ChangeArea (km2)
No Change
Water8.77.5−1.9−13.76.8
Woodland4136.83224.8−1547.6−22.02589.0
Forest424.9271.6−191.8−36.0233.1
Cropland 776.51244.8343.160.3433.5
Other Land Covers870.51468.7440.768.7429.7
Table 7. Woodland Change and No Change for the Years 2001 and 2020.
Class Name Class From Class ToArea (km2)% of Change
Woodland → WaterWoodlandWater 0.40.01
Woodland → ForestWoodlandForest22.60.55
Woodland → CroplandWoodlandCropland 606.514.65
Woodland → Other Land CoversWoodlandOther Land Covers918.122.19
Woodland (No Change)WoodlandWoodland258962.58
Disclaimer/Publisher’s Note: The statements, opinions and data contained in all publications are solely those of the individual author(s) and contributor(s) and not of MDPI and/or the editor(s). MDPI and/or the editor(s) disclaim responsibility for any injury to people or property resulting from any ideas, methods, instructions or products referred to in the content.

