Article

Dynamic Assessment of Street Environmental Quality Using Time-Series Street View Imagery Within Daily Intervals

Shanghai Academy of Fine Arts, Shanghai University, Shangda Road No. 99, Shanghai 200444, China
*
Author to whom correspondence should be addressed.
Land 2025, 14(8), 1544; https://doi.org/10.3390/land14081544
Submission received: 22 June 2025 / Revised: 17 July 2025 / Accepted: 25 July 2025 / Published: 27 July 2025
(This article belongs to the Special Issue Planning for Sustainable Urban and Land Development, Second Edition)

Abstract

Rapid urbanization has intensified global settlement density, significantly increasing the importance of urban street environmental quality, which profoundly affects residents’ physical and psychological well-being. Traditional methods for evaluating urban environmental quality have largely overlooked dynamic perceptual changes occurring throughout the day, resulting in incomplete assessments. To bridge this methodological gap, this study presents an innovative approach combining advanced deep learning techniques with time-series street view imagery (SVI) analysis to systematically quantify spatio-temporal variations in the perceived environmental quality of pedestrian-oriented streets. It further addresses two central questions: how perceived environmental quality varies spatially across sections of a pedestrian-oriented street and how these perceptions fluctuate temporally throughout the day. Utilizing Golden Street, a representative living street in Shanghai’s Changning District, as the empirical setting, street view images were manually collected at 96 sampling points across multiple time intervals within a single day. The collected images underwent semantic segmentation using the DeepLabv3+ model, and emotional scores were quantified through the validated MIT Place Pulse 2.0 dataset across six subjective indicators: “Safe,” “Lively,” “Wealthy,” “Beautiful,” “Depressing,” and “Boring.” Spatial and temporal patterns of these indicators were subsequently analyzed to elucidate their relationships with environmental attributes. This study demonstrates the effectiveness of integrating deep learning models with time-series SVI for assessing urban environmental perceptions, providing robust empirical insights for urban planners and policymakers. The results emphasize the necessity of context-sensitive, temporally adaptive urban design strategies to enhance urban livability and psychological well-being, ultimately contributing to more vibrant, secure, and sustainable pedestrian-oriented urban environments.

1. Introduction

In recent decades, rapid urbanization has significantly reshaped global settlement patterns, leading more than half of the world’s population—and approximately three-quarters of economic activities—to concentrate in urban areas [1,2]. The physical quality of urban environments profoundly influences residents’ daily activities, social interactions, and overall sense of well-being [3]. Urban streets, as multifunctional public spaces, integrate social, economic, and cultural dimensions. They serve as critical arenas for communal interactions and public life, reflecting broader urban social dynamics [4]. Streets often represent the most fundamental spatial units for observing public behaviors, social interactions, and communal values [5]. Recent research further underscores the significant impacts street quality exerts on human health, psychological well-being, and overall urban livability [6]. Consequently, accurately assessing and quantifying street environments is increasingly important for understanding residents’ perceptions and informing effective urban renewal and development initiatives.
Technological advancements, particularly the integration of deep learning techniques with street view imagery (SVI), have enabled rapid, large-scale, and automated assessments of human perceptions regarding urban built environments, significantly surpassing traditional methods based on manual or survey-driven evaluations [7]. While existing research utilizing SVI effectively highlights spatial disparities in environmental attributes, it predominantly neglects temporal variations, thus inadequately addressing the dynamic nature of human environmental perceptions over time. Specifically, the update frequency of SVI has long been problematic. In certain regions, image acquisition rates are low and often outdated, failing to provide sufficient data for current-status monitoring, update analysis, or activation time analysis (e.g., change detection). Moreover, the service does not support historical image queries by design, and inconsistencies may arise from different parts of the same city being imaged at varying times. The timing of image collection also poses challenges: First, image capture may mismatch required research cycles or other datasets used in studies. Second, the timing of annual data collection itself could introduce bias [8,9].
Furthermore, despite their centrality to urban life and interactions, living streets–pedestrian-oriented streets emphasizing community activities, leisure, and social engagements—remain underrepresented in empirical research employing SVI. Addressing these identified research gaps, this study proposes an innovative approach integrating advanced deep learning models with time-series SVI to systematically evaluate street environmental quality across spatial and temporal dimensions. By applying this approach, this study aims to identify key environmental attributes requiring enhancement, thereby facilitating targeted improvements to promptly enhance residents’ satisfaction and urban livability. This research specifically investigates two key questions:
1. How does the perception of street environmental quality at different locations on the same street change dynamically over time within a day, and what kind of spatial variation patterns are presented by such dynamic changes?
2. How does the perception of street environmental quality fluctuate dynamically over time of the day at the same location on the street, and what identifiable patterns emerge from these temporal dynamics?
To systematically explore these questions, this research employs a methodological framework anchored in six rigorously selected subjective perception indicators: “Safe,” “Lively,” “Boring,” “Wealthy,” “Depressing,” and “Beautiful.” These indicators were chosen based on their established reliability, broad applicability, and effectiveness in capturing nuanced emotional and perceptual responses in urban environmental studies [10,11,12]. Utilizing deep learning models trained on validated perceptual datasets, this study generated detailed, quantifiable indicator scores that enable precise comparisons of environmental quality across different spatial locations and time periods.
Golden Street, located in the Gubei area of Shanghai’s Changning District, serves as the empirical context for this study. Spanning approximately 700 m with widths ranging from 40 to 80 m, Golden Street integrates vibrant commercial, leisure, and community functions, resulting in consistently high pedestrian activity and social interaction [13]. As one of Shanghai’s earliest international residential districts, the perceptual experiences of residents regarding environmental quality on Golden Street hold considerable importance for urban planning and quality-of-life enhancement. Consequently, this study pursues three specific objectives: firstly, to analyze the spatial differences in street environment perception at different times in a day and reveal the dynamic spatial variations using a deep learning method; secondly, to explore how the environmental perception of fixed street locations fluctuates dynamically over different periods of time and analyze the dynamic change patterns of perception within a day; thirdly, to reveal the dynamic influence mechanism of environmental characteristics in the time dimension by deeply exploring the correlation between the dynamic time-series change in street environment perception and the physical characteristics of streets.
Collectively, achieving these objectives will provide nuanced insights and robust empirical evidence to inform targeted, context-specific urban renewal strategies and policy interventions.

2. Related Work

2.1. Analyzing Street View Imagery Through Deep Learning

Efficiently and economically assessing the environmental quality of urban streets has historically posed methodological challenges. Recent advances in semantic segmentation techniques, particularly within deep learning frameworks, have provided new opportunities to address these issues. Semantic segmentation enables the detailed extraction and analysis of environmental components within street view imagery (SVI), significantly surpassing traditional manual methods in terms of scale, efficiency, and accuracy.
Google Street View (GSV), launched in 2007, has become a widely utilized global mapping tool, currently covering approximately half the world’s population and frequently employed in urban studies [14,15]. Images from GSV are typically collected by vehicles equipped with GPS and sophisticated sensor arrays, capturing panoramic photos annotated with precise spatial coordinates. Previous research has confirmed that street view images provide a more accurate representation of urban environments as experienced by pedestrians, in contrast to aerial imagery and other remote sensing sources, due to their alignment with actual human visual perspectives [16,17].
Deep learning techniques, especially semantic segmentation, effectively manage the inherent complexity of urban street scenes by identifying detailed patterns from large-scale, multidimensional datasets [18]. Earlier image datasets often encountered difficulties in accurately capturing urban streetscape variability caused by lighting changes, visual obstructions, and the diverse nature of urban elements. However, the introduction of the Place Pulse 2.0 dataset developed by MIT represents an advancement. This dataset encompasses over 110,000 street view images from cities worldwide and includes more than 1.1 million pairwise comparisons across six subjective perceptual dimensions: “Safe,” “Lively,” “Boring,” “Wealthy,” “Depressing,” and “Beautiful” [19]. These dimensions encompass the primary emotional responses and social perceptions people may develop in urban spaces. Key elements include “Safe,” which directly influences behavioral decisions and comfort levels; “Wealthy,” reflecting regional economic development and resource distribution; esthetic experiences like “Beautiful” and “Depressing,” which impact mental health and residential satisfaction; and “Lively,” indicating social engagement and living atmosphere within the area [20]. These corresponding contents are consistent with the improvement of living environment quality and the reconstruction of commercial vitality in the “Changning District Urban Renewal 2025-2027 Action Plan.”
The Place Pulse 2.0 dataset has facilitated advances in urban studies. For example, Wei et al. (2022) employed this dataset to map urban landscape perceptions in central Shanghai, revealing a clear preference for administrative and service-oriented areas and demonstrating how green spaces significantly reduce perceptions of depression [21]. Similarly, Zhang et al. (2021) explored correlations between perceived safety and actual crime rates in Houston, highlighting the practical utility of perceptual data in urban safety research [22]. Therefore, Place Pulse 2.0 serves as a crucial resource for urban designers and policymakers aiming to improve urban environmental quality through targeted interventions.

2.2. Human Perception of Urban Street Environments

Human perception of urban environments is inherently subjective, influenced by various individual and contextual factors [21]. Nevertheless, integrating SVI with deep learning models provides a novel and reliable approach for quantifying these subjective perceptions at a large scale [11,19]. Since vision constitutes the primary sensory modality through which individuals perceive their surroundings, visual assessment is particularly valuable for evaluating urban landscapes [23]. Although SVI does not perfectly replicate dynamic human visual experiences, these images serve as robust static representations suitable for large-scale perceptual studies.
Quantifying subjective perceptions directly is challenging; however, relative judgment methods—such as those employed in the Place Pulse 2.0 dataset—simplify complex perceptual evaluations effectively. Previous studies have validated pairwise comparison methods across diverse contexts, including educational preferences and taste assessments, affirming their reliability in environmental perception research [24,25]. Moreover, perceptual responses frequently correlate with tangible environmental characteristics. For instance, Smardon (1988) established that people typically prefer natural landscapes featuring rich vegetation and water elements [26]. Expanding on this, Liu et al. (2024) demonstrated significant inverse correlations between the presence of vegetation (such as trees, shrubs, and grass) and urban crime rates, further underscoring the profound influence of physical environmental attributes on subjective perceptions [27]. Therefore, deep learning analyses of SVI represent a compelling method for systematically understanding human perceptions of urban street environments.

2.3. Challenges in Analyzing SVI Using Time-Series Approaches
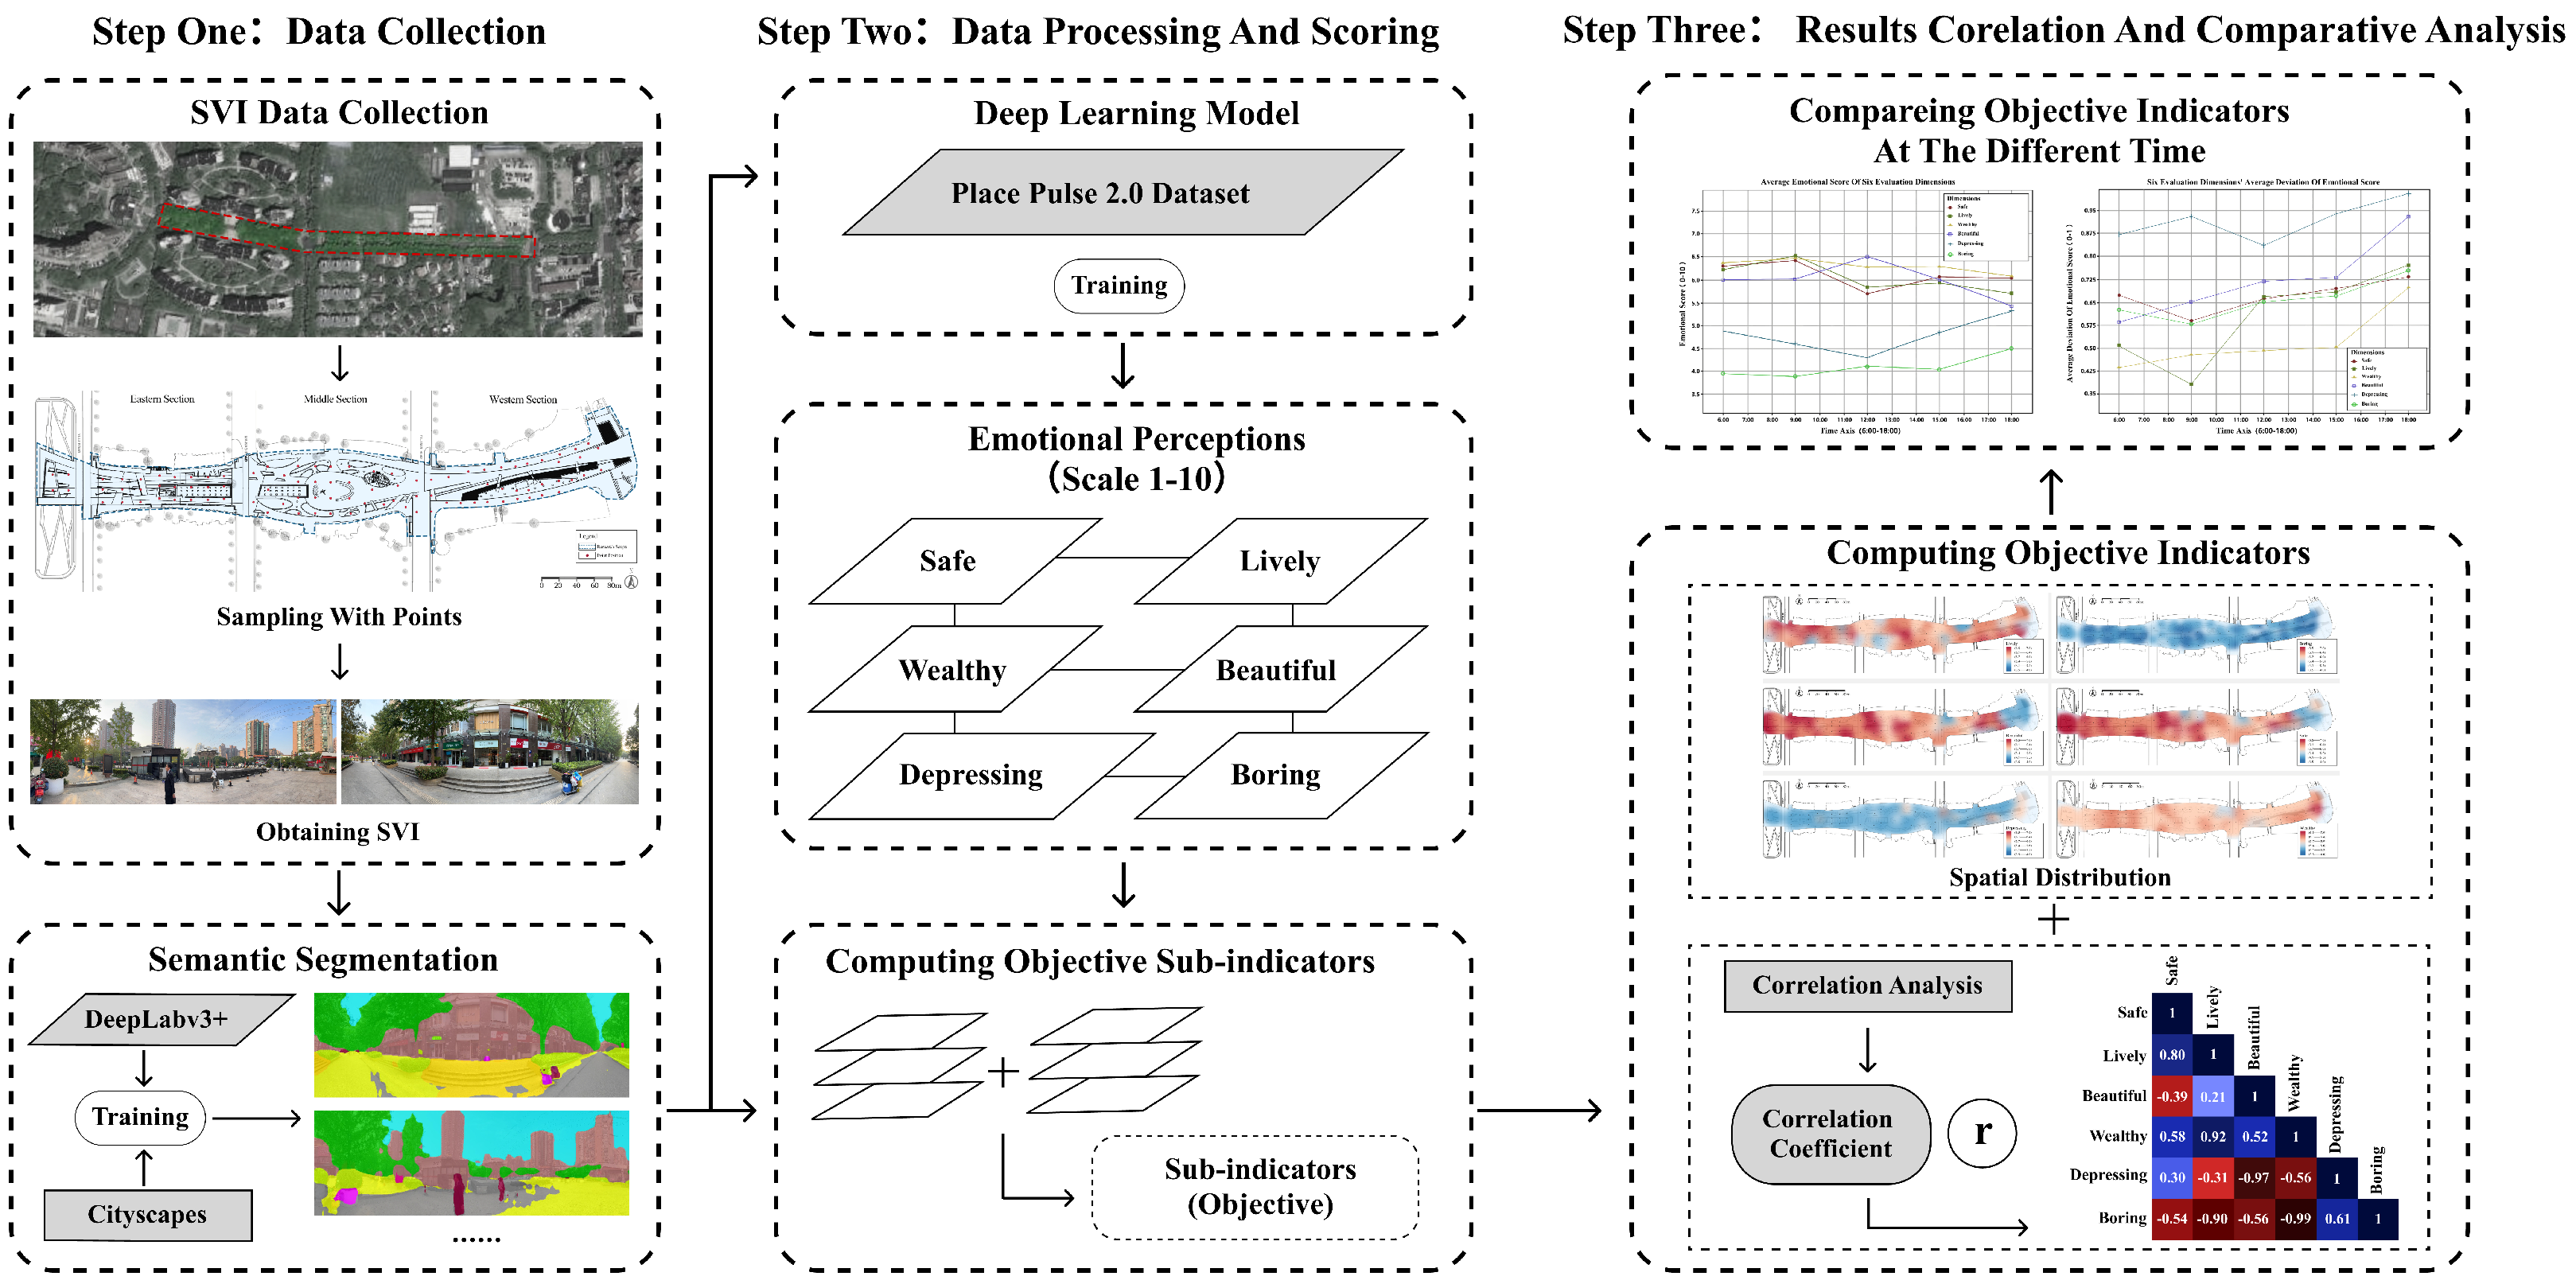
Despite the prevalence of SVI-based analyses, most existing studies neglect temporal dynamics, focusing predominantly on spatial variability at single points in time [8,28]. Such static perspectives inadequately capture the dynamic complexity inherent in evolving urban spaces. Additionally, widely used deep learning models, such as PlaceCNN, currently do not explicitly incorporate temporal variables, creating a methodological gap in understanding perceptual variations over time.
Street environments inherently exhibit temporal variability, influenced by fluctuating factors such as natural lighting, weather conditions, pedestrian density, and commercial activities. These temporal variations significantly affect perceived environmental quality, underscoring the importance of continuously monitoring and evaluating such changes. Time-series street view imagery thus provides a promising approach for capturing these dynamic variations in environmental quality. However, despite the increasing availability of such data, systematic urban monitoring using time-series imagery remains relatively sparse in the literature [29,30], particularly concerning pedestrian-oriented or living streets.
Critically, few studies have utilized the Place Pulse 2.0 dataset to assess temporal dynamics in human perceptions of living street quality specifically. This notable research gap highlights the need for empirical investigations that systematically explore temporal perceptual changes in pedestrian-centric urban contexts. Addressing this gap, the current study explicitly incorporates a temporal dimension in analyzing perceptual variations, substantially contributing to the methodological advancement of urban environmental assessments.

3. Methodology

3.1. Research Framework
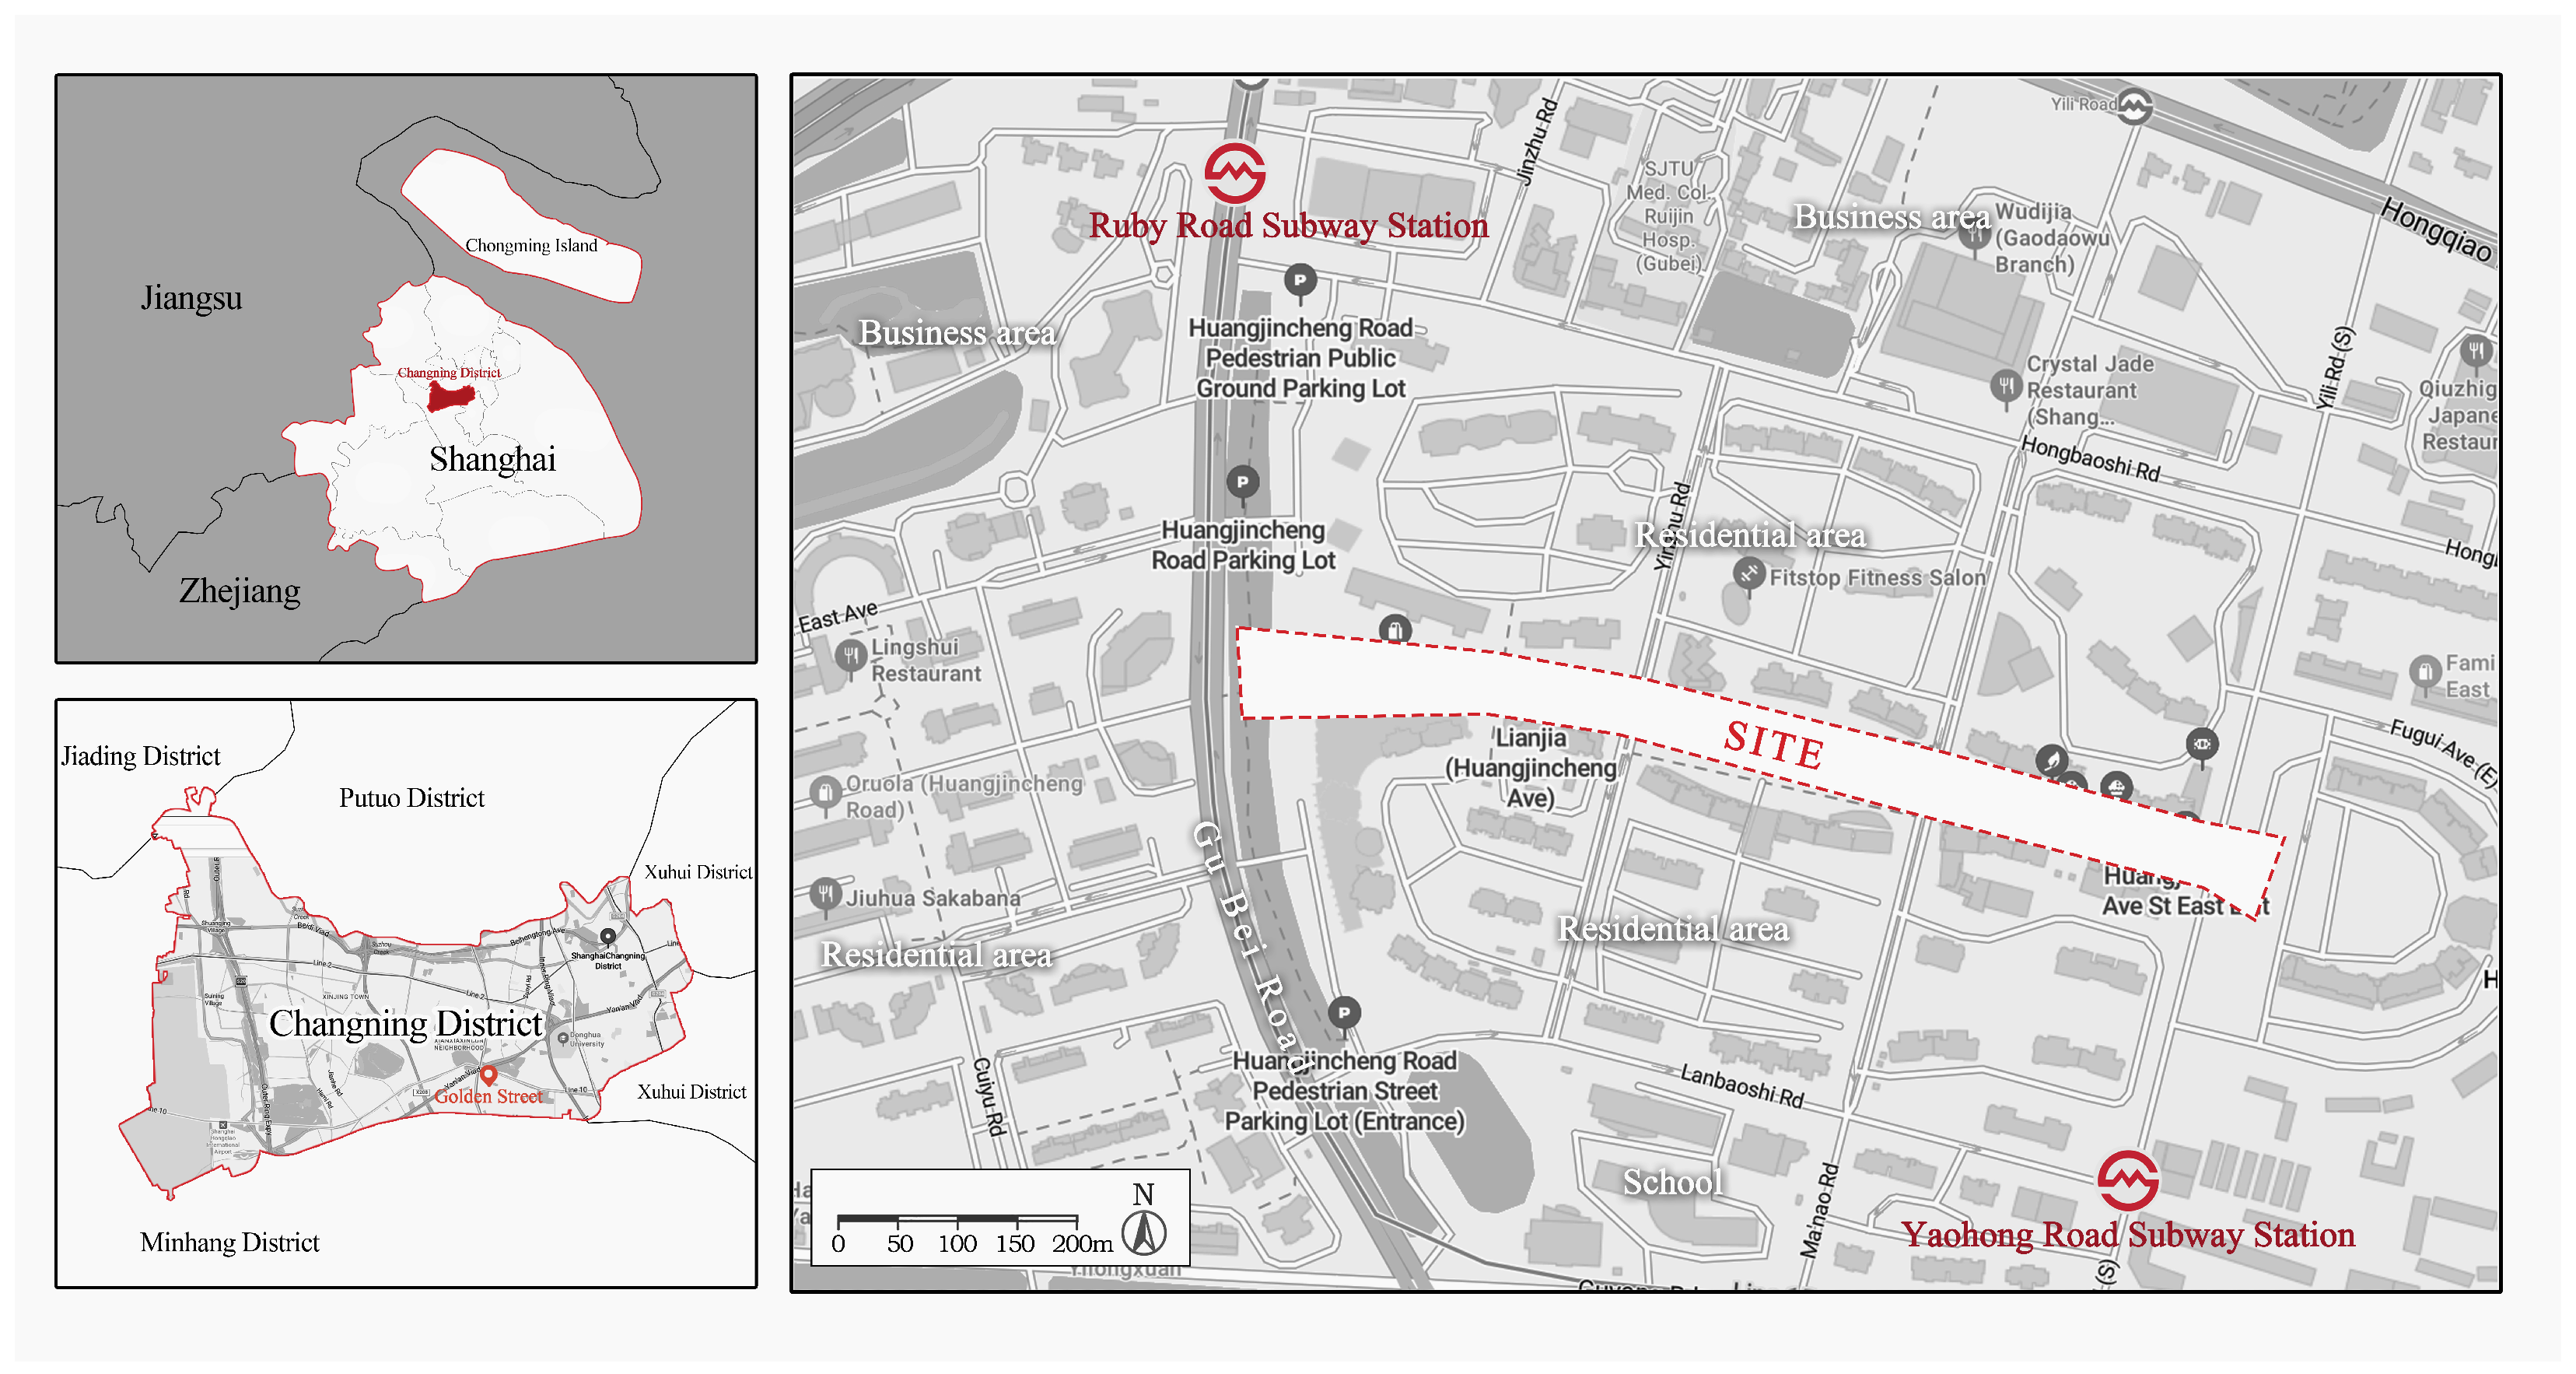
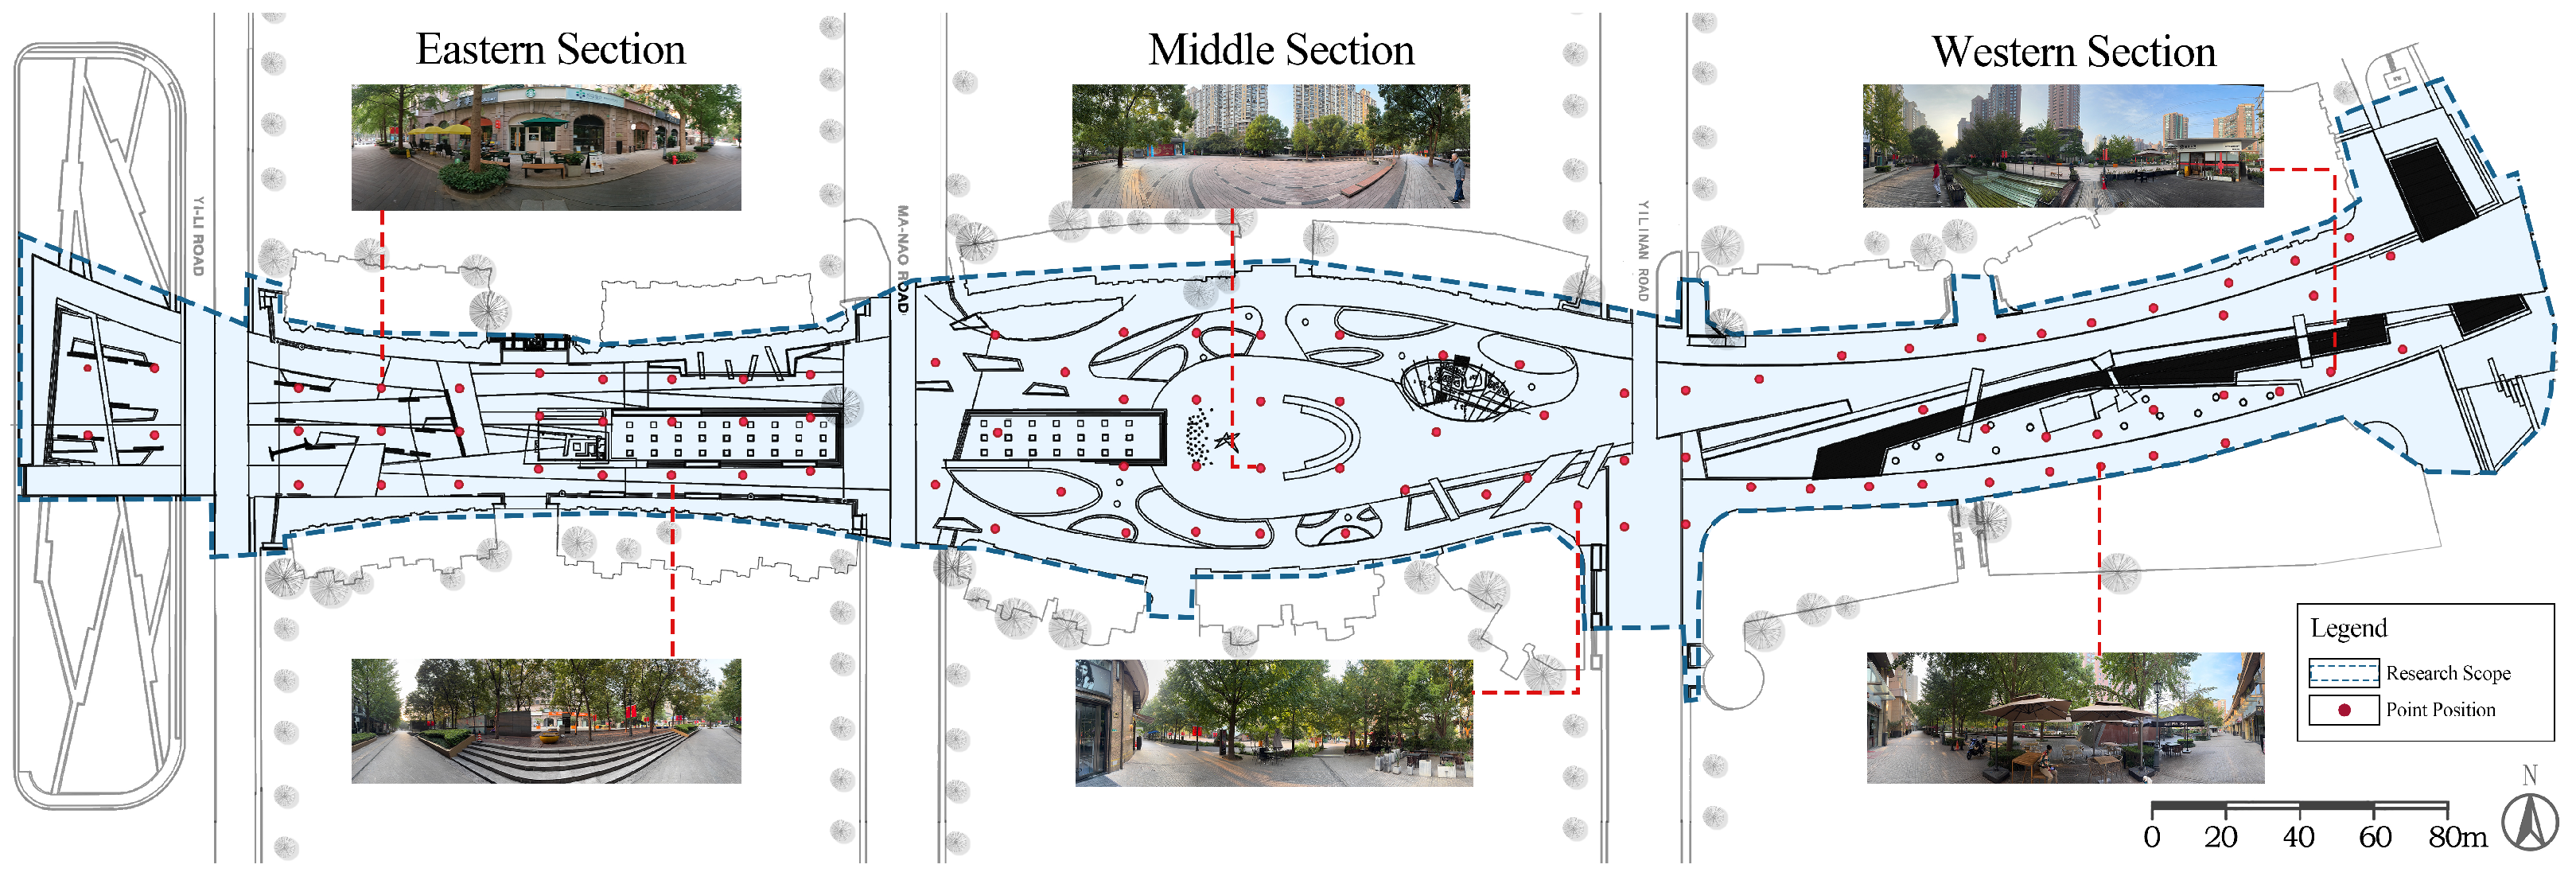
The methodological framework adopted in this study comprises three interconnected stages, as illustrated in Figure 1: (1) data collection, (2) data processing and scoring, and (3) result calculation and comparative analysis. In the first stage, sampling points were systematically determined to capture street view imagery (SVI) at multiple locations along Golden Street and at multiple time intervals within a single day.
The second stage involved advanced data processing using deep learning techniques. Specifically, the collected SVI was initially segmented semantically using the DeepLabv3+ model, trained on the Cityscapes dataset, to accurately identify critical environmental features. Subsequently, these segmented images were analyzed using the MIT Place Pulse 2.0 dataset, which provided quantified emotional scores across six subjective indicators: “Safe,” “Lively,” “Wealthy,” “Beautiful,” “Depressing,” and “Boring.” Each image received detailed scores for these perceptual indicators, enabling comprehensive comparative analyses across different locations and time intervals.
In the third stage, the emotional scores were systematically analyzed and visualized. Heat maps were generated to illustrate spatial and temporal variations in environmental perceptions clearly. Correlation analyses were then conducted to explore relationships among the six perceptual indicators and between these indicators and their spatial–temporal distribution. The outcomes provided insights into environmental quality trends, facilitating informed and targeted strategies for street improvement.

3.2. Study Area

Golden Street, located in Shanghai’s Changning District, was selected as the empirical study area due to its distinctive characteristics as a pedestrian-oriented living street. Designed by SWA Group, Golden Street covers approximately 4.6 hectares, connecting six adjacent residential communities and facilitating social interactions and pedestrian vibrancy. The street integrates diverse commercial, recreational, and leisure spaces, maintaining consistently high pedestrian activity levels and varied usage patterns (Figure 2). The six residential areas proximate to Golden Street had a combined population of 12,200 and exhibited an evenly distributed age composition; this further enhances the representativeness of this study regarding urban environmental perceptions [13].

3.3. MIT Place Pulse 2.0 Dataset and Perceptual Indicators

The MIT Place Pulse 2.0 dataset serves as a robust foundation for quantifying environmental perceptions using crowdsourced geographic information systems (GISs) and pairwise comparisons, overcoming limitations of traditional survey-based methods, such as insufficient sample sizes and limited spatial coverage [31]. The dataset includes over 110,000 street view images from 56 global cities, annotated through more than 1.1 million pairwise comparative assessments across six validated subjective perception dimensions: “Safe,” “Lively,” “Wealthy,” “Beautiful,” “Depressing,” and “Boring.” These dimensions capture a wide range of emotional and perceptual responses relevant to urban quality of life, influencing individual behaviors, economic perceptions, psychological comfort, and overall satisfaction with urban environments.
Participants performed forced-choice pairwise comparisons (e.g., determining “Which image appears safer?”). The results were modeled using the Bradley–Terry model, based on Thurstone’s Law of Comparative Judgment (1927) [32], converting subjective preferences into quantifiable emotional scores.
P ( i > j ) = e θ i e θ i + e θ j
The Bradley–Terry model is robust and widely applicable, effectively generating continuous emotional scores from pairwise comparison data, facilitating comparative analyses across different images and perceptual dimensions [33,34]. This rigorous methodological approach ensures precise quantification and reliable interpretation of human perceptions of street environmental quality.

3.4. Data Collection

Since GSV imagery is unavailable for pedestrian-only streets, we manually collected street view imagery. According to Alexander, objects such as faces can be recognized at about 70 feet [35], and given the maximum effective shooting range (approximately 20 m) of our equipment, sampling points were established at 20-m intervals along Golden Street. This approach ensured comprehensive spatial coverage while maintaining data validity, initially resulting in 105 sampling points. Following quality control procedures that removed invalid images, 96 sampling points remained valid for analysis (Figure 3).
To address the limitations of conventional directional methods, which often fail to replicate pedestrian perspectives adequately, we adopted an optimized panoramic photography approach. Specifically, two opposing 180° panoramic images were captured at each sampling location, oriented parallel to the street’s primary axis (west-to-east and east-to-west). This technique minimized sampling errors, perspective distortions, and ensured comprehensive visual coverage. For instance, Figure 4 illustrates two panoramic SVIs captured at points A and B (labeled as A1, A2, B1, and B2).
All images were captured under controlled conditions: at an eye-level height of approximately 1.7 m, with a horizontal field-of-view of 90° and vertical orientation at 0°, closely approximating typical human visual perspectives [36]. In the selection of the shooting date, it is considered that holidays and other special festivals may lead to significant changes in factors such as human flow, which makes the experimental data not universal. Data collection occurred during clear weather conditions on weekdays in July 2024, from 6:00 a.m. to 6:00 p.m., at three-hour intervals, with a consistent average temperature of approximately 33 °C. These controlled measures ensured the representativeness and generalizability of the dataset, resulting in a total of 960 images. Ethical considerations were strictly adhered to by anonymizing sensitive personal information, such as faces and license plates, in all collected imagery.
The three-hour interval was determined through our pilot study. During testing, we observed that collecting a full SVI dataset requires approximately 1.5 h and necessitates the real-time verification of data availability, with additional sampling required when necessary. Therefore, in developing the formal research methodology, we established a 3 h data collection cycle to ensure systematic data availability. For the collected SVI data, we carried out manual checks to prevent improper operations during data collection from affecting the final data analysis results. Photos that did not meet the shooting standards were deleted, and supplementary photos were taken within the same time period to ensure the reliability of collected data as much as possible.

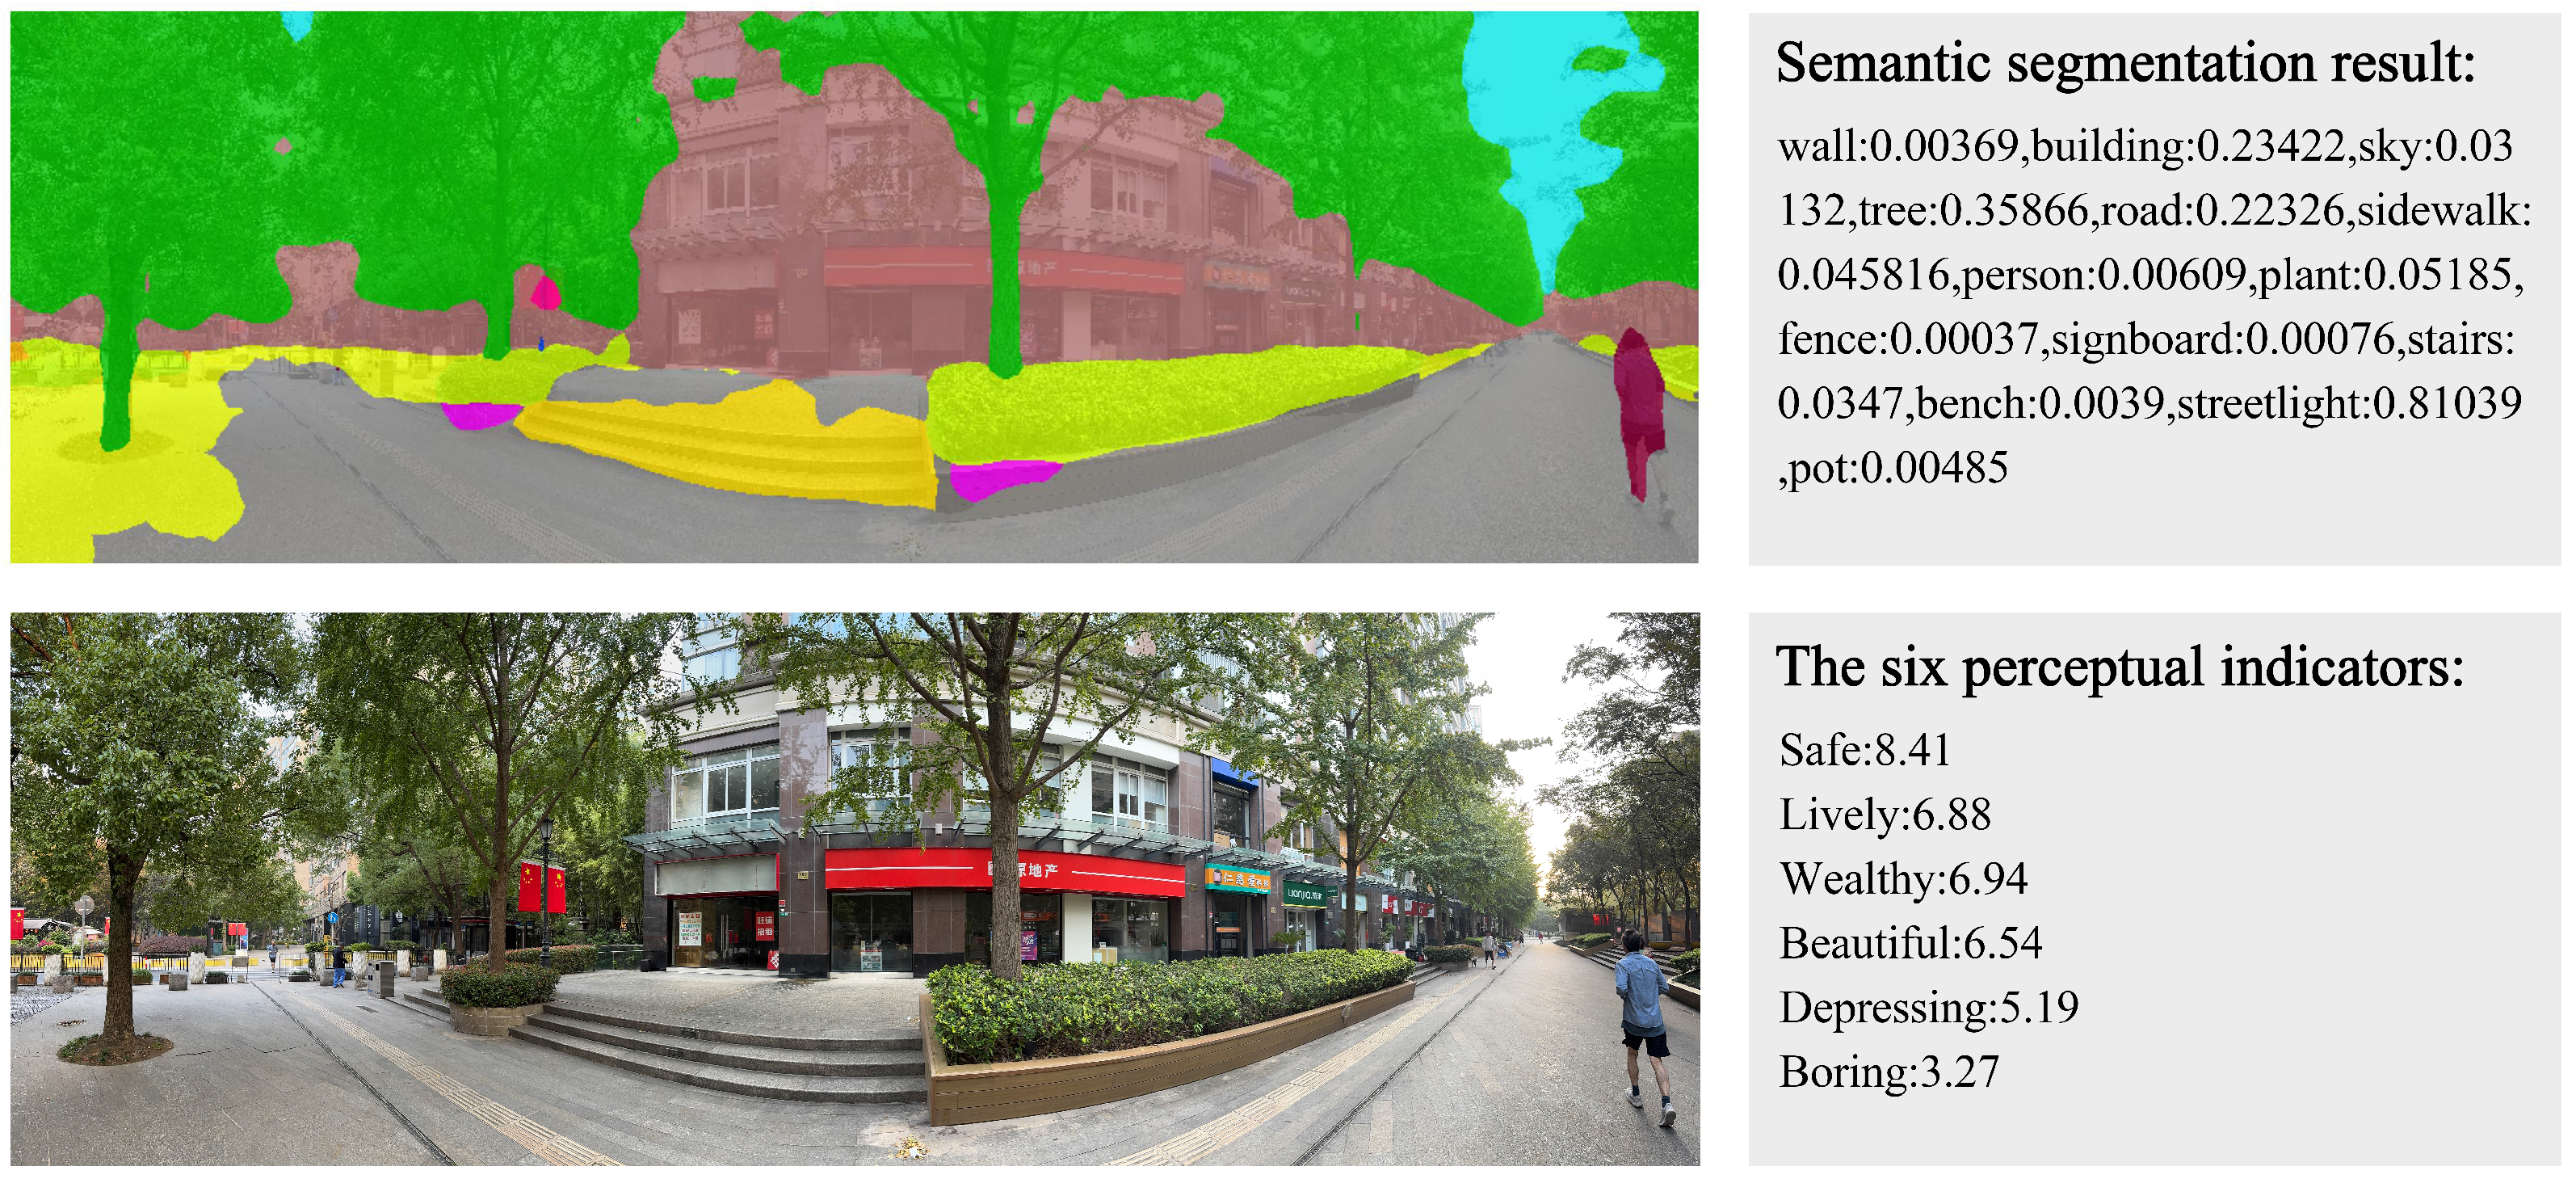
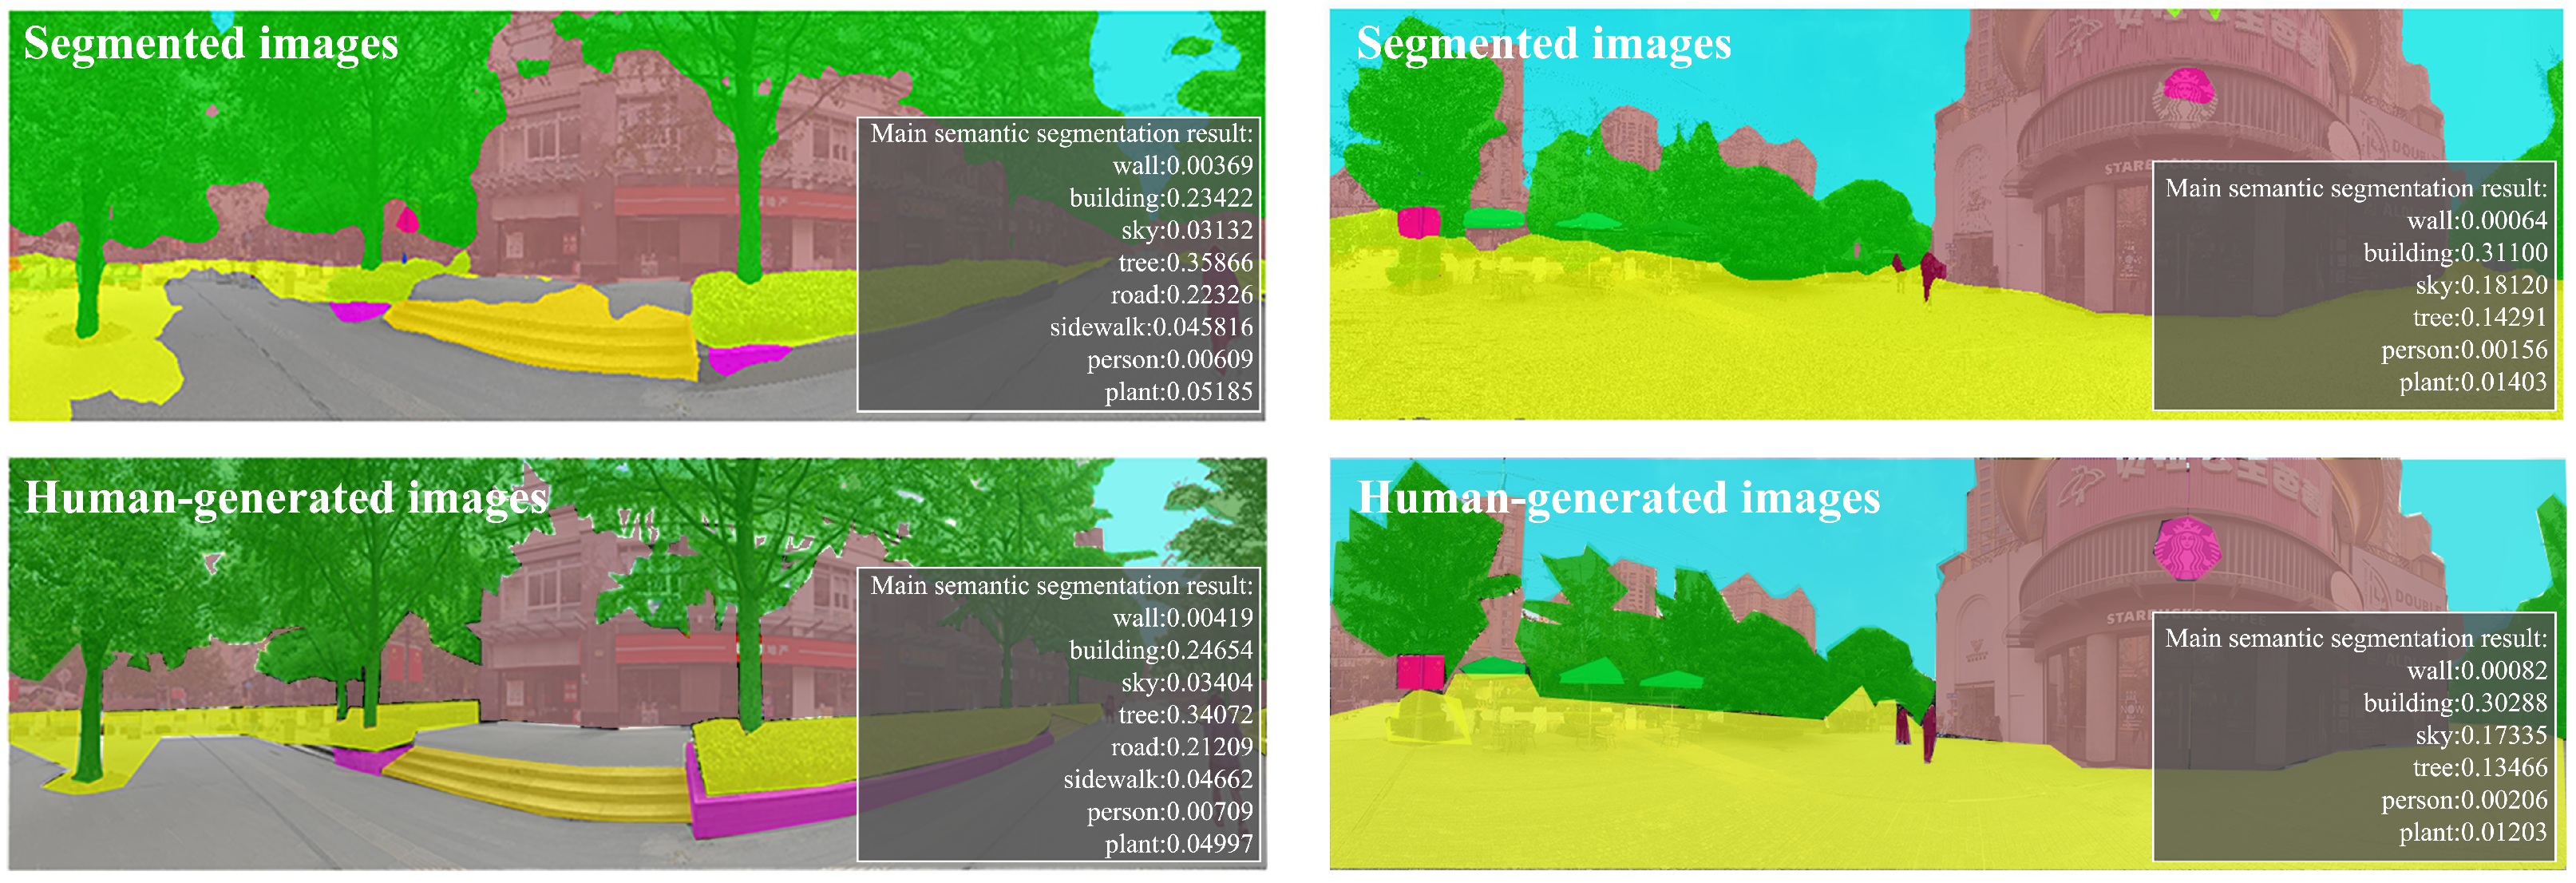
3.5. Deep Learning Model for Assessing Street Environmental Quality

The subsequent analysis required building a predictive deep learning model to estimate subjective emotional scores based on collected street view imagery. The primary objective of this model was to predict scores for six perceptual indicators: “Safe,” “Lively,” “Beautiful,” “Wealthy,” “Depressing,” and “Boring.”
Among existing models suitable for extracting semantic information from street images, the DeepLabv3+ model—based on Atrous Convolution and Atrous Spatial Pyramid Pooling (ASPP)—has demonstrated superior performance, effectively capturing multi-scale street view features [37]. We trained this model using the Cityscapes dataset, a widely recognized dataset optimized for urban scene analysis [38]. This combination has been successfully applied in similar street environmental quality studies [39,40].
DeepLabv3+ set the new state-of-the-art standard on the PASCAL VOC-2012 semantic image segmentation task, reaching 79.7 percent mIOU on the test set and improved on the results on three other datasets: PASCAL-Context, PASCAL-Person-Part, and Cityscapes. All of its code has been made publicly available online [41]. The DeepLabv3+ training results for accuracy, F1, precision, and recall values were 96.47%, 85.29%, 92.07%, and 81.84%, respectively. On the crack segmentation task, FCN and DeepLabv3+ achieved training F1 scores of 79.95% and 85.29%. Clearly, DeepLabv3+ outperforms FCN [42]. DeepLabv3+ integrates Atrous Convolution within an encoder–decoder structure. Atrous Convolution enlarges the receptive field by introducing spacing (“Atrous”) within the convolution kernel. Its mathematical formulation is defined as follows [41]:
Output Size = Input Size + 2 p k ( k 1 ) ( r 1 ) Stride + 1
where p is the padding, k denotes the convolution kernel size and r represents the dilation rate. Increasing r enlarges the effective receptive field without additional parameters or computation.
Cityscapes consists of stereo video sequences captured in streets across 50 different cities, comprising 5000 high-quality pixel-level annotations and 20,000 additional images with coarse annotations [38]. With this framework, semantic segmentation was performed on both Place Pulse 2.0 and our collected SVI. Emotional scores from Place Pulse 2.0 were subsequently integrated with the semantically segmented data to train our deep learning model, which then provided emotional scores for all 960 SVIs (Figure 5).
Liu et al. (2022) proposed a new semi-supervised semantic segmentation method based on consistency. With Deeplabv3+ as the architecture, different samples were randomly extracted from the dataset to serve as the training set, and the test model was used to show the generalization ability of different data [43]. We conducted internal quality control on the semantically segmented SVI via random sampling. A total of 96 randomly selected SVIs (10%) were manually verified, with their features extracted as “human-generated images” for comparison against the “segmented images”. The analysis demonstrated a calculation accuracy rate exceeding 92%, confirming the reliability of the data (Figure 6).

3.6. Spatial and Temporal Analytical Approaches

To reduce potential scoring discrepancies, the two panoramic images captured at each sampling point were independently scored across the six perception indicators, with the results averaged to ensure accuracy and consistency. These averaged scores were linked to corresponding points and timestamps for subsequent spatial–temporal analysis.
We first computed the average emotional scores for each indicator at each time interval from 6:00 a.m. to 6:00 p.m. To analyze spatial data effectively, circular spatial units (radius = 20 m) were constructed around each sampling point. Overlapping areas were processed by averaging relevant scores, yielding comprehensive heat maps representing spatial perceptual variations throughout the study area.
Temporal trends were examined by calculating average scores across different time intervals for the entire area, identifying overall changes and general trends for the six perceptual indicators. Additionally, detailed analyses were conducted on specific street sections exhibiting distinctive temporal patterns differing from the overall average, providing supplementary explanations based on nuanced local observations.

4. Results

This section systematically examines the relationships between subjective emotional scores derived from the Place Pulse 2.0 dataset and their spatial–temporal distributions. By carefully analyzing variations across both spatial and temporal dimensions, we comprehensively captured perceived environmental quality across Golden Street. The analyses yielded essential insights to inform targeted environmental enhancement and urban design strategies.

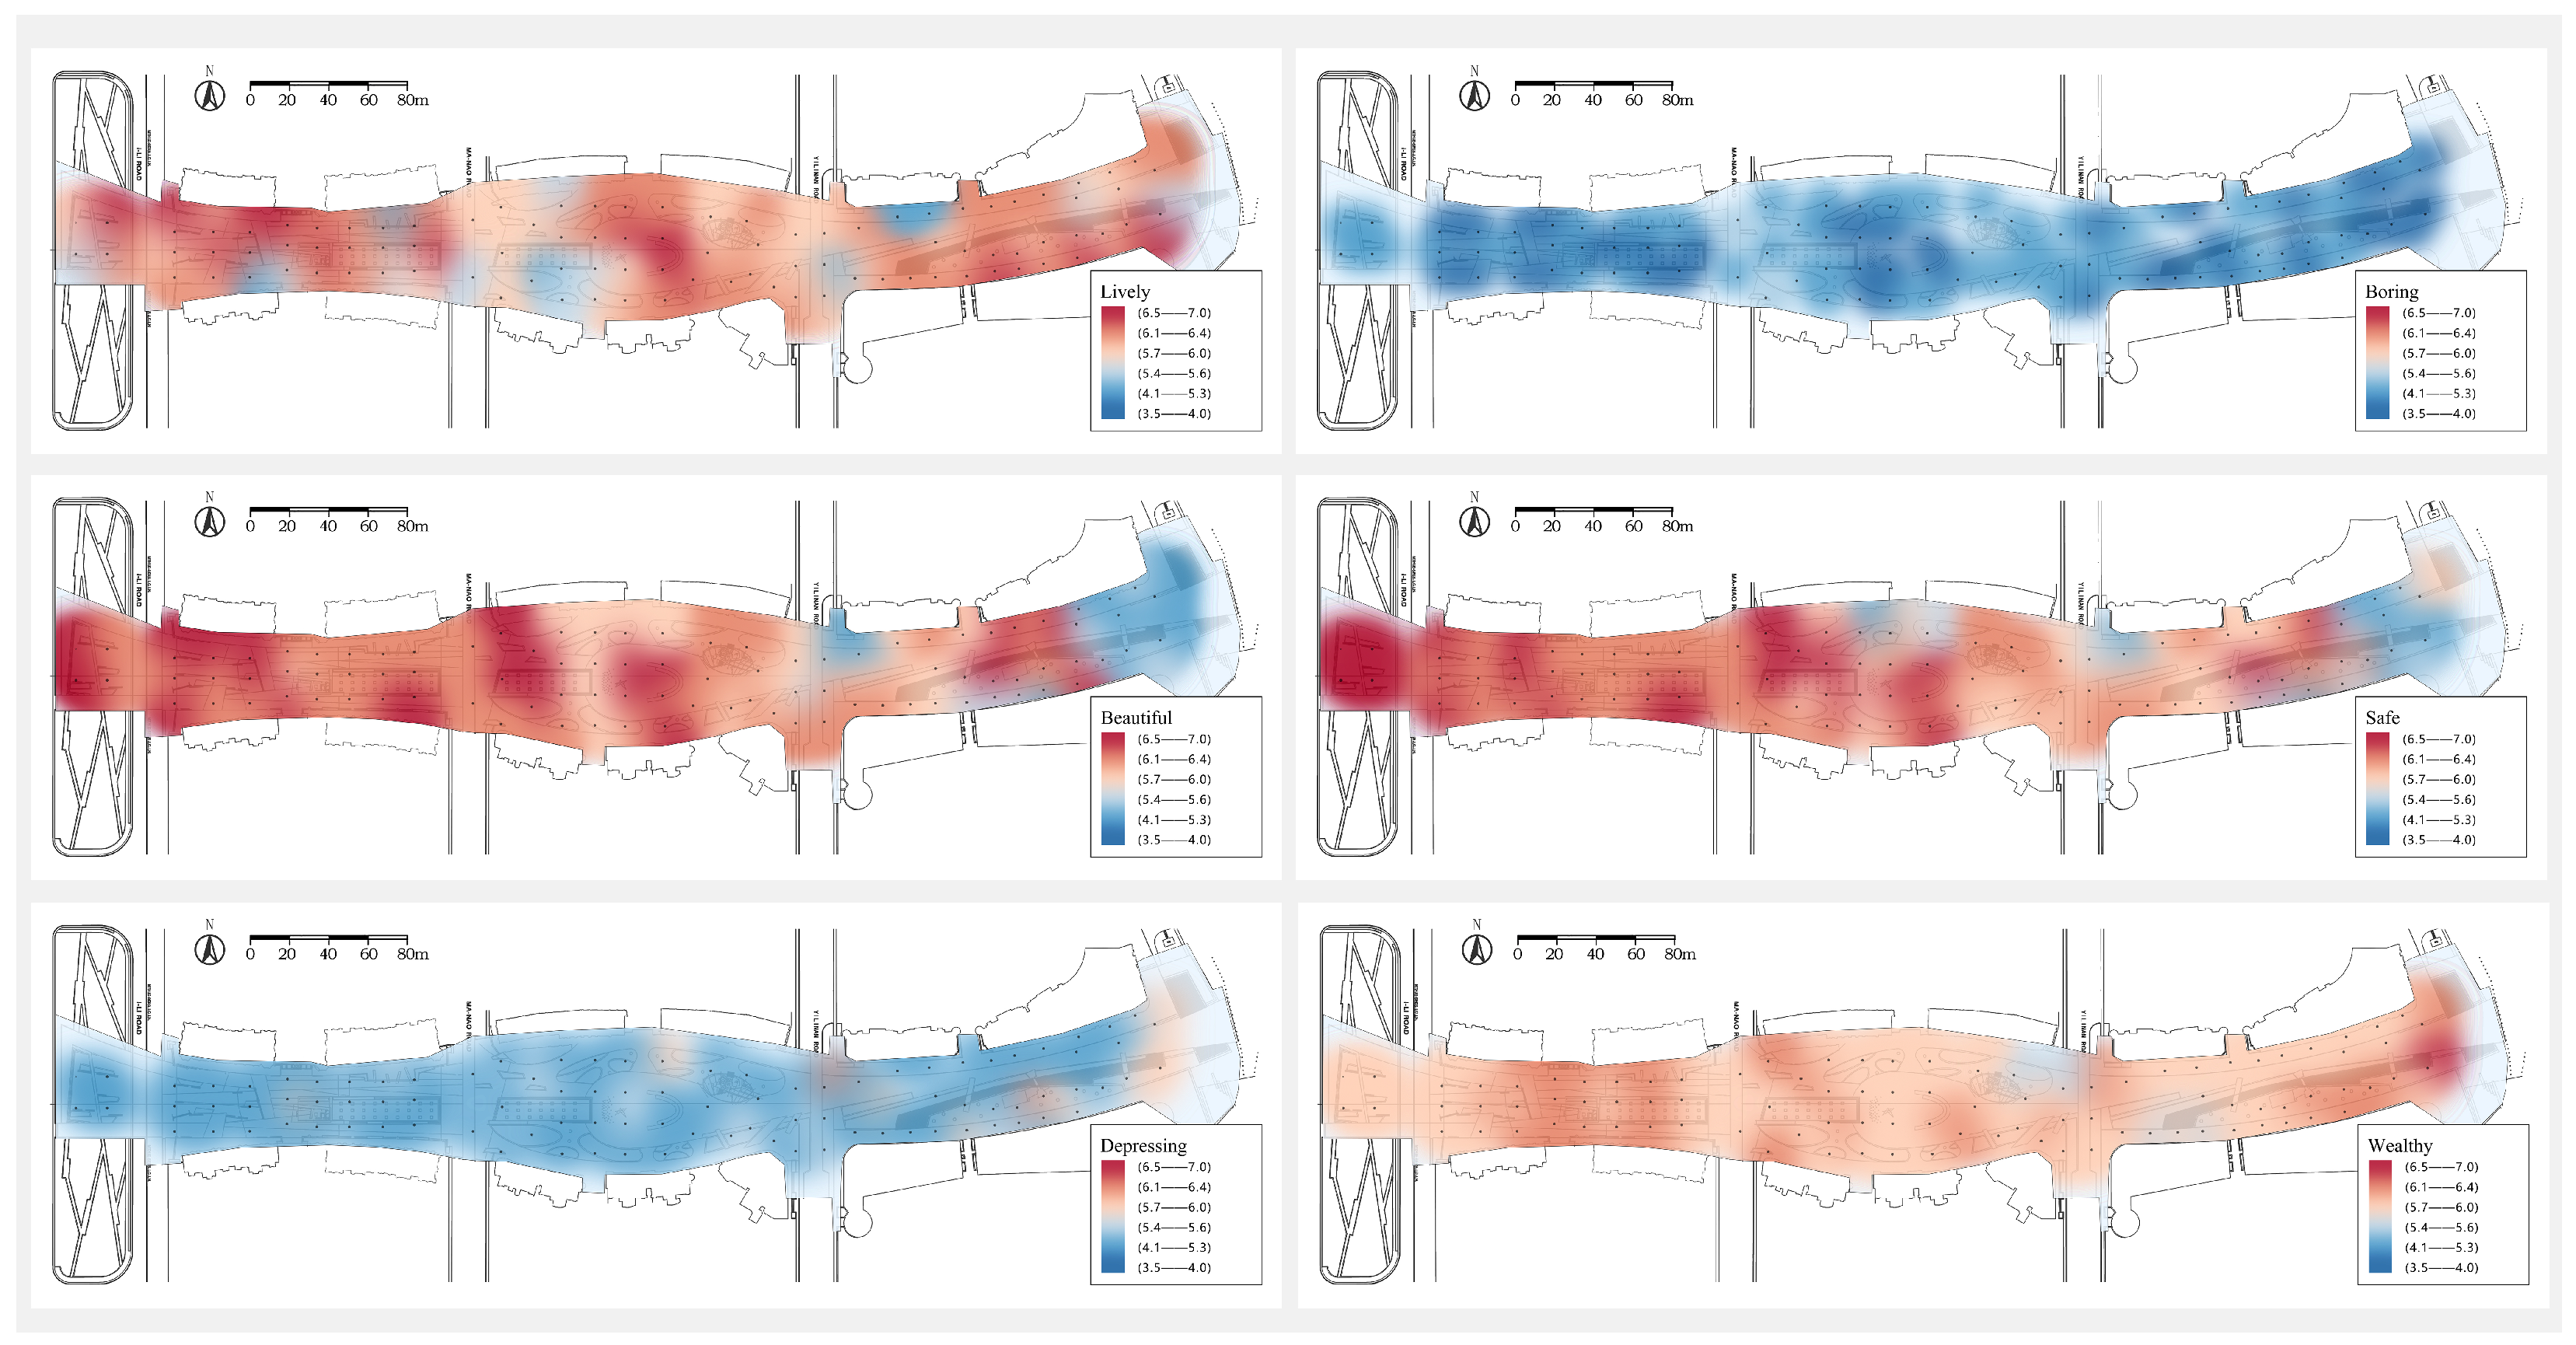
4.1. Spatial Variation in Visual Environmental Quality on Golden Street

The spatial distribution of emotional scores, visualized in Figure 7, highlights distinct variations in environmental quality across different sections of Golden Street. Specifically, the eastern section is consistently perceived as safer and livelier compared to the western section. Scores for the “Boring” indicator remain consistently low across the entire street, reflecting a generally dynamic and engaging urban atmosphere. The “Wealthy” indicator maintains uniformly high scores throughout Golden Street, suggesting consistent perceptions of economic affluence.
A clear negative spatial correlation emerges between perceptions of visual esthetics (“Beautiful”) and negative emotional evaluations (“Depressing”). Spatial clustering indicates that areas perceived as more esthetically pleasing concurrently exhibit lower scores for depression, suggesting that enhancements in visual esthetics could positively impact residents’ psychological well-being. Similarly, spatial clusters also emerge between perceptions of “Wealthy” and “Lively,” indicating that economically affluent areas are also perceived as more engaging.
To further validate these spatial patterns, a correlation matrix was constructed (Figure 8). The results reveal nuanced relationships between various perceptual indicators. Notably, areas perceived as “Lively” positively correlate with areas scored highly on “Beautiful” and “Wealthy,” while “Safe” areas exhibit strong positive correlations with “Lively” areas. Conversely, higher “Depressing” scores consistently correspond with lower “Beautiful” and “Wealthy” perceptions, highlighting complex interplay among perceptual dimensions.
Additionally, significant negative correlations were identified between negatively evaluated indicators (“Depressing” and “Boring”) and positively evaluated ones (“Lively” and “Beautiful”). Interestingly, the perception of safety (“Safe”) negatively correlates with “Boring,” but displays a modest positive correlation with “Depressing,” alongside a moderate negative correlation with “Beautiful,” suggesting intricate dynamics requiring further investigation.

4.2. Spatio-Temporal Variation in Street Environmental Quality

4.2.1. Temporal Variations Across the Entire Street

Building upon the spatial analyses, the temporal dynamics of environmental perceptions were examined from 6:00 a.m. to 6:00 p.m. Figure 9. The “Wealthy” indicator remains stable throughout the day, suggesting a consistent economic perception. In contrast, other indicators (“Safe,” “Lively,” “Beautiful,” “Depressing,” and “Boring”) demonstrate pronounced fluctuations, reflecting dynamic daily changes in street activity and environmental conditions.
Indicators such as “Safe,” “Wealthy,” and “Lively” exhibit distinctive “double-peak” patterns during the day, characterized by initial increases, subsequent decreases, and secondary increases before declining again in the evening. Correspondingly, “Boring” displays a “double-trough” pattern, achieving minimum scores (indicating higher engagement) around 9:00 a.m. and 3:00 p.m. and higher scores (indicating lower engagement) at 6:00 a.m., 12:00 p.m., and 6:00 p.m.
All positively perceived indicators—“Safe,” “Lively,” “Wealthy,” and “Beautiful”—decline noticeably toward evening hours (around 6:00 p.m.), while negatively perceived indicators—“Depressing” and “Boring”—rise, indicating a general deterioration in perceived environmental quality as natural light diminishes.
To investigate regional temporal differences, the dispersion of emotional scores was calculated Figure 10, revealing increased perceptual divergence as evening approaches. Specifically, areas initially perceived positively during earlier times exhibit even higher positive scores later in the day, while negatively perceived areas further decline perceptually.
Individual indicators exhibit distinct temporal patterns. “Safe,” “Lively,” and “Boring” perceptions reach minimum dispersion at 9:00 a.m. and subsequently increase, while “Wealthy” and “Beautiful” perceptions demonstrate consistent upward trends throughout the day. “Depressing” perceptions uniquely dip at midday (12:00 p.m.) and notably rise in early morning and late afternoon.
The variability of the “Depressing” indicator is particularly pronounced, underscoring significant disparities in psychological impacts related to environmental quality. High-quality environments consistently associate with lower depressive perceptions, emphasizing the critical role environmental conditions play in urban mental health.

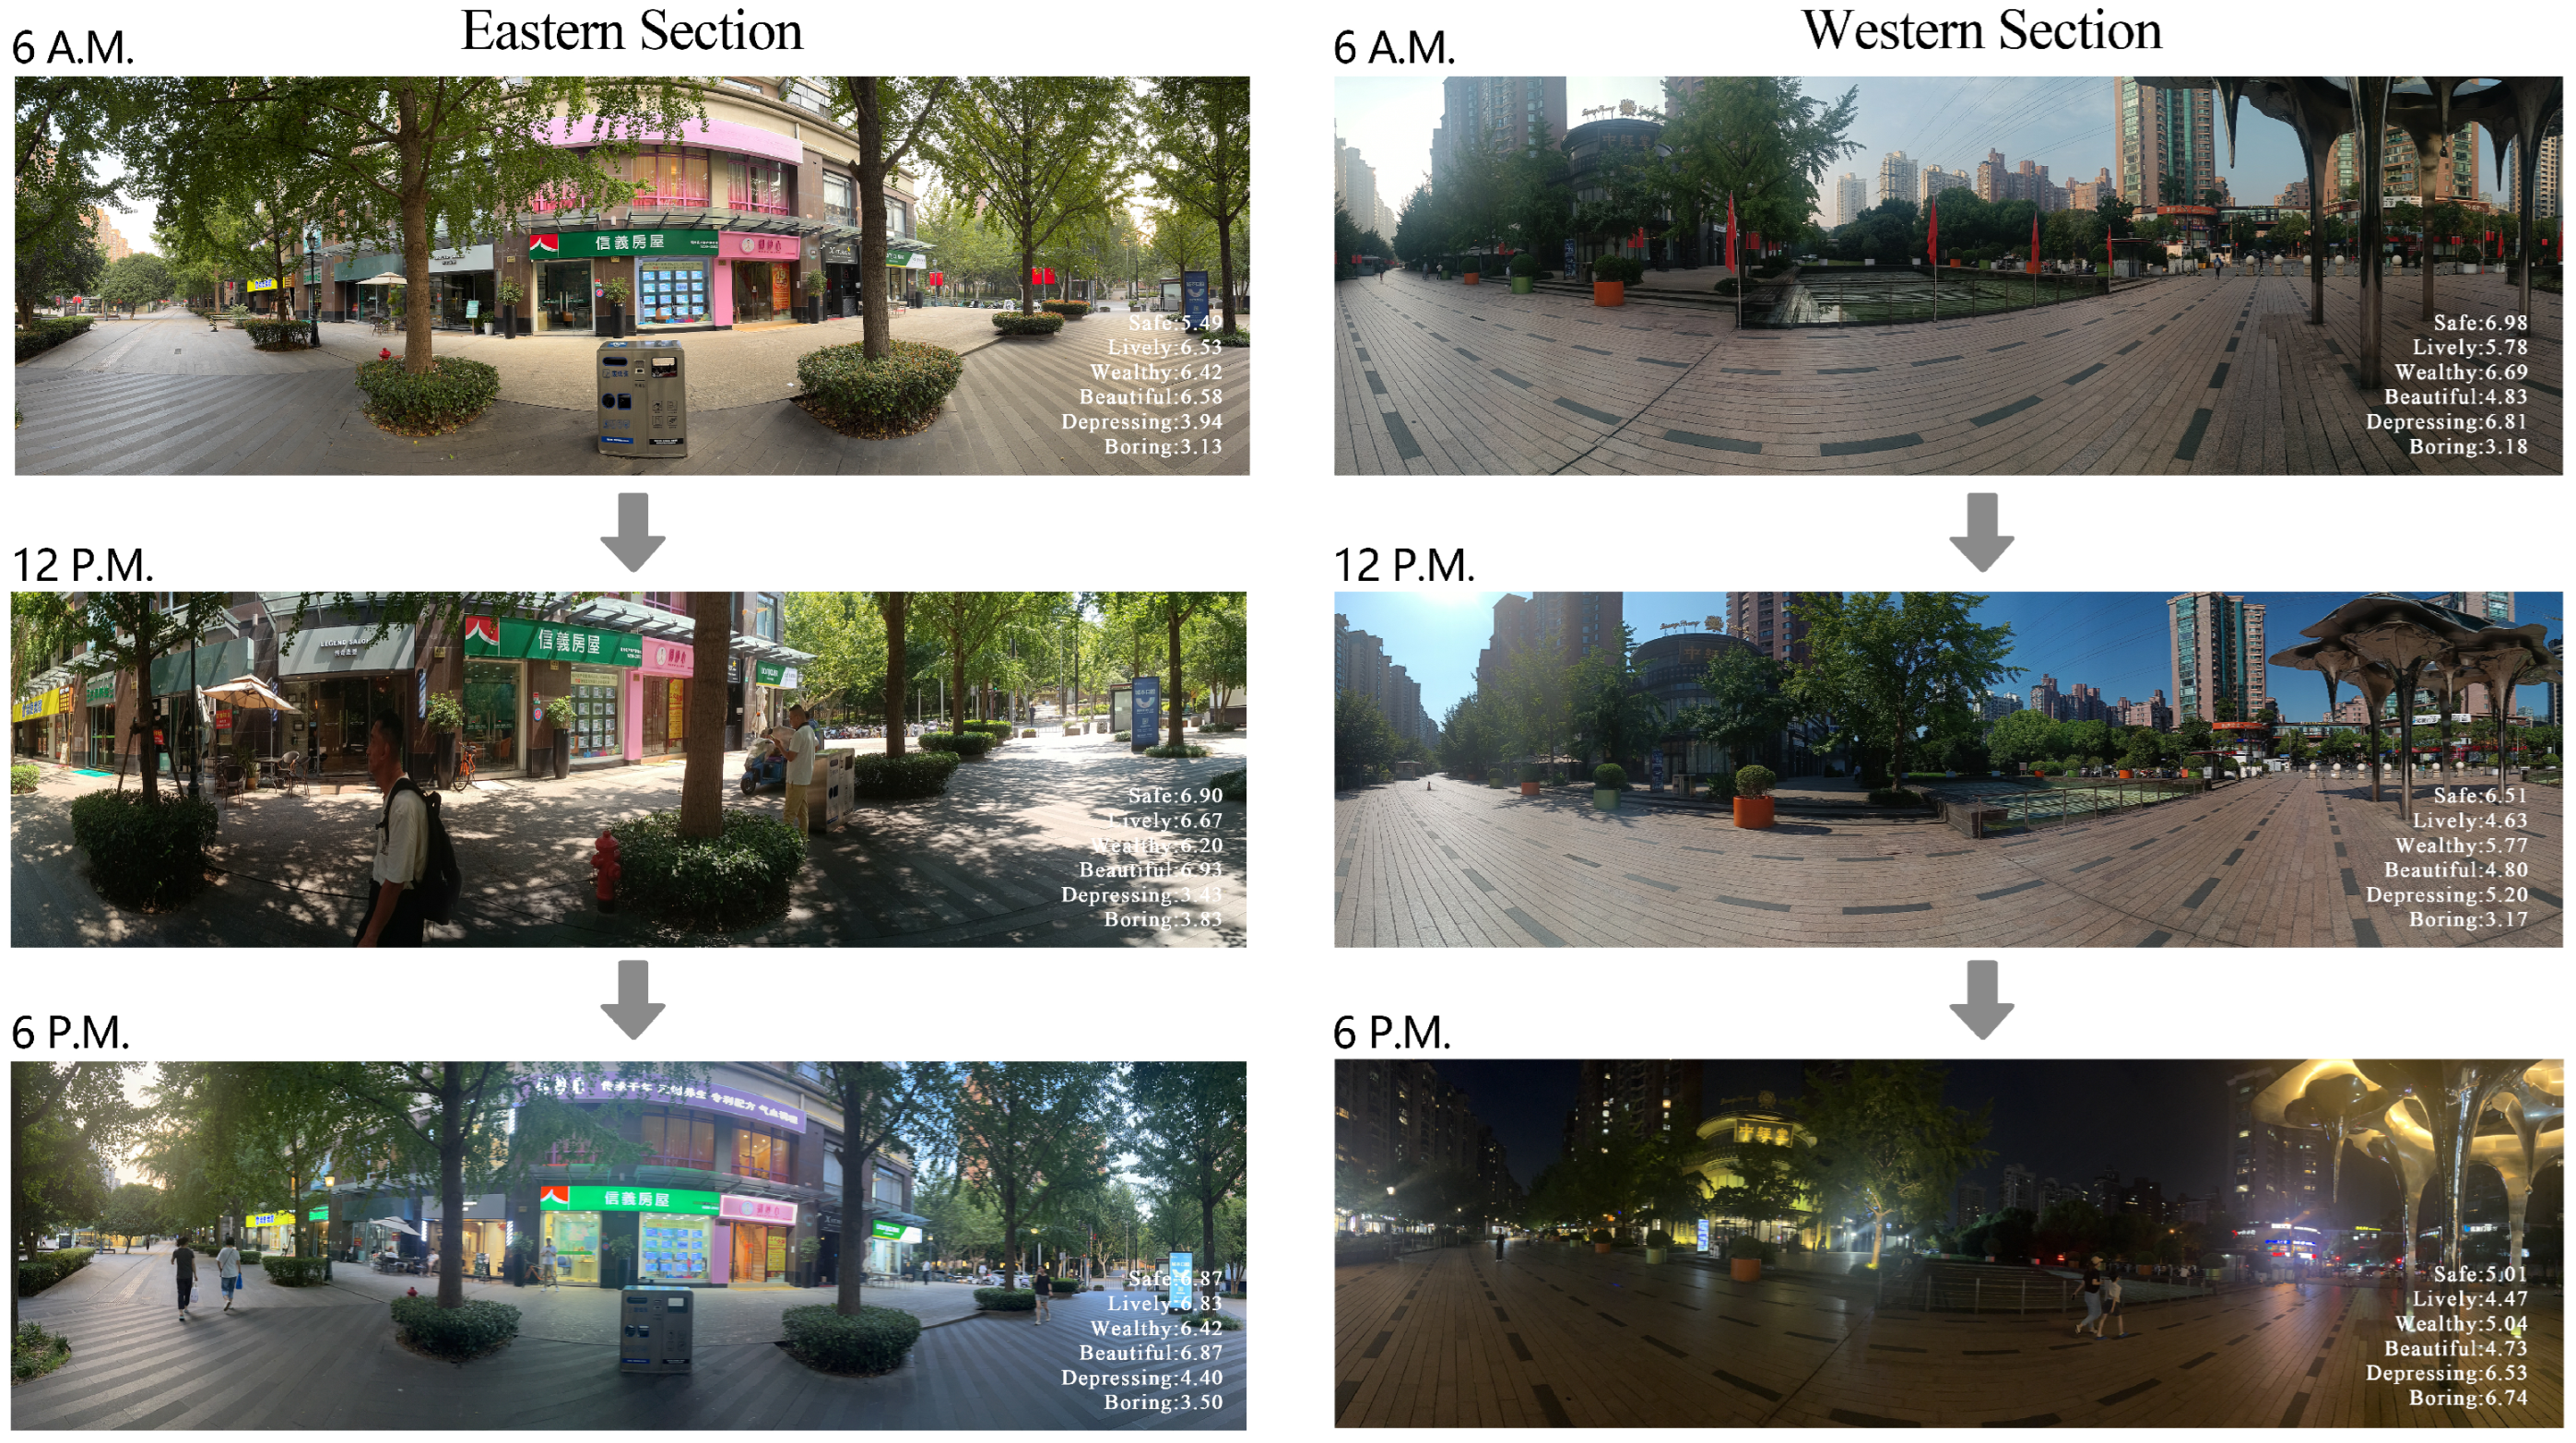
4.2.2. Spatial Differences in Temporal Variations Among Street Sections

Detailed temporal analysis across specific street sections (east, middle, west) provides additional insights (Figure 11). Analysis of the “Wealthy” indicator indicates stability across most sections throughout the day, with only the western section showing a distinct decline at 6:00 p.m., altering the overall trend.
For the indicators “Safe” and “Lively,” the middle and western sections align closely with the average trend for the entire street, whereas the eastern section consistently scores higher, particularly differing in its perceptual trends between 3:00 p.m. and 6:00 p.m. The “Beautiful” and “Boring” indicators follow similar patterns, with the eastern section showing divergent trends during specific periods, whereas other areas largely mirror the street-wide average changes.
Regarding the “Depressing” indicator, most sections align with the average trend, except the western section, which demonstrates higher depressive scores specifically at 6:00 p.m.
Notably, emotional scores across all indicators markedly deteriorate in the western section as evening approaches (6:00 p.m.). This rapid decline coincides with reduced natural lighting, reinforcing the conclusion that lighting significantly influences perceived environmental quality.

5. Discussion

5.1. Spatio-Temporal Variation in Human Perceptions on Golden Street

Incorporating temporal dimensions through time-series analysis provides valuable insights into the dynamic changes in human perceptions throughout the day, highlighting critical periods when environmental quality diminishes, and indicating the necessity for context-specific interventions. Previous community-based studies have suggested beneficial urban interventions—such as façade improvements, alley widening, additional street lighting, and the creation of pocket parks [44]—but these often lack adaptive measures accounting explicitly for spatio-temporal dynamics.
Our analysis clearly reveals distinct spatio-temporal variations in perceived environmental quality along Golden Street (Figure 12). Spatially, the eastern section is consistently perceived as safer, livelier, and more esthetically pleasing, whereas the western section generally exhibits poorer emotional scores. Prior research indicates that semi-private spaces (e.g., low walls, steps, front yards) can enhance residents’ sense of security in adjacent public areas, provided these boundaries allow visual permeability and social interaction. Conversely, enclosed high walls tend to produce discomfort and insecurity [45]. These principles align with our observations on Golden Street, where the eastern section features permeable spatial boundaries through steps, low walls, and vegetation, facilitating visual connectivity and comfort. However, in the central section, enclosed high walls associated with stage designs negatively affect perceptions. In the western section, sparse vegetation coverage, weaker boundary definitions, and open views toward adjacent highways result in ambiguous spatial boundaries, contributing to lower emotional scores in safety, liveliness, and esthetics. To mitigate these issues, urban designers should consider enhancing vegetation coverage and clarifying spatial boundaries, particularly in the western section.
The sense of spatial boundary has been shown to vary significantly between day and night, as clear visibility becomes particularly critical during evening hours when ambiguous boundaries exacerbate feelings of insecurity [46]. Therefore, the design of spatial boundaries must adapt to temporal variations, emphasizing nighttime design strategies. Effective nighttime lighting emerges as a particularly crucial factor. Previous studies suggest inadequate artificial lighting typically correlates with higher crime rates and reduced perceived safety [47]. This pattern corresponds strongly with our findings for Golden Street’s western section, where insufficient lighting infrastructure in open squares contributes to perceptual deterioration during evening hours. Consequently, developing a comprehensive nighttime lighting strategy could significantly enhance perceived safety, liveliness, and esthetic quality in this area.
Besides lighting, a clear and orderly layout—such as a coherent road network, continuous street interfaces, and identifiable spatial nodes—is essential for improving street environmental quality [46]. A well-organized spatial structure reduces ambiguity and uncertainty, ensuring clear visibility and facilitating activity guidance, thereby enhancing the perceived safety and attractiveness of street environments [45].
Interestingly, our study identifies a negative correlation between perceptions of “Safe” and “Beautiful,” contrasting with some existing research that typically emphasizes positive associations between esthetic quality and perceived safety. Previous studies frequently suggest that esthetic enhancements (e.g., increased greenery, tidy building façades) positively impact perceived safety [48]. However, our findings indicate a more nuanced relationship that warrants further investigation, particularly within the unique contexts of pedestrian-oriented streets.
Previous research in historical districts notes that esthetic preservation measures sometimes inadvertently obscure modern security features (e.g., surveillance cameras), thereby reducing perceived safety [49]. Similarly, extensive vegetation, while visually appealing, can obstruct sightlines and compromise perceived safety [50]. On Golden Street, extensive recreational spaces and dense vegetation enhance esthetic appeal but potentially obscure security infrastructure, contributing to the negative correlation observed. Balancing esthetic quality and perceived safety thus necessitates carefully calibrating the vegetation coverage and visibility of security features [51].

5.2. Implications for High-Quality Living Streets

Living streets, serving as vital public spaces integrated closely with daily routines, require particular attention in urban design compared to ordinary traffic-dominated roads. However, accurately assessing and quantifying their environmental quality poses methodological challenges, hindering the development of evidence-based renewal strategies. Addressing this challenge, our study introduces a novel methodological approach integrating time-series street view imagery (SVI) with deep learning techniques, enabling the systematic, large-scale, longitudinal assessment of environmental quality.
Through our case study of Golden Street, this method proved effective in objectively and comprehensively evaluating living street environments, generating robust scientific data to support urban design and renewal interventions. Empirical findings reveal significant spatio-temporal variations in environmental quality, elucidating general dynamic patterns and identifying critical influencing factors—particularly spatial boundary clarity and nighttime lighting infrastructure. These insights offer practical guidance for subsequent street improvement efforts, highlighting the importance of context-specific and temporally adaptive urban design strategies.

5.3. Limitations and Future Research Directions

5.3.1. Limitations of the Place Pulse 2.0 Dataset

Our analysis utilized the publicly available Place Pulse 2.0 dataset, which provides extensive global street view imagery annotated through crowdsourced comparisons. Despite its broad geographic coverage and substantial size, this dataset lacks detailed demographic information about participants (e.g., age, gender, cultural background), potentially introducing biases into perceptual assessments [52]. Furthermore, inherent limitations in the precision of deep learning models trained on this dataset may constrain the generalizability and interpretive depth of this study’s findings.
While our research achieved relatively objective results regarding street environmental quality across six indicators through semantic segmentation and the Place Pulse 2.0 dataset, discrepancies still exist between actual street conditions and subjective perceptions. These differences may stem from multiple factors. Previous studies have demonstrated that urban elements such as road network accessibility, green space density, mixed-use land development, residential convenience, housing prices, the nighttime lighting index, and population density all contribute to the mismatch between perceived street environments and their actual quality [53].
Nevertheless, the primary contribution of our research remains valid—the integration of advanced deep learning and time-series SVI analysis to quantify urban environmental perceptions systematically. Future studies could enhance the robustness and applicability of these methods by integrating demographic factors explicitly and refining deep learning models through further training and validation.

5.3.2. Contextual Generalizability

The manual data acquisition method employed, necessitated by the pedestrian-only nature of Golden Street, presents limitations regarding the scalability and generalizability of this study’s findings. Variations in demographic profiles, street usage patterns, and urban morphology could significantly influence perceptual outcomes when applied to different urban contexts [13]. Consequently, results derived from Golden Street might not seamlessly extend to streets with substantially different physical configurations or demographic compositions.
Additionally, environmental perceptions significantly vary with weather conditions [54,55], a factor not considered in this single-day temporal scope. Therefore, further research incorporating a broader range of temporal scales and environmental conditions would enhance the comprehensiveness and applicability of the results.
Despite these limitations, this study provides valuable insights into urban street perceptions, emphasizing the necessity of context-sensitive analyses for informing urban design interventions.

5.3.3. Potential Future Analyses

This study highlights intricate relationships among subjective environmental quality indicators and their spatio-temporal variations, providing a solid foundation for future research. Further studies could refine environmental quality indicators into more granular urban design elements—such as seating configurations, signage, greenery types and density—to better understand their impacts. Prior research indicates that seating and greenery interactions intensify during evening hours, significantly influencing street vitality and social interactions [56].
Moreover, architectural elements such as building heights, facade proportions, and color schemes substantially affect perceived environmental quality. Wu et al. (2025) indicated that streetscapes with certain building ratios (BR > 60%) and roof ratios (RR > 30%) could appear fragmented or evoke depressive feelings [57]. Future research could investigate these architectural dimensions more explicitly, deepening our understanding and enabling targeted urban interventions to enhance street environmental quality effectively.

6. Conclusions

Effectively monitoring and quantitatively evaluating spatio-temporal variations in the environmental quality of pedestrian-oriented streets remains a significant methodological challenge in urban studies. Although deep learning methodologies have increasingly matured, their application in time-series analyses—particularly within pedestrian-oriented urban contexts—remains limited. To address this gap, this study integrates advanced deep learning techniques with time-series street view imagery (SVI) to systematically evaluate environmental quality variations along Golden Street, a representative living street in Shanghai.
This research comprehensively explores street environmental quality, systematically analyzing spatial variations across different locations at specific times and temporal variations at fixed locations throughout a single day. The following key findings emerged from the analyses.
Spatially, the eastern section of Golden Street is consistently perceived as safer, livelier, and more esthetically pleasing compared to the western section. The entire street exhibited consistently low scores for “Boring” and uniformly high scores for “Wealthy,” indicating an engaging and economically vibrant atmosphere overall. Correlation analysis revealed a complex interplay among perceptual indicators: positive indicators (“Lively,” “Beautiful,” and “Wealthy”) demonstrated strong negative correlations with negative indicators (“Depressing” and “Boring”). Notably, the “Safe” indicator exhibited a mild negative correlation with “Beautiful” and a slight positive correlation with “Depressing,” highlighting intricate relationships requiring nuanced urban design considerations.
Temporally, perceptions of “Wealthy” remained relatively stable across the day, whereas indicators such as “Safe,” “Lively,” “Beautiful,” “Depressing,” and “Boring” displayed pronounced fluctuations. Indicators “Safe,” “Wealthy,” and “Lively” exhibited characteristic “double-peak” patterns, reflecting typical rhythms of pedestrian activity and street vibrancy. Conversely, the “Boring” indicator exhibited a “double-trough” pattern, correlating inversely with peak periods of pedestrian engagement. Significantly, all positive perceptual indicators decreased towards the evening (around 6:00 p.m.), particularly in the western section, coinciding with diminishing natural light and exacerbating perceptions of insecurity and depression. Analysis indicated boundary clarity and nighttime lighting as critical factors influencing these spatio-temporal dynamics, suggesting temporally adaptive design interventions.
Through empirical validation, this study confirms the efficacy of integrating time-series SVI and deep learning methods in systematically evaluating pedestrian street environmental quality. Insights derived from this research enhance our understanding of complex perceptual dynamics and provide robust guidance for targeted urban planning and renewal interventions. Specifically, urban planners and policymakers can leverage these findings to implement context-sensitive, temporally adaptive improvements, ultimately contributing to more livable, engaging, and psychologically supportive urban streetscapes.

Author Contributions

Methodology, P.Z. and Y.H.; Writing—original draft, P.Z.; Writing—review and editing, P.Z. and Y.H.; Visualization, Y.L.; Project administration, Y.H. All authors have read and agreed to the published version of the manuscript.

Funding

This work is supported by the Youth Foundation of Humanities and Social Sciences of the Ministry of Education in China under Grant 21YJC760031.

Data Availability Statement

The data presented in this study are available upon request from the corresponding author. The data are not publicly available due to legal and ethical reasons.

Conflicts of Interest

The authors declare no conflicts of interest.

References

  1. Schneider, A.; Friedl, M.A.; Potere, D. Mapping global urban areas using MODIS 500-m data: New methods and datasets based on ‘urban ecoregions’. Remote Sens. Environ. 2010, 114, 1733–1746. [Google Scholar] [CrossRef]
  2. Lu, Y.; Sarkar, C.; Xiao, Y. The effect of street-level greenery on walking behavior: Evidence from Hong Kong. Soc. Sci. Med. 2018, 208, 41–49. [Google Scholar] [CrossRef]
  3. Saelens, B.E.; Handy, S.L. Built environment correlates of walking: A review. Med. Sci. Sport. Exerc. 2008, 40, S550. [Google Scholar] [CrossRef]
  4. Gutman, R. The social function of the built environment. In The Mutual Interaction of People and Their Built Environment; De Gruyter Mouton: Berlin, Germany; New York, NY, USA, 1976; p. 37. [Google Scholar]
  5. Allocated, L.; Core, C. Streets as Public Spaces and Drivers of Urban Prosperity; UN-HABITAT: Nairobi, Kenya, 2013; p. 108. [Google Scholar]
  6. Wang, J.; Chow, Y.S.; Biljecki, F. Insights in a city through the eyes of Airbnb reviews: Sensing urban characteristics from homestay guest experiences. Cities 2023, 140, 104399. [Google Scholar] [CrossRef]
  7. Liu, L.; Silva, E.A.; Wu, C.; Wang, H. A machine learning-based method for the large-scale evaluation of the qualities of the urban environment. Comput. Environ. Urban Syst. 2017, 65, 113–125. [Google Scholar] [CrossRef]
  8. Biljecki, F.; Ito, K. Street view imagery in urban analytics and GIS: A review. Landsc. Urban Plan. 2021, 215, 104217. [Google Scholar] [CrossRef]
  9. Jeon, J.; Woo, A. Deep learning analysis of street panorama images to evaluate the streetscape walkability of neighborhoods for subsidized families in Seoul, Korea. Landsc. Urban Plan. 2023, 230, 104631. [Google Scholar] [CrossRef]
  10. Huang, Z.; Du, X. Assessment and determinants of residential satisfaction with public housing in Hangzhou, China. Habitat Int. 2015, 47, 218–230. [Google Scholar] [CrossRef]
  11. Zhang, F.; Zhou, B.; Liu, L.; Liu, Y.; Fung, H.H.; Lin, H.; Ratti, C. Measuring human perceptions of a large-scale urban region using machine learning. Landsc. Urban Plan. 2018, 180, 148–160. [Google Scholar] [CrossRef]
  12. Liu, Z.; Ma, L. Residential experiences and satisfaction of public housing renters in Beijing, China: A before-after relocation assessment. Cities 2021, 113, 103148. [Google Scholar] [CrossRef]
  13. An, D.; Liu, Y.; Huang, Y. The Influence of Street Components on Age Diversity: A Case Study on a Living Street in Shanghai. Sustainability 2023, 15, 10493. [Google Scholar] [CrossRef]
  14. Wang, Z.; Ito, K.; Biljecki, F. Assessing the equity and evolution of urban visual perceptual quality with time series street view imagery. Cities 2024, 145, 104704. [Google Scholar] [CrossRef]
  15. Kang, Y.; Zhang, F.; Gao, S.; Lin, H.; Liu, Y. A review of urban physical environment sensing using street view imagery in public health studies. Ann. GIS 2020, 26, 261–275. [Google Scholar] [CrossRef]
  16. Goel, R.; Garcia, L.M.; Goodman, A.; Johnson, R.; Aldred, R.; Murugesan, M.; Brage, S.; Bhalla, K.; Woodcock, J. Estimating city-level travel patterns using street imagery: A case study of using Google Street View in Britain. PLoS ONE 2018, 13, e0196521. [Google Scholar] [CrossRef]
  17. Chen, S.; Biljecki, F. Automatic assessment of public open spaces using street view imagery. Cities 2023, 137, 104329. [Google Scholar] [CrossRef]
  18. Helbich, M.; Yao, Y.; Liu, Y.; Zhang, J.; Liu, P.; Wang, R. Using deep learning to examine street view green and blue spaces and their associations with geriatric depression in Beijing, China. Environ. Int. 2019, 126, 107–117. [Google Scholar] [CrossRef] [PubMed]
  19. Dubey, A.; Naik, N.; Parikh, D.; Raskar, R.; Hidalgo, C.A. Deep learning the city: Quantifying urban perception at a global scale. In Proceedings of the Computer Vision–ECCV 2016: 14th European Conference, Amsterdam, The Netherlands, 11–14 October 2016; Proceedings, Part I 14. Springer: Berlin/Heidelberg, Germany, 2016; pp. 196–212. [Google Scholar]
  20. Dadvand, P.; Bartoll, X.; Basagaña, X.; Dalmau-Bueno, A.; Martinez, D.; Ambros, A.; Cirach, M.; Triguero-Mas, M.; Gascon, M.; Borrell, C.; et al. Green spaces and general health: Roles of mental health status, social support, and physical activity. Environ. Int. 2016, 91, 161–167. [Google Scholar] [CrossRef] [PubMed]
  21. Wei, J.; Yue, W.; Li, M.; Gao, J. Mapping human perception of urban landscape from street-view images: A deep-learning approach. Int. J. Appl. Earth Obs. Geoinf. 2022, 112, 102886. [Google Scholar] [CrossRef]
  22. Zhang, F.; Fan, Z.; Kang, Y.; Hu, Y.; Ratti, C. “Perception bias”: Deciphering a mismatch between urban crime and perception of safety. Landsc. Urban Plan. 2021, 207, 104003. [Google Scholar] [CrossRef]
  23. Long, Y.; Ye, Y. Measuring human-scale urban form and its performance. Landsc. Urban Plan. 2019, 191, 103612. [Google Scholar] [CrossRef] [PubMed]
  24. Nasar, J.L. Perception, cognition, and evaluation of urban places. In Public Places and Spaces; Springer: Berlin/Heidelberg, Germany, 1989; pp. 31–56. [Google Scholar]
  25. Bonaiuto, M.; Fornara, F. Residential satisfaction and perceived urban quality. Encycl. Appl. Psychol. 2004, 3, 267–272. [Google Scholar]
  26. Smardon, R.C. Perception and aesthetics of the urban environment: Review of the role of vegetation. Landsc. Urban Plan. 1988, 15, 85–106. [Google Scholar] [CrossRef]
  27. Liu, K.; Zhang, L.; Tsou, S.; Wang, L.; Hu, Y.; Yang, K. Exploring the Complex Association Between Urban Built Environment, Sociodemographic Characteristics and Crime: Evidence from Washington, DC. Land 2024, 13, 1886. [Google Scholar] [CrossRef]
  28. Gebru, T.; Krause, J.; Wang, Y.; Chen, D.; Deng, J.; Aiden, E.L.; Li, F. Using deep learning and Google Street View to estimate the demographic makeup of neighborhoods across the United States. Proc. Natl. Acad. Sci. USA 2017, 114, 13108–13113. [Google Scholar] [CrossRef]
  29. Li, M.; Sheng, H.; Irvin, J.; Chung, H.; Ying, A.; Sun, T.; Ng, A.Y.; Rodriguez, D.A. Marked crosswalks in US transit-oriented station areas, 2007–2020: A computer vision approach using street view imagery. Environ. Plan. B Urban Anal. City Sci. 2023, 50, 350–369. [Google Scholar] [CrossRef]
  30. Liang, X.; Zhao, T.; Biljecki, F. Revealing spatio-temporal evolution of urban visual environments with street view imagery. Landsc. Urban Plan. 2023, 237, 104802. [Google Scholar] [CrossRef]
  31. Rui, J. Measuring streetscape perceptions from driveways and sidewalks to inform pedestrian-oriented street renewal in Düsseldorf. Cities 2023, 141, 104472. [Google Scholar] [CrossRef]
  32. Li, X.; Zhang, C.; Li, W.; Ricard, R.; Meng, Q.; Zhang, W. Assessing street-level urban greenery using Google Street View and a modified green view index. Urban For. Urban Green. 2015, 14, 675–685. [Google Scholar] [CrossRef]
  33. Naik, N.; Philipoom, J.; Raskar, R.; Hidalgo, C. Streetscore-predicting the perceived safety of one million streetscapes. In Proceedings of the IEEE Conference on Computer Vision and Pattern Recognition Workshops, Columbus, OH, USA, 23–28 June 2014; pp. 779–785. [Google Scholar]
  34. Bradley, R.A.; Terry, M.E. Rank analysis of incomplete block designs: I. The method of paired comparisons. Biometrika 1952, 39, 324–345. [Google Scholar] [CrossRef]
  35. Alexander, C. A Pattern Language: Towns, Buildings, Construction; Oxford University Press: Oxford, UK, 1977. [Google Scholar]
  36. Causeur, D.; Husson, F. A 2-dimensional extension of the Bradley–Terry model for paired comparisons. J. Stat. Plan. Inference 2005, 135, 245–259. [Google Scholar] [CrossRef]
  37. Chen, L.C.; Zhu, Y.; Papandreou, G.; Schroff, F.; Adam, H. Encoder-decoder with atrous separable convolution for semantic image segmentation. In Proceedings of the European Conference on Computer Vision (ECCV), Munich, Germany, 8–14 September 2018; pp. 801–818. [Google Scholar]
  38. Cordts, M.; Omran, M.; Ramos, S.; Rehfeld, T.; Enzweiler, M.; Benenson, R.; Franke, U.; Roth, S.; Schiele, B. The cityscapes dataset for semantic urban scene understanding. In Proceedings of the IEEE Conference on Computer Vision and Pattern Recognition, Las Vegas, NV, USA, 27–30 June 2016; pp. 3213–3223. [Google Scholar]
  39. Ren, Z.; Wang, L.; Song, T.; Li, Y.; Zhang, J.; Zhao, F. Enhancing Road Scene Segmentation with an Optimized DeepLabV3+. IEEE Access 2024, 12, 197748–197765. [Google Scholar] [CrossRef]
  40. Qin, J.; Xu, C.; Ai, Y.; Zhang, H.; Cheng, Y. Research on Semantic Segmentation Algorithm for Autonomous Driving Based on Improved DeepLabv3+. In Artificial Intelligence in China, Proceedings of the International Conference on Artificial Intelligence in China, Wuhan, China, 18–20 November 2023; Springer: Singapore, 2023; pp. 107–117. [Google Scholar]
  41. Chen, L.C.; Papandreou, G.; Kokkinos, I.; Murphy, K.; Yuille, A.L. Deeplab: Semantic image segmentation with deep convolutional nets, atrous convolution, and fully connected crfs. IEEE Trans. Pattern Anal. Mach. Intell. 2017, 40, 834–848. [Google Scholar] [CrossRef]
  42. Hadinata, P.N.; Simanta, D.; Eddy, L.; Nagai, K. Crack detection on concrete surfaces using deep encoder-decoder convolutional neural network: A comparison study between U-Net and DeepLabV3+. J. Civ. Eng. Forum 2021, 7, 323–334. [Google Scholar] [CrossRef]
  43. Liu, Y.; Tian, Y.; Chen, Y.; Liu, F.; Belagiannis, V.; Carneiro, G. Perturbed and strict mean teachers for semi-supervised semantic segmentation. In Proceedings of the IEEE/CVF Conference on Computer Vision and Pattern Recognition, New Orleans, LA, USA, 18–24 June 2022; pp. 4258–4267. [Google Scholar]
  44. Jiang, B.; Mak, C.N.S.; Zhong, H.; Larsen, L.; Webster, C.J. From broken windows to perceived routine activities: Examining impacts of environmental interventions on perceived safety of urban alleys. Front. Psychol. 2018, 9, 2450. [Google Scholar] [CrossRef]
  45. Newman, O. Defensible Space: Crime Prevention Through Urban Design; Collier Books: New York, NY, USA, 1973. [Google Scholar]
  46. Lynch, K. The Image of the City; MIT Press: Cambridge, MA, USA, 1964. [Google Scholar]
  47. Cozens, P.M.; Saville, G.; Hillier, D. Crime prevention through environmental design (CPTED): A review and modern bibliography. Prop. Manag. 2005, 23, 328–356. [Google Scholar] [CrossRef]
  48. Nasar, J.L. Visual preferences in urban street scenes: A cross-cultural comparison between Japan and the United States. J. Cross-Cult. Psychol. 1984, 15, 79–93. [Google Scholar] [CrossRef]
  49. Fuller, M.; Moore, R. An Analysis of Jane Jacobs’s the Death and Life of Great American Cities; Macat Library: London, UK, 2017. [Google Scholar]
  50. Jansson, M.; Fors, H.; Lindgren, T.; Wiström, B. Perceived personal safety in relation to urban woodland vegetation–A review. Urban For. Urban Green. 2013, 12, 127–133. [Google Scholar] [CrossRef]
  51. Ristea, A.; Leitner, M.; Resch, B.; Stratmann, J. Applying spatial video geonarratives and physiological measurements to explore perceived safety in Baton Rouge, Louisiana. Int. J. Environ. Res. Public Health 2021, 18, 1284. [Google Scholar] [CrossRef] [PubMed]
  52. Kang, Y.; Abraham, J.; Ceccato, V.; Duarte, F.; Gao, S.; Ljungqvist, L.; Zhang, F.; Näsman, P.; Ratti, C. Assessing differences in safety perceptions using GeoAI and survey across neighbourhoods in Stockholm, Sweden. Landsc. Urban Plan. 2023, 236, 104768. [Google Scholar] [CrossRef]
  53. Ma, S.; Wang, B.; Liu, W.; Zhou, H.; Wang, Y.; Li, S. Assessment of street space quality and subjective well-being mismatch and its impact, using multi-source big data. Cities 2024, 147, 104797. [Google Scholar] [CrossRef]
  54. Chiang, Y.C.; Liu, H.H.; Li, D.; Ho, L.C. Quantification through deep learning of sky view factor and greenery on urban streets during hot and cool seasons. Landsc. Urban Plan. 2023, 232, 104679. [Google Scholar] [CrossRef]
  55. Han, Y.; Zhong, T.; Yeh, A.G.; Zhong, X.; Chen, M.; Lü, G. Mapping seasonal changes of street greenery using multi-temporal street-view images. Sustain. Cities Soc. 2023, 92, 104498. [Google Scholar] [CrossRef]
  56. Lian, H.; Li, X.; Zhou, W.; Zhang, J.; Li, H. Pedestrian vitality characteristics in pedestrianized commercial streets-considering temporal, spatial, and built environment factors. Front. Archit. Res. 2025, 14, 630–653. [Google Scholar] [CrossRef]
  57. Wu, T.; Chen, Z.; Li, S.; Xing, P.; Wei, R.; Meng, X.; Zhao, J.; Wu, Z.; Qiao, R. Decoupling Urban Street Attractiveness: An Ensemble Learning Analysis of Color and Visual Element Contributions. Land 2025, 14, 979. [Google Scholar] [CrossRef]
Figure 1. Overall framework of the study.
Land 14 01544 g001
Figure 2. Location map showing Golden Street.
Land 14 01544 g002
Figure 3. Selection of study area.
Land 14 01544 g003
Figure 4. Collection of SVI.
Land 14 01544 g004
Figure 5. Example of SVI feature extraction.
Land 14 01544 g005
Figure 6. Example of manual verification of semantic segmentation.
Land 14 01544 g006
Figure 7. The hot and cold spots for each indicator in Golden Street.
Land 14 01544 g007
Figure 8. Correlation matrix for each perception indicator.
Land 14 01544 g008
Figure 9. Average emotional scores of six evaluation dimensions.
Land 14 01544 g009
Figure 10. Six evaluation dimensions’ average deviation of emotional scores.
Land 14 01544 g010
Figure 11. Average emotional scores of six evaluation dimensions across different regions.
Land 14 01544 g011
Figure 12. Examples of SVI in spatio-temporal variation.
Land 14 01544 g012
Disclaimer/Publisher’s Note: The statements, opinions and data contained in all publications are solely those of the individual author(s) and contributor(s) and not of MDPI and/or the editor(s). MDPI and/or the editor(s) disclaim responsibility for any injury to people or property resulting from any ideas, methods, instructions or products referred to in the content.

