
Constructing Ecological Security Patterns in Coal Mining Subsidence Areas with High Groundwater Levels Based on Scenario Simulation

Abstract
1. Introduction
2. Materials and Methods
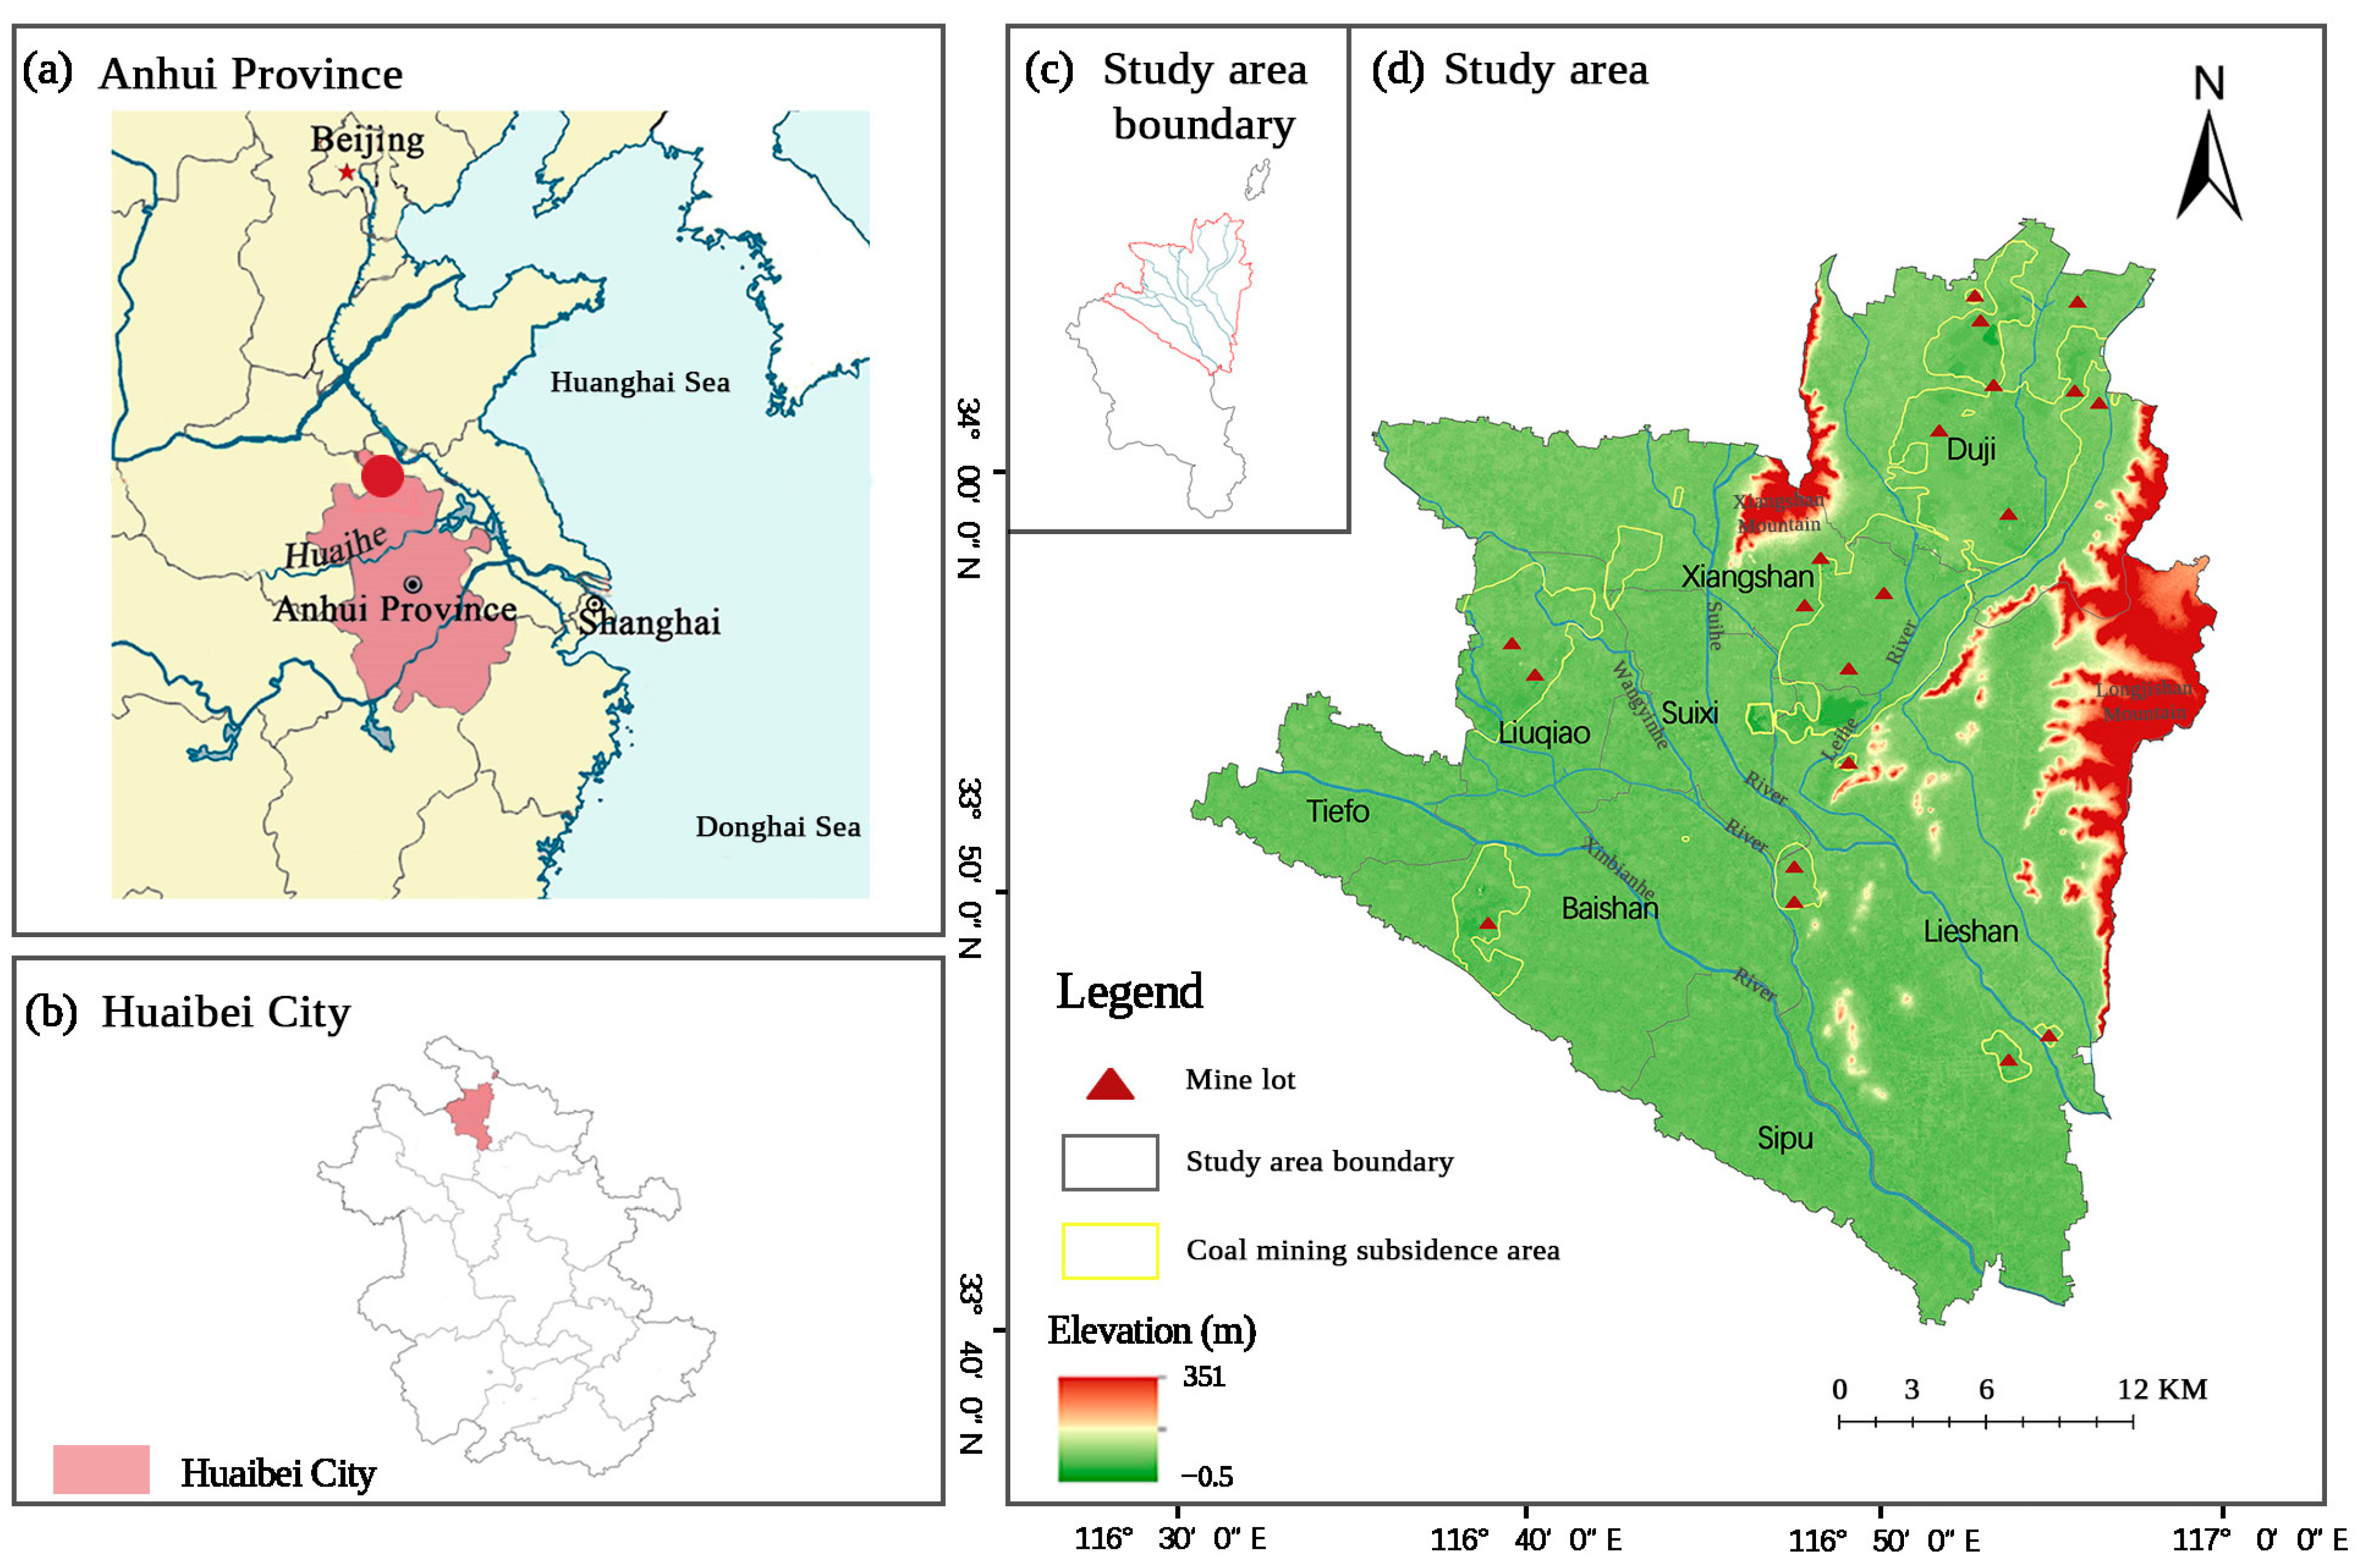
2.1. Study Area
2.2. Data Sources
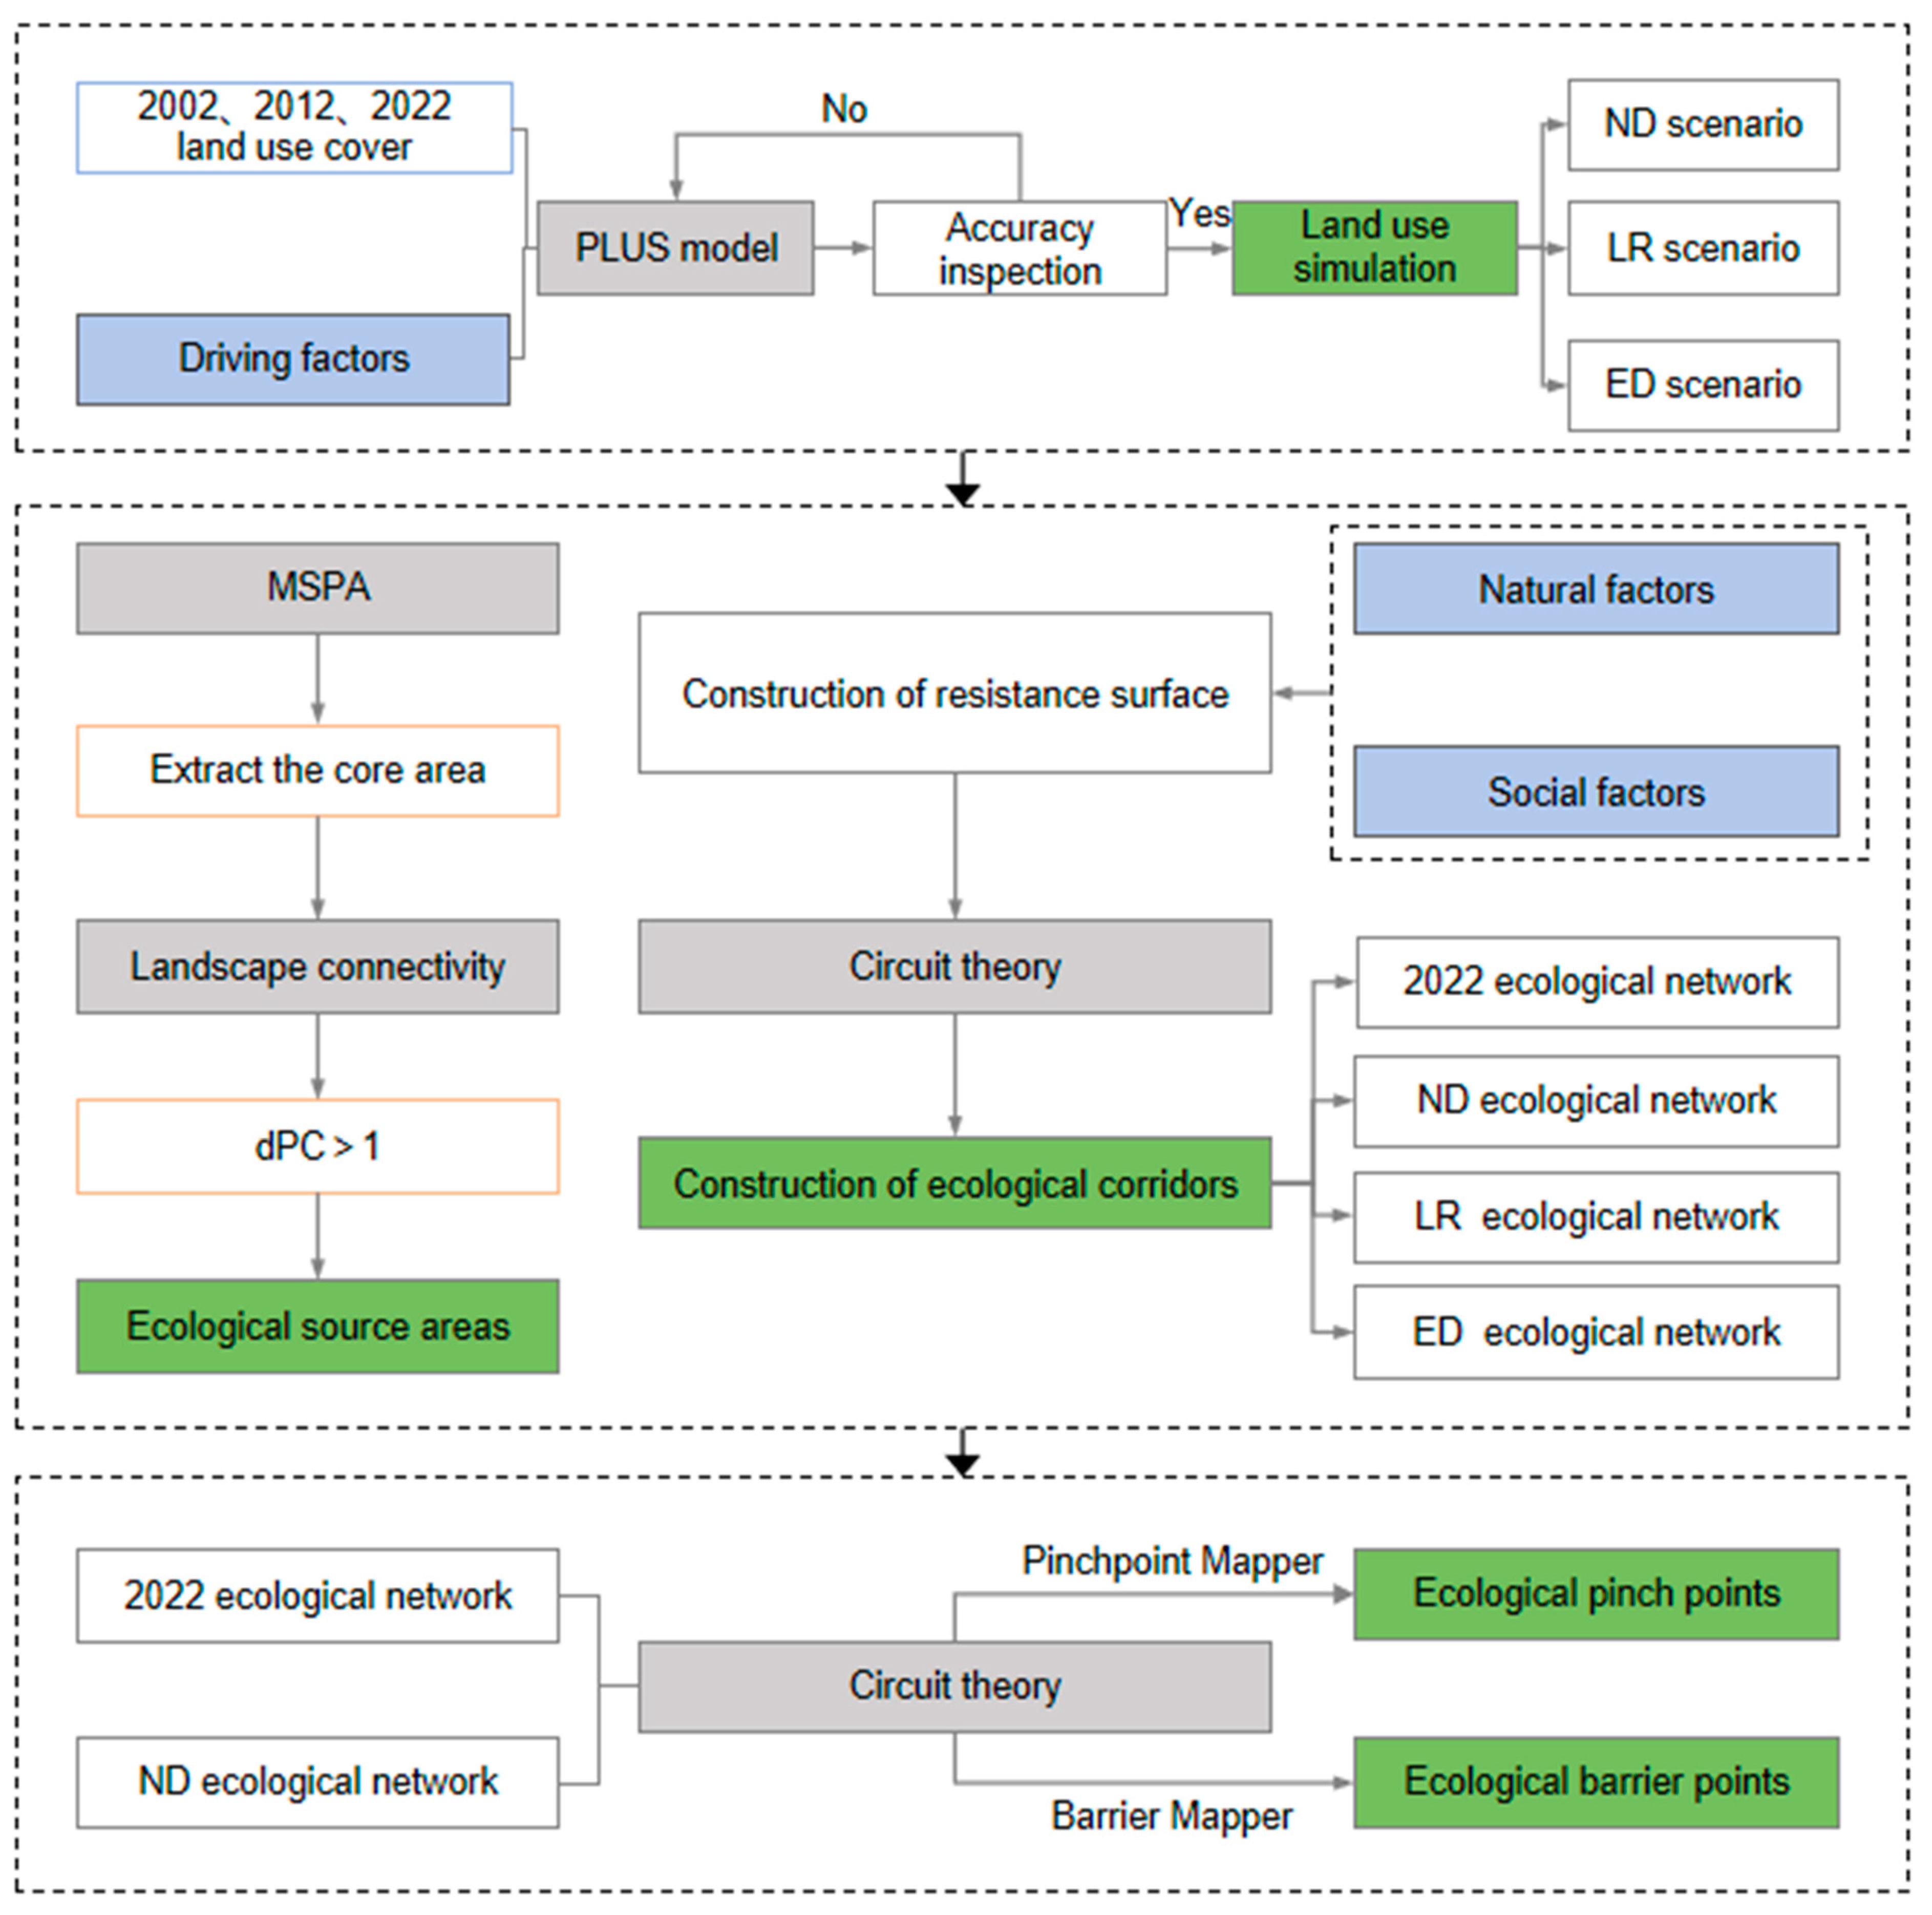
2.3. Methods
2.3.1. Simulation of Spatio-Temporal Changes in Land Use
2.3.2. Scenario Setting
2.3.3. Model Verification
2.3.4. Identification of Ecological Source Areas
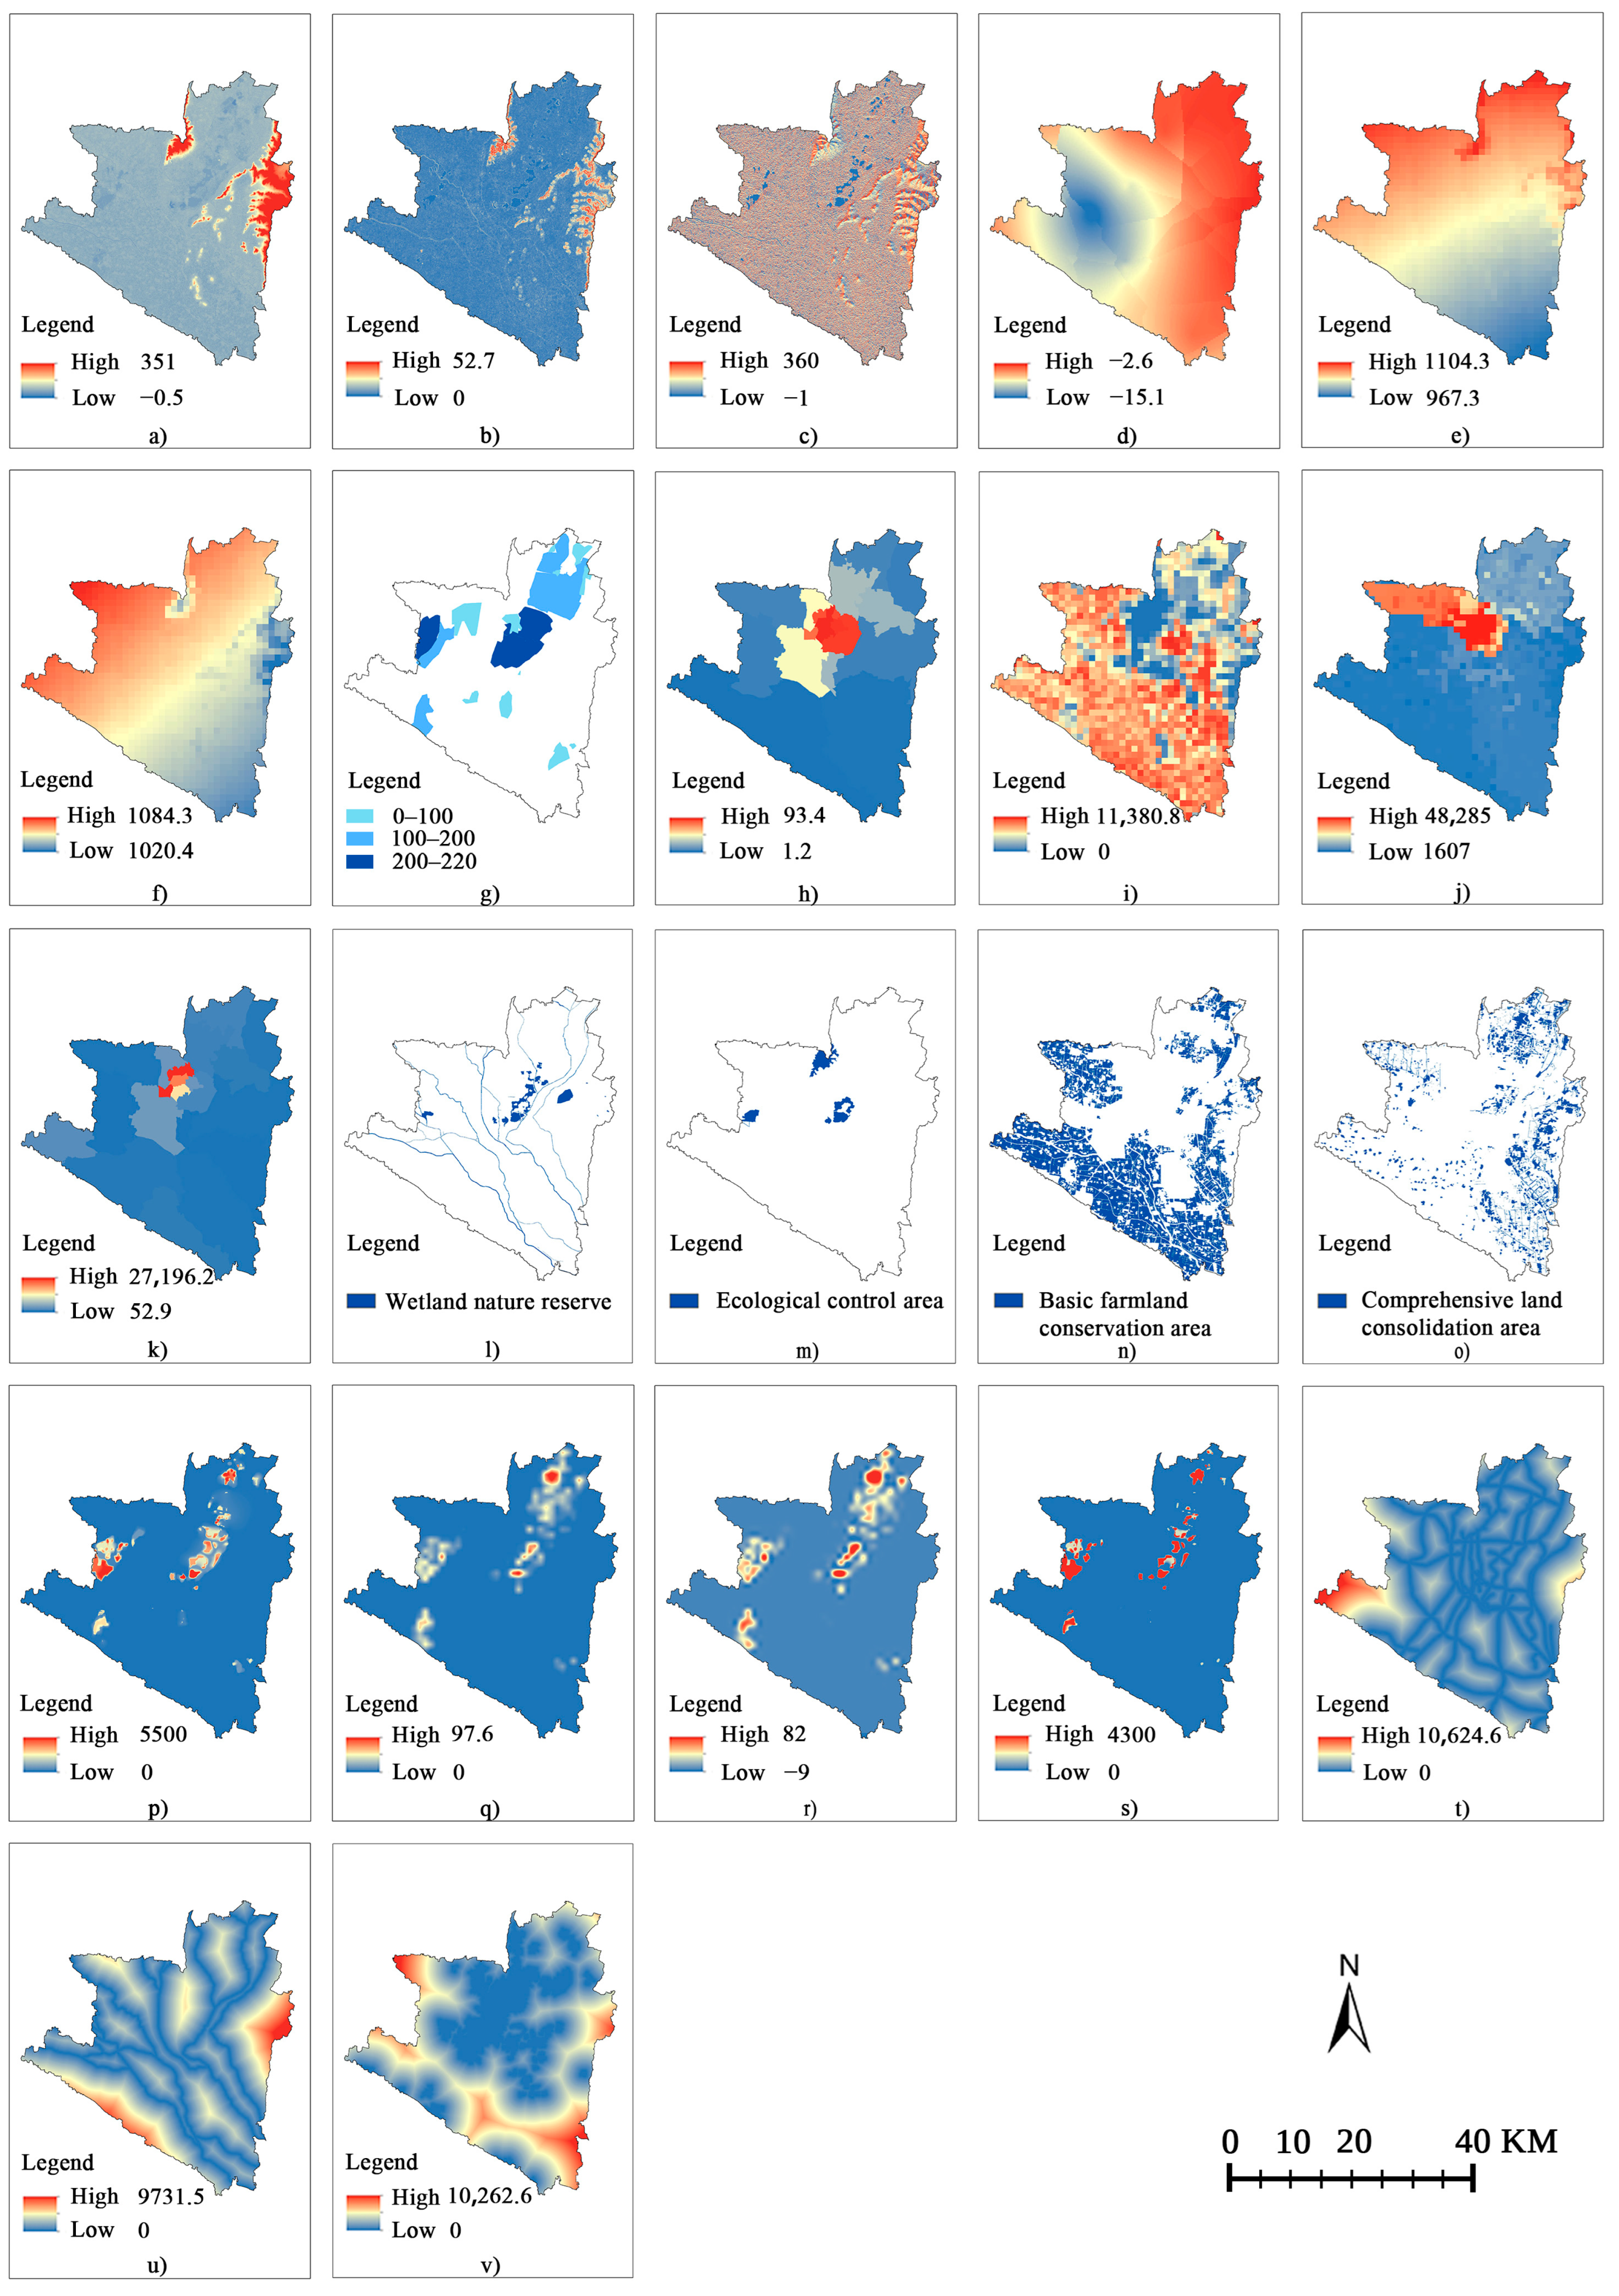
2.3.5. Construction of Resistance Surface
2.3.6. Extraction of Ecological Corridors
2.3.7. Identification of Ecological Pinch Points and Ecological Barrier Points
3. Results
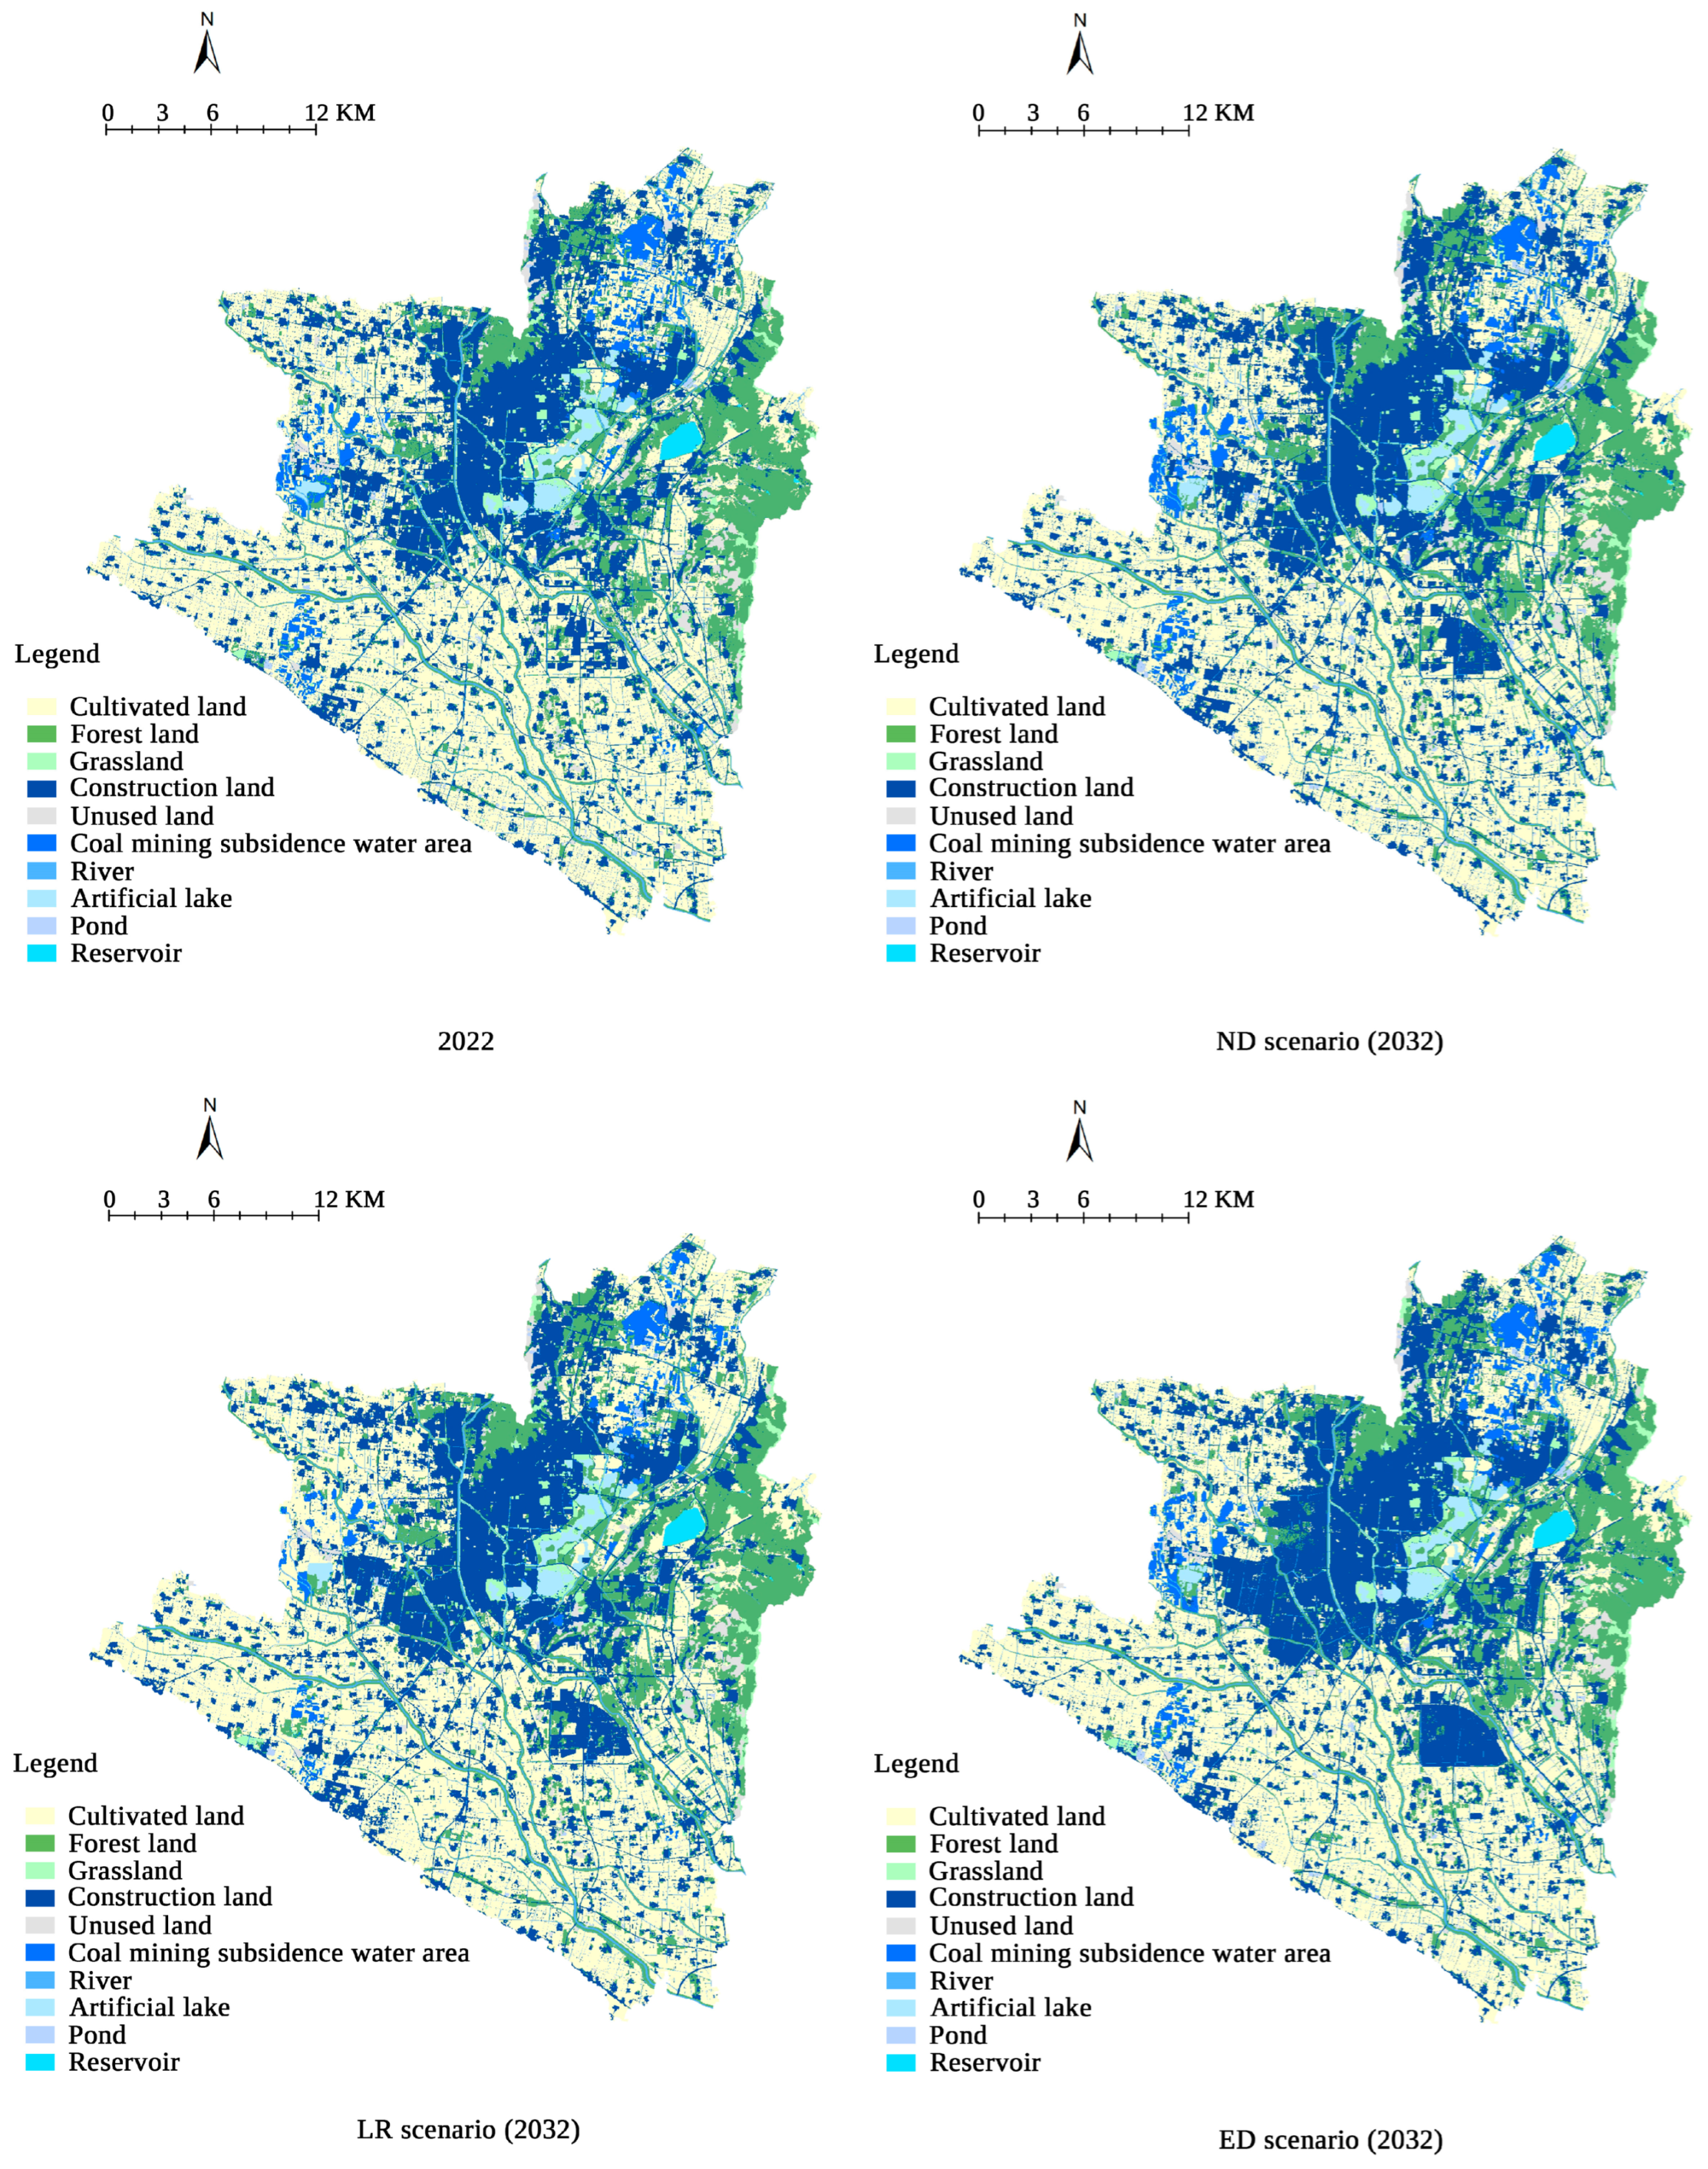
3.1. Simulation Results of Spatio-Temporal Changes in Land Use
3.2. Identification of Ecological Source Areas
3.2.1. Results of Ecological Source Areas Identified Based on MSPA
3.2.2. Results of Extracting Ecological Source Areas Based on Landscape Connectivity
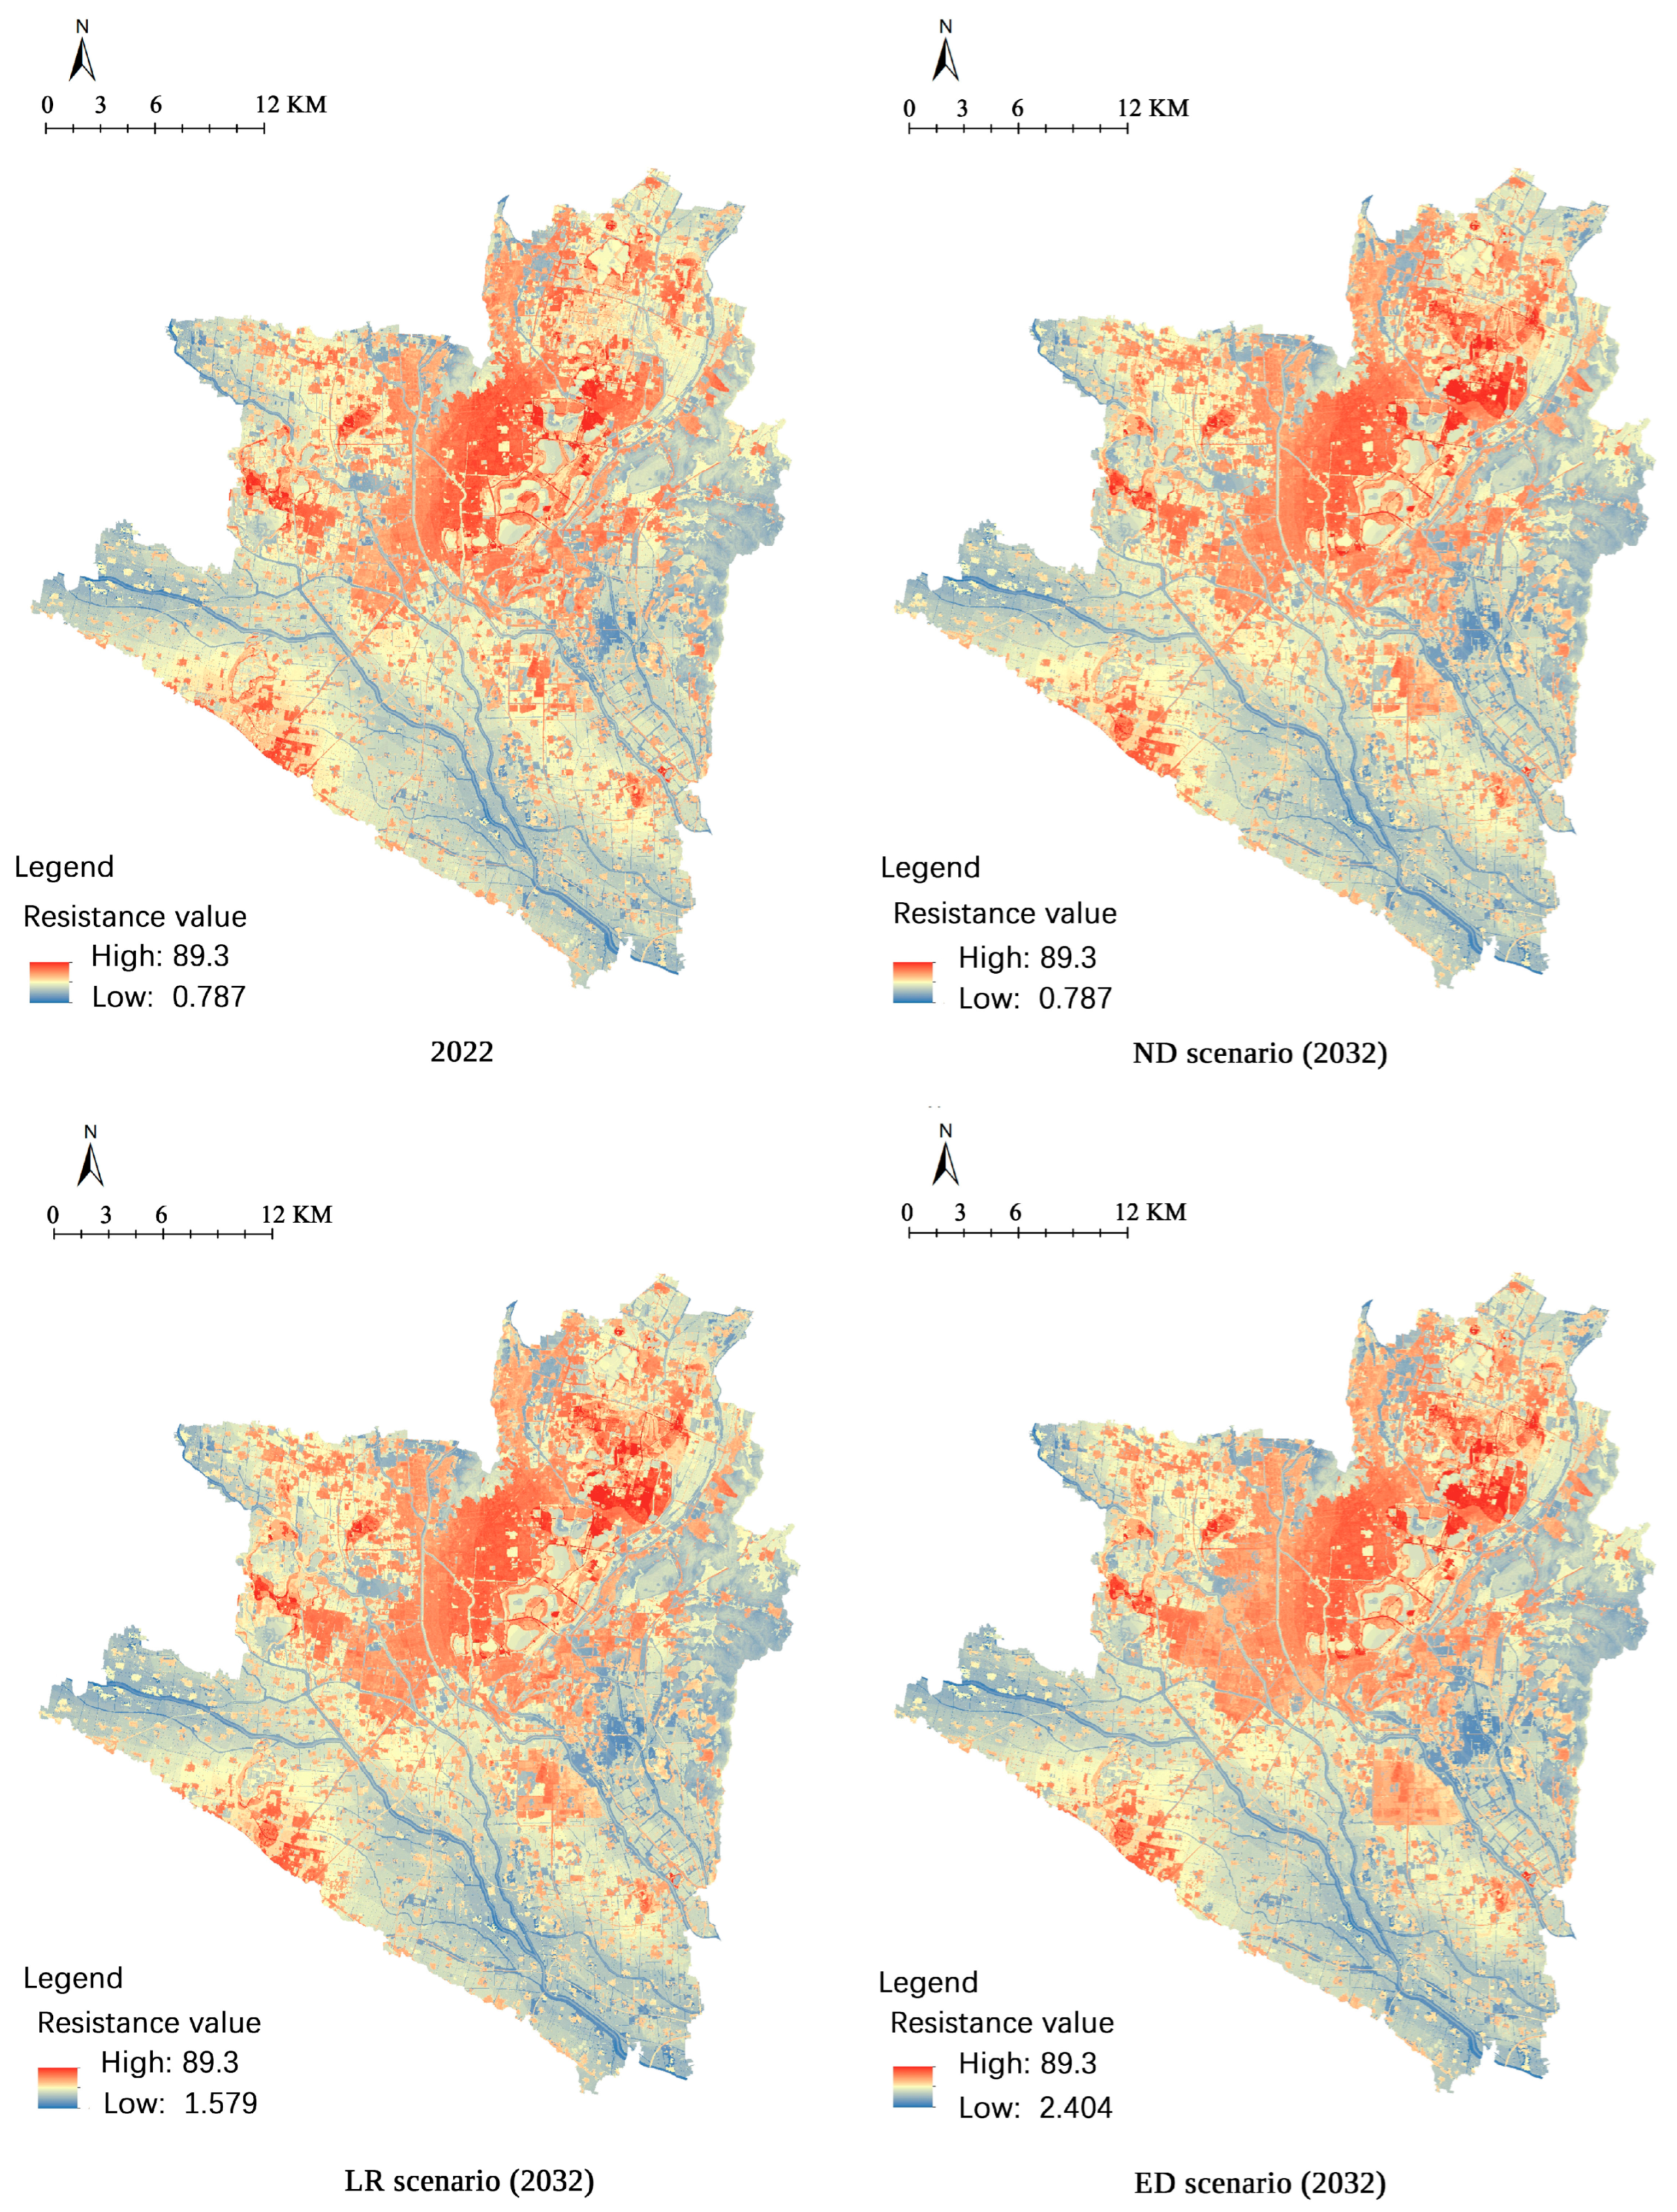
3.3. Resistance Surface Construction Results
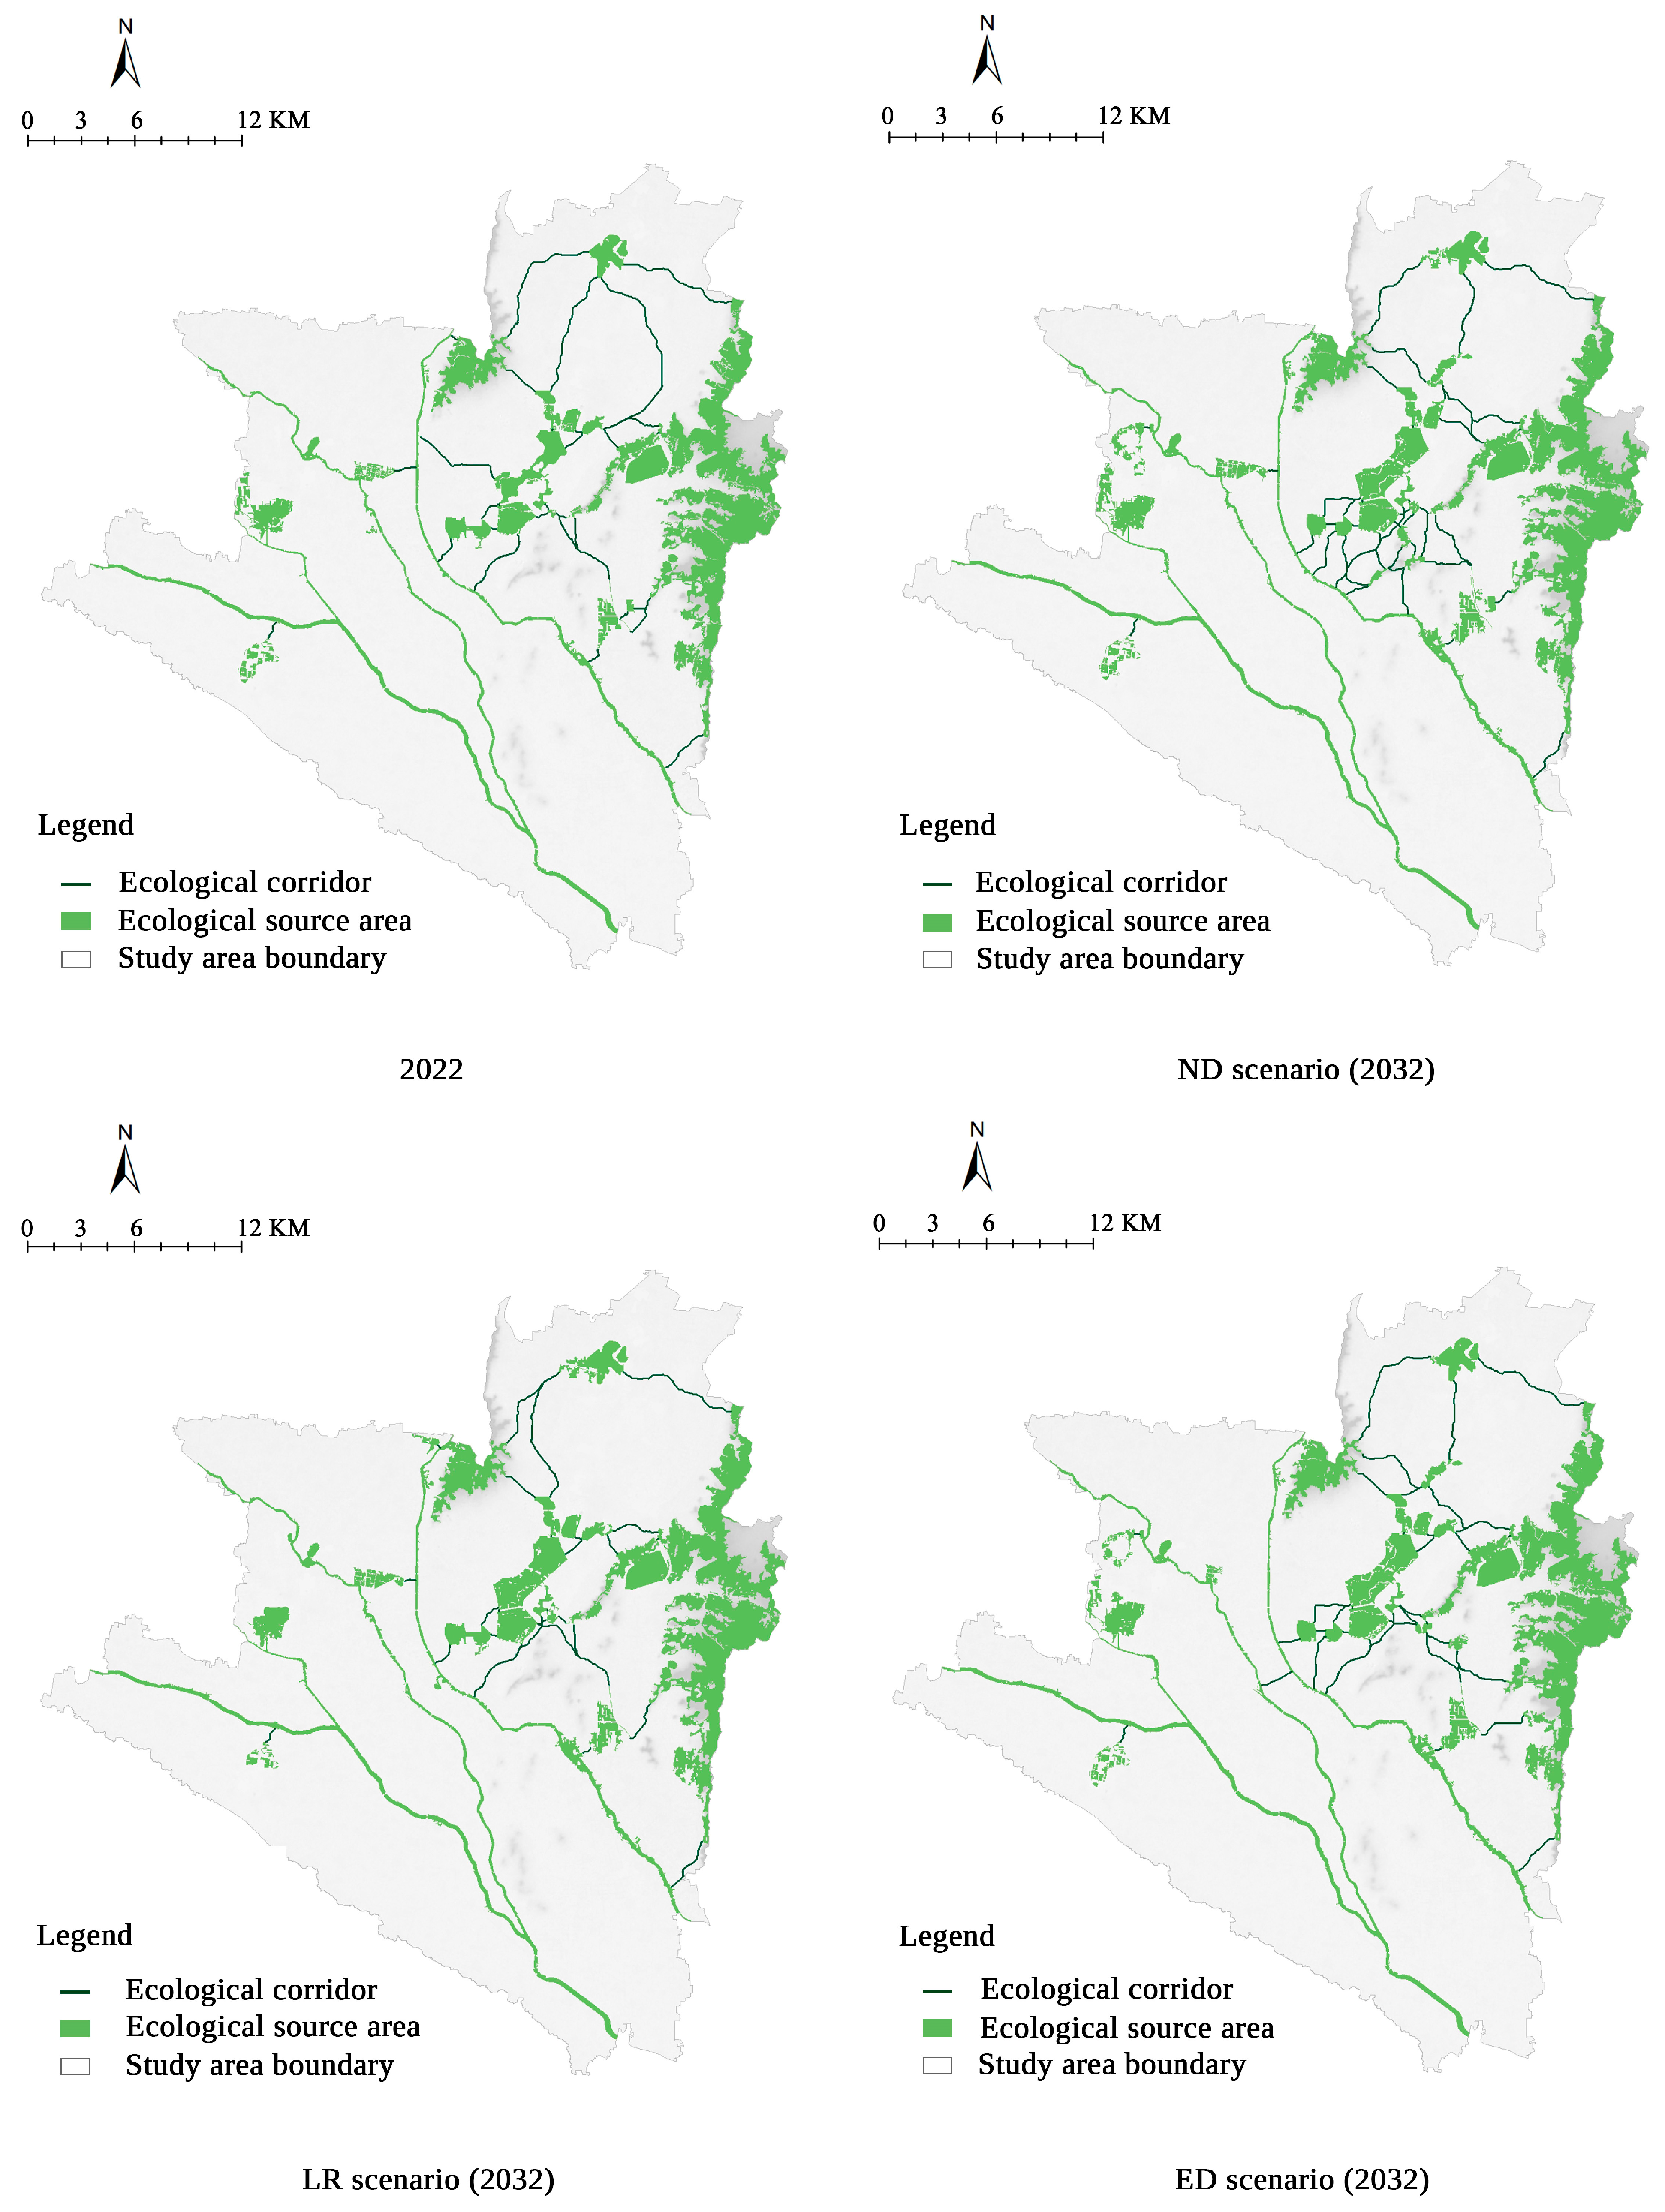
3.4. Ecological Corridor Extraction Results
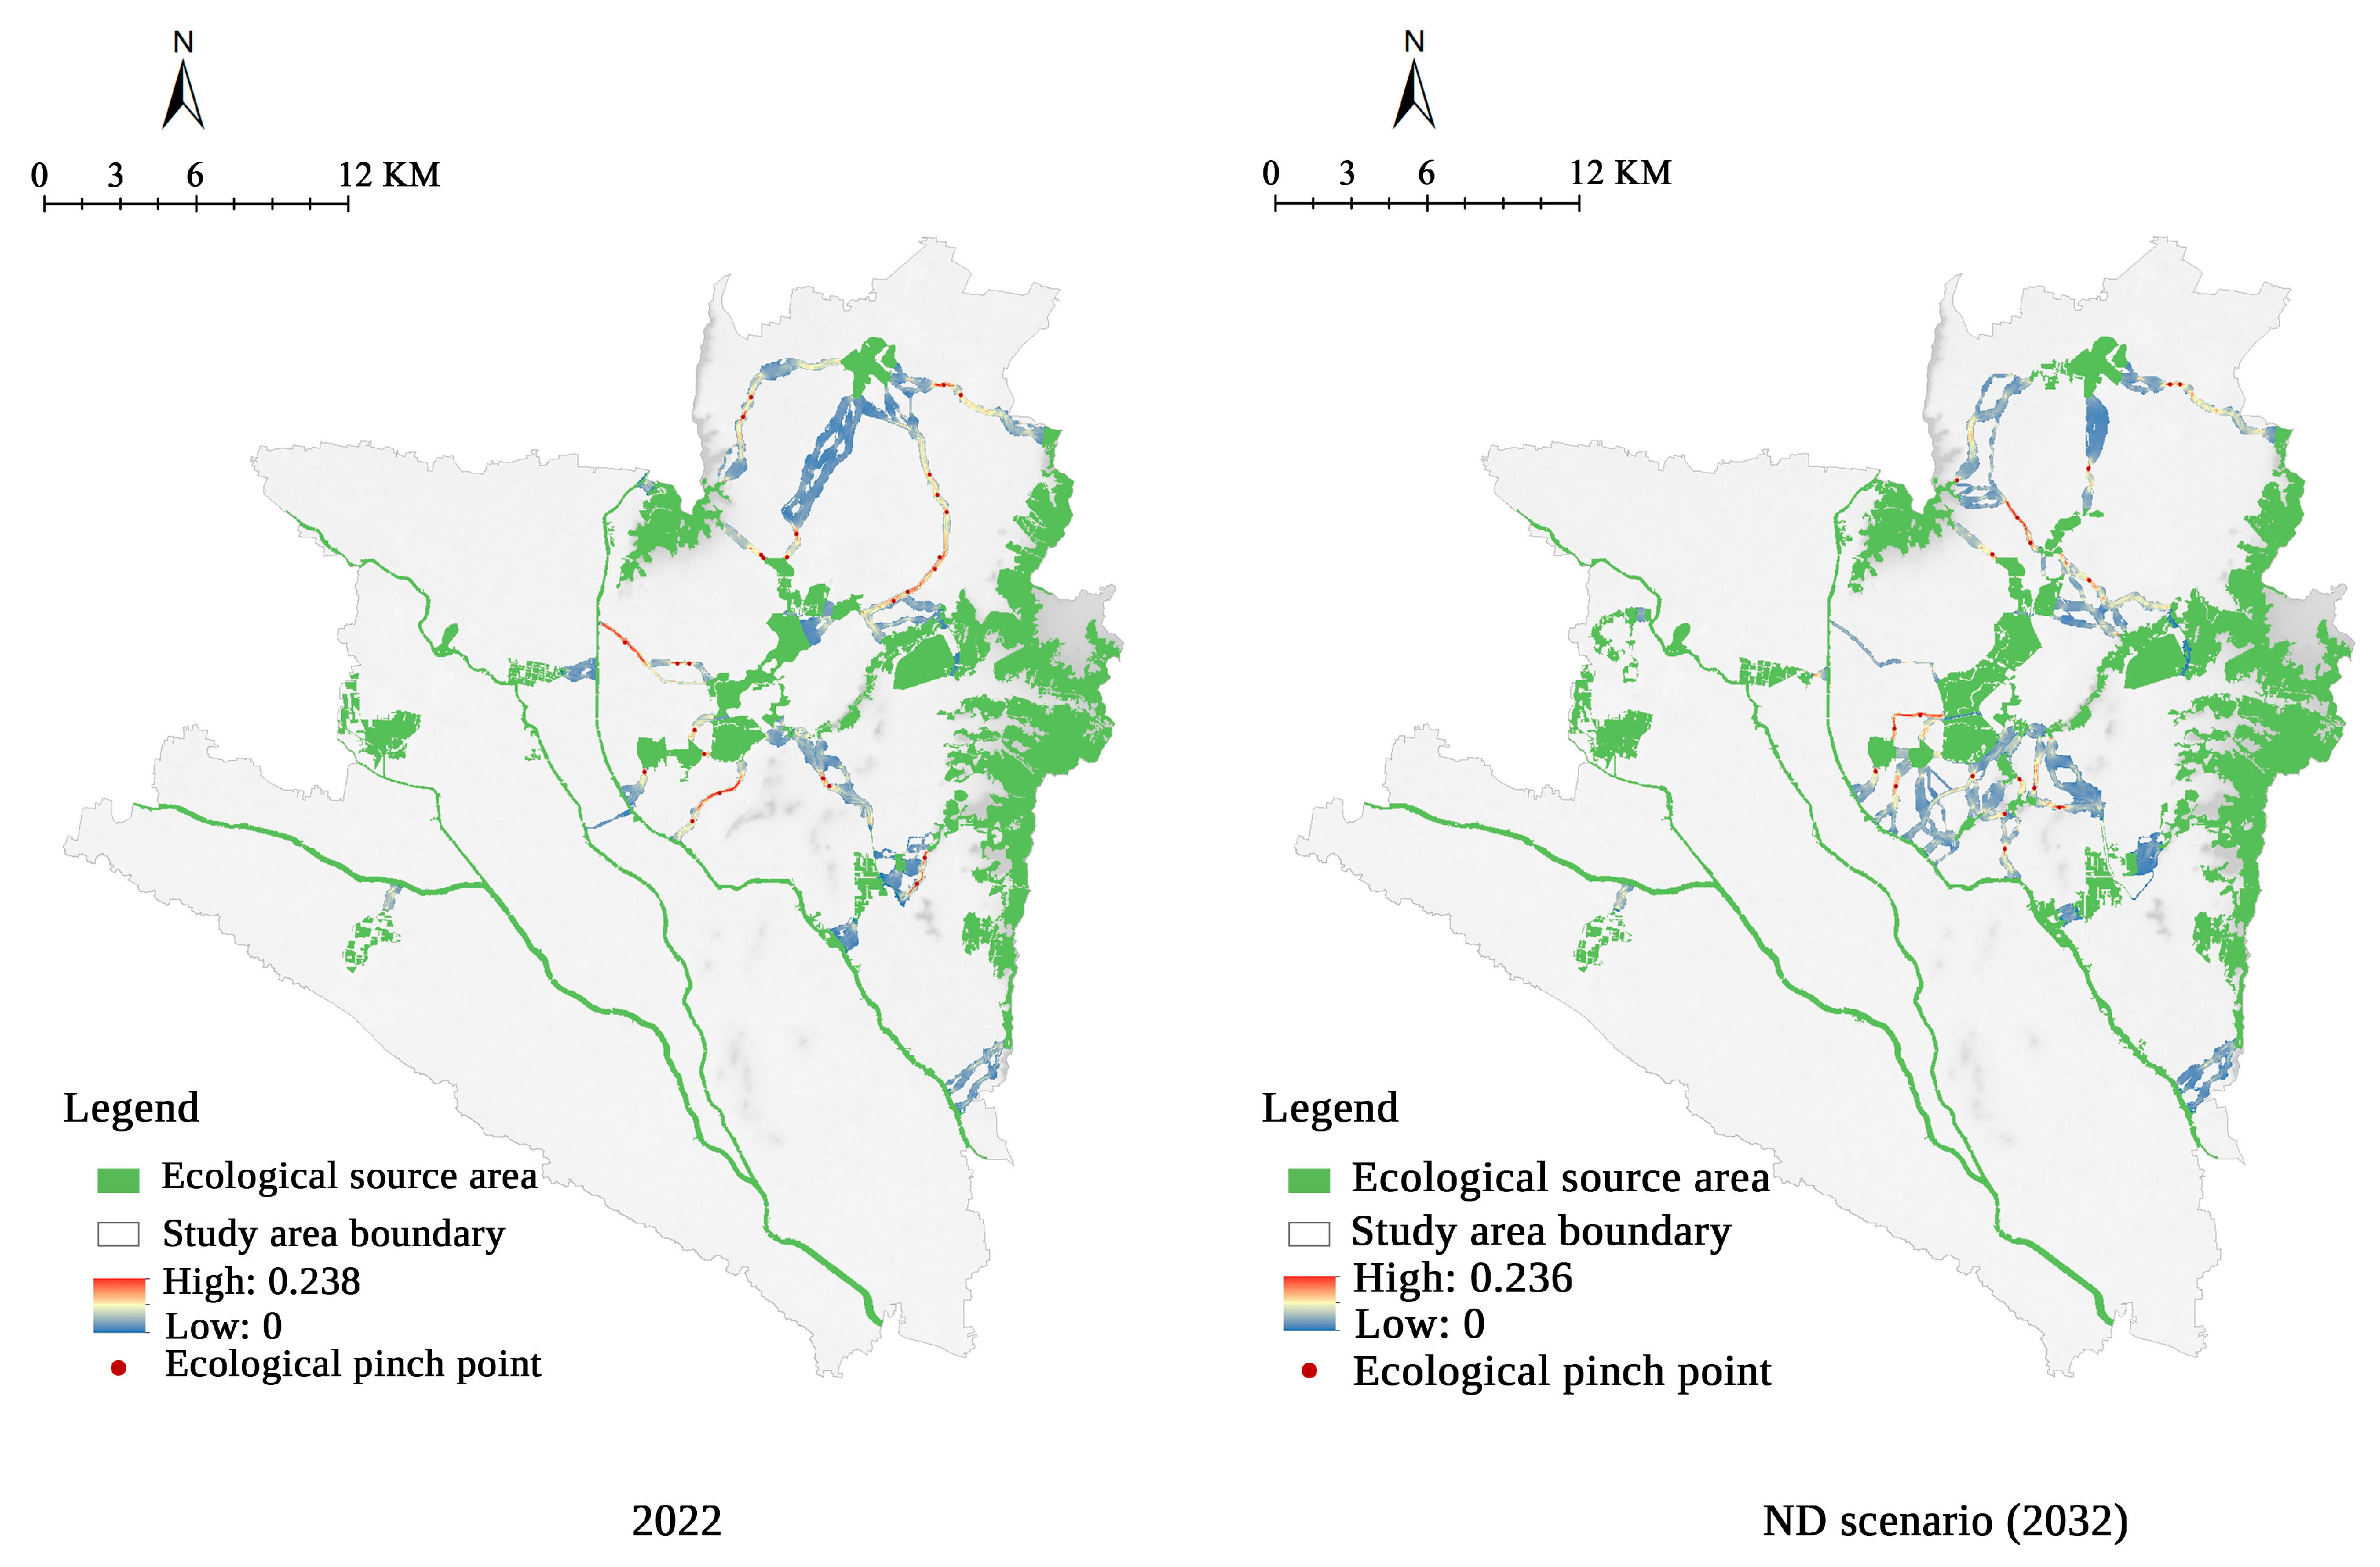
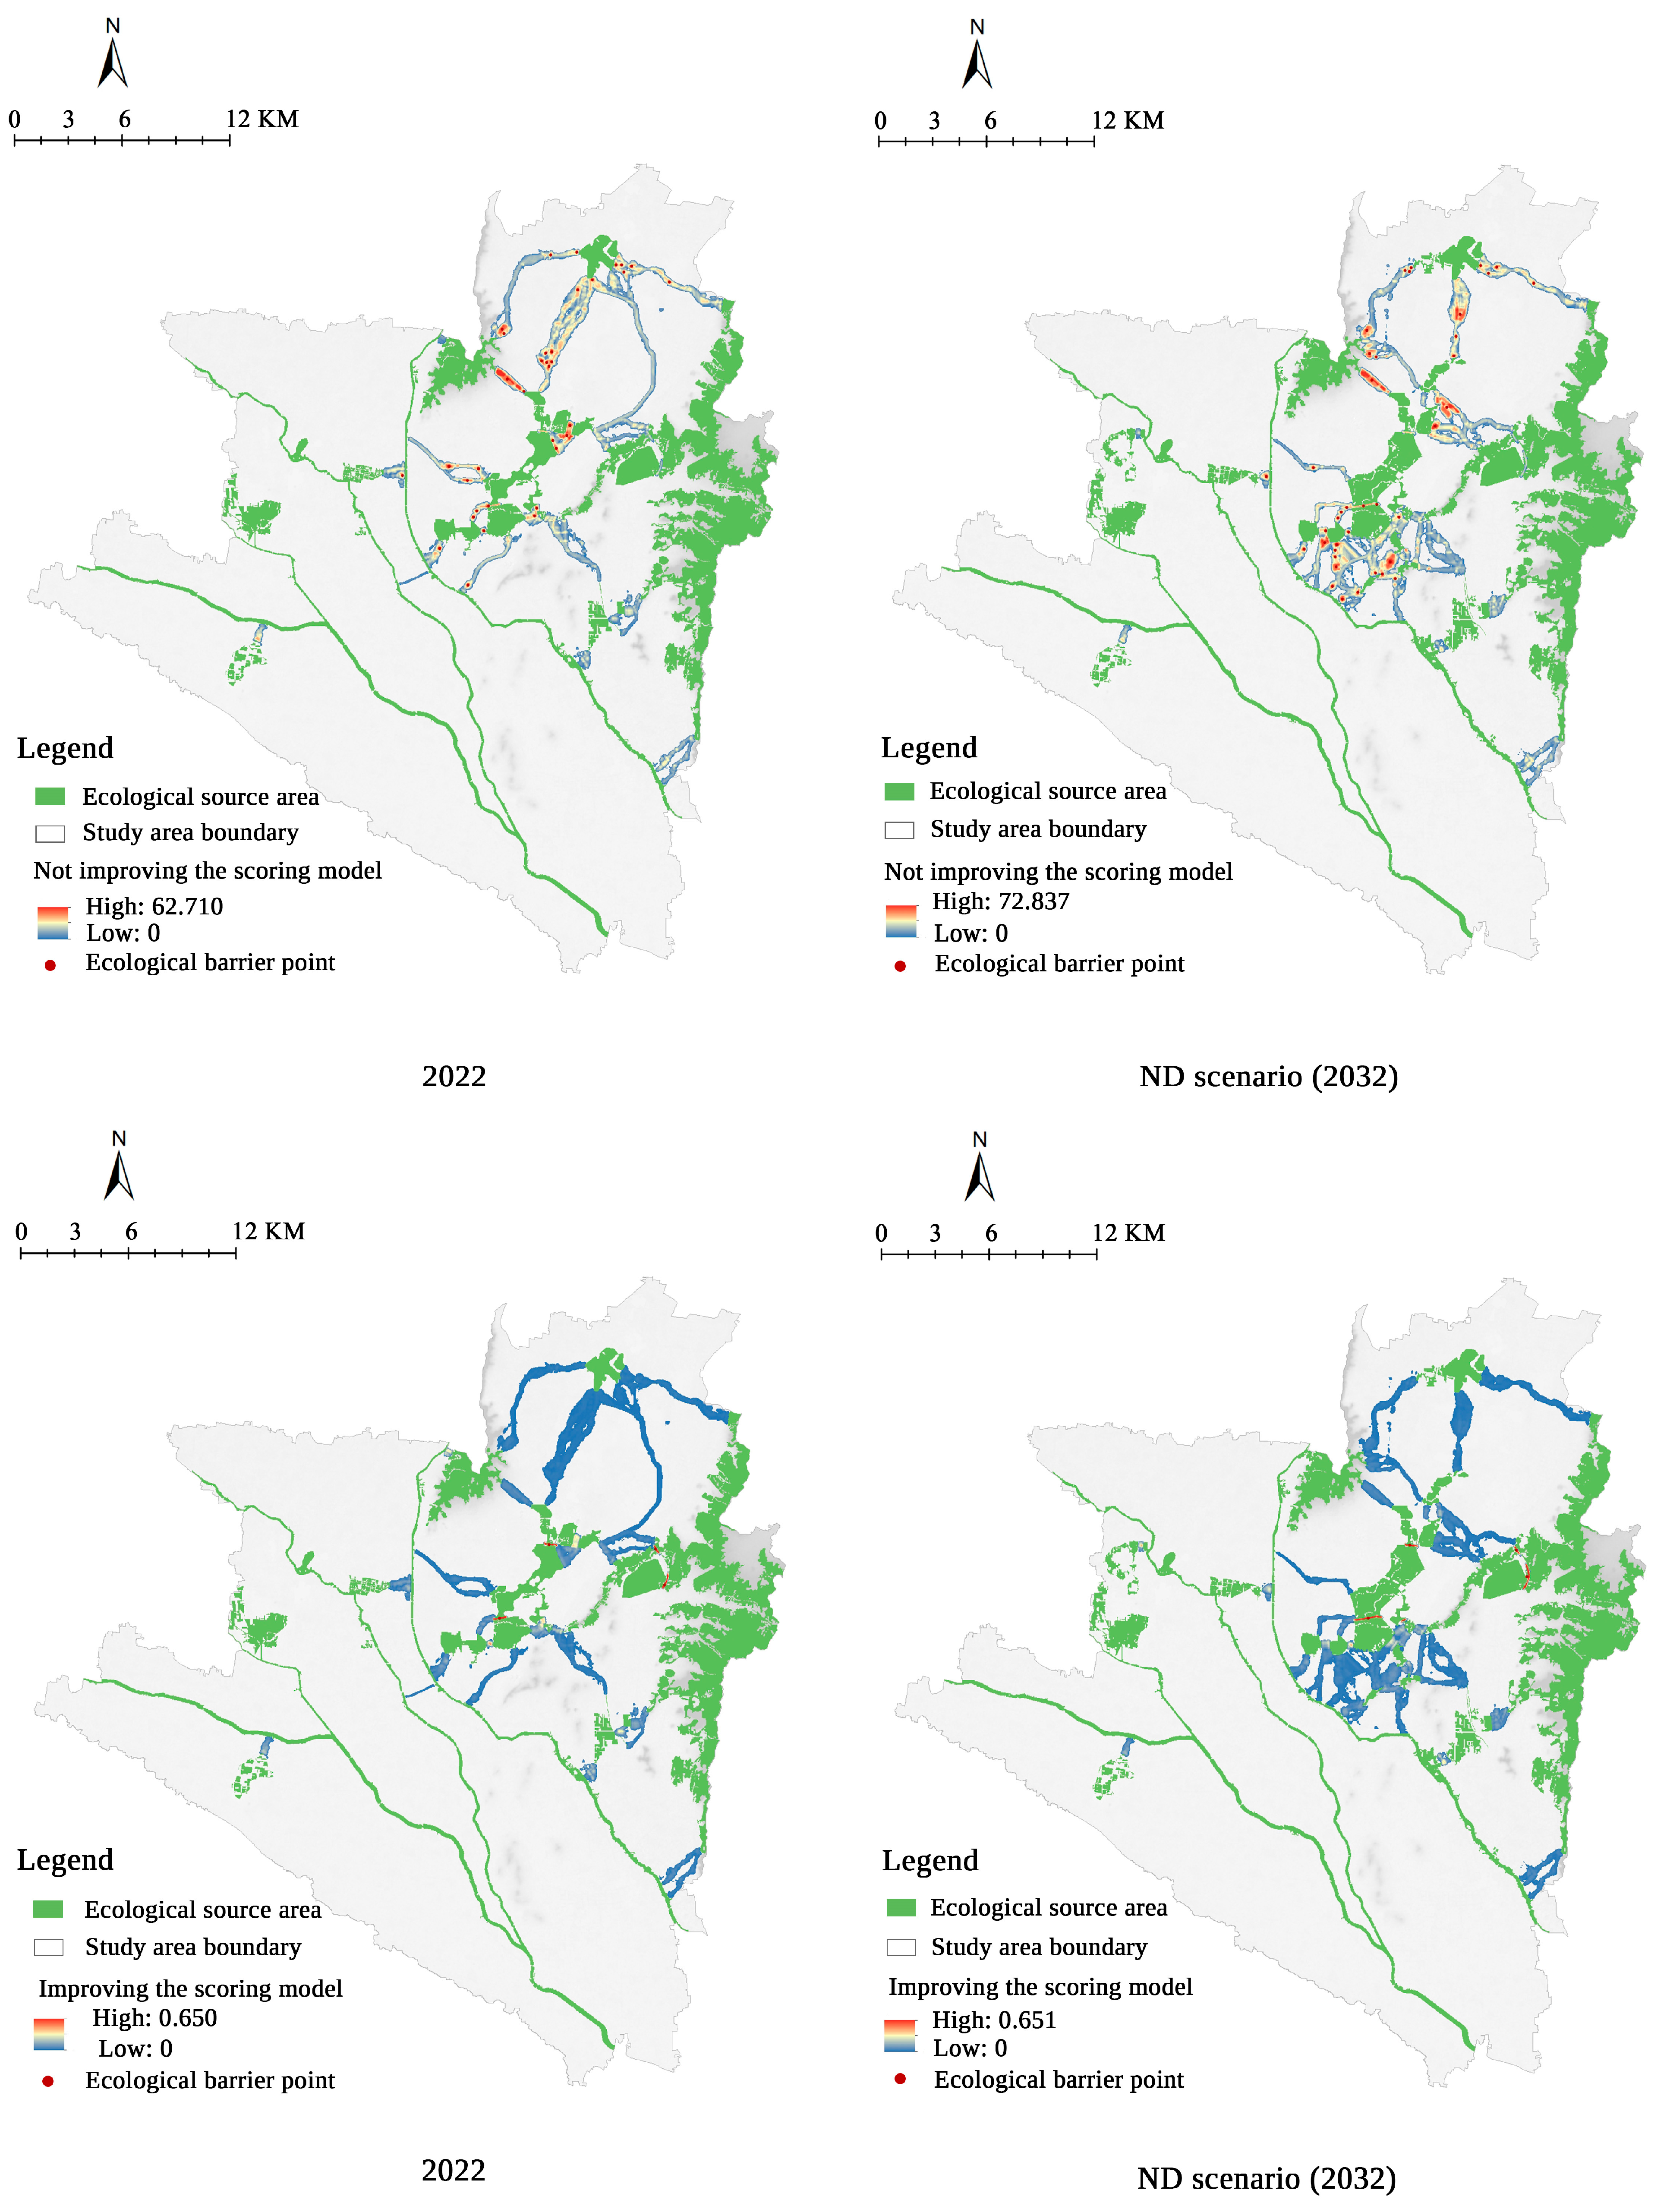
3.5. Identification of Ecological Pinch Points and Barrier Points
4. Discussion
4.1. Optimization of Key Issues and Strategies for Ecological Protection and Restoration in Coal Mining Subsidence Areas with High Groundwater Levels
4.2. Exploring the Applicability and Optimization of Methods for Constructing ESPs
4.3. Limitations and Prospects
5. Conclusions
Author Contributions
Funding
Data Availability Statement
Acknowledgments
Conflicts of Interest
References
- Xiao, W.; Hu, Z.; Xu, X.; Fu, Y. Cost definite method of land reclamation in coal mining area. J. China Coal Soc. 2010, 35, 175–179. [Google Scholar] [CrossRef]
- Hu, Z.; Xiao, W. Optimization of concurrent mining and reclamation plans for single coal seam: A case study in northern Anhui, China. Environ. Earth Sci. 2013, 68, 1247–1254. [Google Scholar] [CrossRef]
- Larondelle, N.; Haase, D. Valuing post-mining landscapes using an ecosystem services approach—An example from Germany. Ecol. Indic. 2012, 18, 567–574. [Google Scholar] [CrossRef]
- Zhang, F.; Jia, Y.; Liu, X.; Li, T.; Gao, Q. Application of MSPA-MCR models to construct ecological security pattern in the basin: A case study of Dawen River basin. Ecol. Indic. 2024, 160, 111887. [Google Scholar] [CrossRef]
- Wang, J.; Li, H.; Guo, Y.; Wang, P. Research progress and perspectives on biodiversity conservation and restoration of coal mine reclamation area. Adv. Earth Sci. 2016, 31, 126–136. [Google Scholar] [CrossRef]
- Sommerhäuser, M.; Stemplewski, J. Ecological Revitalization of Rivers and Streams in an Urban Area Using the Example of the Emscher System Refurbishment: Basic Conditions, Current Status and Control of Success. Wasserwirtschaft 2015, 105, 36–40. [Google Scholar] [CrossRef]
- Guan, D.; Chang, Q.; Zhou, L.; Zhu, K.; Peng, G. Construction and Optimization of Ecological Security Pattern Network Based on the Supply–Demand Ratio of Ecosystem Services: A Study from Chengdu–Chongqing Economic Circle, China. Land 2024, 13, 844. [Google Scholar] [CrossRef]
- Yu, K. Security patterns and surface model in landscape ecological planning. Landsc. Urban Plan. 1996, 36, 1–17. [Google Scholar] [CrossRef]
- Liu, H.; Wang, Z.; Zhang, L.; Tang, F.; Wang, G.; Li, M. Construction of an ecological security network in the Fenhe River Basin and its temporal and spatial evolution characteristics. J. Clean. Prod. 2023, 417, 137961. [Google Scholar] [CrossRef]
- Luo, J.; Fu, H. Construct the future wetland ecological security pattern with multi-scenario simulation. Ecol. Indic. 2023, 153, 110473. [Google Scholar] [CrossRef]
- Wang, H.; He, S.; Liu, X.; Dai, L.; Pan, P.; Hong, S.; Zhang, W. Simulating urban expansion using a cloud-based cellular automata model: A case study of Jiangxia, Wuhan, China. Landsc. Urban Plan. 2013, 110, 99–112. [Google Scholar] [CrossRef]
- Liang, X.; Guan, Q.; Clarke, K.C.; Liu, S.; Wang, B.; Yao, Y. Understanding the drivers of sustainable land expansion using a patch-generating land use simulation (PLUS) model: A case study in Wuhan, China. Comput. Environ. Urban Syst. 2021, 85, 101569. [Google Scholar] [CrossRef]
- Feng, X.; Huang, H.; Wang, Y.; Tian, Y.; Li, L. Identification of Ecological Sources Using Ecosystem Service Value and Vegetation Productivity Indicators: A Case Study of the Three-River Headwaters Region, Qinghai–Tibetan Plateau, China. Remote Sens. 2024, 16, 1258. [Google Scholar] [CrossRef]
- Skokanová, H.; Netopil, P.; Havlíček, M.; Šarapatka, B. The role of traditional agricultural landscape structures in changes to green infrastructure connectivity. Agric. Ecosyst. Environ. 2020, 302, 107071. [Google Scholar] [CrossRef]
- Wang, X.; Wan, R.; Pan, P. Construction and adjustment of ecologicals ecurity pattern based on MSPA-MCR Model in Taihu Lake Basin. Acta Cologica Sin. 2022, 42, 1968–1980. [Google Scholar] [CrossRef]
- Wickham, J.D.; Riitters, K.H.; Wade, T.G.; Vogt, P. A national assessment of green infrastructure and change for the conterminous United States using morphological image processing. Landsc. Urban Plan. 2010, 94, 186–195. [Google Scholar] [CrossRef]
- Hashemi, R.; Darabi, H.; Hashemi, M.; Wang, J. Graph theory in ecological network analysis: A systematic review for connectivity assessment. J. Clean. Prod. 2024, 472, 143504. [Google Scholar] [CrossRef]
- Chen, W.; Liu, H.; Wang, J. Construction and optimization of regional ecological security patterns based on MSPA-MCR-GA Model: A case study of Dongting Lake Basin in China. Ecol. Indic. 2024, 165, 112169. [Google Scholar] [CrossRef]
- Guo, Z.; Zhu, C.; Fan, X.; Li, M.; Xu, N.; Yuan, Y.; Guan, Y.; Lyu, C.; Bai, Z. Analysis of ecological network evolution in an ecological restoration area with the MSPA-MCR model: A case study from Ningwu County, China. Ecol. Indic. 2025, 170, 113067. [Google Scholar] [CrossRef]
- Huang, K.; Peng, L.; Wang, X.; Deng, W.; Liu, Y. Incorporating circuit theory, complex networks, and carbon offsets into the multi-objective optimization of ecological networks: A case study on karst regions in China. J. Clean. Prod. 2023, 383, 135512. [Google Scholar] [CrossRef]
- Zhang, L.; Liu, Q.; Wang, J.; Wu, T.; Li, M. Constructing ecological security patterns using remote sensing ecological index and circuit theory: A case study of the Changchun-Jilin-Tumen region. J. Environ. Manag. 2025, 373, 123693. [Google Scholar] [CrossRef]
- Li, Z.; Chang, J.; Li, C.; Gu, S. Ecological Restoration and Protection of National Land Space in Coal Resource-Based Cities from the Perspective of Ecological Security Pattern: A Case Study in Huaibei City, China. Land 2023, 12, 442. [Google Scholar] [CrossRef]
- Sun, D.; Wu, X.; Wen, H.; Ma, X.; Zhang, F.; Ji, Q.; Zhang, J. Ecological Security Pattern based on XGBoost-MCR model: A case study of the Three Gorges Reservoir Region. J. Clean. Prod. 2024, 470, 143252. [Google Scholar] [CrossRef]
- Wei, B.; Kasimu, A.; Fang, C.; Reheman, R.; Zhang, X.; Han, F.; Zhao, Y.; Aizizi, Y. Establishing and optimizing the ecological security pattern of the urban agglomeration in arid regions of China. J. Clean. Prod. 2023, 427, 139301. [Google Scholar] [CrossRef]
- Fang, Y.; Zhao, L.; Dou, B.; Li, Y.; Wang, S. Circuit VRC: A circuit theory-based ventilation corridor model for mitigating the urban heat islands. Build. Environ. 2023, 244, 110786. [Google Scholar] [CrossRef]
- McRae, B.H.; Beier, P. Circuit theory predicts gene flow in plant and animal populations. Proc. Natl. Acad. Sci. USA 2007, 104, 19885–19890. [Google Scholar] [CrossRef]
- Wu, Q.; Wang, L.; Wang, T.; Ruan, Z.; Du, P. Spatial–temporal evolution analysis of multi-scenario land use and carbon storage based on PLUS-InVEST model: A case study in Dalian, China. Ecol. Indic. 2024, 166, 112448. [Google Scholar] [CrossRef]
- Luan, C.; Liu, R.; Zhang, Q.; Sun, J.; Liu, J. Multi-objective land use optimization based on integrated NSGA–II–PLUS model: Comprehensive consideration of economic development and ecosystem services value enhancement. J. Clean. Prod. 2024, 434, 140306. [Google Scholar] [CrossRef]
- Su, Y.; Ma, X.; Feng, Q.; Liu, W.; Zhu, M.; Niu, J.; Liu, G.; Shi, L. Patterns and controls of ecosystem service values under different land-use change scenarios in a mining-dominated basin of northern China. Ecol. Indic. 2023, 151, 110321. [Google Scholar] [CrossRef]
- Hu, Z.; Li, G.; Yuan, D. Timing of concurrent mining and reclamation in coal-grain overlapping areas with mining-induced subsidence, Eastern China. J. China Coal Soc. 2023, 48, 373–387. [Google Scholar] [CrossRef]
- Cao, X.; Liu, Z.; Li, S.; Gao, Z. Integrating the Ecological Security Pattern and the PLUS Model to Assess the Effects of Regional Ecological Restoration: A Case Study of Hefei City, Anhui Province. Int. J. Environ. Res. Public Health 2022, 19, 6640. [Google Scholar] [CrossRef]
- Luo, X.; Le, F.; Zhang, Y.; Zhang, H.; Zhai, J.; Luo, Y. Multi-scenario analysis and optimization strategy of ecological security pattern in the Weihe river basin. J. Environ. Manag. 2024, 366, 121813. [Google Scholar] [CrossRef]
- AHDARC. Work Plan for Accelerating the Resolution of Outstanding Issues in Comprehensive Governance of Coal Mining Subsidence Areas. Available online: https://www.lieshan.gov.cn/zwgk/public/192/64530506.html (accessed on 10 May 2025).
- Vogt, P.; Riitters, K. GuidosToolbox: Universal digital image object analysis. Eur. J. Remote Sens. 2017, 50, 352–361. [Google Scholar] [CrossRef]
- Taylor, P.D.; Fahrig, L.; Merriam, H.G. Connectivity is a vital element of landscape structure. Oikos 1993, 68, 571–573. [Google Scholar] [CrossRef]
- Saura, S.; Pascual-Hortal, L. A new habitat availability index to integrate connectivity in landscape conservation planning: Comparison with existing indices and application to a case study. Landsc. Urban Plan. 2007, 83, 91–103. [Google Scholar] [CrossRef]
- Adriaensen, F.; Chardon, J.P.; De Blust, G.; Swinnen, E.; Villalba, S.; Gulinck, H.; Matthysen, E. The application of ‘least-cost’ modelling as a functional landscape model. Landsc. Urban Plan. 2003, 64, 233–247. [Google Scholar] [CrossRef]
- Li, L.; Huang, X.; Wu, D.; Yang, H. Construction of ecological security pattern adapting to future land use change in Pearl River Delta, China. Appl. Geogr. 2023, 154, 102946. [Google Scholar] [CrossRef]
- Spear, S.F.; Balkenhol, N.; Fortin, M.J.; McRae, B.H.; Scribner, K.I.M. Use of resistance surfaces for landscape genetic studies: Considerations for parameterization and analysis. Mol. Ecol. 2010, 19, 3576–3591. [Google Scholar] [CrossRef]
- Zhang, Y.; Song, W. Identify Ecological Corridors and Build Potential Ecological Networks in Response to Recent Land Cover Changes in Xinjiang, China. Sustainability 2020, 12, 8960. [Google Scholar] [CrossRef]
- Peng, J.; Li, H.; Liu, Y.; Hu, Y.; Yang, Y. Identification and optimization of ecological security pattern in Xiong’an New Area. Acta Geogr. Sin. 2018, 73, 701–710. [Google Scholar] [CrossRef]
- Wang, J.; Bai, Y.; Huang, Z.; Ashraf, A.; Ali, M.; Fang, Z.; Lu, X. Identifying ecological security patterns to prioritize conservation and restoration: A case study in Xishuangbanna tropical region, China. J. Clean. Prod. 2024, 444, 141222. [Google Scholar] [CrossRef]
- Mcrae, B.H.; Dickson, B.G.; Keitt, T.H.; Shah, V.B. Using circuit theory to model connectivity in ecology, evolution, and conservation. Ecology 2008, 89, 2712–2724. [Google Scholar] [CrossRef]
- McRae, B.H. Isolation by Resistance. Evolution 2006, 60, 1551–1561. [Google Scholar] [CrossRef]
- Peng, J.; Yang, Y.; Liu, Y.; Hu, Y.; Du, Y.; Meersmans, J.; Qiu, S. Linking ecosystem services and circuit theory to identify ecological security patterns. Sci. Total Environ. 2018, 644, 781–790. [Google Scholar] [CrossRef]
- Zhang, Y.; Yang, R.; Sun, M.; Lu, Y.; Zhang, L.; Yin, Y.; Li, X. Identification of spatial protection and restoration priorities for ecological security pattern in a rapidly urbanized region: A case study in the Chengdu–Chongqing economic Circle, China. J. Environ. Manag. 2024, 366, 121789. [Google Scholar] [CrossRef]
- Wu, W.; Zhao, S.; Guo, J.; Ou, M.; Ding, G. Construction and optimization of ecological security pattern based on the circuit theory: A case study of Hohhot City. Environ. Sci. Pollut. Res. 2023, 30, 89597–89615. [Google Scholar] [CrossRef]


| Land Use Type | ND Scenario (2032) | LR Scenario (2032) | ED Scenario (2032) |
|---|---|---|---|
| Cultivated land | 0.5 | 0.8 | 0.4 |
| Forest land | 0.7 | 0.5 | 0.3 |
| Grassland | 0.3 | 0.5 | 0.3 |
| Construction land | 0.8 | 0.7 | 1 |
| Unused land | 0.01 | 0.01 | 0.01 |
| Coal mining subsidence water area | 0.9 | 0.8 | 0.8 |
| River | 0.6 | 0.6 | 0.6 |
| Artificial lake | 0.4 | 0.4 | 0.3 |
| Pond | 0.3 | 0.3 | 0.2 |
| Reservoir | 1 | 1 | 1 |
| Resistance Factors | Resistance Values | Unit | Weights | ||||
|---|---|---|---|---|---|---|---|
| 1 | 25 | 50 | 75 | 100 | |||
| DEM | −0.5–16 21–42 | 42–83 | 16–21 83–135 | 135–200 | >200 | m | 0.056 |
| Slope | 0–3 | 3–7 | 7–13 | 13–22 | >22 | ° | 0.054 |
| Land use type | Water, forest land | Grassland | Cultivated land | Unused land | Construction land | / | 0.304 |
| Distance to river | 0–1000 | 1000–1500 | 1500–3000 | 3000–5000 | >5000 | m | 0.104 |
| Vegetation coverage | 0.8–1 | 0.6–0.8 | 0.4–0.6 | 0.2–0.4 | 0–0.2 | / | 0.099 |
| Distance to built-up area | >4000 | 3000–4000 | 2000–3000 | 1000–2000 | 0–1000 | m | 0.033 |
| Distance to main road | >4000 | 3000–4000 | 2000–3000 | 1000–2000 | 0–1000 | m | 0.033 |
| Subsidence depth | 0–200 >1500 | 200–500 | 500–1500 | mm | 0.213 | ||
| Distance to coal mining subsidence area | >7575 | 5160–7575 | 3077–5160 | 1231–3077 | 0–1231 | m | 0.104 |
| Cultivated Land | Forest Land | Grassland | Water | Construction Land | Unused Land | |||||||
|---|---|---|---|---|---|---|---|---|---|---|---|---|
| Area /km2 | Proportion /% | Area /km2 | Proportion /% | Area /km2 | Proportion /% | Area /km2 | Proportion /% | Area /km2 | Proportion /% | Area /km2 | Proportion /% | |
| 2022 | 524.30 | 46.13 | 181.56 | 15.98 | 20.54 | 1.81 | 97.04 | 8.54 | 293.37 | 25.81 | 19.72 | 1.73 |
| ND scenario (2032) | 489.59 | 43.09 | 194.95 | 17.15 | 21.30 | 1.87 | 100.97 | 8.88 | 309.16 | 27.20 | 20.56 | 1.81 |
| LR scenario (2032) | 505.66 | 44.49 | 194.21 | 17.09 | 21.40 | 1.88 | 87.27 | 7.68 | 308.82 | 27.17 | 19.17 | 1.69 |
| ED scenario (2032) | 479.14 | 42.16 | 193.77 | 17.06 | 21.07 | 1.85 | 99.96 | 8.79 | 322.46 | 28.37 | 20.13 | 1.77 |
| Landscape Type | 2022 | ND Scenario (2032) | LR Scenario (2032) | ED Scenario (2032) | ||||
|---|---|---|---|---|---|---|---|---|
| Area /km2 | Proportion /% | Area /km2 | Proportion /% | Area /km2 | Proportion /% | Area /km2 | Proportion /% | |
| Core | 171.53 | 69.28 | 191.87 | 72.22 | 187.99 | 72.63 | 134.77 | 51.4 |
| Islet | 9.75 | 3.94 | 6.83 | 2.57 | 6.43 | 2.48 | 6.53 | 2.49 |
| Perforation | 2.86 | 1.15 | 2.87 | 1.08 | 2.55 | 0.99 | 3.15 | 1.2 |
| Edge | 44.05 | 17.79 | 46.45 | 17.48 | 45.03 | 17.4 | 46.33 | 17.67 |
| Loop | 2.62 | 1.06 | 1.48 | 0.56 | 1.17 | 0.45 | 1.76 | 0.67 |
| Bridge | 5.77 | 2.33 | 4.17 | 1.57 | 4.01 | 1.55 | 57.7 | 22.01 |
| Branch | 11.01 | 4.45 | 12.01 | 4.52 | 11.66 | 4.5 | 11.96 | 4.56 |
| Total | 247.59 | 100 | 265.68 | 100 | 258.84 | 100 | 262.2 | 100 |
Disclaimer/Publisher’s Note: The statements, opinions and data contained in all publications are solely those of the individual author(s) and contributor(s) and not of MDPI and/or the editor(s). MDPI and/or the editor(s) disclaim responsibility for any injury to people or property resulting from any ideas, methods, instructions or products referred to in the content. |
© 2025 by the authors. Licensee MDPI, Basel, Switzerland. This article is an open access article distributed under the terms and conditions of the Creative Commons Attribution (CC BY) license (https://creativecommons.org/licenses/by/4.0/).
Share and Cite
Zhou, S.; Zhang, Z.; Luo, P.; Hou, Q.; Sun, X. Constructing Ecological Security Patterns in Coal Mining Subsidence Areas with High Groundwater Levels Based on Scenario Simulation. Land 2025, 14, 1539. https://doi.org/10.3390/land14081539
Zhou S, Zhang Z, Luo P, Hou Q, Sun X. Constructing Ecological Security Patterns in Coal Mining Subsidence Areas with High Groundwater Levels Based on Scenario Simulation. Land. 2025; 14(8):1539. https://doi.org/10.3390/land14081539
Chicago/Turabian StyleZhou, Shiyuan, Zishuo Zhang, Pingjia Luo, Qinghe Hou, and Xiaoqi Sun. 2025. "Constructing Ecological Security Patterns in Coal Mining Subsidence Areas with High Groundwater Levels Based on Scenario Simulation" Land 14, no. 8: 1539. https://doi.org/10.3390/land14081539
APA StyleZhou, S., Zhang, Z., Luo, P., Hou, Q., & Sun, X. (2025). Constructing Ecological Security Patterns in Coal Mining Subsidence Areas with High Groundwater Levels Based on Scenario Simulation. Land, 14(8), 1539. https://doi.org/10.3390/land14081539