Article

Green Public Procurement and Its Influence on Urban Carbon Emission Intensity: Spatial Spillovers Across 285 Prefectural Cities in China

School of Public Policy and Management, China University of Mining and Technology, Xuzhou 221116, China
*
Author to whom correspondence should be addressed.
Land 2025, 14(8), 1545; https://doi.org/10.3390/land14081545
Submission received: 13 June 2025 / Revised: 18 July 2025 / Accepted: 25 July 2025 / Published: 27 July 2025

Abstract

Green public procurement (GPP) is a pivotal policy instrument for advancing urban low-carbon transitions. Using panel data from 285 Chinese cities (2015–2023), this study employs a panel fixed-effects model, mediation analysis, and spatial Durbin model to assess the impact, influencing mechanisms, and spatial spillover effects of GPP on urban carbon emissions intensity. The key findings reveal the following: (1) a 1% increase in GPP implementation is associated with a 1.360% reduction in local urban carbon emissions intensity. (2) GPP reduces urban carbon emissions intensity through urban green innovation, corporate sustainability performance, and public ecological awareness. (3) GPP exhibits significant cross-boundary spillovers, where a 1% reduction in local carbon emissions intensity induced by GPP leads to a 14.510% decline in that in neighboring cities. These results provide robust empirical evidence for integrating GPP into the urban climate governance framework. Furthermore, our findings offer practical insights for optimizing the implementation of GPP policies and strengthen regional cooperation in carbon reduction.

1. Introduction

Recent decades have witnessed accelerating global climate change, with atmospheric CO2 concentrations reaching a record high of 422.5 ppm in 2024 [1]. Urban areas have emerged as the primary drivers of greenhouse gas (GHG) emissions, and account for approximately 75% of global fossil fuel-related CO2 emissions [2]; this trend is expected to intensify with ongoing urbanization. From 1978 to 2023, China’s urban population surged from 17% to 67% (National Bureau of Statistics of China, 2024), consequently driving profound transformations in economic growth, industrial structures, and consumption, all of which have contributed to surging carbon emissions. Consequently, China remained the world’s largest carbon emitter in 2023, ultimately generating 12.6 billion tons of CO2 (34% of global emissions) (IEA 2024) [2]. The interplay between urbanization and carbon emissions underscores the urgency of urban carbon mitigation governance, particularly in developing economies.
To address the climate challenge, China has strategically implemented green public procurement (GPP) as a key policy instrument that supports its UNGA (2020) commitment to achieve carbon peaking and neutrality by 2030 and 2060, respectively. As a demand-side instrument, GPP leverages the government’s market power to systematically reorient supply chains (SCs) toward low-carbon alternatives through market mechanisms. According to China’s Ministry of Finance (2024), annual expenditure on energy- and water-saving products has reached USD 5.1 billion, which represents 83.9% of the total procurement in these categories [3]. The design of GPP combines demand guarantees with price signals to embed decarbonization incentives in value chains, thus creating an integrated climate governance framework that aligns public procurement power with market-based incentives.
Despite the growing recognition of the potential of GPP, its impact on reducing urban carbon emissions intensity remains underexplored. The current literature on carbon emissions is divided into two streams: (1) studies on socioeconomic determinants (e.g., economic development [4,5] and industrial structure [6,7]), digital finance [8], green innovation [7], and urbanization [9,10,11], with emerging attention to spatial spillovers [9]), and (2) analyses of formal regulatory mechanisms (e.g., emission standards, carbon pricing, and cap-and-trade systems). The latter has sparked vigorous debate: Sinn (2008) argues that due to design flaws, implementation issues, or corporate evasion, regulatory policies may fail to meet emissions reduction targets [12], while Nordhaus (2015) counters with the institutional solution of “climate clubs” to address collective action dilemmas [13]. Recent empirical studies have enriched the discourse. Yan et al. (2023) demonstrate the synergistic effects between digital finance and environmental regulations in reducing industrial carbon intensity [14], and Tariq and Hassan (2023) identify an inverted U-shaped relationship in which regulatory policies initially increase but ultimately decrease emissions intensity [15]. However, these studies overwhelmingly focus on formal regulatory tools and ignore the roles of market-driven tools, such as GPP.
Emerging micro-level studies have provided clues for revealing the relationship between GPP and carbon emissions. Yang et al. (2023) demonstrates the dual-channel influence of GPP on residents’ green consumption behavior through direct regulatory mechanisms (price and information regulation) and indirect peer effects [16]. Liu et al. (2024) highlight its risk-mitigation effects on corporate green innovation [17], and Liu et al. (2025) reveal its capacity to alleviate financing constraints and enhance environmental, social, and governance (ESG) performance [18]. However, despite progress at the micro level, there remains a lack of macro-level research, especially city-level panel studies, on the overall impact of GPP on urban carbon intensity, its underlying mechanisms, and spatial spillovers. This imbalance limits comprehensive policy assessments and obstructs the design of coherent decarbonization frameworks [17]. Addressing this gap through systematic city-level analyses would yield critical macro-level insights, empirically validate the policy relevance of GPP, and complement the predominantly regulatory approaches in previous research.
To bridge the research gap, this study regards GPP as a demand-side environmental policy instrument that exerts multi-scalar impacts on urban carbon emissions intensity. Using panel data from 285 Chinese prefectural cities (2015–2023), we employ an integrated methodological framework that combines panel fixed-effects regression, mediation analysis, and the spatial Durbin model to systematically examine the impact of GPP on urban carbon emissions intensity. Our findings reveal three distinct mechanisms: (1) direct effects through demand-pull market expansion and regulatory-driven optimization of industrial structures and production technologies; (2) indirect effects via policy demonstration that stimulates urban green innovation, enhances corporate sustainability performance, and strengthens public environmental awareness; and (3) spatial spillover effects via inter-regional policy diffusion, knowledge dissemination, and technology transfer that collectively foster carbon reduction networks. These results demonstrate the systemic decarbonization potential of GPP through integrated direct, indirect, and spatial channels.
The contribution of this study is fourfold. First, our work substantially extends the analytical framework in carbon reduction from conventional regulatory approaches to market-based mechanisms, with a focus on GPP. The distinctive features of GPP—such as voluntary participation, market incentives, and social demonstration effects—complement conventional regulatory methods, thereby offering a more integrated view of environmental policy systems and their operational dynamics. Second, this study adopts a socio-technical systems perspective to explore how GPP influences urban carbon intensity through both technological and social pathways. Addressing the fragmented and micro-level focus of current studies offers a more integrated framework for understanding the broader impact of the policy. Third, this study identifies and verifies the spatial spillover effects of GPP using spatial Durbin models, thus providing robust empirical evidence for cross-regional collaborative governance strategies in carbon reduction. Fourth, to the best of our knowledge, our study is the first to integrate micro-level GPP contract data with city-level datasets. By matching 167,062 GPP contract records with urban data from 285 Chinese cities, we construct a comprehensive research database that will serve as a valuable resource for future empirical studies in this field.
The remainder of this paper is organized as follows: Section 2 introduces the background. Section 3 develops the theoretical framework and proposes the research hypotheses. Section 4 describes the variables, data sources, and methodology. Section 5 presents the results. Finally, Section 6 presents conclusions, put forward policy implications and prospects for future research.

2. Background

GPP serves as a strategic policy instrument that integrates environmental sustainability criteria into public procurement processes. By prioritizing products and services with internationally recognized eco-certification standards, GPP advances sustainable development goals through market-driven mechanisms [17]. This approach is based on two complementary theoretical frameworks. First, Caldwell (1985) conceptualizes environmental issues as global public goods, and emphasizes the necessity of public participation and social innovation to achieve sustainability [19]. Building on this perspective, Hajer (1995) proposed the ecological modernization theory, positing GPP as a legitimized governance mechanism that integrates technological, market, and institutional coordination to enhance environmental policy effectiveness [20]. Together, these theories present two roles of GPP in that it embodies the collective value of environmental governance while exemplifying the advance of policy instruments in addressing sustainability challenges.
The theoretical foundations have translated into concrete institutional reforms globally. Since the United Nations Sustainable Development Summit introduced the concept of sustainable public procurement in 2002, developed countries have progressively established operational frameworks for GPP implementation. For example, since the enactment of the Resource Conservation and Recovery Act in 1976, the United States has systematically enhanced its GPP system [21]. Japan institutionalized its approach in 2000 with the Green Procurement Law, which requires government agencies and public organizations to formulate green purchasing plans and report on the implementation progress [22]. Meanwhile, the European Union has integrated a life-cycle costing (LCC) mechanism into public procurement regulations through amendments to Directive 2014/24/EU, explicitly incorporating carbon emissions performance as an evaluation criterion [23]. In Australia, each state and territory’s local councils have their own unique green procurement policies, which are crucial for advancing the circular economy through the purchase of waste-derived products and play a significant role in environmental sustainability management and green procurement [24,25]. In South American countries such as Peru, public procurement accounts for 11.7% of GDP, and the two main categories of publicly procured products are offset paper and medium-density particleboard (MDP) furniture [26,27]. Although South Africa currently has no specific legislation on green public procurement; however, existing regulations allow procuring entities to incorporate environmental considerations into their procurement practices [28]. These cross-national experiences demonstrate that GPP has evolved from basic green procurement toward an integrated framework embedding environmental economics, climate mitigation, and multilevel governance.
Although institutional advancements in GPP are evident, its actual effectiveness depends on the balance between strict regulations and flexible implementation strategies. Appolloni (2012) demonstrated this balance in the Italian context, where mandatory requirements were effectively combined with digital procurement platforms, financial incentives, and public-private research partnerships to advance low-carbon technologies [29]. However, persistent challenges have revealed gaps. Zhu et al. (2013) find that while regulatory pressure and stakeholder demands promote compliance, insufficient environmental expertise among officials often undermines policy outcomes [30]. Similarly, Dou et al. (2014) further identify “institutional suspension” in municipal GPP programs, where implementation gaps emerge from misaligned policy structures and operational practices [31]. Collectively, these findings illustrate that the effectiveness of GPP hinges not only on well-designed regulatory frameworks but also on coherent institutional environments and adaptable implementation strategies.
China’s rapid adoption of GPP reflects both global trends and local governments’ innovation. Although initiated later than in developed countries, China has rapidly established comprehensive institutional frameworks. The 2003 Public Procurement Law first linked public procurement to ecological protection objectives, thus establishing the foundation for sustainable purchasing practices. Subsequently, legislation such as the 2007 Mandatory Procurement System for Energy-Saving Products and the 2015 launch of the Chinese Government Procurement Website (http://www.ccgp.gov.cn) significantly enhanced transparency and enforcement through digital platforms and mandatory purchasing lists. A pivotal shift occurred in 2024, when China integrated carbon footprint management into procurement requirements, consequently aligning with international best practices such as the EU’s LCC approach. This policy evolution has strengthened environmental governance, with the Ministry of Finance (2024) reporting that GPP now dominates 83.9% of the relevant product categories [3], ultimately showcasing its effectiveness in environmental transformation and carbon emissions reduction.
Figure 1 shows significant spatial heterogeneity in China’s annual GPP expenditure between 2015 and 2023. The dark-green eastern coastal areas indicate above-average GPP expenditure levels, while light-green central regions reflect moderate spending level. Large white western areas primarily result from data limitations, though weaker policy implementation may also contribute to lower observed values.
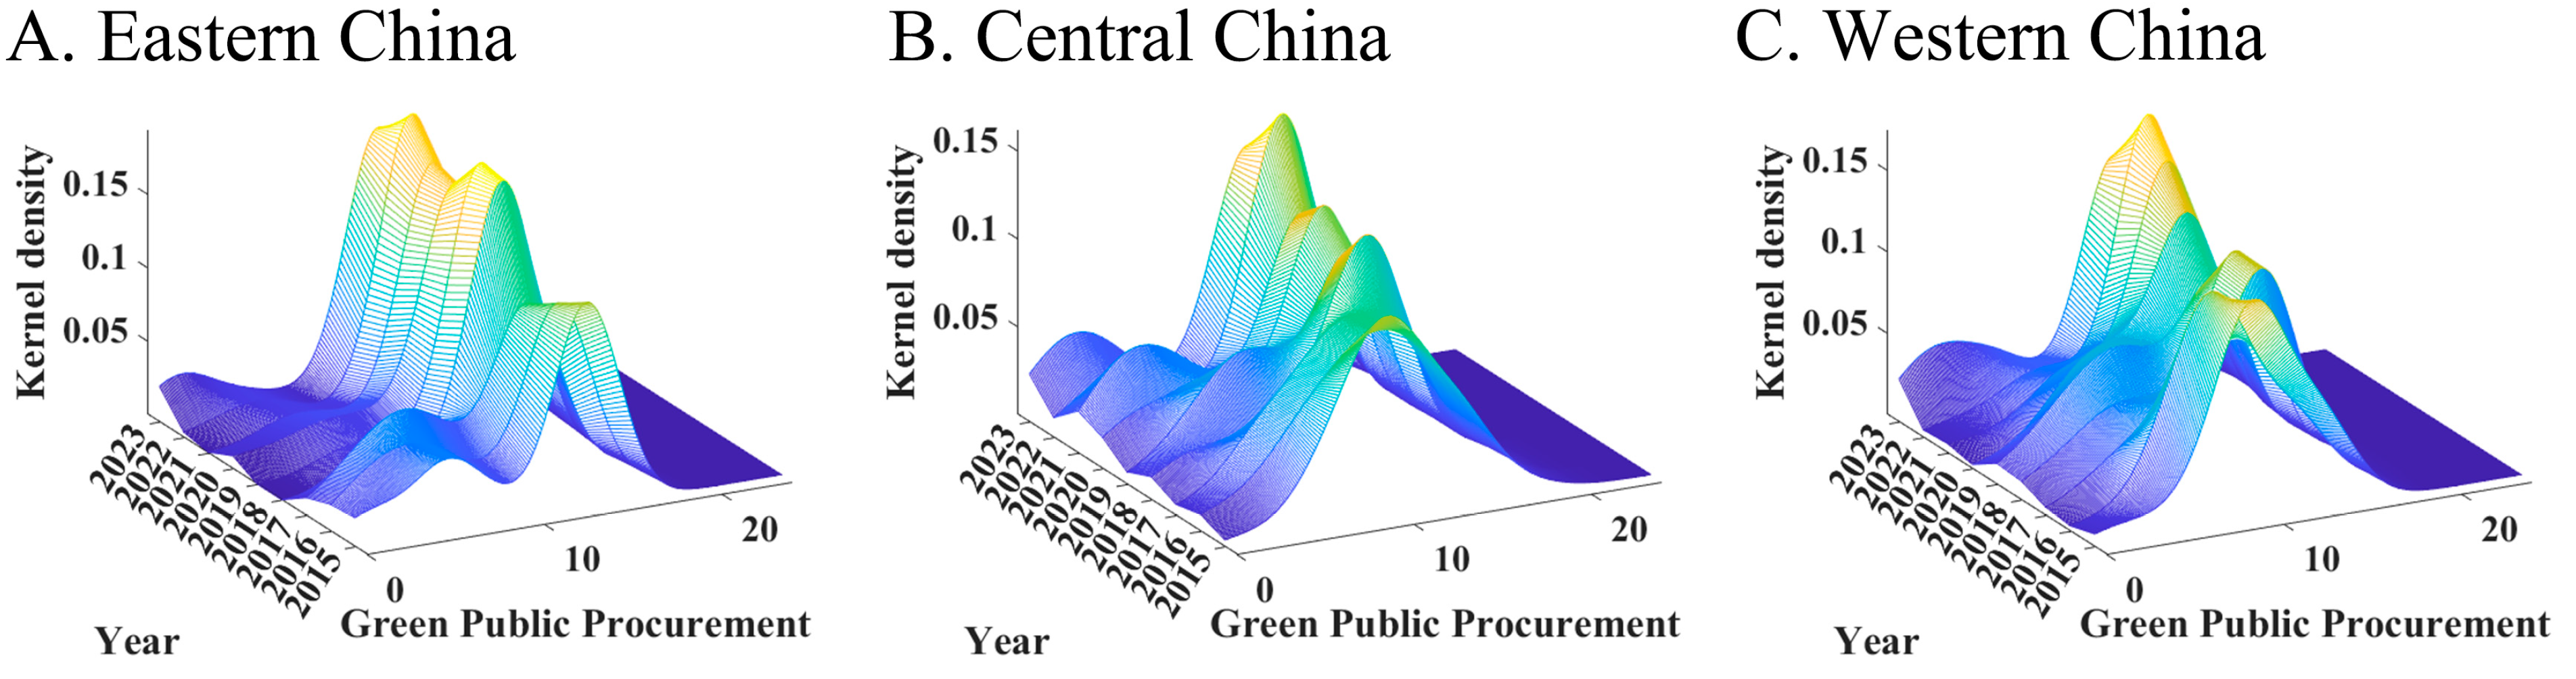
These distribution patterns are further supported by the kernel density estimation in Figure 2: First, the eastern region exhibits a high and steep kernel density curve, which suggests that provinces in eastern China generally have higher levels of GPP expenditure, reflecting their relatively advanced enterprise activity. The rightward shift of the curve over time further indicates rapid growth in GPP expenditure in eastern China. Second, the central region demonstrates a smoother distribution with a broader peak. Since 2019, the peak of GPP expenditures has gradually shifted toward higher values, indicating a continuous increase in GPP expenditures at the provincial level. However, overall performance of the central region remains inferior to that of the eastern region. Third, the western region displays a relatively flat distribution, with most observations concentrated in lower value ranges, thereby reflecting relative lower GPP expenditures compared to the other regions.

3. Theoretical Framework

3.1. Impacts of Green Public Procurement on Urban Carbon Emissions Intensity

First, GPP generates market demand for eco-friendly goods and services [32], which stimulates increased production while concurrently leading to a reduction in urban carbon emissions intensity in the short term. Furthermore, the effective implementation of GPP policy sends clear low-carbon signals to the market, ultimately guiding businesses to allocate more resources toward green technology development. Consequently, this fosters a shift toward lower carbon production throughout the market in the long term [33].
Second, GPP directly reduces urban carbon emissions intensity through economic incentives and regulatory constraints [34]. On the one hand, GPP offers stable market orders and income sources for enterprises that meet environmental standards, thereby enhancing their motivation toward clean production. Conversely, GPP is typically accompanied by strict environmental standards that require enterprises to adopt cleaner production processes, thereby reducing carbon emissions directly. Accordingly, this study proposes the first hypothesis:
Hypothesis 1 (H1).
Green public procurement helps to curb urban carbon emissions intensity.

3.2. Mechanisms of the Effect of Green Public Procurement on Urban Carbon Emission Intensity

3.2.1. Mediating Analysis of Urban Green Innovation

Theoretically, GPP initiatives effectively expand market demand for low-carbon products and services, significantly alleviating the market risks associated with green innovation [35], and thereby promoting a greater willingness to invest in the development of green technologies [36]. From a long-term perspective, GPP delivers stable low-carbon policy signals to the market, enhances expectations regarding the long-term returns on green innovation, and encourages enterprises to invest in alignment with urban green innovation initiatives [37]. From an industry chain perspective, GPP collaboration between upstream and downstream enterprises, consequently leading to significant technological spillovers. This facilitates low-carbon technology advancements and systemic transformations across the industry chain. Driven by GPP and market responses, the innovation ecosystem ensures ongoing technical support and institutional backing for urban low-carbon development [38]. Accordingly, this study proposes the second hypothesis:
Hypothesis 2 (H2).
Green public procurement inhibits urban carbon emissions intensity through urban green innovation.

3.2.2. Mediating Analysis of Corporate Sustainability Performance

Corporate sustainability performance refers to an enterprise’s effectiveness in balancing ESG objectives to achieve long-term value growth [39]. GPP may enhance corporate sustainability performance through three mechanisms: First, GPP sets standards that obligate enterprises to adopt eco-friendly technologies. The second mechanism involves mimetic processes, in which firms engage in more internal than external corporate social responsibility actions. We believe that a wider gap between external and internal actions is negatively associated with market value [40]. The third mechanism operates through normative pressures, wherein GPP encourages industry associations and certification bodies—like ISO 14001—to develop ESG evaluation frameworks that support enterprises in refining their governance structures [41]. Furthermore, from a resource-based perspective, improved corporate sustainability performance enhances carbon emissions intensity reduction. Regarding environmental performance, GPP motivates investments in clean technologies, thus leading to lower energy consumption per output unit [42]. For social performance, corporate sustainability performance enhances social responsibility through rigorous labor standards and ethical supply chain management [43], with co-benefits in reducing carbon-intensive production practices. Regarding governance performance, GPP promotes ESG disclosure, thereby driving enterprises to form sustainability committees and enhance environmental decision-making efficacy. Accordingly, this study proposes the third hypothesis:
Hypothesis 3 (H3).
Green public procurement inhibits the development of urban carbon emissions intensity through corporate sustainability performance.

3.2.3. Mediating Analysis of Public Ecological Awareness

According to the normative activation theory, policies can enhance public awareness of social responsibility through “normative activation,” thus influencing individuals’ consumption behavior and social participation [44]. GPP serves as a policy signal that boosts public ecological awareness through its authoritative demonstration effect, ultimately leading individuals to favor eco-friendly products. Moreover, Heightened ecological awareness generates market pressure, driving firms—especially in pollutive industries—to boost green technology investments [45]. Lastly, this collaborative governance model of “policy guidance—public participation—market response” effectively lowers urban carbon emissions intensity by leveraging the mediating role of enhanced public ecological awareness. Accordingly, this study proposes the fourth hypothesis:
Hypothesis 4 (H4).
Green public procurement inhibits the development of urban carbon emissions intensity through improving public ecological awareness.

3.2.4. Spillover Effects of Green Public Procurement on Urban Carbon Emissions Intensity

The effects of GPP on urban carbon emissions intensity extend beyond local regions, ultimately reshaping regional green development patterns through factor mobility and institutional diffusion. Specifically, the increased demand for green products and services from governments encourages enterprises to invest more in the R&D of green technologies, thereby promoting ecological innovation in products and processes [33]. Moreover, the technological improvement generated by GPP function as regional public goods. By leveraging spatial externalities, they lower the marginal abatement costs for low-carbon transitions in neighboring cities, thus enabling coordinated regional decarbonization at scale [46]. From an industrial ecosystem perspective, it reconstructs value chains by developing green industry clusters in core cities while promoting carbon leakage mitigation across supply chains. Ultimately, this creates an integrated “institution—industry—technology—market” mechanism that systematically lowers regional carbon emissions intensity. Accordingly, the fifth hypothesis is proposed:
Hypothesis 5 (H5).
Green public procurement generates negative spatial spillover effects on urban carbon emissions intensity in neighboring cities.
Figure 3 presents the theoretical framework that systematically examines how GPP influences urban carbon emissions intensity through the above three interconnected mechanisms.

4. Materials and Methods

4.1. Model Specification

4.1.1. Panel Fixed-Effects Model

To assess the effect of GPP on urban carbon emissions intensity, we constructed a panel fixed-effects model. The model controls for both individual and time-fixed effects, thus addressing the potential endogeneity arising from unobserved heterogeneity across these dimensions. Logarithmic transformations were applied to the continuous variables to mitigate heteroskedasticity and multicollinearity concerns.
  C E I it = α 0 + α 1 LnGPP it + α n Control it + μ it
where C E I i t denotes the carbon emissions intensity of city i in period t; Ln G P P i t represents the GPP of city i in period t; C o n t r o l i t refers to a vector of control variables, including economic development, industrial structure, urbanization rate, total retail sales, government intervention; α 1 captures the marginal effect of GPP on urban carbon emissions intensity; μ i t is the idiosyncratic error term. A statistically significant α 1 < 0 would indicate that higher GPP correlates with lower urban carbon emissions intensity, thereby supporting H1.

4.1.2. Mediating Effect Model

To examine the mechanism through which GPP affects urban carbon emissions intensity, we employ the following mediation models:
C E I it =   α 0 + α 1 LnGPP it +   α n Control it   +   μ it Mediator it = β 0 + β 1 LnGPP it + β n C o n t r o l it +   ε it CEI it =   γ 0 + γ 1 LnGPP it +   γ 2 Mediator it +   γ n Control it   +   μ it
where C E I i t denotes the carbon emissions intensity of city i in year t; Ln G P P i t reflects GPP with subscript i and t for cities and years, respectively; the vector M e d i a t o r i t comprises mediating variables, including urban green innovation, corporate sustainability performance, and public ecological awareness; C o n t r o l i t consists of various control variables which are consistent with Equation (1); the coefficient γ 1 captures the direct effect of GPP on urban carbon emission intensity, which accounts for the mediating mechanisms variables; μ i t represents the random disturbance term. If β 1 and the coefficients of the mediators γ 2 are statistically significant while | α 1 | > | γ 1 |, it suggests a partial mediation effect; if γ 1 becomes insignificant after controlling mediators while the mediator coefficient γ 2 remains significant, this implies a complete mediation effect.

4.1.3. Spatial Durbin Model

To validate H3, this study employs a spatial Durbin model (SDM) to examine the spatial spillover effects of GPP on urban carbon emissions intensity, as specified below:
C E I i t = ρ W   C E I i t + β 1   G P P i t + β 2 W   G P P i t + β 3   Control it + β 4 W C o n t r o l it + α i + V t + ε i t
where C E I i t represents the dependent variable and G P P i t is the core independent variable. C o n t r o l i t encompasses all control variables, with subscript i and t for prefectural city and year, respectively. W is the spatial weight matrix; ρ signifies the spatial autoregressive coefficient, which captures the inherent spatial dependence in the sample; β 1 β 4 measure the direct and indirect effects of the independent and control variables; α i accounts for regional fixed effects; V t captures time fixed effects, and i t is a random error term.

4.1.4. Spatial Autocorrelation Model

The global spatial autocorrelation of urban carbon emissions intensity is analyzed using the Moran’s I index, which is calculated as follows:
I   =   i = 1 n j = 1 n w i j x i x ¯ ( x j x ¯ ) S 2 i = 1 n j = 1 n w i j
where S 2 =   i = 1 n x i x ¯ 2 n represents the sample variance, while w i j denotes the spatial weight matrix, which reflects spatial dependence between observational units i and j. i = 1 n j = 1 n w i j corresponds to the aggregation of all spatial weights. The Moran’s I statistic ranges from −1 to 1: values significantly greater than zero indicate positive spatial autocorrelation, values significantly less than zero indicate negative spatial autocorrelation, and values close to zero indicate no significant spatial autocorrelation (consistent with a random spatial distribution pattern).

4.2. Variable Selection

4.2.1. Dependent Variable

Carbon emissions intensity, which is calculated as CO2 emissions per unit of GDP, is selected as the carbon emissions indicator. It represents a fundamental metric that neutralizes economic scale effects while accurately reflecting achievements in industrial restructuring and energy efficiency gains [47]. By quantifying carbon emissions per unit of economic output, this intensity metric offers distinct analytical advantages—isolating genuine structural and technological improvements from mere scale effects of economic expansion.
The calculation methodology involves dividing a city’s annual CO2 emissions by its GDP (measured in tons per CNY 10,000), with adjustments made using real GDP deflators and consistent emissions data derived from the Intergovernmental Panel on Climate Change methodologies. This indicator selection reflects the evolving paradigm in climate economics from aggregate emissions control to efficiency-oriented approaches, while aligning with the strategic goals of China’s dual-carbon strategy.
Figure 4 presents the spatial distribution of urban carbon emission intensity across Chinese cities for 2015–2023, along with annual rankings of the 50 cities with the lowest carbon emission intensity. Spatial divergence and clustering patterns reveal a relative lower carbon emissions intensity in eastern and southern regions compared to their western and northern counterparts. Eastern coastal cities consistently maintain carbon emissions intensity levels below 2.9 tons of CO2 per CNY 10,000 GDP, thereby forming a contiguous low-carbon intensity zone. Conversely, energy-intensive cities in central and western regions exhibit carbon emissions intensity exceeding 5.8 tons, primarily due to coal dependence. Post-2019, several cities demonstrate marked carbon emissions intensity reductions through investments in renewable energy. The analysis of urban agglomeration coordination reveals significant convergence in carbon emissions intensity disparities within major metropolitan regions, particularly the Chengdu–Chongqing (Chengyu) and Beijing–Tianjin–Hebei (Jingjinji) clusters, thus suggesting effective regional policy coordination in driving balanced emissions reductions. Longitudinal analysis (2015–2023) indicates a substantial contraction of high-carbon emissions intensity regions, with notable transitions in Hebei and Shanxi provinces from high- to low-intensity categories. The expansion of cities that achieved the lowest carbon emissions intensity status, including Jixi and Ganzhou, collectively demonstrates the measurable progress in China’s urban emissions reduction initiatives.

4.2.2. Core Independent Variable

Our core independent variable is Green Public Procurement (GPP). This study collected original public procurement contract data from the Chinese Government Procurement Website (http://www.ccgp.gov.cn), which is the official platform administered by the Chinese Ministry of Finance, spanning the period from 2015 to 2023. Using R programming, we constructed a comprehensive public procurement contract dataset (Ç) for analysis. Each contract record (ç ∈ Ç) contains detailed fields including “contract name,” “main items name,” and “specifications or service requirements,” which are collectively denoted as Text(ç). Building upon the official “Government Procurement List of Energy-Saving Products (2019)” and “Government Procurement List of Environmental Labeling Products (2019),” we developed an extensive keyword database for green products. Through the Jieba word segmentation tool in Python 3.8, we processed product names and conducted manual vocabulary refinement, ultimately establishing a repository (Κ) containing over 1100 verified green product names. Subsequently, we implemented multi-criteria matching procedures using Excel VBA tools and successfully identified 167,062 public procurement contracts for green products ( Ç g r e e n ):
Ç g r e e n   =   ç Ç κ K , κ T e x t ç
where Çgreen denotes the subset of successfully matched GPP contracts, while κ ⊆ Text(ç) indicates that the extracted keywords (κ) are substrings embedded within the contractual text Text(ç).
Through precise matching of the purchaser identity, address, and regional information contained within the GPP contracts ( Ç g r e e n ), we establish exact correspondence with China’s 333 prefecture-level administrative units (comprising 293 prefecture-level cities, 7 administrative regions, 30 autonomous prefectures, and 3 leagues). The GPP for city i in year t is computed as follows:
G P P i t = ç Ç g r e e n i , t A m o u n t ç
where Ç g r e e n i , t denotes the subset of GPP contracts for city i in year t; A m o u n t ç represents the monetary value of contract (ç).
To address heteroscedasticity and linearize the relationship, the natural logarithm is applied to G P P i t :
Ln G P P i t = Ln G P P i t + 1

4.2.3. Mediating Variables

(1) Urban Green Innovation
Urban green innovation refers to the development and implementation of novel technologies, processes, and management methods by nations, regions, or enterprises during production and operations, and is aimed at mitigating environmental impacts, enhancing resource efficiency, and fostering sustainable development. To quantify urban green innovation levels, we adopt the natural logarithm of annual green patent grants as the core measurement indicator. Unlike patent applications, granted patents undergo rigorous examination and demonstrate higher technological maturity, thus providing a more precise reflection of the actual urban green innovation output and innovation intensity.
(2) Public Ecological Awareness
Public ecological awareness reflects society’s awareness, attitudes, and emotions toward environmental challenges. This indicates the sensitivity, concern level, and willingness to engage in environmental topics at a specific time. The Baidu Index is the most authoritative tool for analyzing public attention in China. By quantifying keyword search volumes and media coverage, the index tracks trends in public concerns regarding particular issues. This study uses data from the Baidu Index platform (https://index.baidu.com) focusing on keywords “haze” and “environmental pollution.” The Baidu Index platform gathered search index data from 2015 to 2023 across various cities in China (including both PC and mobile). By aggregating annual keyword indices for each city and applying a natural logarithm transformation, we developed an indicator of public ecological awareness.
(3) Corporate Sustainability Performance
Corporate sustainability performance is a multidimensional construct that includes environmental stewardship (E), social responsibility (S), and governance quality (G), collectively referred to as ESG. This framework evaluates organizational capabilities in achieving sustainable development through green innovation, efficient resource utilization, and long-term value creation with stakeholders. ESG ratings serve as vital metrics for corporate sustainability performance assessment. We analyze corporate sustainability performance at the urban level by aggregating micro-level ESG scores of firms using the mean method. By averaging data from all enterprises in a city, we create a “City-Year” corporate sustainability performance index that captures the overall sustainability performance of regional corporate groups while minimizing individual firm variations; the formula is as follows:
C S P i t   =   1 N i t j = 1 N i t E S G i j t
where C S P i t represents the average sustainability performance of enterprises located in city i during year t and N i t indicates the number of listed enterprises in city i for the same year. Furthermore, E S G i j t denotes the ESG score of enterprise j, which is situated in city i during year t. If the data for a specific city and year are missing, the environmental compliance rate of large-scale industrial enterprises is used for linear interpolation to maintain panel data completeness.

4.2.4. Control Variables

To mitigate potential omitted variable bias and account for confounding factors affecting urban carbon emissions intensity, we incorporate city-level control variables following Yin et al. (2025) [48] and Zhu and Lin (2025) [49], which include: (1) Economic development: Measured as the natural logarithm of per capita GDP (in 10,000 CNY/person). (2) Industrial structure: Represented by the proportion of secondary industry value-added to GDP (%). (3) Urban population: Measured as the natural logarithm of the urban permanent resident population (10,000 persons). (4) Total retail sales: Calculated as the ratio of consumer goods retail sales to GDP (%). (5) Government intervention: Captured by the ratio of local government general budget expenditure to GDP (%). (6) Energy structure: the ratio of coal consumption to total energy consumption (%). These control variables isolate the relationship between GPP and urban carbon emissions intensity, thereby enhancing the robustness of our empirical findings.

4.2.5. Spatial Weight Matrix

To investigate the spatial spillover effects of urban carbon emissions intensity, we construct a spatial weight matrix for spatial econometric analysis. The matrix specification adheres to Tobler’s First Law of Geography, which establishes that spatial dependence decreases with increasing distance between geographical units.
Let W i j denote the geographical distance between regions i and j. The n × n spatial weight matrix W is formally defined with the following properties:
W = W 11 W 1 n W n 1 W n n W i j   =   0   i   =   j
A city’s GPP policies may influence the carbon emissions intensity of neighboring cities through industrial relocation and technology diffusion mechanisms [50]. The geographic distance matrix effectively captures spatial proximity relationships by measuring the physical distances between cities. This proximity significantly affects policy implementation outcomes because adjacent cities are more likely to experience spatial spillover effects.
Drawing on the methodological framework, we adopt an inter-city geographic distance matrix with the following formal specification [51]:
W = 1 d i j , i j 0 , i = j

4.3. Data Source

To ensure data availability and continuity, we employ panel data covering 285 Chinese cities from 2015 to 2023 for the empirical analysis. Owing to data constraints, the sample excludes Hong Kong Special Administrative Region (SAR), Macao SAR, Taiwan region, and other cities in Tibet. The selection of these 285 cities is determined by the consistent availability of both urban carbon emissions intensity data and city-level GPP data across all locations. The year 2015 serves as the starting point because the Ministry of Finance of China issued a notice that year on enhancing transparency in public procurement information, thus addressing issues such as incomplete or delayed disclosures on certain regional procurement platforms. This policy shift has led to more systematic and comprehensive public procurement data being reported since then.
This study draws on multiple data sources: (1) comprehensive financial databases (CSMAR and Wind); (2) statistical yearbooks (China City Statistical Yearbook and provincial statistical yearbooks); (3) green public procurement records from the official China Government Procurement portal (http://www.ccgp.gov.cn); (4) green patent data obtained from the China Research Data Service Platform (CNRDS); (5) public ecological awareness indicator constructed using city-level annual search volume data for “haze” and “environmental pollution” sourced from Baidu Index (https://index.baidu.com); (6) corporate sustainability performance from Huazheng ESG ratings; and (7) city-level energy structure is proxied by provincial-level energy structure from the China Energy Statistical Yearbook. To maintain data integrity, we implemented linear interpolation for marginal missing observations. Economic indicators were standardized to 2015 constant values. We applied logarithmic transformations to absolute-value variables to normalize distributions and performed 1% Winsorization on continuous variables to minimize outlier effects. The key characteristics of the dataset are summarized in Table 1.

5. Results

5.1. Panel Fixed-Effects Analysis

This study ensures reliable model specifications through systematic econometric testing1. The regression results from a two-way fixed-effects model that effectively captures unobserved heterogeneity and temporal trends by including individual and time-fixed effects are reported in Table 2. All regression analyses used clustered robust standard errors to validate statistical inferences.
The panel fixed-effects regression results presented in Table 2 consistently demonstrate a negative and statistically significant coefficient for GPP across all model specifications, which indicates that GPP policies significantly reduce urban carbon emissions intensity. Columns (1) to (6) in Table 2 indicate that the absolute magnitude of the GPP coefficient gradually diminishes with the sequential inclusion of additional control variables. This pattern suggests that factors such as economic development and industrial structure partially account for the observed urban carbon emissions intensity reduction effects. Notably, the coefficient remains statistically significant at the 1% level throughout all specifications, which confirms the robust independent explanatory power of GPP. In the fully controlled Column (7), the estimated coefficient for GPP is −1.548, which implies that a 1% increase in GPP expenditures is associated with a 1.548% reduction in urban carbon emissions intensity, ceteris paribus. This finding provides robust evidence supporting H1 such that GPP serves as an effective policy instrument for reducing urban carbon emissions intensity through demand-side market incentives.
Regarding the control variables, both economic development and industrial structure exhibit statistically significant negative correlations with urban carbon emissions intensity, which provides empirical support for the Environmental Kuznets Curve hypothesis in the context of urbanization [52]. This finding suggests that with the expansion of aggregate economic output and advancement of technological capabilities, carbon emissions per unit of GDP decline. Specifically, economic growth and technological progress facilitate a structural shift from energy-intensive industries toward a more service-oriented economy [53,54], thereby substantially reducing urban carbon emissions intensity. However, government intervention demonstrates an unexpected positive effect (β = 3.420, p < 0.01), which implies that excessive administrative involvement may inadvertently increase the aforementioned intensity through multiple mechanisms. First, rapid government-driven urbanization and industrialization can lead to rigid energy consumption patterns [55], thereby elevating urban carbon emissions. Second, excessive regulatory interference may distort market mechanisms, suppress technological innovation, and weaken environmental enforcement [56], thereby blurring the decoupling relationship between urban economic growth and urban carbon emissions intensity. These findings highlight the critical importance of maintaining equilibrium between governmental and market forces.

5.2. Mediating Effects Analysis

5.2.1. Empirical Test of the Mediating Effect of Urban Green Innovation

The regression results on the mediating effect of urban green innovation are reported in Table 3. Column (1) indicates a significant negative impact of GPP on urban carbon emissions intensity, and the coefficient suggests that a 1% increase in GPP expenditures is associated with a 1.548% reduction in the latter. In Column (3), the inclusion of urban green innovation lowers the coefficient for GPP to −1.400, which remains statistically significant at the 1% level. This suggests that even with the mediation of urban green innovation, GPP continues to exert a notable negative effect on urban carbon emissions intensity. These results support the demand-side pull hypothesis in the circular economy theory [57], thereby indicating that governmental initiatives through GPP can stimulate markets for sustainable products and enhance market-driven strategies for urban carbon emissions intensity reduction.
Regarding the mediating effect mechanism, regression results from Column (2) indicate that GPP significantly promotes urban green innovation, thus fulfilling the first-stage mediation conditions. This indicates that GPP drives market participants’ innovation through demand-pull effects, which arise from four channels: policy-driven demand, standards pressure, policy signals, and knowledge spillover networks [33,58,59]. Furthermore, regression results from Column (3) indicate that urban green innovation significantly reduces urban carbon emissions intensity, which validates the chain transmission logic and confirms second-stage mediation criteria. The mediating effect accounted for 9.65%2 of the total effect, thereby establishing a partial mediation. Additionally, both Sobel test and Bootstrap method (with 5000 resampling iterations) confirm significance at the 1% level, ultimately reinforcing the robustness of this mediating pathway and supporting H2.

5.2.2. Empirical Test of the Mediating Effect of Corporate Sustainability Performance

The mediating mechanism by which GPP impacts urban carbon emissions intensity through corporate sustainability performance is illustrated in Table 4. In Column (1), GPP exhibits a significant negative effect, which indicates that a 1% increase in GPP expenditures leads to a 1.548% reduction in urban carbon emissions intensity, thereby confirming the efficacy of the policy in reducing such intensity. Column (2) reveals that GPP significantly enhances corporate sustainability performance, which satisfies the first condition for mediation effects. This suggests that such procurement motivates companies to improve supply chain management and environmental practices, while simultaneously improving corporate reputation through dual drivers of regulatory pressure and market incentives. In Column (3), corporate sustainability performance negatively affects urban carbon emissions intensity. Specifically, each unit improvement in corporate sustainability performance results in a decrease of 0.171 units in urban carbon emissions intensity, thus meeting the second condition for mediation effects.
Overall, the carbon emissions intensity reduction effect of GPP in urban areas can be quantitatively assessed through corporate sustainability performance, thereby yielding a result of 1.206 × (−0.171) = −0.206, which accounts for 13.32% of the total effect (−1.548). After controlling for corporate sustainability performance, the direct effect of GPP decreases to −1.115 (p < 0.01). Both the direct and indirect effects remain negative with no evidence of compensation, thereby supporting a partial mediation effect and thus validating H3.

5.2.3. Empirical Test of the Mediating Effect of Public Ecological Awareness

The results for the impact of GPP expenditures on urban carbon emissions intensity mediated by public ecological awareness are reported in Table 5. In Column (1), GPP has a total effect of −1.548 on urban carbon emissions intensity (p < 0.01). In Column (3) with public ecological awareness included, the direct effect decreases to −1.460 but remains significant (p < 0.01). This highlights the robustness of our findings.
In terms of the mediation mechanism, Column (2) reveals that GPP significantly boosts public ecological awareness, thereby meeting the first-stage condition for testing mediation effects. This suggests that GPP signals the government’s commitment to environmental governance and strengthens societal engagement in climate risk policies. The mediation test results in Column (3) indicate that increased public ecological awareness is negatively associated with urban carbon emissions intensity. The Sobel test (z = −2.83, p < 0.01) and Bootstrap method (95% CI [−0.019,−0.005]) validate this mediating path, thus supporting H4.
Notably, the mediating effect of GPP, which enhances public ecological awareness, accounts for 5.31%3 of the total effect. This indicates that while public ecological awareness significantly contributes to the mediation process, it does not operate in isolation. Although its impact (5.31%) is less than that of corporate sustainability performance (13.32%), the importance of “government-public” collaborative governance in achieving carbon neutrality goals is highlighted. Public engagement may reduce urban carbon emissions intensity through two mechanisms. First, enhanced environmental awareness induces a shift in consumer demand toward low-carbon certified products, leveraging market mechanisms to drive emission reductions [60]. Second, increased public participation in environmental oversight generates informal regulatory pressure, which in turn constrains corporate carbon emissions through channels such as complaints and feedback mechanisms [61].

5.3. Spillover Effects Analysis

5.3.1. Spatial Autocorrelation Test

The Moran’s I index of urban carbon emissions intensity based on spatial geographic matrices is reported in Table 6. The results demonstrate a statistically significant positive Moran’s I index (p < 0.01) across all years, thus revealing strong spatial autocorrelation in urban carbon emissions intensity. Given these observed spatial effects, conventional econometric models may yield biases due to their failure to account for spatial dependence.
We analyzed the spatial autocorrelation of urban carbon emissions intensity using Moran’s I scatter plots (Figure 5). The point distribution demonstrates significant clustering in the high–high and low–low quadrants, with comparatively sparse observations in the high–low and low–high regions. Between 2015 and 2023, the point density in the high–high and low–low quadrants displayed marked increases, while it decreased substantially in the high–low and low–high quadrants, thus suggesting intensified positive spatial dependence. This spatial pattern emerges from industrial convergence among proximate cities [62], aligned energy structures, and environmental policy spillovers, which collectively reinforce both high- and low-carbon emissions agglomerations. While some cities exhibit dispersed spatial patterns, the persistent regional interdependence in urban carbon emissions intensity justifies the application of spatial econometric approaches.

5.3.2. Selection of Spatial Econometric Models

We apply the Lagrange Multiplier (LM) test to examine spatial dependence, with results reported in Table 7. The spatial lag test reveals statistically significant and robust LM statistics across all model specifications, which confirms the presence of spatial lag effects. By contrast, the Spatial Error test yields significant results at the 1% level under random effects and time-fixed specifications, consequently leading to the rejection of the null hypothesis of “no spatial error effects.” However, under individual fixed- and two-way fixed effects, the robust LM statistics show mixed significance (327.35 *** and 2.391 in Table 7, respectively), thereby implying that fixed effects may partially account for the spatial error correlations. Following LeSage and Pace (2010), the SDM is the preferred specification when significant spatial lag effects coexist with insignificant spatial error effects [63].
The appropriate use of the SDM is assessed using LR tests and compared to simpler specifications such as the spatial autoregressive model (SAR) and the spatial error model (SEM). Both the LR-SDM/SAR and LR-SDM/SEM tests yield statistically significant results, thus rejecting the null hypotheses that “SDM can be reduced to SAR” and “SDM can be reduced to SEM.” These findings confirm that the SDM provides a superior fit by incorporating spatially lagged independent variables in addition to the dependent variable. Consequently, adopting the SDM allows for a more comprehensive analysis of spatial interactions between independent and dependent variables, thereby reducing potential model misspecification bias.

5.3.3. Spatial Spillover Effects

Based on prior spatial dependence tests, we employ both Random Effects (RE) and Two-Way Fixed Effects (FE) spatial SDM for empirical analysis; the results are reported in Table 8. In the FE SDM, the coefficient for GPP is −1.368, and statistically significant at the 1% level. This suggests that a 1% increase in local GPP expenditures leads to a 1.368% reduction in urban carbon emissions intensity. Furthermore, the spatial interaction term coefficient (W × Green public procurement) is −15.580 and significant at the 1% level, thereby implying that local GPP may also contribute to carbon emissions intensity reduction in neighboring cities through policy diffusion and technology spillovers. These findings demonstrate the synergistic effect of GPP initiatives in promoting cross-regional carbon emissions intensity reduction.
From the perspective of spatial effects in the control variables, after applying spatial weight matrices to the independent variables, only the spatial interaction term of industrial structure (W × Industrial structure) is statistically insignificant, while all other variables exhibit significant spatial spillover effects. For instance, the coefficient of urban population is significantly negative, while its spatial interaction term (W × Urban population) is significantly positive. This indicates that local population growth may reduce carbon emission intensity through agglomeration effects, whereas population expansion in neighboring cities can exacerbate emission intensity through negative externalities such as regional energy interdependence spillovers.

5.3.4. Decomposition of Spatial Spillover Effects

The coefficient estimates from the SDM cannot be directly interpreted as marginal effects of independent variables on the dependent variable [63]. Following standard spatial econometric practices, we decompose and report the direct, indirect, and total effects for each independent variable. The direct effect captures the influence of a given independent variable on urban carbon emissions intensity within its own region, whereas the indirect effect (or spatial spillover effect) quantifies the impact of neighboring regions’ characteristics on local carbon emissions intensity.
The decomposition results from the SDM are presented in Table 9, revealing distinct mechanisms through which determinants influence urban carbon emissions intensity: (1) GPP exhibits significant decarbonization effects, with a robust direct effect of −1.360 (p < 0.01) and a notable spatial spillover effect of −14.510 (p < 0.01), consequently yielding an inter-regional policy multiplier of 1:10.7 (−1.360: −14.510). This means that a 1% reduction in local carbon emissions intensity caused by GPP leads to a 10.7% decline in that in neighboring cities. These effects arise from institutional synergies, such as the regional green certification mutual recognition scheme piloted in the Yangtze River Delta, coupled with technology diffusion enabled by the GPP-driven adoption of clean energy solutions. (2) Economic development exhibits a significant direct effect of −4.194 (p < 0.01) and a spatial spillover effect of −4.990 (p < 0.1). This implies that regional economic development has crossed the inflection point of the Kuznets curve, whereby the associated carbon emissions intensity reduction benefits of economic development have transcended geographical boundaries to generate spatial spillovers. (3) Industrial structure exhibits a significant direct effect of −2.239 (p < 0.01) but indirect effect statistically insignificant at conventional levels, suggesting its effectiveness in local decarbonization but limited regional synergistic effects. (4) Urban population and total retail sales reveal complex spatial dynamics: while both exhibit negative direct effects, their positive spatial spillovers signify “carbon leakage” effects from population agglomeration and consumption-driven production shifts, particularly between the central city and its surrounding cities. (5) Government intervention has dual effects: a direct and spillover effect coefficient of 3.591 (p < 0.01) and −20.470 (p < 0.01), respectively, which indicate short-term compliance costs and regional coordination benefits of GPP. (6) Energy structure exhibits insignificant direct effects but strong positive spillovers, demonstrating a characteristic pattern of “weak direct effects—strong spillover effects” on carbon emission intensity. Based on the analysis above, GPP clearly influences urban carbon emissions intensity through a spatial spillover effect, which supports H4.

5.4. Robustness Tests

5.4.1. Robustness Tests of the Baseline Regression

To ensure the reliability of results, we conduct comprehensive robustness tests in three dimensions (Table 10). First, the temporal heterogeneity test shows that after excluding samples from the 2020 COVID-19 pandemic period, the regression coefficient of government procurement policies (GPP) remains significantly negative, indicating that the pandemic did not systematically bias the baseline results. Second, robustness tests addressing data distribution indicate that after applying a 2% two-tailed winsorization to mitigate outliers, both the significance level (p < 0.01) and the coefficient (β = −1.312) of GPP remain stable, confirming that the results are robust. Third, when the dependent variable is replaced with “carbon emission intensity per unit of secondary output”, the GPP regression coefficient increases in magnitude (β = −2.047), indicating that GPP exhibits a stronger carbon reduction effect on industrial emissions. All models demonstrate strong explanatory power (R-squared > 0.6), further confirming the reliability of the model specification.

5.4.2. Robustness Tests of the Spatial Effects

Table 11 presents the robustness test results. First, to mitigate the unusual impact of the COVID-19 pandemic, we run a regression analysis excluding samples from 2020. Column (1) reveals that both the direct effect (−1.754) and spatial spillover effect (−50.20) of GPP remain significant, and exhibit an increased intensity in urban carbon emissions intensity reduction compared to the panel fixed-effects model. This finding indicates that the pandemic reduced policy effectiveness. Second, after performing 2% tail trimming on key variables [64], neither the direction nor significance of the coefficients changed (direct effect: −0.961; indirect effect: −13.330), which confirms that outliers did not influence the main findings. Finally, using an economic geography nested matrix (including interaction terms for GDP and distance), the spatial autocorrelation coefficient ρ remains significantly negative (I = −0.071; p < 0.01). Additionally, the direction of policy effects (direct: −1.553; indirect: −2.256) align with those observed in the panel fixed-effects model.

6. Conclusions and Policy Implications

6.1. Conclusions

Using panel data from 285 Chinese prefecture-level cities (2015–2023), this study examines the impact of green public procurement (GPP) on urban carbon emissions intensity with a particular focus on spatial spillover effects. The key findings are as follows.
First, the results confirm that GPP significantly reduces urban carbon emissions intensity. Panel fixed-effects models reveal that a 1% increase in GPP expenditures leads to a 1.548% decrease in carbon emissions intensity. This finding confirming that GPP practices can effectively drive reductions in carbon emissions at the city level.
Second, the study identifies three key mechanisms through which GPP lowers urban carbon emissions intensity. Urban green innovation mediates 9.65% of the total effect, corporate sustainability performance exhibits a mediation effect of 13.32%. Additionally, public ecological awareness mediates 5.31% of the effect, as GPP initiatives raise environmental consciousness, thus influencing consumer behavior and societal oversight to further curb emissions. These mechanisms collectively explain the multidimensional impact of GPP policies on urban carbon emissions intensity.
Third, our analysis reveals a significant spatial spillover effect. The SDM establishes that a 1% increase in local GPP leads to a 1.360% reduction in local carbon emissions intensity and a 14.510% decrease in that of neighboring cities. This creates a remarkable cross-regional multiplier effect with a ratio of 1:10.7. These findings highlight the potential of GPP to foster inter-city collaboration in emissions reduction efforts.
Finally, several control variables demonstrate complex spatial interaction effects that policymakers should consider. Population agglomeration and consumption upgrade directly reduce local carbon emissions intensity but may inadvertently increase intensity in adjacent regions through demand-driven production relocation and “carbon leakage”—whereby high-emission activities shift to areas with laxer regulations. Government intervention has a dual effect: moderate regulation facilitates emission reduction, but excessive intervention may distort market functions. Notably, stricter environmental policies in neighboring cities can trigger a “competitive abatement” effect that benefits the entire region.

6.2. Policy Implications

To establish an effective carbon governance system, we propose a theoretical framework that integrates mandatory regulatory tools with market-based mechanisms. This approach combines carbon taxation and emissions trading systems with voluntary measures such as GPP. Carbon pricing provides legally binding economic incentives for emission reductions by internalizing environmental externalities, while GPP leverages market demand signals to drive low-carbon innovation and shape sustainable consumption patterns.
To maximize the decarbonization potential of GPP, a coordinated implementation mechanism should be established, with a focus on three key dimensions: (1) Accelerate green technological innovation through dedicated R&D funding, expedited patent examination for low-carbon technologies, and targeted subsidies for strategic emerging industries (e.g., renewable energy, carbon capture); (2) Integrate the carbon footprint of suppliers into procurement evaluations, offer preferential prices for green SCs, and foster a “leading enterprise—small and medium-sized enterprise” cooperation model to enhance the overall level of cooperate sustainable performance; (3) Stimulate social engagement by implementing transparent emission reporting requirements and public oversight platforms. This integrated framework ensures synchronized progress in low-carbon transformation across technological, corporate, and societal levels.
A regional synergistic compensation mechanism is critical to address the spatial spillover effects of urban carbon emissions. Key measures include: (1) Establish a Green Supply Chain City Alliance to facilitate cross-regional low-carbon technology transfer and collaborative innovation, enabling tiered diffusion of green technologies from eastern to central and western regions; (2) Pilot mutual recognition of green certifications in major urban agglomerations (e.g., Yangtze River Delta, Beijing-Tianjin-Hebei), while imposing carbon intensity thresholds for industrial relocation to mitigate carbon leakage risks; (3) Enhance green labeling systems and introducing inter-regional environmental tax adjustments to curb high-carbon demand displacement through price signals. These measures would strengthen coordinated emissions reduction while addressing spillover externalities.
Finally, a robust data infrastructure and cross-departmental policy coordination are essential. A nationally unified carbon accounting database should be established to support the cross-regional trading of GPP quotas and carbon allowances, ultimately facilitating jurisdictional alignment. By integrating big data and national platforms, a multi-tiered GPP governance framework can evolve from localized pilot programs to regional coordination and ultimately national integration, thereby optimizing emissions reduction synergies.
We must admit that this study focuses primarily on the Chinese context, yet GPP effectiveness can vary significantly across institutional settings. In highly marketized economies such as United States and European countries, GPP tends to yield stronger outcomes when integrated with complementary instruments such as corporate innovation incentives and carbon-footprint accounting. Conversely, in jurisdictions with limited policy transparency and weak market mechanisms, it may be prudent to begin by targeting procurement in sectors already characterized by robust market mechanisms. Over time, policymakers can layer in public-participation and oversight structures to bolster accountability and enhance the environmental and carbon-reduction outcomes of these green procurement measures.

6.3. Prospects for Future Research

This study analyzes the relationship between GPP and urban carbon emissions intensity; however, several avenues for further research remain.
First, although the use of prefecture-level city data improves precision compared to provincial-level analyses, heterogeneity in non-urban areas may not be fully captured. Future studies could incorporate county-level microdata to better assess localized variations in GPP mechanisms and their environmental impacts.
Second, although panel fixed-effects regression, mediation tests, and spatial spillover analyses were conducted, the dynamic impact of policy shifts on the GPP-urban carbon emissions intensity relationship requires further exploration. A Difference-in-Differences approach with detailed policy timelines could assess how significant regulatory changes shape the effectiveness of GPP in emissions governance more rigorously.
Finally, the generalizability of these findings beyond China warrants careful consideration. As the world’s largest developing economy, China’s institutional context and developmental stage shape its carbon governance outcomes. Future research should expand geographical coverage to diverse settings, thus enhancing the generalizability of policy recommendations for global low-carbon urban development.

Author Contributions

L.W.: conceptualization, data collection and processing, methodology, empirical testing, funding acquisition, writing—review, and editing; H.W.: data collection and processing, spatial analysis, software, writing—original draft preparation; J.Z.: conceptualization, supervision, writing—review, and editing. All authors have read and agreed to the published version of the manuscript.

Funding

This research was funded by The National Social Science Fund of China (Grant No. 23CGL066).

Data Availability Statement

The data presented in this study are available on request from the corresponding author, the data are not publicly available due to privacy.

Acknowledgments

We express our deepest gratitude to the reviewers and the editor for their invaluable comments and suggestions.

Conflicts of Interest

The authors declare no conflicts of interest.

Notes

1
Prior to conducting fixed-effects regression analysis, diagnostic tests revealed that all independent variables had VIF values below 2.61, which is well below the critical threshold of 10, thereby confirming no multicollinearity issues. To address nonstationarity risks, we conducted three unit root tests—LLC, IPS, and ADF-Fisher—with results (p < 0.05) confirming that all variables are stationary processes, thus mitigating potential spurious regression concerns. For enhanced interpretability and estimation precision, continuous variables were mean-centered in the model specification
2
It is calculated using the formula: 12.454 × (−0.012)/(−1.548)
3
Calculation: 0.004 × (−20.543)/(−1.548)

References

  1. Global Monitoring Laboratory. Mauna Loa CO2 Annual Mean Data; NOAA: Washington, DC, USA, 2024. [Google Scholar]
  2. IEA. Tracking Clean Energy Progress 2023; International Energy Agency: Paris, France, 2024. [Google Scholar]
  3. China’s Ministry of Finance. China Financial Yearbook; China’s Ministry of Finance: Beijing, China, 2024.
  4. Li, Y.; Chen, B.; Guo, L.; Kang, J. Analysis of the Impact of the Digital Economy System on Carbon Emissions and Carbon Footprint from the Perspective of High-Quality Development. Front. Environ. Sci. 2025, 13, 1443405. [Google Scholar] [CrossRef]
  5. Yang, G.; Wang, X.; Peng, L.; Zhang, X. Dynamic Interactions of Urban Land Use Efficiency, Industrial Structure, and Carbon Emissions Intensity in Chinese Cities: A Panel Vector Autoregression (PVAR) Approach. Land 2024, 14, 57. [Google Scholar] [CrossRef]
  6. Yu, X.; Wang, P. Economic Effects Analysis of Environmental Regulation Policy in the Process of Industrial Structure Upgrading: Evidence from Chinese Provincial Panel Data. Sci. Total Environ. 2021, 753, 142004. [Google Scholar] [CrossRef]
  7. Liu, X.; Zhang, X. Industrial Agglomeration, Technological Innovation and Carbon Productivity: Evidence from China. Resour. Conserv. Recycl. 2021, 166, 105330. [Google Scholar] [CrossRef]
  8. Du, M.; Zhang, Y.-J. The Synergistic Carbon Emission Reduction Advantage of Green Finance and Digital Finance. Environ. Impact Assess. Rev. 2025, 112, 107795. [Google Scholar] [CrossRef]
  9. Liu, Y.; Xiao, H.; Lv, Y.; Zhang, N. The Effect of New-Type Urbanization on Energy Consumption in China: A Spatial Econometric Analysis. J. Clean. Prod. 2017, 163, S299–S305. [Google Scholar] [CrossRef]
  10. Sadorsky, P. The Effect of Urbanization on CO2 Emissions in Emerging Economies. Energy Econ. 2014, 41, 147–153. [Google Scholar] [CrossRef]
  11. Ali, H.S.; Abdul-Rahim, A.; Ribadu, M.B. Urbanization and Carbon Dioxide Emissions in Singapore: Evidence from the ARDL Approach. Environ. Sci. Pollut. Res. 2017, 24, 1967–1974. [Google Scholar] [CrossRef] [PubMed]
  12. Sinn, H.-W. Public Policies against Global Warming: A Supply Side Approach. Int. Tax Public Financ. 2008, 15, 360–394. [Google Scholar] [CrossRef]
  13. Nordhaus, W. Climate Clubs: Overcoming Free-Riding in International Climate Policy. Am. Econ. Rev. 2015, 105, 1339–1370. [Google Scholar] [CrossRef]
  14. Yan, B.; Wang, F.; Chen, T.; Liu, S.; Bai, X. Digital Finance, Environmental Regulation and Emission Reduction in Manufacturing Industry: New Evidence Incorporating Dynamic Spatial-Temporal Correlation and Competition. Int. Rev. Econ. Financ. 2023, 83, 750–763. [Google Scholar] [CrossRef]
  15. Tariq, A.; Hassan, A. Role of Green Finance, Environmental Regulations, and Economic Development in the Transition towards a Sustainable Environment. J. Clean. Prod. 2023, 413, 137425. [Google Scholar] [CrossRef]
  16. Yang, M.; Chen, H.; Long, R.; Yang, J. How Does Government Regulation Shape Residents’ Green Consumption Behavior? A Multi-Agent Simulation Considering Environmental Values and Social Interaction. J. Environ. Manag. 2023, 331, 117231. [Google Scholar] [CrossRef]
  17. Cheng, W.; Appolloni, A.; D’Amato, A.; Zhu, Q. Green Public Procurement, Missing Concepts and Future Trends—A Critical Review. J. Clean. Prod. 2018, 176, 770–784. [Google Scholar] [CrossRef]
  18. Liu, J.; Zhao, W.; Zhuang, C.C. Going Green or Losing Edge? The Impact of Government Procurement on Carbon Reduction and Firm Value in China. Energy Econ. 2025, 142, 108219. [Google Scholar] [CrossRef]
  19. Caldwell, L.K. Duke Press policy studies. In international Environmental Policy: Emergence and Dimensions, 2nd ed.; Duke University Press: Durham, UK, 1990; ISBN 978-0-8223-1058-7. [Google Scholar]
  20. Hajer, M.A. The Politics of Environmental Discourse: Ecological Modernization and the Policy Process; Clarendon Press: Oxford, UK, 1995. [Google Scholar]
  21. Behravesh, S.-A.; Darnall, N.; Bretschneider, S. A Framework for Understanding Sustainable Public Purchasing. J. Clean. Prod. 2022, 376, 134122. [Google Scholar] [CrossRef]
  22. Kuan, S.H.; Low, F.S.; Chieng, S. Towards Regional Cooperation on Sustainable Plastic Recycling: Comparative Analysis of Plastic Waste Recycling Policies and Legislations in Japan and Malaysia. Clean Technol. Environ. Policy 2022, 24, 761–777. [Google Scholar] [CrossRef]
  23. Andhov, M.; Caranta, R.; Wiesbrock, A. The European Union Law of Life-Cycle Costing. In Cost and EU Public Procurement Law; Routledge: London, UK, 2019; ISBN 978-0-429-06004-5. [Google Scholar]
  24. Ahsan, K.; Rahman, S. Green Public Procurement Implementation Challenges in Australian Public Healthcare Sector. J. Clean. Prod. 2017, 152, 181–197. [Google Scholar] [CrossRef]
  25. Shahin, A.; Polonsky, M.; Wood, L.C.; Presbitero, A.; Wijayasundara, M. Greening the Procurement: A SMART Evaluation of Environmental Sustainability in Australian Government Purchasing Policies. Asia Pac. J. Mark. Logist. 2024, 37, 1029–1047. [Google Scholar] [CrossRef]
  26. Biberos-Bendezú, K.; Cárdenas, Ú.; Kahhat, R.; Vázquez-Rowe, I. Introducing Environmental Decision-Making Criteria to Foster Green Public Procurement in Peru. Integr. Environ. Assess. Manag. 2021, 18, 1206–1220. [Google Scholar] [CrossRef]
  27. Ortega Carrasco, P.; Iannone, F.; Ferrón Vílchez, V.; Testa, F. Green Public Procurement as an Effective Way for Sustainable Development: A Systematic Literature Review and Bibliometric Analysis. Sustain. Dev. 2025, 33, 2364–2391. [Google Scholar] [CrossRef]
  28. Agyepong, A.O.; Nhamo, G. Green Procurement in South Africa: Perspectives on Legislative Provisions in Metropolitan Municipalities. Environ. Dev. Sustain. 2017, 19, 2457–2474. [Google Scholar] [CrossRef]
  29. Appolloni, A. Green Public Procurement in Italy: As an Environmental Policy Toll: Innovation Design Issues. Available at SSRN 2025283. 2012. Available online: https://www.researchgate.net/publication/256016244_Green_Public_Procurement_in_Italy_As_an_Environmental_Policy_Toll_Innovation_Design_Issues (accessed on 6 January 2025).
  30. Zhu, Q.; Geng, Y.; Sarkis, J. Motivating Green Public Procurement in China: An Individual Level Perspective. J. Environ. Manag. 2013, 126, 85–95. [Google Scholar] [CrossRef]
  31. Dou, Y.; Sarkis, J.; Bai, C. Government Green Procurement: A Fuzzy-DEMATEL Analysis of Barriers. In Supply Chain Management Under Fuzziness; Kahraman, C., Öztayşi, B., Eds.; Studies in Fuzziness and Soft Computing; Springer: Berlin/Heidelberg, Germany, 2014; Volume 313, pp. 567–589. ISBN 978-3-642-53938-1. [Google Scholar]
  32. Creutzig, F.; Niamir, L.; Bai, X.; Callaghan, M.; Cullen, J.; Díaz-José, J.; Figueroa, M.; Grubler, A.; Lamb, W.F.; Leip, A.; et al. Demand-Side Solutions to Climate Change Mitigation Consistent with High Levels of Well-Being. Nat. Clim. Chang. 2022, 12, 36–46. [Google Scholar] [CrossRef]
  33. Fusillo, F.; Orsatti, G.; Scandura, A. Public Green Demand and Green Innovation: Evidence from US Firms. Eurasian Bus. Rev. 2025, 1–33. [Google Scholar] [CrossRef]
  34. Xin-gang, Z.; Jin, Z. Impacts of Two-Way Foreign Direct Investment on Carbon Emissions: From the Perspective of Environmental Regulation. Environ. Sci. Pollut. Res. 2022, 29, 52705–52723. [Google Scholar] [CrossRef] [PubMed]
  35. Liu, X.; Miao, H.; Zhou, W.; Qiu, Y. The Impact of Government Procurement on Green Technological Innovation: Evidence from Manufacturing Sector in China. Pac. Basin Financ. J. 2024, 86, 102457. [Google Scholar] [CrossRef]
  36. Guo, R.; Lv, S.; Liao, T.; Xi, F.; Zhang, J.; Zuo, X.; Cao, X.; Feng, Z.; Zhang, Y. Classifying Green Technologies for Sustainable Innovation and Investment. Resour. Conserv. Recycl. 2020, 153, 104580. [Google Scholar] [CrossRef]
  37. Tang, L.; Zhao, H.; Zhou, Z.; Qian, Z.; Hou, S.; Liu, B. Can Government Procurement Drive Corporate Green Technology Innovation? Evidence from Chinese Listed Companies. Eval. Program. Plan. 2025, 111, 102592. [Google Scholar] [CrossRef]
  38. Albino, V.; Ardito, L.; Dangelico, R.M.; Messeni Petruzzelli, A. Understanding the Development Trends of Low-Carbon Energy Technologies: A Patent Analysis. Appl. Energy 2014, 135, 836–854. [Google Scholar] [CrossRef]
  39. De Souza Barbosa, A.; Da Silva, M.C.B.C.; Da Silva, L.B.; Morioka, S.N.; De Souza, V.F. Integration of Environmental, Social, and Governance (ESG) Criteria: Their Impacts on Corporate Sustainability Performance. Humanit. Soc. Sci. Commun. 2023, 10, 410. [Google Scholar] [CrossRef]
  40. Al-Shammari, M.A.; Al-Shammari, H.; Banerjee, S.N. CSR Discrepancies, Firm Visibility and Performance: A Mediated Moderation Analysis. Manag. Decis. 2022, 60, 1560–1584. [Google Scholar] [CrossRef]
  41. e Silva, F.C.N.S. Iso 14001—Environmental Management System as A Strategic Tool for Companies in The Electric Sector. RGSA 2024, 18, e03109. [Google Scholar] [CrossRef]
  42. Zhang, Z.; Jiang, Y. Can Green Public Procurement Change Energy Efficiency? Evidence from a Quasi-Natural Experiment in China. Energy Econ. 2022, 113, 106244. [Google Scholar] [CrossRef]
  43. Zheng, S.; Wen, J. Green Public Procurement and Corporate Environmental Performance: An Empirical Analysis Based on Data from Green Procurement Contracts. Int. Rev. Econ. Financ. 2024, 96, 103578. [Google Scholar] [CrossRef]
  44. Wei, J.; Zhang, L.; Yang, R.; Song, M. A New Perspective to Promote Sustainable Low-Carbon Consumption: The Influence of Informational Incentive and Social Influence. J. Environ. Manag. 2023, 327, 116848. [Google Scholar] [CrossRef] [PubMed]
  45. Khan, S.A.R.; Yu, Z.; Umar, M. How Environmental Awareness and Corporate Social Responsibility Practices Benefit the Enterprise? An Empirical Study in the Context of Emerging Economy. Manag. Environ. Qual. Int. J. 2021, 32, 863–885. [Google Scholar] [CrossRef]
  46. Cheng, J.; Xu, L.; Wang, H.; Geng, Z.; Wang, Y. How Does the Marginal Abatement Cost of CO2 Emissions Evolve in Chinese Cities? An Analysis from the Perspective of Urban Agglomerations. Sustain. Prod. Consum. 2022, 32, 147–159. [Google Scholar] [CrossRef]
  47. Abbasi, K.R.; Kirikkaleli, D.; Altuntaş, M. Carbon Dioxide Intensity of GDP and Environmental Degradation in an Emerging Country. Environ. Sci. Pollut. Res. 2022, 29, 84451–84459. [Google Scholar] [CrossRef]
  48. Yin, J.; Ibrahim, S.; Mohd, N.N.A.; Zhong, C.; Mao, X. Unpacking Multidimensional Effects of Economic Restructuring and Technological Progress on Carbon Emission Performance: The Moderating Role of Environmental Regulation. Sci. Rep. 2025, 15, 1267. [Google Scholar] [CrossRef] [PubMed]
  49. Zhu, Z.; Lin, W. Impact of Livelihood Development on CO2 Emissions: Empirical Evidence from Yangtze River Delta Urban Agglomeration. Front. Environ. Sci. 2025, 13, 1523850. [Google Scholar] [CrossRef]
  50. Simcoe, T.; Toffel, M.W. Government Green Procurement Spillovers: Evidence from Municipal Building Policies in California. J. Environ. Econ. Manag. 2014, 68, 411–434. [Google Scholar] [CrossRef]
  51. Wang, Y.; Yao, X.; Wang, J.; Kang, C.; Meng, X.; Hu, G.; Liu, Y.; Li, X. Investigating the Effect of Industry-Specific Economic Distance on the Prediction of Intercity Population Movement. Cities 2024, 150, 105047. [Google Scholar] [CrossRef]
  52. Wang, Q.; Wang, X.; Li, R. Does Urbanization Redefine the Environmental Kuznets Curve? An Empirical Analysis of 134 Countries. Sustain. Cities Soc. 2022, 76, 103382. [Google Scholar] [CrossRef]
  53. Mysachenko, V.I.; Komarov, V.Y.; Reshetov, K.Y. Innovation and Structural Transformation of Industry. In Complex Systems: Innovation and Sustainability in the Digital Age; Bogoviz, A.V., Ed.; Studies in Systems, Decision and Control; Springer International Publishing: Cham, Switzerland, 2020; Volume 282, pp. 257–265. ISBN 978-3-030-44702-1. [Google Scholar]
  54. Wang, X.; Wang, Q. Research on the Impact of Green Finance on the Upgrading of China’s Regional Industrial Structure from the Perspective of Sustainable Development. Resour. Policy 2021, 74, 102436. [Google Scholar] [CrossRef]
  55. Yu, W.; Liang, W.; Yao, X. The Effect of the County-to-District Conversion Policy on Energy Efficiency of Enterprises: Evidence from China. Energy Econ. 2024, 134, 107618. [Google Scholar] [CrossRef]
  56. You, D.; Zhang, Y.; Yuan, B. Environmental Regulation and Firm Eco-Innovation: Evidence of Moderating Effects of Fiscal Decentralization and Political Competition from Listed Chinese Industrial Companies. J. Clean. Prod. 2019, 207, 1072–1083. [Google Scholar] [CrossRef]
  57. Mateo, E.; Turunen, T.; Alaranta, J. Demand-Pull Instruments to Support the Circular Economy: A Global Perspective. J. Environ. Law Policy 2022, 2, 102–138. [Google Scholar] [CrossRef]
  58. Wei, S.; Chusheng, Y. How Does Government Procurement Promote Enterprise Innovation?—On the Synergy Between Demand-Pull and Supply-Push of Innovation Policies. Front. Educ. China 2024, 19, 1–29. [Google Scholar]
  59. Dai, X.; Li, Y.; Chen, K. Direct Demand-Pull and Indirect Certification Effects of Public Procurement for Innovation. Technovation 2021, 101, 102198. [Google Scholar] [CrossRef]
  60. Ma, H.; Chen, Q. Social Environment, Low-Carbon Cognition and Low-Carbon Consumption Behaviors of Youth Groups: Evidence from Xizang, China. Front. Psychol. 2025, 16, 1494761. [Google Scholar] [CrossRef] [PubMed]
  61. Zhang, X.; Yang, Y.; Li, Y. Does Public Participation Reduce Regional Carbon Emission? Atmosphere 2023, 14, 165. [Google Scholar] [CrossRef]
  62. Xu, M.; Luan, S.; Gao, X.; Wang, H. Spatiotemporal Evolution, Spatial Agglomeration and Convergence of Environmental Governance in China—A Comparative Analysis Based on a Basin Perspective. Land 2024, 13, 231. [Google Scholar] [CrossRef]
  63. LeSage, J.P.; Pace, R.K. Spatial Econometric Models. In Handbook of Applied Spatial Analysis; Fischer, M.M., Getis, A., Eds.; Springer: Berlin/Heidelberg, Germany, 2010; pp. 355–376. ISBN 978-3-642-03646-0. [Google Scholar]
  64. Chu, X.; Bai, Y.; Li, C. The Dark Side of Firms’ Green Technology Innovation on Corporate Social Responsibility: Evidence from China. J. Bus. Ethics 2024, 195, 47–66. [Google Scholar] [CrossRef]
Figure 1. Spatial distribution of average annual GPP in China (2015–2023). Note: GPP expenditure values are measured in natural logarithmic terms (CNY) at the city level.
Land 14 01545 g001
Figure 2. Kernel density estimation distribution of GPP across Chinese regions (2015–2023). Note: GPP expenditure values are measured in natural logarithmic terms (CNY) at the city level.
Land 14 01545 g002
Figure 3. Analytical framework of the impact of GPP on urban carbon emission intensity.
Land 14 01545 g003
Figure 4. Distribution of carbon emission intensity in Chinese cities from 2015 to 2023.
Land 14 01545 g004
Figure 5. Moran’s I scatter plot of urban carbon emissions intensity from 2015 to 2023.
Land 14 01545 g005
Table 1. Descriptive statistics of key variables.
VariablesUnitMeanStandard DeviationMinMax
Dependent variable
Urban carbon emissions intensity (log)tons/CNY1.674 1.463 0.084 11.220
Independent variables
Green public procurement (log)CNY10.043 3.622 0.519 15.320
Mediating variables
Urban green innovation (log)/5.297 1.713 0.000 10.372
Public ecological awareness (log)/4.898 3.647 0.000 11.222
Corporate sustainability performance/3.915 0.713 1.000 6.750
Control variables
Economic development (log)CNY10.935 0.514 9.797 12.119
Industrial structure%41.670 10.343 10.680 73.033
Urban population (log)/9.4471.1553.82713.056
Total retail sales%39.428 10.96715.22070.446
Government intervention%21.629 10.7698.43965.339
Energy structure%34.79712.3531.93063.713
Table 2. Panel fixed-effect regression results.
Urban Carbon Emissions Intensity(1)(2)(3)(4)(5)(6)(7)
Green public procurement −1.658 ***−2.036 ***−1.904 ***−1.799 ***−1.593 ***−1.546 ***−1.548 ***
(0.572)(0.420)(0.414)(0.412)(0.409)(0.402)(0.402)
Economic development −4.084 ***−4.243 ***−4.538 ***−4.619 ***−4.239 ***−4.233 ***
(0.070)(0.071)(0.089)(0.089)(0.098)(0.098)
Industrial structure −2.694 ***−2.065 ***−2.354 ***−1.544 ***−1.531 ***
(0.308)(0.327)(0.326)(0.334)(0.334)
Urban population 8.440 ***7.623 ***6.231 ***6.188 ***
(1.542)(1.531)(1.516)(1.516)
Total retail sales −1.402 ***−1.180 ***−1.177 ***
(0.205)(0.203)(0.203)
Government intervention 3.394 ***3.420 ***
(0.391)(0.391)
Energy structure −1.080
(0.804)
Constant99.059 ***−2.946 **−2.962 **−14.478 ***−12.610 ***−10.314 ***−10.212 ***
(5.479)(1.364)(1.342)(2.492)(2.519)(2.493)(2.494)
N2565256525652565256525652565
R-squared0.3170.5950.6080.6130.6210.6330.633
Note: Standard errors are in parentheses. All variables are mean-centered. ** p < 0.05, *** p < 0.01.
Table 3. Mediating effect of urban green innovation.
(1) Urban Carbon Emissions Intensity(2) Urban Green Innovation(3) Urban Carbon Emissions Intensity
Green public procurement−1.548 ***12.454 ***−1.400 ***
(0.402)(4.518)(0.399)
Urban green innovation −0.012 ***
(0.002)
Control VariablesYesYesYes
Constant −10.212 ***78.877 ***−9.270 ***
(2.494)(28.017)(2.476)
Individual Fixed EffectsYesYesYes
Temporal Fixed EffectsYesYesYes
N256525652565
R-squared0.6330.0250.640
Notes: Standard errors in parentheses. All variables mean-centered. *** p < 0.01.
Table 4. Mediating effect of corporate sustainability performance.
(1) Urban Carbon Emissions Intensity(2) Corporate Sustainability Performance(3) Urban Carbon Emissions Intensity
Green public procurement−1.548 ***1.206 ***−1.115 ***
(0.402)(0.318)(0.401)
Corporate sustainability performance −0.171 ***
(0.028)
Control VariablesYesYesYes
Constant −10.212 ***26.097 *−54.139 ***
(2.494)(15.105)(19.008)
Individual Fixed EffectsYesYesYes
Temporal Fixed EffectsYesYesYes
N256525652565
R-squared0.6330.0590.649
Notes: Standard errors in parentheses. All variables mean-centered. * p < 0.1, *** p < 0.01.
Table 5. Mediating effect of public ecological awareness.
(1) Urban Carbon emissions Intensity(2) Public Ecological Awareness(3) Urban Carbon Emissions Intensity
Green public procurement−1.548 ***0.004 **−1.460 ***
(0.402)(0.002)(0.401)
Public ecological awareness −20.543 ***
(4.549)
Control VariablesYesYesYes
Constant −10.212 ***0.174 ***−6.645 **
(2.494)(0.011)(2.606)
Individual Fixed EffectsYesYesYes
Temporal Fixed EffectsYesYesYes
N256525652565
R-squared0.6330.6190.636
Notes: Standard errors in parentheses. All variables mean-centered. ** p < 0.05, *** p < 0.01.
Table 6. Global Moran’s I and statistical significance tests for urban carbon emission intensity.
YearGlobal Moran’s IForward Indexσ2Z
20150.161 ***−0.0020.0014.924
20160.188 ***−0.0020.0015.755
20170.216 ***−0.0020.0016.536
20180.228 ***−0.0020.0016.862
20190.246 ***−0.0020.0017.387
20200.257 ***−0.0020.0017.712
20210.260 ***−0.0020.0017.792
20220.268 ***−0.0020.0018.030
20230.284 ***−0.0020.0018.488
Notes: *** p < 0.01.
Table 7. Results of spatial econometric model specification.
Spatial Model Testing Random EffectsTemporal Fixed EffectsIndividual Fixed EffectsTwo-Way Fixed Effects
LM
Test
Spatial lagLagrange Multiplier389.801 ***717.263 ***30.827 ***84.792 ***
Robust Lagrange Multiplier4.283 ***46.373 ***82.180 ***57.894 ***
Spatial errorLagrange Multiplier620.928 ***689.380 ***276.002 ***29.289 ***
Robust Lagrange Multiplier235.410 ***18.490 ***327.354 ***2.391
LR
Test
LR-SDM/SAR100.17 ***125.85 ***104.21 ***25.81 ***
LR-SDM/SEM7290.77 ***109.84 ***72.20 ***22.17 ***
Notes: *** p < 0.01.
Table 8. Estimation results of the spatial Durbin model.
(1) Urban Carbon Emissions Intensity(2) Urban Carbon Emissions Intensity
Green public procurement−1.451 ***−1.368 ***
(0.408)(0.384)
Economic development−4.035 ***−4.184 ***
(0.134)(0.128)
Industrial structure−2.173 ***−2.277 ***
(0.400)(0.379)
Urban population−2.880 ***−6.992 ***
(0.618)(0.955)
Total retail sales−0.782 ***−0.677 ***
(0.216)(0.206)
Government intervention3.571 ***3.575 ***
(0.431)(0.406)
Energy structure−2.360−5.1360
(7.569)(7.410)
W × Green public procurement−14.930 ***−15.580 ***
(3.727)(3.886)
W × Economic development−5.897 ***−5.784 ***
(1.174)(1.611)
W × Industrial structure−0.372−0.513
(1.755)(1.651)
W × Urban population75.114 ***83.189 ***
(10.852)(15.055)
W × Total retail sales2.134 ***2.112 ***
(0.717)(0.676)
W × Government intervention−20.820 ***−21.560 ***
(3.481)(3.729)
W × Energy structure400.1 **418.8 **
(1779)(1739)
Fixed-effectsNoYes
Notes: ** p < 0.1, *** p < 0.01.
Table 9. Decomposition results of spatial spillover effects.
Urban Carbon Emissions IntensityDirect EffectIndirect EffectTotal Effect
Coefficientt-StatisticCoefficientt-StatisticCoefficientt-Statistic
Green public procurement−1.360 ***−3.53−14.510 ***−5.29−15.87 ***−5.66
Economic development −4.194 ***−38.46−4.990 ***−5.19−9.184 ***−9.60
Industrial structure−2.239 ***−5.56−0.401−0.26−2.640 *−1.74
Urban population−6.957 ***−6.7777.720 ***6.4470.763 ***5.78
Total retail sales−0.715 ***−2.982.035 ***2.891.320 *1.82
Government intervention3.591 ***9.52−20.470 ***−6.60−16.87 ***−5.31
Energy structure−5.210−0.71418.9 ***2.67413.7 ***2.62
Notes: * p < 0.1, *** p < 0.01.
Table 10. Results of robustness tests for baseline regression.
Urban Carbon Emissions Intensity(1) Excluding 2020(2) Trim the Tail(3) Replace with Carbon Emission Intensity per Unit of Secondary Output
Green public procurement−1.992 ***−1.735 ***−1.655 ***−1.312 ***−2.617 ***−2.047 ***
(0.614)(0.434)(0.602)(0.453)(0.859)(0.472)
Control VariablesNoYesNoYesNoYes
Constant98.906 ***−7.518 **91.656 ***0.45621.845 ***−9.182 ***
(5.605)(3.047)(5.391)(2.508)(8.277)(2.930)
N256825682568256825682568
R-squared0.3360.6410.3220.6040.0810.715
Notes: ** p < 0.05, *** p < 0.01.
Table 11. Results of robustness tests for the spatial effects.
(1) Excluding 2020(2) Trim the Tail(3) Replace with the Economic Geography Nested Matrix
Direct Effects−1.754 ***−0.961 **−1.553 ***
(0.426)(0.392)(0.391)
Indirect Effects−50.20 ***−13.330 ***−2.256 **
(18.99)(2.526)(0.897)
Total Effects−51.95 ***−14.29 ***−3.809 ***
(19.13)(2.579)(0.974)
N228025652565
Notes: ** p < 0.05, *** p < 0.01.
Disclaimer/Publisher’s Note: The statements, opinions and data contained in all publications are solely those of the individual author(s) and contributor(s) and not of MDPI and/or the editor(s). MDPI and/or the editor(s) disclaim responsibility for any injury to people or property resulting from any ideas, methods, instructions or products referred to in the content.

