Article

Revealing Ecosystem Carbon Sequestration Service Flows Through the Meta-Coupling Framework: Evidence from Henan Province and the Surrounding Regions in China

by
Wenfeng Ji
1,2,
Siyuan Liu
1,2,
Yi Yang
3,
Mengxue Liu
4,
Hejie Wei
1,2,* and
Ling Li
1,2,*
1
College of Resources and Environmental Sciences, Henan Agricultural University, Zhengzhou 450046, China
2
Henan Engineering Research Center of Land Consolidation and Ecological Restoration, Henan Agricultural University, Zhengzhou 450002, China
3
College of Forestry, Henan Agricultural University, Zhengzhou 450046, China
4
Lhasa Plateau Ecosystem Research Station, Key Laboratory of Ecosystem Network Observation and Modeling, Institute of Geographic Sciences and Natural Resources Research, Chinese Academy of Sciences, Beijing 100101, China
*
Authors to whom correspondence should be addressed.
Land 2025, 14(8), 1522; https://doi.org/10.3390/land14081522
Submission received: 23 June 2025 / Revised: 14 July 2025 / Accepted: 22 July 2025 / Published: 24 July 2025
(This article belongs to the Special Issue Land Resource Assessment (Second Edition))

Abstract

Research on ecosystem carbon sequestration services and ecological compensation is crucial for advancing carbon neutrality. As a public good, ecosystem carbon sequestration services inherently lead to externalities. Therefore, it is essential to consider externalities in the flow of sequestration services. However, few studies have examined intra- and inter-regional ecosystem carbon sequestration flows, making regional ecosystem carbon sequestration flows less comprehensive. Against this background, the research objectives of this paper are as follows. The flow of carbon sequestration services between Henan Province and out-of-province regions is studied. In addition, this study clarifies the beneficiary and supply areas of carbon sink services in Henan Province and the neighboring regions at the prefecture-level city scale to obtain a more systematic, comprehensive, and actual flow of carbon sequestration services for scientific and effective eco-compensation and to promote regional synergistic emission reductions. The research methodologies used in this paper are as follows. First, this study adopts a meta-coupling framework, designating Henan Province as the focal system, the Central Urban Agglomeration as the adjacent system, and eight surrounding provinces as remote systems. Regional carbon sequestration was assessed using net primary productivity (NEP), while carbon emissions were evaluated based on per capita carbon emissions and population density. A carbon balance analysis integrated carbon sequestration and emissions. Hotspot analysis identified areas of carbon sequestration service supply and associated benefits. Ecological radiation force formulas were used to quantify service flows, and compensation values were estimated considering the government’s payment capacity and willingness. A three-dimensional evaluation system—incorporating technology, talent, and fiscal capacity—was developed to propose a diversified ecological compensation scheme by comparing supply and beneficiary areas. By modeling the ecosystem carbon sequestration service flow, the main results of this paper are as follows: (1) Within Henan Province, Luoyang and Nanyang provided 521,300 tons and 515,600 tons of carbon sinks to eight cities (e.g., Jiaozuo, Zhengzhou, and Kaifeng), warranting an ecological compensation of CNY 262.817 million and CNY 263.259 million, respectively. (2) Henan exported 3.0739 million tons of carbon sinks to external provinces, corresponding to a compensation value of CNY 1756.079 million. Conversely, regions such as Changzhi, Xiangyang, and Jinzhong contributed 657,200 tons of carbon sinks to Henan, requiring a compensation of CNY 189.921 million. (3) Henan thus achieved a net ecological compensation of CNY 1566.158 million through carbon sink flows. (4) In addition to monetary compensation, beneficiary areas may also contribute through technology transfer, financial investment, and talent support. The findings support the following conclusions: (1) it is necessary to consider the externalities of ecosystem services, and (2) the meta-coupling framework enables a comprehensive assessment of carbon sequestration service flows, providing actionable insights for improving ecosystem governance in Henan Province and comparable regions.

1. Introduction

Global climate change has become one of the most significant challenges to human development. The rise in global carbon dioxide concentrations has triggered a series of issues, including global warming and glacial melting, which pose major threats to society [1]. The Paris Agreement of 2015 established a goal of achieving net zero emissions by the latter half of this century, with 60 countries committing to this target by 2050 or earlier, as reported by the United Nations Framework Convention on Climate Change (UNFCCC). Closely associated with the “carbon peaking and carbon neutrality goals” is the concept of ecosystem carbon sequestration services, which refers to the benefits derived from the carbon sequestration process, wherein natural vegetation captures atmospheric CO2 through photosynthesis [2,3]. This process is crucial for mitigating climate change and fostering sustainable regional development [4].
Ecosystem carbon sequestration services represent a subset of ecosystem services, which include various products and benefits obtained directly or indirectly by humans from ecosystems [5]. Research on ecosystem services can inform the development of regional strategies for sustainable land use and ecosystem restoration [6]. In the context of increasing global pressure on natural resources, policymakers and land managers need to adopt sustainable solutions to ensure the long-term provision of essential ecosystem services [7]. Ecosystem service flow refers to the spatiotemporal transfer of ecosystem services from supply sources to benefit sinks, driven by both natural and anthropogenic factors. The supply source consists of ecosystems formed through interactions among organisms (plants, animals, and microorganisms) and abiotic components (light, heat, water, soil, and air), whereas the benefit sink represents areas where humans derive benefits from these ecosystems. Examining ecosystem service flow effectively links ecosystem service supply and regulation processes with spatial heterogeneity, dynamic demand, and functional diversity, which is vital for quantitatively assessing ecosystem services [8]. This assessment can provide targeted suggestions and references for ecosystem service planning. Based on the relationship between supply and demand across different spaces, ecosystem service flows can be categorized into four types [9,10], including in situ service, omnidirectional service flow, and directional service flow. At present, many scholars regard ecosystem carbon sequestration service flow as either omnidirectional [11,12] or directional [13]. The former assumes that carbon sequestration services exhibit omnidirectional flow influenced by atmospheric motion, while the latter suggests that carbon sources are linked to carbon sinks through atmospheric circulation, transferring services along specific wind directions. This study models ecosystem carbon sequestration service flows as omnidirectional.
Some researchers [14] have employed the ArcGIS10.8 software and fuzzy number simulation to calculate ecosystem service flows through various pathways. Numerous studies have explored ecosystem service flow using the ARIES system. For example, Zank [15] examined the effects of urban expansion on natural resource storage and ecosystem service flow in Puget Sound, Washington, using the ARIES platform. In this study, ARIES was used to quantify and model the baseline state of key ecosystem services in the study area and their response under land cover change scenarios. Nevertheless, most research on ecosystem service flows does not differentiate between intra-regional flows and those extending to external regions. For example, Zhai et al. [12] focused on ecosystem service flows within the Yellow River Basin, neglecting the contributions from external regions and the actual demand for ecosystem services from outside the basin, which results in an incomplete understanding of ecosystem service flows and hampers targeted ecosystem management [16]. This gap can be addressed through the application of the meta-coupling framework proposed by Liu [8], which includes human–nature interactions within the focal system (intra-coupling), between remote systems (tele-coupling), and between adjacent systems (peri-coupling). Through studying ecosystem service flow at varying scales, the meta-coupling framework elucidates the externalities of social, economic, and ecological interactions. The concept and framework of meta-coupling have been widely adopted by researchers and practitioners [17]. For instance, Herzberger [18] analyzed global food trade flows using a meta-coupled framework, while Merz et al. [19] applied it to cross-border river basin management, demonstrating its utility in analyzing transboundary rivers and the spillover effects within coupled human and natural systems (CHANSs). Zhang et al. [16] assessed ecosystem service flows in the Huangshui River Basin within the Tibetan Plateau using the meta-coupling framework, revealing that such a framework enables a comprehensive evaluation of ecosystem service flows across both adjacent and remote systems. However, the focus of the Huangshui River Basin study on the supply of ecosystem service flows failed to adequately consider regional differences in ecosystem service demand. By deducting local consumption, ecosystem carbon sequestration services manifest as either surplus or deficit, subsequently flowing from surplus areas to deficit areas, thereby forming carbon sequestration flows [20]. Thus, it is essential to integrate the supply and demand of regional ecosystem services and to explore the disparities between them to provide a locally relevant basis for regional development planning and decision making.
Regional variations in natural resources and socio-economic development frequently result in spatial disparities between regions with significant ecosystem service supply capabilities and those that consume these services [21]. Ecological compensation, which aims to ensure equity in social development, effectively addresses this issue. As a strategic tool to reconcile the tension between ecological preservation and economic growth, ecological compensation has been extensively applied both domestically and internationally [22,23,24].
At present, the predominant methods for establishing compensation standards in China include the water footprint method [25], opportunity cost method [26], ecological footprint method [27], and ecosystem service value method [28]. Among these, the ecosystem service value method is frequently utilized due to its reduced susceptibility to researcher bias during the calculation process [29]. This method theoretically maximizes ecological benefits [30]. However, it relies on the quantification of ecosystem service compensation generated by nature without considering regional disparities in economic and social development, as well as the varying payment capacities and intentions of local governments. The Regulations on Ecological Protection Compensation clarify that the term “ecological protection compensation” refers to incentive structures designed to compensate entities and individuals engaged in ecological protection as stipulated by regulations or agreements. These arrangements may include financial vertical compensation, inter-regional horizontal compensation, market mechanism compensation, and other mechanisms. As an incentive mechanism, ecological compensation does not strictly equate to the replacement of natural resources with monetary value. Ignoring local capacities to accommodate ecological compensation may exacerbate regional disparities. In recent years, with the maturation of the carbon trading market, the unit price method—characterized by a relatively complex calculation process—has gained popularity for determining the compensation value of carbon sequestration services [11], enabling a more precise economic valuation based on market prices.
This study aims to establish a carbon compensation standard system of “one area, one price” through quantitative analysis of the social and economic development levels within the study area. At present, government financial compensation remains the predominant form of ecological compensation in China. Although this approach is efficient, it also exhibits a degree of dependency and a lack of sustainability. Therefore, the exploration of diversified compensation methods is increasingly recognized as necessary.
This study addresses the limitations of existing research and optimizes the following aspects: (1) concurrently evaluating the supply and demand of carbon sequestration services to more accurately identify the flow of these services; (2) accounting for the externalities of carbon sequestration services to minimize errors arising from external service flows; and (3) considering variations in willingness and ability to pay, technological advancement, and talent availability across regions to develop scientifically grounded ecological compensation payment standards and diversified compensation schemes.
Henan Province, a pivotal area for population, agriculture, industry, and energy consumption in China, has a substantial carbon emission footprint. Additionally, Henan serves as the core of the Central Urban Agglomeration, exerting significant influence due to its geographical position and area. This geographic context has led to the formation of a ring structure comprising “Henan Province—Central Urban Agglomeration—Surrounding Provinces”. Utilizing the meta-coupling framework, we can systematically analyze the interactions of ecosystem carbon sequestration services between Henan Province and the outer ring, which is crucial for promoting carbon emission reduction and regional coordinated development. Therefore, this study focuses on Henan Province as the central system of the meta-coupling framework, the Central Urban Agglomeration as the adjacent system, and the eight surrounding provinces as the remote system, conducting research on ecosystem carbon sequestration service flows. The study’s objectives include the following: (1) identifying the supply and benefit areas of carbon sequestration services in Henan Province and its neighboring provinces; (2) quantifying the flow of carbon sequestration services among Henan Province, the Central Urban Agglomeration, and nearby provinces while analyzing its direction; (3) determining the ecological compensation amounts between cities within Henan Province and between provinces; and (4) identifying diversified ecological compensation methods supported by quantitative evaluation indices.

2. Materials and Methods
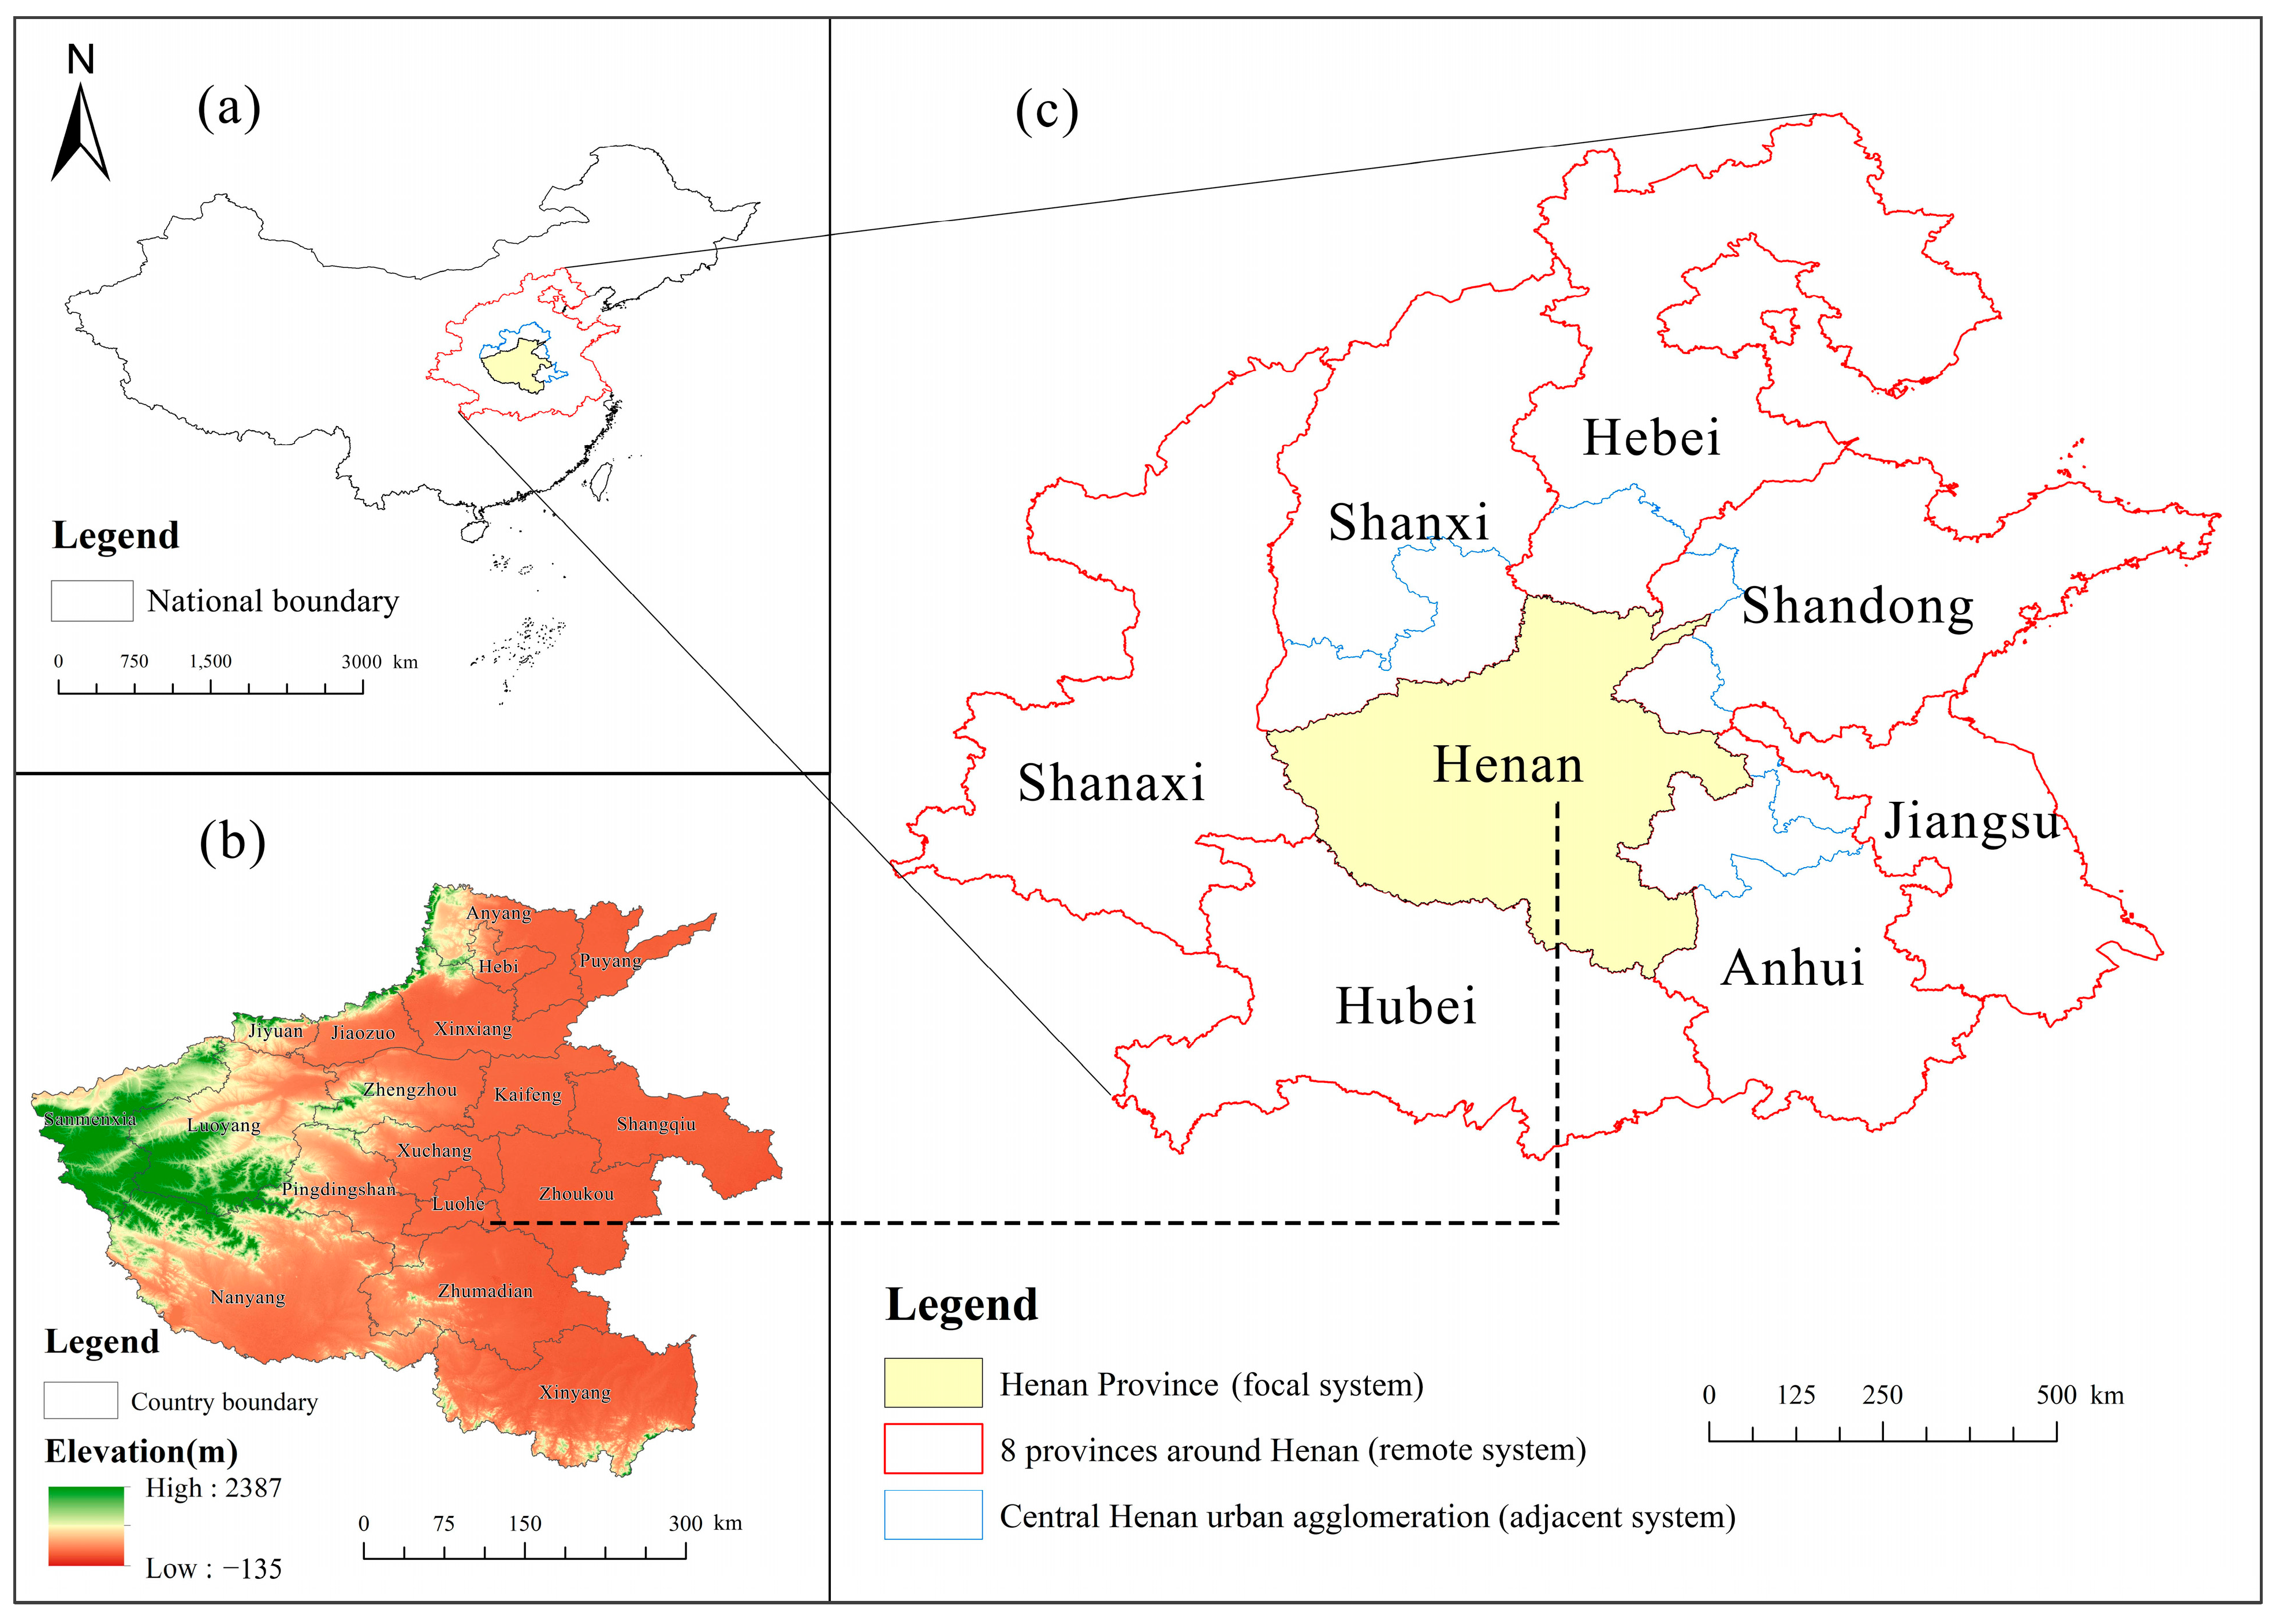
2.1. Study Area

The study area includes the focal system, adjacent system, and remote system (Figure 1). Henan Province (focal system) is located in the central and eastern regions of China, spanning latitudes 31°23′ to 36°22′ north and longitudes 110°21′ to 116°39′ east, covering a total area of approximately 167,000 km2. It comprises 18 cities and 103 counties and features convenient transportation networks. In 2021, Henan Province’s GDP reached CNY 5.81 trillion, accounting for 5.15% of the national GDP, while its resident population totaled 98.83 million, representing 7.0% of the national population. The Central Urban Agglomeration (adjacent system) consists of 30 prefecture-level cities across five provinces, covering a land area of 287,000 km2 and supporting a permanent population of 163 million, which accounts for 11.54% of the national population and CNY 8.87 trillion or 7.75% of the national GDP. Zhengzhou, one trillion-class city, serves as the core of this urban agglomeration. The Central Urban Agglomeration is characterized by its proximity to major cities such as Beijing, Wuhan, Jinan, and Xi’an, within a radius of 500 km, featuring the largest urban group, densest population, robust economic strength, rapid industrialization, high urbanization levels, and significant transportation advantages. Henan Province is bordered by eight provinces: Hebei, Shaanxi, Shanxi, Hubei, Anhui, Jiangsu, and Shandong (remote system). In 2021, the combined population of Henan Province and its eight neighboring provinces reached 553.83 million, accounting for 39.21% of the national population and 38.83% of the national GDP. Henan Province has a variety of land types, ranging from forests and waters that have a positive effect on the ecosystem to urban areas that are extremely densely populated. At the same time, it connects the more economically developed provinces in the east, such as Jiangsu Province, with the mountainous provinces in the west. This unique geographical location makes it very suitable for research and analysis using the meta-coupling framework.
The entire scope of this study is the Henan Province and the neighboring provinces, while the core area is the Henan Province. The three systems delineated by the meta-coupling framework are used to comprehensively and systematically explore the interactions of carbon sequestration service flows within and between the internal and external parts of Henan Province.

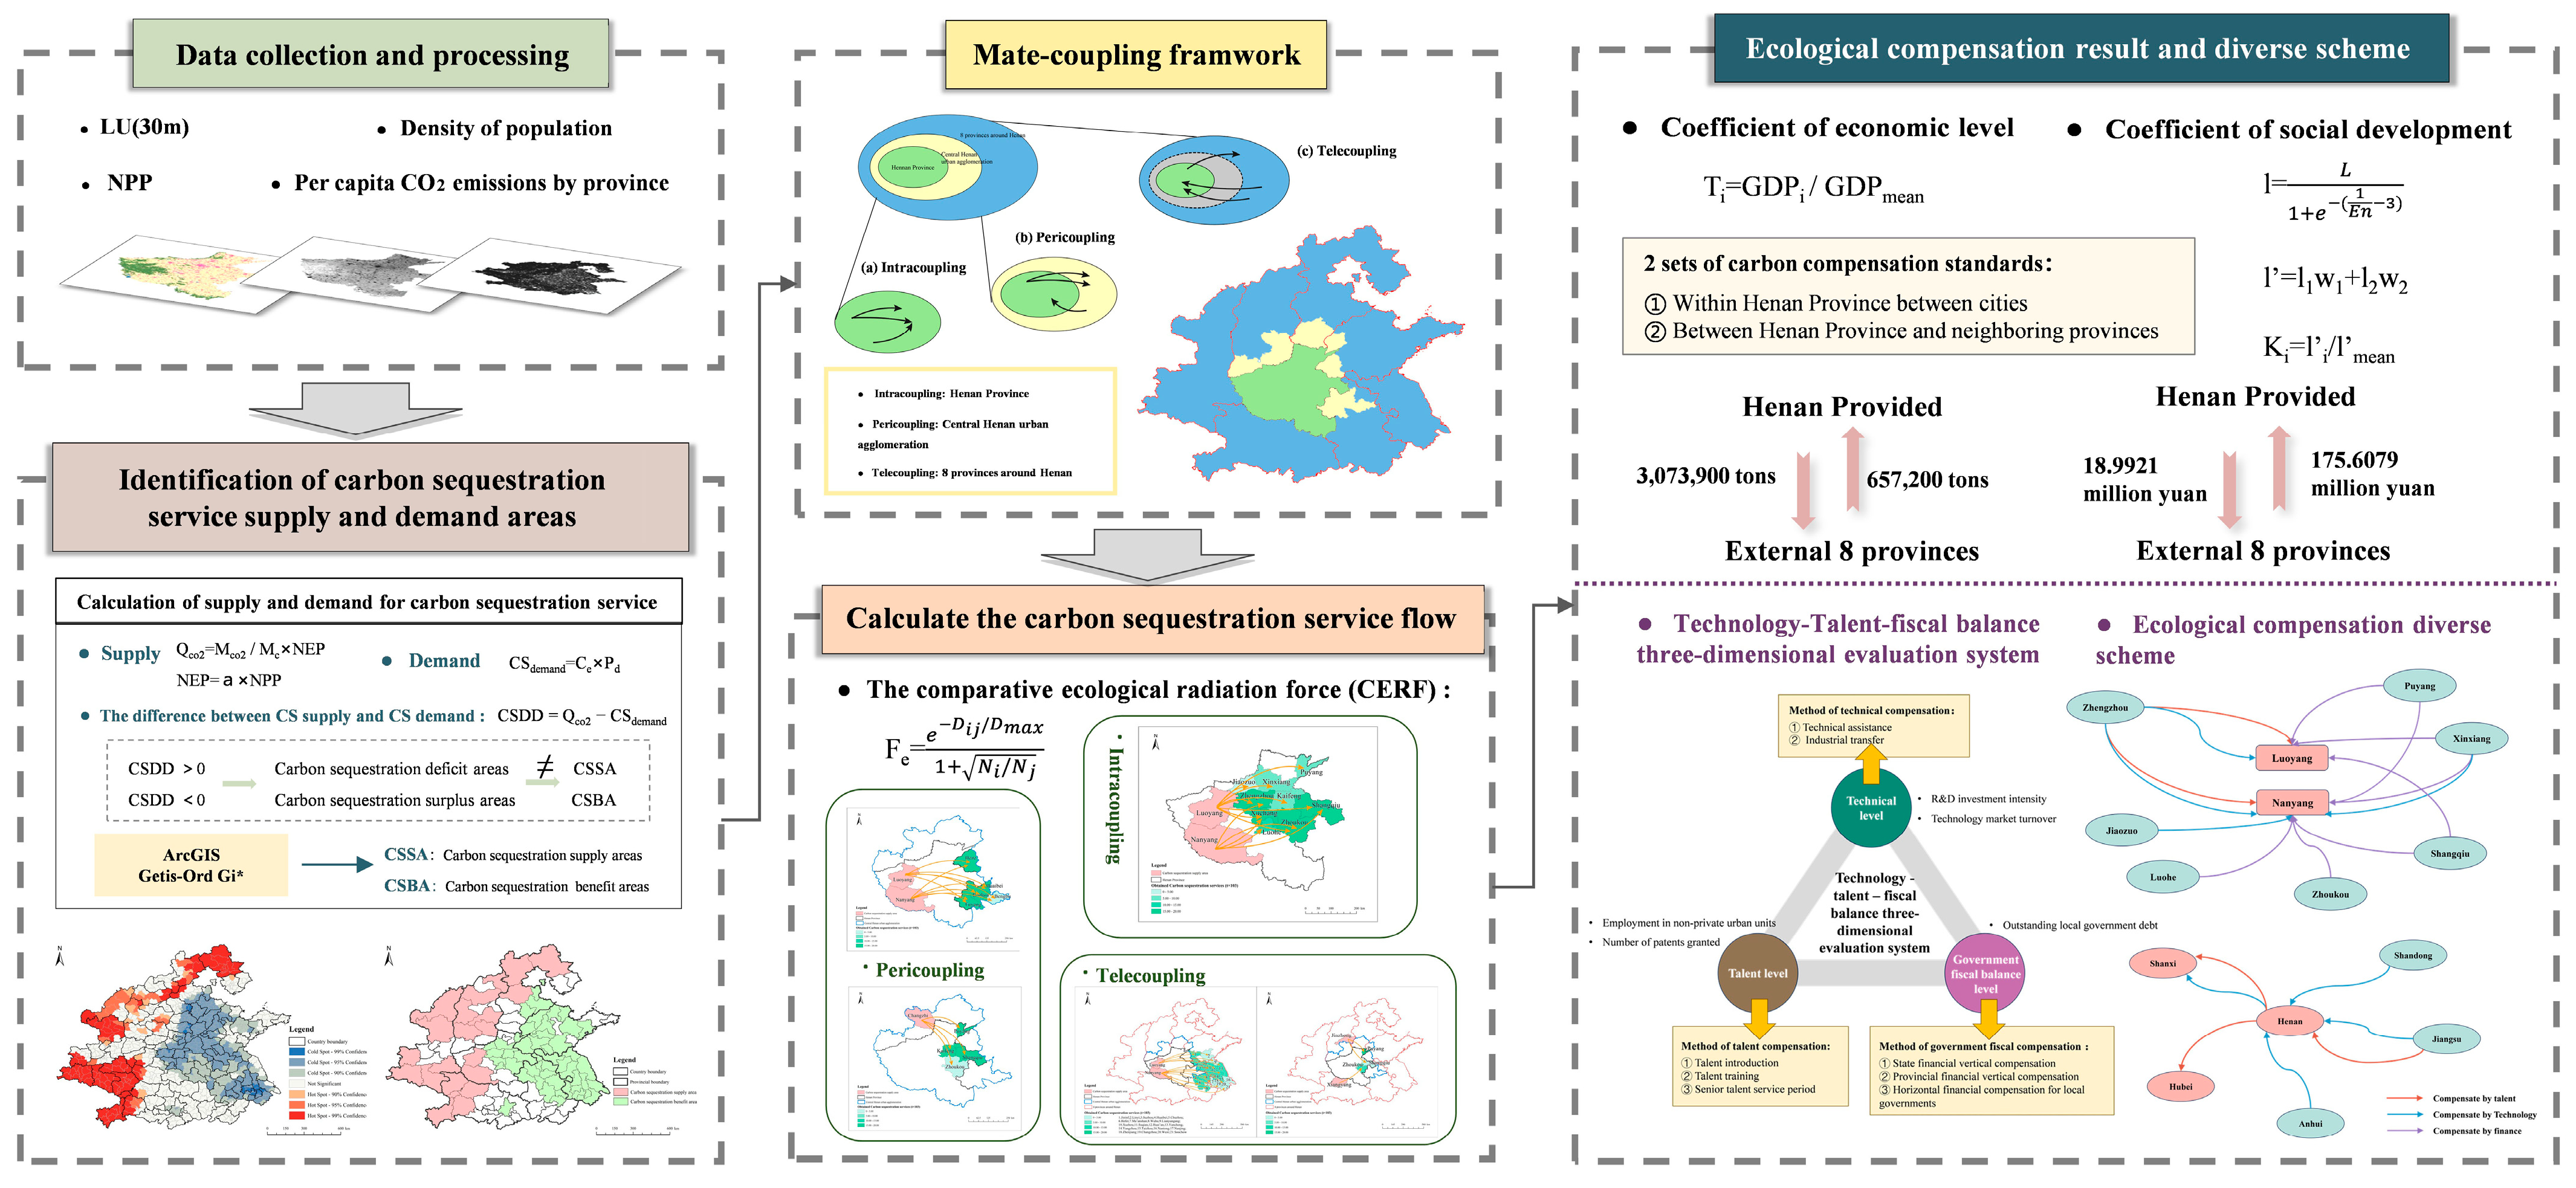
2.2. Data Collection and Processing

The study utilizes land use data from Wuhan University, specifically from the dataset released by Professors Yang and Huang (https://zenodo.org/records/12779975, accessed on 15 November 2024), with a resolution of 30 m. This dataset categorizes land use into nine types: farmland, forest, shrub, grassland, water, ice and snow, bare land, impervious surface, and wetland. Population density data are sourced from the WorldPop dataset (https://www.worldpop.org/, accessed on 22 November 2024), which provides the most accurate population density figures at a resolution of 100 m. Data on per capita carbon emissions in China are obtained from the Chinese Urban Greenhouse Gas Working Group (https://lca.cityghg.com/, accessed on 6 December 2024), including carbon emissions from energy, industry, transportation, domestic, and other sectors. NPP (MOD17A2H) data are accessed from the MODIS official website (https://modis.gsfc.nasa.gov/, accessed on 28 December 2024). Elevation, temperature, precipitation, and administrative boundary data are sourced from the Resources and Environmental Science and Data Center (https://www.resdc.cn, accessed on 28 December 2024). The conversion coefficient between NEP and NPP is referenced from the Technical Guide for the Gross Land Ecosystem Product (GEP) Accounting (https://rcees.cas.cn/, accessed on 2 February 2025). GDP, Engel coefficient, population, and employment data are compiled from China’s Economic and Social Big Data Research platform (https://data.cnki.net/, accessed on 17 February 2025). All spatial data are standardized to an Albers projection with a spatial resolution of 1 km. Based on data accessibility, all data are taken from 2021.

2.3. Studying Route

The technical approach of this study comprises three main components (Figure 2). The first component employs the NEP method and per capita emission method to calculate carbon sequestration and emissions in the study area, identifying carbon sequestration service supply areas (CSSAs) and carbon sequestration service benefit areas (CSBAs) through hotspot analysis. The second component introduces the meta-coupling framework to examine carbon sequestration service flows between systems at varying levels. In the focal system (Henan Province), this study focuses on the ecosystem carbon sequestration flows between the municipalities within the region. Then, it examines the ecosystem carbon sequestration flows from the focal system to the adjacent system (Central Henan Urban Agglomeration) and from the adjacent system (Central Henan Urban Agglomeration) to the focal system (Henan Province). Finally, it examines the ecosystem carbon sequestration flows from the focal system to the remote system (provinces around Henan Province) and from the remote system (provinces around Henan Province) to the focal system (Henan Province). By exploring these three different geographic circles, the ecosystem carbon sequestration flows between the internal and between the internal and external parts of the focal system can be comprehensively and systematically grasped. Using this method, the supply and benefit areas of carbon sequestration services can be clarified and used as a basis for subsequent ecological compensation. The third component addresses the adjustment of the monetary valuation of ecosystem carbon sequestration services and formulating diversified compensation schemes. This adjustment is achieved by multiplying the economic level coefficient and social development coefficient, leading to the establishment of two sets of standards: one for within Henan Province and another for interactions between Henan Province and its neighbors. The latter seeks a more diversified ecological compensation scheme through the establishment of a three-dimensional evaluation system focused on technology, talent, and fiscal balance. To visualize the supply and benefit areas of carbon sequestration services and facilitate the subsequent development of eco-compensation, the basic observation units in this study are prefecture-level cities.

2.4. Quantification of Supply and Demand

This study employs ecosystem net productivity (NEP) as a metric to quantify carbon sequestration services. The net primary productivity (NPP) is converted to NEP based on land use type using a conversion coefficient derived from the Technical Guide for Gross Terrestrial Ecosystem Product (GEP) Accounting. Subsequently, NEP is transformed into the supply of carbon sequestration services [31,32]. The demand for carbon sequestration services is expressed in terms of annual carbon emissions, calculated by multiplying per capita carbon emissions data by population density.
The formula for calculating carbon sequestration service supply is as follows:
Qco2 = Mco2/Mc × NEP
Among them, Qco2 is the carbon sequestration of terrestrial ecosystems (t·CO2·a−1), Mco2/Mc is the molecular mass ratio of CO2 to C (is 44/12), and NEP is net ecosystem productivity (t·C·a−1).
The NEP value is calculated based on NPP, and the formula is as follows:
NEP = a × NPP
where a is the conversion coefficient between NEP and NPP, which can be sourced from the Research Center of Eco-Environmental Sciences, Chinese Academy of Sciences (https://rcees.cas.cn/, accessed on 2 February 2025). In this study, the 30 m land use data from Wuhan University are utilized, with each land class assigned a relative conversion coefficient α via the “Reclassify” tool in ArcGIS. For example, the values for forest, shrub, grassland, and wetland in Henan Province are 0.208, 0.200, 0.173, and 0.062, respectively. NEP is then calculated by multiplying NPP using the “Raster Calculator” tool in ArcGIS.
The formula for calculating the demand for carbon sequestration services is as follows:
CSdemand = Ce × Pd
where CSdemand is the demand for carbon sequestration services, Ce is the per capita carbon emission (t/pop), and Pd is the population density (pop/km2).
To elucidate the relationship between the supply and demand of ecosystem carbon sequestration services, the difference between carbon sequestration service supply and demand (CSDD) is computed. When CSDD > 0, the region is classified as a surplus area; conversely, it is designated as a deficit area. The formula is as follows:
CSDD = Qco2CSdemand

2.5. Determination of the Carbon Sequestration Supply Zone and Benefit Zone

The existing literature [33] indicates that neglecting spatial autocorrelation in studies of ecosystem services may result in the misidentification of the roles of supply and demand. Therefore, in this study, the “Getis-Ord Gi*” tool in ArcGIS is employed to identify regions of significant statistical significance (hot and cold spots), leading to the determination of supply and benefit areas for carbon sequestration services. The criteria are as follows: cities with two or more hot spots are identified as supply areas, whereas cities with two or more cold spots are recognized as beneficiary areas. Cities with CSDD ≥ 0 are excluded from being designated as beneficiary areas. Cities exhibiting both cold and hot spot counties are manually assessed based on the positive and negative CSDD values, as well as the area ratio of these spots.

2.6. Flow Modeling

The first law of geography asserts that spatial relationships exist, with proximity enhancing correlation; as distance increases, correlation diminishes. This concept parallels distance decay, where increased distance results in higher consumption in the flow, thereby diminishing the quantity of ecosystem services reaching the beneficiary area. Accordingly, this study introduces the comparative ecological radiation force (CERF) formula, which merges the gravity model with the breaking point formula, suggesting that the external influence of carbon sequestration services correlates with the distance between regions [34] and their effect on carbon sequestration services [35]. The formula is as follows:
F e = e D i j / D m a x 1   +   N i / N j
where Fe is the eco-radiant force, Dij is the distance between CSSA j and CSBA i, Dmax is the maximum distance between CSSA j and CSBA i, and Ni and Nj are the carbon sequestration service quantity of CSBA i and CSSA j, respectively.
By calculating the ecological radiation force, the proportion of carbon sequestration service quality received by a particular benefit area from the supply area can be determined. The total carbon sequestration service acquired by a benefit area is derived by multiplying this proportion by the surplus of the corresponding supply area. The total carbon sequestration service obtained by the benefit area is calculated by summing all flow quantities. It should be noted that this study assumes that carbon sequestration services are preferentially supplied from the nearest region. Once a benefit area meets its demand (CSDD = 0), it ceases to receive further supply. This assumption facilitates the determination of the minimum compensation required by each benefit area in subsequent ecological service compensation calculations.

2.7. Compensation Valuation

Given the varying economic development and social conditions across regions, as well as differing governmental willingness and capacity to fund ecological compensation, this study incorporates an economic level coefficient and a social development coefficient to adjust the monetary amounts of compensation paid by beneficiary areas for carbon sequestration services. The formula is as follows:
Eij = Vij × Pc × Ti × Ki
where Eij is the amount of ecological compensation that beneficiary area i needs to pay to supply area j, Vij is the amount of carbon sequestration service that supply area j inputs to beneficiary area i, and Pc is the market price of China C in 2021, which is set at 48 CNY/ton with reference to China Carbon Price Survey Report in 2021. Ti is the coefficient of economic level, and Ki is the coefficient of social development.
The formula for economic level coefficient is as follows [36]:
Ti = GDPi/GDPmean
where GDPi is the per capita GDP of the city corresponding to the beneficiary area i, and GDPmean is the per capita GDP of the study area.
The formula for social development coefficient is as follows [37]:
l   =     L 1 + e ( 1 E n 3 )
l′ = l1w1 + l2w2
Ki = li/lmean
where l is the social development coefficient related to the actual willingness to pay (WTP), L is the WTP (=1) of people under extremely rich conditions, e is the natural constant, and En is the Engel coefficient. Here, l1 and l2 are the social development coefficients of urban and rural areas in a certain beneficiary area i, respectively, and w1 and w2 are the proportions of urban and rural population in the beneficiary area i. In addition, li is the social development coefficient of the beneficiary area i, and lmean is the average social development coefficient of the study area.
The ecological compensation standard is divided into two components: compensation between cities within Henan Province and compensation between Henan Province and other provinces. Therefore, the economic level and social development coefficients will be adjusted separately for research involving Henan Province and its neighboring regions.

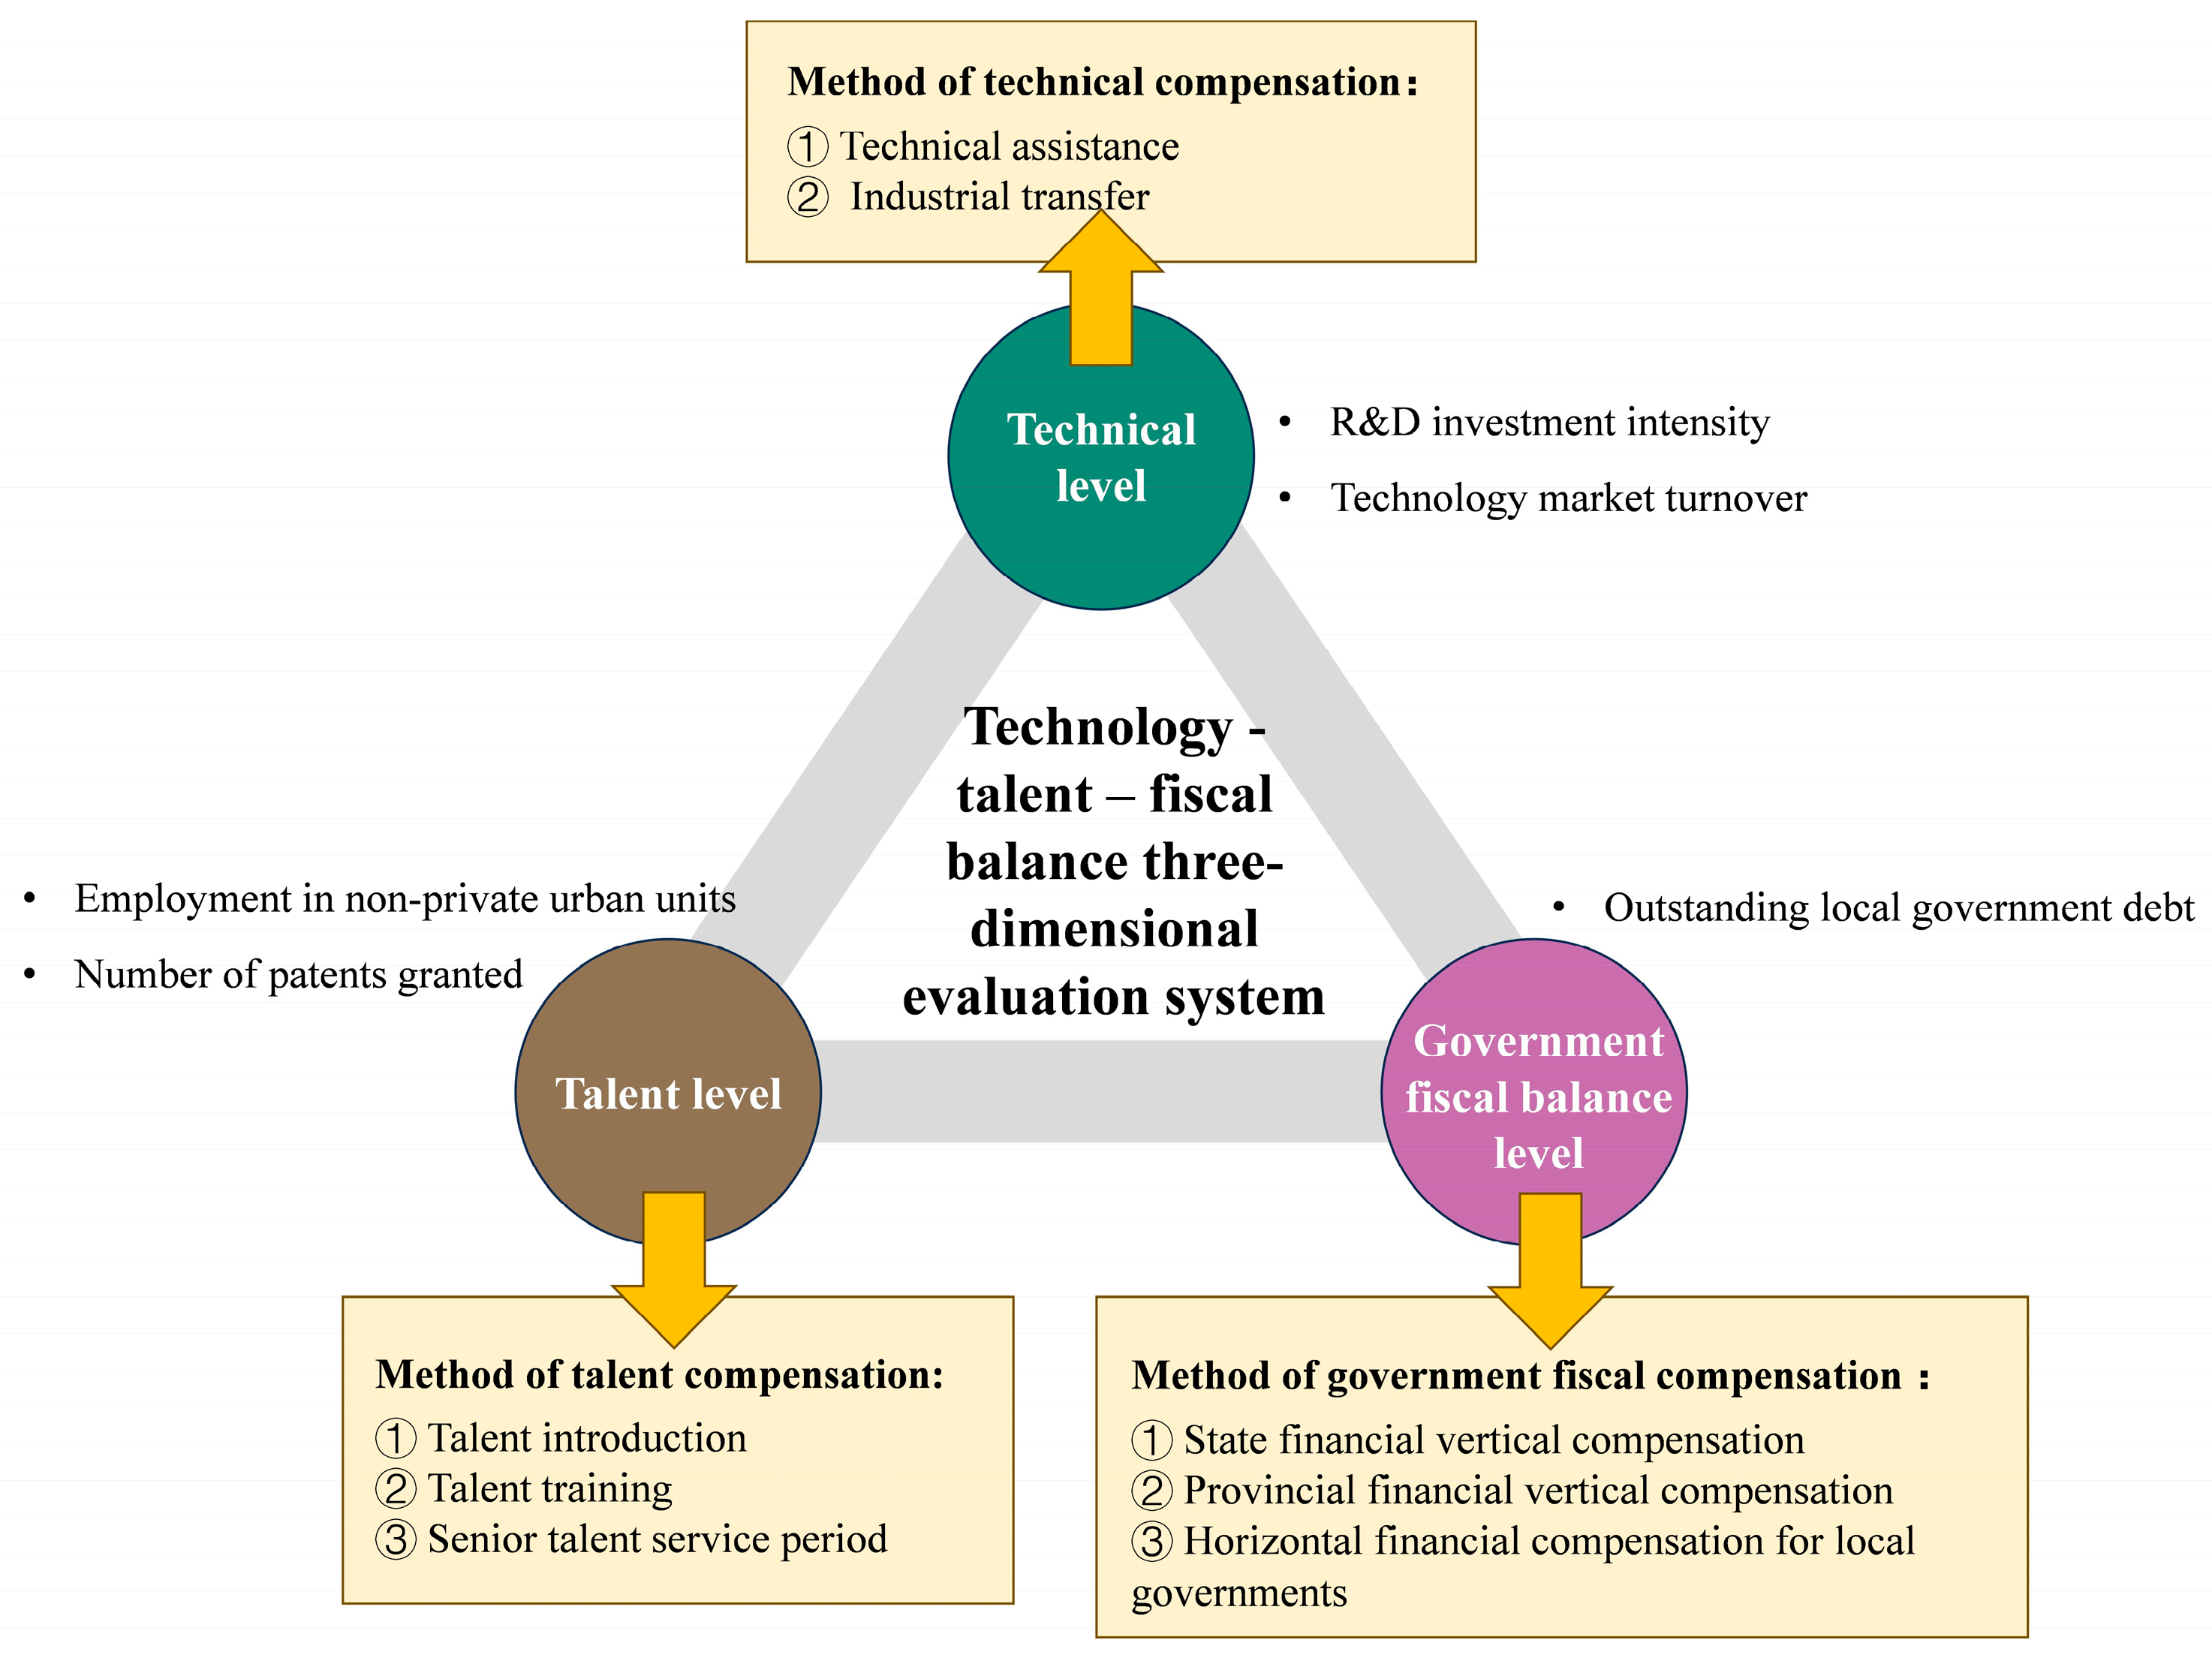
2.8. Compensation Strategy Development

At present, there are two primary approaches for implementing ecological compensation in our country. The first includes government-led ecological compensation facilitated by administrative mechanisms, and the second involves compensation achieved through market mechanisms and voluntary trading among relevant stakeholders. The compensation amount estimated in this study pertains to the first type of government transfer payment, which serves as the principal source of ecological compensation funding. However, this compensation method faces numerous challenges, including the lack of sustainability in compensation schemes, with funds often not being disbursed after the completion of ecological engineering projects, thereby hindering the establishment of long-term compensation effects. Therefore, it is essential to explore diversified ecological compensation strategies. This study proposes a three-dimensional evaluation system including technology, talent, and financial balance. The weight of each dimension is equal to one-third, with specific evaluation indicators detailed in Table 1.
The technology, talent, and fiscal balance levels for each region are obtained using normalized calculations of these indicators. By comparing the technical, talent, and financial burdens between CSSAs and benefit areas (CSBAs), appropriate ecological compensation pathways are given (Figure 3).

3. Results

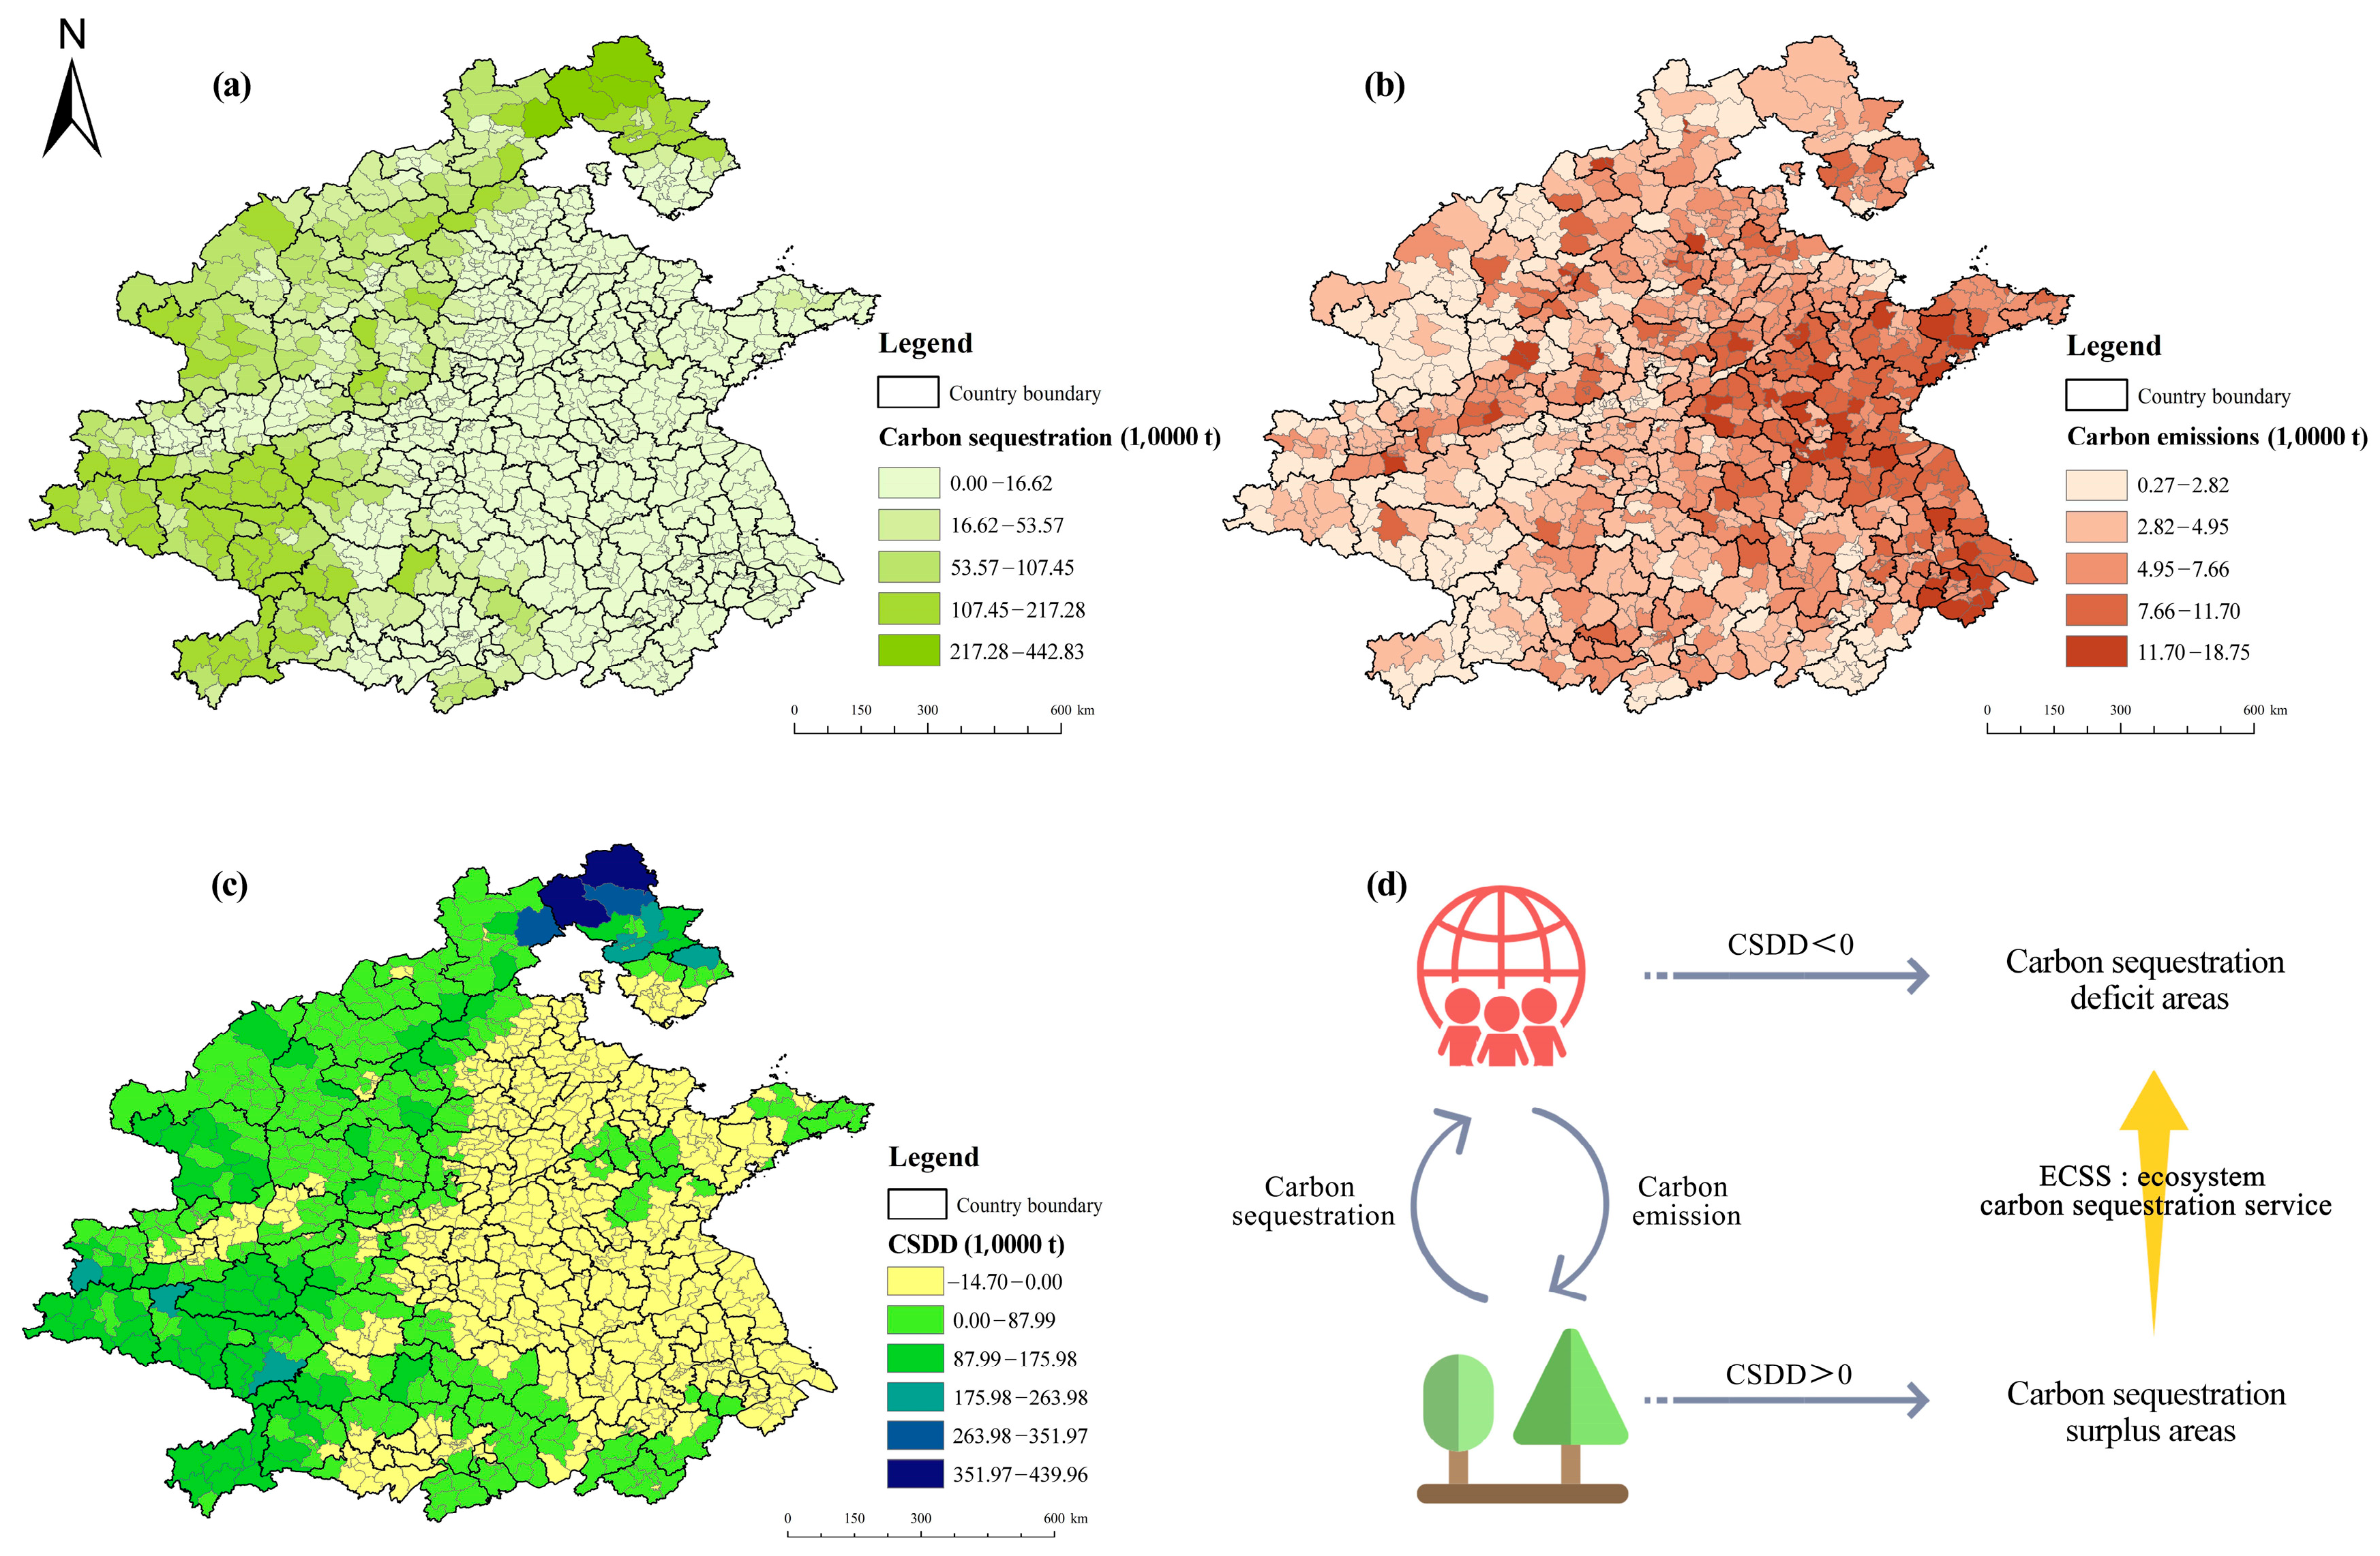
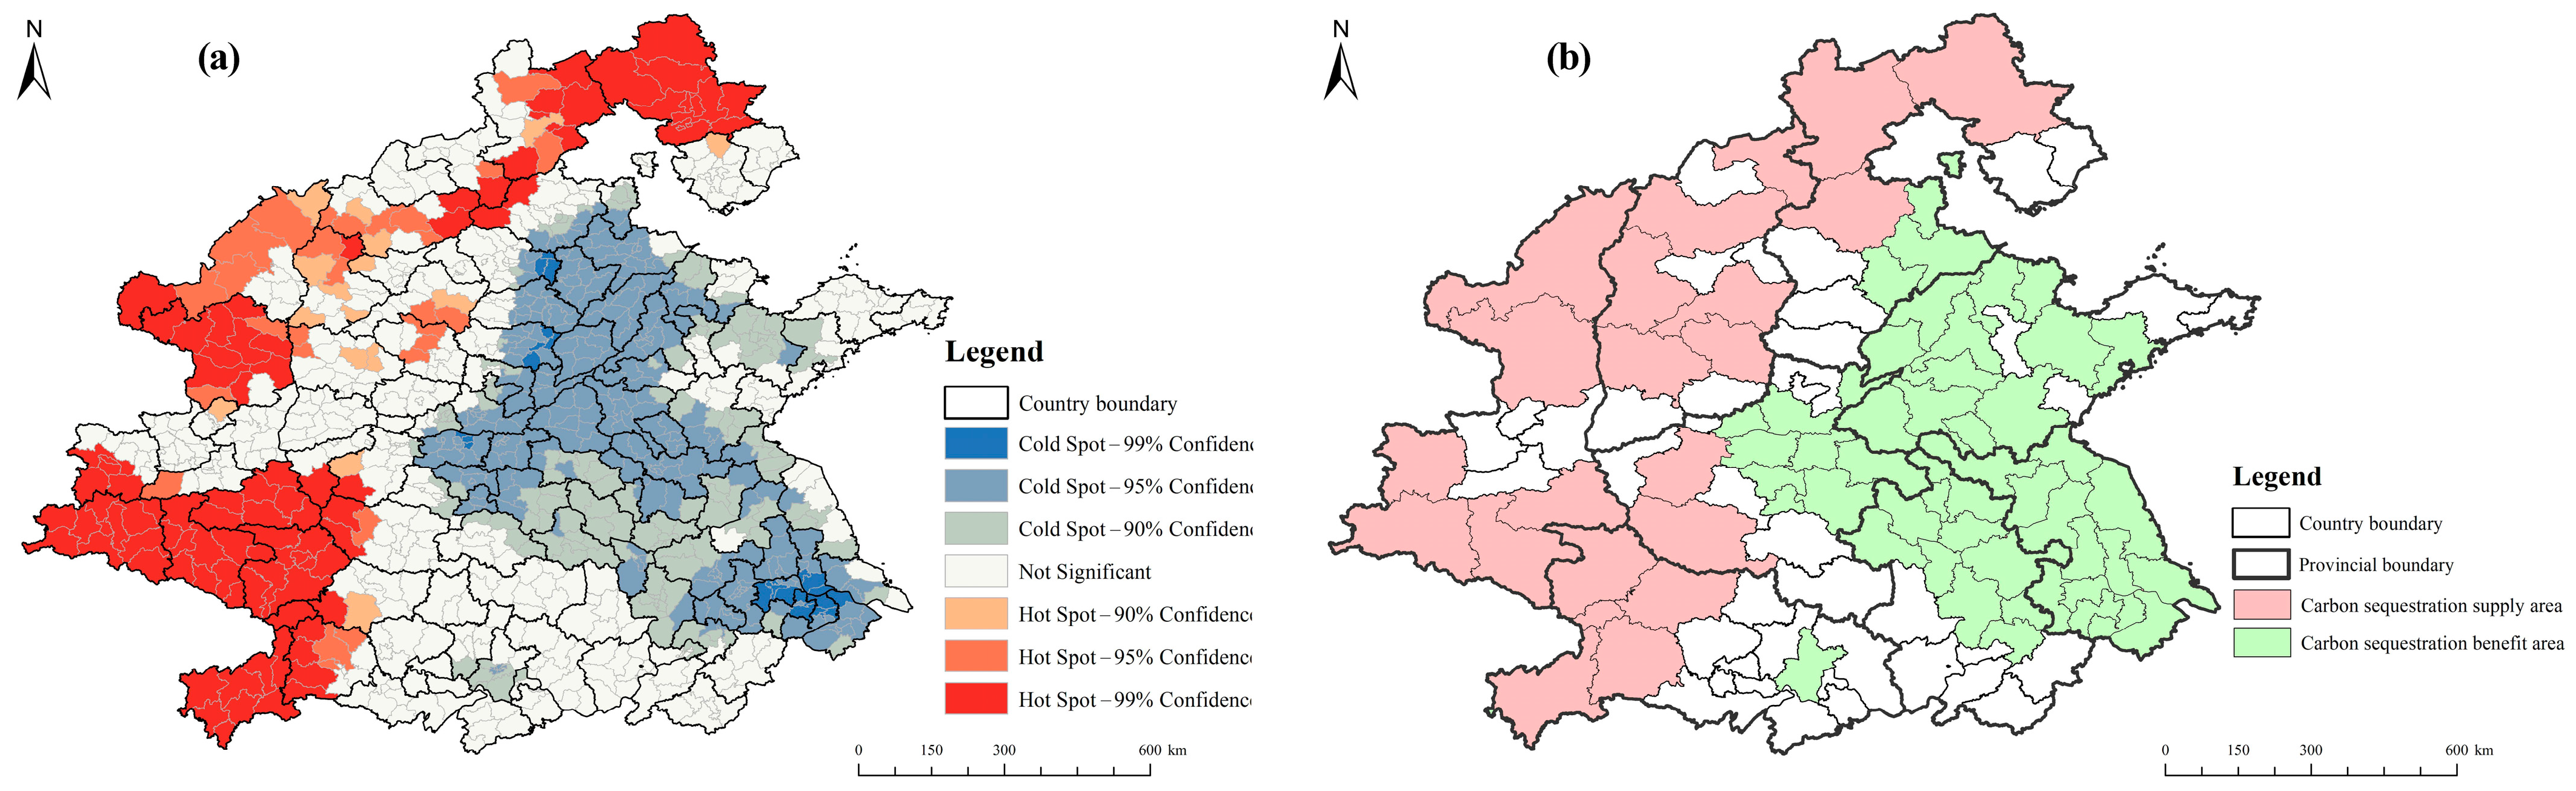
3.1. Spatial Distribution of Ecosystem Carbon Sequestration Services

The carbon supply (carbon sequestration) and carbon demand (carbon emissions) of Henan Province and its surrounding provinces are depicted in Figure 4. The spatial disparities between the two are evident. High-value carbon supply areas are located in Shanxi, Shaanxi, and parts of Hebei, Henan, and Hubei provinces. In contrast, high-value carbon demand areas are concentrated in Shandong and Jiangsu provinces, as well as in highly urbanized regions of each province, such as provincial capitals. Overall, the western region exhibits a greater carbon supply but a lower carbon demand, whereas the eastern region shows a reduced carbon supply coupled with a high carbon demand. The spatial distribution of carbon supply and demand is significantly unbalanced, illustrating a mismatch between the two. As illustrated in (Figure 4), the distribution of CSDD parallels that of carbon supply, with the yellow areas indicating counties that are deficit regions for carbon sequestration services, while the remainder are surplus areas.

3.2. Carbon Sequestration Service Supply Area and Benefit Area

To identify spatially significant actual carbon sequestration supply and benefit areas, the “hot spot analysis” tool in ArcGIS was utilized to determine the significance level of each county. Following the criteria outlined in the Methodology section, service supply areas and beneficiary areas were selected, as shown in Figure 5.

3.3. Carbon Sequestration Service Flow Based on Meta-Coupling Framework

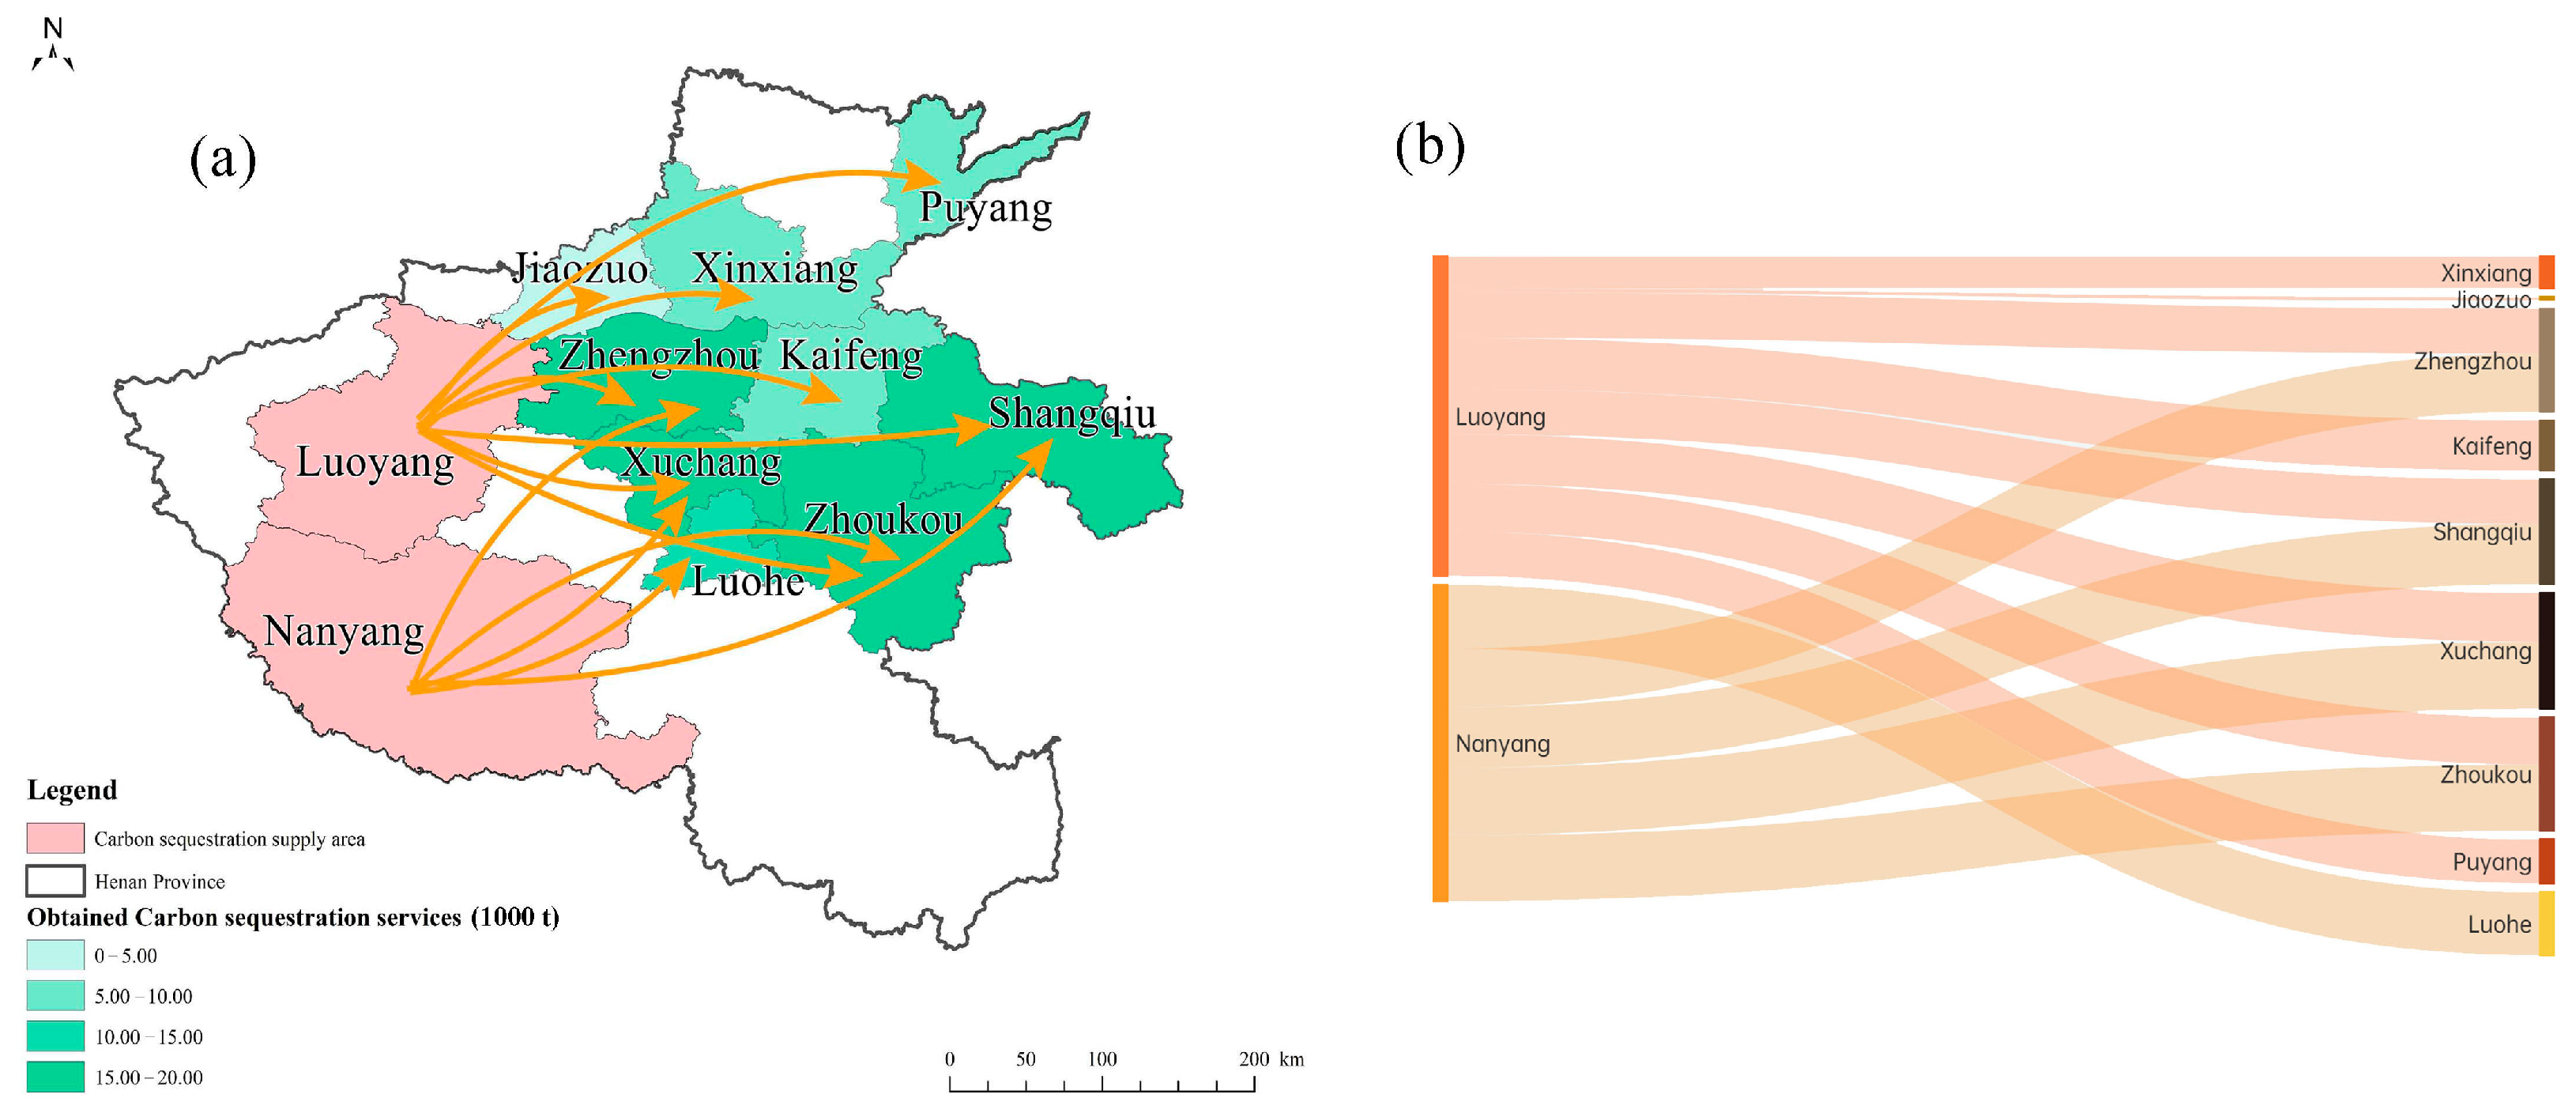
3.3.1. Intra-Coupling

In the internal system of Henan Province, Luoyang and Nanyang serve as CSSAs, located in the southwest of the province. Carbon sequestration service beneficiary areas, including Xinxiang, Jiaozuo, Zhengzhou, Kaifeng, Puyang, Shangqiu, Zhoukou, Luohe, and Xuchang, are concentrated in central, northern, and eastern Henan Province. The nine beneficiary areas collectively received a total of 1.0369 Mt of carbon sequestration services from Luoyang and Nanyang, with Xuchang receiving the largest amount of 189,600 tons, and Jiaozuo City receiving the least amount of 60,400 tons (Figure 6).

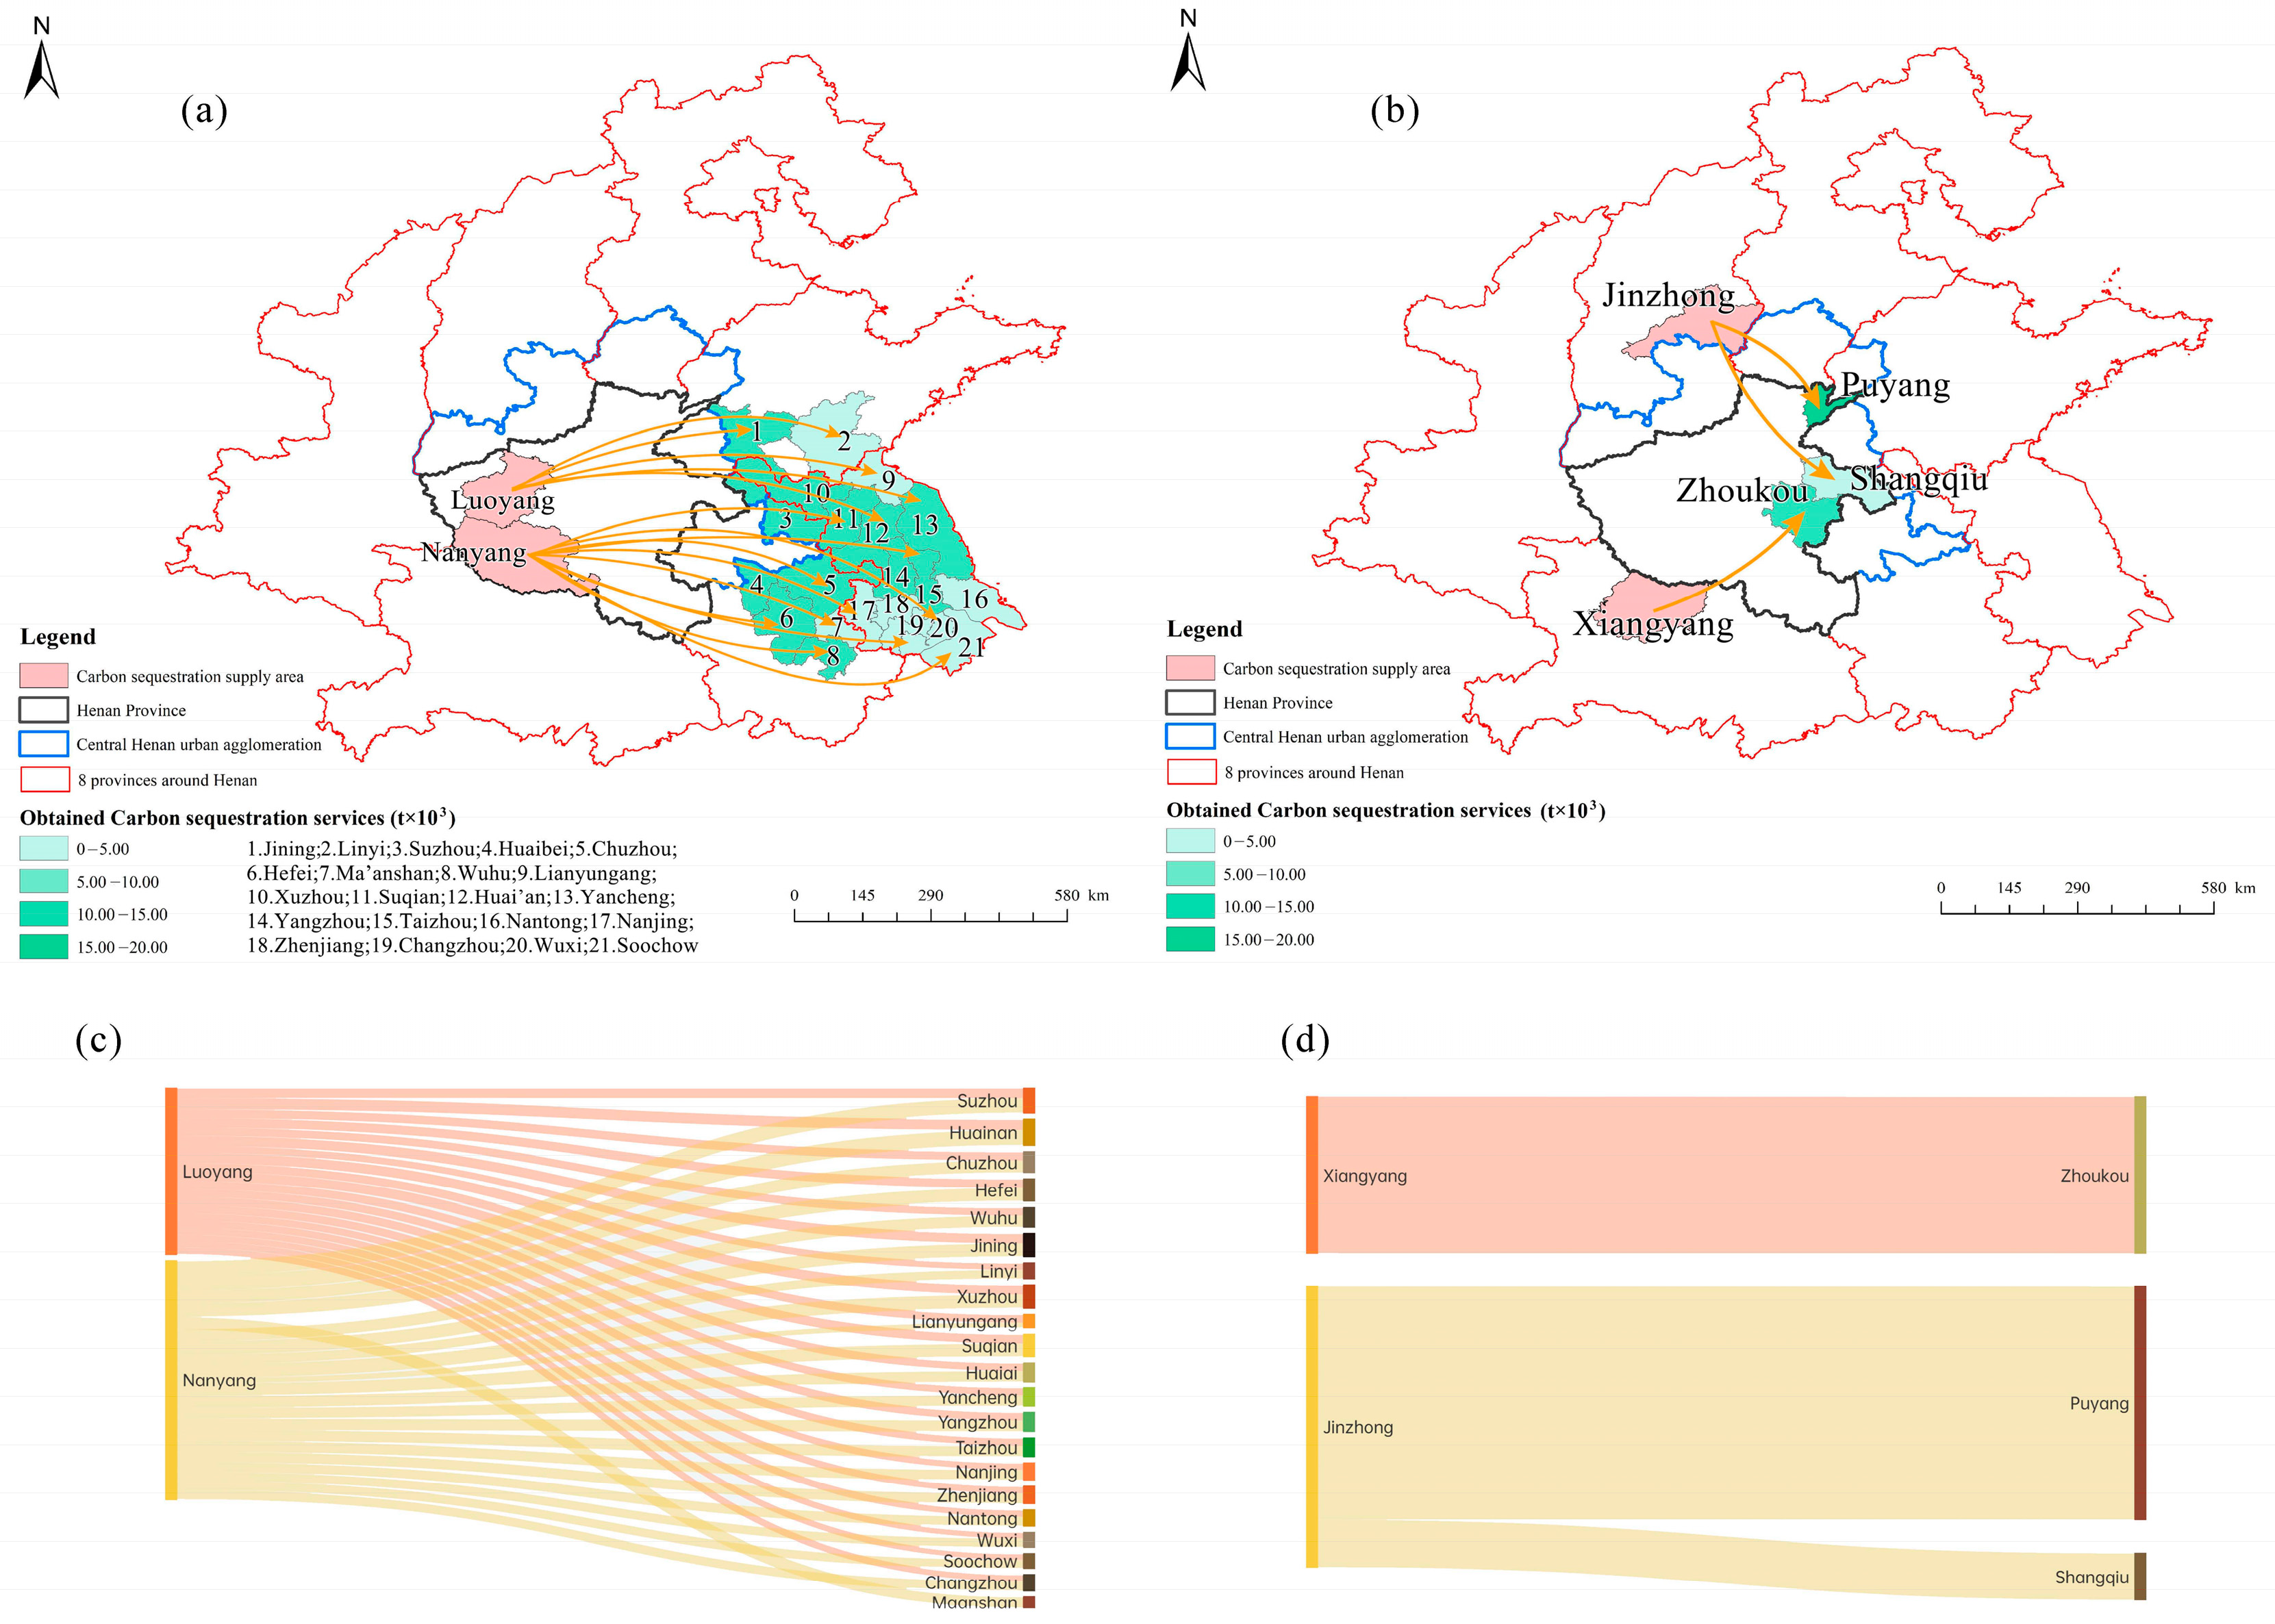
3.3.2. Peri-Coupling

The carbon sequestration supply area in Henan Province provided a total of 799,300 tons of carbon sequestration services to the beneficiary areas of neighboring systems (Heze, Bengbu, Huaibei, Bozhou, and Fuyang). The adjacent Changzhi, as a carbon sequestration supply area, contributed 398,500 tons of carbon sequestration services to Zhoukou, Shangqiu, Puyang, and Kaifeng in Henan Province (Figure 7). The two internal carbon sequestration supply areas, Luoyang and Nanyang, supplied carbon sequestration services to beneficiary areas in the adjacent system, with Nanyang supplying a greater volume than Luoyang.

3.3.3. Remote Coupling

The carbon sequestration supply area within Henan Province delivered 2.2746 Mt of carbon sequestration services to the beneficiary area of the remote system, which includes 21 cities such as Suzhou, Huainan, Chuzhou, and Ma’anshan. In the remote system, Xiangyang and Jinzhong, as carbon sequestration supply areas, provided 166,200 tons of carbon sequestration services to Zhoukou, Shangqiu, and Puyang in Henan Province (Figure 8). Ma’anshan exclusively receives carbon sequestration services from Nanyang, whereas other beneficiary areas receive supplies from both Luoyang and Nanyang.

3.4. Monetary Value of Ecological Compensation

Based on the coefficients of economic level and social development, this study revises the payment capacity and willingness of each region to establish a feasible compensation amount for carbon sequestration services. This compensation is categorized into internal compensation within Henan Province and inter-provincial compensation between Henan Province and neighboring provinces. The compensation amounts payable by each beneficiary area are presented in Table 2. Within Henan Province, Luoyang City has provided ecosystem carbon sequestration services to eight cities, including Xinxiang, Jiaozuo, Zhengzhou, and Kaifeng, and is entitled to receive a total of CNY 26.2817 million in ecological compensation from these cities. Nanyang City, along with a few beneficiary cities (Luohe, Zhengzhou, Shangqiu, Xuchang, and Zhoukou), should receive a total of CNY 26.3259 million in ecological compensation. Between provinces, Henan Province functions as both a supply area and a beneficiary area. As a supply area, Henan Province is entitled to CNY 175.6079 million in ecological compensation from Shandong, Anhui, and Jiangsu provinces; as a beneficiary area, it is responsible for providing an ecological compensation of CNY 16.9378 million to Shanxi Province and CNY 2.0543 million to Hubei Province.

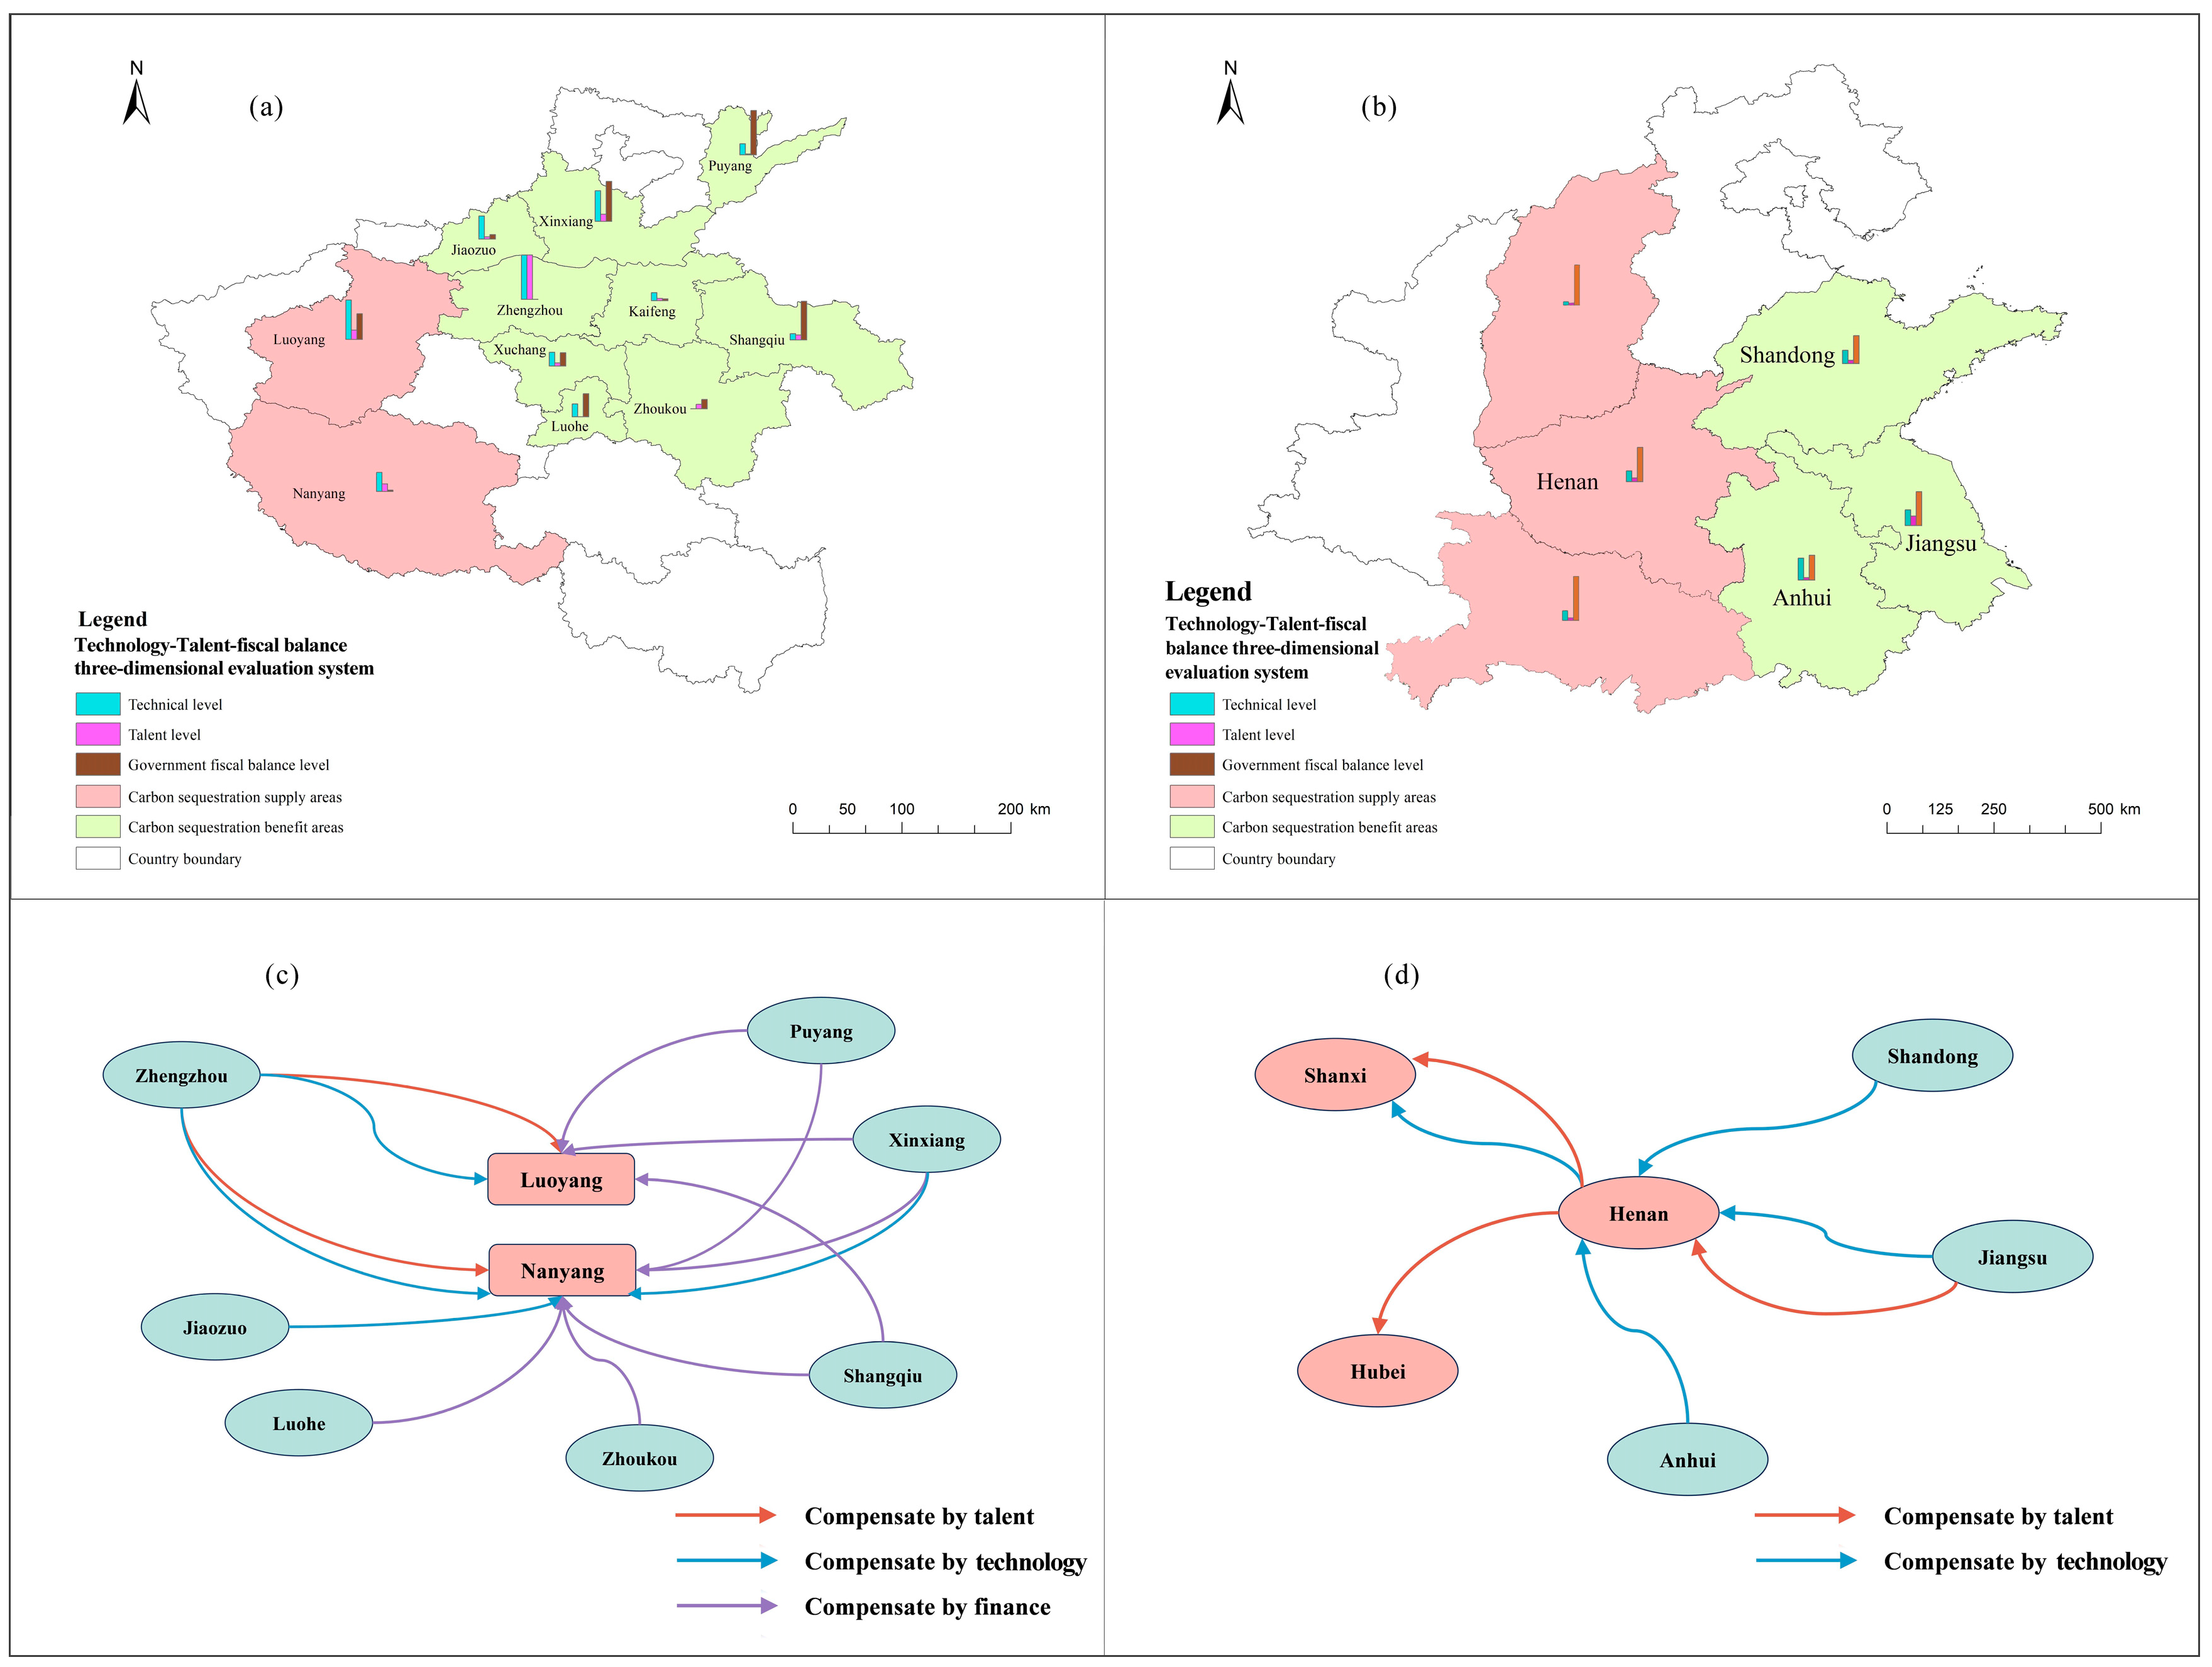
3.5. Diversified Ecological Compensation Schemes

The normalized indices of technology, talent, and fiscal balance among cities in Henan Province and neighboring provinces are illustrated in Figure 9a,b. Within Henan Province, cities with advanced technological capabilities include Zhengzhou, Luoyang, Jiaozuo, and Xinxiang, whereas lower levels are observed primarily in the agriculture-centric regions of Shangqiu and Zhoukou. As the capital of Henan Province, Zhengzhou exhibits a leading talent level relative to other cities. A higher level of government finance correlates with a lesser fiscal burden, thereby enhancing the capacity for ecological compensation through economic means. The fiscal balance does not exhibit marked spatial agglomeration, with higher fiscal balance levels primarily found in Puyang, Xinxiang, Luoyang, and Shangqiu. Thus, in the selection of ecological compensation strategies for Luoyang, Zhengzhou could offer technological and talent support, whereas Puyang, Xinxiang, and Shangqiu could provide financial support. For Nanyang, Zhengzhou, Xinxiang, and Jiaozuo could supply technological support, whereas Puyang, Shangqiu, Xinxiang, Zhoukou, and Luohe could provide talent and financial support, with Zhengzhou also contributing talent support (Figure 9c).
Among Henan Province and its neighboring provinces, the financial index of the western provinces is slightly higher than that of the eastern provinces. In contrast, high-value areas of technological capability are predominantly found in the eastern provinces. Jiangsu Province demonstrates a higher talent level compared to other provinces. Therefore, Henan could extend talent support to Shanxi and Hubei, as well as technological support to Shanxi. In the context of ecological compensation strategies for Henan, Jiangsu could provide both technological and talent support, whereas Shandong and Anhui could offer technological support (Figure 9d).

3.6. Summary of Results

This study explores the flow of carbon sequestration services between cities and municipalities within Henan Province, between Henan Province and the Central Henan Urban Agglomeration, and between Henan Province and the surrounding provinces. In addition, the ecosystem carbon sequestration service supply areas, beneficiary areas, and the amount of flow are specified in Section 3.3. First, Luoyang and Nanyang are the only two carbon sequestration service supply areas in Henan Province. They supplied 521,300 tons and 515,600 tons of carbon sinks to the nine ecosystem carbon sequestration service demand zones within Henan Province, accounting for 19.66% and 14.47% of their own carbon sequestration service supply, respectively. Luoyang and Nanyang supplied 12.68% and 12.99% of their own carbon sequestration services to surrounding systems, respectively, as well as 35.12% and 37.63% of their own carbon sequestration services to remote systems, respectively. After supplying carbon sequestration services to various systems, Luoyang and Nanyang still have 863,300 tons and 1,244,300 tons of net carbon sequestration services remaining and are able to maintain a roughly balanced ecological environment of their own. Of the carbon sequestration services provided by Luoyang and Nanyang, 97.99% came from forests, whereas 0.06% and 1.95% were obtained from scrubland and grassland, respectively. In China’s urbanization process, scrub and grassland are easily encroached upon by construction, whereas forests are relatively less susceptible to direct exploitation. Therefore, the source of carbon sequestration services provided by the carbon sequestration supply area in Henan Province is relatively stable.
Within Henan Province, Xuchang has been one of the biggest beneficiaries due to its proximity to the supply zone. Xuchang, together with Xinxiang, Jiaozuo, Luohe, and Zhengzhou, meet their own demand through the flow of sequestration services within Henan Province. However, Puyang, Kaifeng, Shangqiu, and Zhoukou all need to receive external supply to meet their needs. This is due to the fact that these three cities are located in the eastern part of Henan Province, which is far from the supply area, and are not able to obtain sufficient supply from the supply area in the western part of Henan Province. Outside of Henan, Jiangsu and Anhui Provinces receive more supply from Henan. Shaanxi Province, on the other hand, is the most important external supplier to Henan Province. The overall supply and demand pattern of carbon sequestration services between Henan and its surrounding provinces is “high supply and low demand in the west, high demand and low supply in the east” which is a mismatch between supply and demand.
The spatial mismatch between supply and demand for ecosystem carbon sequestration services is often rooted in development imbalances. Areas with urbanization and rapid development also have lower carbon sequestration capacity. Ecological compensation is an effective means of reconciling the economy and ecology between regions. Based on the results of carbon sequestration service flows under the meta-coupling framework, this study systematically formulates a diversified scheme of ecological compensation and monetary compensation amounts among cities and municipalities within Henan Province, as well as between Henan Province and the surrounding provinces. These schemes can provide a reference for inter-regional managers.

4. Discussion

4.1. The Meta-Coupling Framework Enables a More Systematic and Comprehensive Understanding of Ecosystem Service Flows

Spatial spillover effects of ecosystem services are evident. This study not only addresses the flow of ecosystem carbon sequestration services within the focal system but also explores the flow of these services between the focal system and adjacent systems, as well as between the focal area and remote systems through the meta-coupling framework. The findings indicate that the quantity of ecosystem carbon sequestration services obtained using adjacent and remote systems is 0.771 and 2.194 times that of the internal supply of the focal system, respectively. This finding suggests significant interactions of ecosystem carbon sequestration services between the focal area and external systems and that these ecological flows can be analyzed in layers using the meta-coupling framework.
In previous studies on ecosystem service flows, such as the investigation of carbon sequestration service flow in the Minjiang River Basin conducted by Dai et al. [38], certain deficit areas—including Jin’an District, Mawei District, and Changle District on the southeastern border of the basin—were unable to receive carbon sequestration services from the output areas within the study region. These three areas have a high potential to benefit from external carbon sequestration services. However, due to the unclear demarcation of the research boundary, the accuracy of the ecosystem service flow assessment in the study area is compromised to some extent. Liang and Pan [39] did not account for the carbon sequestration service flow between the study area and external regions in their research on identifying priority supply areas for carbon sequestration in the northwest Shiyang River Basin, causing adjacent areas to rely on “passive” supply to a degree. In this study, Kaifeng, Shangqiu, Puyang, and Zhoukou were not able to satisfy the demand for carbon sequestration services when the flow of carbon sequestration services within Henan Province was exclusively considered. However, after considering the external flow of carbon sequestration services, the needs of these cities are met. It is evident that not considering the externalities of ecosystem service flows can easily lead to inaccuracies in the supply and demand of ecosystem services within the study area. It is also not possible to clarify the ecosystem service flow from inside the study area to the outside or the supply from the outside to the inside. These findings emphasize the necessity of considering the externalities of ecosystem service flow. The meta-coupling framework can improve the comprehensiveness and accuracy of ecosystem service flows in focal systems by systematically studying ecosystem service flows within the focal system, between the focal system and adjacent system, and between the focal system and remote system. The results of ecosystem service flows between internal systems as well as between internal and external systems also provide a comprehensive and systematic approach to the study of ecological compensation, which can help to develop more scientific environmental management strategies.
The meta-coupling framework is also relevant for examining cultural service flows [40]. Through elucidating the interactions of ecosystem service flows within systems, between adjacent systems, and across remote systems, the meta-coupling framework can inform the formulation of relevant policies, such as ecological compensation criteria. The originator of the meta-coupled framework noted that its boundaries need not be defined by spatial units, allowing for considerable flexibility [8] that can be adapted to specific research questions. The Central Urban Agglomeration—primarily centered around Henan Province—represents a collaborative development initiative. This study aims to investigate the internal and external carbon sequestration service flows within Henan Province and explore the interactions of carbon sinks between Henan Province and the Central Urban Agglomeration, thereby promoting future industrial planning and development within the agglomeration. Therefore, it is designated as an adjacent system for research within the meta-coupling framework.
The concept of “ecological products”, analogous to ecosystem services, has emerged as a critical focus in contemporary theoretical research in China [41]. Ecological products can be categorized into three types [42]: ecological material products, regulatory service products, and cultural service products. In future research, based on the flow characteristics of various ecological products, it will be beneficial to simulate both omnidirectional and directional service flows in conjunction with the meta-coupling framework. This approach will provide a more scientific and accurate understanding of the inter-regional supply and demand for ecological products, facilitate the marketization of these products, and offer clear guidance for policymakers.

4.2. Diversified and Rational Approaches to Ecological Compensation

Revising ecological compensation standards is both reasonable and necessary. Regions vary significantly in economic levels and living standards, leading to a considerable gap between the actual ecological compensation that can be provided and the compensation that is warranted [43]. Additionally, ecological compensation serves as an incentive mechanism rather than a punitive measure [13]. China’s “Regulations on Ecological Protection Compensation” emphasize that ecological protection compensation refers to institutional arrangements for incentivizing units and individuals engaged in ecological protection, and this is facilitated through mechanisms such as financial vertical compensation, inter-regional horizontal compensation, and market-based compensation. Therefore, in horizontal ecological compensation among regions, it is essential to adjust compensation standards according to the ability and willingness to pay in different areas, thus creating a feasible carbon compensation scheme. It is important to encourage supply and benefit areas of ecological products to engage in horizontal ecological protection compensation based on the principle of voluntary consultation, considering the valuation of ecological products, their physical quantities, and other relevant factors.
Utilizing the dimensions of the three-dimensional technology–talent–fiscal balance evaluation system, it is possible to identify areas with high demand for compensation in the supply region and substantial compensation capacity in the beneficiary area to “learn from each other” and implement diversified ecological compensation in a targeted manner. For example, when Zhengzhou City (CSBA) provides ecological compensation for Luoyang City (CSSA), it can consider compensation in terms of technology and talent, including technical assistance, industrial transfers, talent recruitment, talent development, and the service period for senior talent. In Henan Province, certain cities, such as Xuchang City and Kaifeng City, may not show significant dimensions in the three-dimensional evaluation system. In such cases, ecological compensation responsibilities can also be addressed through national/provincial vertical fund compensation, the co-construction of parks, and the establishment of “ecological enclaves.” Specific compensation mechanisms can be chosen based on the three dimensions of technology, talent, and financial balance, or a combination of multiple compensation forms can be implemented to achieve the objectives of ecological compensation.

4.3. Limitations

The flow path of ecosystem carbon sequestration services is complex and affected by temperature, wind direction, and socio-economic factors. In addition, ecological corridors facilitate the movement of matter, energy, and information between regions [44,45]. However, given data and technology limitations, this study did not take into account the magnitude of resistance in ecosystem service flow pathways. Therefore, the results obtained are also more idealized. In fact, environmental factors also affect the strength, flow rate, and scope of action of ecosystem service flows. Incorporating environmental factors into the modeling of ecosystem service flows is more consistent with natural realities, such as constructing habitat quality to construct resistance surfaces [46]. Future research will consider more comprehensive models and scientific approaches to simulating the flow of carbon sequestration services.
In addition, the indicators of the three-dimensional technology–talent–fiscal balance evaluation system proposed in this paper are not sufficiently robust. For example, policy compensation has become a prevalent form of ecological compensation, whereby recipients leverage priority and preferential treatment from policy frameworks to formulate innovative policies that promote development and raise funding. However, the three dimensions of ecological compensation identification presented in this paper have not effectively addressed this aspect, presenting certain limitations. Future efforts should align with contemporary developments and regional realities, enriching the index dimensions and system, and establishing standardized statistics and implementation mechanisms for ecological compensation to determine diverse ecological compensation programs more scientifically and reasonably.
The meta-coupling framework combined with ecological compensation described in this paper provides an example of coordinated development between regions, especially between less developed and developed regions [47]. The meta-coupling framework clarifies the transfer of carbon sequestration service flows between regions in a hierarchical manner and identifies the main suppliers and beneficiaries. Central government authorities or administrators can focus ecological compensation efforts on specific regional scales to coordinate the interests between regions. Eco-compensation that takes into account the different levels of economic and social development of regions holds practical significance effective implementation. Furthermore, substituting financial compensation with technological resources and skilled talent offers additional possibilities and enhances the feasibility of ecological compensation programs.

5. Conclusions

In this paper, based on the meta-coupling framework, the supply and demand of ecosystem carbon sequestration services was calculated using the NEP method and per capita carbon emission method. Carbon sink flows and the payable ecological compensation amounts were analyzed in Henan Province, the Central Plains Urban Agglomeration, and the eight provinces surrounding Henan Province. The conclusions derived were as follows:
(1)
Within Henan Province, Luoyang and Nanyang contributed 521,300 tons and 515,600 tons of carbon sinks, respectively, to eight cities, including Jiaozuo, Zhengzhou, and Kaifeng. Henan Province provided 3.07 million tons of carbon sinks to other provinces, while Changzhi, Xiangyang, and Jinzhong supplied 657,200 tons of carbon sinks to Henan Province.
(2)
Through the adjustment of compensation standards based on the internal payment capacity and willingness to pay within Henan Province, Luoyang and Nanyang—identified as CSSAs—are projected to receive ecological compensation of CNY 26.28 million and CNY 26.33 million from internal beneficiary areas. Adjustments in inter-provincial payment capacity and willingness to pay indicate that Henan Province should receive CNY 175.61 million in ecological compensation from external provinces, while the CSSA from those external provinces should receive CNY 18.99 million from Henan Province. Therefore, through the carbon sink flow process between Henan Province and its surrounding provinces, Henan Province can attain a net compensation of CNY 156.62 million.
(3)
The meta-coupling framework allows for a thorough consideration of the spatial spillover effects of ecosystem carbon sequestration services, enhancing the accuracy of research results related to ecosystem service flows and corresponding ecological compensation. In determining ecological compensation plans, in addition to traditional monetary compensation from the government, the evaluation system for technology, talent, and fiscal balance can identify strengths and weaknesses among CSSAs and CSBAs, thereby enabling the proposal of targeted and diversified ecological compensation strategies (e.g., technology transfer, financial investment, and talent support) to help bridge the development gap between regions.
Based on the meta-coupling framework, this study systematically quantified the supply and demand of ecosystem carbon sequestration services in Henan Province, the Central Plains Urban Agglomeration, and its eight surrounding provinces by integrating methods based on net ecosystem productivity (NEP) and per capita carbon emission and revealed the spatial flow pattern of the carbon sinks and the ecological compensation mechanism. The study innovatively proposed a diversified compensation strategy by identifying the differences in factor endowments between the CSSAs and the carbon sink beneficiary areas (CSBAs) and constructed diversified compensation paths such as technology transfer, capital investment, and talent support, providing an operational institutional design for bridging the regional development gap. The results provide theoretical support and a methodological paradigm for the formulation of cross-scale ecological compensation policy.

Author Contributions

Formal analysis, H.W.; funding acquisition, H.W. and L.L.; investigation, H.W.; methodology, W.J.; visualization, H.W.; writing—original draft, W.J.; writing—review and editing, S.L., Y.Y., M.L., H.W. and L.L. All authors have read and agreed to the published version of the manuscript.

Funding

This research was sponsored by Natural Science Foundation of Henan (252300420286, 252300420850), Key Project of Henan Provincial Science and Technology R&D Plan Joint Fund (225200810045), and Soft Science Research of Henan Province (242400410274).

Data Availability Statement

The data presented in this study are available on request from the corresponding author.

Conflicts of Interest

The authors declare no conflicts of interest.

References

  1. Duan, H.; Zhou, S.; Jiang, K.; Bertram, C.; Harmsen, M.; Kriegler, E.; van Vuuren, D.P.; Wang, S.; Fujimori, S.; Tavoni, M.; et al. Assessing china’s efforts to pursue the 1.5 °C warming limit. Science 2021, 372, 378–385. [Google Scholar] [CrossRef] [PubMed]
  2. Li, T.; Li, J.; Wang, Y. Carbon sequestration service flow in the guanzhong-tianshui economic region of china: How it flows, what drives it, and where could be optimized? Ecol. Indic. 2019, 96, 548–558. [Google Scholar] [CrossRef]
  3. Smith, P. Soil carbon sequestration and biochar as negative emission technologies. Glob. Change Biol. 2016, 22, 1315–1324. [Google Scholar] [CrossRef] [PubMed]
  4. Li, X.E.; Hu, Y.N. Measuring Regional Balance of Carbon Sequestration from the Perspective of Supply and Demand: A Case Study of Yangtze River Delta Ecological Greening Development Demonstration Area. Resour. Environ. Yangtze Basin. 2024, 33, 55–65. [Google Scholar]
  5. Hermann, A.; Schleifer, S.; Wrbka, T. The Concept of Ecosystem Services Regarding Landscape Research: A Review. Living Rev. Landsc. Res. 2011, 5, 5. [Google Scholar] [CrossRef]
  6. Zhang, M.; Chen, E.; Zhang, C.; Liu, C.; Li, J. Multi-Scenario Simulation of Land Use Change and Ecosystem Service Value Based on the Markov-FLUS Model in Ezhou City, China. Sustainability 2024, 16, 6237. [Google Scholar] [CrossRef]
  7. Schirpke, U.; Tscholl, S.; Taseer, E. Spatio-temporal changes in ecosystem service values: Effects of land-use changes from past to future (1860–2100). J. Environ. Manag. 2020, 272, 111068. [Google Scholar] [CrossRef] [PubMed]
  8. Liu, J. Integration across a metacoupled world. Ecol. Soc. 2017, 22. [Google Scholar] [CrossRef]
  9. Fisher, B.; Turner, R.K.; Morling, P. Defining and classifying ecosystem services for decision making. Ecol. Econ. 2009, 68, 643–653. [Google Scholar] [CrossRef]
  10. Syrbe, R.; Walz, U. Spatial indicators for the assessment of ecosystem services: Providing, benefiting and connecting areas and landscape metrics. Ecol. Indic. 2012, 21, 80–88. [Google Scholar] [CrossRef]
  11. Wu, C.; Lu, R.; Zhang, P.; Dai, E. Multilevel ecological compensation policy design based on ecosystem service flow: A case study of carbon sequestration services in the qinghai-tibet plateau. Sci. Total Environ. 2024, 921, 171093. [Google Scholar] [CrossRef] [PubMed]
  12. Zhai, T.; Chang, M.; Ma, Y.; Huang, L.; Li, L. Exploring the changes and driving mechanisms in the production-transport-consumption process of ecosystem services flow in the yellow river basin under the background of policy changes. Ecol. Indic. 2023, 151, 110316. [Google Scholar] [CrossRef]
  13. Wu, C.S.; Zhang, P. Discussion on policy formulation of ecological compensation based on ecosystem service. Acta Ecol. Sin. 2023, 43, 10032–10041. [Google Scholar]
  14. Locatelli, B.; Imbach, P.; Vignola, R.; Metzger, M.J.; Hidalgo, E.J.L. Ecosystem services and hydroelectricity in central america: Modelling service flows with fuzzy logic and expert knowledge. Reg. Environ. Change 2011, 11, 393–404. [Google Scholar] [CrossRef]
  15. Zank, B.; Bagstad, K.J.; Voigt, B.; Villa, F. Modeling the effects of urban expansion on natural capital stocks and ecosystem service flows: A case study in the puget sound, washington, usa. Landsc. Urban Plan. 2016, 149, 31–42. [Google Scholar] [CrossRef]
  16. Zhang, J.; He, C.; Huang, Q.; Li, L. Understanding ecosystem service flows through the metacoupling framework. Ecol. Indic. 2023, 151, 110303. [Google Scholar] [CrossRef]
  17. Hovis, C.L.; Dou, Y.; Herzberger, A.; Liu, J. Through the lens of telecoupling and metacoupling: New perspectives for global sustainability. Sustainability 2021, 13, 2953. [Google Scholar] [CrossRef]
  18. Herzberger, A.; Chung, M.G.; Kapsar, K.; Frank, K.A.; Liu, J. Telecoupled food trade affects pericoupled trade and intracoupled production. Sustainability 2019, 11, 2908. [Google Scholar] [CrossRef]
  19. Merz, L.; Yang, D.; Hull, V. A metacoupling framework for exploring transboundary watershed management. Sustainability 2020, 12, 1879. [Google Scholar] [CrossRef]
  20. Zhai, T.; Zhang, D.; Zhao, C. How to optimize ecological compensation to alleviate environmental injustice in different cities in the yellow river basin? A case of integrating ecosystem service supply, demand and flow. Sustain. Cities Soc. 2021, 75, 113341. [Google Scholar] [CrossRef]
  21. Larondelle, N.; Lauf, S. Balancing demand and supply of multiple urban ecosystem services on different spatial scales. Ecosyst. Serv. 2016, 22, 18–31. [Google Scholar] [CrossRef]
  22. Sanchez-Azofeifa, G.A.; Pfaff, A.; Robalino, J.A.; Boomhower, J.P. Costa rica’s payment for environmental services program: Intention, implementation, and impact. Conserv. Biol. 2007, 21, 1165–1173. [Google Scholar] [CrossRef] [PubMed]
  23. Ouyang, Z.; Zheng, H.; Xiao, Y.; Polasky, S.; Liu, J.; Xu, W.; Wang, Q.; Zhang, L.; Xiao, Y.; Rao, E.; et al. Improvements in ecosystem services from investments in natural capital. Science 2016, 352, 1455–1459. [Google Scholar] [CrossRef] [PubMed]
  24. Yan, H.; Yang, H.; Guo, X.; Zhao, S.; Jiang, Q. Payments for ecosystem services as an essential approach to improving ecosystem services: A review. Ecol. Econ. 2022, 201, 107951. [Google Scholar] [CrossRef]
  25. Jiao, M.M.; He, L.; Wang, Y.X. Regional horizontal ecological compensation and ecosystem service value based on water resources pattern and insurance gain. Chin. J. Appl. Ecol. 2023, 34, 751–760. [Google Scholar]
  26. Lai, M.; Chen, F.G. Eco-compensation standard for ecological conservation of marine protected areas based on opportunity cost method. Acta Ecol. Sin. 2020, 40, 1901–1909. [Google Scholar]
  27. Ding, Z.M.; Yao, S.B. Theory and valuation of cross-regional ecological compensation for cultivated land: A case study of shanxi province, china. Ecol. Indic. 2022, 136, 108609. [Google Scholar] [CrossRef]
  28. Niu, J.; Mao, C.; Xiang, J. Based on ecological footprint and ecosystem service value, research on ecological compensation in anhui province, china. Ecol. Indic. 2024, 158, 111341. [Google Scholar] [CrossRef]
  29. Deng, Y.J.; Hou, M.Y.; Jia, L.; Wang, Y.Q. Ecological compensation strategy of the old revolutionary base areas along the route of Long March based on ecosystem service value evaluation. Chin. J. Appl. Ecol. 2022, 33, 159–168. [Google Scholar]
  30. Lai, M.; Wu, S.H.; Yin, Y.H.; Pan, T. Accounting for eco-compensation in the three-river headwaters region based on ecosystem service value. Acta Ecol. Sin. 2015, 35, 227–236. [Google Scholar]
  31. Zheng, H.; Wang, L.; Peng, W.; Zhang, C.; Li, C.; Robinson, B.E.; Wu, X.; Kong, L.; Li, R.; Xiao, Y.; et al. Realizing the values of natural capital for inclusive, sustainable development: Informing china’s new ecological development strategy. Proc. Natl. Acad. Sci. USA 2019, 116, 8623–8628. [Google Scholar] [CrossRef] [PubMed]
  32. Ouyang, Z.; Song, C.; Zheng, H.; Polasky, S.; Xiao, Y.; Bateman, I.J.; Liu, J.; Ruckelshaus, M.; Shi, F.; Xiao, Y.; et al. Using gross ecosystem product (GEP) to value nature in decision making. Proc. Natl. Acad. Sci. USA 2020, 117, 14593–14601. [Google Scholar] [CrossRef] [PubMed]
  33. Shaikh, S.F.E.A.; See, S.C.; Richards, D.; Belcher, R.N.; Gret-Regamey, A.; Torres, M.G.; Carrasco, L.R. Accounting for spatial autocorrelation is needed to avoid misidentifying trade-offs and bundles among ecosystem services. Ecol. Indic. 2021, 129, 107992. [Google Scholar] [CrossRef]
  34. Jia, H.; Chen, H. Spatiotemporal Dynamics and Optimization Management of Ecosystem Service Flows in the Yangtze River Delta Urban Agglomeration, China. Sustainability 2025, 17, 4727. [Google Scholar] [CrossRef]
  35. Tan, F.; Lu, Z. Regional sustainability system as ecosystem: Case study of china’s two leading economic circles from a keystone perspective. Environ. Dev. Sustain. 2019, 21, 961–983. [Google Scholar] [CrossRef]
  36. Li, F.; Li, W.H.; Zhen, L.H.; He, Q.W. Estimating eco-compensation requirements for forest ecosystem conservation: A case study in Hainan province, southern China. Outlook Agric. 2010, 40, 51–57. [Google Scholar]
  37. Du, H.; Zhao, L.; Zhang, P.; Li, J.; Yu, S. Ecological compensation in the beijing-tianjin-hebei region based on ecosystem services flow. J. Environ. Manag. 2023, 331, 117230. [Google Scholar] [CrossRef] [PubMed]
  38. Dai, H.X.; Xie, H.L.; Chen, L.X.; Gao, Y.Y.; Zhang, J. Evaluation of Carbon Sequestration Service Flow in Min jiang River Basin for Supply and Demand Synergy. Environ. Sci. 2025, 1–15. [Google Scholar] [CrossRef]
  39. Liang, J.; Pan, J. Identifying carbon sequestration’s priority supply areas from the standpoint of ecosystem service flow: A case study for northwestern china’s shiyang river basin. Sci. Total Environ. 2024, 927, 172283. [Google Scholar] [CrossRef] [PubMed]
  40. Liu, T.; Yu, L.; Liu, J.; Xu, Z.; Chen, X.; Wu, H.; Zheng, S.; Zhao, Q.; Gong, P. Unveiling interprovincial geographic patterns of 5A-level tourism cultural ecosystem service flows and tourist preferences in China’s metacoupled systems. Appl. Geogr. 2024, 172, 103432. [Google Scholar] [CrossRef]
  41. Qiu, S.L.; Huang, M.X. Research progress and prospect of realizing the value of ecological products in China. J. Environ. Prot. 2023, 51, 41–45. [Google Scholar]
  42. Song, C.; Ouyang, Z. Theoretical Connotation and Application Practice of Gross Ecosystem Product (GEP). Frontiers 2023, 18, 92–95. [Google Scholar]
  43. Ma, Y.; Chen, H.; Yang, M.; Aihemaiti, G.; Lu, W.; Zhao, R. Ecological compensation based on multiscale ecosystem carbon sequestration service flow. J. Environ. Manag. 2024, 372, 123396. [Google Scholar] [CrossRef] [PubMed]
  44. Deng, J.J.; Chen, L.X.; Yang, C.Y. Evaluation of the importance of ecological corridors in highly urbanized areas: A case study of Shenzhen. Geogr. Res. 2017, 36, 573–582. [Google Scholar]
  45. Puth, L.M.; Wilson, K.A. Boundaries and corridors as a continuum of ecological flow control: Lessons from rivers and streams. Conserv. Biol. 2001, 15, 21–30. [Google Scholar] [CrossRef]
  46. Feng, X.; Du, Z.; Tao, P.; Liang, H.; Wang, Y.; Wang, X. Construction of Green Space Ecological Network in Xiongan New Area Based on the MSPA-InVEST-MCR Model. Appl. Sci. 2024, 14, 10760. [Google Scholar] [CrossRef]
  47. Li, W.; Ma, Z.; Luo, R.; Hong, Y.; Wang, S.; Ma, X.; Bao, Q. Balancing Poverty Alleviation and Ecosystem Vulnerability Reduction: Implication from China’s Targeted Interventions. Sustainability 2025, 17, 2490. [Google Scholar] [CrossRef]
Figure 1. The location of the mate-coupling framework in Henan province (a), the meta-coupling framework with Henan Province as the focal system for a location in China (b), the elevation map of Henan Province (c), and the schematic of the meta-coupling framework with Henan Province as the focal system.
Land 14 01522 g001
Figure 2. Technology roadmap.
Land 14 01522 g002
Figure 3. The concept map of the three-dimensional evaluation system based on technology, talent, and fiscal balance.
Land 14 01522 g003
Figure 4. Carbon sequestration service supply (a), demand (b), and CSDD (c) in Henan and surrounding provinces. Conceptual diagram of ecosystem carbon sequestration service flow (d).
Land 14 01522 g004
Figure 5. Identification of cold and hot spots (a) as well as supply areas and benefit areas (b) of carbon sequestration services in Henan Province and surrounding provinces.
Land 14 01522 g005
Figure 6. Spatial distribution diagram (a) and Sankey diagram (b) of carbon sequestration service flow within Henan Province.
Land 14 01522 g006
Figure 7. Spatial distribution diagram (a,b) and Sankey diagram (c,d) of carbon sequestration service flow between Henan Province and adjacent system.
Land 14 01522 g007
Figure 8. Spatial distribution diagram (a,b) and Sankey diagram (c,d) of carbon sequestration service flow between Henan Province and remote system.
Land 14 01522 g008
Figure 9. The normalized evaluation index comprising technology, talent, and financial balance in Henan Province (a) and the surrounding provinces (b), and diversified ecological compensation schemes among cities in Henan Province (c) and other provinces (d).
Land 14 01522 g009
Table 1. The evaluation indicators of the technology, talent, and fiscal balance levels.
Evaluation DimensionEvaluation Index
Technical levelR&D investment intensity (%)
Technical market turnover (ten thousand CNY)
Talent levelEmployment in non-private urban units (10,000)
Number of patents granted (pieces)
Government fiscal balance levelOutstanding local government debt (100 million CNY)
Table 2. Monetary amount paid for ecological compensation for ecosystem carbon sequestration services.
CSSACSBACompensation Amount (CNY Ten Thousand)
LuoyangXinxiang243.63
Jiaozuo32.41
Zhengzhou672.93
Kaifeng437.44
Shangqiu213.36
Xuchang507.06
Zhoukou222.10
Puyang299.23
Subtotal2628.17
NanyangLuohe476.519
Zhengzhou872.43
Shangqiu285.65
Xuchang689.07
Zhoukou308.91
Subtotal2632.59
Henan ProvinceShandong Province1257.30
Anhui Province5668.14
Jiangsu Province10,635.34
Subtotal17,560.79
Shanxi ProvinceHenan Province1693.78
Hubei Province205.46
Disclaimer/Publisher’s Note: The statements, opinions and data contained in all publications are solely those of the individual author(s) and contributor(s) and not of MDPI and/or the editor(s). MDPI and/or the editor(s) disclaim responsibility for any injury to people or property resulting from any ideas, methods, instructions or products referred to in the content.

