Article

How Do Invasive Species Influence Biotic and Abiotic Factors Drive Vegetation Success in Salt Marsh Ecosystems?

1
School of Marine Science and Engineering, Nanjing Normal University, Nanjing 210023, China
2
College of Economics & Management, Anhui Agricultural University, Hefei 230036, China
3
School of Urban and Planning, Yancheng Teachers University, Yancheng 224007, China
*
Authors to whom correspondence should be addressed.
Land 2025, 14(8), 1523; https://doi.org/10.3390/land14081523
Submission received: 7 June 2025 / Revised: 19 July 2025 / Accepted: 22 July 2025 / Published: 24 July 2025

Abstract

Vegetation succession is a critical indicator of ecosystem structure and function and is often disrupted by the expansion of invasive species. However, ecosystem-scale studies elucidating invasion-driven succession mechanisms remain limited. This research focused on the Yancheng coastal salt marsh and analyzed the distribution variation of invasive species (Spartina alterniflora) and native species (Suaeda salsa and Phragmites australis) from 1987 to 2022 via the Google Earth Engine and random forest method. Logistic/Gaussian models were used to quantify land–sea distribution changes and vegetation succession trajectories. By integrating data on soil salinity, invasion duration, and fractional vegetation cover, generalized additive models (GAMs) were applied to identify the main factors influencing vegetation succession and to explore how Spartina alterniflora invasion affects the succession of salt marsh vegetation. The results indicated that the areas of Spartina alterniflora and Phragmites australis significantly increased by 3787.49 ha and 3452.60 ha in 35 years, respectively, contrasting with Suaeda salsa’s 82.46% decline. The FVC in the area has significantly increased by 42.10%, especially in the coexisted areas of different vegetation communities, indicating intensified interspecific competition. The overall trend of soil salinity was decreasing, with a decrease in soil salinity in native species areas from 0.72% to 0.37%. From the results of GAMs, soil salinity, tidal action, and invasion duration were significant factors influencing the distribution of native species, but salinity was not a significant factor affecting the Spartina alterniflora distribution. The findings revealed that the expansion of Spartina alterniflora changed the soil salinity and interspecific interactions, thereby altering the original plant community structure and establishing a new vegetation succession. This study enhances the understanding of the impacts of invasive species on ecosystems and offers theoretical support for salt marsh restoration.

1. Introduction

The changes displayed by an ecosystem over time following a disturbance are defined as succession. These changes usually occur in a range of ecosystem attributes such as species diversity and composition, vegetation structure, soils, etc. [1]. As an essential component of ecosystems, plant communities play a crucial role in material cycling and energy flow. Owing to changes in plant community types, system status, species composition, or abundance being easily identifiable, the succession of vegetation communities has also become an important basis for explaining and predicting ecosystem evolution [2]. Vegetation succession is closely linked to changes in abiotic and biotic factors and is driven by a combination of deterministic and stochastic ecological processes [3]. Generally, deterministic processes, which include environmental filtering (i.e., abiotic environmental conditions act as a filter, significantly influencing species establishment, survival, and growth), and interspecific interactions (i.e., multiple species coexist in the same temporal and spatial environment, acting as environmental factors for each other, thereby forming interspecific interactions) play a major role in the formation of and change in vegetation succession [4]. When the relative importance of these ecological processes changes, the rate and sequence of vegetation succession changes correspondingly [5]. In the presence of a dominant environmental filter, the vegetation distribution tends to shift in response to abiotic stress gradients. However, when interspecific interactions take over as the dominant factor, functionally similar species may be replaced, and succession may shift toward homogeneity [6,7].
Invasive species affect the flow of materials and energy in invaded areas by altering the regional environment during the invasion, and combining competition and facilitation among plants to directly or indirectly impact the original vegetation community [8]. These impacts may fundamentally change the regional vegetation composition and structure, leading to serious ecological consequences for the invaded ecosystem, such as the degradation or loss of ecological function [9]. Owing to their dominant properties and wide tolerance ranges, invasive species disrupt the original succession by establishing new communities with distinct ecosystem characteristics, thereby initiating new succession [10]. As invasive species stably expand, they form dominant communities in small-scale areas and achieve ecological niche differentiation on larger scales [11]. Thus, a new pattern of succession is formed. It can be seen that changes in vegetation succession after invasion can effectively reflect the degree of impact of invasion events on regional ecosystems [12].
Salt marshes are among the most productive and valuable ecosystems and play crucial roles in biodiversity conservation, storm and coastal protection, nutrient cycling, carbon storage, and climate regulation [13]. Owing to their location in the land–sea interface region with frequent changes in environmental elements, salt marshes are also habitats with strong and potentially lethal biotic/abiotic stress gradients [14]. In salt marshes, the interplay of tidal movements and elevation creates significant gradients in inundation depth, frequency, salinity, and other stressors from land to sea [15,16]. Among these factors, salinity is a key factor influencing vegetation succession. Owing to differences in tolerance to salt stress, plants in salt marshes change along stress gradients to form a typical zonation pattern [17]. As a result, salt stress determines the lower limit of vegetation zonation, whereas the upper limit is related mainly to plant interactions [18]. However, with the introduction and rapid expansion of exotic invasive species, such as Spartina alterniflora (S. alterniflora), dominant populations were established at the front of the coast, influencing and modifying local environmental elements. Leveraging its tall stems and dense canopy structure, this species effectively attenuates waves and decelerates currents, accelerating sediment deposition (accretion rates: 2–4 cm/yr) [19,20]. By modulating hydrodynamic processes, sediment transport, and topographic accretion effects, S. alterniflora colonies drive morphological restructuring of tidal creek systems, such as tidal creek fragmentation, diminished tidal prism capacity, and contraction of tidal influence zones [21,22]. Under synergistic influences such as precipitation leaching, soil salinity in landward areas markedly decreases [23,24]. The regional ecosystem equilibrium was gradually disrupted, and the distribution of the indigenous vegetation communities subsequently changed [16]. Concurrently, the individual traits of S. alterniflora (e.g., physiological properties, reproductive strategies, abiotic stress tolerance, and allelopathy) combined with its community characteristics (tall, dense structure) confer multifaceted competitive advantages [25]. Environmental factors change, and competitive exclusion mechanisms are combined to drive a significant decline in functionally similar native species (such as Suaeda salsa (S. salsa)), thereby accelerating the homogenization process of salt marsh vegetation [26]. However, it is important to note that the impacts of species invasion on indigenous vegetation are not solely characterized by direct competition and suppression. In contrast, some species that are weak competitors in their native environments transform into dominant competitors in the later stages of succession [27]. Nevertheless, there have been relatively few studies on such ecosystem role transformations. Therefore, studying the vegetation succession mechanism within the salt marsh is crucial, not only for comprehending the sensitivity of ecosystems and response characteristics to the incursion of S. alterniflora but also for elucidating the impact mechanism of species invasion on the salt marsh ecosystems. This study can also provide a basis for predicting the ecological impacts and effective restoration of coastal wetlands after controlling for invasive species.
Plant responses to changes in abiotic factors generally exhibit distinct regularity [28]. Therefore, the study of plant traits controlled by single factors through experiments or controlled studies of interspecific interactions via the introduction/removal of individual species has still been the dominant approach in the study of successional mechanisms [13,29]. However, such methods have been applied mainly to small- and medium-scale regions and, furthermore, have rarely analyzed the driving mechanisms of successional changes from the perspective of the integrated effects of biotic and abiotic factors. Additionally, it has also been difficult to compare the magnitude of the effects of different driving factors to clarify the relative importance of those factors. The continuous enrichment of remote sensing data and the innovation of processing technology have made it possible to obtain long-term successional trajectories. Coupling these successional trajectories with actual environment and biological factors provides a new and effective way to explore the impact of invasive species on vegetation succession changes at the ecosystem scale [30].
On this basis, this study aimed to elucidate regional vegetation succession trajectories by extracting the spatiotemporal distribution patterns of typical plant communities through remote sensing big data analysis methods, combined with the distribution dynamics of different vegetation types along the land–sea gradient. Integrating biotic and abiotic factors such as invasion duration, soil salinity, and fractional vegetation cover (FVC), and applying generalized additive models (GAMs) to analyse the key driving factors of vegetation succession changes, thereby revealing the succession mechanisms of coastal wetland vegetation under the background of S. alterniflora invasion. The specific research objectives are as follows: (1) to accurately extract and analyze the trajectory characteristics of vegetation succession in the region; (2) to identify the key driving factors affecting vegetation succession and analyze their driving effects; and (3) to explore the mechanisms underlying the impact of the invasion of S. alterniflora on changes in vegetation succession in salt marsh ecosystems.

2. Materials and Methods
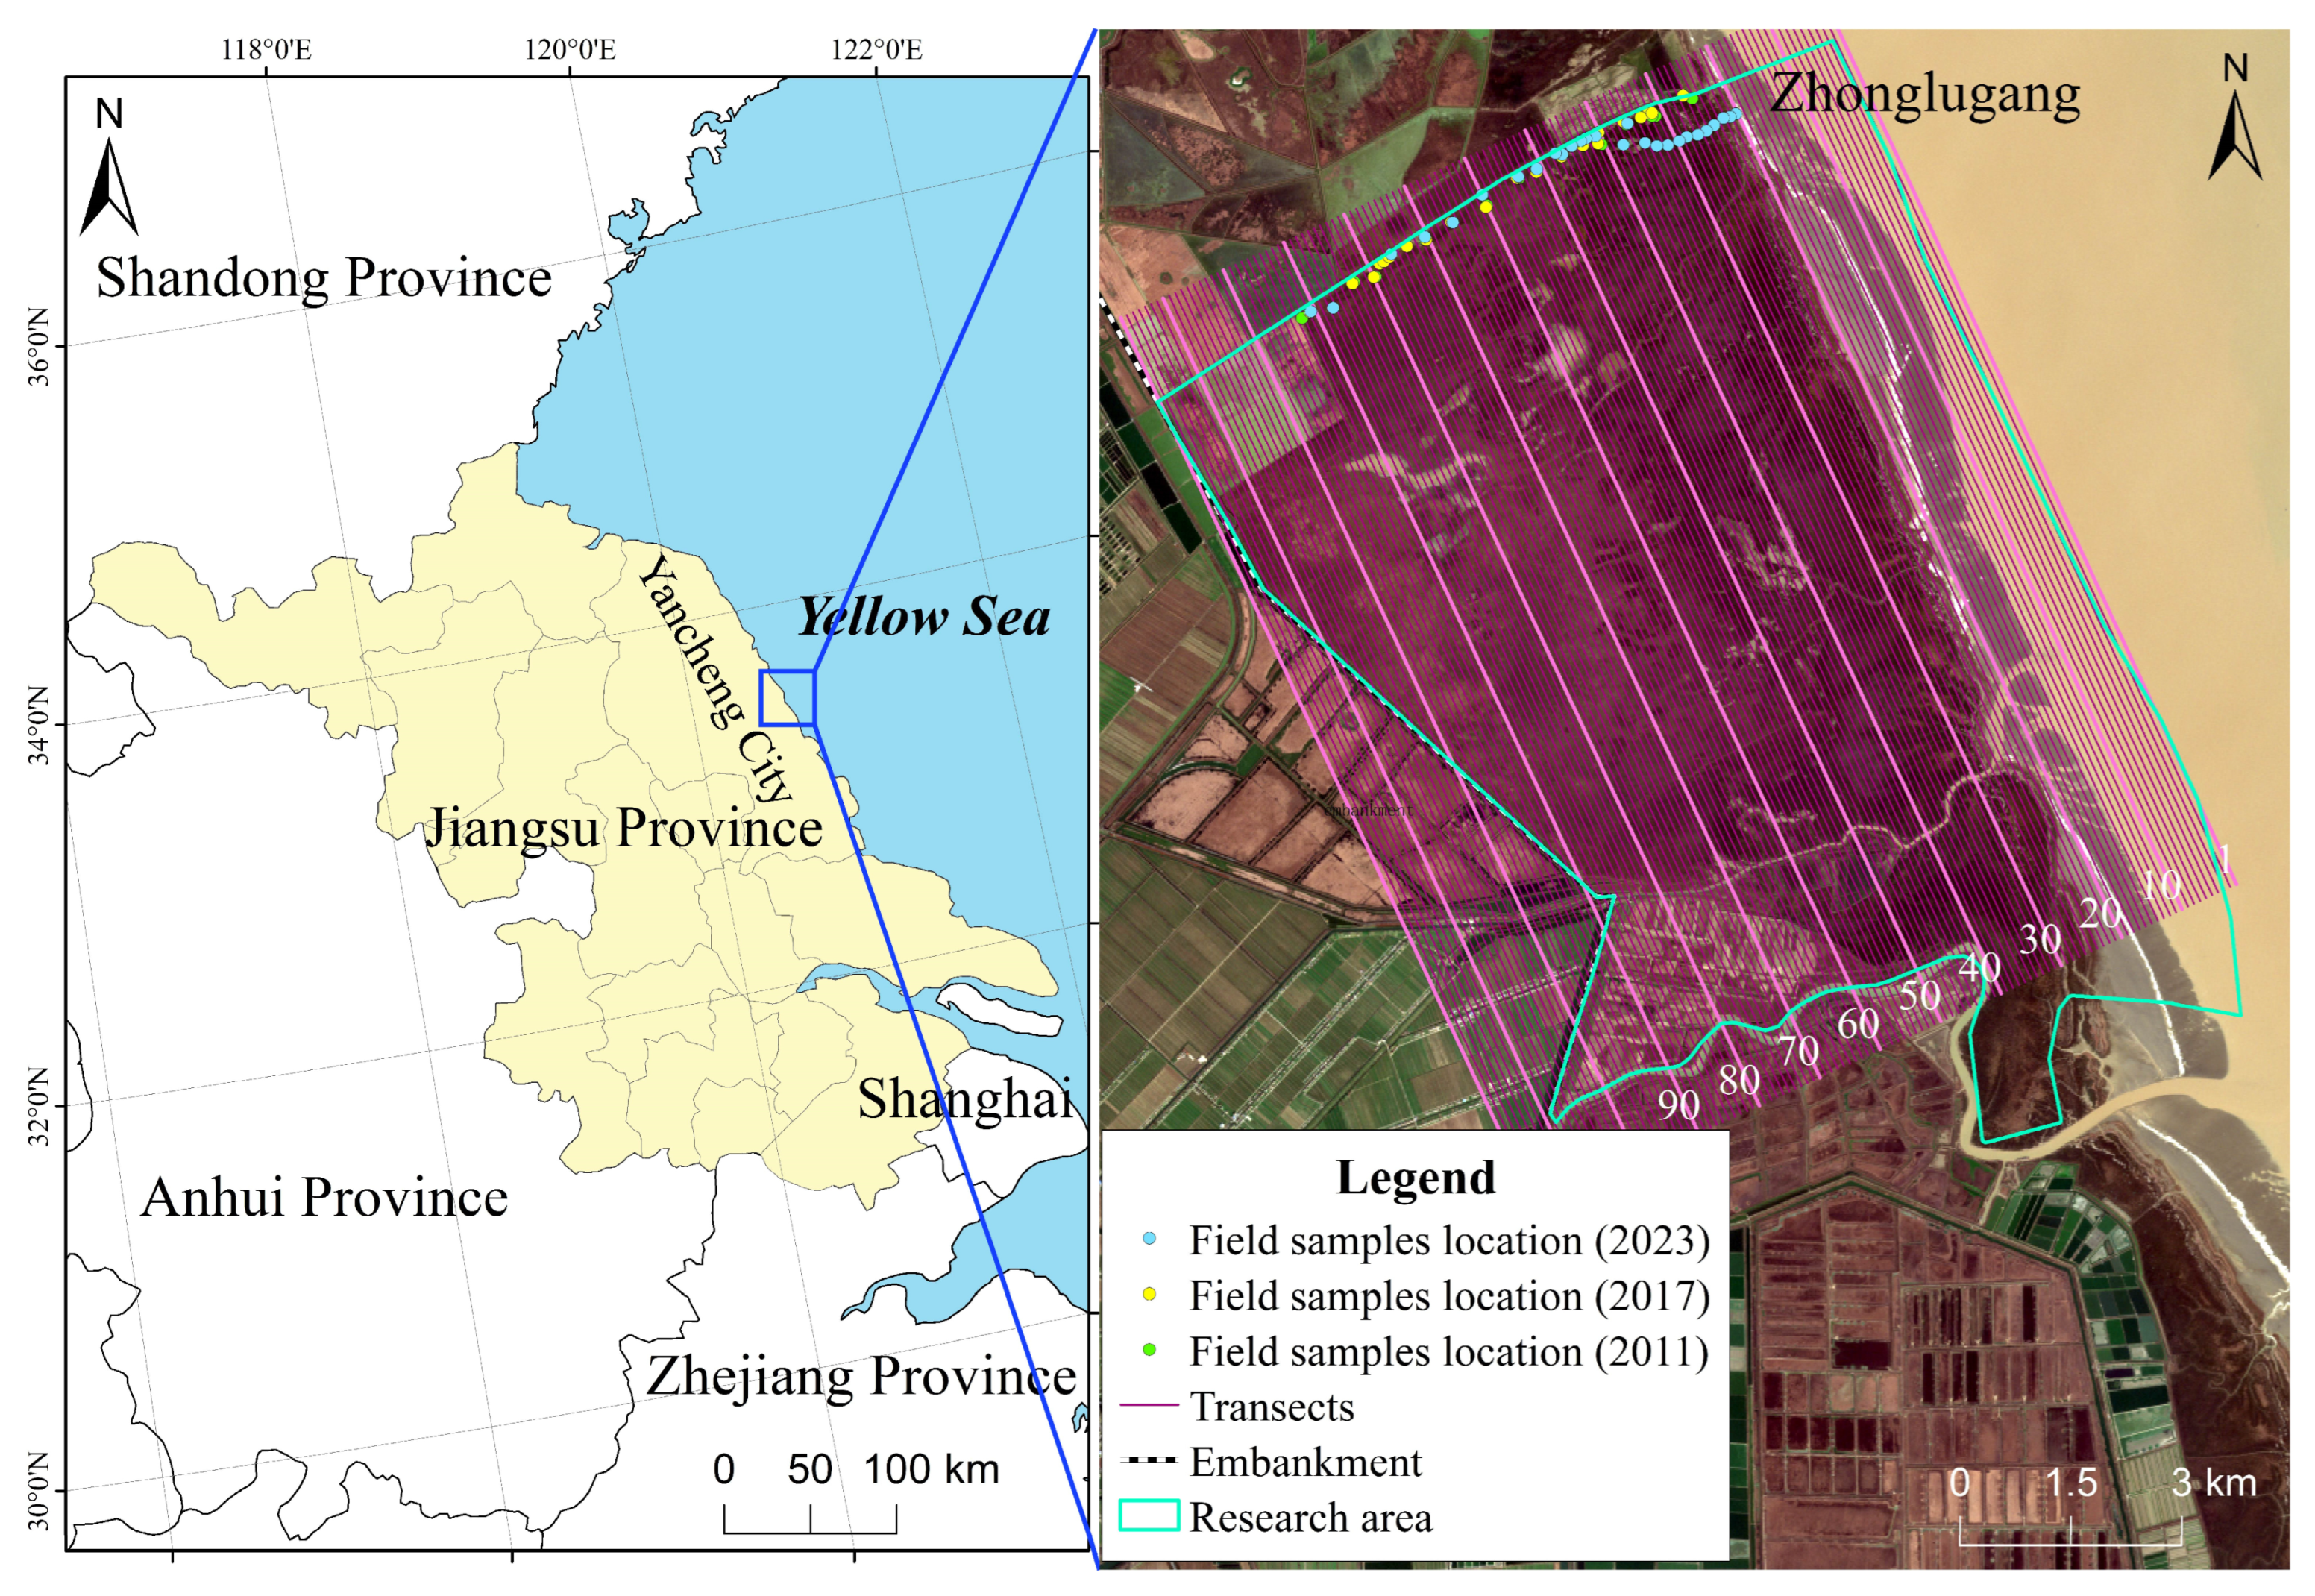
2.1. Study Sites

In this study, the core area of the Jiangsu Yancheng Wetlands & Rare Birds National Natural Reserve (the natural salt marsh on the south side of Zhonglugang) was selected as a typical study area (33°28′46″~33°38′37″ N, 120°31′59″~120°41′34″ E, as shown in Figure 1), with a total area of 115.88 km2. The study area features a subtropical monsoon climate, with an annual average precipitation of more than 1000 mm and an average annual temperature ranging from 13.9–16.1 °C. The Jiangsu coastline is dominated by silt-muddy coasts with abundant sediment supply. The tidal flat exhibits flat and expansive topography, with an average width exceeding 4 km [31,32]. Highly interconnected, multi-branched tidal creek networks are well developed across the tidal flats. Influenced by anthropogenic activities such as reclamation, which has substantially reduced tidal flat width and is compounded by the rapid invasion of S. alterniflora, the tidal creek systems have undergone progressive degradation and contraction [21,33]. The shallow component tide is significant near this area, and the tide type is dominated by irregular semidiurnal tides with an average tidal range of 2–4 m [31]. As an important node in the migratory route of migratory birds from East Asia to Australasia, the study area also serves as an important wintering site for many rare birds, such as Grus japonensis [34]. The area is minimally disturbed by human activities, and the land-to-sea plant types are Phragmites australis (P. australis), S. salsa, S. alterniflora. Among them, S. alterniflora was introduced into China in 1979, began to be planted on tidal flats near the study area in 1986, and has become a dominant species in the region [35].

2.2. Data Collection

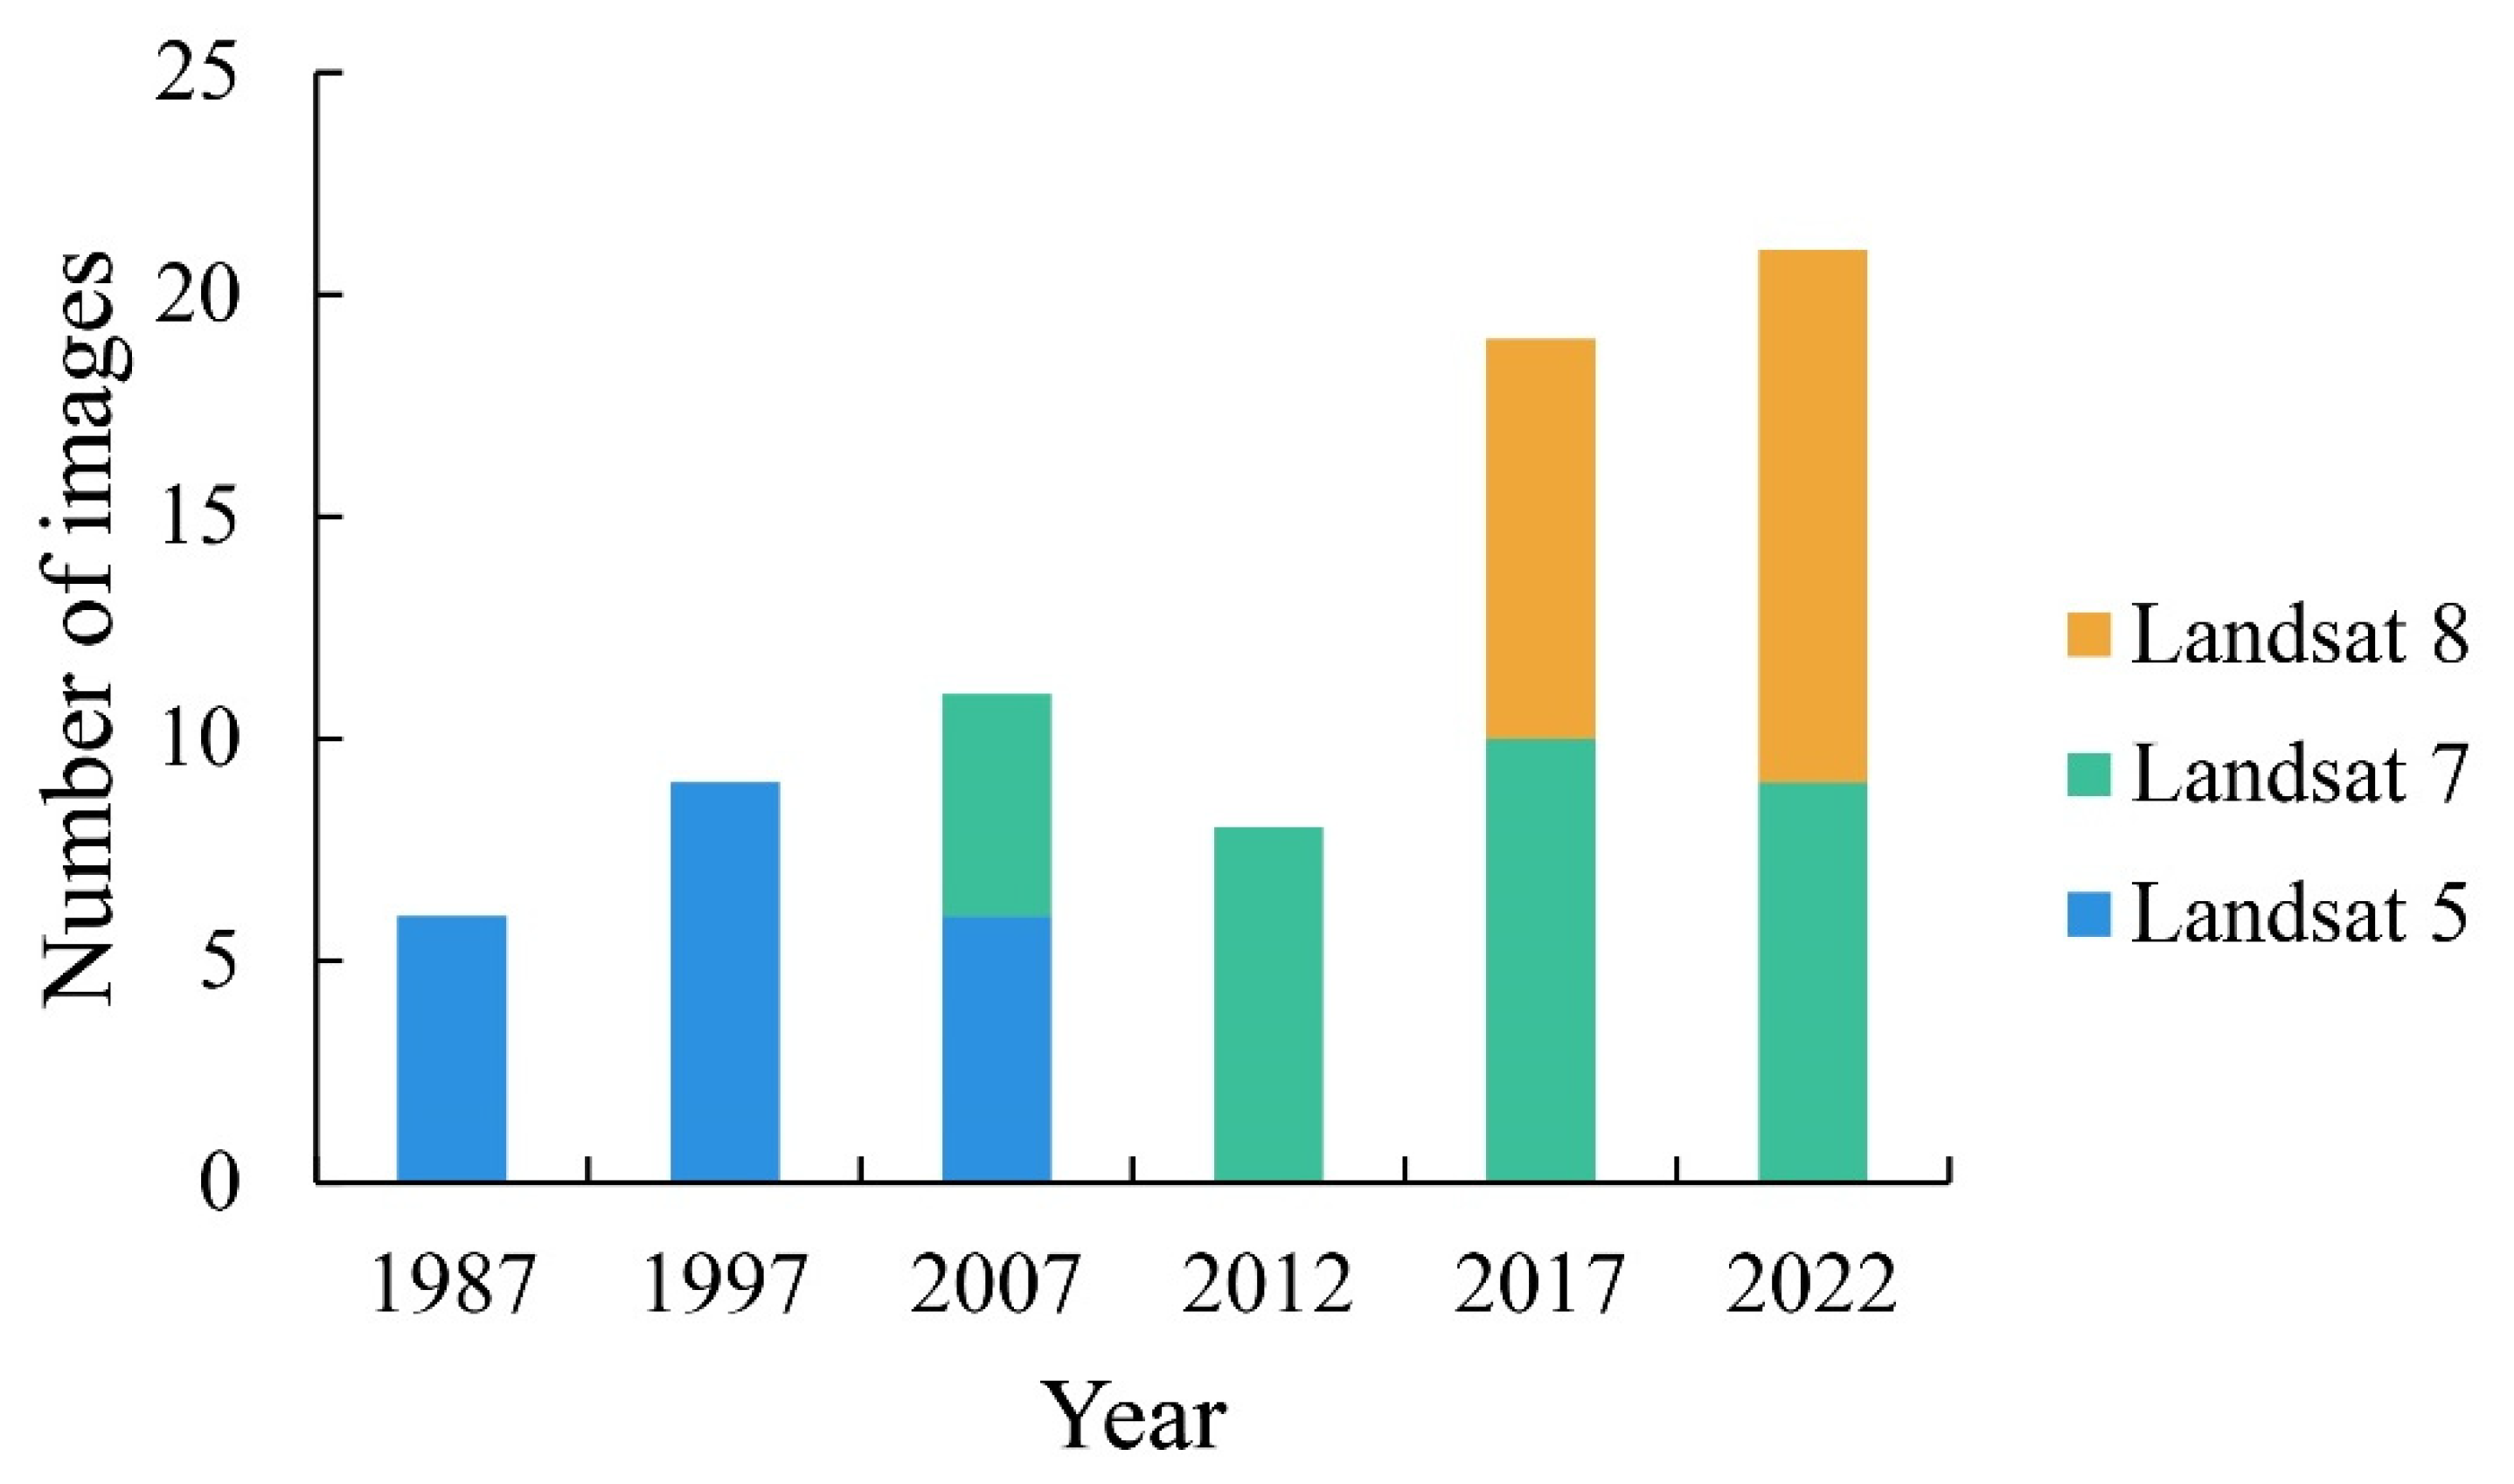
2.2.1. Satellite Remote Sensing Images

To capture the impact of S. alterniflora invasion on vegetation succession completely, 1987 was set as the initial year of colonization and key years were set on the basis of the expansion status of S. alterniflora (with a 10-year interval used before the formation of the S. alterniflora belt (before 2007) and a 5-year interval used after its formation). Consequently, six key years were set, i.e., 1987, 1997, 2007, 2012, 2017, and 2022. Considering the time scale and spatial resolution requirements, the remote sensing images from the Landsat series satellite were selected for this study research on vegetation succession in coastal wetland ecosystems. Based on the requirement of covering the study area (the path and row numbers are 119 and 37), the T1-level surface reflectance datasets of Landsat 5 TM, Landsat 7 ETM+, and Landsat 8 OLI from Google Earth Engine (GEE, https://earthengine.google.com/) were filtered. Then, the QA_PIXEL quality band information was used to construct cloud masks and radio-saturated masks to perform image cloud removal. The synthetic images for the growing season (from April to October) for the key years were then cropped according to the vector range of the study area (see Figure 2). The above-selected images were preprocessed with geometric and atmospheric corrections.

2.2.2. Soil Salinity

Soil salinity data were obtained through literature collection and field sampling (see Table 1). The historical literature was screened based on the principle of the same or similar study area locations. Owing to the scarcity of available historical salinity records, data within ±1 year of each target temporal node (1987, 1997, 2007, 2012) were included. All cited studies [36,37,38,39,40] employed methodologies directly comparable to our protocol: using the standard electrical conductivity (EC) method applied to topsoil samples (0–20 cm depth). Specifically, field-collected samples underwent consistent laboratory pretreatment—including drying, grinding, impurity removal, and sieving—before the EC measurement of soil–water leachate. Although some of the cited literature (e.g., [36,37]) did not exhaustively provide method details, the uniformity in reported salinity values and coastal gradient sampling design confirms methodological coherence. For 2012–2022, field sampling followed identical methods and standards and the locations of the sampling points are shown in Figure 1. Since the study area is relatively small and the lateral variation in salinity distribution is not significant, the salinity variation along the sampling transects was used to represent the soil salinity variation in the sea–land direction for that year.

2.3. Methods

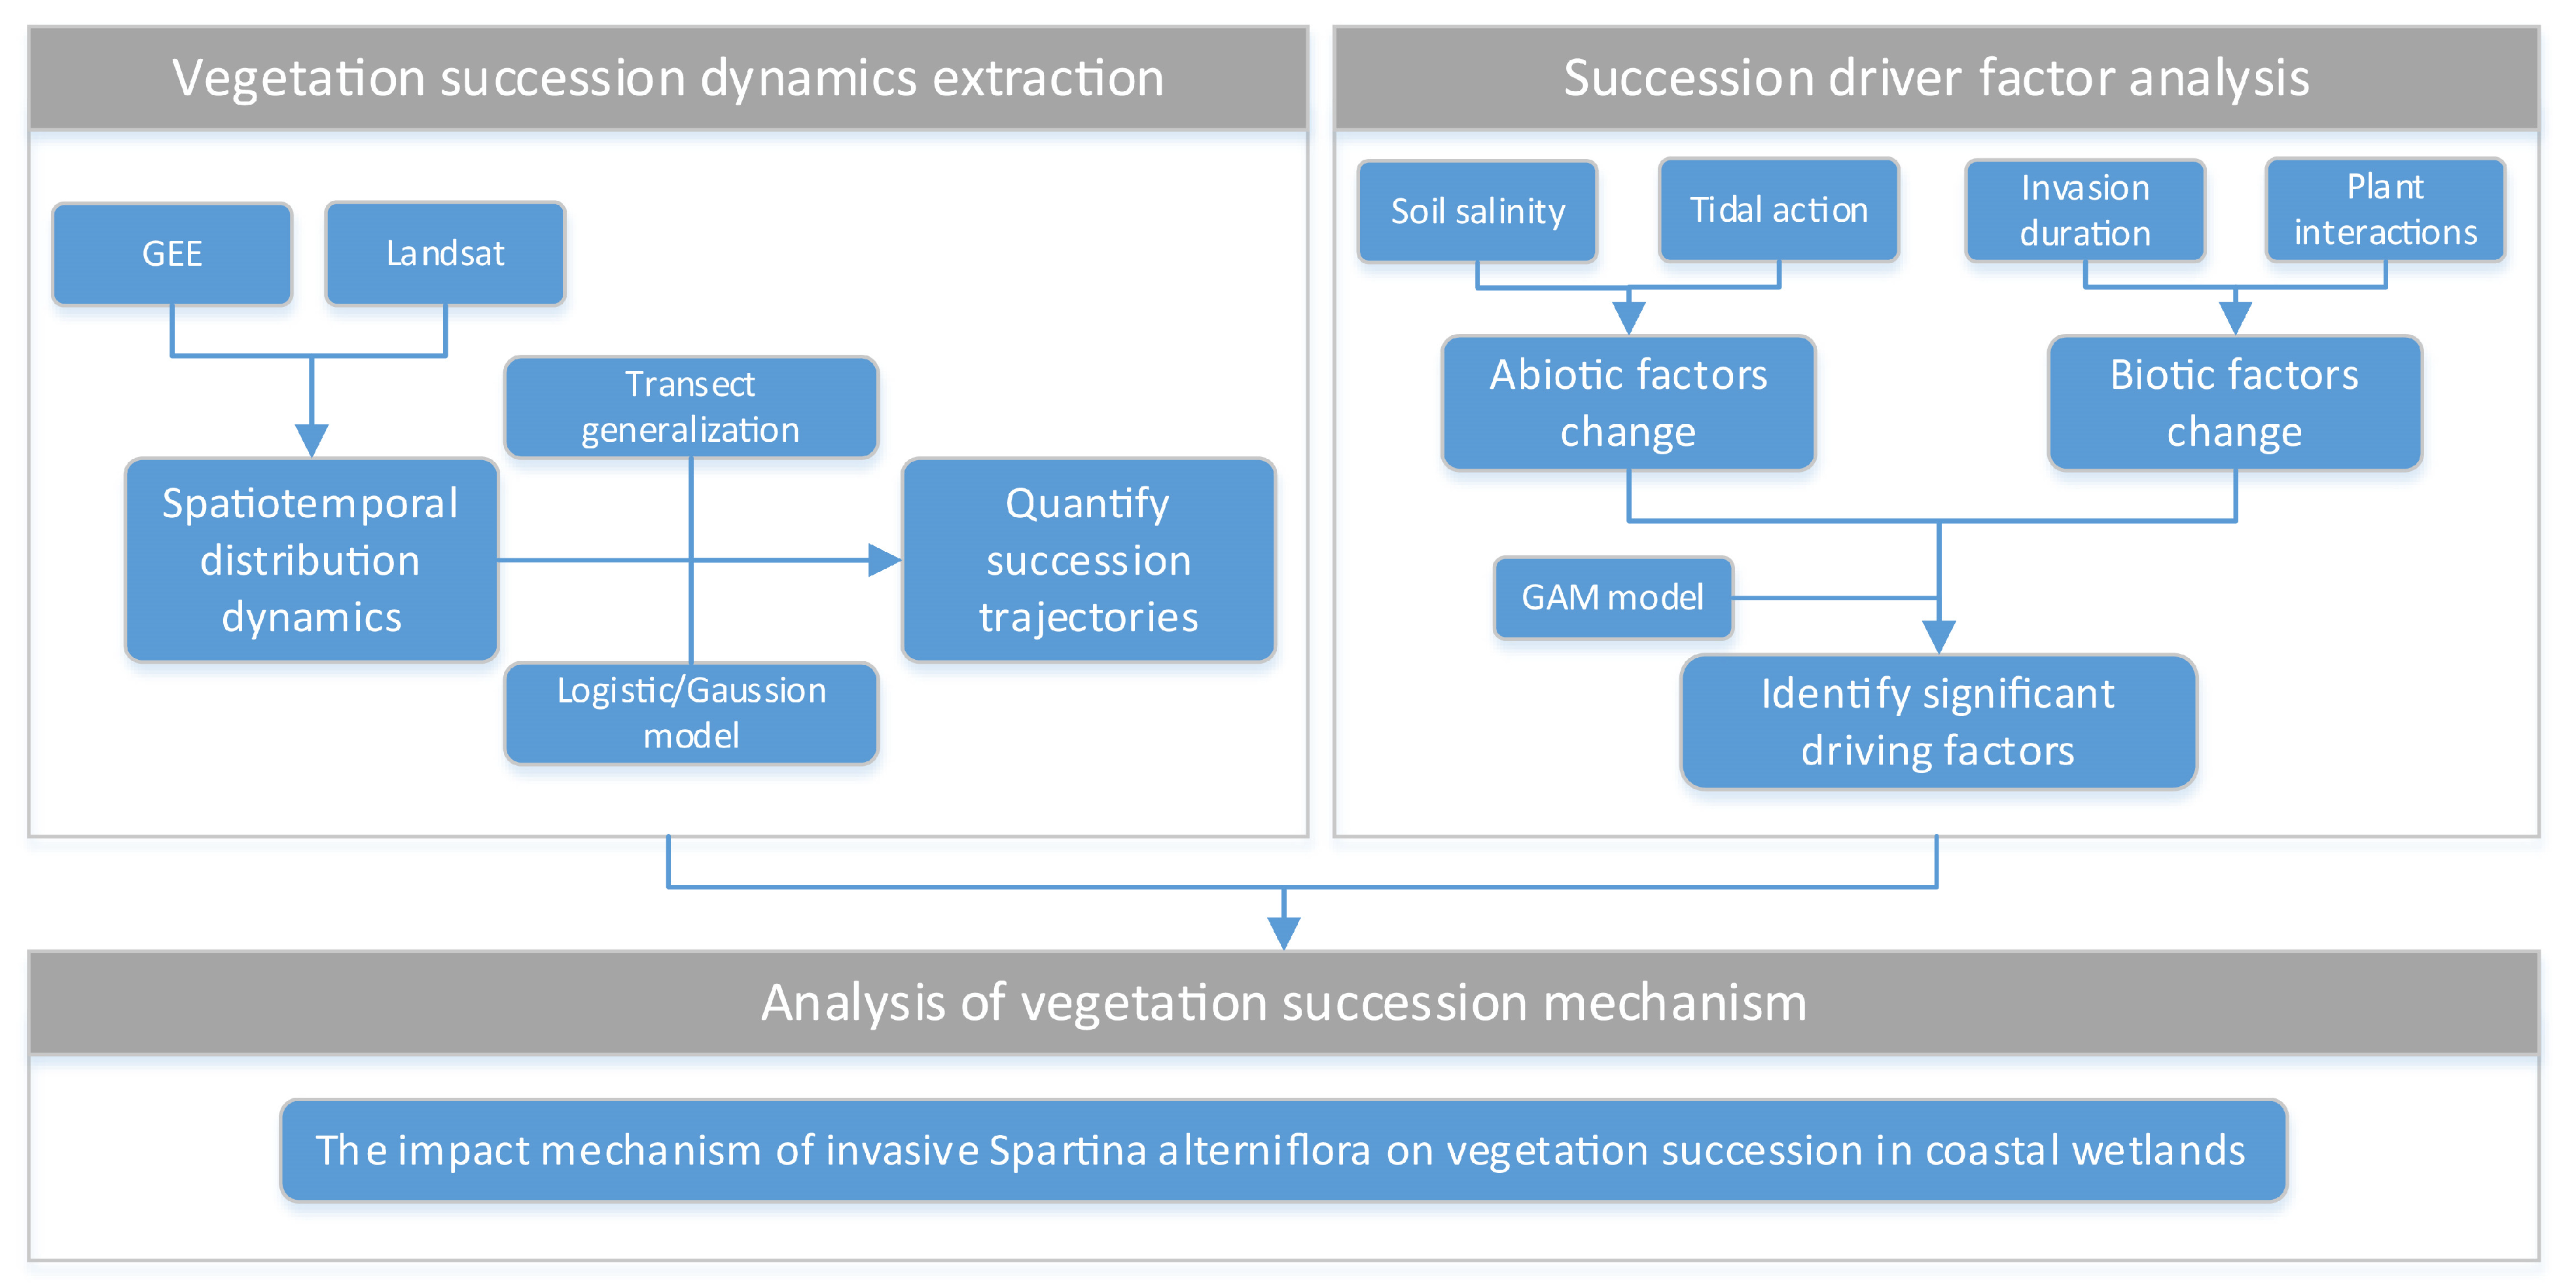
2.3.1. Overall Analysis Framework

To elucidate the mechanisms of coastal wetland vegetation succession under S. alterniflora invasion, this study integrated multi-source data and statistical models to construct a systematic analysis framework, which included the following three parts (see Figure 3): (1) Based on multi-temporal Landsat remote sensing images, the spatiotemporal distribution dynamics of S. alterniflora and native species (S. salsa, P. australis) from 1987 to 2022 were extracted by coupling the random forest algorithm on the Google Earth Engine (GEE) platform. The vegetation succession trajectories were quantified using the land–sea transect generalization method, and the logistic and Gaussian models were applied to analyze the characteristics of succession. (2) Integrating multi-dimensional driving factors such as soil salinity, tidal flooding (proxied by distance from the sea), invasion duration, and plant interactions (characterized by FVC), the generalized additive model (GAM) was used to identify significant biotic/abiotic factors affecting the distribution change in vegetation in the land–sea ward. (3) Based on the results of the GAM models and the dynamics of vegetation succession, the ecological mechanism by which S. alterniflora invasion reshapes the vegetation succession of coastal wetlands by altering environmental conditions and biological interactions was systematically analyzed.

2.3.2. Classification and Interspecific Interaction Extraction of Plant Communities via the Google Earth Engine

(1)
Classification of typical plant community types
The random forest algorithm was used in Google Earth Engine (GEE) to classify the types of plant communities in the study area. The steps were as follows: (a) Type delineation and sample selection: based on the results of the field survey, the feature types of the study area were divided into two categories: salt marsh vegetation and others (including tidal flats, tidal creeks, water, etc.). The vegetation was further subdivided into three typical types of plant communities, namely S. alterniflora (Spartina anglica was replaced by S. alterniflora after 1987 and was therefore not included in the statistics), S. salsa, and P. australis (Scirpus triqueter and Imperata cylindrica are transitional species and often grow mixed with P. australis, so they were jointly calculated). The remote sensing images after de-clouding were used to calculate the mean value of the whole image stack on a pixel-by-pixel basis every year, and then to obtain the synthetic image of the key years. On the basis of the types of plant communities, a visual method was adopted for sample point selection, and 2882 sample points were selected in the six key years. A total of 70% of these points were randomly selected as training sample points, and the remaining 30% served as validation sample points. (b) Feature dataset construction and model training: Different reflectance bands of Landsat images (B1–B7) and multiple spectral indices (NDVI [41], MNDWI [42], EVI [43], and BSI [44]) were combined to establish a multidimensional classification feature set. In the random forest model, the number of decision trees in the classifier was set to 20, and the remaining parameters were maintained at their default values [45]. (c) Accuracy validation: The confusion matrix method was used to evaluate the classification accuracy, and the classification results whose accuracy met the requirements were exported (overall accuracy ≥ 90%, kappa coefficient ≥ 0.85, the verification results of classification accuracy can be seen in Supplementary Materials S1). The GF satellite images and Google Earth high-resolution images were used for manual decoding and correction, which yielded the final classification results [46].
(2)
Extraction of changes in interspecific interactions based on fractional vegetation cover
The fractional vegetation cover (FVC) is sensitive to both growth and abundance and can reflect the overall condition of regional vegetation. Additionally, differences in vegetation traits can also indicate variations in competitive advantage. Taller and more densely distributed plants exhibit a notably stronger competitive ability [47]. This index assumes that the spectral information of a single pixel is a linear weighted combination of components from both vegetated and non-vegetated surfaces. Therefore, the NDVI values of bare soil and complete vegetation cover were combined with a highly simplified linear model to calculate an approximation of vegetation cover. It is also known as the pixel dichotomous model or two-ended meta-model [48]. The equation is as follows:
F V C = N D V I N D V I s o i l N D V I v e g + N D V I s o i l
where N D V I s o i l and N D V I v e g are the NDVI values of the bare soil and pure vegetation images, respectively. In this study, the maximum and minimum values of the NDVI in the images of each year were set as N D V I s o i l and N D V I v e g , respectively. The mean FVC of different plant communities in each transect was subsequently extracted from land to sea, and the method of transect establishment can be found in Section 2.3.3.

2.3.3. Modeling the Relationship Between the Sea–Land Distribution Positions and the Distribution Proportions of Typical Plant Communities

By constructing parallel transects distributed from land to sea, the distribution proportion of each typical plant community in each transect was extracted as the main index of vegetation succession modeling [49] (as shown in Figure 1). The specific steps were as follows: (a) Based on the generalized straight line of the coastline, parallel lines were made in the landward direction, with the spacing of each transect being 90 m (L1–L117); (b) discrete points were set at 90 m intervals in each transect, and the number of points of different types of plant communities in each transect was calculated as the percentage of distribution; (c) Given that species respond to ecological gradients typically manifest as either mono-tonic or unimodal responses [50]; therefore, we extracted the distributional proportion of three typical plant species across the land–sea gradient, and the logistic/Gaussian model was selected to simulate the relationship between the distribution location and the distribution proportion of typical plant communities in the land and sea directions (Equations (2) and (3)) [51]; and (d) areas with a distribution proportion of more than 50% are defined as the dominant ecological niche of this species; the model parameter is extracted for analysis. The formula of the logistic model is as follows:
y = a 1 + e k × ( x x c )
where y is the distribution proportion of the plant community type, x is the distance from the embankment, and a is a magnitude factor indicating the peak proportion of the distribution along the land–sea direction. k is a slope factor controlling the steepness of the curve, and   x c is the centroid position, which shifts seaward and vice versa to the landward side as x c increases.
The formula of the Gaussian model is as follows:
y = a 1 × e ( x b 1 c 1 ) 2
where y is the distribution proportion of the plant community type, x is the distance from the embankment, and a 1 is a magnitude factor indicating the peak proportion of the distribution along the land–sea direction. b 1 is the position of the center which moves seaward and conversely landward as b 1 increases. c 1 is the standard deviation of the curve and controls the width of the curve, which becomes steeper when c 1 decreases.

2.3.4. Modeling the Driving Factors and Mechanisms of Vegetation Succession

Based on the results of modeling the change in the distribution proportion of typical plant communities along the land–sea direction, generalized additive models (GAMs) with a Gaussian distribution and log link function were used to analyze the relationships between biotic and abiotic factors and vegetation succession. The response variable in the model was the average distribution proportion of typical plant communities in transects near the salinity points. There were two types of covariates: biotic and abiotic factors. For the biotic factors, the fractional vegetation cover of P. australis (FVC_PA), S. salsa (FVC_SS), and S. alterniflora (FVC_SA) was selected to characterize the competitive ability of the three plants. The invasion duration (YEAR) was used to characterize the degree of impact of invasion, with a longer duration indicating a greater degree of impact. For the abiotic factors, soil salinity (SAL) and the distance from the land-side embankment (DIS_LAND) were selected to reflect the salinity stress and tidal action of the environmental factors. Model parameterization used Thin-Plate Regression Splines (TPRSs, k = 5) optimized by generalized cross-validation (GCV) to capture nonlinear responses while preventing overfitting. Given that this study focuses on the main effect driving mechanism, interactions were not considered, and only additive structures were used. The data from each transect were averaged, thereby converting the areal distribution data in the covariates into a linear distribution along the sea–land direction.

2.3.5. Statistical Analysis

The Shapiro–Wilk test and Levene’s test were used to assess the normality and homogeneity of variance of the data, respectively. Using linear regression combined with permutation test method to evaluate the significance of area changes for various vegetation types. One-way ANOVA was employed to test the variance in soil salinity changes, with Tukey’s HSD test used for post hoc analysis. The variance inflation factor (VIF) was utilized to test for multicollinearity among the variables in each model, with a threshold of 10. If the VIF exceeded 10, the factor with the largest VIF was removed, and the test was repeated until no multicollinearity remained among the influencing factors. Model performance was compared via the Akaike information criterion (AIC) and R2 to select the best-fitting model [52]. The above data tests were conducted via SPSS 22, and the generalized additive model, logistic model, and Gaussian model were built using the “mgcv” package in R 4.5.1 and Origin 2022.

3. Results

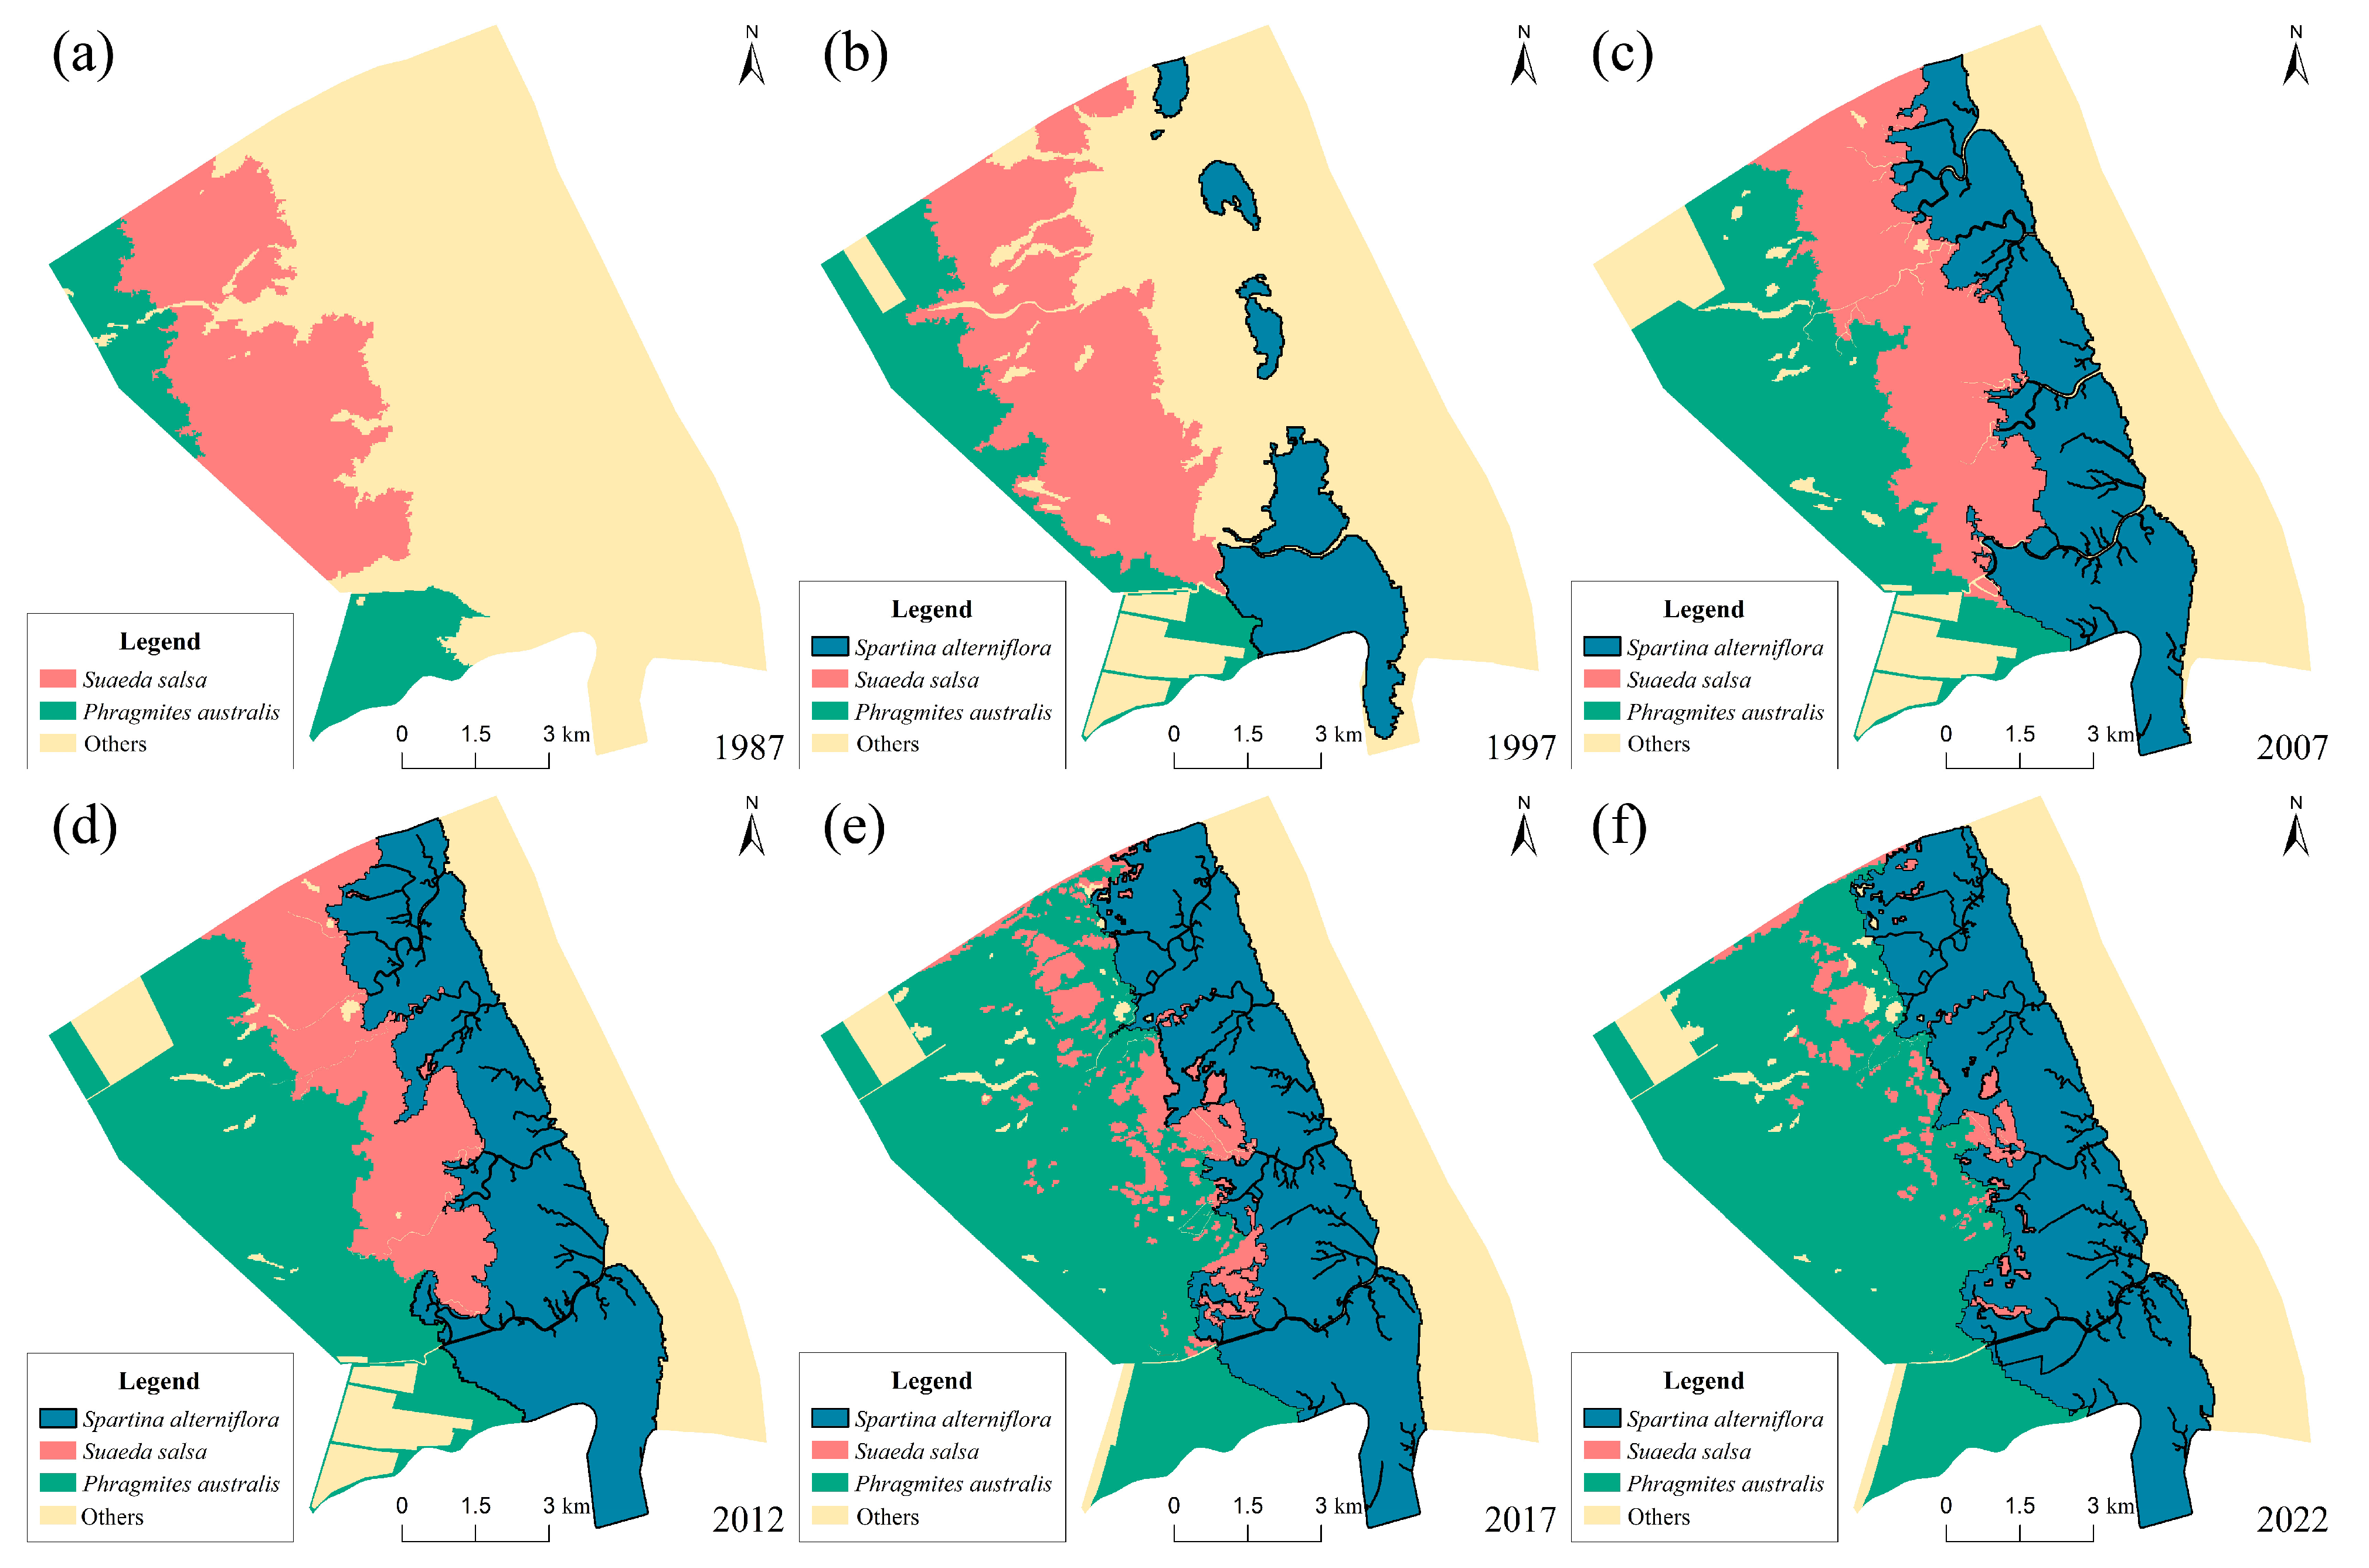
3.1. Changes in Vegetation Succession Within Salt Marsh Ecosystems

(1)
Changes in the type and area of plant communities
During 1987–2022, both the types of plant communities and their distribution areas within the study area changed significantly. Among them, the distribution areas of Spartina alterniflora (S. alterniflora) and Phragmites australis (P. australis) exhibited explosive expansion. Linear regression indicated invasion/expansion rates of 81.97 ha/yr (R2 = 0.94, F1,4 = 115.2, p < 0.001) and 97.42 ha/yr (R2 = 0.83, F1,4 = 49.3, p < 0.01), respectively, with permutation tests confirming statistical significance (p < 0.001 and p < 0.01). Conversely, Suaeda salsa (S. salsa) coverage underwent a drastic decline with a rate of 51.28 ha/yr (R2 = 0.93, F1,4 = 55.6, p < 0.01) based on linear regression. At the early invasion stage of S. alterniflora (1987), the distribution area of S. salsa was the largest in the study area, reaching 2495 ha. The area of P. australis was small and mainly distributed near the embankment (Figure 4a). At this time, the plant communities in the area showed a succession of P. australisS. salsa from land to sea. In 1997, the distribution areas of all three plant types increased. S. alterniflora replaced Spartina anglica, forming several patches in the seaside front area (Figure 4b). Meanwhile, the area of P. australis expanded seaward, forming a continuous distribution belt along the embankment. In 2007, there was a substantial expansion of S. alterniflora, covering an area of 2845 ha, representing a 121.47% increase. A broad northwest-southeast distribution belt formed along the seaside front area (Figure 4c). The area covered by P. australis also experienced rapid growth, reaching 2687 ha. At this time, a vegetation succession of P. australisS. salsaS. alterniflora formed from land to sea. Since 2007, the areas covered by S. alterniflora and P. australis have been expanding rapidly. Notably, P. australis surpassed S. alterniflora in area by 2022. The distribution area of S. alterniflora also increased by 943 ha over 15 years. Conversely, the area covered by S. salsa continued to decline. By 2022, its area was only 438 ha, accounting for 3.78% of the total area (Figure 4f). During this period, the vegetation community transitioned to a more homogeneous vegetation succession of P. australisS. alterniflora.
(2)
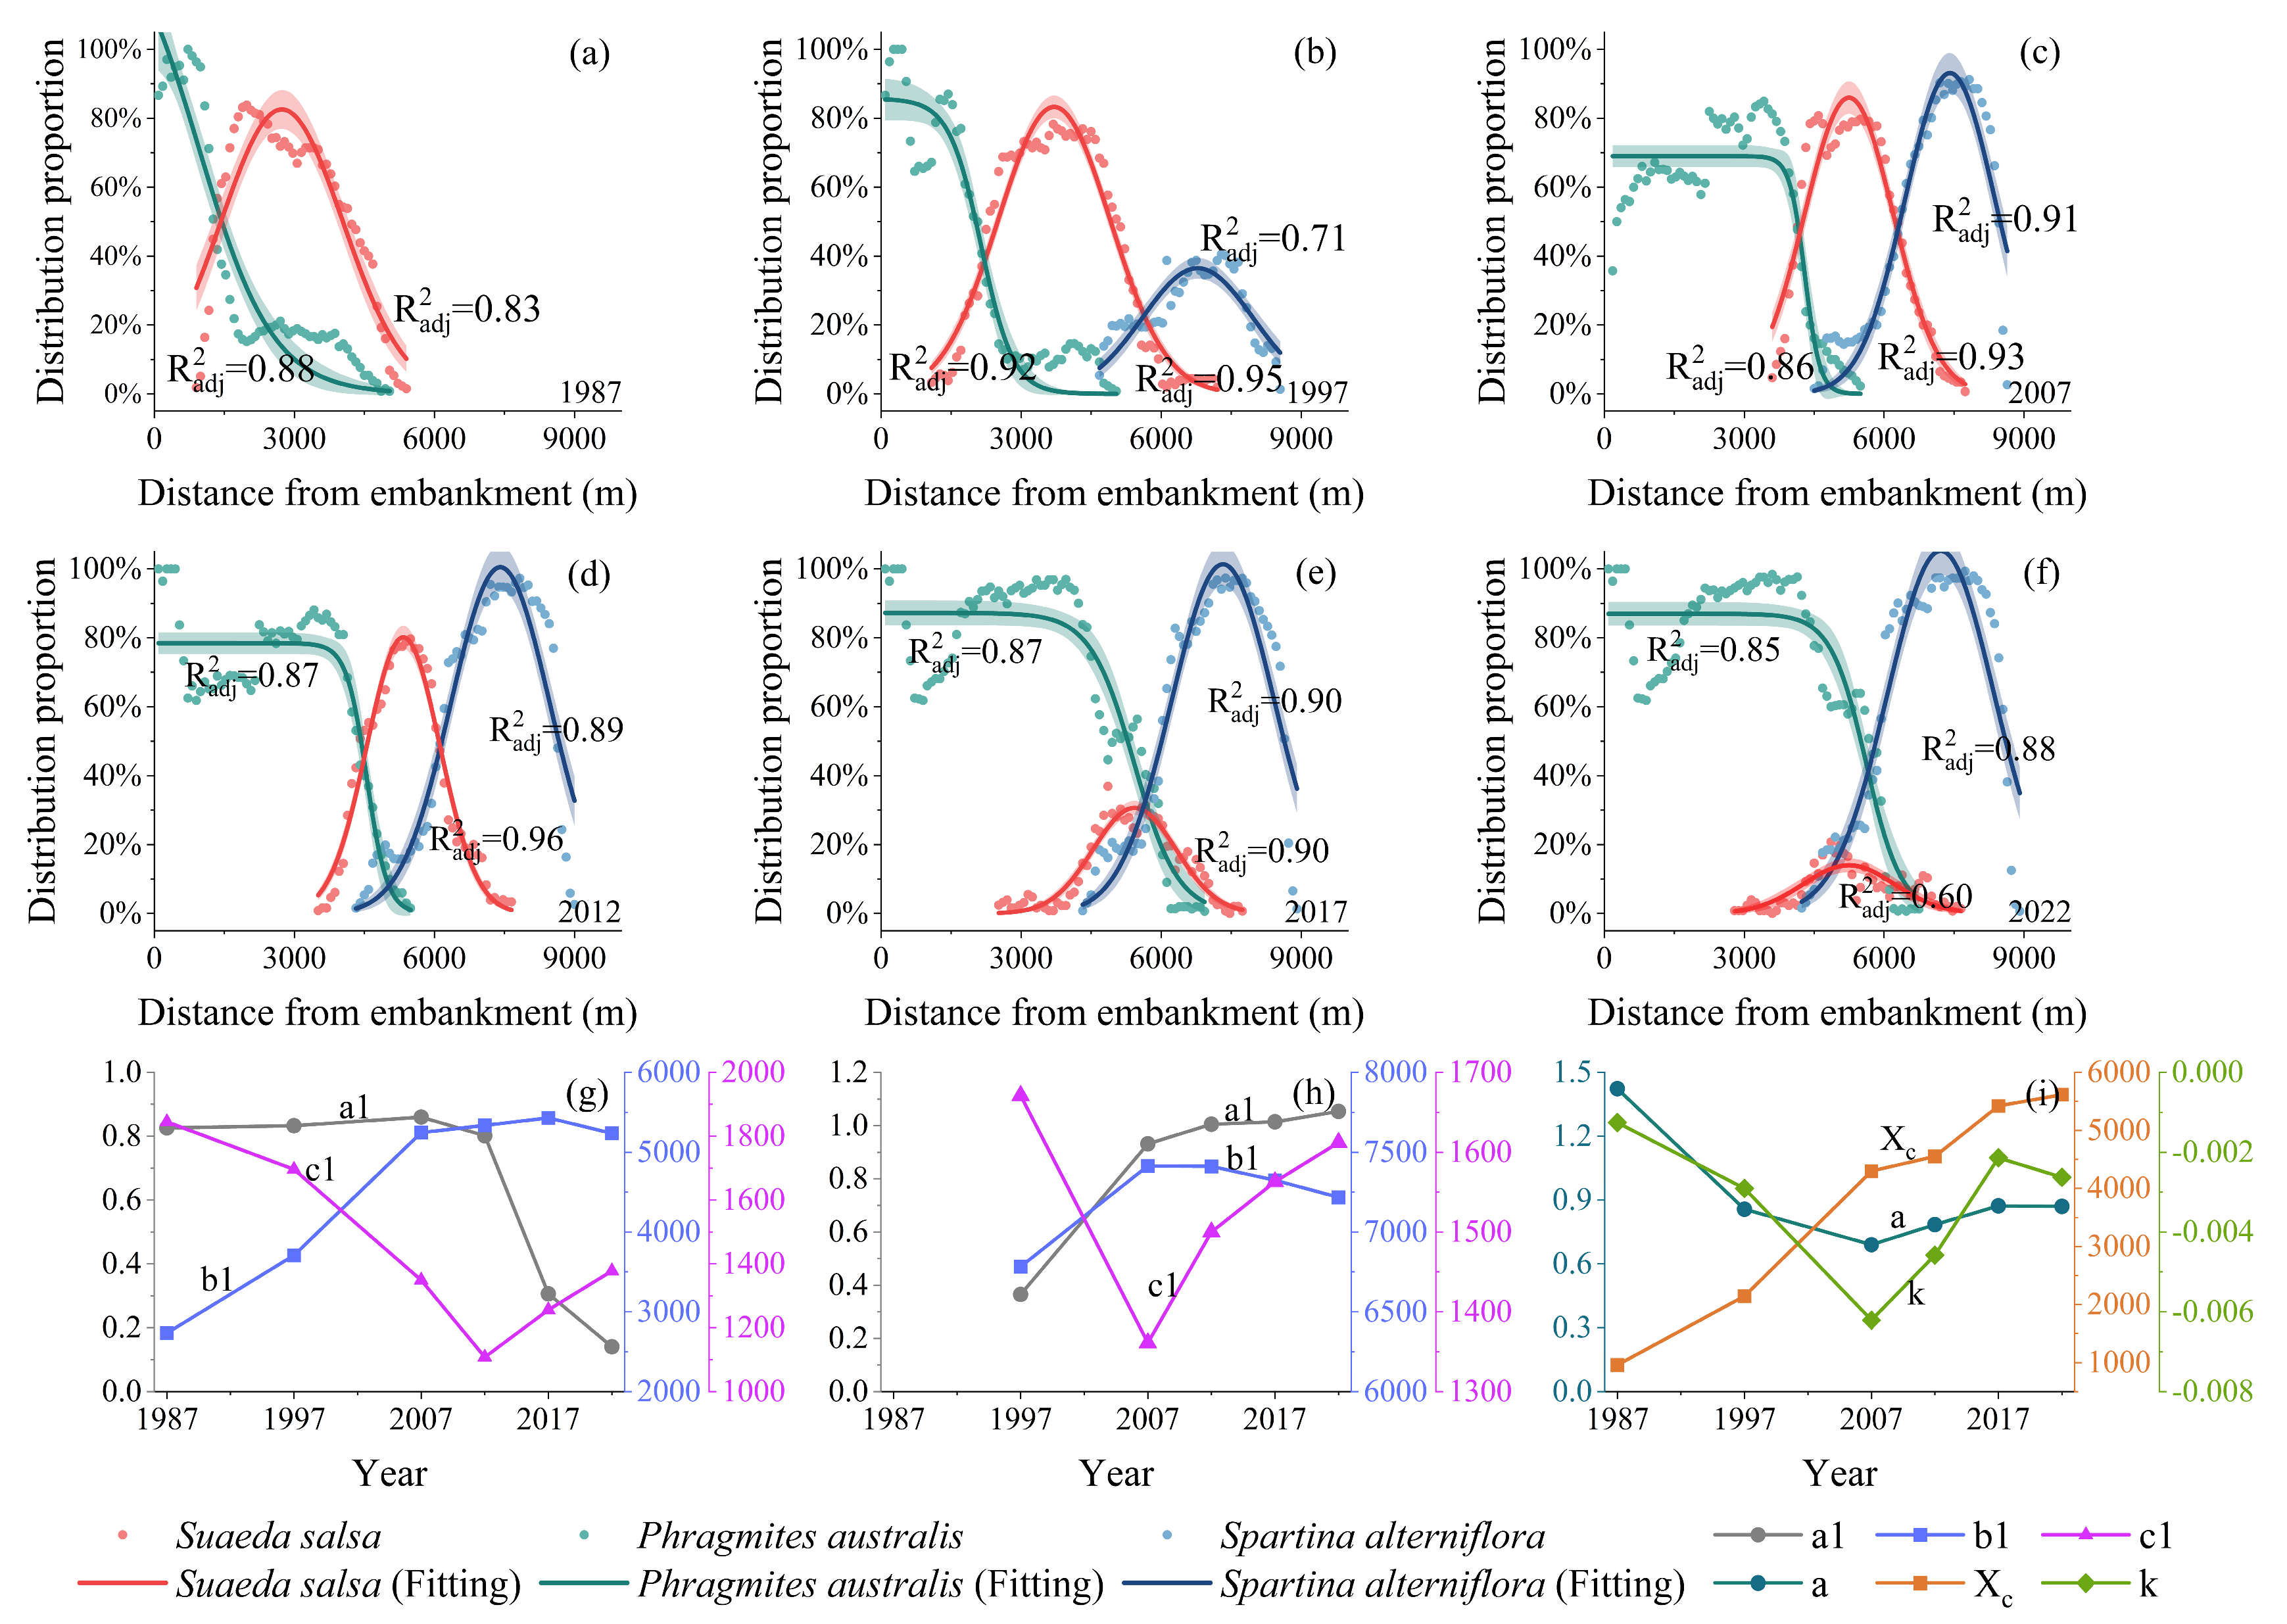
Changes in the spatial distribution pattern of plant communities
As shown in Figure 5, the relationships between the sea–land distribution positions and distribution proportions of the S. alterniflora and S. salsa communities exhibit a single-peaked pattern, while the P. australis community remains relatively stable on the embankment side but declines rapidly seaward. Based on the characteristics of the data, as well as the AIC and R2 results (Supplementary Materials S2), the distribution changes in the P. australis community were best fitted using a logistic model, whereas the distribution changes in the other two plants were fitted using a Gaussian model (Figure 5a–f). The results of the parameters of the modeling are shown in Figure 5g–i.
In 1987, the P. australis community was primarily distributed within a range of 0–5000 m from the embankment, with its dominant ecological niche in the range of 1445 m from the embankment. The distribution of S. salsa partially overlapped with that of P. australis and the proportion of the S. salsa community reached its maximum ( a 1 = 0.83) at 2733 m from the embankment (Figure 5a). In 1997, there was minimal change in the distribution range of the P. australis community (Figure 5b). The distribution range of the S. salsa community shifted seaward, but the width of its dominant ecological niche did not change significantly. S. alterniflora was mainly distributed within 4700 to 8500 m from the embankment, although its area was small. It can be observed that the seaward expansion of the P. australis community and the colonization by S. alterniflora did not significantly affect the width of the dominant ecological niche or the highest distribution proportion of S. salsa at this time. During 1997–2007, the distribution of P. australis continued to expand seaward, with its dominant ecological niche extending significantly to a range of 4142 m from the embankment. However, the peak proportion decreased significantly to 69% (Figure 5c), which was related to the reclamation of part of the P. australis distribution area for aquaculture. Conversely, the distribution range of the S. salsa community showed a marked contraction. The width of its dominant ecological niche decreased significantly by 18%. These findings indicate that the living space of S. salsa was significantly compressed, and its dominant ecological niche shifted seaward. The distribution range of S. alterniflora did not change much compared to that in 1997, but a dominant ecological niche was established, reaching 2146 m. This indicates that S. alterniflora began to become the dominant species in the seaward front area. At this time, the seaward expansion of the P. australis community and the widening of the dominant ecological niche of S. alterniflora began to impact the distribution of S. salsa.
In 2012, the change in the distribution of each vegetation community maintained the characteristics observed in 2007 (Figure 5d). The dominant ecological niche widths of P. australis and S. alterniflora increased, further compressing the living space of S. salsa. Consequently, the dominant ecological niche width and peak proportion of S. salsa declined to 1522 m and 0.8, respectively (Figure 5i). In 2017, the distribution range and dominant ecological niches of P. australis expanded significantly seaward. The distribution range and width of the dominant ecological niche of S. salsa changed less, but the dominant ecological niche disappeared completely, with the peak proportion ( a 1 ) decreasing significantly to 0.3 (Figure 5g). By 2022, the dominant ecological niches of P. australis and S. alterniflora continued to expand, reaching widths of 5500 m and 2782 m, respectively. The peak proportion a1 of S. salsa within the land–sea gradient continued to decrease, and its distribution area further decreased. This suggests that, as the distribution ranges of S. alterniflora and P. australis expanded, the dominant ecological niche of S. salsa encroached upon, even though it maintained its distribution range.

3.2. Analysis of Changes in the Driving Factors and Driving Effects of Vegetation Succession

(1)
Spatial and temporal changes in soil salinity
The soil salinity tended to increase from land to sea. Statistical analysis of soil salinity changes based on the dominant ecological niches of the three plants revealed significant differences in the suitable soil salinity for different salt marsh plants (Figure 6a). Within its dominant ecological niche, P. australis had the lowest soil salinity (average of 0.42%), followed by S. salsa, with a soil salinity of 0.77%. The soil salinity in the area of S. alterniflora was highest, with levels reaching 1.14%. From 1987 to 2022, the soil salinity within the dominant ecological niches of S. salsa varied most significantly (p < 0.05), particularly from 1987 to 2007, with the average salinity increasing from 0.78% to 1.04%. After 2007, the soil salinity began to decline continuously, and the average soil salinity of the salt marsh in the study area decreased to 0.53% by 2022. At this time, the distribution of S. salsa had almost disappeared, transitioning to a state of multispecies symbiosis. The changes in soil salinity within the dominant ecological niches of P. australis and S. alterniflora showed opposite trends. The soil salinity within the P. australis area tended to decrease, with the average salinity decreasing from 0.51% to 0.32%. In contrast, the salinity within the S. alterniflora area generally increased, particularly after 2012, increasing from 1% to 1.31% by 2022. Additionally, this study also analyzed the average salinity change in the distribution areas of P. australis and S. salsa following the stable expansion of S. alterniflora. As shown in Figure 6b, before the establishment of the S. alterniflora distribution belt (2007), changes in soil salinity in the distribution areas of P. australis and S. salsa were not significant (the salinity was approximately 0.72%). However, with increasing duration of invasion, the average salinity in the P. australis and S. salsa ranges continued to decrease. By 2022, the average salinity of the soil had significantly decreased to 0.37%.
(2)
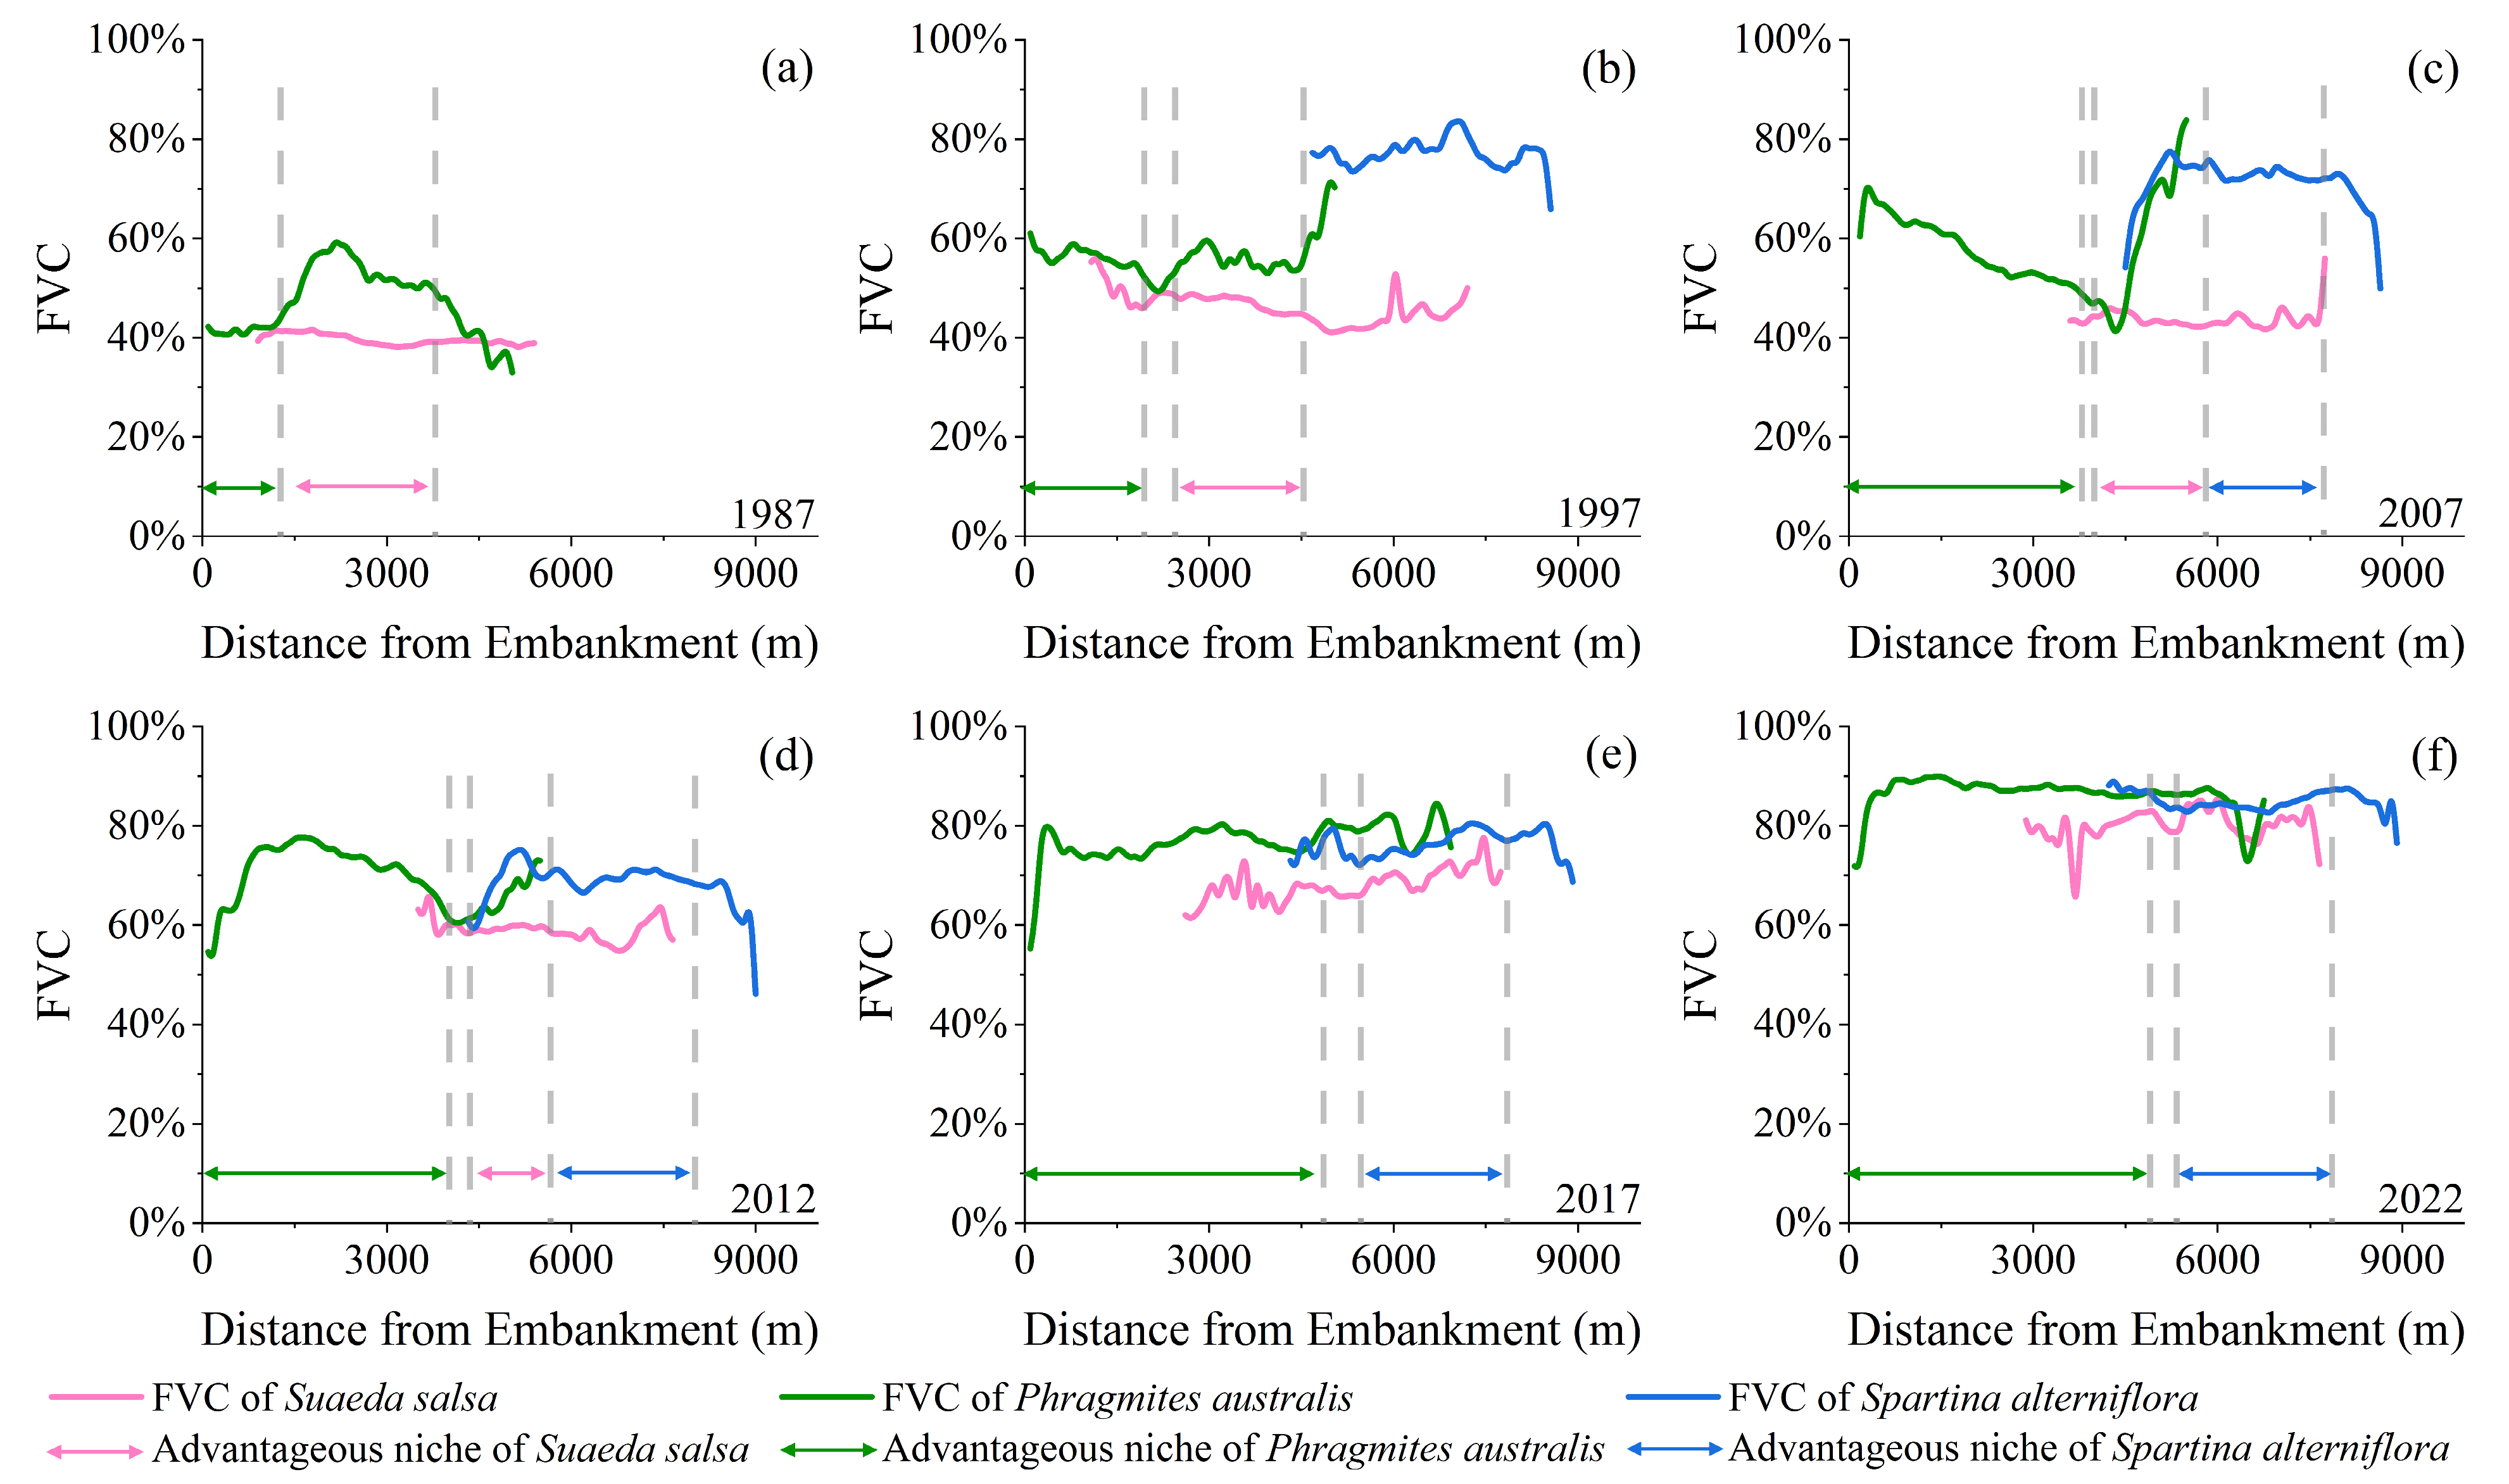
Changes in interspecific interactions based on fractional vegetation cover
From 1987 to 2022, the fractional vegetation cover (FVC) within the study area increased rapidly, with the average FVC increasing from 34.73% to 76.83%. As shown in Figure 7a, coverage was generally low in 1987. The FVCs within the dominant ecological niches of the S. salsa and P. australis communities were 42.08% and 39.63%, respectively. In the areas where the distributions of the two communities overlapped, the coverage of the P. australis community increased slightly but remained below 60% (Figure 7a). From 1987 to 1997, several patchy areas of high cover formed after the colonization and expansion of S. alterniflora on the seaside. The cover of the P. australis and S. salsa communities increased slightly, but a rapid increase in the FVC of P. australis occurred in areas where the three plants coexisted (Figure 7b). In 2007, there were notable differences in the FVC of P. australis in the land–sea direction, with the proportion reaching 70% near the embankment and then continuing to decline towards the sea. Additionally, the FVC of P. australis rose within the dominant ecological niche of S. salsa, achieving a similar vegetation cover (mean FVC of 71.71%) to that of S. alterniflora (Figure 7c). In 2012, the FVC of all three plant communities increased, with the average FVC within the dominant ecological niches of P. australis and S. salsa increasing to 69.47% and 58.95%, respectively. In the areas of plant symbiosis, the increase in the FVC was even more notable (Figure 7d). After 2012, the dominant ecological niche of S. salsa was continuously compressed, but its FVC still maintained an upward trend. By 2022, the FVC within the dominant ecological niche of P. australis reached 86.53%, while the FVC of S. alterniflora slightly increased to 84.97%. During this period, the change in the FVC within the symbiotic zone was minimal (Figure 7e,f). The above results show that, between 1987 and 2022, the study area underwent a transition from an FVC state characterized by low vegetation density and sparse distribution to one characterized by high vegetation density and abundant distribution. In the areas where plants engage in symbiotic relationships, the FVC consistently demonstrated an upwards trend, suggesting intensified competition among the plants.
(3)
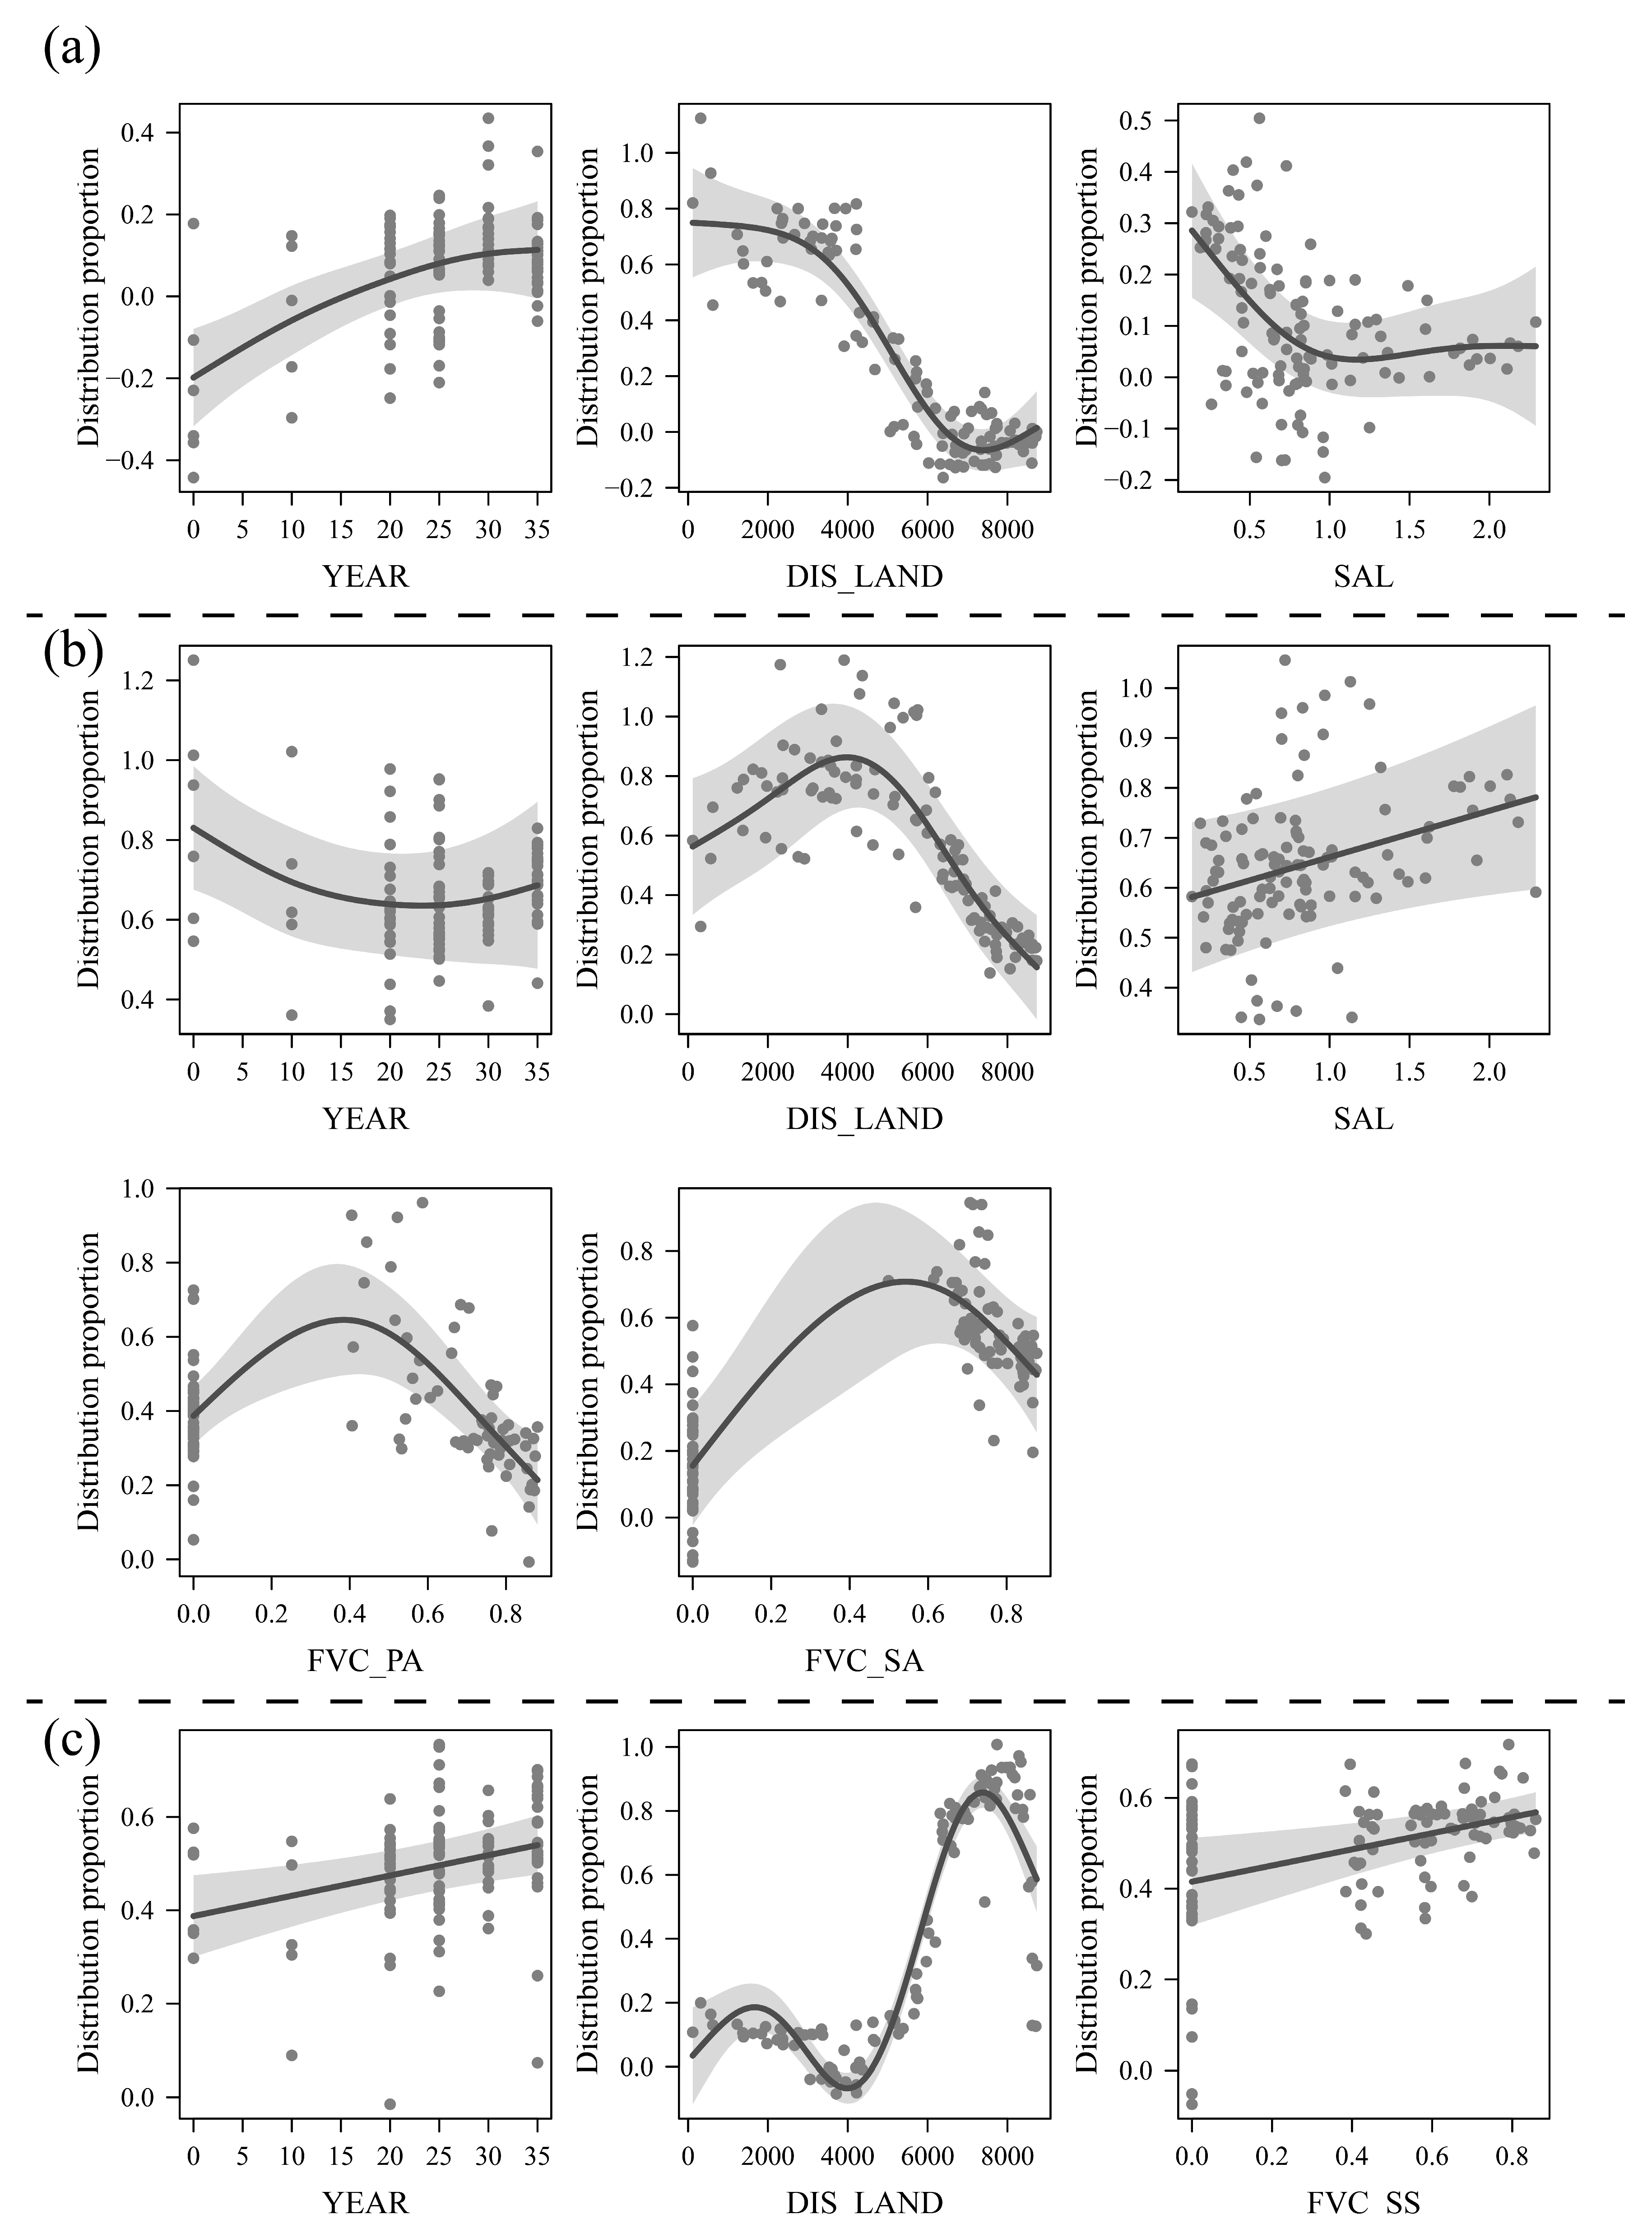
Analysis of the driving effects of different factors on vegetation succession
For the changes in the distribution proportion of the P. australis community, the overall goodness of fit and explanatory power of the GAM reached 0.89 and 89.7%, respectively (more verification results can be found in Supplementary Materials S3). Among them, the factors with significant effects were the invasion duration of S. alterniflora (YEAR, F = 7.40, p < 0.001), distance from the land-side embankment (DIS_LAND, F = 66.93, p < 0.001), and soil salinity (SAL, F = 3.19, p < 0.01). Figure 8a showed that the distribution proportion of P. australis was generally greater in the range of 0–4 km from the embankment. As the distance increased to approximately 6 km, the distribution proportion approached zero. Similarly, the increase in soil salinity caused a rapid decrease in the distribution proportion. When the salinity reached 1.0% or more, the proportion stabilized at a low level. Although the increase in the invasion duration of S. alterniflora was positively correlated with the proportion of P. australis, the magnitude of this effect was small.
Changes in the distribution proportion of S. salsa were significantly related to each of the analyzed factors (Figure 8b). The most significant effects were observed for DIS_LAND (F = 22.46, p < 0.001), the FVC of P. australis (FVC_PA, F = 7.56, p < 0.001), and the FVC of S. alterniflora (FVC_SA, F = 13.37, p < 0.001). The area approximately 4 km from the embankment had the highest proportion of S. salsa distribution, from which it gradually decreased in both the landward and seaward directions. The distribution proportion of S. salsa decreased significantly as the FVC of adjacent P. australis and S. alterniflora areas increased, reaching 0.4 and 0.5, respectively. The invasion duration of S. alterniflora (F = 2.67, p < 0.05) and salinity (F = 4.59, p < 0.05) also had a significant effect on the distribution proportion of S. salsa, but the effect was shown to be monotonically variable. Specifically, the increase in soil salinity promoted a positive increase in the proportion, but the number of years of invasion was inversely correlated with the distribution proportion of S. salsa. The changes in the distribution proportion of S. alterniflora were influenced by three main factors, namely, YEAR (F = 9.38, p < 0.01), DIS_LAND (F = 135.70, p < 0.001), and FVC_SS (F = 7.83, p < 0.01) (Figure 8c), and the effects of soil salinity were not significant. Increasing values of all three factors had a positive effect on the distribution proportion of S. alterniflora, especially the distance from the embankment, which reached its highest proportion when the distance from the embankment reached approximately 8 km.

4. Discussion

4.1. Coupling of Major Biotic and Abiotic Factors with Salt Marsh Vegetation Succession

The use of satellite remote sensing images to map vegetation distributions and interaction information into geographic space, combined with spatiotemporal variations in environmental factors, can be used to effectively evaluate the coupling of biological and geographic environmental features with vegetation successional changes [53]. In coastal salt marshes, salinity and tidal action are key environmental factors affecting the distribution of vegetation communities [15,54]. The results of the GAM revealed that changes in salinity had opposite effects on the distributions of P. australis and S. salsa. Owing to osmotic stress and ionic toxicity, P. australis can adapt to only low-to-moderate levels of salt stress, particularly thriving under slightly saline conditions (0.5%), which provides a better growth response than does to a salt-free environment [55]. However, with increasing salinity, the emergence of P. australis seedlings is significantly inhibited, and both growth height and plant basal diameter tend to decrease [56]. For S. salsa, increased salinity has been shown to promote above- and belowground biomass [57]. For S. alterniflora, while the effect of salinity variation on its distribution proportion was not significant, this finding did not imply that salinity had no impact on its growth. In contrast, excessive salinity also inhibited tillering and seed germination in S. alterniflora [58]. However, due to its ion repulsion mechanism and salt-secreting properties, S. alterniflora can effectively reduce the damage caused by high salinity to plant tissues [59]. Since the range of salinity tolerance matched the salinity variation in the seaward frontal region, the soil salinity variation within this region did not significantly affect the distribution of S. alterniflora.
Tidal action is another major factor influencing the distribution of S. alterniflora. During the seed stage, tidewater carries S. alterniflora seeds moving in the coastal wetlands and promotes seed redistribution through flotation and secondary dispersal [60]. By the seedling establishment stage, the strong hydrodynamic environment in the frontal region often drags or erodes surface sediment around S. alterniflora plants, causing seedling displacement [61]. When the hollow microtopography captures tidally carried seeds or seedlings and quickly fixes them, dense patches of S. alterniflora gradually form [62]. However, the expansion of S. alterniflora equally relies on specific tidal inundation conditions. In land-ward areas of the coast, lower inundation depths and frequencies prevent seed germination. Conversely, in the seaward, increasing inundation frequency induces a positive response in seedling establishment density [63]; however, when average inundation duration exceeds 11 h/d, seedling survival rate plummets below 10% [64]. The impact of tidal action (inundation depth and duration) on plant height and aboveground biomass of S. alterniflora manifests as a significant unimodal response pattern. The optimal ecological range occurs at inundation depths of 0.37–0.39 m and single-event durations of 4.12–4.13 h, where both plant height and biomass accumulation peak [15]. The suitable inundation environment formed through seaward accretion persistently promotes the rapid expansion of S. alterniflora, while the dispersive patches created by its expansion essentially determine its distribution range. The expansion and merging of these patches gradually establish their dominant ecological niche. Conversely, in land-ward regions, although both inundation depth and frequency significantly decrease, they remain subject to lower tidal influence. The gradual formation of a dominant ecological niche by P. australis in this area indicates that the influence of low tidal action on their distribution and expansion is relatively small. Research of Song et al. also indicates P. australis’s high tolerance to inundation depths below 30 cm [65], further supporting the result in GAM. For S. salsa, the change in depth and frequency of flooding towards land alleviates the growth stress caused by tidal effects. Therefore, the distribution area of S. salsa was generally located in the middle region affected by tides.
In addition to abiotic factors, such as environmental elements, interspecific interactions are equally important in determining plant distribution patterns and shaping plant community structure [66]. Whether positive or negative, interactions between plants may cause changes in plant community dynamics [67]. In particular, the plant traits related to competitive ability and resource use can aid in the analysis of ecological niche differences between plants [11,68]. Generally, under any non-resource stress condition, taller plants and a greater density distribution indicate a stronger competitive advantage [30]. Since the invasion stage, S. alterniflora has responded to strong hydrodynamic disturbances in seaward front areas and mutual competition among vegetation through very high vegetation densities [62]. The P. australis populations have undergone a transformation from low to high densities. The increased vegetation density resulted in a well-developed root system that created a more open soil structure, thereby enhancing soil water infiltration and retention. Concurrently, the tall, dense stems and leaves reduced evapotranspiration and water dissipation, effectively lowering soil salinity within its distribution range. This created positive feedback that supported the seaward expansion of the P. australis community [23,69]. In direct competition with S. salsa, the increasing FVC of S. alterniflora and P. australis provided a clear competitive advantage, resulting in the compression of S. salsa’s habitat and a reduction in its distribution range and dominant ecological niche width.

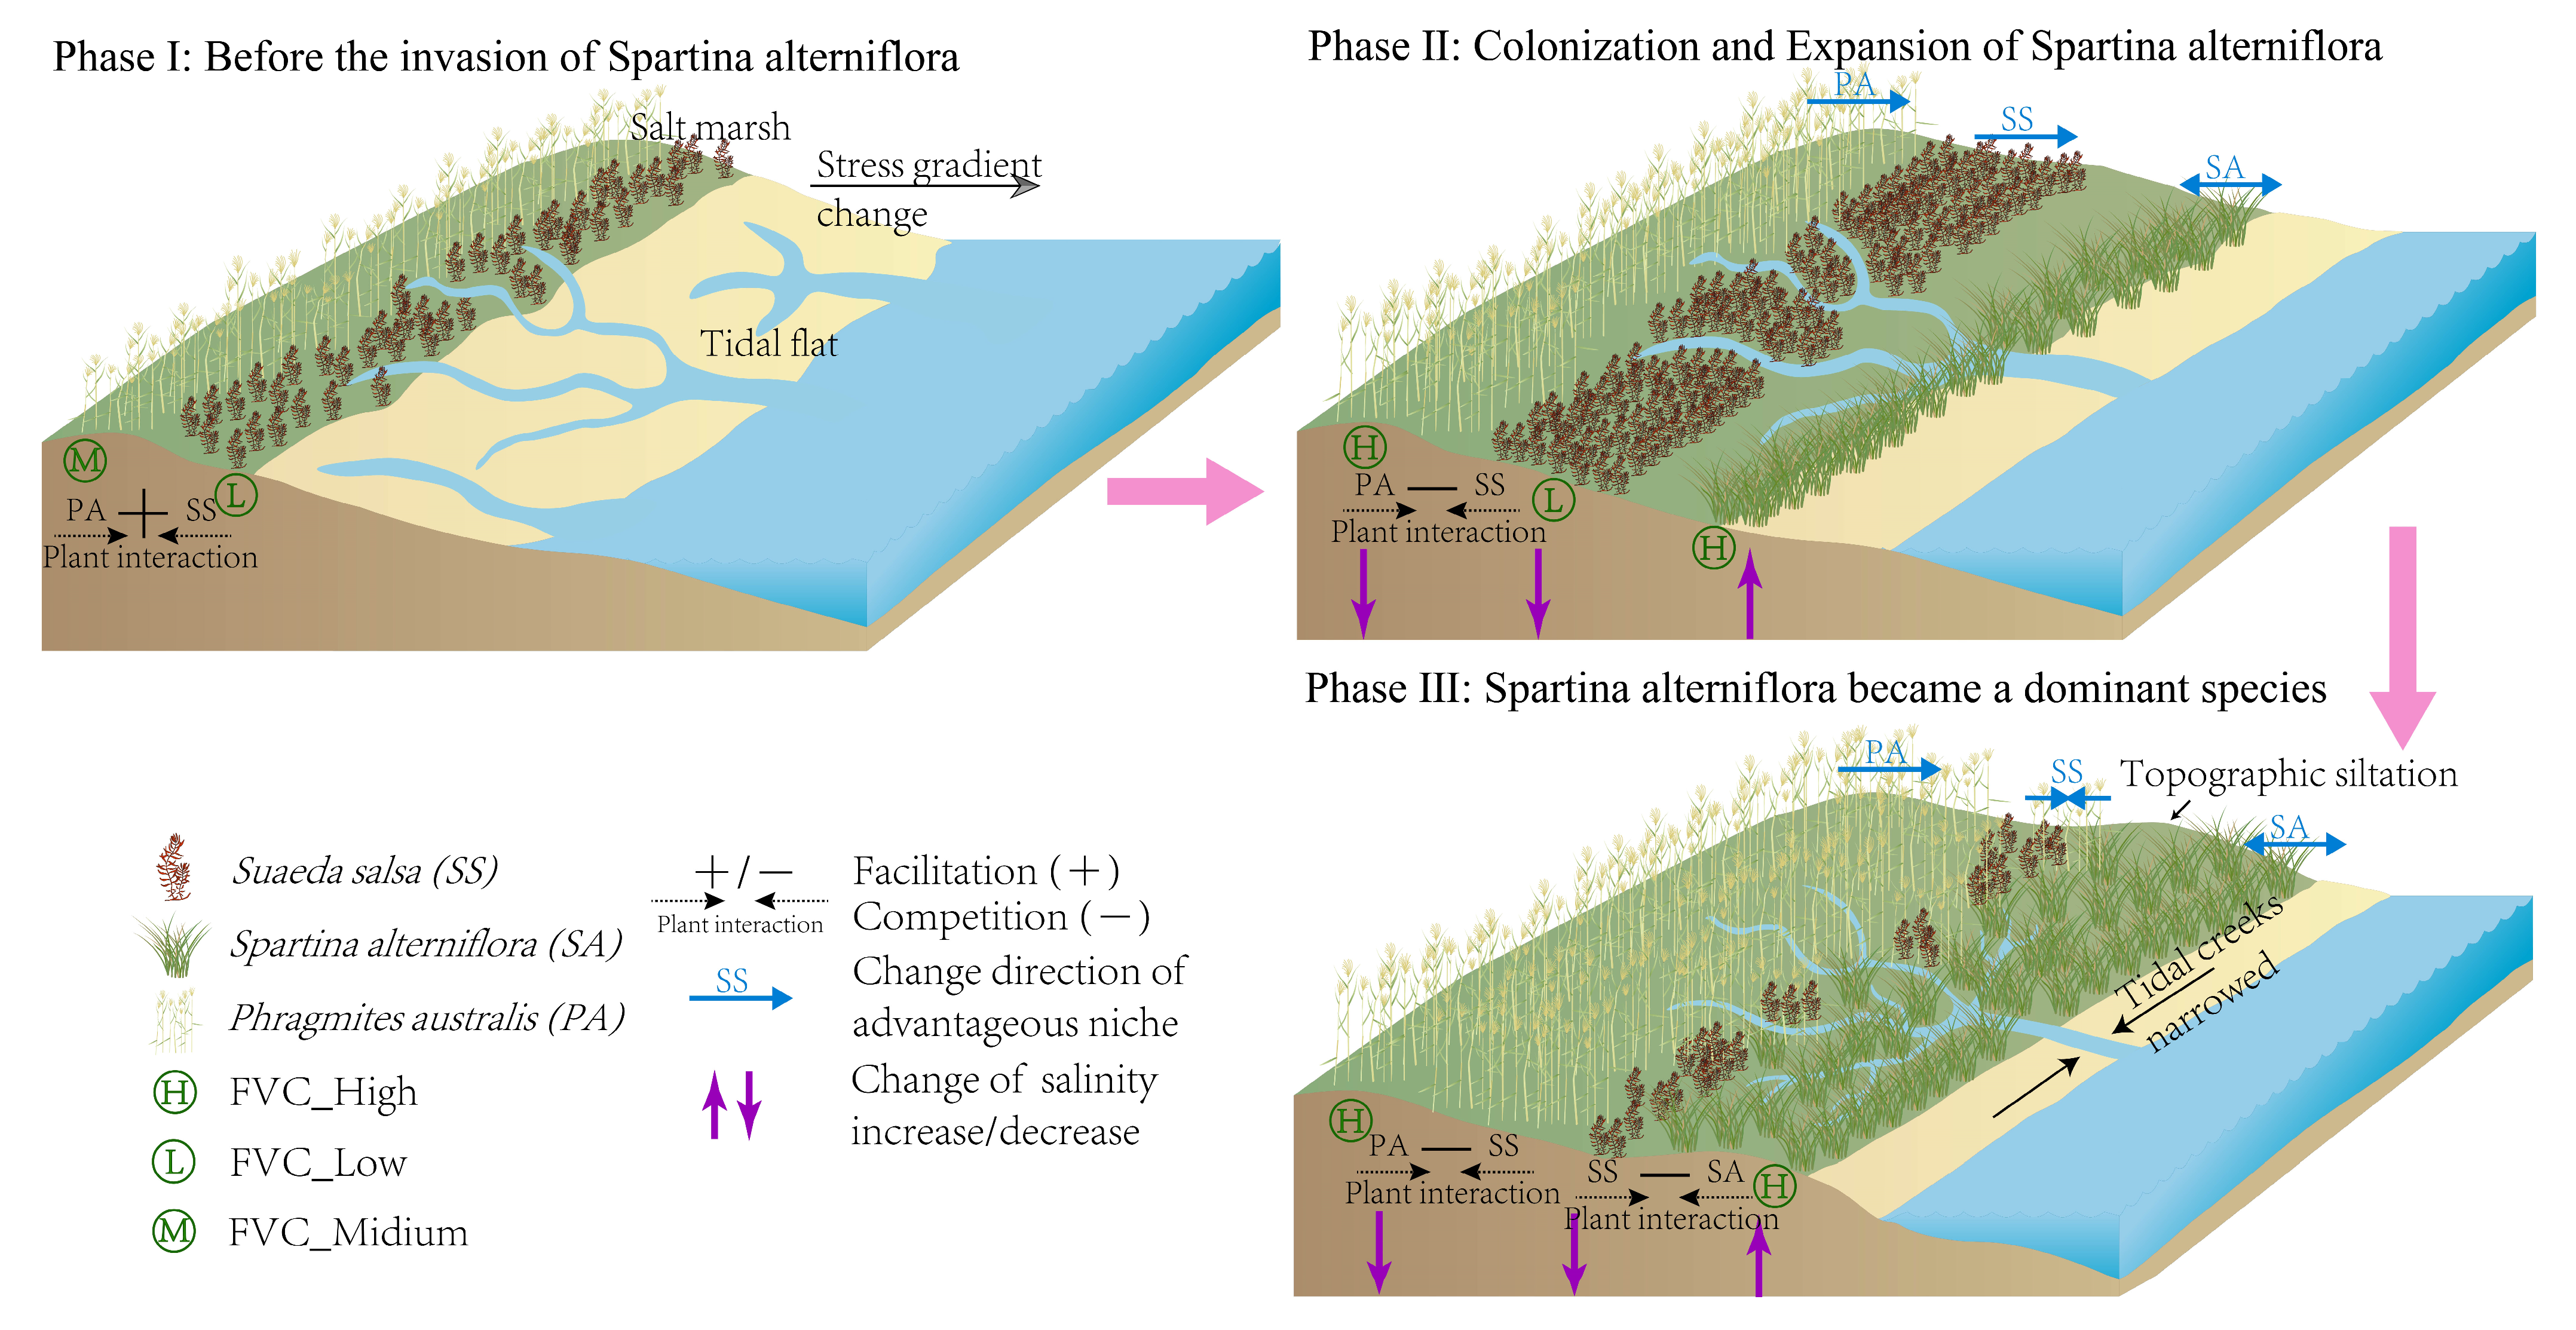
4.2. Mechanisms of the Impact of Biological Invasions on Changes in Vegetation Succession

As S. alterniflora continues to expand, its role as an “ecosystem engineer” gradually strengthens, thereby modifying regional environmental factors and ecological processes to create new environmental filters. These filters impact indigenous plants, causing significant changes in the growth and distribution of indigenous vegetation. The spatial and temporal accumulation of these changes is expressed as vegetation succession [53,70]. Before the invasion of species, the establishment and distribution of indigenous plants were primarily directly related to stress gradients. As observed in this study, the indigenous vegetation was mainly composed of P. australis and S. salsa and the variations in tidal and salinity gradients were the main stress factors [15]. Under high abiotic stress conditions, S. salsa grew in coastal pioneer positions because of its relatively high salt tolerance, whereas P. australis was distributed close to embankments. At this time, the coverage of both plants was moderate, and their interactions were generally balanced or mutually facilitated, resulting in the initial succession of P. australisS. salsa [71].
With the introduction of S. alterniflora, the composition and structure of vegetation in regional ecosystems have begun to change, gradually revealing new successional trajectories. Overall, there are two main pathways through which invasive species impact vegetation succession: direct competition, where invasive species exert pressure on recipient communities through competition [72], or indirect effects, where invasive species impact ecological processes or utilize cascade effects, indirectly leading to the degradation or disappearance of indigenous plants [68]. During the colonization of S. alterniflora in the study area, it occupied the vacant ecological niche on the seaward side, reducing niche overlap with indigenous plants (such as S. salsa) and alleviating competition pressure during establishment (as shown in Stage II of Figure 9). By the stable expansion phase following its establishment (approximately 1997), the distribution area of S. alterniflora was still small, and it had not yet become a dominant species; thus, its competitive advantage had a minimal impact on indigenous plants. With rapid expansion in the seaward and landward directions, a broad distribution belt of S. alterniflora has formed in the seaward frontal region, establishing a vegetation succession of P. australisS. salsaS. alterniflora from land to sea. Tall, dense plants significantly buffer tidal movements, continuously reducing the transportation capacity of tidal flows. As a result, the topography within its distribution area has gradually elevated due to siltation; thus, a biological dike has formed [73]. The originally wide tidal creeks gradually became canalized and severely shrank, making it difficult for periodic tidal water to enter the former distribution area of S. salsa, and the range affected by tidal action continued to decrease [33]. Under the leaching effect of rainfall, the soil salinity in the land-side area gradually declined [23].
With the alleviation of stress conditions, the interaction between S. salsa and P. australis has shifted from balance/facilitation to a competitive state [47]. P. australis began to expand seaward and encroached upon the original habitat of S. salsa. Under the dual impact of environmental changes and plant competition, the distribution range of S. salsa moved seaward and overlapped ecologically with that of S. alterniflora in the seaward direction. The tall and dense plants in the distribution belt effectively ensured the competitive advantage of S. alterniflora [68]. Therefore, when facing indigenous plants with similar ecological niches, S. alterniflora used its competitive advantage and allelopathy to inhibit and replace neighboring plants [25]. In addition to direct competitive advantages, research by Ning et al. found that sedimentary morphological changes (such as the formation of marginal depressions) caused by the expansion of S. alterniflora significantly reduce the biotic resistance of native plant communities (such as S. salsa) to plant invasion, further diminishing their competitive ability. This may also be an important factor in the rapid decline of S. salsa [13]. Collectively, the above direct/indirect effects inhibit the growth and distribution of S. salsa, leading to a shift in vegetation succession towards homogenization. Following its invasion, S. alterniflora alters ecological processes to affect the growth status of native plants, leading to the transition of the originally diverse invaded ecosystem to monospecific dense communities. This scenario has widely occurred in wetland ecosystems impacted by S. alterniflora invasion in countries such as South Korea and the United States [74,75].
As an ecosystem engineer, S. alterniflora modified environmental elements to drive changes in ecological processes and expanded the suitable spatial niche for P. australis towards the sea, thereby promoting the expansion of P. australis. This process also mechanistically elucidates the theory of “long-distance interactions” proposed by Wang et al. that long-distance, cross-ecosystem interactions at intermediate landscape scales can significantly influence the structure, function, and resilience of ecological systems [49]. Moreover, P. australis has developed growth and trait characteristics that promote its expansion or coexistence with invasive species. The most notable characteristic was the increase in plant density within the population, thus forming positive feedback that promoted self-expansion [69]. However, as the salinity gradient increased towards the sea when salt stress exceeded the physiological tolerance of P. australis, this promoting effect gradually collapsed [60]. As P. australis expanded towards the sea, its ecological niche overlapped with that of S. salsa. At this time, the distribution area of S. salsa was encroached upon by P. australis and formed small discrete patches. Thus, it is presented as a small change in the distribution range but a significant loss in area.
However, while this study reveals the driving mechanisms of soil salinity, tidal action, and plant–plant interactions on coastal wetland vegetation succession under S. alterniflora invasion, it is crucial to consider more comprehensive quantitative factors for fully analyzing the S. alterniflora alters biotic/abiotic factors and step impacts on regional ecosystem structure and function. Future research will continue to integrate high-precision topographic data and in situ hydrological monitoring metrics and incorporate anthropogenic disturbance factors to systematically elucidate the mechanisms of the ecological impacts of S. alterniflora invasion under the interactions of natural–anthropogenic factors.

5. Conclusions

The development and application of remote sensing data provide a new and effective approach for studying the impact of invasive species on salt marsh vegetation succession at the ecosystem scale. This study comprehensively employed diverse methods such as remote sensing big data analysis and generalized additive models to extract the characteristics of vegetation succession in the coastal salt marsh of Yancheng after the S. alterniflora invasion (from 1987 to 2022). By combining data on soil salinity, invasion duration, and fractional vegetation cover, this study identified significant biotic and abiotic factors affecting vegetation succession in the salt marsh and explored the relationships between biological invasion events and changes in the salt marsh ecosystem. The research results revealed that (1) during the early invasion of S. alterniflora, the regional vegetation reached its initial state due to environmental stress. Following stable expansion, significant alterations in regional succession occurred due to shifts in biotic interactions and environmental filtering. (2) The expansion of S. alterniflora significantly altered the regional salinity distribution, with soil salinity within the areas of P. australis and S. salsa showing a marked decline. (3) Soil salinity, tidal action, and the duration of S. alterniflora invasion significantly affected the distributions of S. salsa and P. australis. Additionally, interspecific interactions were another important factor influencing the reduction in S. salsa. The distribution proportion of S. alterniflora was mainly influenced by tidal action and interspecific interactions, with salinity changes having a less significant impact. These findings suggested that invasive species alter regional ecological processes through interspecific interaction and environmental modifications, affecting vegetation distribution and ecosystem structure and ultimately leading to changes in vegetation succession within the ecosystem. Therefore, when implementing restoration projects following S. alterniflora removal or management, ecological process restoration measures must be prioritized. This includes reconstructing topographic gradients along the saltmarsh foreshore; excavating and reconstructing tidal creeks to restore tidal hydrological processes; and controlling P. australis expansion through measures like mowing. These actions are essential to restore the original plant succession trajectory.

Supplementary Materials

The following supporting information can be downloaded at: https://www.mdpi.com/article/10.3390/land14081523/s1, Table S1: Validation results of typical plant community type classification accuracy; Table S2: Comparison of fitting models for land-sea distribution proportions of three vegetation; Figure S3.1: Phragmites australis Model Diagnostic Plots; Figure S3.2: Suaeda salsa Model Diagnostic Plots; Figure S3.3: Spartina alterniflora Model Diagnostic Plots.

Author Contributions

Y.Z.: conceptualization, methodology, software, writing—original draft, and writing—review and editing. C.Q.: conceptualization, software, writing—original draft, and writing—review and editing. H.L.: conceptualization, methodology, writing—original draft, and writing—review and editing. Y.L.: conceptualization, writing—original draft, and writing—review and editing. C.W.: conceptualization, writing—original draft, and writing—review and editing. G.W.: investigation, data analysis, and writing—review and editing. M.S.: investigation and data analysis. C.H.: investigation and data analysis. All authors have read and agreed to the published version of the manuscript.

Funding

This research was supported by the Yellow Sea Wetland Research Project (HHSDKT202309), the Jiangsu Forestry Science and Technology Innovation and Extension Program (LYKJ [2022]03), and the National Natural Science Foundation of China (Nos. 31971547, 32201346, and 32271662).

Data Availability Statement

Data will be made available on request.

Conflicts of Interest

The authors declare that they have no known competing financial interests or personal relationships that could have appeared to influence the work reported in this paper.

References

  1. Poorter, L.; Amissah, L.; Bongers, F.; Hordijk, I.; Kok, J.; Laurance, S.; Lohbeck, M.; Martínez-Ramos, M.; Matsuo, T.; Meave, J.; et al. Successional theories. Biol. Rev. 2023, 98, 2049–2077. [Google Scholar] [CrossRef] [PubMed]
  2. Shugart, H.H. Ecological succession and community dynamics. In Encyclopedia of Sustainability Science and Technology; Springer: New York, NY, USA, 2012; pp. 3278–3296. [Google Scholar]
  3. Li, T.; Yang, H.; Yang, X.; Guo, Z.; Fu, D.; Liu, C.; Li, S.; Pan, Y.; Zhao, Y.; Xu, F.; et al. Community assembly during vegetation succession after metal mining is driven by multiple processes with temporal variation. Ecol. Evol. 2022, 12, e8882. [Google Scholar] [CrossRef] [PubMed]
  4. Purschke, O.; Schmid, B.C.; Sykes, M.T.; Poschlod, P.; Michalski, S.G.; Durka, W.; Kühn, I.; Winter, M.; Prentice, H.C. Contrasting changes in taxonomic, phylogenetic and functional diversity during a long-term succession: Insights into assembly processes. J. Ecol. 2013, 101, 857–866. [Google Scholar] [CrossRef]
  5. Måren, I.E.; Kapfer, J.; Aarrestad, P.A.; Grytnes, J.; Vandvik, V. Changing contributions of stochastic and deterministic processes in community assembly over a successional gradient. Ecology 2017, 99, 148–157. [Google Scholar] [CrossRef] [PubMed]
  6. Das Gupta, S.; Pinno, B.D. Spatial patterns and competition in trees in early successional reclaimed and natural boreal forests. Acta Oecol. 2018, 92, 138–147. [Google Scholar] [CrossRef]
  7. Han, T.; Ren, H.; Hui, D.; Zhu, Y.; Lu, H.; Guo, Q.; Wang, J. Dominant ecological processes and plant functional strategies change during the succession of a subtropical forest. Ecol. Indic. 2023, 146, 109885. [Google Scholar] [CrossRef]
  8. Crooks, J.A. Characterizing ecosystem-level consequences of biological invasions: The role of ecosystem engineers. Oikos 2002, 97, 153–166. [Google Scholar] [CrossRef]
  9. Walsh, J.R.; Carpenter, S.R.; Vander Zanden, M.J. Invasive species triggers a massive loss of ecosystem services through a trophic cascade. Proc. Natl. Acad. Sci. USA 2016, 113, 4081–4085. [Google Scholar] [CrossRef] [PubMed]
  10. Meiners, S.J.; Rye, T.A.; Klass, J.R. On a level field: The utility of studying native and non-native species in successional systems. Appl. Veg. Sci. 2009, 12, 45–53. [Google Scholar] [CrossRef]
  11. Muñoz-Rodríguez, A.F.; Infante-Izquierdo, M.D.; Polo-Ávila, A.; Hermoso-López, V.; Nieva, F.J.J.; Gallego-Tévar, B.; Castillo, J.M. Recruitment niche segregation of halophytes along the tidal gradient. Estuar. Coast. Shelf Sci. 2024, 305, 108859. [Google Scholar] [CrossRef]
  12. Prach, K.; Walker, L.R. Four opportunities for studies of ecological succession. Trends Ecol. Evol. 2011, 26, 119–123. [Google Scholar] [CrossRef] [PubMed]
  13. Ning, Z.; Chen, C.; Xie, T.; Li, S.; Zhu, Z.; Wang, Q.; Cai, Y.; Bai, J.; Cui, B. Invasive plant indirectly affects its self-expansion and native species via bio-geomorphic feedbacks: Implications for salt marsh restoration. CATENA 2023, 226, 107056. [Google Scholar] [CrossRef]
  14. Zhu, K.-H.; Zeng, J.; Ge, Z.-M.; Zuo, Y.; Li, S.-H.; Zhao, L.-H.; Han, Y.; Cheng, H.-F.; Xin, P. A model coupling ecological and hydrodynamic processes for simulating the biogeomorphology of a coastal salt marsh. Ecol. Modell. 2024, 493, 110758. [Google Scholar] [CrossRef]
  15. Yan, D.; Li, J.; Yao, X.; Luan, Z. Integrating UAV data for assessing the ecological response of Spartina alterniflora towards inundation and salinity gradients in coastal wetland. Sci. Total Environ. 2022, 814, 152631. [Google Scholar] [CrossRef] [PubMed]
  16. Ivajnšič, D.; Šajna, N.; Kaligarič, M. Primary succession on re-created coastal wetland leads to successful restoration of coastal halophyte vegetation. Landsc. Urban Plan. 2016, 150, 79–86. [Google Scholar] [CrossRef]
  17. Zhou, Z.; Hua, J.; Xue, J. Salinity drives shifts in soil microbial community composition and network complexity along vegetation community succession in coastal tidal flats. Estuar. Coast. Shelf Sci. 2022, 276, 108005. [Google Scholar] [CrossRef]
  18. Veldhuis, E.R.; Schrama, M.; Staal, M.; Elzenga, J.T.M. Plant stress-tolerance traits predict salt marsh vegetation patterning. Front. Mar. Sci. 2019, 5, 501. [Google Scholar] [CrossRef]
  19. Wang, A.; Gao, S.; Jia, J. Impact of Spartina alterniflora on sedimentary and morphological evolution of tidal salt marshes of Jiangsu, China. Hai Yang Xue Bao 2006, 28, 92–99. (In Chinese) [Google Scholar]
  20. Seo, J.Y.; Choi, S.M.; Ha, H.K. Assessment of potential impact of invasive vegetation on cohesive sediment erodibility in intertidal flats. Sci. Total Environ. 2021, 766, 144493. [Google Scholar] [CrossRef] [PubMed]
  21. Zhou, S.; Wang, C.; Li, Y.; Huang, W.; Jia, Y.; Wang, Y.; Xu, W.; Qiu, C.; Liu, H. Study on spatio-temporal variation and hydrological connectivity of tidal creek evolution in Yancheng coastal wetlands. Environ. Sci. Pollut. Res. 2022, 30, 37143–37156. [Google Scholar] [CrossRef] [PubMed]
  22. Yu, D.; Han, G.; Wang, X.; Zhang, B. Effects of Spartina alterniflora invasion on morphological characteristics of tidal creeks and plant community distribution in the Yellow River Estuary. Chin. J. Ecol. 2022, 41, 42–49. (In Chinese) [Google Scholar]
  23. Lorrain-Soligon, L.; Robin, F.; Bertin, X.; Jankovic, M.; Rousseau, P.; Lelong, V.; Brischoux, F. Long-term trends of salinity in coastal wetlands: Effects of climate, extreme weather events, and sea water level. Environ. Res. 2023, 237, 116937. [Google Scholar] [CrossRef] [PubMed]
  24. Song, J.; Liang, Z.; Li, X.; Wang, X.; Chu, X.; Zhao, M.; Zhang, X.; Li, P.; Song, W.; Huang, W.; et al. Precipitation changes alter plant dominant species and functional groups by changing soil salinity in a coastal salt marsh. J. Environ. Manag. 2024, 368, 122235. [Google Scholar] [CrossRef] [PubMed]
  25. Li, S.; Ge, Z.-M.; Tan, L.-S.; Xie, L.-N.; Li, Y.-L. Multiple competitive superiority made a great successful invasion of Spartina alterniflora in Eastern China: Hints for management. J. Environ. Manag. 2025, 389, 126287. [Google Scholar] [CrossRef] [PubMed]
  26. Huang, Y.; Liu, Z.; Zheng, G.; Zhao, C. Identification of Spartina alterniflora habitat expansion in a Suaeda salsa dominated coastal wetlands. Ecol. Indic. 2022, 145, 109704. [Google Scholar] [CrossRef]
  27. Kulmatiski, A. Exotic plants establish persistent communities. Plant Ecol. 2006, 187, 261–275. [Google Scholar] [CrossRef]
  28. Nawaz, M.; Sun, J.; Shabbir, S.; Khattak, W.A.; Ren, G.; Nie, X.; Bo, Y.; Javed, Q.; Du, D.; Sonne, C. A review of plants strategies to resist biotic and abiotic environmental stressors. Sci. Total Environ. 2023, 900, 165832. [Google Scholar] [CrossRef] [PubMed]
  29. Muench, A.; Elsey-Quirk, T. Competitive reversal between plant species is driven by species-specific tolerance to flooding stress and nutrient acquisition during early marsh succession. J. Appl. Ecol. 2019, 56, 2236–2247. [Google Scholar] [CrossRef]
  30. Ma, S.; Ren, J.; Wu, C.; He, Q. Extreme precipitation events trigger abrupt vegetation succession in emerging coastal wetlands. CATENA 2024, 241, 108066. [Google Scholar] [CrossRef]
  31. Zhou, Y.; Zhang, D.; Cutler, M.E.J.; Xu, N.; Wang, X.H.; Sha, H.; Shen, Y. Estimating muddy intertidal flat slopes under varied coastal morphology using sequential satellite data and spatial analysis. Estuar. Coast. Shelf Sci. 2021, 251, 107183. [Google Scholar] [CrossRef]
  32. Kuai, Y.; Tao, J.; Zhou, Z.; Aarninkhof, S.; Wang, Z.B. Sediment characteristics and intertidal beach slopes along the Jiangsu Coast, China. J. Mar. Sci. Eng. 2021, 9, 347. [Google Scholar] [CrossRef]
  33. Fan, X.; Zhang, L.; Yuan, L.; Guo, B.; Zhang, Q.; Wang, Y.; Wu, Q. Loss of tidal creek ecosystem vitality caused by tidal flat narrowing on the central Jiangsu coast, China. Sci. Total Environ. 2023, 864, 161216. [Google Scholar] [CrossRef] [PubMed]
  34. Wang, C.; Liu, H.; Li, Y.; Dong, B.; Qiu, C.; Yang, J.; Zong, Y.; Chen, H.; Zhao, Y.; Zhang, Y. Study on habitat suitability and environmental variable thresholds of rare waterbirds. Sci. Total Environ. 2021, 785, 147316. [Google Scholar] [CrossRef] [PubMed]
  35. Zhang, D.; Hu, Y.; Liu, M.; Chang, Y.; Yan, X.; Bu, R.; Zhao, D.; Li, Z. Introduction and spread of an exotic plant, Spartina alterniflora, along coastal marshes of China. Wetlands 2017, 37, 1181–1193. [Google Scholar] [CrossRef]
  36. Feng, Y. The ecological characteristics and evolution of the tidal flat in Zhonglu Port. Jiangsu Agric. Sci. 1989, 1, 18–20. (In Chinese) [Google Scholar]
  37. Yang, G.; Shi, Y.; Ji, Z. The ecological response of typical mud flat to sea level change in Jiangsu coastal plain. Acta Geogr. Sin. 2002, 1, 76–84. (In Chinese) [Google Scholar]
  38. Ren, L.; Wang, G.; He, D.; Mao, Z.; Liu, J. Spatial distributions of soil organic matter in different vegetation zones of the Yancheng tidal flat. Adv. Mar. Biol. 2011, 29, 54–62. (In Chinese) [Google Scholar]
  39. Mao, Z.; Gu, X.; Liu, J.; Ren, L.; Wang, G. Evolvement of soil quality in saltmarshes and reclaimed farm lands in Yancheng coastal wetland. Chin. J. Appl. Ecol. 2010, 21, 1986–1992. (In Chinese) [Google Scholar]
  40. Zhang, H.; Zhen, Y.; Li, Y.; Sun, X. Spatial heterogeneity of soil Salinity in Jiangsu Yancheng Wetland National Nature Reserve, Rare Bird. Wetl. Sci. 2018, 16, 152–158. (In Chinese) [Google Scholar]
  41. Tucker, C.J. Red and photographic infrared linear combinations for monitoring vegetation. Remote Sens. Environ. 1979, 8, 127–150. [Google Scholar] [CrossRef]
  42. Xu, H. Modification of normalised difference water index (NDWI) to enhance open water features in remotely sensed imagery. Int. J. Remote Sens. 2006, 27, 3025–3033. [Google Scholar] [CrossRef]
  43. Huete, A.; Didan, K.; Miura, T.; Rodriguez, E.P.; Gao, X.; Ferreira, L.G. Overview of the radiometric and biophysical performance of the MODIS vegetation indices. Remote Sens. Environ. 2002, 83, 195–213. [Google Scholar] [CrossRef]
  44. Diek, S.; Fornallaz, F.; Schaepman, M.E.; De Jong, R. Barest pixel composite for agricultural areas using Landsat time series. Remote Sens. 2017, 9, 1245. [Google Scholar] [CrossRef]
  45. Breiman, L. Random Forests. Mach. Learn. 2001, 45, 5–32. [Google Scholar] [CrossRef]
  46. Lou, Y.; Dai, Z.; Long, C.; Dong, H.; Wei, W.; Ge, Z. Image-based machine learning for monitoring the dynamics of the largest salt marsh in the Yangtze River Delta. J. Hydrol. 2022, 608, 127681. [Google Scholar] [CrossRef]
  47. Liancourt, P.; Callaway, R.M.; Michalet, R. Stress tolerance and competitive-response ability determine the outcome of biotic interactions. Ecology 2005, 86, 1611–1618. [Google Scholar] [CrossRef]
  48. Carlson, T.N.; Ripley, D.A. On the relation between NDVI, fractional vegetation cover, and leaf area index. Remote Sens. Environ. 1997, 62, 241–252. [Google Scholar] [CrossRef]
  49. Wang, B.; Zhang, K.; Liu, Q.-X.; He, Q.; van de Koppel, J.; Teng, S.N.; Miao, X.; Liu, M.; Bertness, M.D.; Xu, C. Long-distance facilitation of coastal ecosystem structure and resilience. Proc. Natl. Acad. Sci. USA 2022, 119, e2123274119. [Google Scholar] [CrossRef] [PubMed]
  50. Oksanen, J.; Minchin, P.R. Continuum theory revisited: What shape are species responses along ecological gradients? Ecol. Modell. 2002, 157, 119–129. [Google Scholar] [CrossRef]
  51. Coudun, C.; Gégout, J.-C. The derivation of species response curves with Gaussian logistic regression is sensitive to sampling intensity and curve characteristics. Ecol. Modell. 2006, 199, 164–175. [Google Scholar] [CrossRef]
  52. Ma, S.; Ren, J.; Wu, C.; Cheng, F.; Wang, X.; Li, B.; He, Q. Hydrological control of threshold transitions in vegetation over early-period wetland development. J. Hydrol. 2022, 610, 127931. [Google Scholar] [CrossRef]
  53. Sun, C.; Li, J.; Liu, Y.; Zhao, S.; Zheng, J.; Zhang, S. Tracking annual changes in the distribution and composition of saltmarsh vegetation on the Jiangsu coast of China using Landsat time series–based phenological parameters. Remote Sens. Environ. 2023, 284, 113370. [Google Scholar] [CrossRef]
  54. Li, X.; Yang, W.; Li, S.; Sun, T.; Bai, J.; Pei, J.; Xie, T.; Cui, B. Asymmetric responses of spatial variation of different communities to a salinity gradient in coastal wetlands. Mar. Environ. Res. 2020, 158, 105008. [Google Scholar] [CrossRef] [PubMed]
  55. Lissner, J.; Schierup, H.-H. Effects of salinity on the growth of Phragmites australis. Aquat. Bot. 1997, 55, 247–260. [Google Scholar] [CrossRef]
  56. Liu, Y.; Ding, Z.; Bachofen, C.; Lou, Y.; Jiang, M.; Tang, X.; Lu, X.; Buchmann, N. The effect of saline-alkaline and water stresses on water use efficiency and standing biomass of Phragmites australis and Bolboschoenus planiculmis. Sci. Total Environ. 2018, 644, 207–216. [Google Scholar] [CrossRef] [PubMed]
  57. Guo, H.; Gao, F.; Pang, J.; Wang, H.; Wang, H.; Wang, Y.; Whitt, A.A.; Ma, C. Plant-plant interactions of Phragmites australis and Suaeda salsa as mediated by combined influences of salinity and tidal level changes. Plant Soil 2022, 474, 141–161. [Google Scholar] [CrossRef]
  58. Matsuda, R.; Yamada, K.; Hayasaka, D.; Henmi, Y. Effects of salinity, temperature, and immersion conditions on seed germination of invasive Spartina alterniflora Loisel (smooth cordgrass) in Japan. Reg. Stud. Mar. Sci. 2023, 57, 102738. [Google Scholar] [CrossRef]
  59. Shi, F.; Bao, F. Effects of salinity and temperature stress on ecophysiological characteristics of exotic cordgrass, Spartina alterniflora. Sheng Tai Xue Bao 2007, 27, 2733–2741. [Google Scholar] [CrossRef]
  60. Elsey-Quirk, T.; Middleton, B.A.; Proffitt, C.E. Seed flotation and germination of salt marsh plants: The effects of stratification, salinity, and/or inundation regime. Aquat. Bot. 2009, 91, 40–46. [Google Scholar] [CrossRef]
  61. Schwarz, C.; Bouma, T.J.; Zhang, L.Q.; Temmerman, S.; Ysebaert, T.; Herman, P.M.J. Interactions between plant traits and sediment characteristics influencing species establishment and scale-dependent feedbacks in salt marsh ecosystems. Geomorphology 2015, 250, 298–307. [Google Scholar] [CrossRef]
  62. Zhou, Y.; Qiu, C.; Li, Y.; Wang, C.; Zhang, Y.; Huang, W.; Li, L.; Liu, H.; Zhang, D. Integrating UAV data to explore the relationship between microtopographic variation and Spartina alterniflora expansion during its early invasion. Ecol. Indic. 2023, 154, 110633. [Google Scholar] [CrossRef]
  63. Ma, X.; Yan, J.; Wang, F.; Qiu, D.; Jiang, X.; Liu, Z.; Sui, H.; Bai, J.; Cui, B. Trait and density responses of Spartina alterniflora to inundation in the Yellow River Delta, China. Mar. Pollut. Bull. 2019, 146, 857–864. [Google Scholar] [CrossRef] [PubMed]
  64. Pang, B.; Xie, T.; Ning, Z.; Cui, B.; Zhang, H.; Wang, X.; Gao, F.; Zhang, S.; Lu, Y. Invasion patterns of Spartina alterniflora: Response of clones and seedlings to flooding and salinity—A case study in the Yellow River Delta, China. Sci. Total Environ. 2023, 877, 162803. [Google Scholar] [CrossRef] [PubMed]
  65. Song, H.; Guo, X.; Yu, X.; Liu, L.; Wang, N.; Eller, F.; Guo, W. Is there evidence of local adaptation of Phragmites australis to water level gradients and fluctuation frequencies? Sci. Total Environ. 2021, 756, 144065. [Google Scholar] [CrossRef] [PubMed]
  66. Soliveres, S.; Smit, C.; Maestre, F.T. Moving forward on facilitation research: Response to changing environments and effects on the diversity, functioning and evolution of plant communities. Biol. Rev. 2014, 90, 297–313. [Google Scholar] [CrossRef] [PubMed]
  67. Kuebbing, S.E.; Nuñez, M.A. Negative, neutral, and positive interactions among nonnative plants: Patterns, processes, and management implications. Glob. Chang. Biol. 2014, 21, 926–934. [Google Scholar] [CrossRef] [PubMed]
  68. Carboni, M.; Livingstone, S.W.; Isaac, M.E.; Cadotte, M.W. Invasion drives plant diversity loss through competition and ecosystem modification. J. Ecol. 2021, 109, 3587–3601. [Google Scholar] [CrossRef]
  69. Reijers, V.C.; van den Akker, M.; Cruijsen, P.M.J.M.; Lamers, L.P.M.; van der Heide, T. Intraspecific facilitation explains the persistence of Phragmites australis in modified coastal wetlands. Ecosphere 2019, 10, e02842. [Google Scholar] [CrossRef]
  70. Liu, Y.; Chen, J.; Zhang, R.; Shen, Y. Analysis of remote sensing images for vegetation succession on tidal salt marsh in Jiangsu. J. Ecol. Rural. Environ. 2001, 17, 39–41. (In Chinese) [Google Scholar]
  71. He, Q.; Bertness, M.D. Extreme stresses, niches, and positive species interactions along stress gradients. Ecology 2014, 95, 1437–1443. [Google Scholar] [CrossRef] [PubMed]
  72. Berthon, K. How do native species respond to invaders? Mechanistic and trait-based perspectives. Biol. Invasions 2015, 17, 2199–2211. [Google Scholar] [CrossRef]
  73. Larsen, L.G. Multiscale flow-vegetation-sediment feedbacks in low-gradient landscapes. Geomorphology 2019, 334, 165–193. [Google Scholar] [CrossRef]
  74. Kim, S.; Yu, C.; Ruesink, J.; Hong, J.-S. Vertical distribution of the salt marsh invader Spartina alterniflora and native halophytes on the west coast of Korea in relation to tidal regimes. Aquat. Invasions 2023, 18, 331–349. [Google Scholar] [CrossRef]
  75. Brusati, E.D.; Grosholz, E.D. Native and Introduced Ecosystem engineers produce contrasting effects on estuarine infaunal communities. Biol. Invasions 2006, 8, 683–695. [Google Scholar] [CrossRef]
Figure 1. The schematic of the study area.
Land 14 01523 g001
Figure 2. Imagery acquisition in each key year.
Land 14 01523 g002
Figure 3. Analysis flow chart.
Land 14 01523 g003
Figure 4. Changes in the distribution of three plant community types from 1987 to 2022. (a) 1987; (b) 1997; (c) 2007; (d) 2012; (e) 2017; (f) 2022.
Land 14 01523 g004
Figure 5. The fitting results of the distribution proportions of three plant community types from land to sea from 1987 to 2022 (af) and the parameter variation in the fitted model for Phragmites australis (g), Spartina alterniflora (h), and Suaeda salsa (i). a1 is a magnitude factor indicating the peak proportion of the distribution, b1 is the position of the center, and c1 is the standard deviation of the curve. a is also a magnitude factor indicating the peak proportion, k is a slope factor controlling the steepness of the curve, and x c is the centroid position.
Land 14 01523 g005
Figure 6. Changes in soil salinity within the dominant ecological niches of the three plant community types (mean ± standard deviation) (a) and changes in soil salinity within the distribution areas of Phragmites australis and Suaeda salsa after the stable expansion of Spartina alterniflora (b). One-way ANOVA and Tukey’s HSD multiple comparisons were used to test for the significance of the changes in soil salinity. Different letters (upper and lower case) above the bars indicate statistically significant differences (p < 0.05) within groups (different plant types in the same year) and between groups (between years for the same plant type), respectively. ** indicate p < 0.01.
Land 14 01523 g006
Figure 7. Land-to-sea changes in the fractional vegetation cover (FVC) of three plant community types from 1987 to 2022. (a) 1987; (b) 1997; (c) 2007; (d) 2012; (e) 2017; (f) 2022.
Land 14 01523 g007
Figure 8. The explanation of significant factors and driving relationships affecting changes in the distribution proportion of Phragmites australis, Suaeda salsa, and Spartina alterniflora based on the generalized additive models (GAMs). (a) Significant factors affecting the distribution proportion of Phragmites australis; (b) significant factors affecting the distribution proportion of Suaeda salsa; (c) significant factors affecting the distribution proportion of Spartina alterniflora. (YEAR: invasion duration of Spartina alterniflora; DIS_LAND: distance from the land-side embankment; SAL: soil salinity; FVC_SS, FVC_PA, and FVC_SA are the fractional vegetation covers of Suaeda salsa, Phragmites australis, and Spartina alterniflora, respectively).
Land 14 01523 g008
Figure 9. The schematic diagram of the mechanism of the impact of Spartina alterniflora invasion on vegetation succession.
Land 14 01523 g009
Table 1. Data sources of soil salinity.
Represented
Year
MethodNumber of
Samples
Actual Sampling
Years
Cited Sources
1987Literature search61986[36]
1997Literature search51996[37]
2007Literature search222006–2008[38,39]
2012Literature search
and field sampling
342011–2012[40]
2017Field sampling212017/
2022Field sampling272023/
Disclaimer/Publisher’s Note: The statements, opinions and data contained in all publications are solely those of the individual author(s) and contributor(s) and not of MDPI and/or the editor(s). MDPI and/or the editor(s) disclaim responsibility for any injury to people or property resulting from any ideas, methods, instructions or products referred to in the content.

