
Simulation and Analysis of Changes in Carbon Storage and Ecosystem Services Against the Backdrop of Land Transfer: A Case Study in Lvzenong Park


Abstract
1. Introduction
2. Literature Review
3. Materials and Methods
3.1. Research Area
3.2. Research Methods
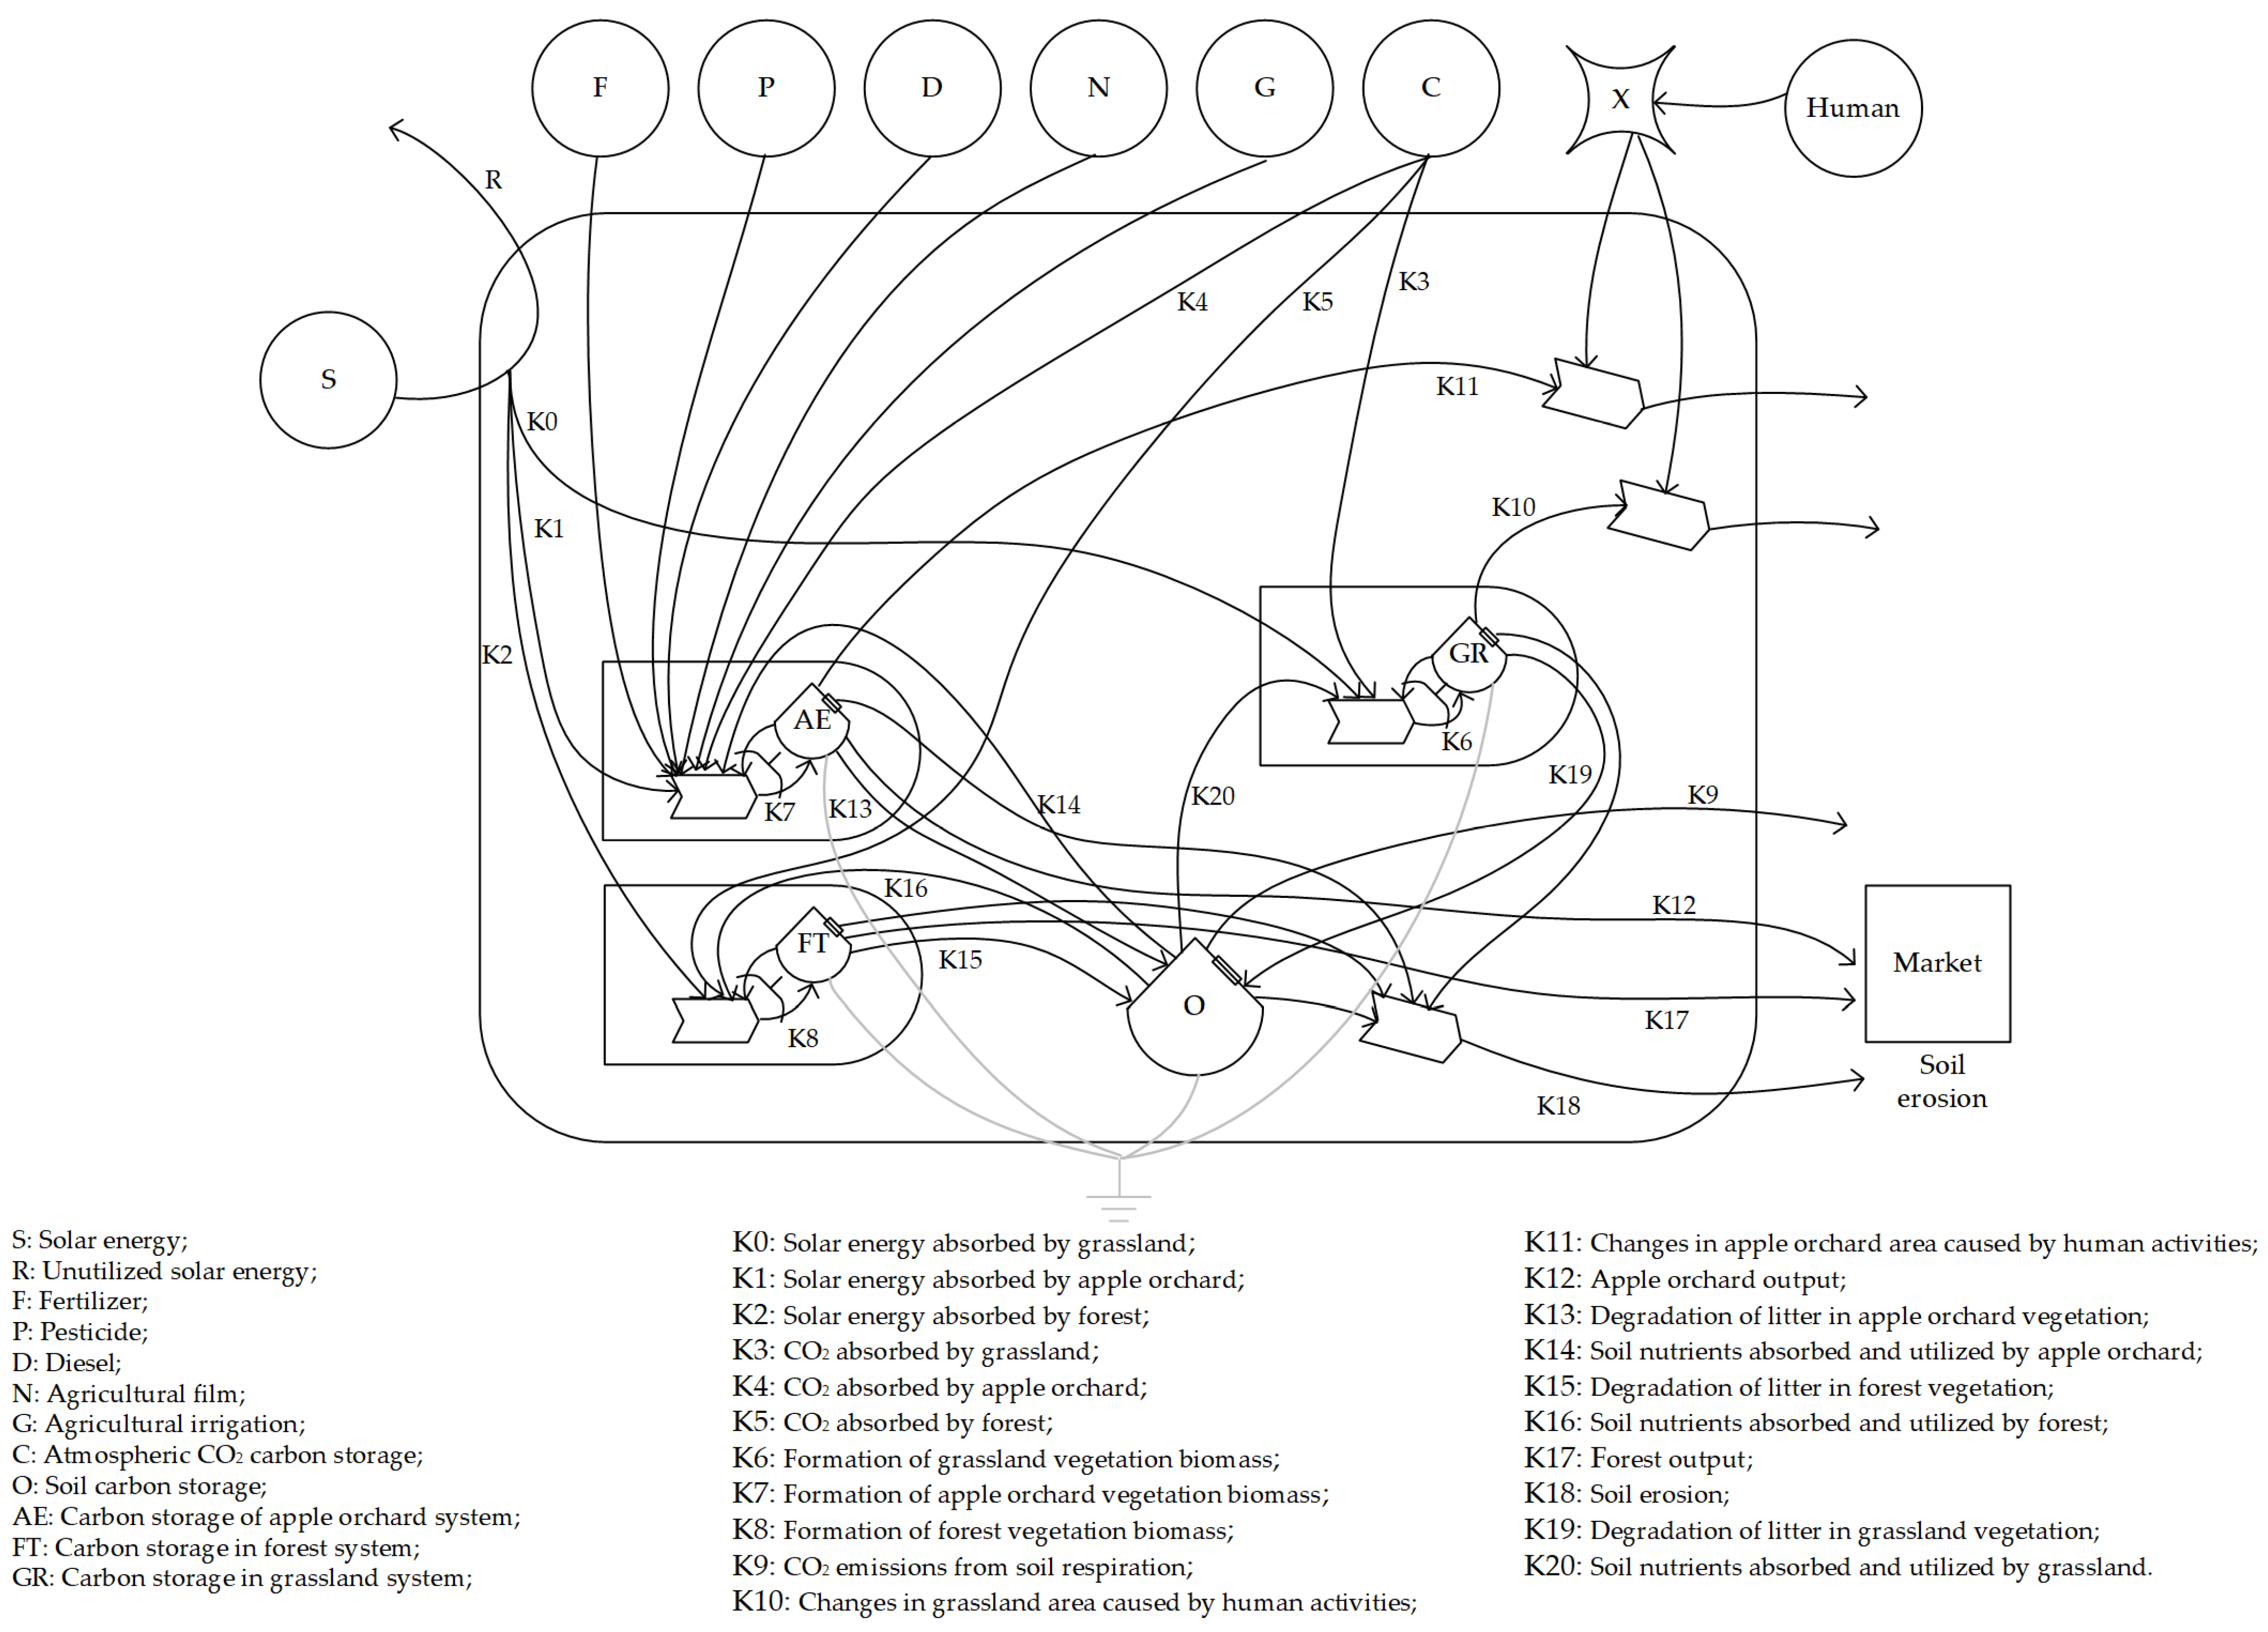
3.2.1. The Carbon Flow Model Based on ESL
3.2.2. Evaluation of Ecosystem Service Values Based on Carbon Flow Model
3.3. Data Sources
4. Results
4.1. Simulation of Carbon Storage Changes in Lvzenong Park
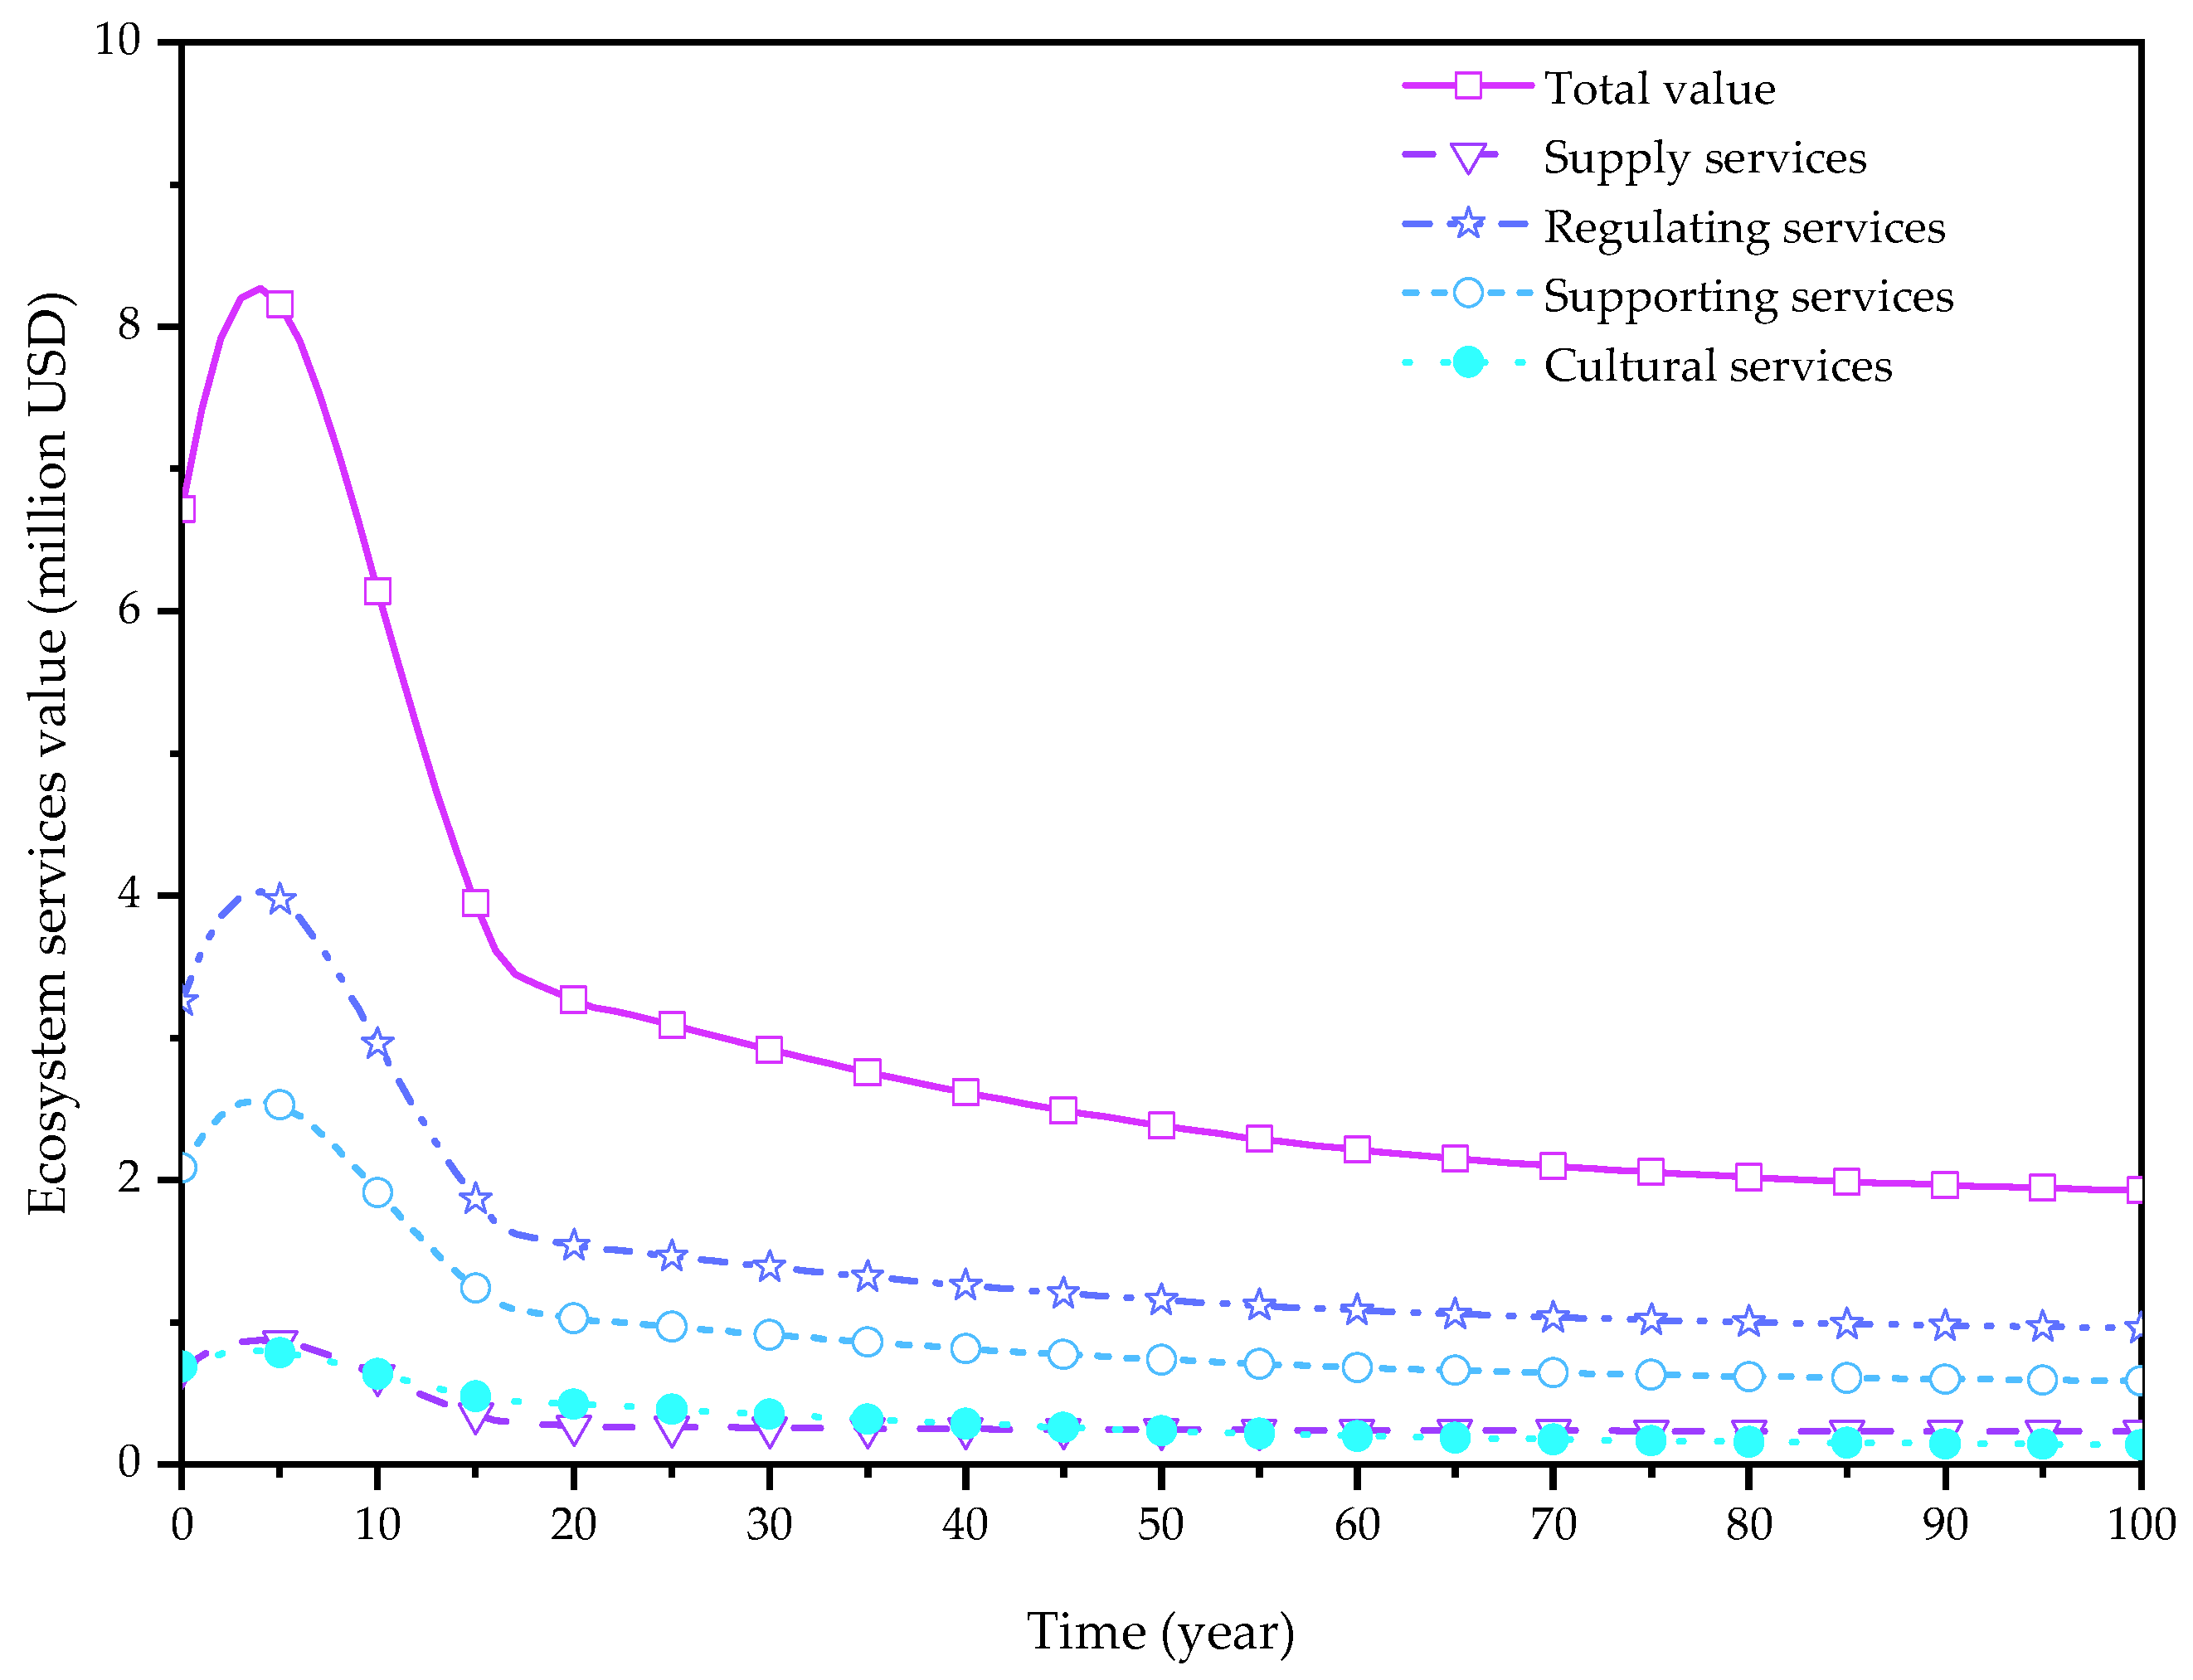
4.2. Simulation of Ecosystem Services Changes in Lvzenong Park
4.3. Simulating the Response of Carbon Storage and Ecosystem Services to Land Transfer Under Multiple Scenarios
4.3.1. Scenario Settings
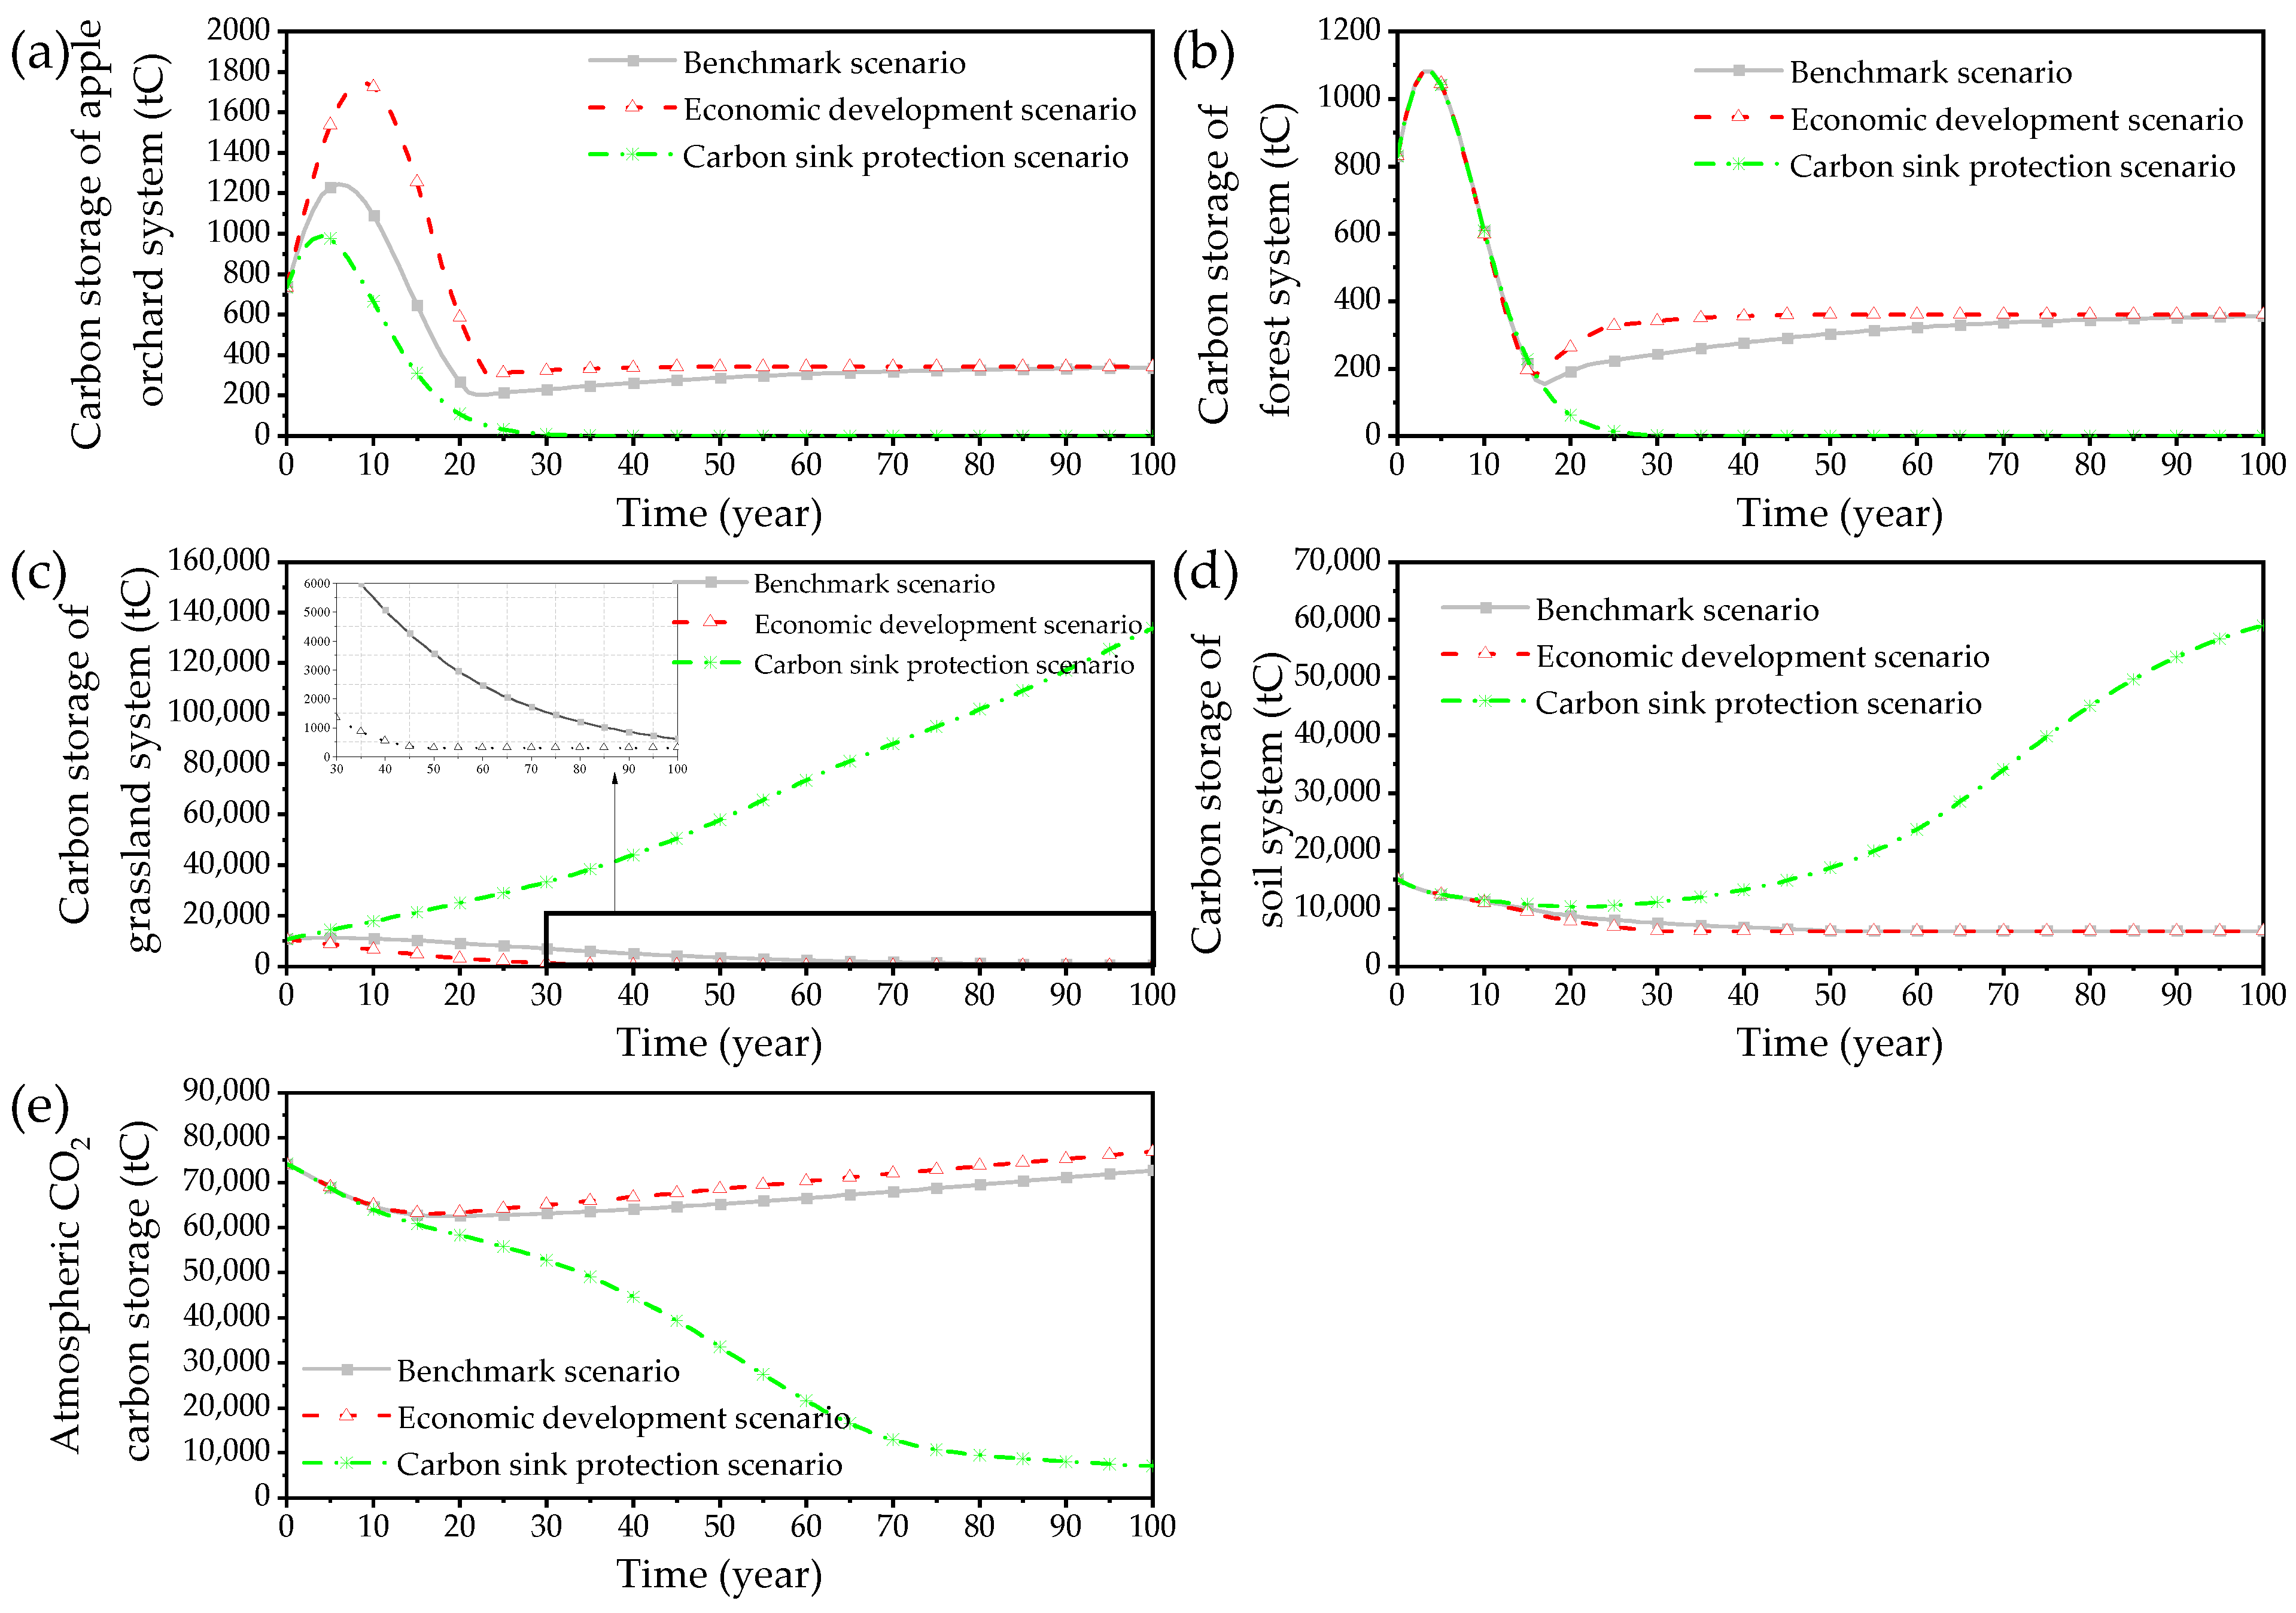
4.3.2. Simulation of Carbon Storage Changes in Lvzenong Park Under Different Scenarios
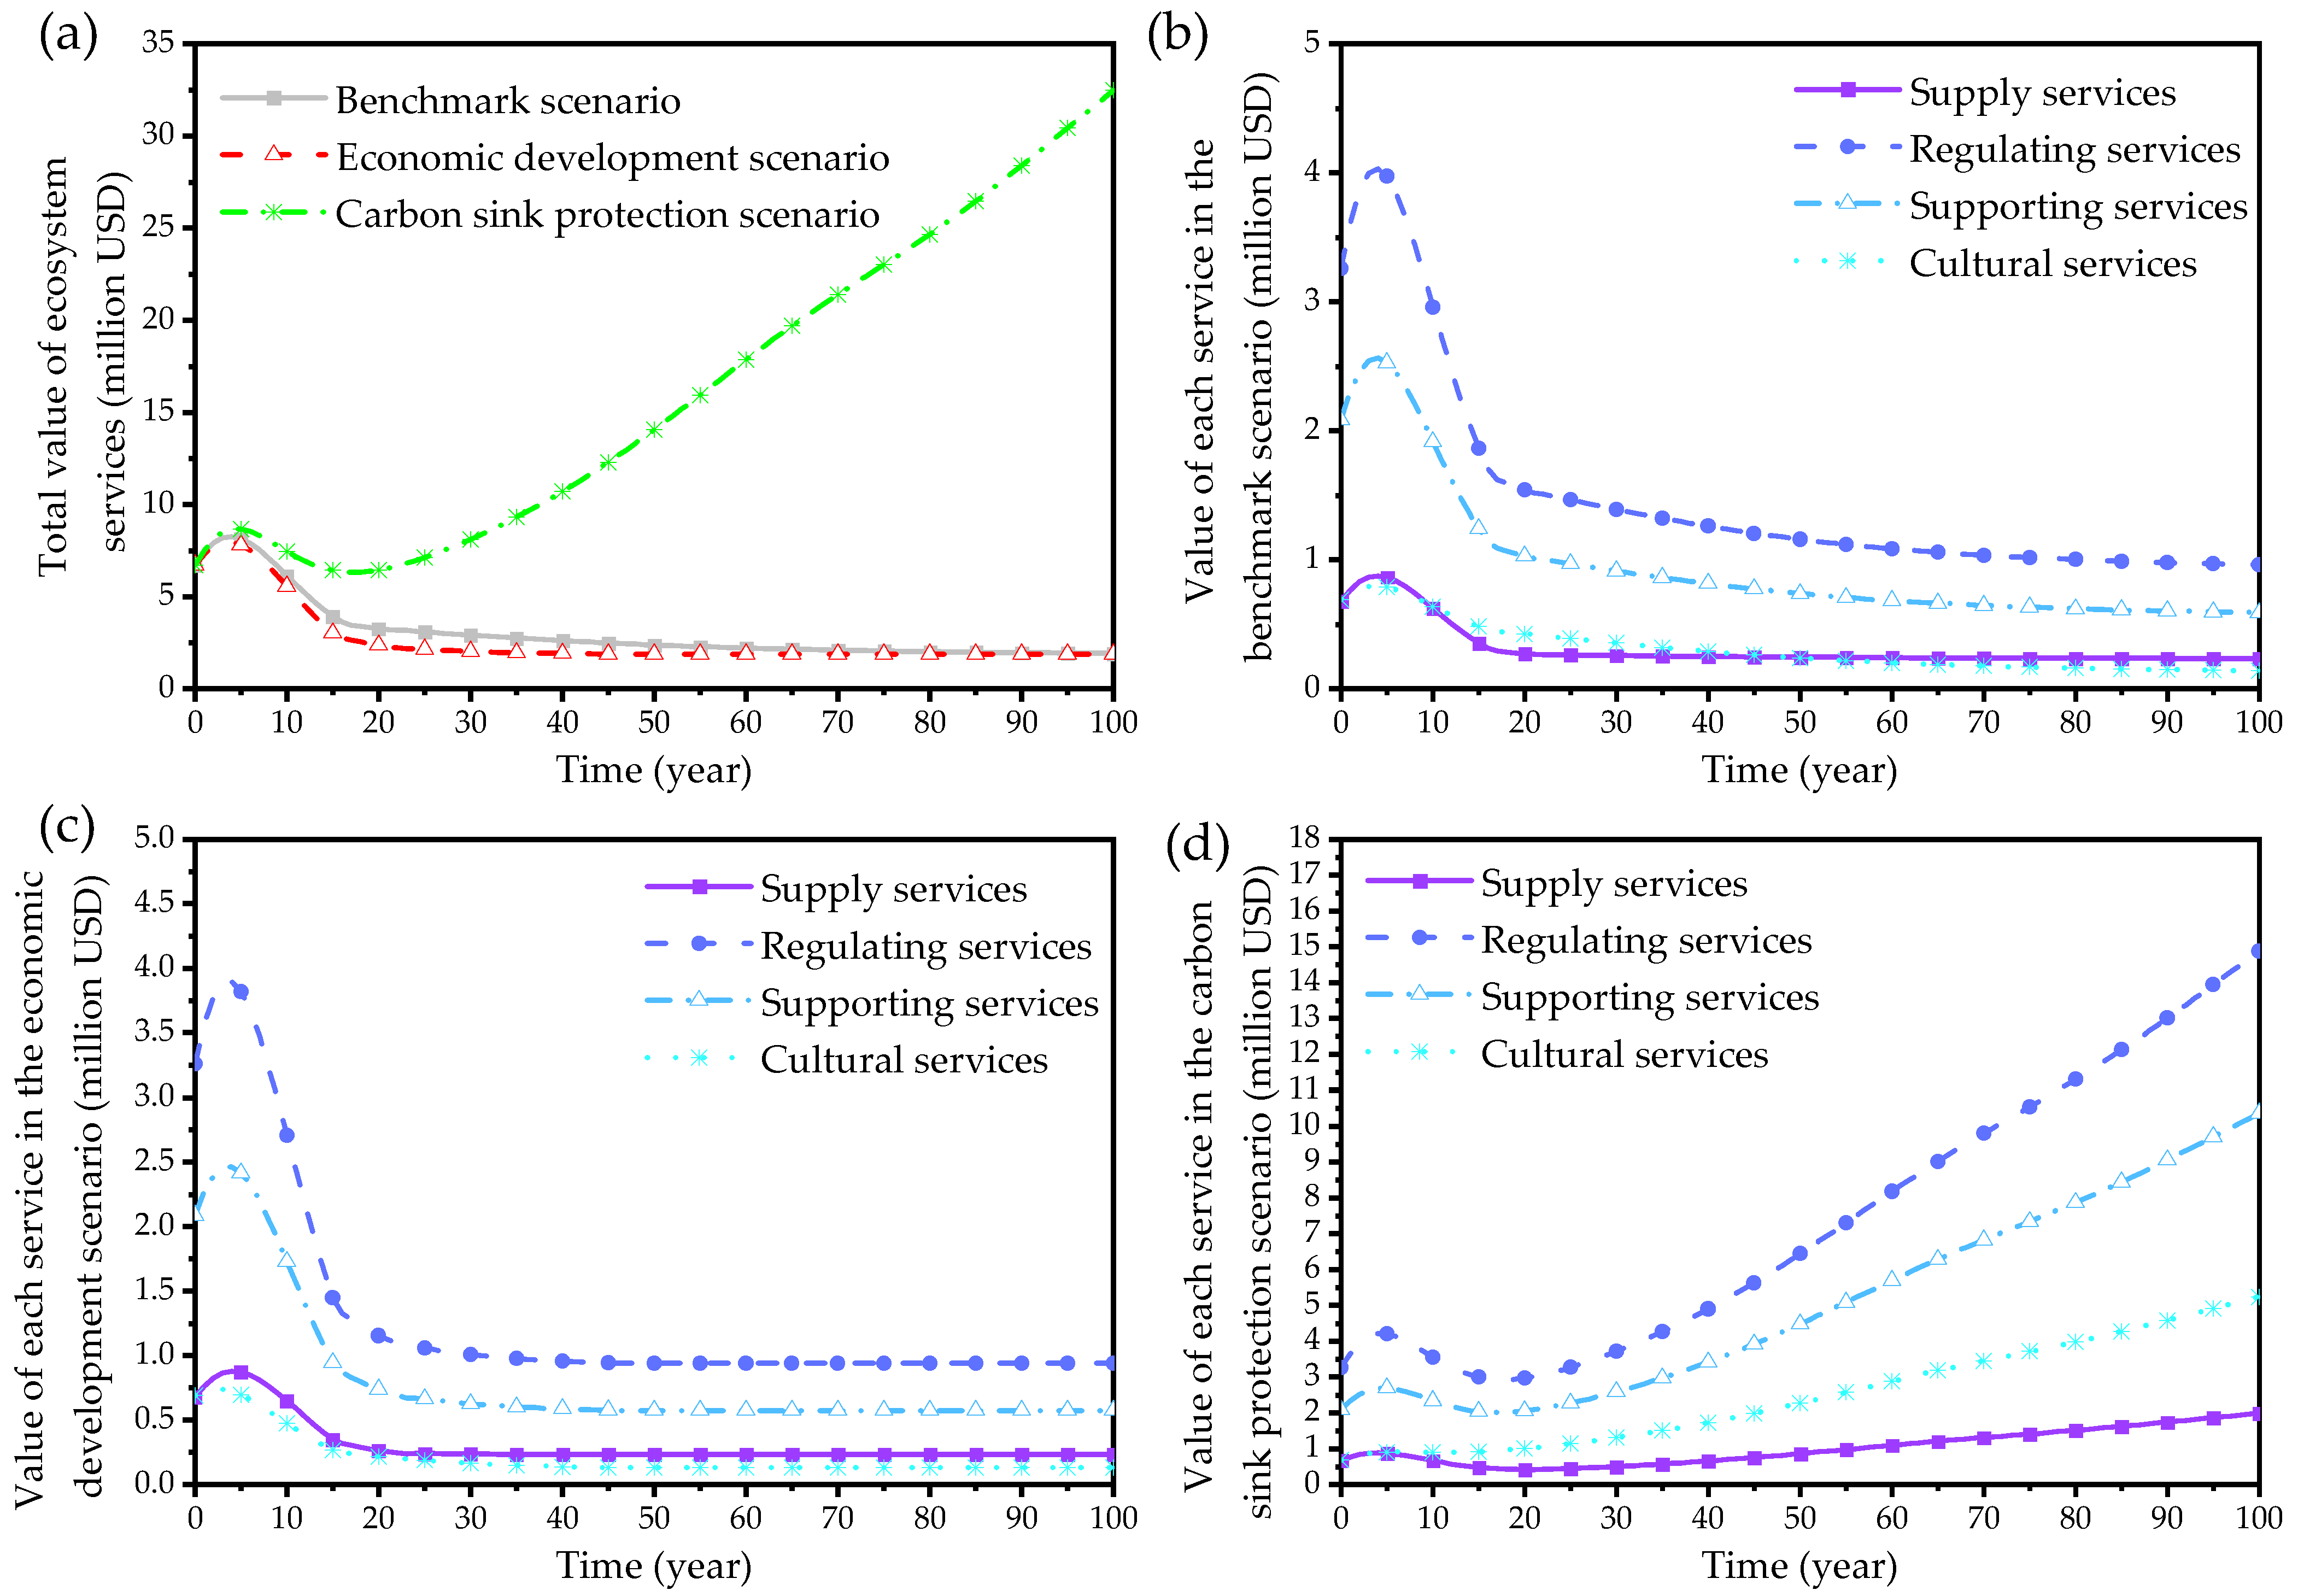
4.3.3. Simulation of Ecosystem Services Changes in Lvzenong Park Under Different Scenarios
5. Discussion
5.1. Analysis of the Impact of Land Transfer on Carbon Storage and Ecosystem Services
5.2. Policy Recommendations
5.3. Limitations
6. Conclusions
- (1)
- From 2015 to 2115, the carbon storage of apple orchard, forest, and grassland systems shows a trend of first increasing and then decreasing, reaching its peak in the sixth, third, and fifth years, respectively. Soil carbon storage continues to decline, with an average annual decrease of 1.75%. The overall atmospheric CO2 carbon pool shows an increasing trend, and the total value of ecosystem services decreases by 71.30%, with an average annual decrease of 1.24%. The ecological environment is damaged, and soil erosion accelerated.
- (2)
- Land transfer behavior can significantly affect the carbon storage of the ecosystem. The economic development scenario has a positive effect on the carbon storage of the apple orchard system and atmospheric CO2 carbon pool, and a negative effect on the carbon storage of the grassland system. The carbon sink protection scenario positively affects the carbon storage of the grassland system and soil, while negatively affecting the atmospheric CO2 carbon pools.
- (3)
- Land transfer behavior can significantly affect ecosystem services. The total value of ecosystem services and the value of the four types of services show a trend of first increasing and then decreasing in the economic development scenario, while they generally show a growth trend in the carbon sink protection scenario. In the selection of the “dual carbon target” strategy, priority should be given to the carbon sink protection scenario to quickly improve the carbon sink capacity of the ecosystem. In the selection of poverty alleviation strategies, the economic development scenario should be selected to enable rural impoverished people to quickly overcome poverty.
Author Contributions
Funding
Data Availability Statement
Conflicts of Interest
References
- Xi, J. Speech at the General Debate of the Seventy-Fifth Session of the United Nations General Assembly. Gaz. State Counc. People’s Repub. China 2020, 28, 5–7. [Google Scholar]
- Gonzalez-Redin, J.; Gordon, I.J.; Hill, R.; Polhill, J.G.; Dawson, T.P. Exploring sustainable land use in forested tropical social-ecological systems: A case-study in the Wet Tropics. J. Environ. Manag. 2019, 231, 940–952. [Google Scholar] [CrossRef] [PubMed]
- Abate, M.C.; He, Z.; Cai, B.; Huang, Y.; Betelhemabraham, G.; Bayu, T.; Addis, A.K. Environmental Impact of Agricultural Land Transfer in China: A Systematic Review on Sustainability. Sustainability 2024, 16, 6498. [Google Scholar] [CrossRef]
- Chang, X.; Xing, Y.; Wang, J.; Yang, H.; Gong, W. Effects of land use and cover change (LUCC) on terrestrial carbon stocks in China between 2000 and 2018. Resour. Conserv. Recycl. 2022, 182, 106333. [Google Scholar]
- Tang, X.; Zhao, X.; Bai, Y.; Tang, Z.; Wang, W.; Zhao, Y.; Wan, H.; Xie, Z.; Shi, X.; Wu, B.; et al. Carbon pools in China’s terrestrial ecosystems: New estimates based on an intensive field survey. Proc. Natl. Acad. Sci. USA 2018, 115, 4021–4026. [Google Scholar]
- Li, Y.; Liu, W.; Feng, Q.; Zhu, M.; Yang, L.; Zhang, J. Effects of land use and land cover change on soil organic carbon storage in the Hexi regions, Northwest China. J. Environ. Manag. 2022, 312, 114911. [Google Scholar]
- Liu, Z.; Rommel, J.; Feng, S.; Hanisch, M. Can land transfer through land cooperatives foster off-farm employment in China? China Econ. Rev. 2017, 45, 35–44. [Google Scholar] [CrossRef]
- Zhou, C.; Liang, Y.; Fuller, A. Tracing Agricultural Land Transfer in China: Some Legal and Policy Issues. Land 2021, 10, 58. [Google Scholar]
- Odum, H.T.; Odum, E.C.; Frankel, E. Energy basis for man and nature. Am. J. Phys. 1976, 45, 226–227. [Google Scholar]
- Cao, H.; Zhu, X.; Heijman, W.; Zhao, K. The impact of land transfer and farmers’ knowledge of farmland protection policy on pro-environmental agricultural practices: The case of straw return to fields in Ningxia, China. J. Clean. Prod. 2020, 277, 123701. [Google Scholar]
- Xu, Z.H.; Fan, W.G.; Wei, H.J.; Zhang, P.; Ren, J.H.; Gao, Z.C.; Ulgiati, S.; Kong, W.D.; Dong, X.B. Evaluation and simulation of the impact of land use change on ecosystem services based on a carbon flow model: A case study of the Manas River Basin of Xinjiang, China. Sci. Total Environ. 2019, 652, 117–133. [Google Scholar] [CrossRef] [PubMed]
- García-Llamas, P.; Geijzendorffer, I.R.; García-Nieto, A.P.; Calvo, L.; Suárez-Seoane, S.; Cramer, W. Impact of land cover change on ecosystem service supply in mountain systems: A case study in the Cantabrian Mountains (NW of Spain). Reg. Environ. Change 2019, 19, 529–542. [Google Scholar]
- Souza, N.; Solberg, M.; Hu, X.; Cherubini, F. Environmental benefits and changes in ecosystem services of climate-smart agriculture relative to conventional agriculture in Norway. J. Environ. Manag. 2025, 377, 124633. [Google Scholar]
- Wei, Z.; Ling, L.; Wang, Q.; Luo, D. Multi-Scenario Land Use Change Dynamic Simulation and Carbon Stock Assessment of Man–Nature in Border Mountainous Areas. Sustainability 2025, 17, 1695. [Google Scholar] [CrossRef]
- Wang, B.; Li, F.; Feng, S.; Shen, T. Transfer of development rights, farmland preservation, and economic growth: A case study of Chongqing’s land quotas trading program. Land Use Policy 2020, 95, 104611. [Google Scholar] [CrossRef]
- Deng, Y.; Guo, Y.; Zhu, J. Land Transfer, Increase of Farmers’ Income and Income Inequality. Rural Econ. 2021, 6, 33–40. [Google Scholar]
- Li, C.; Yong, J.; Tao, S.; Liu, A. Alleviating multi-dimensional poverty through land transfer: Evidence from poverty-stricken villages in China. China Econ. Rev. 2021, 69, 101670. [Google Scholar]
- Sun, X.; Li, Q. Study on the poverty reduction effect and its heterogeneity of multi-dimensional subthreshold land transfer—Based on CFPS2018 microscopic data analysis. Chin. J. Agric. Resour. Reg. Plan. 2022, 43, 259–268. [Google Scholar]
- Zhang, L.; Feng, S.; Heerink, N.; Qu, F.; Kuyvenhoven, A. How do land rental markets affect household income? Evidence from rural Jiangsu, P.R. China. Land Use Policy 2018, 74, 151–165. [Google Scholar] [CrossRef]
- Zhang, Y.; Halder, P.; Zhang, X.; Qu, M. Analyzing the deviation between farmers’ Land transfer intention and behavior in China’s impoverished mountainous Area: A Logistic-ISM model approach. Land Use Policy 2020, 94, 104534. [Google Scholar]
- Deininger, K.; Xia, F. Assessing the long-term performance of large-scale land transfers: Challenges and opportunities in Malawi’s estate sector. World Dev. 2018, 104, 281–296. [Google Scholar]
- Tang, P.; Yang, S.; Shen, J.; Fu, S. Does China’s low-carbon pilot programme really take off? Evidence from land transfer of energy-intensive industry. Energy Policy 2018, 114, 482–491. [Google Scholar]
- Su, B.; Li, Y.; Li, L.; Wang, Y. How does nonfarm employment stability influence farmers’ farmland transfer decisions? Implications for China’s land use policy. Land Use Policy 2018, 74, 66–72. [Google Scholar]
- Fan, W.; Chen, N.; Yao, W.; Meng, M.; Wang, X. Integrating Environmental Impact and Ecosystem Services in the Process of Land Resource Capitalization—A Case Study of Land Transfer in Fuping, Hebei. Sustainability 2021, 13, 2837. [Google Scholar] [CrossRef]
- Leng, Z.; Wang, Y.; Hou, X. Structural and Efficiency Effects of Land Transfers on Food Planting: A Comparative Perspective on North and South of China. Sustainability 2021, 13, 3327. [Google Scholar] [CrossRef]
- Liu, Y.; Yan, B.; Wang, Y.; Zhou, Y. Will land transfer always increase technical efficiency in China?—A land cost perspective. Land Use Policy 2019, 82, 414–421. [Google Scholar]
- Li, J.; Sun, Z. Does the transfer of state-owned land-use rights promote or restrict urban development? Land Use Policy 2021, 100, 104945. [Google Scholar]
- Jiang, X.; Lu, X.; Liu, Q.; Chang, C.; Qu, L. The effects of land transfer marketization on the urban land use efficiency: An empirical study based on 285 cities in China. Ecol. Indic. 2021, 132, 108296. [Google Scholar]
- Li, B.; Shen, Y. Effects of land transfer quality on the application of organic fertilizer by large-scale farmers in China. Land Use Policy 2021, 100, 105124. [Google Scholar]
- Wu, X.; Wang, S.; Fu, B.; Liu, Y.; Zhu, Y. Land use optimization based on ecosystem service assessment: A case study in the Yanhe watershed. Land Use Policy 2018, 72, 303–312. [Google Scholar]
- Wang, M.M.; Zhao, J.; Wang, S.Q.; Chen, B.; Li, Z.P. Detection and attribution of positive net ecosystem productivity extremes in China’s terrestrial ecosystems during 2000–2016. Ecol. Indic. 2021, 132, 108323. [Google Scholar]
- Xiang, S.; Wang, Y.; Deng, H.; Yang, C.; Wang, Z.; Gao, M. Response and multi-scenario prediction of carbon storage to land use/cover change in the main urban area of Chongqing, China. Ecol. Indic. 2022, 142, 109205. [Google Scholar]
- Yang, S.; Su, H.; Zhao, G. Multi-scenario simulation of urban ecosystem service value based on PLUS model—Take Hanzhong city as an example. J. Arid Land Resour. Environ. 2022, 36, 86–95. [Google Scholar]
- Jiang, L.; Wang, Z.; Zuo, Q.; Du, H. Simulating the impact of land use change on ecosystem services in agricultural production areas with multiple scenarios considering ecosystem service richness. J. Clean. Prod. 2023, 397, 136485. [Google Scholar]
- Lin, T.; Yang, M.; Wu, D.; Liu, F.; Yang, J.; Wang, Y. Spatial correlation and prediction of carbon reserves based on InVEST-PLUS model—Take Guangdong Province as an example. China Environ. Sci. 2022, 42, 4827–4839. [Google Scholar]
- Han, H.Q.; Dong, Y.X. Assessing and mapping of multiple ecosystem services in Guizhou Province, China. Trop. Ecol. 2017, 58, 331–346. [Google Scholar]
- Leh, M.; Matlock, M.; Cummings, E.; Thoma, G.; Cothren, J. Measuring ecosystem service change: A case study from a northwest Arkansas dairy farm. Int. Dairy J. 2013, 31, S91–S100. [Google Scholar]
- Sadat, M.; Salehi, E.; Amiri, M.J.; Ehsani, A.H. Spatiotemporal ecosystem services: Response to structural changes (A case study in Lahijan, Iran). Integr. Environ. Assess. Manag. 2023, 20, 1099–1111. [Google Scholar]
- Yin, L.; Zheng, W.; Shi, H.; Ding, D. Ecosystem services assessment and sensitivity analysis based on ANN model and spatial data: A case study in Miaodao Archipelago. Ecol. Indic. 2022, 135, 108511. [Google Scholar]
- Anaya-Romero, M.; Muñoz-Rojas, M.; Ibáñez, B.; Marañón, T. Evaluation of forest ecosystem services in Mediterranean areas. Aregional case study in South Spain. Ecosyst. Serv. 2016, 20, 82–90. [Google Scholar]
- Masalvad, S.K.; Patil, C.; Vardhan, A.R.; Yadav, A.; Lavanya, B.; Sakare, P.K. Predicting land use changes and ecosystem service impacts with CA-Markov and machine learning techniques. Environ. Dev. Sustain. 2025, 1573, 2975. [Google Scholar] [CrossRef]
- Liu, H.; Xiao, W.; Li, Q.; Tian, Y.; Zhang, Q.; Zhu, J. Analysis of spatial temporal change and tradeoff of ecosystem service in Beijing. J. Ecol. 2021, 40, 209–219. [Google Scholar]
- Shao, Y.; Yi, X.; Sang, W. Land use trade-offs and synergies based on temporal and spatial patterns of ecosystem services in South China. Ecol. Indic. 2022, 143, 109335. [Google Scholar] [CrossRef]
- Zarandian, A.; Mohammadyari, F.; Mirsanjari, M.M.; Visockiene, J.S. Scenario modeling to predict changes in land use/cover using Land Change Modeler and InVEST model: A case study of Karaj Metropolis, Iran. Environ. Monit. Assess. 2023, 195, 273. [Google Scholar] [CrossRef]
- Farinosi, F.; Arias, M.E.; Lee, E.; Longo, M.; Pereira, F.F.; Livino, A.; Moorcroft, P.R.; Briscoe, J. Future Climate and Land Use Change Impacts on River Flows in the Tapajos Basin in the Brazilian Amazon. Earths Future 2019, 7, 993–1017. [Google Scholar] [CrossRef]
- Qin, M.; Zhao, J.; Feng, C.; Huang, Z.; Wen, Y.; Zhang, W. Response of ecosystem carbon storage service in Shiyang River Basin in 1980–2030. Acta Ecol. Sin. 2022, 42, 9525–9536. [Google Scholar]
- Yue, C.; Ciais, P.; Houghton, R.A.; Nassikas, A.A. Contribution of land use to the interannual variability of the land carbon cycle. Nat. Commun. 2020, 11, 3170. [Google Scholar] [CrossRef]
- Hong, C.; Burney, J.A.; Pongratz, J.; Nabel, J.E.M.S.; Mueller, N.D.; Jackson, R.B.; Davis, S.J. Global and regional drivers of land-use emissions in 1961–2017. Nature 2021, 589, 554–561. [Google Scholar] [CrossRef]
- Xu, Z.; Wei, H.; Fan, W.; Wang, X.; Huang, B.; Lu, N.; Ren, J.; Dong, X. Energy modeling simulation of changes in ecosystem services before and after the implementation of a Grain-for-Green program on the Loess Plateau—A case study of the Zhifanggou valley in Ansai County, Shaanxi Province, China. Ecosyst. Serv. 2018, 31, 32–43. [Google Scholar]
- Xu, Z.H.; Fan, W.G.; Dong, X.B.; Wang, X.C.; Liu, Y.X.; Xue, H.L.; Klemes, J.J. Analysis of the functional orientation of agricultural systems from the perspective of resource circulation. J. Clean. Prod. 2020, 258, 120642. [Google Scholar] [CrossRef]
- Lopion, P.; Markewitz, P.; Robinius, M.; Stolten, D. A review of current challenges and trends in energy systems modeling. Renew. Sust. Energ. Rev. 2018, 96, 156–166. [Google Scholar]
- Rivera, E.C.; de Queiroz, J.F.; Ferraz, J.M.; Ortega, E. Systems models to evaluate eutrophication in the Broa Reservoir, Sao Carlos, Brazil. Ecol. Model. 2007, 202, 518–526. [Google Scholar]
- Fan, W.; Yao, W.; Chen, K. Integrating Energy Systems Language and Emergy Approach to Simulate and Analyze the Energy Flow Process of Land Transfer. Land 2023, 12, 1070. [Google Scholar] [CrossRef]
- Zhang, F.; Xu, N.; Wang, C.; Wu, F.; Chu, X. Effects of land use and land cover change on carbon sequestration and adaptive management in Shanghai, China. Phys. Chem. Earth 2020, 120, 102948. [Google Scholar]
- Herts, I.R.H. Modeling for All Scales: An Introduction to System Simulation. J. Environ. Qual. 2001, 30, 2212. [Google Scholar]
- Xie, G.; Zhen, L.; Lu, C.; Xiao, Y.; Chen, C. Expert knowledge based valuation method of ecosystem services in China. J. Nat. Resour. 2008, 23, 911–919. [Google Scholar]
- Xie, G.; Zhang, C.; Zhang, L.; Chen, W.; Li, S. Improvement of ecosystem service value conversion method based on value equivalent factor per unit area. J. Nat. Resour. 2015, 30, 1243–1254. [Google Scholar]
- Zhang, X.Q.; Yin, Q.W.; Zheng, Z.W.; Sun, S.F.; Huang, J.F. Dynamic changes and key drivers of ecosystem service values in populous zones on the Tibetan Plateau: A 35-Year analysis. Ecol. Indic. 2024, 167, 112620. [Google Scholar]
- Yao, S.; Li, Y.H.; Quan, X.Y.; Xu, J.R. Applying the driver-pressure-state-impact-response model to ecological restoration: A case study of comprehensive zoning and benefit assessment in Zhejiang Province, China. Glob. Ecol. Conserv. 2024, 55, e03222. [Google Scholar]
- Costanza, R.; de Groot, R.; Sutton, P.; van der Ploeg, S.; Anderson, S.J.; Kubiszewski, I.; Farber, S.; Turner, R.K. Changes in the global value of ecosystem services. Glob. Environ. Change 2014, 26, 152–158. [Google Scholar]
- Wang, W.J.; Guo, H.C.; Chuai, X.W.; Dai, C.; Lai, L.; Zhang, M. The impact of land use change on the temporospatial variations of ecosystems services value in China and an optimized land use solution. Environ. Sci. Policy 2014, 44, 62–72. [Google Scholar] [CrossRef]
- Hu, H.; Zhang, J.; Xiong, J.; Zhou, J.; Sun, J. Carbon Emission Estimation and Reduction Pressure Analysis in Hebei Province. Geogr. Geo-Inf. Sci. 2016, 32, 61–67. [Google Scholar]
- Lu, N.; Wei, H.; Fan, W.; Xu, Z.; Wang, X.; Xing, K.; Dong, X.; Viglia, S.; Ulgiati, S. Multiple influences of land transfer in the integration of Beijing-Tianjin-Hebei region in China. Ecol. Indic. 2018, 90, 101–111. [Google Scholar] [CrossRef]
- Tang, H.; Ma, H.; Su, Y.; Xin, C.; Wang, J. Carbon Emissions and Carbon Absorptions of Different Land Use Types in Xinjiang. Arid Zone Res. 2016, 33, 486–492. [Google Scholar]


| Variable | Meaning | Variable | Meaning | Variable | Meaning | Variable | Meaning |
|---|---|---|---|---|---|---|---|
| S | Solar energy | F | Fertilizer | N | Agricultural film | AE | Carbon storage of apple orchard system |
| R | Unutilized solar energy | P | Pesticide | G | Agricultural irrigation | FT | Carbon storage in forest system |
| C | Atmospheric CO2 carbon storage | D | Diesel | O | Soil carbon storage | GR | Carbon storage in grassland system |
| Parameter | Meaning | Parameter | Meaning | Parameter | Meaning |
|---|---|---|---|---|---|
| K0 | Solar energy absorbed by grassland | K7 | Formation of apple orchard vegetation biomass | K14 | Soil nutrients absorbed and utilized by apple orchard |
| K1 | Solar energy absorbed by apple orchard | K8 | Formation of forest vegetation biomass | K15 | Degradation of litter in forest vegetation |
| K2 | Solar energy absorbed by forest | K9 | CO2 emissions from soil respiration | K16 | Soil nutrients absorbed and utilized by forest |
| K3 | CO2 absorbed by grassland | K10 | Changes in grassland area caused by human activities | K17 | Forest output |
| K4 | CO2 absorbed by apple orchard | K11 | Changes in apple orchard area caused by human activities | K18 | Soil erosion |
| K5 | CO2 absorbed by forest | K12 | Apple orchard output | K19 | Degradation of litter in grassland vegetation |
| K6 | Formation of grassland vegetation biomass | K13 | Degradation of litter in apple orchard vegetation | K20 | Soil nutrients absorbed and utilized by grassland |
| First Class | Second Class | Farmland (Apple Orchard) | Grassland | Forest |
|---|---|---|---|---|
| Supply services | Food production | 466.69 | 200.68 | 154.01 |
| Raw material production | 182.01 | 168.01 | 1390.74 | |
| Regulating services | Gas regulation | 336.02 | 700.04 | 2016.10 |
| Climate regulation | 452.69 | 728.04 | 1899.43 | |
| Hydrological regulation | 359.35 | 709.37 | 1908.76 | |
| Waste treatment | 648.70 | 616.03 | 802.71 | |
| Supporting services | Soil conservation | 686.04 | 1045.39 | 1876.10 |
| Biodiversity conservation | 476.02 | 872.71 | 2104.77 | |
| Cultural services | Providing aesthetics | 79.34 | 406.02 | 970.72 |
| Parameter | Component | Initial Value | Unit | Coefficient | Parameter | Component | Initial Value | Unit | Coefficient |
|---|---|---|---|---|---|---|---|---|---|
| S | Solar energy | 1000.00 | Constant | J12 | Apple orchard output | 368.28 | tC/y | 0.50 | |
| F | Fertilizer | 198.63 | tC/y | J13 | Degradation of litter in apple orchard vegetation | 73.66 | tC/y | 0.10 | |
| P | Pesticide | 14.20 | tC/y | FT | Carbon storage in forest systems | 831.79 | tC | ||
| D | Diesel | 1.15 | tC/y | J2 | Energy utilized by forests | 20.00 | 2.26 × 10⁻¹¹ | ||
| N | Agricultural film | 32.99 | tC/y | J8 | Forest vegetation growth | 748.61 | tC/y | 8.47 × 10⁻¹⁰ | |
| G | Agricultural irrigation | 21.67 | tC/y | J15 | Degradation of litter in forest vegetation | 582.25 | tC/y | 0.70 | |
| R | Unutilized solar energy | 950.00 | tC/y | J17 | Forest output | 41.59 | tC/y | 0.05 | |
| C | Atmospheric CO2 carbon storage | 74,126.00 | tC | GR | Carbon storage in grassland systems | 10,740.38 | tC | ||
| J3 | CO2 absorbed by grassland | 805.53 | tC/y | 7.06 × 10⁻¹¹ | J0 | Energy utilized by grassland | 17.50 | 1.53 × 10⁻¹² | |
| J4 | CO2 absorbed by apple orchards | 368.28 | tC/y | 2.03 × 10⁻¹¹ | J6 | Grassland vegetation growth | 966.63 | tC/y | 8.47 × 10⁻¹¹ |
| J5 | CO2 absorbed by forests | 665.43 | tC/y | 7.53 × 10⁻¹⁰ | J10 | Changes in grassland area (human activities) | tC/y | ||
| J9 | CO2 emissions from soil respiration | 905.03 | tC/y | 0.06 | J19 | Degradation of litter in grassland vegetation | 751.83 | tC/y | 0.07 |
| AE | Carbon storage of apple orchard system | 736.57 | tC | O | Soil carbon storage | 15,083.90 | tC | ||
| J1 | Energy utilized by apple orchard | 12.50 | 6.89 × 10⁻¹³ | J14 | Soil nutrients absorbed and utilized by apple orchards | 110.49 | tC/y | 6.09 × 10⁻¹² | |
| J7 | Apple growth | 589.25 | tC/y | 3.25 × 10⁻¹¹ | J16 | Soil nutrients absorbed and utilized by forests | 301.68 | tC/y | 3.41 × 10⁻¹⁰ |
| J11 | Changes in apple orchard area (human activities) | tC/y | J18 | Soil erosion | 3.77 | tC/y | 0.30 | ||
| J20 | Soil nutrients absorbed and utilized by grasslands | 905.03 | tC/y | 7.93 × 10⁻¹¹ |
| Carbon Flow | The 1st Year | The 20th Year | The 100th Year | Carbon Flow | The 1st Year | The 20th Year | The 100th Year |
|---|---|---|---|---|---|---|---|
| J0 | 16.63 | 7.66 | 0.42 | J11 | 0 | 0 | 0 |
| J1 | 13.98 | 2.31 | 2.40 | J12 | 441.94 | 133.80 | 169.13 |
| J2 | 21.43 | 2.34 | 3.57 | J13 | 88.39 | 26.76 | 33.83 |
| J3 | 765.62 | 352.68 | 19.36 | J14 | 123.54 | 20.42 | 21.19 |
| J4 | 411.81 | 68.07 | 70.64 | J15 | 669.59 | 133.76 | 248.98 |
| J5 | 713.07 | 77.77 | 118.85 | J16 | 323.28 | 35.26 | 53.88 |
| J6 | 918.75 | 423.22 | 23.23 | J17 | 47.83 | 9.55 | 17.78 |
| J7 | 658.90 | 108.92 | 113.02 | J18 | 3.65 | 4.02 | 28.65 |
| J8 | 802.21 | 87.50 | 133.70 | J19 | 766.86 | 646.98 | 43.26 |
| J9 | 855.94 | 524.63 | 368.38 | J20 | 860.20 | 396.25 | 21.75 |
| J10 | 0 | 0 | 0 |
| Carbon Flow | The 1st Year | The 20th Year | The 100th Year | Carbon Flow | The 1st Year | The 20th Year | The 100th Year |
|---|---|---|---|---|---|---|---|
| J0 | 15.82 | 2.41 | 0.23 | J11 | −46.04 | −29.30 | −17.17 |
| J1 | 14.56 | 4.60 | 2.57 | J12 | 460.35 | 292.98 | 171.75 |
| J2 | 21.44 | 2.94 | 3.83 | J13 | 92.07 | 58.60 | 34.35 |
| J3 | 728.26 | 111.06 | 10.37 | J14 | 128.72 | 40.67 | 22.74 |
| J4 | 429.07 | 135.57 | 75.80 | J15 | 669.59 | 184.75 | 252.85 |
| J5 | 713.24 | 97.70 | 127.53 | J16 | 323.35 | 44.29 | 57.82 |
| J6 | 873.92 | 133.28 | 12.44 | J17 | 47.83 | 13.20 | 18.06 |
| J7 | 686.51 | 216.92 | 121.28 | J18 | 4.00 | 16.48 | 56.52 |
| J8 | 802.39 | 109.91 | 143.47 | J19 | 729.27 | 224.01 | 21.92 |
| J9 | 855.94 | 469.99 | 368.38 | J20 | 818.22 | 124.78 | 11.65 |
| J10 | 520.91 | 160.01 | 15.66 |
| Carbon Flow | The 1st Year | The 20th Year | The 100th Year | Carbon Flow | The 1st Year | The 20th Year | The 100th Year |
|---|---|---|---|---|---|---|---|
| J0 | 17.44 | 22.75 | 78.85 | J11 | 42.35 | 5.50 | 1.03 × 10⁻¹¹ |
| J1 | 13.39 | 1.04 | 1.27 × 10⁻¹² | J12 | 423.53 | 55.02 | 1.03 × 10⁻¹⁰ |
| J2 | 21.43 | 0.83 | 1.63 × 10⁻¹⁵ | J13 | 84.71 | 11.00 | 2.07 × 10⁻¹¹ |
| J3 | 802.97 | 1047.29 | 3629.61 | J14 | 118.37 | 9.17 | 1.12 × 10⁻¹¹ |
| J4 | 394.56 | 30.56 | 3.73 × 10⁻¹¹ | J15 | 669.59 | 43.50 | 1.32 × 10⁻¹³ |
| J5 | 712.91 | 27.62 | 5.43 × 10⁻¹⁴ | J16 | 323.20 | 12.52 | 2.46 × 10⁻¹⁴ |
| J6 | 963.56 | 1256.75 | 4355.53 | J17 | 47.83 | 3.11 | 9.40 × 10⁻¹⁵ |
| J7 | 631.30 | 48.90 | 5.97 × 10⁻¹¹ | J18 | 3.33 | 2.22 | 1468.06 |
| J8 | 802.02 | 31.07 | 6.11 × 10⁻¹⁴ | J19 | 804.45 | 1759.56 | 9376.76 |
| J9 | 855.94 | 622.69 | 3539.11 | J20 | 902.16 | 1176.66 | 4077.97 |
| J10 | −574.61 | −1256.83 | −6697.69 |
| Time/Year | Ecosystem Service Value Dynamic Degree | Ecosystem Service Change Index | ||||
|---|---|---|---|---|---|---|
| Benchmark Scenario | Economic Development Scenario |
Carbon Sink Protection Scenario | Benchmark Scenario | Economic Development Scenario |
Carbon Sink Protection Scenario | |
| 0–10 | −0.44% | −0.60% | 0.95% | −0.45% | −0.62% | 0.91% |
| 10–20 | −5.00% | −5.89% | −1.77% | −6.70% | −8.51% | −1.92% |
| 20–30 | −1.09% | −1.89% | 2.44% | −1.15% | −2.08% | 2.21% |
| 30–40 | −0.90% | −0.49% | 3.18% | −0.94% | −0.50% | 2.80% |
| 40–50 | −0.77% | −0.14% | 3.13% | −0.80% | −0.14% | 2.76% |
| 50–60 | −0.60% | 0.00% | 2.70% | −0.62% | 0.00% | 2.42% |
Disclaimer/Publisher’s Note: The statements, opinions and data contained in all publications are solely those of the individual author(s) and contributor(s) and not of MDPI and/or the editor(s). MDPI and/or the editor(s) disclaim responsibility for any injury to people or property resulting from any ideas, methods, instructions or products referred to in the content. |
© 2025 by the authors. Licensee MDPI, Basel, Switzerland. This article is an open access article distributed under the terms and conditions of the Creative Commons Attribution (CC BY) license (https://creativecommons.org/licenses/by/4.0/).
Share and Cite
Chen, N.; Nie, W.; Fan, W. Simulation and Analysis of Changes in Carbon Storage and Ecosystem Services Against the Backdrop of Land Transfer: A Case Study in Lvzenong Park. Land 2025, 14, 694. https://doi.org/10.3390/land14040694
Chen N, Nie W, Fan W. Simulation and Analysis of Changes in Carbon Storage and Ecosystem Services Against the Backdrop of Land Transfer: A Case Study in Lvzenong Park. Land. 2025; 14(4):694. https://doi.org/10.3390/land14040694
Chicago/Turabian StyleChen, Nan, Wanqing Nie, and Weiguo Fan. 2025. "Simulation and Analysis of Changes in Carbon Storage and Ecosystem Services Against the Backdrop of Land Transfer: A Case Study in Lvzenong Park" Land 14, no. 4: 694. https://doi.org/10.3390/land14040694
APA StyleChen, N., Nie, W., & Fan, W. (2025). Simulation and Analysis of Changes in Carbon Storage and Ecosystem Services Against the Backdrop of Land Transfer: A Case Study in Lvzenong Park. Land, 14(4), 694. https://doi.org/10.3390/land14040694