3. Materials and Methods
3.1. Partnership Background Between Author and EDR Researchers
The author worked with the UDP who did a data analysis for SLC as part of the “Thriving in Place Project,” which is a community-driven process to analyze and understand gentrification and displacement and then craft a plan of action [
48]. UPD employs a combination of GIS modeling and data analysis to evaluate displacement risk across the city [
1]. At the core of the study is the EDR model, a GIS-driven tool designed to estimate the likelihood of displacement for low-income renter households across all census tracts in Utah, with a particular focus on Salt Lake City [
1].
3.2. EDR Model
The EDR model identifies census tracts with characteristics strongly correlated with low-income renter population loss between 2015 and 2019. The model analyzes migration patterns by comparing low-income renter populations who left neighborhoods versus those who moved in, using American Community Survey data as the primary data source. The model generates risk classifications through a framework where Low Data Quality indicates tracts with fewer than 500 total households or census margins of error greater than 15% of the estimate. Probable Displacement means the model estimates displacement is likely occurring, Elevated Displacement indicates the model estimates a small amount of displacement, and High Displacement shows the model estimates relatively high displacement levels. The model produces three distinct map layers including an Overall Displacement layer that shows the number of income groups experiencing any displacement risk, a 50–80% AMI layer showing displacement risk specifically for low-income households, and a 0–50% AMI layer that combines extremely low-income and very low-income households using the more extreme displacement scenario when predictions differ.
Key model variables include demographic characteristics, housing market conditions, and built environment features, though the technical report notes that specific variable weights and mathematical formulas are proprietary to the Urban Displacement Project methodology. Critical model limitations acknowledged by UDP include that the model focuses exclusively on renter displacement rather than homeowner displacement pressures, uses 2015–2019 data while missing pandemic and post-pandemic housing market changes, does not incorporate recent housing construction or infrastructure projects, may overestimate risk in areas with high student or military populations due to natural mobility patterns, and may underestimate risk in high-homeownership areas experiencing gentrification pressures.
To enhance the depth of the analysis, the EDR model incorporates additional map layers detailing demographic and economic conditions, such as the percentage of low-income renters, an Affordable Market Index, segregation patterns, and redlined zones from the 1930s. Historical redlining data, sourced from the University of Richmond’s Mapping Inequality project, delineates neighborhoods that were redlined in the 1930s, underscoring the enduring effects of racial segregation and disparities in wealth and homeownership [
49].
Overlay layers further contextualize the analysis by including city limits and city council district boundaries, which help define the geographic scope of governance and policymaking. Additionally, the analysis integrates demographic-specific layers to account for unique population characteristics, such as tracts with over 30% student populations or over 40% retired individuals. While students’ low wages and high migration rates may lead to overestimations of displacement risk, low-income non-student residents in these areas may still face significant pressures. Similarly, retired populations, despite their low incomes, often have stable housing situations, which may also skew risk predictions. Military infrastructure, another key layer, captures areas with military bases or facilities, where high in- and out-migration rates may affect displacement assessments. Finally, the inclusion of roads and transit networks reflects the critical role of accessibility and mobility in shaping housing dynamics.
Together, these layers provide a comprehensive framework for evaluating displacement risk, balancing historical, demographic, and infrastructural influences, and ensuring a more nuanced understanding of the factors contributing to housing instability. More details of the EDR model applied in SLC could be found in the technical paper: Urban Displacement Project’s Salt Lake City Displacement Data Analysis [
1].
3.3. Limitations of EDR Model
Because the model assesses displacement risk for renters, it may overlook displacement pressures faced by homeowners, leading to potential underestimations in areas with higher homeownership rates. Furthermore, the model does not account for new housing developments or infrastructure projects initiated after 2019, which may influence current displacement dynamics. The use of pre-2019 data introduces substantial limitations given COVID-19’s transformative impacts on housing markets, with remote work policies, eviction moratoriums, and historically low interest rates fundamentally altering displacement dynamics.
3.4. Interview Data Collection
This study involved comparing the GIS model’s outputs with qualitative neighborhood assessments conducted by University of Utah students under the author’s guidance. This qualitative data, drawn from 22 community interviews per neighborhood and narratives, offers on-the-ground insights that either validate or challenge the model’s predictions. In this study, data for six neighborhoods is presented—Poplar Grove, Glendale, Ballpark, Central City, East Central, Fairpark—for a total of 132 interviews.
The selection of neighborhoods—Poplar Grove, Glendale, Ballpark, Central City, East Central, and Fairpark—was informed by their historical, socio-economic, and demographic significance. These areas represent a spectrum of displacement pressures, from high-risk zones identified by the EDR model to neighborhoods experiencing early signs of gentrification. By focusing on these specific neighborhoods, the study aimed to capture a diverse range of displacement dynamics, offering insights into how varying socio-economic factors interact with urban development and housing policies. Additionally, these areas provided opportunities to compare the model’s outputs with rich, community-driven qualitative data, enabling the identification of discrepancies and validation of predictive patterns.
To ensure a diverse and representative sample, researchers employed multiple strategies to engage potential interviewees. Outreach was conducted in various public and private settings, including sidewalks, commercial establishments, and community events. A common practice involved researchers introducing themselves as graduate students from the University of Utah’s City and Metropolitan Planning Master’s Program. They explained that the interviews were part of a project for their Community Engagement in Planning course, aimed at understanding neighborhood changes.
3.5. Interview Procedures
Each interview lasted approximately 20 min and followed a semi-structured format, allowing participants to provide in-depth responses to key questions while enabling flexibility to explore emerging themes. Interviews were conducted in person, and participants were recruited through public outreach at community events, local businesses, and residential areas. Interviews were audio-recorded with participant consent and later transcribed verbatim for analysis by each student who conducted them. Participants could choose to use their names or not.
The interview process was structured to gather insights into participants’ connections to the neighborhood and their views on its evolution. The interview questions were crafted to explore several key themes:
The interview questions were designed to capture key dimensions of gentrification and displacement that quantitative data alone cannot reveal. Questions about participants’ relationship to the neighborhood and their observations of changes provide insights into how gentrification impacts long-term residents and the social fabric of the area. From the perspective of Asset-based Community Development (ABCD), exploring neighborhood strengths and community connections highlights the cultural and social assets that define the neighborhood’s identity, which are often threatened by displacement [
46,
50]. Lastly, asking about participants’ future vision for the neighborhood helps identify their priorities and concerns, ensuring that community voices are considered in planning and policy decisions. These questions enable a comprehensive understanding of gentrification by uncovering the lived experiences behind broader socioeconomic trends.
3.6. Ethics of Qualitative Data Collection
To protect participant confidentiality, pseudonyms were used for most people unless they wanted to use their real name. Students were required to submit images of their engagement. The IRB allowed images and names of participants if they were interested in telling their stories. We found that business owners, non-profit, and advocates were interested in telling their stories using their names. If people choose anonymity the identifying information was removed from the transcripts. All participants provided informed consent under an Institutional Review Board (IRB)-approved protocol. A total of 12 students contributed to these interviews and they received training under the IRB, a committee responsible for ensuring the ethical treatment of human subjects in research. The IRB approval number is 00099240, titled “Gentrification and Neighborhood Change: Index and Affordability Strategies for Salt Lake City”.
3.7. Limitations of Qualitative Data
While 132 interviews were conducted across six neighborhoods (22 per neighborhood), detailed demographic breakdowns of participants were not systematically collected, representing a limitation in assessing potential sampling bias. Despite the absence of explicit demographic information about all respondents, the reliability of the interview data can be supported by the methodological approach described in the documents, which focused on gathering in-depth perspectives from directly affected individuals within the neighborhoods. The research aimed to collect valuable information from people most affected by current development and displacement trends. The methodology emphasized engaging directly with residents to develop a deeper and more detailed story of the community and its assets, with collected information including personal experiences that were shared, which is crucial for understanding the qualitative impact of neighborhood changes from the perspective of those living them. By focusing on direct engagement and collecting unique stories, the interviews aimed to provide rich, contextualized data about neighborhood changes and community assets, which is a hallmark of qualitative research that prioritizes the depth and nuance of individual experiences over broad statistical representation. Therefore, while specific demographic breakdowns are not provided for all interviewees, the data’s reliability stems from the direct, in-depth engagement with individuals significantly impacted by and knowledgeable about the neighborhood changes, ensuring the captured experiences are authentic and relevant to the study’s objectives.
4. Background: Description of Salt Lake City and Neighborhoods
Data from the American Community Survey (ACS) for 2019 is presented in
Table 1 to provide context for each neighborhood, offering a detailed snapshot of their demographic, economic, and housing characteristics. These metrics help illuminate the unique dynamics of neighborhoods like Poplar Grove, Glendale, Ballpark, Central City, East Central, and Fairpark, highlighting the socioeconomic conditions and housing trends that shape their identities.
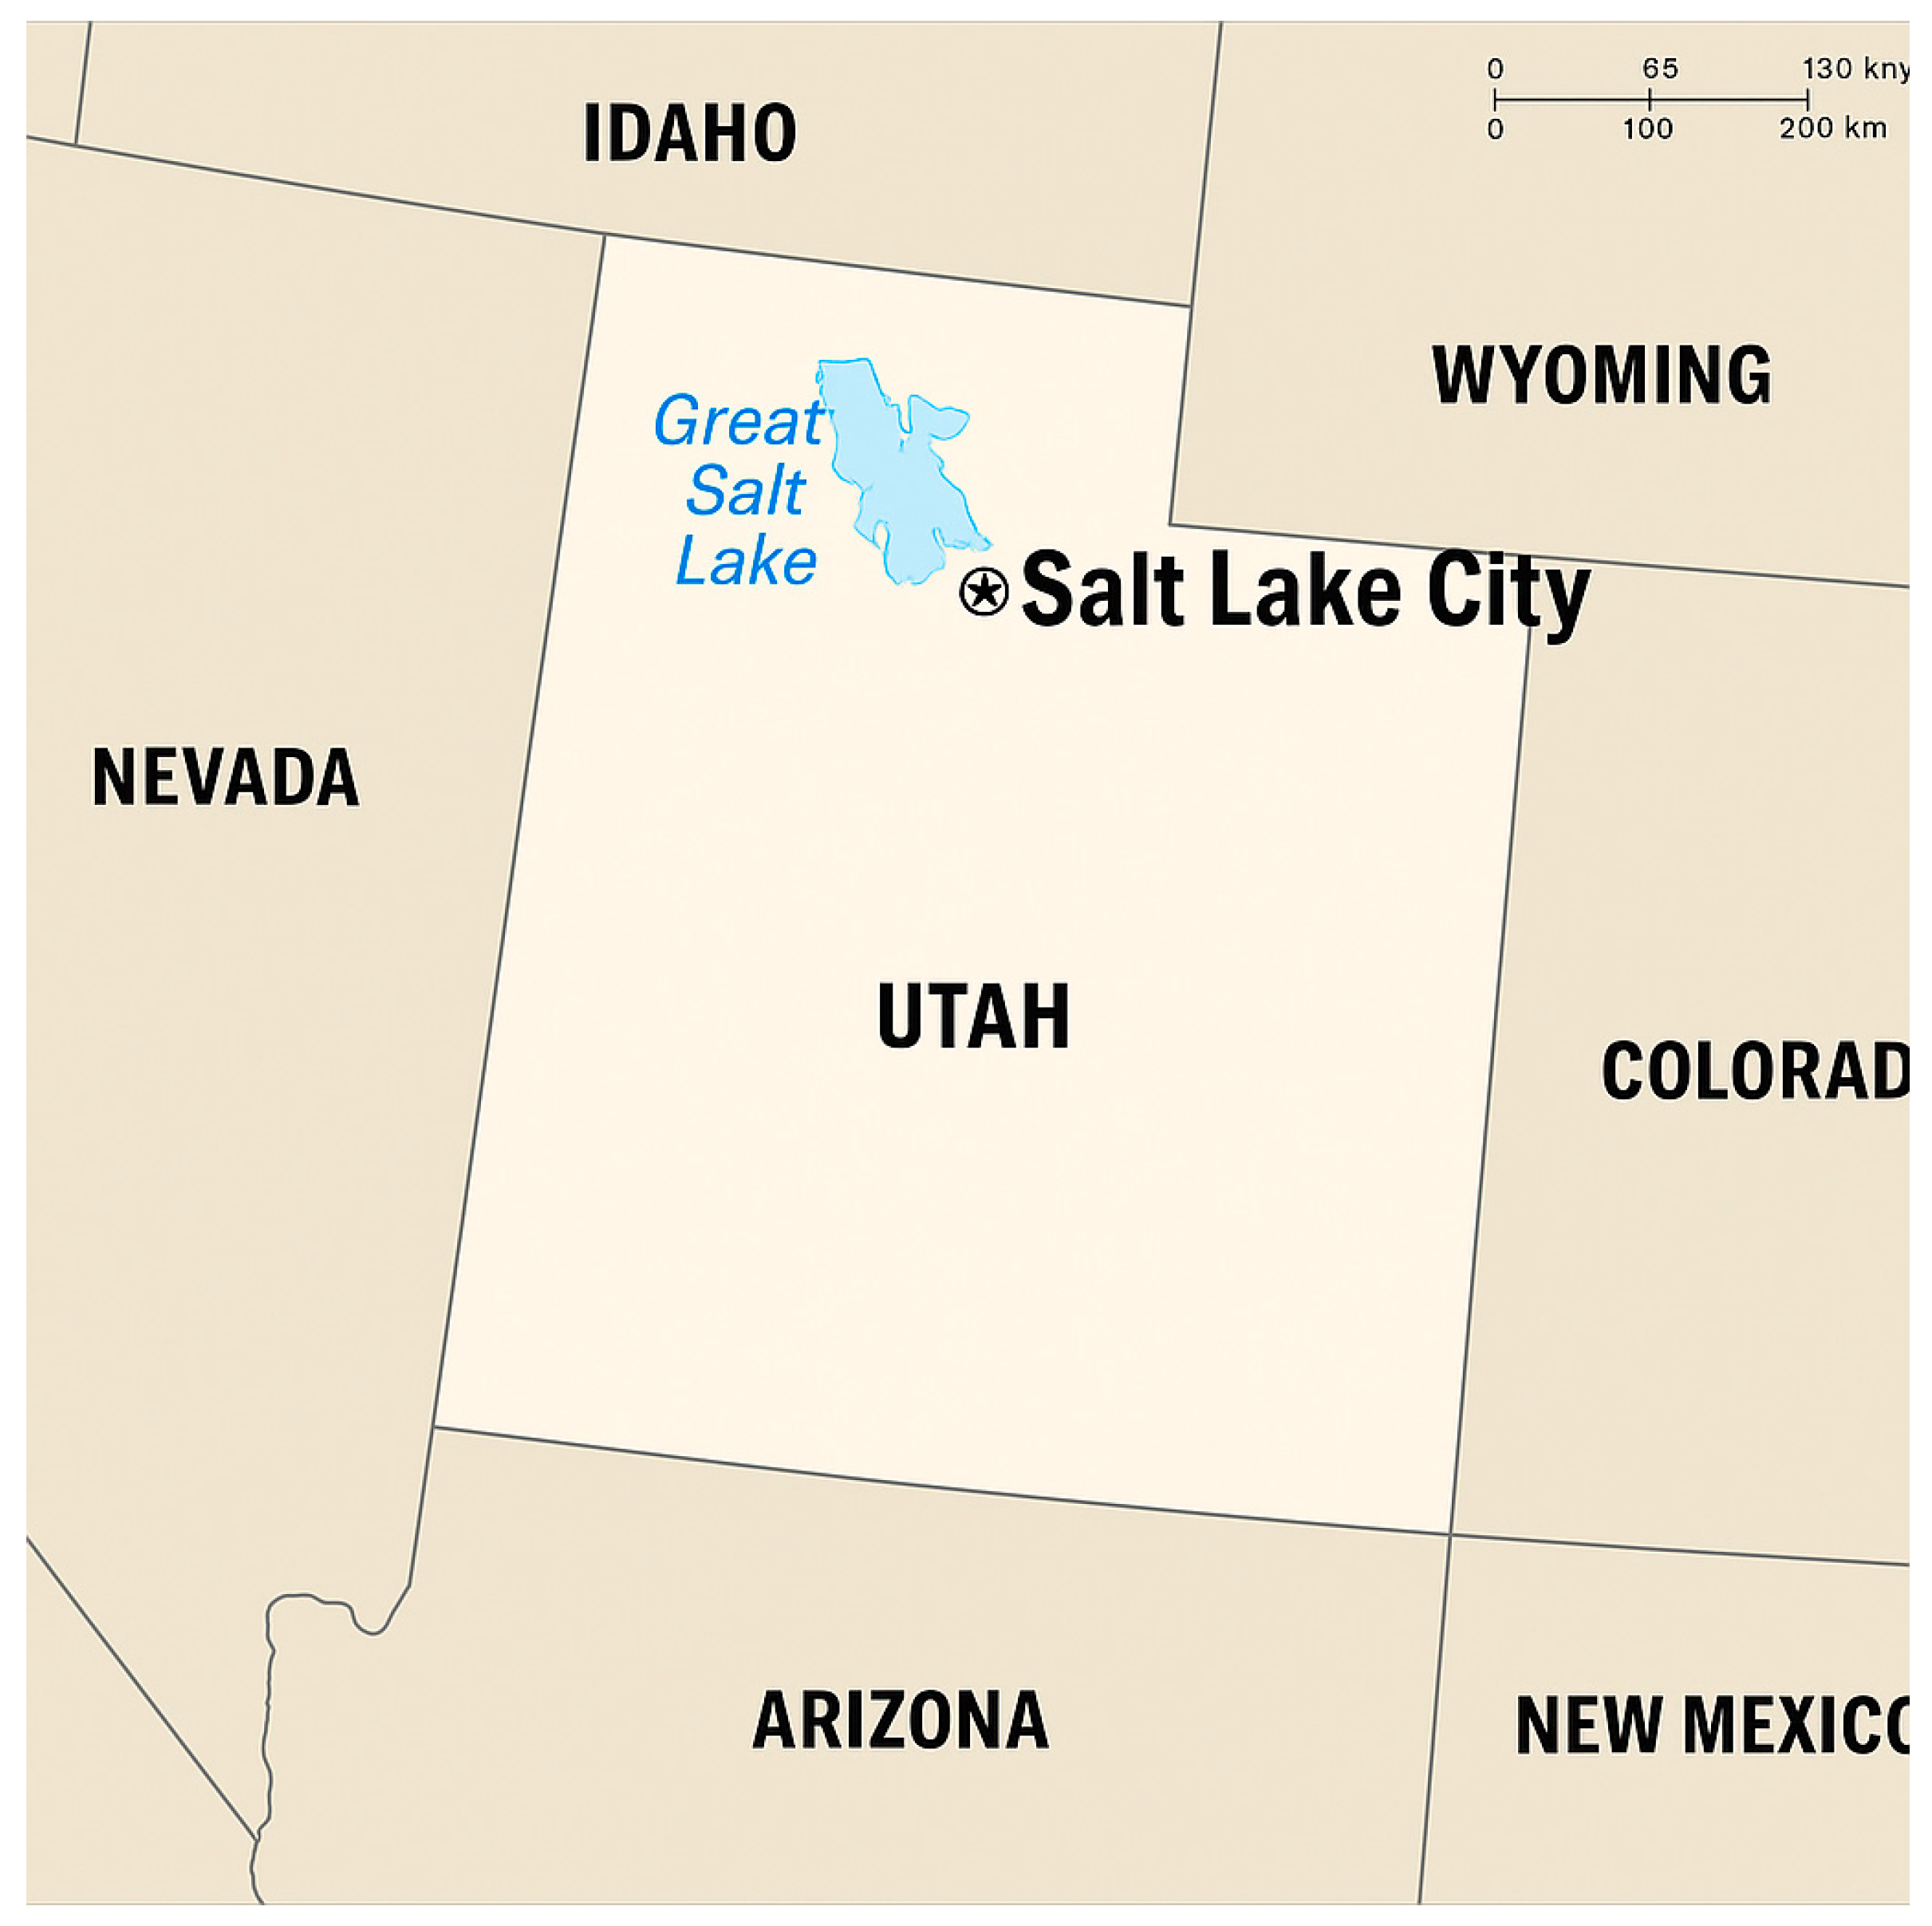
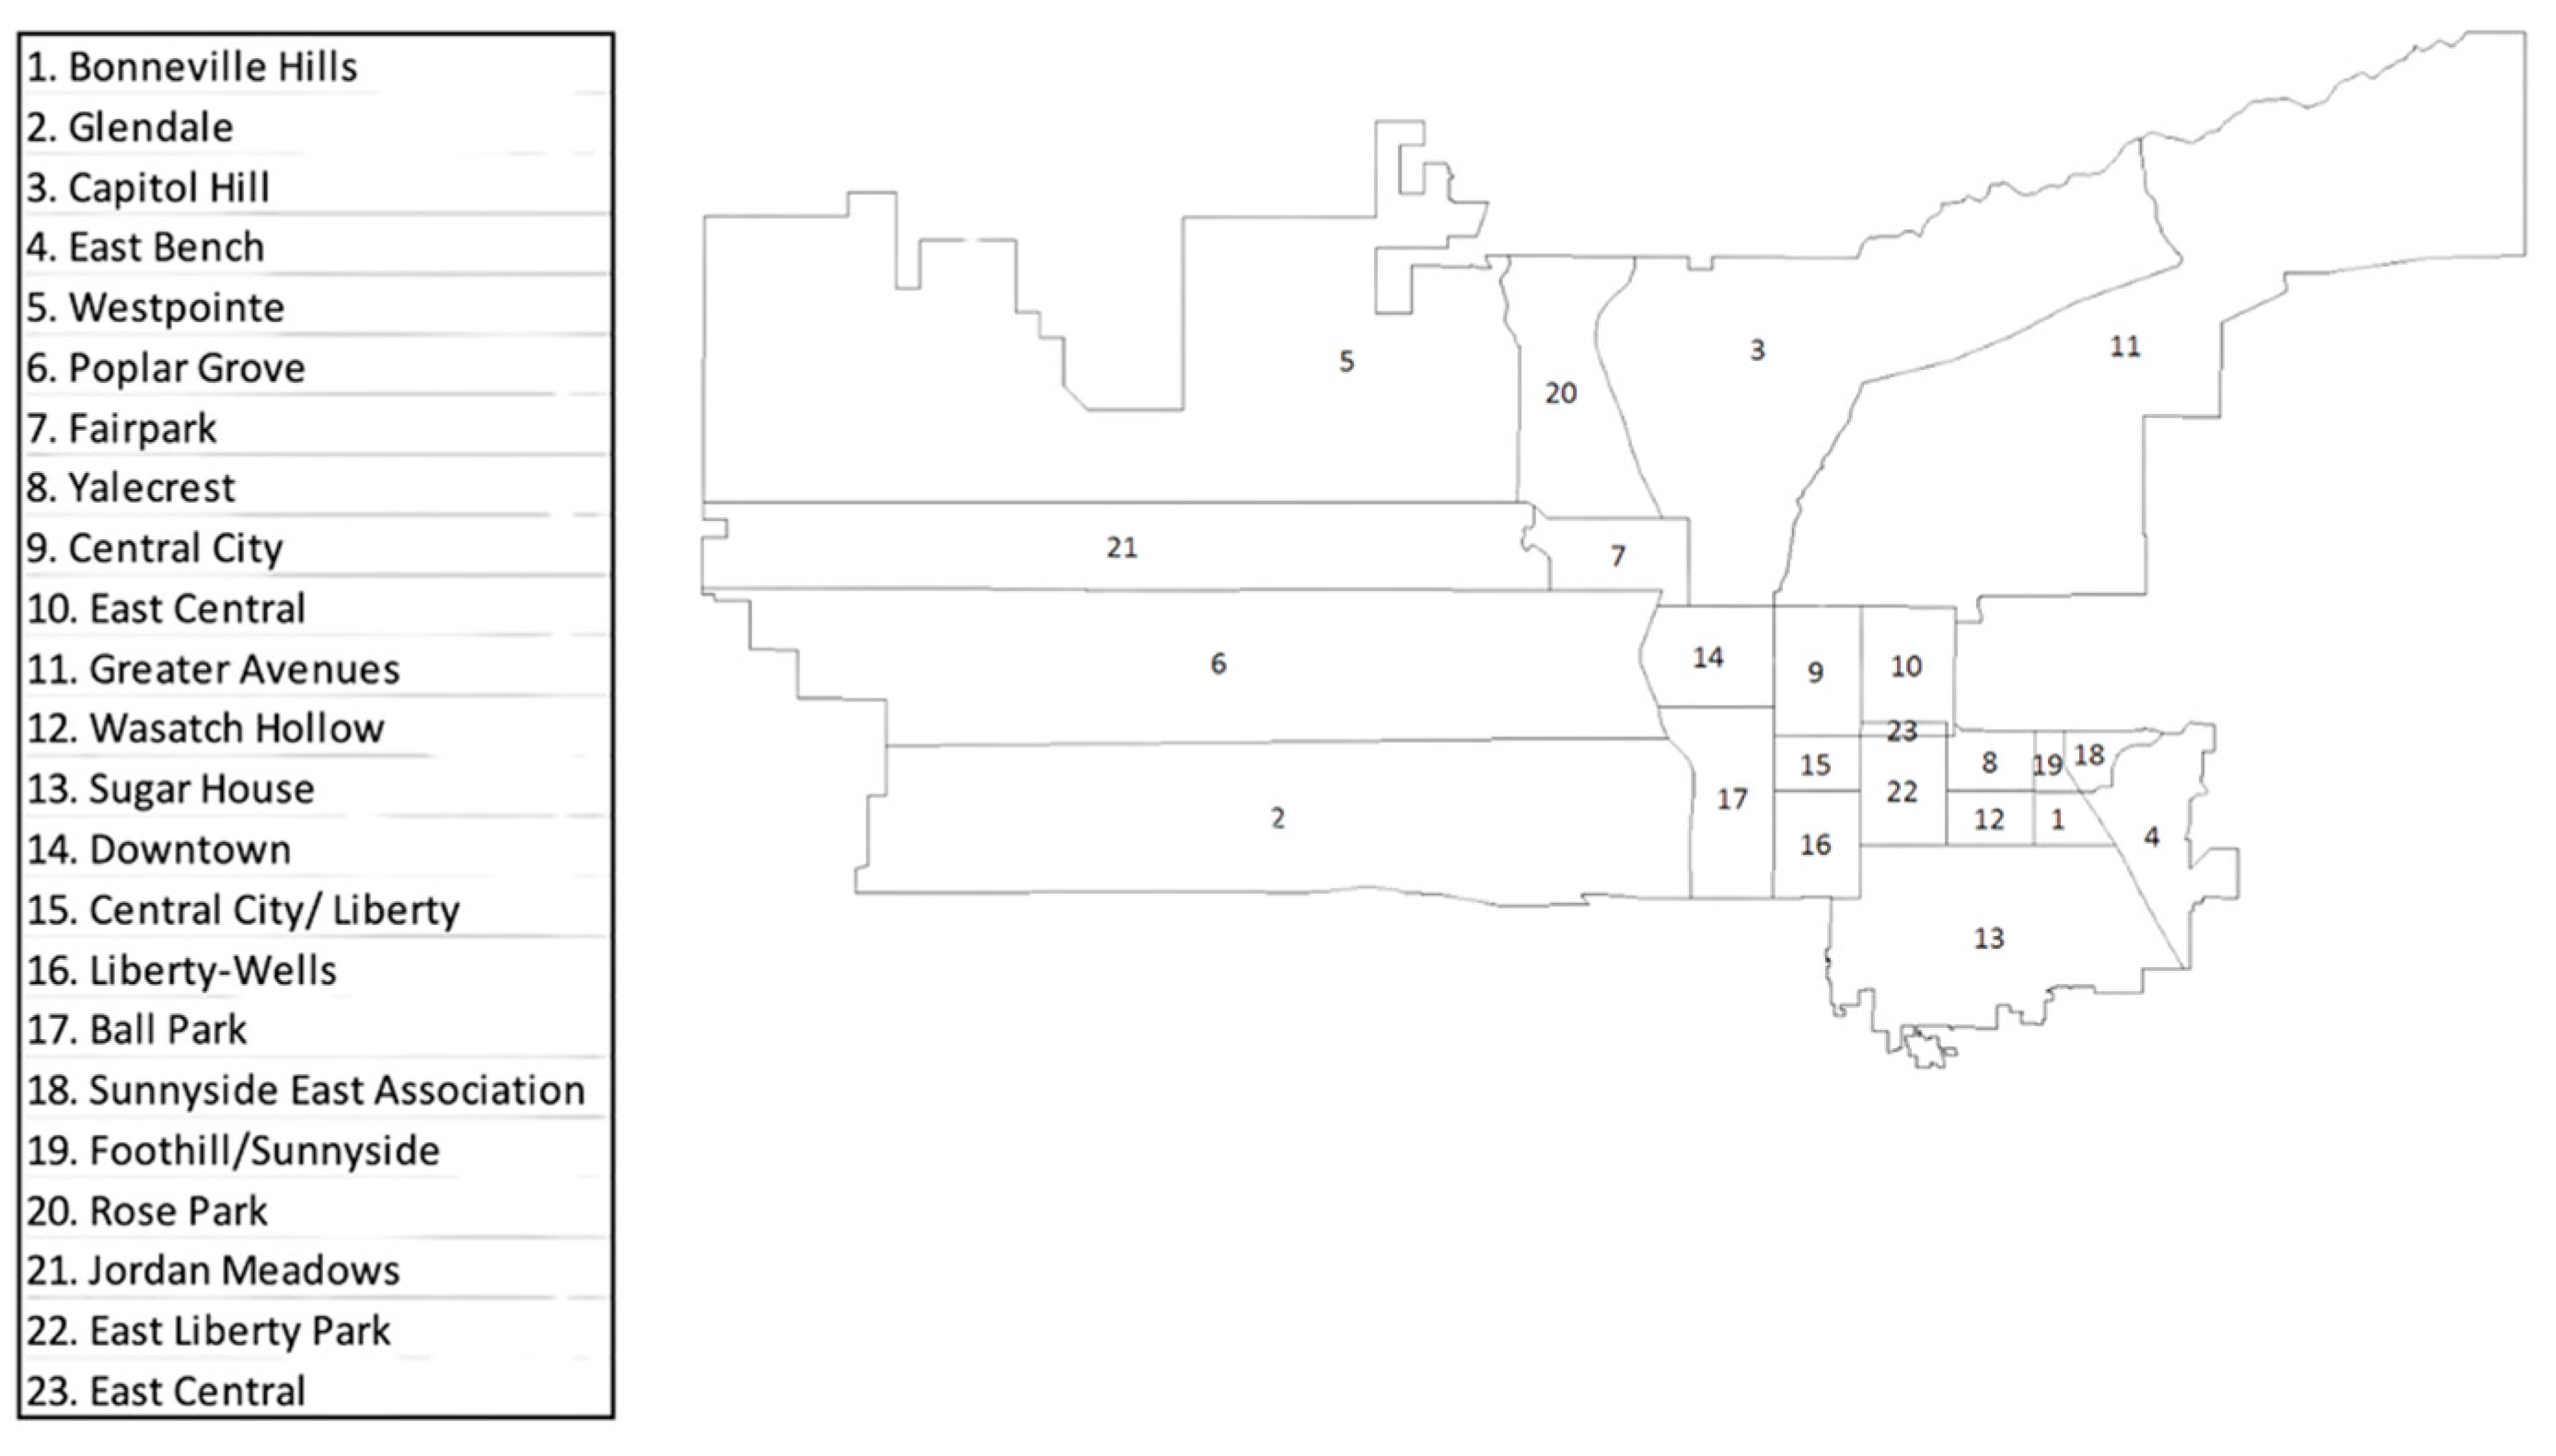
Figure 1 shows where Salt Lake City is located in the United States, and
Figure 2 shows where the neighborhoods are situated within Salt Lake City.
This contextual information is critical for understanding how gentrification manifests differently across neighborhoods. For example, indicators such as rising median house values, shifts in racial and ethnic composition, changes in educational attainment, and varying proportions of renter-occupied versus owner-occupied housing provide insights into the pressures and transformations that neighborhoods may experience. These data points are not only descriptive but also serve as key indicators of broader trends, helping to identify where gentrification and displacement pressures may be occurring and where targeted interventions might be needed to support vulnerable populations.
4.1. Salt Lake City
Salt Lake City, the capital of Utah, has a population of approximately 210,314. The city is predominantly composed of residents who identify as “White alone” (73.9%), with a significant Latino population (21%). It has a relatively younger demographic, with only 6.1% of its population under 18 years old and 11.4% over the age of 65. Family households comprise 56.3% of the total, with 9.3% being female-headed families with children. Housing in Salt Lake City is almost evenly split between renter-occupied units (45.0%) and owner-occupied units (55.0%). The city’s median family income is USD 91,332, and 33.6% of residents have obtained a college degree or higher. Despite its relatively high median house value of USD 342,316, 15.7% of the population lives below the poverty line.
The city’s demographic and economic makeup provides a unique lens for examining gentrification and displacement trends. Salt Lake City’s mix of renters and homeowners indicates a population at risk for displacement, particularly as housing prices continue to rise. Neighborhoods with higher proportions of renters and vulnerable populations, such as families below the poverty line and Latino residents, often experience the earliest signs of gentrification. These signs include rising rents, new high-density developments, and an influx of higher-income residents. Such dynamics, combined with the city’s relatively high percentage of college-educated individuals, suggest pressures for neighborhood upgrading and redevelopment. These changes risk displacing long-standing residents, disrupting social networks, and transforming the cultural character of vulnerable communities. Understanding these trends is essential for crafting policies that address housing inequities and promote inclusive urban development.
4.2. Central City
Central City exhibits strong indicators of gentrification, including the highest percentage of college graduates (39.4%) and one of the lowest percentages of family households (21.7%). Median house values are relatively high at USD 285,600, and the population is predominantly White (73.1%). With 85.1% renter-occupied housing and higher income levels (USD 55,951), the area reflects typical signs of urban gentrification, such as displacement of long-standing, low-income residents in favor of higher-income, educated newcomers.
4.3. Ballpark
Ballpark is characterized by high renter occupancy (84.3%) and a lower percentage of families (42.2%). The median house value is USD 244,000, and poverty levels are high (31.7%). The demographic composition includes a majority White population (66.3%) and 32.6% Latino residents. This neighborhood shows significant signs of gentrification, with low family household percentages and high renter occupancy, suggesting turnover and housing instability.
4.4. East Central
East Central stands out as the most affluent neighborhood in the group, with the highest median house value (USD 409,500) and median family income (USD 76,250). A significant portion of the population holds college degrees (39.1%), and only 10.8% of residents are Latino. High housing costs and a low percentage of family households (26.6%) suggest this area has undergone substantial gentrification, leading to reduced housing affordability for low-income populations.
4.5. Glendale
Glendale exhibits similar demographic characteristics to Poplar Grove, with 43.4% Latino residents and a slightly higher median house value (USD 190,033). Owner-occupied housing (57%) dominates, but renters still make up a significant portion (43%). The percentage of families below the poverty line is moderate (17.6%), and educational attainment remains low (9.6% with a college degree). While the signs of gentrification are subtle, its higher family household rates and homeownership could make it less vulnerable to displacement pressures.
4.6. Fairpark
Fairpark has a more balanced housing mix, with 33.3% renter-occupied units and 66.7% owner-occupied units. The median house value (USD 134,600) and income levels (USD 48,936) are among the lowest, and poverty rates are high (32.7%). While educational attainment (13.8%) and managerial occupation percentages (7.2%) remain low, the area shows fewer signs of gentrification due to its lower housing costs and stable family household percentages (66.6%).
4.7. Poplar Grove
Poplar Grove has a predominantly Latino population (53.5%), with relatively low educational attainment (8.6% college graduates) and a median house value of USD 174,067, among the lowest in the group. A significant portion of housing units are renter-occupied (52.6%), and poverty levels (17.4%) are moderate. Signs of gentrification are less apparent here, as low house values and income levels suggest limited economic changes compared to other neighborhoods. However, the area’s proximity to more central locations may attract future development pressures.
According to the ACS data alone, Ballpark, Central City, and East Central show the strongest indicators of gentrification, with high renter occupancy, increasing house values, and higher levels of education and income. These patterns suggest displacement risks for low-income, minority, and family households. In contrast, neighborhoods like Fairpark, Glendale, and Poplar Grove retain more affordable housing and family-friendly characteristics, but they may face future pressures as development continues in adjacent areas.
5. Results: Alignment Between GIS Predictions and Lived Experiences
The results of this study reveal significant insights into the relationship between GIS-driven displacement models and the lived experiences of residents in Salt Lake City. By comparing the Urban Displacement Project’s (UDP) Estimated Displacement Risk (EDR) model with qualitative interviews conducted across various neighborhoods, several key findings emerged, highlighting both the strengths and limitations of predictive GIS tools in capturing urban displacement dynamics. In
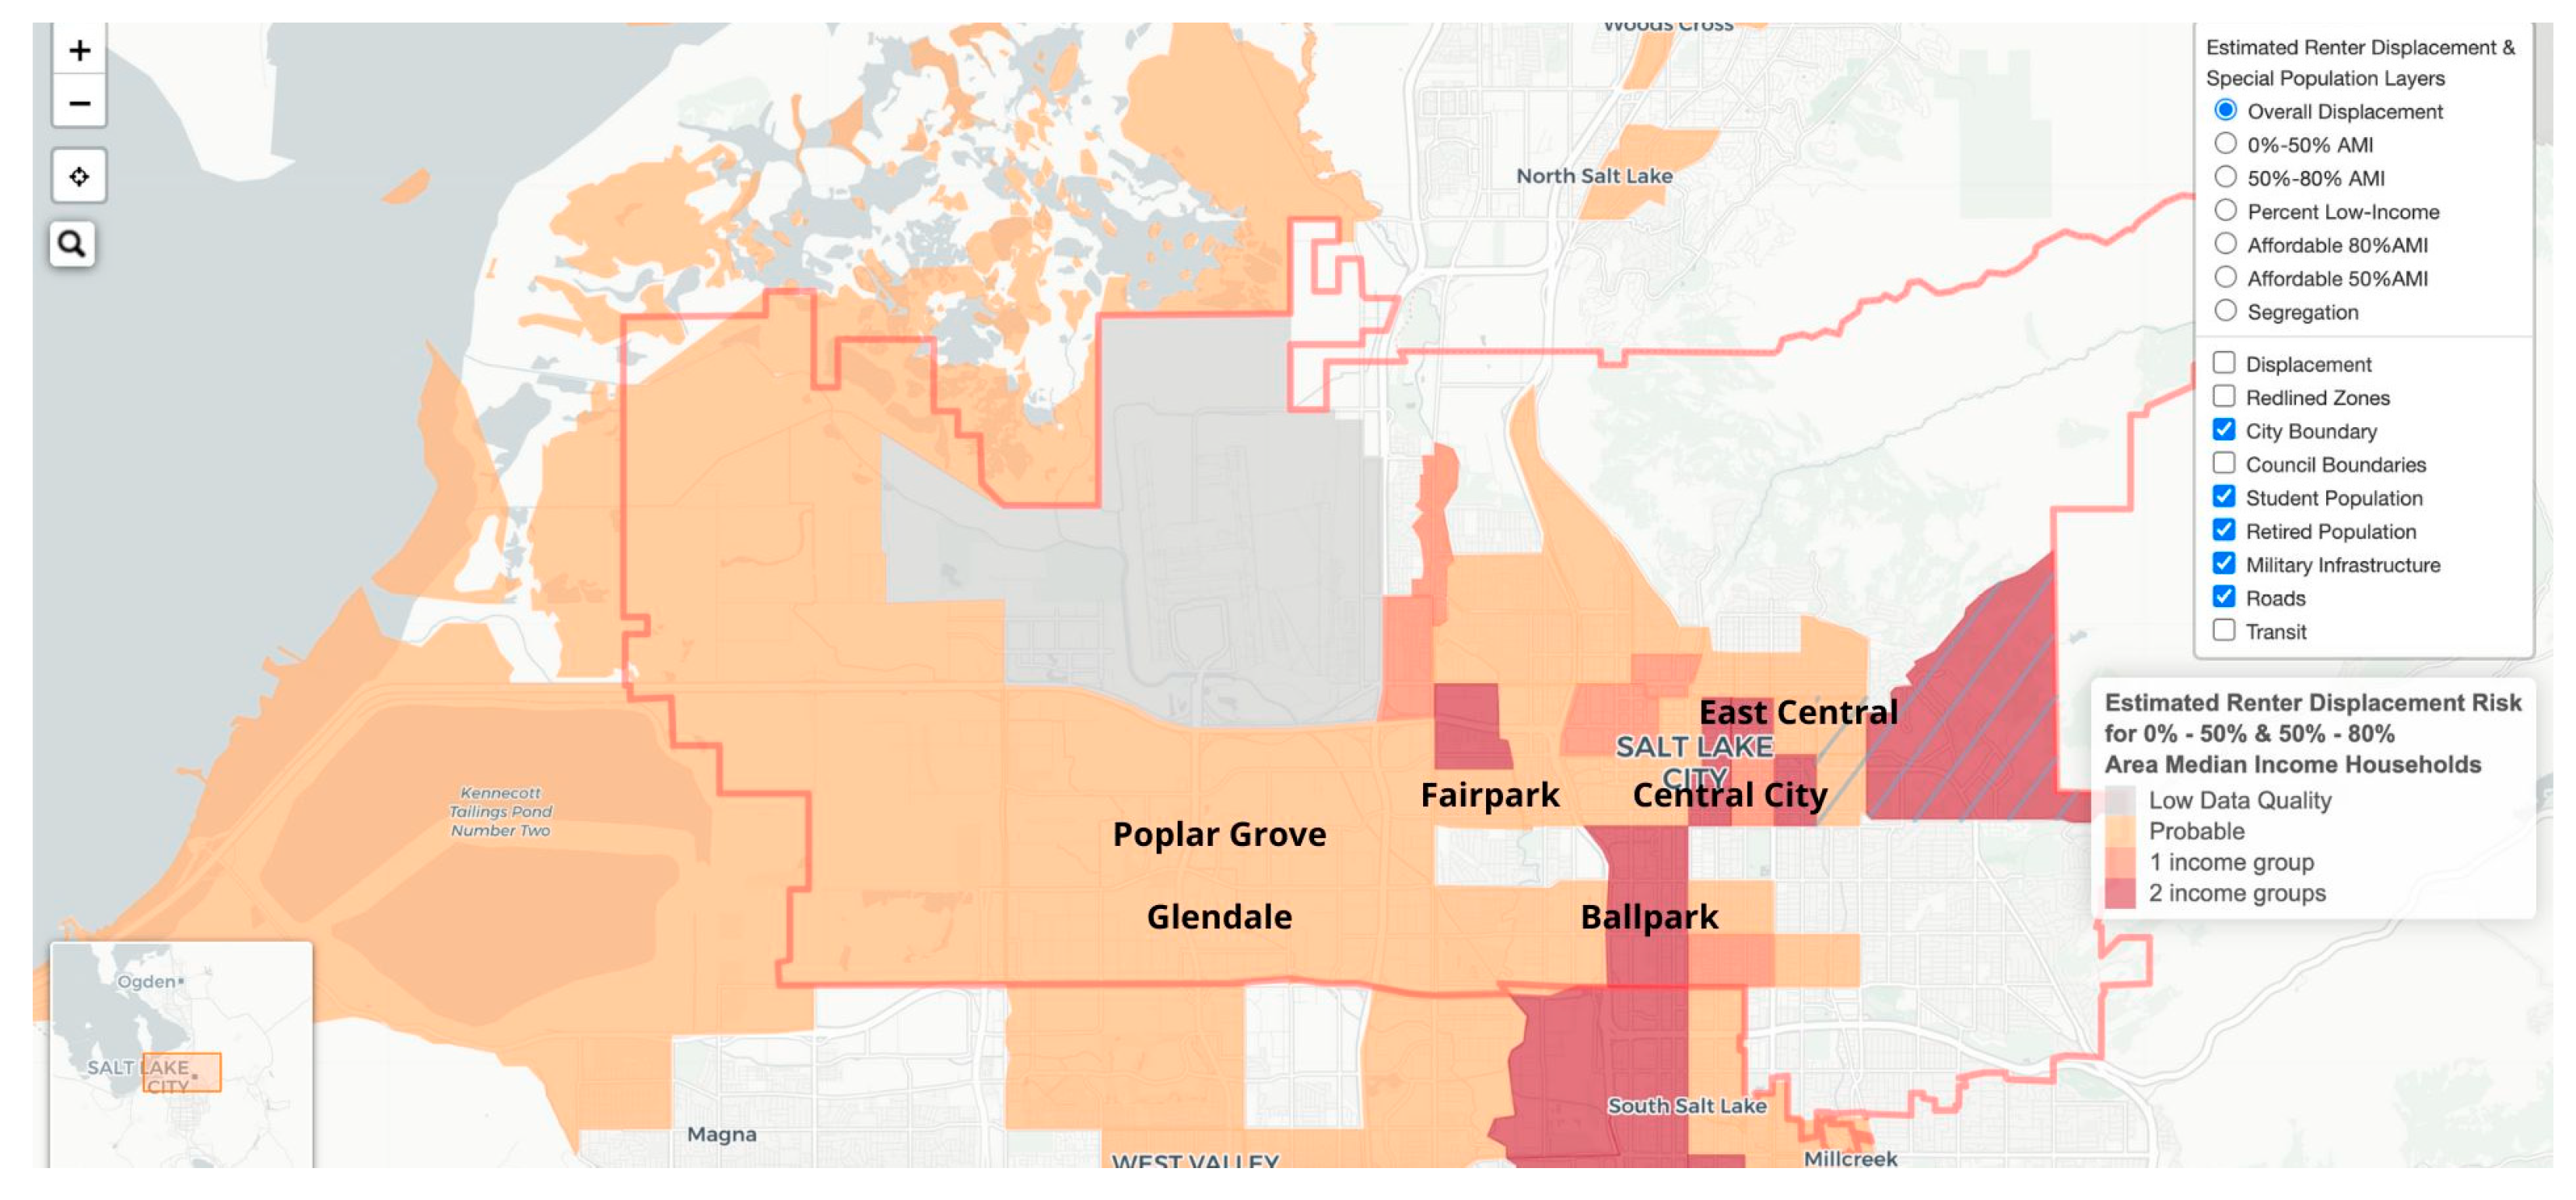
Figure 3 the dark reddish color means that the zip code shows high displacement risk for two income groups (very low 0–50% AMI and low income 50–80%), the dark orange is elevated displacement for very low-income households (0–50% AMI) and light orange is probable displacement risk. This classification suggests that rising housing costs, demographic shifts, and increased development are contributing to the vulnerability of low-income households.
5.1. Central City
The risk of displacement in Central City is evident through the voices of long-time residents and business owners. Bailey, who has lived in the neighborhood since her college years, notes that “the stability of the Central City neighborhood is threatened by the aggressive development of high-priced apartment buildings.” She laments the demolition of historical buildings, replaced by luxury apartments, contributing to the erosion of the area’s character and affordability. Similarly, Ken, a business owner for 25 years expressed concern that rising rents may force his closure, stating, “If my business is forced to close its current location, I will have nowhere to relocate to. Affordable space no longer exists in the valley.”
Long-term residents like Gabriella, who lives in senior housing, worry about the vulnerability of their communities. She shares, “If folks from my building were displaced due to rising rents, I am unsure where they would go.” Donnie, a homeowner, highlights the impact of short-term rentals, describing how “more than half my street is short-term rentals, making it feel like I have no neighbors.” This shift toward short-term leasing reduces the availability of stable housing, contributing to displacement.
Even those involved in development acknowledge the issue. One developer suggests, “There should be a 2:1 replacement requirement for any affordable rental housing that is lost in development.” The voices from Central City reflect a neighborhood in transition, with rising costs and changing demographics pushing out long-standing residents and businesses, underscoring the urgent need for policies to address displacement risks.
The map highlights a high risk of displacement in the area, which aligns with ongoing trends in the neighborhood. Historic homes have been demolished to make way for higher-density apartment buildings, reflecting increased development pressure. The area, previously redlined, is now seeing a surge in investment, contributing to rising property values and rents. With most residents being low-income renters, they are particularly vulnerable to these changes. Additionally, the neighborhood is attracting an influx of out-of-state residents, further intensifying competition for housing. The area’s proximity to downtown and strong public transit access makes it desirable, accelerating the risk of displacement. However, the presence of affordable, deed-restricted units provides some safeguard, helping to stabilize households that meet the qualifications for these units.
5.2. Ballpark
The Ballpark neighborhood of Salt Lake City is undergoing significant redevelopment, sparking concerns about displacement and the erosion of community character as described by interviewees. Tracy, a resident since 2015, points out the stark juxtaposition of gentrification and persistent social issues, stating, “It’s weird cause, like, I still have people smoking heroin on my front porch, but then I also have a bunch of yuppies that are like mad about it.” This highlights the culture clash between long-time residents and wealthier newcomers, as rents in the area continue to rise, forcing many to downsize or leave.
Garrett, who rents a house with others, expresses frustration with the shifting landscape, noting that “I’m not a big fan of all the luxury apartments” replacing historic homes and businesses. Similarly, longtime resident Ron reflects on the physical transformation of the neighborhood, lamenting that “it’s on its last legs” as apartment complexes replace single-family homes, diminishing the neighborhood’s historic character and sense of community.
Matt, who has lived in Ballpark for 20 years, underscores the resilience of residents fighting to preserve the neighborhood’s character, explaining, “We fight what we can fight, we’re very careful to welcome those who are going to bring services to the community.” However, he also recognizes the challenges posed by safety issues and the lack of local amenities, pointing out the need for more schools and better infrastructure. The voices from Ballpark paint a picture of a neighborhood at a crossroads, where redevelopment brings both opportunity and concern for those at risk of being displaced.
The map indicates elevated displacement risk for both income groups, which aligns with the area’s history and current trends. The neighborhood was previously redlined, has a high concentration of low-income renters, and is experiencing rising rents alongside new apartment and townhome developments. Its proximity to transit further increases the likelihood of displacement.
In contrast, the map shows no displacement risk in other areas. This is consistent with the fact that these neighborhoods were historically rated as “best” or “still desirable” on redlining maps. They are characterized by large populations of wealthy White homeowners and high housing prices, making them exclusive and less susceptible to displacement pressures.
5.3. East Central
The interviews conducted in the East Central and East Liberty Park neighborhoods validate the mapping that indicates a high risk of displacement. Several residents expressed concerns about rising rents, new luxury developments, and the influx of wealthier individuals reshaping the area.
Kyle, a new resident, observed that “small single-family homes are being torn down and replaced by large, hideous luxury condos.” He expressed fears that these new developments drive up housing costs without sufficiently increasing housing availability. Similarly, Ethan reflected on the changing character of the neighborhood, pointing out that “new apartment complexes are not creating more walkable neighborhoods” and are instead contributing to rising rents.
Long-term residents like Blair also highlighted the impact of new construction, sharing that “local businesses are getting torn down to make way for development,” which he finds overwhelming. Gavin, planning to move out of state due to housing costs, emphasized that “rising rents are not just a possibility—they’re happening now.”
While some residents like Nikki have not yet experienced significant displacement, there is widespread acknowledgment that the increasing presence of luxury apartments and high property values threatens the neighborhood’s stability. Dustin, a 12-year resident, noted that “larger apartments going up aren’t the answer” and expressed concerns that people will have to relocate to less expensive areas further west if costs continue to rise.
Overall, the interviews consistently reflect anxiety about displacement, reinforcing the findings of the mapping analysis and painting a clear picture of a neighborhood in transition, facing the pressures of gentrification and increasing housing insecurity.
The map indicates high displacement risk in the northern part of the area, while the rest shows no significant risk. This aligns with local demographics, as the northern section near the university has a large student population, most of whom are renters with relatively low incomes. In contrast, the surrounding neighborhoods are more affluent, with a higher concentration of homeowners, contributing to greater stability and lower displacement risk.
5.4. Glendale
The interviews from Glendale reveal deep concerns about gentrification and displacement, reflecting a community at risk of significant change. Residents consistently highlight rising rents, increasing development, and demographic shifts as emerging threats to the neighborhood’s stability.
Erin, a homeowner for two years, expressed apprehension about the influx of condominiums and rising housing prices, noting that “there are more rental properties and higher prices now than in previous years.” She fears that if current trends continue, there will be no affordable options left within Salt Lake Valley for displaced residents. Similarly, Austin observed a decline in the racial diversity that once defined Glendale, attributing it to the arrival of young, wealthier newcomers. He remarked, “I was more of a minority when I moved here, but now there’s been a shift.”
Long-term residents like Kim, who has lived in Glendale for 18 years, voiced concerns about the neighborhood losing its character due to increased crime, homelessness, and development pressures. “You have to be rich now to live here,” said James, underscoring the economic divide that gentrification exacerbates. Cheryl echoed these sentiments, warning that as more people move in, “they’re going to start tearing a lot of places down soon.”
Despite these challenges, many residents remain committed to preserving Glendale’s community spirit. Cassy, a nine-year resident, values the neighborhood’s diversity and hopes it will retain its cultural identity, explaining, “I’ve lived all over the valley and immediately felt the community here.”
The collective narrative points to a strong sense of place and belonging, but also a growing unease about the future. Glendale residents recognize the need for affordable housing, improved infrastructure, and protections for long-term community members to mitigate displacement and ensure the neighborhood’s inclusivity endures.
The map shows probable displacement risk for the lowest income group, while showing no significant risk for the 50–80% AMI group [
1]. The area has a large Latinx population with flourishing businesses, along with other immigrants and many residents are lower-income households [
1]. However, similar to other neighborhoods on the west side, the area has a lot of homeowners who are less likely to be displaced [
1].
5.5. Fairpark
The Fairpark community in Salt Lake City reflects a neighborhood deeply concerned about the risk of gentrification and displacement. Interviews with residents reveal anxieties about the area’s increasing development, rising property values, and the influx of new, wealthier residents. One long-time resident noted, “This place changes all the time… it’s suddenly beginning to recover. This was just urban decay.” While some see revitalization as positive, others fear it could lead to displacement of lower-income households.
Several interviewees pointed to the loss of local businesses and essential services, like the closure of a neighborhood Walgreens. One resident expressed frustration, saying, “There was no replacement for those businesses, they went away, they’re gone.” This lack of reinvestment in community-serving institutions raises concerns that new developments may not prioritize existing residents’ needs.
Additionally, there is a notable divide between long-term residents and newcomers. A young resident reflected on the transformation, mentioning, “They see some economic growth and a fiscal dollar sign on it, now they’re wanting to invest a lot more into where they overlooked for way too long.” While development brings attention to the neighborhood, many fear that these changes could price out current residents, forcing them to relocate to more affordable areas outside of Salt Lake City.
The proximity of Fairpark to downtown and transit hubs makes it a prime target for redevelopment, and while residents acknowledge the benefits of investment, many worry about the neighborhood losing its cultural identity. Efforts to preserve affordability and community assets will be crucial in ensuring that revitalization does not lead to widespread displacement.
The map indicates probable displacement risk for both income groups, though the qualitative narrative suggests an even greater risk than the map reflects. Residents highlight the transformation of dilapidated homes into renovated properties, signaling increased investment and rising housing costs. The area’s high poverty rate, large Latinx population, and the displacement of multigenerational families by younger renters further emphasize the pressures of gentrification. These firsthand accounts paint a picture of a neighborhood undergoing rapid change, where the threat of displacement looms larger than quantitative models may capture.
5.6. Poplar Grove
The Poplar Grove community in Salt Lake City reflects a growing concern about displacement and gentrification, as highlighted by residents’ narratives and observations. While the map may show probable displacement risk, the interviews reveal deeper anxieties and lived experiences of change. Long-term residents like JT expressed frustration over the influx of new people, stating, “They are taking over the neighborhood and making it worse.” He attributes rising costs, and neighborhood shifts to the arrival of wealthier newcomers and increasing development.
Other residents echoed similar sentiments. One resident, “P,” noted how demand for housing is pushing prices up, sharing that his own home value increased by USD 80,000. He described receiving frequent cash offers for his property, which he sees as a sign of encroaching gentrification. P voiced concern over large-scale apartment developments, emphasizing that “I would like to see families move in, not apartment buildings with hundreds of people.”
Steph and Dan, residents for nearly a decade, described an “interesting juxtaposition of new development and deterioration.” They observed vacant businesses and deteriorating homes alongside new renovations and infrastructure improvements, reflecting the uneven nature of neighborhood change. While they appreciated enhancements to green spaces and trails, they were wary of the rising number of homeless individuals in parks, which they saw as a sign of economic strain and displacement.
Overall, the qualitative data reflects widespread community concern that gentrification is already underway, driven by increasing property values, new development, and shifting demographics. Residents express a strong desire to preserve the character and affordability of Poplar Grove, fearing that unchecked development could lead to the displacement of long-standing, lower-income households.
The map indicates probable displacement risk, with the northwest part of the area showing elevated risk. However, the qualitative narrative points to potentially greater displacement pressures. The neighborhood is highly diverse, with a population that is half Latinx, and new development is emerging along North Temple. Rising home prices, along with the area’s green spaces and strong transportation access, make it increasingly appealing to higher-income residents, further heightening the risk of displacement.
6. Discussion
6.1. Summary Comparing EDR Model an Interview Data
The following neighborhood assessments represent exploratory comparisons based on 22 interviews per area. These findings are context-specific to Salt Lake City and should not be generalized beyond this case study without additional validation in similar urban contexts.
Table 2 shows a detailed comparison of the EDR model’s predicted displacement risk levels with the qualitative insights gathered from community narratives, highlighting key areas of alignment as well as discrepancies in neighborhoods across Salt Lake City. In many cases, the EDR model accurately identified areas experiencing displacement pressures, particularly in neighborhoods near downtown and the east side of the city. Residents in these areas reported increasing rent burdens, new high-density developments, and the loss of affordable housing stock—factors that closely aligned with the model’s designation of elevated or high displacement risk. Neighborhoods such as Central City, Ballpark, and the East Central emerged as hotspots where both the model and community narratives highlighted ongoing displacement.
6.2. EDR Analysis
While
Table 2 presents a summary of alignment and discrepancies between the EDR model and community narratives, further analysis reveals key structural limitations in the model’s predictive framework. For example, the model tends to underestimate displacement risk in neighborhoods like Glendale, Fairpark, and Poplar Grove due to its reliance on renter-focused metrics and lagging data sources. These areas, characterized by higher rates of homeownership and strong community ties, are experiencing what might be termed “cultural” or “anticipatory” displacement—forms of neighborhood change not readily captured by traditional indicators such as rent burden or income levels. In contrast, high-risk areas like Ballpark and Central City exhibit alignment between the model and resident accounts, but qualitative data reveals deeper impacts, including the erosion of social networks, loss of small businesses, and feelings of disconnection. This suggests that while GIS models are valuable for identifying displacement hotspots, they require complementary qualitative inputs to expose early warning signs, local nuances, and the broader emotional and social dimensions of displacement. Thus, the integration of spatial and narrative data does not merely validate the model but also exposes its blind spots, ultimately strengthening its policy relevance.
However, the study also found discrepancies between model predictions and ground-level experiences, particularly in the west side neighborhoods of Glendale, Fairpark, and Poplar Grove. While the EDR model suggested moderate or low displacement risk in these areas, interviews revealed significant concerns about rising housing costs, new developments, and the influx of higher-income residents. Community members described the early signs of gentrification, including commercial displacement and the gradual erosion of long-standing cultural and social networks. These findings suggest that the model may underrepresent displacement risk in areas with higher rates of homeownership, as it primarily focuses on renter displacement.
Several limitations of the GIS model became apparent through qualitative engagement. The model uses U.S. Census American Community Survey (ACS), Housing Urban Development (HUD) Fair Market Rent and the Bureau of Labor Statistics (BLS) Consumer Price Index data from Salt Lake City 2015–2019. Some of the limitation of this data is that it might now reflect recent upzoning changes [
51], demolition of naturally occurring affordable housing, and other displacement pressures that have been taking place in the city [
50]. Also, changes related to COVID-19 like the lowering of interest rates which increase home prices during the pandemic [
52,
53,
54,
55]. In addition, the overall inflation that the economy experience is also reflected in increases in rent [
52,
54,
55].
6.3. Qualitative Data Analysis
Nonetheless, this research should be understood as a methodological exploration rather than a comprehensive validation study. The sample size of 132 interviews, while substantial for qualitative research, cannot support statistical generalization to other urban contexts. The findings are specific to Salt Lake City’s unique demographic composition, housing market conditions, and policy environment during the study period.
In west side neighborhoods, interviewees noted that while displacement was not yet as widespread as in downtown areas, it was occurring incrementally, often affecting vulnerable populations first. These patterns, driven by speculative development and increasing land values, were not fully reflected in the model’s risk assessments. The discrepancy underscores the need for real-time data integration and continuous model updates to reflect the rapidly evolving housing landscape.
Qualitative data plays a critical role in validating GIS-based models by providing a nuanced understanding of the lived experiences that quantitative metrics may fail to capture. Specifically, in the context of content validity, qualitative insights ensure that the variables used in the model reflect the realities on the ground. For example, interviews and community narratives can reveal socio-cultural factors, emotional ties, and informal networks that are not easily quantified but significantly impact displacement dynamics. By incorporating qualitative data, researchers can identify gaps or biases in the model, leading to more robust and comprehensive evaluations.
6.4. What We Can Learn
From a theoretical perspective, this study highlights the critical intersection of structural and human-centered approaches to understanding displacement. While GIS models provide valuable predictive insights, they must be contextualized through the lived experiences of residents to avoid perpetuating inequities in urban development. Practically, the findings underline the need for adaptive policymaking that combines data-driven strategies with community engagement to create equitable solutions. For example, policymakers should consider mechanisms to safeguard affordable housing, incentivize inclusive development, and support displaced populations with resources such as relocation assistance and social network rebuilding initiatives.
The focus on Salt Lake City as a mid-sized urban area provides a unique lens to understand displacement dynamics that differ from those in large metropolitan areas, such as New York or Los Angeles. As noted in the literature review, mid-sized cities often face distinct challenges, including fewer financial resources, limited planning capacities, and rapidly changing demographics [
36,
37]. The findings align with studies from other mid-sized cities, such as Portland and Providence, where discrepancies between GIS model predictions and community narratives have revealed early signs of displacement pressures [
38,
43]. However, the qualitative data further emphasized the emotional and psychological toll of displacement—factors that GIS models cannot easily quantify.
Residents expressed deep ties to their neighborhoods, with many citing generational connections and the importance of local social networks in providing stability. Displacement not only disrupted housing but also affected access to schools, jobs, and essential services, contributing to broader economic and social instability. This human dimension of displacement adds critical context to the model’s findings, reinforcing the need for policies that prioritize community preservation alongside housing development.
Fostering participatory planning processes is essential for aligning development projects with the needs and aspirations of residents. Community engagement can provide valuable insights and build trust, ensuring that urban development is equitable and inclusive. Finally, there is a pressing need to develop real-time monitoring tools to better reflect current market and socio-economic conditions, particularly in the post-COVID-19 era. Investing in real-time data collection and regular model updates will allow policymakers to respond more effectively to rapidly changing housing dynamics and mitigate displacement pressures in a timely manner.
By integrating predictive models with community narratives, this study advances both the theory and practice of urban planning, emphasizing the importance of inclusive, data-informed policies to address displacement. Future research should explore how these approaches can be applied to other mid-sized cities, further enhancing their relevance and scalability.
Based on this case study’s exploratory findings, future research might consider developing systematic approaches to incorporate community feedback into displacement models. This could include regular community surveys, real-time development tracking, and cultural displacement indicators, though such integration would require extensive validation across multiple urban contexts before implementation
6.5. Future Research
Longitudinal studies tracking displacement over time are needed to assess the long-term effectiveness of policy interventions [
56]. Future research should prioritize cross-disciplinary collaborations, integrating insights from urban planning, sociology, and public health, among others [
57]. Finally, expanding the accessibility of GIS tools so that residents could use them and fostering community partnerships will be essential in developing responsive, inclusive urban policies that safeguard vulnerable populations against displacement [
58].


