Abstract
Smart Land Use Planning (SLUP) has gained increasing attention in urban development, yet few studies examine its implementation from an urban governance perspective. This study investigates municipal SLUP project characteristics, their spatial distribution, and intercity cooperation networks by analyzing 3689 SLUP government procurement contracts in China’s Yangtze River Delta urban agglomeration. Using the Latent Dirichlet Allocation model, this study identified four main SLUP project types: real estate management, land resource protection, land use planning, and geographic information services. Spatial analysis revealed significant imbalances across cities, with SLUP projects concentrated in central cities while other cities heavily depend on intercity cooperation for technical support and services. Network analysis showed a core–periphery structure, with industrial structure and institution similarities significantly facilitating cooperation, while geographic distance and cultural similarity had limited impact. Future research should expand data sources to enable cross-regional comparative analysis. This study offers empirical evidence for policymaking in the implementation of SLUP and regional coordinated development.
1. Introduction
With increasing urbanization and digital advancement, Smart Land Use Planning (SLUP) has become an important tool for optimizing land resource allocation and enhancing urban governance effectiveness. SLUP uses artificial intelligence algorithms such as such as machine learning (ML) and deep learning (DL) to process data, integrating GIS and big data analysis to address urban land scarcity, irrational land use, and environmental sustainability challenges [1,2,3,4,5,6,7]. It has significant value for improving land use efficiency and achieving smart city and sustainable development goals [8,9,10].
Existing studies on SLUP mainly focus on three aspects: technological applications, policy frameworks, and effectiveness assessment. Technological application studies focus on how to utilize remote sensing, big data, and artificial intelligence technologies to support land use decisions [11,12,13]. Policy framework studies explore institutional design and policy instruments that promote SLUP implementation [14,15,16]. Effectiveness assessment studies primarily examine SLUP’s impact on land use efficiency, environmental quality, and social equity factors [17,18,19,20]. However, few studies discuss the government’s role in SLUP implementation from an urban governance perspective, especially government behaviors and intercity cooperation at the regional scale. In other words, how do governments within a region implement SLUP?
Government is the key driver of smart city and SLUP implementation [21], and its investment directly affects the progress and effectiveness of smart city and SLUP [1,22]. Particularly under China’s government-led urban development model, government procurement has become an important policy tool for promoting SLUP [8]. Government procurement refers to the act of government obtaining necessary goods, works, and services from other organizations using fiscal funds through statutory procedures [23,24]. It is an important means for local governments to provide public services. Through government procurement, governments can overcome their own capability limitations and improve service efficiency and performance by leveraging the strengths of other governments and enterprises [25,26]. Specifically in the SLUP context, since governments themselves lack sufficient digital technology capabilities, cooperation with enterprises through government procurement is an important pathway for SLUP implementation. Governments may adopt digital technologies in several types of public service delivery to achieve SLUP. For example, in land property rights management, digital registration systems improve the reliability and transparency of property information [27,28]; in land resource protection, intelligent monitoring technologies enable governments to more effectively monitor land use conditions [29]; in land use planning, data analysis and simulation tools provide scientific basis for decision-makers [30,31,32]. However, adopting these technologies may also generate challenges, including insufficient communication and integration between different systems and administrative levels, creating data silos, inefficiencies, and coordination difficulties in governance [33,34]. Investments in these areas reflect local governments’ policy preferences and innovation willingness in SLUP, which is significant for understanding SLUP implementation, yet few studies have discussed this.
Moreover, due to differences in development stage within a region, government procurement in SLUP among different cities may exhibit significant variations, leading to spatially uneven distribution of SLUP development levels. This spatial imbalance may affect the overall regional SLUP development level, thereby hindering regional sustainable development goals [3,4,16]. In this context, cooperation between cities within a region plays an important role in promoting regional SLUP development [35,36]. Since government procurement involves cooperative relationships between city governments and other organizations, cities lacking digital technology capabilities can achieve SLUP by purchasing services from more capable cities within the region. Procurement contract relationships among cities constitute the intercity cooperation network in SLUP. Therefore, understanding the intercity cooperation mechanisms in SLUP government procurement is important for helping lagging cities implement SLUP projects, thereby enhancing regional SLUP development levels.
City networks provide an important perspective for understanding cooperative relationships between cities within a region. City networks are complex systems constituted by various flow relationships between cities (such as capital, information, technology) [37,38,39]. Castells describes them as social forms constituted by spaces of flows [40], while Taylor and Derudder emphasize that city networks are concrete manifestations of functional connections between cities in the context of globalization [41]. City network research examines various relationship types (Table 1): production networks explore economic value chains and capital flows between enterprises [42]; infrastructure networks investigate how transportation systems like aviation and railways affect urban development [43,44]; and innovation networks analyze academic collaboration and technology diffusion pathways [45,46]. In the field of public administration, government-involved city networks also receive attention. Shrestha and Feiock proposed the concept of local government networks [47]. These networks are collaborative structures where local governments interact with diverse actors—including government agencies, corporations, nonprofits, and citizens—to solve cross-jurisdictional problems, share policy expertise, and align regional development strategies [48,49]. In local government networks, intercity cooperation may be influenced by multiple factors, including geographic distance, size similarity, institutional similarity, and others [50,51]. However, existing research has not systematically revealed the formation mechanisms of intercity SLUP cooperation networks, especially in rapidly developing urban agglomeration regions.

Table 1.
Summary of city network concepts and research themes.
The Yangtze River Delta urban agglomeration (YRD), one of China’s most economically vibrant regions, offers an ideal case study for examining the characteristics of SLUP projects and cooperation networks across cities. Based on government procurement contracts, this study employs text analysis and social network analysis methods to explore the spatial distribution in SLUP government procurement projects and city cooperation networks across the YRD. Specifically, the study focuses on three questions: (1) What are the typological characteristics of SLUP government procurement projects in the YRD? (2) How are government SLUP projects spatially distributed across different cities in the region? (3) What are the structural characteristics of the intercity SLUP cooperation network, and which factors influence the formation of cooperative relationships?
For the first question, the study collects 3689 SLUP-related government procurement contracts and applies Latent Dirichlet Allocation (LDA) analysis, identifying four main project types. For the second question, the study analyzes the procurement scale and spatial distribution characteristics of SLUP-related government procurement projects across the 41 YRD cities. For the third question, the study develops an intercity SLUP cooperation network for the YRD region and employs Multiple Regression Quadratic Assignment Procedure (MRQAP) to examine the influence of city homogeneity and proximity on SLUP cooperative relationships. This paper makes three main contributions. First, it reflects government actions and preferences in the SLUP implementation process based on actual government procurement data. Second, it reveals the spatial distribution characteristics of SLUP government investment in the YRD region, enriching the regional research perspective on SLUP. Finally, it introduces social network analysis methods into SLUP research, revealing the structural characteristics and formation mechanisms of SLUP city cooperation networks, providing a new analytical framework for understanding regional cooperative actions and promoting SLUP development.
2. Materials and Methods
2.1. Study Area
The YRD region encompasses 41 cities across Shanghai Municipality, Jiangsu Province, Zhejiang Province, and Anhui Province, with a population over 220 million and covering an area of 358,000 square kilometers [52]. The YRD holds a crucial strategic position in China’s regional development landscape and serves as a focal point for the country’s digital economy growth. In 2023, the YRD’s digital economy added value surpassing CNY 12 trillion, accounting for over 40% of the total GDP across the three provinces and one municipality. Meanwhile, major differences in digital development persist among cities in the YRD. For instance, in the 2022 Digital Financial Inclusion Index [53], seven cities in the YRD ranked among China’s top ten in 2022, while Huaibei City was positioned only 140th nationally, highlighting the digital development gap between core and peripheral cities. In recent years, the integrated development of the YRD has been proposed as a national strategy. Cities within this region have established cooperation across multiple domains, with smart city initiatives, including SLUP, emerging as a key area of cooperation. However, systematic research is still lacking, especially on how much cities invest in SLUP and what factors promote or hinder intercity cooperation of SLUP. Therefore, focusing on the YRD as a research area helps understand local government behavior during regional integration processes and provides theoretical and practical insights for promoting more widespread and effective implementation of SLUP.
2.2. Data Source
This study utilizes government procurement data obtained from online government procurement contracts. Current social science research increasingly leverages government procurement data to analyze government service delivery [23,25]. In China, the Ministry of Finance mandates the disclosure of government procurement contract information on the China Government Procurement Website [54] and provincial procurement websites since 2017. We collected contracts related to government digitalization projects by using keywords including “system”, “platform”, “digital”, “information”, and “smart” on the China Government Procurement Network and the provincial procurement websites of Zhejiang, Jiangsu, Shanghai, and Anhui provinces. Data retrieval occurred in June 2023, yielding a total of 203,996 procurement contracts. We limited our search scope to land-related government agencies, including Bureau of Land and Resources, Bureau of Planning, and Bureau of Planning and Natural Resources, covering procurement data from 2018 to 2022. Python web crawlers (Python version 3.10.9) were used to extract the relevant data. For the collected contracts, we applied regular expressions to identify key contract information from unstructured web data, including project names, dates, administrative regions, purchasers, suppliers, and contract amounts. Subsequently, we matched supplier information from these contracts with enterprise registration data obtained from Tianyancha [55], one of China’s largest enterprise databases, to identify supplier addresses. After manual verification of the extracted data, and excluding SLUP projects procured by central and provincial governments and simple goods procurement contracts (e.g., purchasing computers and servers, which typically do not involve complex collaboration processes), we obtained 3689 government procurement projects related to SLUP. Figure 1 illustrates the data acquisition and filtering procedure.
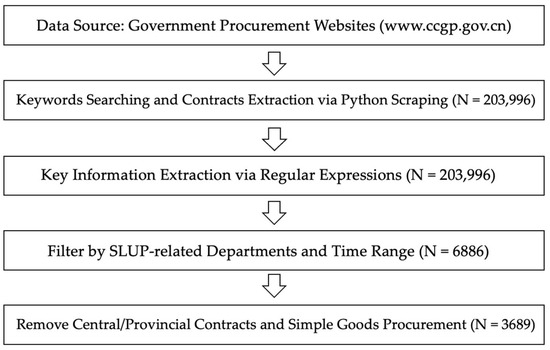
Figure 1.
Data Acquisition and Filtering Procedure.
2.3. Methods
2.3.1. Latent Dirichlet Allocation Topic Model Analysis
We use LDA to identify the main types of SLUP projects from government procurement project titles. Latent Dirichlet Allocation (LDA) is a generative probabilistic topic model designed to discover latent thematic structures in text collections [56]. LDA assumes each document consists of multiple topics mixed in different proportions, with each topic representing a probability distribution over words in the vocabulary. The generative process of LDA is based on two multinomial distributions: topic–word distribution and document–topic distribution, both governed by Dirichlet priors. Implementing LDA analysis typically involves three steps: text preprocessing, model training, and topic inference. Preprocessing includes tokenization, stopword removal, and vocabulary construction. Model training generally employs methods such as variational Bayes or Gibbs sampling to estimate model parameters. Topic inference calculates the topic distribution for each document and word distribution for each topic. The key parameter in LDA is the number of topics K, typically determined by optimizing perplexity or coherence metrics. The Gensim library in Python is employed to perform LDA topic analysis.
2.3.2. Social Network Analysis
Social Network Analysis is a methodological approach for studying the relational structures between social entities by describing and analyzing connection patterns between nodes using graph theory and network theory [57]. In social networks, nodes represent actors while edges represent relationships or interactions between actors. In this study, social network analysis is used to construct and analyze the structural characteristics of intercity collaboration networks in SLUP across the YRD region. We used intercity SLUP procurement amounts as the weights for edges in the cooperation network. For example, if the government of City A procured SLUP projects worth CNY 1 million from a supplier registered in City B, the weight of the edge from City A to City B would be 1 (unit: million CNY). This study employs the following core metrics.
Average Weighted Degree Reflects the average value of weighted connections for nodes. The formula is as follows:
In Equation (1), represents the weight of the connection between nodes i and j. The average weighted degree reflects the average strength of collaborative relationships between cities.
Network Density measures the closeness of network connections. The formula is as follows:
In Equation (2), L is the actual number of edges and n is the number of nodes. Network density reflects the prevalence of intercity collaboration.
Average Clustering Coefficient is the mean of local clustering coefficients for all nodes in the network, used to evaluate the degree of close connections within each node’s neighborhood. The formula is as follows:
In Equation (3), is the number of neighbors for node , and is the number of actual connections between these neighbors.
Centralization measures the imbalance in the distribution of centrality across nodes in the entire network, indicating whether the network exhibits concentrated characteristics dependent on a few core nodes. If the degree of a small number of nodes is significantly higher than other nodes, the centralization is high, suggesting that the network may be overly dependent on these key nodes for information control or resource allocation. The formula is as follows:
In Equation (4), is the maximum degree centrality value in the network, and is the degree centrality of node .
2.3.3. Multiple Regression Quadratic Assignment Procedure
Multiple Regression Quadratic Assignment Procedure (MRQAP) is a statistical method for analyzing relational data that effectively addresses autocorrelation issues in network data [58]. In this study, MRQAP is used to examine how factors such as city homogeneity and proximity influence the formation of smart land use planning collaboration networks. Compared to traditional linear regression, MRQAP offers significant advantages in network data analysis: First, linear regression assumes observations are independent, while relationships in network data are typically non-independent—MRQAP resolves this through quadratic assignment permutation tests. Second, MRQAP processes relational data directly in matrix form, preserving the integrity of network structures. Third, MRQAP provides more robust statistical inference for spatial autocorrelation and multicollinearity issues common in urban networks. In this study, intercity cooperation is influenced by multiple dimensions including geographic proximity and economic structural similarity, with complex interactions between these factors. MRQAP can accurately assess the net effect of each factor, revealing the intrinsic mechanisms of urban collaboration network formation. The basic regression model for MRQAP is
In Equation (5), represents the relationship value between nodes i and j in the dependent variable matrix, represents the relationship value between nodes i and j in the kth independent variable matrix, and is the regression coefficient.
3. SLUP Procurement Project Characteristics and Their Spatial Distribution
3.1. SLUP Procurement Project Characteristics
From 2018 to 2022, governments of 41 cities in the YRD region invested in 3689 SLUP projects, with a total expenditure of CNY 7.22 billion (approximately USD 1 billion). This substantial investment reflects the high priority these cities place on SLUP. Figure 2 shows the financial trends across this period, indicating a consistent upward trajectory in procurement spending. This growth demonstrates that SLUP in the YRD region is in a rapid development phase, maintaining momentum even during the pandemic. The sustained growth aligns with national digital development strategies, particularly the 2016 “National Informatization Development Strategic Outline”, which provided policy support for SLUP initiatives. Additionally, China’s reform from traditional land use planning to a comprehensive spatial planning system has created more application scenarios for smart technologies, driving both technological innovation and deeper implementation.
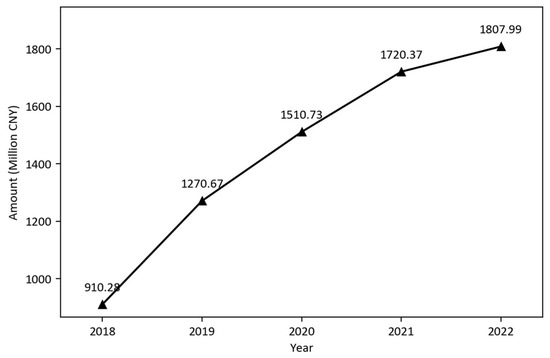
Figure 2.
2018–2022 annual SLUP project procurement amount changes (million CNY).
To understand government project characteristics in SLUP, we conducted LDA topic analysis on procurement project titles to identify distinct project categories. We first evaluated LDA models with 2–20 topics and plotted their topic-coherence scores (Figure 3). Topic coherence measures the semantic consistency of the top words within each topic—the higher the score, the easier the topic is for humans to interpret and the clearer its separation from other topics. The 11-topic solution achieved the highest coherence (0.5749), providing the best balance between detail and interpretability. Based on topic coherence evaluation, we determined 11 as the optimal number of topics, which were then manually categorized into four main groups: Real Estate Management, Land Use Planning, Land Resource Protection, and Geographic information Services. Table 2 lists each group’s concise concept definition and its constituent sub-topics. Based on classification coherence evaluation, we determined 11 as the optimal number of topics, which were then manually categorized into four main groups: Real Estate Management, Land Use Planning, Land Resource Protection, and Geographic information Services.
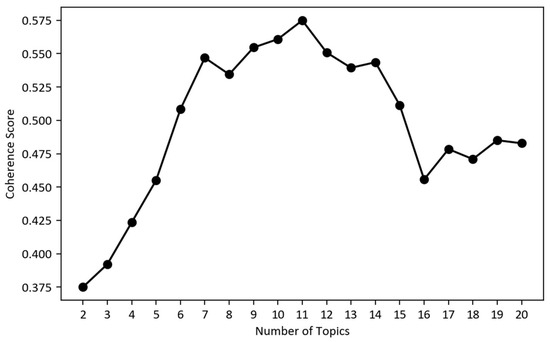
Figure 3.
Topic-coherence Scores.
Table 2.
Groups definition and sub-topics.
The first category is Real Estate Management, encompassing property registration, rights confirmation, and transaction management. It includes Topic 1 and Topic 11. Topic 1 focuses on optimizing registration processes and inter-governmental coordination, with keywords such as “real estate/registration/maps/coordination”. Topic 11 addresses digital archiving and system upgrades, featuring keywords like “real estate registration/archives/system upgrades”. This category demonstrates SLUP applications in real estate management, emphasizing property rights confirmation, information sharing, and process optimization.
The second category, Land Resource Protection, concentrates on dynamic land resource monitoring, ecological protection, and disaster prevention. It comprises Topics 2, 7, and 10. Topic 2 highlights forest fire prevention and state-owned land security monitoring, with keywords “monitoring/forest/fire prevention”. Topic 7 emphasizes 3D spatial supervision and rural land remediation, with keywords “land resources/3D/supervision”. Topic 10 focuses on land surveys and database development, with keywords “land/survey/database”. This category reflects SLUP applications in land resource protection, particularly in ecological security and land surveys.
The third category is Land Use Planning, including spatial planning development, data integration, and multi-planning collaborative management. It contains Topics 4, 5, and 6. Topic 4 emphasizes cross-regional planning coordination, with keywords “integration/unified planning/infrastructure”. Topic 5 reflects “one map” implementation and system integration, with keywords “one map/spatial planning/information systems”. Topic 6 focuses on strategic planning, with keywords “planning/natural resources/14th Five-Year Plan”. This category represents core SLUP content, especially unified planning and spatial planning system development.
The fourth category is Geographic information Services, covering digital government services, geographic information mapping, geographic information services, and data protection. It includes Topics 3, 8, and 9. Topic 3 focuses on basic geographic data management and smart scenario development, with keywords “data/mapping/geographic information”. Topic 8 involves “Internet+ government services”, with keywords “service projects/land/internet”. Topic 9 emphasizes system integration and data security protection, with keywords “integration/data security/server”. Unlike the first three groups, which focus on how the government manages land or sets policy, Geographic Information Services looks outward. It gives businesses and citizens the maps, location data, and secure online portals they need. Because it serves as a public utility—rather than a planning or regulatory tool—mixing it with the other groups would hide this special role. We therefore keep it as its own group. This category demonstrates the integration trend between geographic information technology and digital government services in the context of smart cities and SLUP development.
Figure 4 illustrates the procurement distribution across SLUP project categories and their temporal trends. In terms of procurement scale, Geographic information Services accounts for 30.8% of total investment, ranking first, followed by Land Use Planning at 29.9%. Land Resource Protection and Real Estate Management represent 25.6% and 13.6%, respectively. This distribution pattern reflects the priorities and characteristics of SLUP development in the YRD region. The highest proportion in Geographic Information Services indicates that geographic information infrastructure and data services are focal areas in smart land use planning. The similar proportion of Land Use Planning demonstrates that planning development and implementation remain core tasks. From a temporal perspective, Geographic Information Services shows rapid growth, increasing from CNY 217.32 million in 2018 to CNY 859.7 million in 2022. Land Use Planning exhibits a rise-then-decline pattern, peaking at CNY 568.36 million in 2019 before decreasing to CNY 368 million in 2022. This fluctuation likely results from China’s planning cycle, as 2019–2020 marked the period for developing the 14th Five-Year Plan and a new round of spatial planning. This result reflects the cyclical nature of land use planning work, with concentrated investments during the planning phase followed by relatively reduced investments during implementation. Additionally, Land Resource Protection investments grew from CNY 321.36 million in 2018 to CNY 415.95 million in 2022. This increase closely aligns with national ecological civilization construction and sustainable development strategies. After 2020, as spatial ecological restoration projects gained momentum, localities increased smart investments in land resource protection, particularly in ecological monitoring, resource surveys, and disaster prevention. Real Estate Management investments remained generally stable, possibly because real estate management systems were already well-established before 2018, with current focus mainly on maintenance and upgrades.
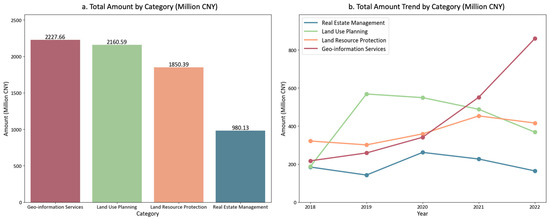
Figure 4.
Procurement amounts and annual changes of SLUP projects by category (million CNY).
3.2. Spatial Distribution Patterns
Figure 5 illustrates the spatial distribution of procurement amounts and cross-regional procurement ratios in SLUP projects. The procurement amount distribution exhibits a clear “core-periphery” structure, with Shanghai and surrounding cities forming the center of SLUP project procurement in the YRD region. Shanghai ranks highest at CNY 915.1 million, followed by Suzhou (CNY 584.7 million) and Hangzhou (CNY 563.9 million). Beyond this central area, provincial capitals such as Hefei and Nanjing also show relatively high investment levels, creating a spatial pattern with central cities as cores and surrounding cities in a gradient distribution. Peripheral cities, mainly in the western and northern parts of the YRD region, exhibit significantly lower investments; for example, Chizhou in Anhui Province contracted only CNY 18.5 million, while Huaibei in Jiangsu Province contracted CNY 22.3 million, demonstrating an unbalanced spatial distribution. This pattern correlates strongly with urban economic development levels, administrative status, and innovation capacity, reflecting SLUP’s resource endowment dependency.
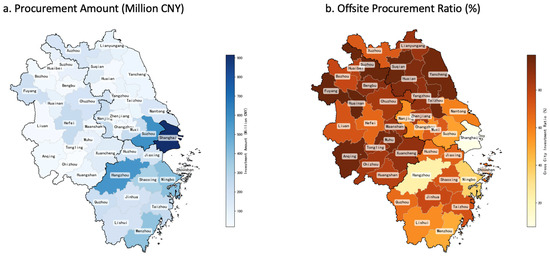
Figure 5.
Spatial distribution of SLUP procurement amounts and cross-regional ratios.
The spatial distribution of cross-regional procurement ratios shows an opposite pattern to procurement amounts. From 2018–2022, cross-regional SLUP procurement in the YRD reached CNY 4.2 billion, accounting for 57.7% of total procurement amount. Generally, cities with higher economic development levels and administrative status demonstrate lower cross-regional procurement ratios. For instance, Shanghai, as the only municipality and most developed city in the YRD region, has a cross-regional procurement ratio of only 7.3%. Cities like Hangzhou and Ningbo also show relatively low cross-regional procurement ratios, indicating strong digital technology capabilities that can meet government SLUP project requirements. Peripheral cities, however, almost entirely depend on cross-regional procurement for SLUP projects. For example, Huainan in Anhui Province sourced 98.7% of its SLUP projects from outside vendors, while most cities in the northern and western parts of the region had cross-regional procurement ratios more than 80%. This emphasizes the importance of cooperation for peripheral cities in implementing SLUP. Overall, the spatial distribution of SLUP projects in the YRD is influenced by urban economic strength and administrative status, as well as city functional positioning and resource capability. These spatial disparities reflect the imbalanced development stages and digital technology capabilities within the region, while simultaneously creating conditions and necessities for intercity cooperation.
4. Intercity Cooperation Networks and Influencing Factors in SLUP
4.1. Characteristics of Cooperation Networks
Figure 6 displays the weighted cooperation networks in SLUP government procurement across the YRD region, alongside networks for different project types, rendered using Gephi Software (version 0.10) with the OpenOrd layout algorithm. The OpenOrd algorithm was configured with the following parameters: Edge Cut = 0.8, Scaling = 1.0, Iterations = 1000, and Gravity = 0.1, optimizing the visualization for clustering and spatial distribution of nodes based on network structure. Nodes represent cities, with nodes of the same color representing cities from the same province, and node size indicating degree. Edges represent procurement amounts between cities, with wider edges indicating larger amounts. Table 3 displays relevant descriptive metrics for the network.
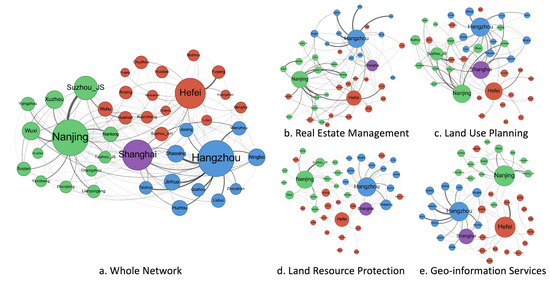
Figure 6.
SLUP project procurement collaboration network in the YRD region.
Table 3.
Network descriptive indicators.
Results show that the overall network comprises 41 nodes and 180 edges, with a network density of 0.22, indicating that cities in the YRD region have established only about 22% of potential cooperation relationships, displaying a relatively sparse network structure. The average weighted degree is 1360.77, reflecting the overall intensity of intercity cooperation. The average clustering coefficient is 0.031; this low value indicates few triangular cooperation relationships in the network, with city cooperation rarely exhibiting the closed structure of “friends of friends are also friends”. The centralization index is 0.65; this relatively high value indicates that the overall cooperation network has a distinct “core-periphery” structure, with a few core cities dominating the network and controlling key resources and information channels. The network visualization in Figure 4 also reveals that cities from each province primarily form three sub-networks around their provincial capitals—Hefei, Nanjing, and Hangzhou—while Shanghai occupies the central position connecting these three sub-networks.
Examining networks by category reveals significant differences in network metrics. Regarding network connectivity, the Land Use Planning network has the highest number of edges (113) and network density (0.14), followed by the Land Resource Protection network with 97 edges and a density of 0.12. The Geographic Information Services network has 87 edges and a density of 0.11, slightly higher than the Real Estate Management network with 85 edges and a network density of 0.10. This indicates that in the land use planning field, cities have formed more extensive cooperation relationships, while cooperation in Land Resource Protection is also relatively active. City cooperation in Geographic Information Services and Real Estate Management fields is comparatively limited.
In terms of average weighted degree, the four network types exhibit varying cooperation intensities. The Land Use Planning network ranks highest (418.98), reflecting frequent exchanges in this domain; Land Resource Protection network follows (359.53), indicating relatively close cooperation relationships; Geographic Information Services network shows a moderate average weighted degree (330.10); Real Estate Management network ranks lowest (252.16), suggesting relatively weaker cooperation in this field. Regarding structural characteristics, the four networks present different organizational patterns. By average clustering coefficient, the Real Estate Management network ranks highest (0.074), indicating this domain tends to form localized, clustered cooperation patterns; Land Use Planning network follows (0.053), also showing certain clustering features; Geographic Information Services network has a moderate average clustering coefficient (0.035); while Land Resource Protection network ranks lowest (0.020), suggesting more dispersed cooperation with fewer closed triangular cooperation structures. Examining centralization indices, the Real Estate Management network ranks highest (0.48), indicating cooperation in this domain highly depends on a few core cities; Land Resource Protection network follows (0.47), also showing high centralization; Land Use Planning network’s centralization index is moderate (0.45), while Geographic Information Services network ranks lowest (0.43), suggesting a relatively balanced cooperation pattern with more equal participation among cities.
These differences in network indicators reflect the project characteristics and policy orientations across SLUP sub-domains. The Land Use Planning network’s high connectivity and weighted degree reflect the importance of regional collaborative planning amid spatial planning system reforms. The Land Resource Protection network’s high centralization and low clustering coefficient demonstrate both core city dominance and dispersed cooperation in this field. The Real Estate Management network’s high clustering coefficient and centralization indicate both regional collaboration needs and dependence on core cities’ technical capabilities. The Geographic Information Services network’s relatively balanced centralization reflects the distinct territorial nature of such projects—since basic geographic data collection, processing, and application have clear territorial attributes, local procurement may be more efficient. These differentiated network structures reveal varying cooperation logics and resource integration patterns across different domains in SLUP.
4.2. Factors Influencing Partner Selection in Cooperation Networks
4.2.1. Proximity and Homogeneity
Multiple factors shape intercity cooperation networks, primarily categorized as proximity and homogeneity. Geographic proximity, emphasized in traditional regional science, suggests that cities closer to each other face lower cooperation costs and higher cooperation likelihood [59,60]. Recent studies indicate that interactions between geographic proximity and network relationships generate social capital, strengthen cooperation willingness, and promote collaboration [51]. However, some studies suggest that the importance of geographic proximity may gradually decline while homogeneity factors (such as industrial structure similarity) become increasingly influential [61].
The homogeneity hypothesis proposes that similar partners better understand and trust each other, facilitating cooperation. For instance, local governments more easily establish cooperation when they share similar interests, economic development levels, and institutional foundations [60,62]. Competing views argue that similar actors often compete with each other [63], and differences between cooperation partners can create complementary advantages [59]. Recent studies increasingly recognize that homogeneity and heterogeneity are not mutually exclusive but play different roles across various characteristics [63].
4.2.2. MRQAP Analysis
Based on the above discussion, we examine how proximity and homogeneity between cities influence their cooperation in SLUP.
First, proximity refers to geographic distance between cities. We use the shortest road distance between government buildings of 41 cities in the YRD region, calculated through the API provided by Amap (a leading Chinese map service provider), as a proxy for geographic distance ().
Second, homogeneity encompasses multiple dimensions, including scale homogeneity, institutional homogeneity, and cultural homogeneity [43]. Using data from China City Statistical Yearbooks, we obtained city-level information on population, GDP, tertiary industry proportion, administrative area, cultivated land area, general public budget expenditure, and general public budget revenue for the years 2018–2022. We calculated differences between the 41 cities in population (), GDP (), tertiary industry proportion (), administrative area (), cultivated land area (), and fiscal pressure () as proxies for scale homogeneity. Within China’s multi-level government system, cities in the same province face similar policy environments. Therefore, we use whether cities belong to the same province as a proxy for institutional homogeneity (), coded as 0 if two cities belong to the same province and 1 otherwise. Additionally, previous studies have confirmed that China’s counterpart assistance mechanism significantly promotes cooperation between paired cities [64], so we control for counterpart assistance relationships between cities () [65]. We use city-level dialect similarity as a proxy for cultural homogeneity () [66].
Finally, the dependent variable is the procurement amount of SLUP projects between cities, derived from the cooperation network constructed in the previous section. We process this as a directed weighted network. For example, if City A procures a SLUP project worth CNY 1 million from City B, the edge weight from City A to City B is 1. We further decompose the dependent variable into the overall cooperation network and four different categories of cooperation networks.
Table 4 presents the MRQAP analysis results across five models, each representing a different dependent variable: Model 1 for the overall cooperation network, Model 2 for Land Use Planning network, Model 3 for Land Resource Protection network, Model 4 for Geographic Information Services network, and Model 5 for Real Estate Management network. The analysis reveals complex mechanisms in the formation of intercity SLUP cooperation networks, with variables showing differentiated effects across different types of cooperation networks.
Table 4.
MRQAP model results.
Geographic distance () is not significant in any of the five models, indicating that geographic distance between cities does not significantly affect the formation of SLUP cooperation networks. This suggests that in the context of digital technology development and improved transportation infrastructure, the inhibiting effect of geographic distance on intercity cooperation has weakened in SLUP networks. YRD cities can overcome spatial limitations to engage in SLUP cooperation. This finding further confirms the “space of flows” attribute of digital services [32]: the low-cost flow characteristics of data enable cities to transcend spatial boundaries and select partners based on technical needs rather than geographic proximity.
Scale homogeneity appears to facilitate greater cooperation between cities in SLUP. Industry structure differences () show highly significant negative correlations (1% level) across all five models, emerging as the most consistent and influential factor. This strongly supports the scale homogeneity hypothesis, indicating that cities with similar industrial structures more readily form cooperative relationships. Such similarity enhances mutual trust and understanding while reducing coordination costs, thereby facilitating cooperation. Farmland area differences () display significant negative correlations (5% level) across all models, suggesting that cities with similar agricultural resource endowments are more likely to engage in SLUP cooperation. This may stem from shared challenges in agricultural transformation and land protection, prompting these cities to seek collaborative solutions. GDP differences () show significance (10% level, negative correlation) only in the Land Use Planning network, indicating that cities with similar economic development levels cooperate more easily in this domain, possibly due to facing comparable urbanization challenges and economic structural transformation issues. In the other four domains, economic development disparities have no significant impact on cooperation. Population differences () exhibit heterogeneity, with significant positive correlations (10% level) in overall network and Geographic Information Services network, and stronger significance (5% level) in Land Use Planning network. This supports the scale complementarity effect between cities—larger cities often possess advanced planning concepts and technical resources, while smaller cities provide diverse implementation scenarios, creating mutually beneficial cooperation patterns. This effect is similarly observed in fiscal pressure differences (). Administrative area differences () remain insignificant across all models with coefficients near zero, indicating that variations in administrative division size have limited impact on SLUP cooperation.
Institutional environment similarity emerges as a significant facilitator of intercity cooperation. Provincial relationships () show significant negative correlations across all models—with overall network, Land Resource Protection, Geographic Information Services, and Real Estate Management networks significant at the 1% level, and Land Use Planning at the 10% level. This indicates closer cooperation between cities within the same province, aligning with institutional homogeneity theory. Cities sharing similar institutional environments face lower coordination costs and enjoy more convenient cooperation due to common policy frameworks and regulatory requirements. Counterpart assistance relationships () remain insignificant across all models, suggesting that traditional assistance mechanisms have limited impact on SLUP cooperation when controlling for other factors, possibly because cooperation in this field relies more on professional technical needs and market mechanisms rather than administrative directives. Cultural homogeneity () shows no significant influence across all models, indicating that traditional cultural differences (such as dialect variations) have minimal impact on SLUP cooperation.
The MRQAP analysis reveals complex mechanisms underlying SLUP cooperation networks in the YRD region. Industry structure homogeneity, institutional environment similarity, and farmland area homogeneity emerge as key cooperation drivers, while population size and fiscal condition differences demonstrate complementary cooperation characteristics. The weakened influence of geographic distance and traditional cultural differences highlights new features of urban cooperation in the context of digitalization and regional integration. These findings provide empirical evidence for promoting coordinated regional development.
5. Discussion
Previous studies on SLUP primarily focused on technical applications, policy frameworks, and effectiveness assessment, with limited exploration from urban governance and regional cooperation network perspectives. This study addresses this research gap by systematically analyzing SLUP project characteristics, spatial distribution patterns, and influencing factors of intercity cooperation networks in the YRD region. Specifically, this study employs LDA topic model analysis to identify main SLUP project types, reveal spatial distribution characteristics, and explore cooperation network structures and influencing factors using social network analysis and MRQAP.
First, this study provides a in-depth analysis of SLUP implementation mechanisms from an urban governance perspective, emphasizing that SLUP extends beyond technical applications to integration within actual urban governance operations. Results show government procurement SLUP projects include four main types, reflecting distinct urban governance functions. Government policy preferences significantly influence project priorities, with Geographic Information Services and Land Use Planning identified as major investment areas. Additionally, Land Resource Protection projects show growth, reflecting policy orientations toward ecological protection and sustainable development. This finding suggests SLUP has evolved from a purely technical tool to an essential component of urban governance systems, supporting the view that the smart city is not technologically neutral but profoundly shaped by government policy preferences and strategic goals [2,15]. The variation in procurement proportions across SLUP types also reveals specific pathways of Chinese local governments in SLUP development, demonstrating trends from planning formulation to digital service delivery.
Second, this study reveals spatial inequality in SLUP development, closely echoing equity discussions in current smart city research. Findings show SLUP projects display a distinct “core-periphery” spatial pattern in the YRD region. Central cities like Shanghai, Suzhou, and Hangzhou significantly outpace peripheral cities in funding, with this distribution difference substantially influenced by economic development levels, administrative status, and innovation capacities. Central cities exhibit significantly lower cross-regional procurement rates than peripheral cities. This phenomenon indicates peripheral cities’ heavy reliance on regional cooperation networks for technical support and services [28]. Such spatial inequality highlights equity issues in SLUP implementation, drawing attention to challenges faced by peripheral cities and emphasizing the importance of regional cooperation in narrowing technical capacity gaps.
Third, this study explores the procurement relationships between YRD region cities in the SLUP field and the influencing factors of relationship formation from a cooperation network perspective. Results indicate geographic distance’s diminishing influence on intercity cooperation networks in the digital era, allowing cities to overcome traditional spatial constraints for technical cooperation. Additionally, industrial structure similarity significantly increases cooperation likelihood, supporting theoretical assumptions that scale homogeneity reduces cooperation costs and enhances mutual trust. The study also finds institutional environment similarity plays a key role in intercity cooperation, with cities in the same province more readily cooperating due to institutional and policy framework convergence. Conversely, traditional cultural similarities and counterpart assistance mechanisms have limited impact on cooperation network formation. These findings provide new perspectives and empirical evidence for theoretical research on intercity cooperation in the context of digitalization and regional integration [59,62].
Despite providing the first analysis of SLUP implementation mechanisms from an urban governance perspective, this study has limitations. It primarily relies on government procurement contract data without fully considering other types of government-implemented SLUP projects or informal SLUP initiatives, potentially overlooking critical factors. Future research could broaden data sources and incorporate interviews and surveys to examine government cooperation motivations and barriers more comprehensively. Additionally, while this study focuses on the YRD region, future research should pursue cross-regional and cross-national comparative analyses to assess how variations in policy environments and technological development across regions and countries influence SLUP implementation and network cooperation patterns, providing valuable insights for broader policy formulation.
Based on these findings, we propose several policy recommendations (Table 5). Governments should clearly define technical applications and requirements across different functional domains when formulating and implementing SLUP policies and projects, enhancing SLUP targeting and implementation efficiency. Regarding the high inequality in SLUP cooperation networks, governments should prioritize regional equity issues by establishing more robust technical sharing and cooperation mechanisms, strengthening collaboration between core and peripheral cities to significantly enhance regional SLUP capabilities and reduce technical and resource disparities. Additionally, considering the positive impact of institutional environment and industrial structure similarity on regional cooperation, governments should actively promote policy and institutional unification and standardization processes within regions to further reduce cross-regional cooperation barriers, optimize resource allocation efficiency, and achieve regional coordinated development goals.
Table 5.
Policy recommendations for enhancing SLUP implementation and regional cooperation.
6. Conclusions
This study aims to explore government procurement project characteristics and intercity cooperation network mechanisms in SLUP, focusing on three research questions: (1) What are the typological characteristics of SLUP government procurement projects in the YRD? (2) How are government SLUP projects spatially distributed across different cities in the region? (3) What are the structural characteristics of the intercity SLUP cooperation network, and which factors influence the formation of cooperative relationships? Using the YRD region as the research subject, the study analyzes 3689 SLUP government procurement projects identified from online government procurement contracts. The study first employs LDA topic modeling analysis to identify project types and describe their spatial distribution characteristics, then uses Social Network Analysis to construct and analyze intercity cooperation network structures, and finally applies MRQAP to examine how geographic distance, scale homogeneity, institutional environment homogeneity, counterpart assistance relationships, and cultural homogeneity influence intercity cooperation network formation.
The study finds that SLUP government procurement projects in the YRD region primarily comprise four categories: Real Estate Management, Land Resource Protection, Land Use Planning, and Geographic Information Services. Geographic Information Services account for the highest proportion of investment, followed by Land Use Planning, then Land Resource Protection, with Real Estate Management receiving the lowest. Regarding spatial distribution, regional investments display a distinct core–periphery structure, centered around economically developed central cities, with peripheral cities highly dependent on external procurement. Network structure analysis reveals a relatively sparse overall network with pronounced core–periphery characteristics, where a few core cities dominate resource and information allocation. Among factors influencing network formation, similarities in industrial structure and farmland area significantly promote city cooperation; institutional environment similarity also significantly increases cooperation probability, while geographic distance, traditional cultural similarity, and counterpart assistance relationships do not show influences. Theoretically, this study enriches regional-scale SLUP research by combining social network analysis and MRQAP methods to analyze SLUP cooperation network formation mechanisms for the first time, providing new analytical perspectives and empirical evidence for promoting regional coordinated development policies and practices.
Author Contributions
Conceptualization, G.L. and Y.X.; Methodology, G.L.; Software, G.L.; Validation, Y.X.; Formal analysis, G.L.; Investigation, G.L.; Resources, Y.X.; Data curation, G.L.; Writing—original draft, G.L.; Writing—review & editing, Y.X.; Supervision, Y.X.; Project administration, Y.X.; Funding acquisition, Y.X. All authors have read and agreed to the published version of the manuscript.
Funding
This research is supported by funding from the National Natural Science Foundation of China (42201206), Humanities and Social Science Project of the Ministry of Education of China (22YJC630176), and Zhejiang Federation of Humanities and Social Sciences (21YJRC05-2YB). This research is also supported by ZJU-CMZJ Joint Lab on Data Intelligence and Urban Future and China Institute of Urbanization Zhejiang University.
Data Availability Statement
The original contributions presented in the study are included in the article, further inquiries can be directed to the corresponding author.
Conflicts of Interest
The authors declare no conflicts of interest.
References
- Cui, X.; Li, F.; de Vries, W.T. Smart Land Use Planning: New Theories, New Tools and New Practice. Land 2023, 12, 1315. [Google Scholar] [CrossRef]
- Vali, A.; Comai, S.; Matteucci, M. Deep Learning for Land Use and Land Cover Classification Based on Hyperspectral and Multispectral Earth Observation Data: A Review. Land 2020, 12, 2495. [Google Scholar] [CrossRef]
- Li, Z.; Chen, B.; Wu, S.; Su, M.; Chen, J.M.; Xu, B. Deep Learning for Urban Land Use Category Classification: A Review and Experimental Assessment. Remote Sens. Environ. 2024, 311, 114290. [Google Scholar] [CrossRef]
- Wang, J.; Bretz, M.; Dewan, M.A.A.; Delavar, M.A. Machine Learning in Modelling Land-Use and Land Cover-Change (LULCC): Current Status, Challenges and Prospects. Sci. Total Environ. 2022, 822, 153559. [Google Scholar] [CrossRef]
- Pham, Q.B.; Ali, S.A.; Parvin, F.; Van On, V.; Sidek, L.M.; Đurin, B.; Cetl, V.; Šamanović, S.; Minh, N.N. Multi-Spectral Remote Sensing and GIS-Based Analysis for Decadal Land Use Land Cover Changes and Future Prediction Using Random Forest Tree and Artificial Neural Network. Adv. Space Res. 2024, 74, 17–47. [Google Scholar] [CrossRef]
- Peng, M.; Liu, Y.; Khan, A.; Ahmed, B.; Sarker, S.K.; Ghadi, Y.Y.; Bhatti, U.A.; Al-Razgan, M.; Ali, Y.A. Crop Monitoring Using Remote Sensing Land Use and Land Change Data: Comparative Analysis of Deep Learning Methods Using Pre-Trained CNN Models. Big Data Res. 2024, 36, 100448. [Google Scholar] [CrossRef]
- Aslam, R.W.; Naz, I.; Quddoos, A.; Quddusi, M.R. Assessing Climatic Impacts on Land Use and Land Cover Dynamics in Peshawar, Khyber Pakhtunkhwa, Pakistan: A Remote Sensing and GIS Approach. GeoJournal 2024, 89, 202. [Google Scholar] [CrossRef]
- Zhuo, Z.; Ye, J.; Wang, Y.; Chen, H.; Liang, B. Smart Cities, Smarter Land Use? Unveiling the Efficiency Gains from China’s Digital Urban Transformation. Ecol. Indic. 2025, 171, 113151. [Google Scholar] [CrossRef]
- Masoumi, Z.; van Genderen, J. Artificial Intelligence for Sustainable Development of Smart Cities and Urban Land-Use Management. Geo-spat. Info. Sci. 2024, 27, 1212–1236. [Google Scholar] [CrossRef]
- Kalfas, D.; Kalogiannidis, S.; Chatzitheodoridis, F.; Toska, E. Urbanization and Land Use Planning for Achieving the Sustainable Development Goals (SDGs): A Case Study of Greece. Urban Sci. 2023, 7, 43. [Google Scholar] [CrossRef]
- Chaturvedi, V.; de Vries, W.T. Machine Learning Algorithms for Urban Land Use Planning: A Review. Urban Sci. 2021, 5, 68. [Google Scholar] [CrossRef]
- Wang, Z.; Sun, Q.; Zhang, X.; Hu, Z.; Chen, J.; Zhong, C.; Li, H. CUGUV: A Benchmark Dataset for Promoting Large-Scale Urban Village Mapping with Deep Learning Models. Sci. Data 2025, 12, 390. [Google Scholar] [CrossRef]
- Batty, M. Digital Twins in City Planning. Nat. Comput. Sci. 2024, 4, 192–199. [Google Scholar] [CrossRef]
- Ameyaw, P.D.; de Vries, W.T. Blockchain Technology Adaptation for Land Administration Services: The Importance of Socio-Cultural Elements. Land Use Policy 2023, 125, 106485. [Google Scholar] [CrossRef]
- Marsal-Llacuna, M.-L.; López-Ibáñez, M.-B. Smart Urban Planning: Designing Urban Land Use from Urban Time Use. J. Urban Technol. 2014, 21, 39–56. [Google Scholar] [CrossRef]
- Jia, C.; Feng, S.; Chu, H.; Huang, W. The Heterogeneous Effects of Urban Form on CO2 Emissions: An Empirical Analysis of 255 Cities in China. Land 2023, 12, 981. [Google Scholar] [CrossRef]
- Ameyaw, P.D.; de Vries, W.T. Toward Smart Land Management: Land Acquisition and the Associated Challenges in Ghana. A Look into a Blockchain Digital Land Registry for Prospects. Land 2021, 10, 239. [Google Scholar] [CrossRef]
- Yu, T.; Huang, X.; Jia, S.; Cui, X. Unveiling the Spatio-Temporal Evolution and Key Drivers for Urban Green High-Quality Development: A Comparative Analysis of China’s Five Major Urban Agglomerations. Land 2023, 12, 1962. [Google Scholar] [CrossRef]
- Kamrowska-Załuska, D. Impact of AI-Based Tools and Urban Big Data Analytics on the Design and Planning of Cities. Land 2021, 10, 1209. [Google Scholar] [CrossRef]
- Jiang, Y.; Yang, L.; Wei, X.; Zhang, X. The Impact of Government Digital Transformation on Land Use Efficiency: Evidence from China. Land 2024, 13, 2080. [Google Scholar] [CrossRef]
- Wu, M.; Yan, B.; Huang, Y.; Sarker, M.N.I. Big Data-Driven Urban Management: Potential for Urban Sustainability. Land 2022, 11, 680. [Google Scholar] [CrossRef]
- Lu, S.; Wang, H. How Political Connections Exploit Loopholes in Procurement Institutions for Government Contracts: Evidence from China. Governance 2022, 36, 1205–1224. [Google Scholar] [CrossRef]
- Tang, W.; Wang, Y.; Wu, J. Local Favoritism in China’s Public Procurement: Information Frictions or Incentive Distortion? J. Urban Econ. 2025, 145, 103716. [Google Scholar] [CrossRef]
- Casady, C.B.; Petersen, O.H.; Brogaard, L. Public Procurement Failure: The Role of Transaction Costs and Government Capacity in Procurement Cancellations. Public Manag. Rev. 2023, 1–28. [Google Scholar] [CrossRef]
- Patrucco, A.S.; Kauppi, K.; Di Mauro, C.; Schotanus, F. Enhancing Strategic Public Procurement: A Public Service Logic Perspective. Public Manag. Rev. 2024, 1–21. [Google Scholar] [CrossRef]
- Konashevych, O. Constraints and Benefits of the Blockchain Use for Real Estate and Property Rights. J. Prop. Plan. Environ. Law 2020, 12, 109–127. [Google Scholar] [CrossRef]
- Putri, R.A. Development of Digital Registration Information System in Kelurahan to Improve Administration Efficiency and Transparency. Inf. Technol. Syst. 2024, 1, 92–99. [Google Scholar] [CrossRef]
- Liu, C.; Zhang, Z.; Zhang, S. Smart Initiatives for Land Resource Management: Perspectives and Practices from China. J. Urban Technol. 2023, 30, 3–21. [Google Scholar] [CrossRef]
- Cao, C.; Dragićević, S.; Li, S. Land-Use Change Detection with Convolutional Neural Network Methods. Environments 2019, 6, 25. [Google Scholar] [CrossRef]
- Jiménez-Espada, M.; Martínez García, F.M.; González-Escobar, R. Sustainability Indicators and GIS as Land-Use Planning Instrument Tools for Urban Model Assessment. ISPRS Int. J. Geo-Inf. 2023, 12, 42. [Google Scholar] [CrossRef]
- Zhuo, Y.; Jing, X.; Wang, X.; Li, G.; Xu, Z.; Chen, Y.; Wang, X. The Rise and Fall of Land Use Mix: Review and Prospects. Land 2022, 11, 2198. [Google Scholar] [CrossRef]
- Ejiaku, S. Technology Adoption: Issues and Challenges in Information Technology Adoption in Emerging Economies. J. Int. Technol. Inf. Manag. 2014, 23, 5. [Google Scholar] [CrossRef]
- Arduini, D.; Belotti, F.; Denni, M.; Giungato, G.; Zanfei, A. Technology Adoption and Innovation in Public Services: The Case of E-Government in Italy. Inf. Econ. Policy 2010, 22, 257–275. [Google Scholar] [CrossRef]
- Mu, R.; Wu, P.; Haershan, M. Pre-Contractual Relational Governance for Public–Private Partnerships: How Can Ex-Ante Relational Governance Help Formal Contracting in Smart City Outsourcing Projects? Int. Rev. Adm. Sci. 2023, 89, 112–128. [Google Scholar] [CrossRef]
- Gil-Garcia, J.R.; Zhang, J.; Puron-Cid, G. Conceptualizing Smartness in Government: An Integrative and Multi-Dimensional View. Gov. Inf. Q. 2016, 33, 524–534. [Google Scholar] [CrossRef]
- Zhang, R.; Lin, J.; Sun, D. The Role of Institutions and Markets in Shaping Intercity Investment Networks in China. Cities 2024, 153, 105221. [Google Scholar] [CrossRef]
- Shi, S.; Wong, S.K.; Zheng, C. Network Capital and Urban Development: An Inter-Urban Capital Flow Network Analysis. Reg. Stud. 2022, 56, 406–419. [Google Scholar] [CrossRef]
- Capello, R. The City Network Paradigm: Measuring Urban Network Externalities. Urban Stud. 2000, 37, 1925–1945. [Google Scholar] [CrossRef]
- Castells, M. The Rise of the Network Society, 3rd ed.; John Wiley & Sons: Chichester, UK, 2010; pp. 407–453. [Google Scholar]
- Taylor, P.; Derudder, B. World City Network: A Global Urban Analysis; Routledge: New York, NY, USA, 2015; pp. 7–27. [Google Scholar]
- Coe, N.M.; Dicken, P.; Hess, M.; Yeung, H.W. Making Connections: Global Production Networks and World City Networks. Glob. Netw. 2010, 10, 138–149. [Google Scholar] [CrossRef]
- Mignoni, J.; Bittencourt, B.A.; da Silva, S.B.; Zen, A.C. Orchestrators of Innovation Networks in the City Level: The Case of Pacto Alegre. Innov. Manag. Rev. 2023, 20, 194–210. [Google Scholar] [CrossRef]
- Gebauer, A.; Nam, C.W.; Parsche, R. Regional Technology Policy and Factors Shaping Local Innovation Networks in Small German Cities. Eur. Plan. Stud. 2005, 13, 661–683. [Google Scholar] [CrossRef]
- Leydesdorff, L.; Rafols, I. Local Emergence and Global Diffusion of Research Technologies: An Exploration of Patterns of Network Formation. J. Am. Soc. Inf. Sci. 2011, 62, 846–860. [Google Scholar] [CrossRef]
- De Freitas, S.; Mayer, I.; Arnab, S.; Marshall, I. Industrial and Academic Collaboration: Hybrid Models for Research and Innovation Diffusion. J. High. Educ. Policy Manag. 2014, 36, 2–14. [Google Scholar] [CrossRef]
- Shrestha, M.K.; Feiock, R.C. Toward a Multiplex Network Theory of Interlocal Service Contracting. Public Adm. Rev. 2021, 81, 911–924. [Google Scholar] [CrossRef]
- Feiock, R.C.; Scholz, J.T. (Eds.) Self-Organizing Federalism: Collaborative Mechanisms to Mitigate Institutional Collective Action Dilemmas; Cambridge University Press: Cambridge, UK, 2009; pp. 3–33. [Google Scholar]
- Andrew, S.A.; Short, J.E.; Jung, K.; Arlikatti, S. Intergovernmental Cooperation in the Provision of Public Safety: Monitoring Mechanisms Embedded in Interlocal Agreements. Public Adm. Rev. 2015, 75, 401–410. [Google Scholar] [CrossRef]
- LeRoux, K.; Brandenburger, P.W.; Pandey, S.K. Interlocal Service Cooperation in U.S. Cities: A Social Network Explanation. Public Adm. Rev. 2010, 70, 268–278. [Google Scholar] [CrossRef]
- Shen, R. Regional Governance and Multiplex Networks in Environmental Sustainability: An Exponential Random Graph Model Analysis in the Chinese Local Government Context. Urban Aff. Rev. 2024, 60, 571–613. [Google Scholar] [CrossRef]
- Zhu, W.; Zhang, J.; Dai, J.; Wang, D.; Ma, C.; Xu, Y.; Chen, Y. Study on the Spatiotemporal Evolution Characteristics and Influencing Factors on Green Building Development of City Clusters in the Yangtze River Delta Region in China. Sustainability 2023, 15, 9457. [Google Scholar] [CrossRef]
- Tao, Z.; Zhi, Z.; Shangkun, L. Digital Economy, Entrepreneurship, and High Quality Economic Development: Empirical Evidence from Urban China. Front. Econ. China 2022, 17, 393. [Google Scholar]
- Central Government Procurement Network Home Page. Available online: http://www.ccgp.gov.cn (accessed on 13 May 2025).
- Tianyancha Home Page. Available online: http://www.tianyancha.com (accessed on 13 May 2025).
- Chauhan, U.; Shah, A. Topic Modeling Using Latent Dirichlet Allocation: A Survey. ACM Comput. Surv. 2022, 54, 1–35. [Google Scholar] [CrossRef]
- Scott, J. What Is Social Network Analysis? Bloomsbury Academic: London, UK, 2012; pp. 31–57. [Google Scholar]
- Krackhardt, D. Predicting with Networks: Nonparametric Multiple Regression Analysis of Dyadic Data. Soc. Netw. 1988, 10, 359–381. [Google Scholar] [CrossRef]
- Feiock, R.C. Metropolitan Governance and Institutional Collective Action. Urban Aff. Rev. 2009, 44, 356–377. [Google Scholar] [CrossRef]
- Chen, B.; Ma, J.; Feiock, R.; Suo, L. Factors Influencing Participation in Bilateral Interprovincial Agreements: Evidence from China’s Pan Pearl River Delta. Urban Aff. Rev. 2019, 55, 923–949. [Google Scholar] [CrossRef]
- Tavares, A.F.; Camões, P.J. New Forms of Local Governance: A Theoretical and Empirical Analysis of Municipal Corporations in Portugal. Public Manag. Rev. 2010, 12, 587–608. [Google Scholar] [CrossRef]
- Feiock, R.C. The Institutional Collective Action Framework. Policy Stud. J. 2013, 41, 397–425. [Google Scholar] [CrossRef]
- Feiock, R.C.; Lee, I.W.; Park, H.J. Administrators’ and Elected Officials’ Collaboration Networks: Selecting Partners to Reduce Risk in Economic Development. Public Adm. Rev. 2012, 72, S58–S68. [Google Scholar] [CrossRef]
- Yi, H.; Suo, L.; Shen, R.; Zhang, J.; Ramaswami, A.; Feiock, R.C. Regional Governance and Institutional Collective Action for Environmental Sustainability. Public Adm. Rev. 2018, 78, 556–566. [Google Scholar] [CrossRef]
- Yi, H.; Liu, W.; Ma, L. Designed Networks and the Emergence of Self-Organizing Interlocal Learning Network: Evidence from Chinese Cities. Public Adm. 2024, 102, 21–39. [Google Scholar] [CrossRef]
- Xu, Y.; Zhu, Y.; Wu, Y.; Wang, X.; Zhang, W. The Population Flow under Regional Cooperation of “City-Helps-City”: The Case of Mountain-Sea Project in Zhejiang. Land 2022, 11, 1816. [Google Scholar] [CrossRef]
- Zhu, J.; Grigoriadis, T.N. Chinese Dialects, Culture & Economic Performance. China Econ. Rev. 2022, 73, 101783. [Google Scholar] [CrossRef]
Disclaimer/Publisher’s Note: The statements, opinions and data contained in all publications are solely those of the individual author(s) and contributor(s) and not of MDPI and/or the editor(s). MDPI and/or the editor(s) disclaim responsibility for any injury to people or property resulting from any ideas, methods, instructions or products referred to in the content. |
© 2025 by the authors. Licensee MDPI, Basel, Switzerland. This article is an open access article distributed under the terms and conditions of the Creative Commons Attribution (CC BY) license (https://creativecommons.org/licenses/by/4.0/).