Article

Summer Cooling Effect of Rivers in the Yangtze Basin, China: Magnitude, Threshold and Mechanisms

School of Smart City, Chongqing Jiaotong University, No. 66 Xuefu Rd., Nan’an Dist., Chongqing 400074, China
*
Author to whom correspondence should be addressed.
These authors contributed equally to this work.
Land 2025, 14(8), 1511; https://doi.org/10.3390/land14081511
Submission received: 29 May 2025 / Revised: 14 July 2025 / Accepted: 19 July 2025 / Published: 22 July 2025

Abstract

Under the dual pressures of global climate warming and rapid urbanization, the Yangtze River Basin, as the world’s largest urban agglomeration, is facing intensifying thermal environmental stress. Although river ecosystems demonstrate significant thermal regulation functions, their spatial thresholds of cooling effects and multiscale driving mechanisms have remained to be systematically elucidated. This study retrieved land surface temperature (LST) using the split window algorithm and quantitatively analyzed the changes in the river cold island effect and its driving mechanisms in the Yangtze River Basin by combining multi-ring buffer analysis and the optimal parameter-based geographical detector model. The results showed that (1) forest land is the main land use type in the Yangtze River Basin, with built-up land having the largest area increase. Affected by natural, socioeconomic, and meteorological factors, the summer temperatures displayed a spatial pattern of “higher in the east than the west, warmer in the south than the north”. (2) There are significant differences in the cooling magnitude among different land types. Forest land has the maximum daytime cooling distance (589 m), while construction land has the strongest cooling magnitude (1.72 °C). The cooling effect magnitude is most pronounced in upstream areas of the basin, reaching 0.96 °C. At the urban agglomeration scale, the Chengdu–Chongqing urban agglomeration shows the greatest temperature reduction of 0.90 °C. (3) Elevation consistently demonstrates the highest explanatory power for LST spatial variability. Interaction analysis shows that the interaction between socioeconomic factors and elevation is generally the strongest. This study provides important spatial decision support for formulating basin-scale ecological thermal regulation strategies based on refined spatial layout optimization, hierarchical management and control, and a “natural–societal” dual-dimensional synergistic regulation system.

Graphical Abstract

1. Introduction

In recent years, the urban heat island effect has intensified the frequent occurrence of urban heatwave events [1]. Extreme high temperatures have caused severe consequences for human health, the stability of ecological systems, and food security [2,3]. Rivers can alleviate the urban heat island effect by relying on the inherent heat absorption capacity and evaporation capacity of water bodies to reduce urban temperatures [4,5]. Water, as a crucial landscape element capable of improving thermal environments, can mitigate urban heat island effects through the construction of water corridors, thereby ensuring the safety and stability of urban ecosystems [6]. While large water bodies generally exhibit greater cooling intensity, there remains a lack of quantitative findings on the cooling effect magnitude and thresholds across large-scale watersheds, and the interaction mechanisms among multiple driving factors have yet to be fully elucidated. Therefore, this study quantitatively reveals the magnitude and thresholds of the river cooling effect at the large basin scale, with a focus on analyzing the interaction mechanisms among multiple driving factors. Therefore, uncovering the mechanisms underlying the cooling effects of large-scale rivers will not only provide theoretical support for climate-resilient urban planning but also establish a scientific foundation for optimizing urban agglomeration landscape patterns and advancing ecological restoration initiatives.
From a global perspective, all 41 megacities worldwide exhibit significantly intense urban heat island effects, among which the rising trend of the surface temperature in Asian cities is particularly prominent [7]. At the urban scale, the current studies on the assessment of river cooling effects have revealed different geomorphic differentiation patterns: mountainous rivers have a strong cooling intensity. For example, the cooling amplitudes of rivers in Pennsylvania, USA, and the Weishui River in Changsha, China, reach 2.25 °C and 2.79 °C, respectively [8,9]; the optimal cooling distance of mountain–plain transitional rivers (such as the Hunhe River in Shenyang, China) is 2500 m [10]; the cooling effect of plain rivers shows significant regional differences due to the impact of urbanization. The cooling effects of the Cheonggyecheon in South Korea and the Huangpu River in Shanghai, China, are 0.46 °C and 4.47 °C, respectively, among which the cooling impact distance of the Huangpu River reaches 197.35 m [11,12]; the cooling effect of the Porsuk River in Turkey covers a range of 90 m in the summer [13]; studies by Liu et al. pointed out that the expansion of built-up areas during urbanization will compress the low-temperature zones around water bodies, thereby restricting the cold island effect [14,15].
Existing studies have revealed significant heterogeneity in the cooling effects of rivers across different land use types [16]. Specifically, rivers demonstrate distinct cooling variations on forest land, built-up land, and cropland. Forest land mitigates diurnal temperature fluctuations and daytime maximum temperatures by enhancing hydrological regulation [17], while rivers exert particularly strong cooling effects on large, contiguous built-up land areas [9]. In contrast, cropland exhibits weaker responsiveness to river cooling [18], though its evapotranspiration significantly improves thermal comfort [19]. Vegetation coverage and area are critical determinants of cooling performance, with densely vegetated riverbanks showing substantially lower temperatures compared to those constructed solely with engineered materials [20]. Furthermore, synergistic interactions between blue and green spaces amplify the cooling efficiency. Riparian grassland, for instance, enhances the cooling capacity of river corridors [21,22], and combined blue–green spaces reduce average air temperatures by 3.3 °C more than isolated water bodies or forest land alone, as quantified by Dachuan Shi et al. [23]. Water bodies outperform grassland in cooling efficiency: Xingyu Tan et al. demonstrated that a 10% increase in grassland or water body coverage reduced the mean land surface temperatures by 0.39 °C and 0.42 °C, respectively [24]. Urban–rural disparities are also evident, with river-influenced urban areas like Ottawa, Canada, experiencing more pronounced temperature modulation compared to the surrounding rural zones dominated by cropland or unused land [25]. Overall, river cooling effects arise from multiscale synergies: water bodies achieve the highest cooling efficiency on built-up land, followed by forest land, while cropland shows minimal responsiveness. Although blue–green space synergies significantly enhance cooling, their interaction mechanisms remain poorly understood and require systematic exploration.
Research on the drivers of river cooling effects has identified four principal dimensions of influence. Landscape configuration constitutes a key dimension, and land cover indices and landscape metrics exert significant impacts on thermal regulation, wherein the normalized difference vegetation index (NDVI) demonstrates a significant negative correlation with land surface temperature [26]. Environmental characteristics represent another critical aspect, showing a progressive decline with increasing elevation [27]. Socioeconomic factors emerge as a third dimension. The distance from the city center, building area, average building height, and building density are all closely related to the cooling effect. Detailed analyses revealed an inverse correlation between building density and average building height [28,29], alongside a positive association between socioeconomic development levels and cooling effect magnitude [30]. The spatial patterns of water bodies form the fourth dimension, characterized by positive correlations between the cooling capacity and the contagion index (CONTAG), non-significant relationships with patch density (PD) metrics [31]. Empirical studies employing a geographical detector model and regression analyses confirmed the independent explanatory power of individual factors such as the NDVI, elevation, and building density in governing river cooling processes. However, the synergistic mechanisms through which natural and anthropogenic factors interactively regulate thermal mitigation—particularly the nonlinear amplification effects and scale-dependent thresholds arising from multi-driver combinations—remain inadequately resolved, representing a critical frontier in hydroclimatic research.
In summary, the current research on river cooling effect assessments still faces two key scientific questions: (1) how to define the cooling magnitude and thresholds of large-scale rivers; (2) how to elucidate the mechanisms driving river cooling effects across large-scale basins. Neha Gupta et al. determined the cooling intensity and distance through buffer zone analysis [5]. Jian Peng et al. employed partial correlation analysis and the geographical detector model to explore influencing and dominant factors of cooling effects at different urbanization stages [32]. These studies provide a critical theoretical and methodological foundation for the framework of this research.
The primary objectives of this study are to determine the cooling effect magnitude and thresholds through buffer zone analysis and to elucidate the driving mechanisms of the cooling effect using the optimal parameter-based geographical detector model. Focusing on the Yangtze River Basin as the study area, this research first analyzes the spatiotemporal distribution characteristics of the land use types and land surface temperature. Subsequently, it quantifies the cooling effect magnitudes and associated thresholds for primary ecological land uses by statistically evaluating temperature differentials across distinct land use types. Finally, the study investigates the underlying mechanisms governing the cooling island effect along third-order rivers within the basin through the application of the optimal parameter-based geographical detector model.

2. Materials and Methods
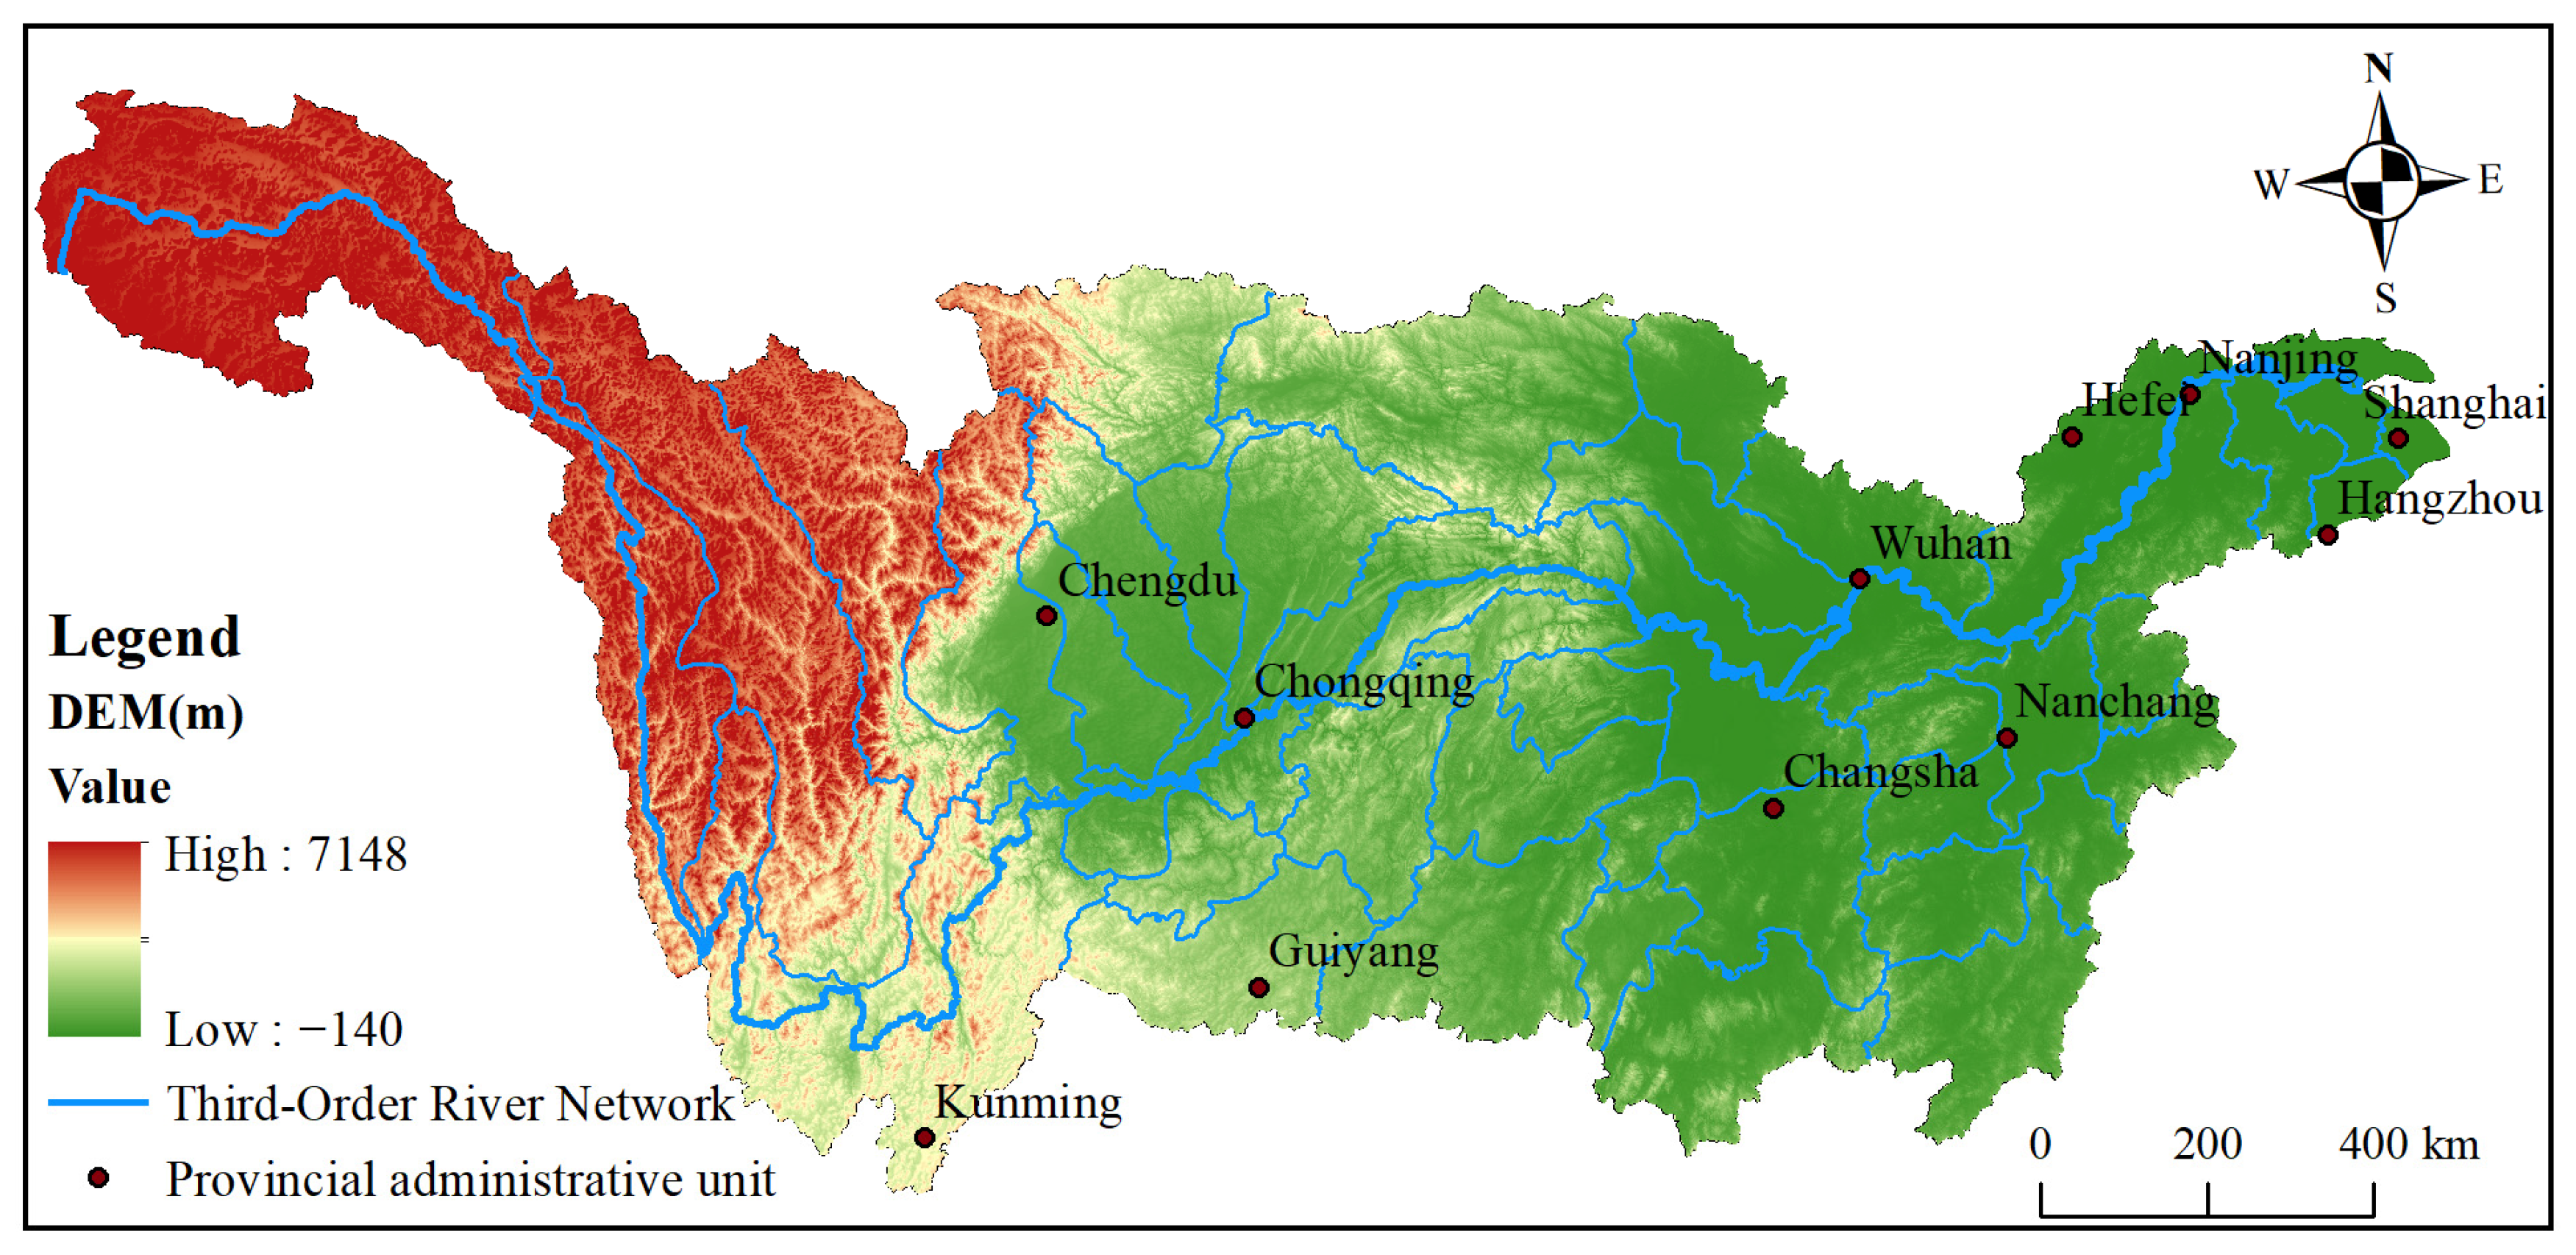
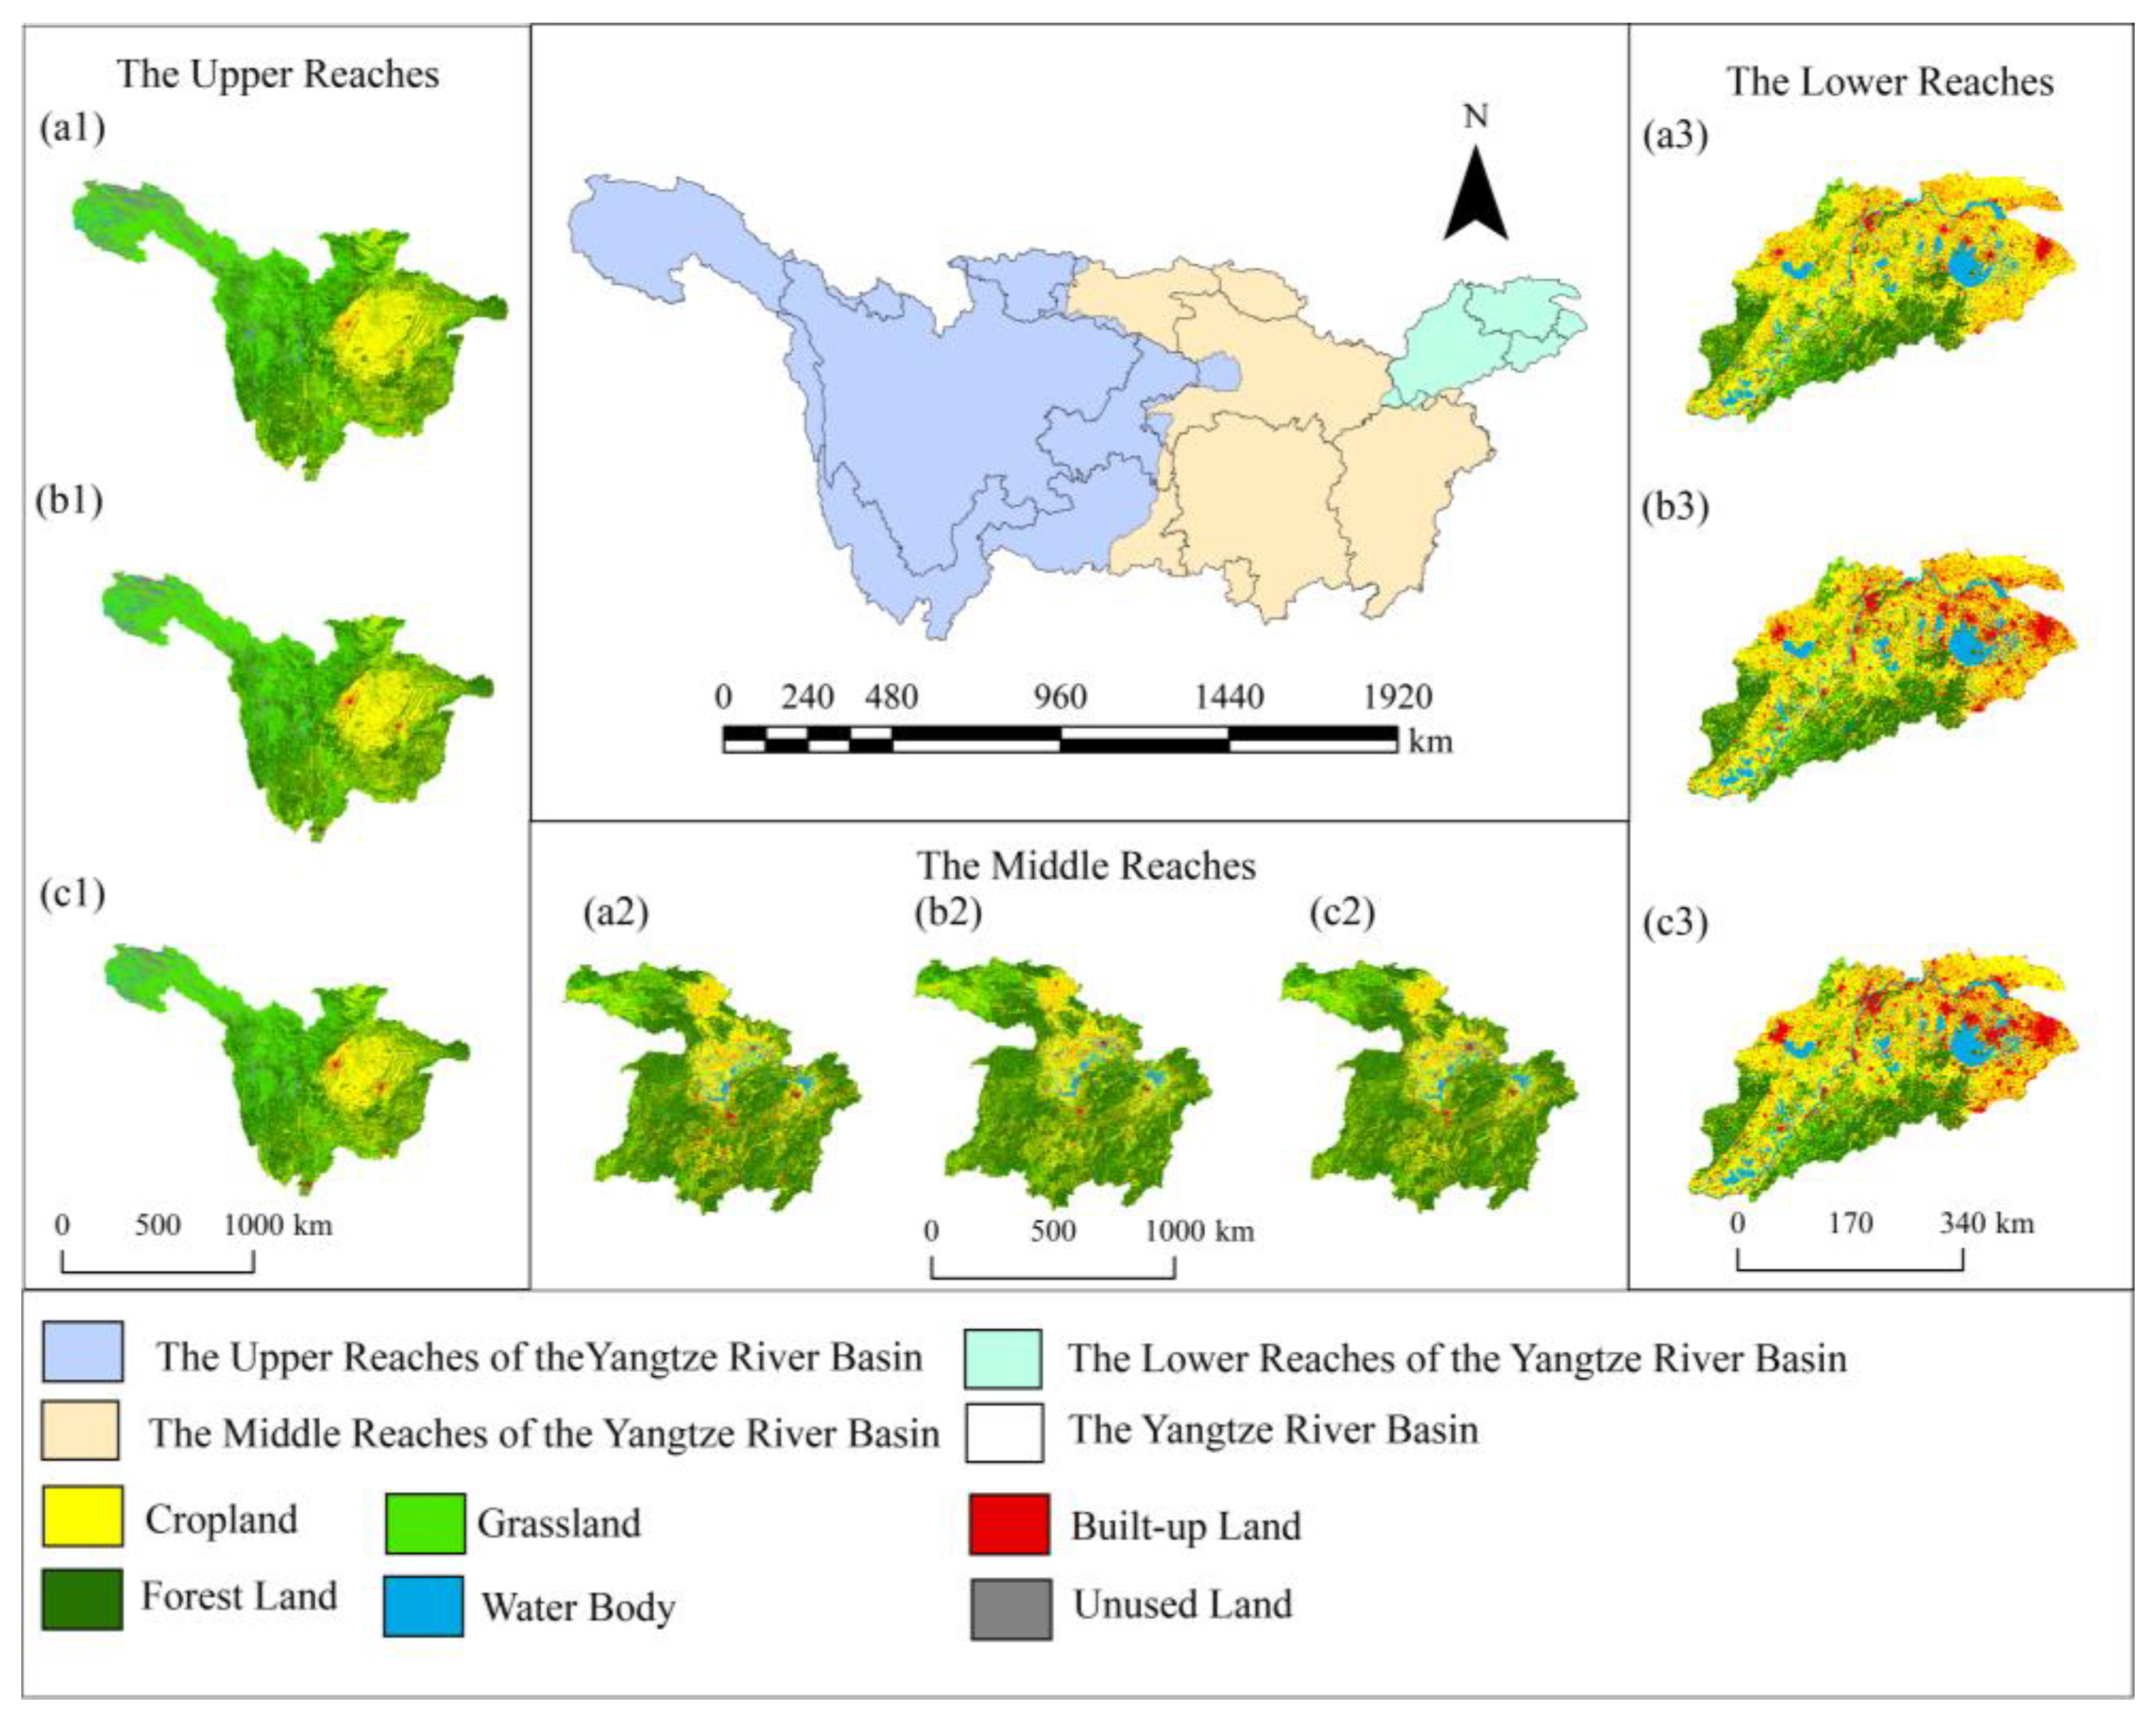
2.1. Research Area

The total area of the Yangtze River Basin (Figure 1) is roughly 1.8 million square kilometers. It accounts for 18.8% of China’s national territory and ranks as the world’s third-largest river basin [33]. Situated in the subtropical region of China, the Yangtze River Basin has a west-high and east-low terrain, spanning across China’s three major topographic steps. With a dense population and a well-developed socioeconomic system, it experiences pronounced changes in its thermal environment [34]. According to the Köppen climate classification, the Yangtze River Basin belongs to the subtropical humid climate (Cfa) [35]. The basin has cold and humid winters and hot and rainy summers. Temperature and precipitation display distinct spatial distribution patterns. From 2000 to 2022, the summer land surface temperature (LST) in the basin ranged from −5.76 °C to 33.06 °C, with an average of 21.01 °C, and generally showed an upward trend at a growth rate of 0.409 °C per decade. Due to differences in terrain, the annual average temperature in the Yangtze River Basin has a spatial distribution trend of being higher in the east and south and lower in the west and north. The average surface temperature in the middle and lower reaches is generally higher than that in the upper reaches. The extreme maximum temperature can reach 44.9 °C, while the extreme minimum temperature can reach −42.1 °C.

2.2. Data Source

A total of five types of data were used in this paper, all with a data resolution of 1 km. Firstly, the land use-type data were sourced from the Earth Resources Data Cloud (http://www.gis5g.com/). Secondly, the MODIS imagery data were obtained from the National Aeronautics and Space Administration (NASA, https://search.earthdata.nasa.gov/search/ (accessed on 4 May 2024)). Thirdly, the physical geography data, including DEM data, normalized difference vegetation index (NDVI), soil types, etc., were sourced from the Resource and Environment Science Data Center of the Chinese Academy of Sciences (http://www.resdc.cn/). Fourthly, the socioeconomic data, including population density, the primary industry, the secondary industry, and the tertiary industry, were obtained from the China Statistical Yearbooks of 2000, 2010, and 2020, as well as local statistical yearbooks (https://www.stats.gov.cn/sj/ndsj/ (accessed on 1 June 2024)). Finally, the meteorological data, including wind speed and humidity, were sourced from the Resource and Environment Science Data Center of the Chinese Academy of Sciences.

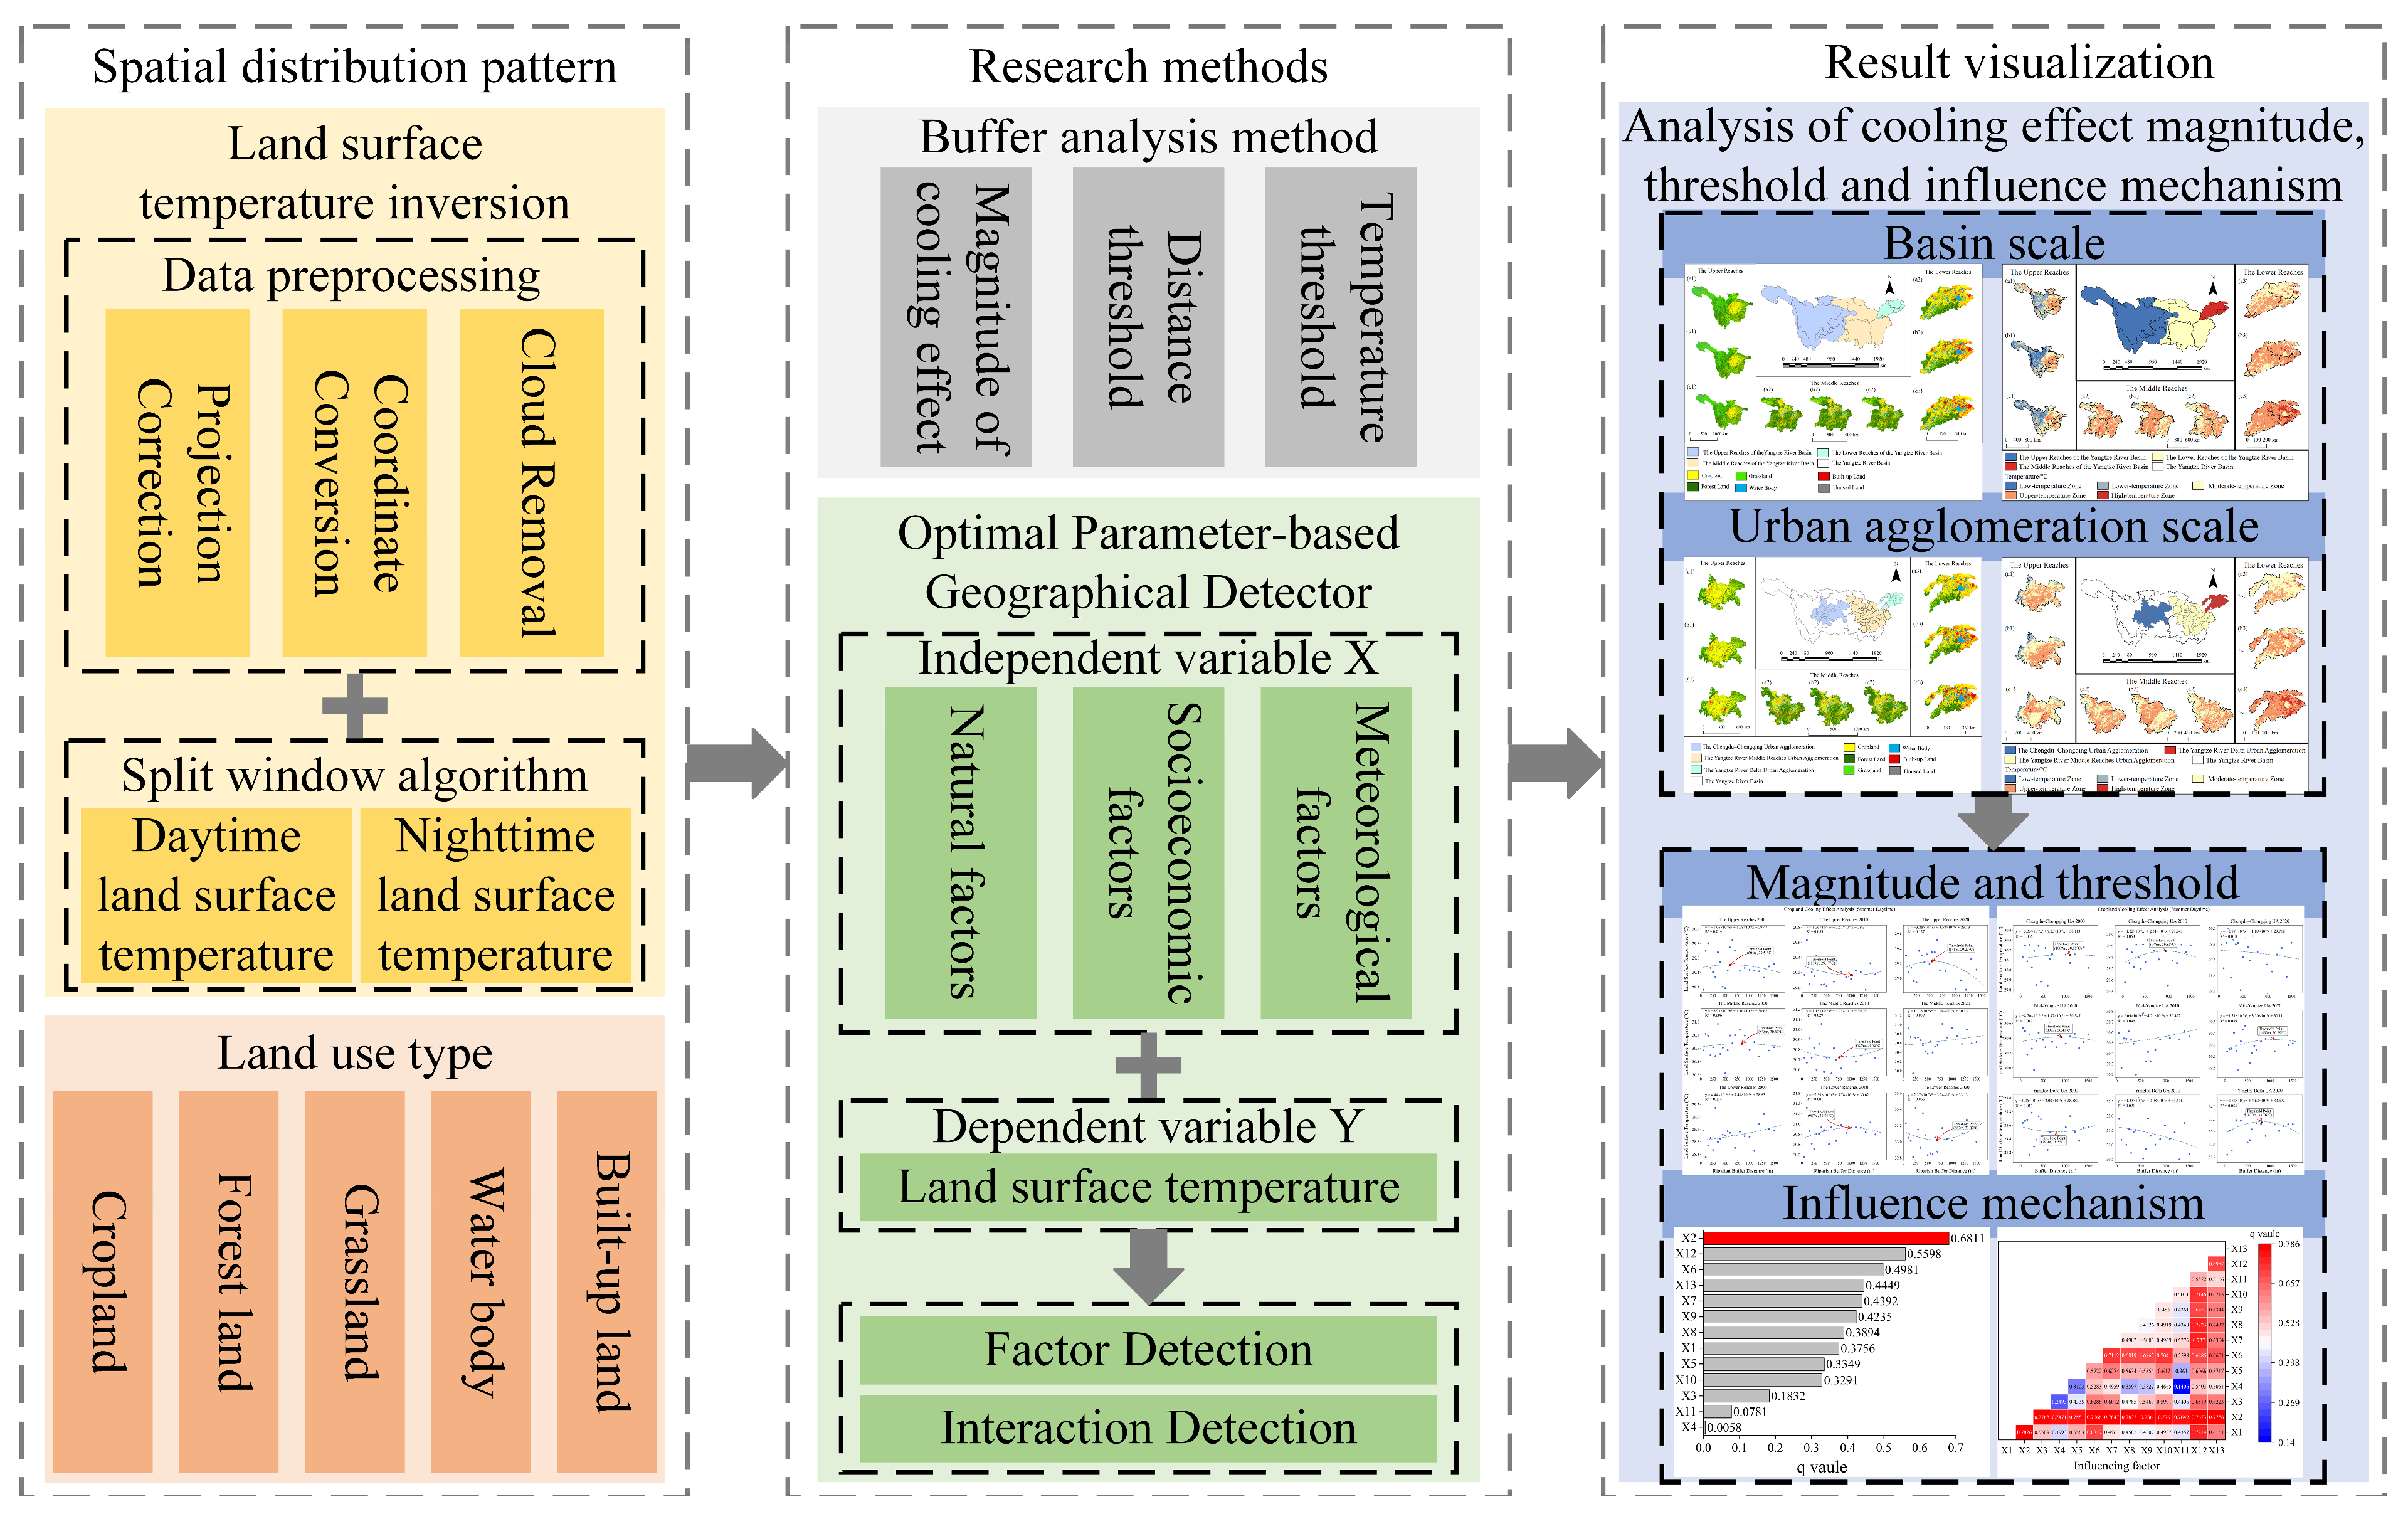
2.3. Research Methodology

This study used the 8-day composite land surface temperature (LST) product (MOD11A2) provided by the Terra-MODIS sensor as the main remote sensing data source to establish a research framework for the cool island effect in the Yangtze River Basin. First, based on ArcGIS 10.4, the land use types were classified to analyze the temporal and spatial dynamic changes of the land use pattern in the Yangtze River Basin at different scales. Second, the split window algorithm was employed to retrieve the LST, and the temporal and spatial differentiation laws of the LST field at different scales were compared and analyzed. Third, multi-ring buffers (50–1500 m) were used to quantify the differences in cooling effects among different land types. Finally, the optimal parameter-based geographical detector model was adopted to analyze the influencing mechanism of the cool island effect of the three-level rivers in the Yangtze River Basin. The specific technical route is shown in Figure 2.

2.3.1. Split Window Algorithm

Land surface temperature (LST) [36], as a core variable in the surface energy balance equation, is a key physical parameter characterizing the thermodynamic state of the Earth’s surface. The MODIS sensor onboard the Terra/Aqua satellites, with its high spatiotemporal resolution, is widely used for large-scale remote sensing monitoring of surface thermal environments. The split window algorithm enables the precise inversion of LST [37]. Therefore, based on the split window algorithm, this study selected the MODIS LST products (MOD11A2 1KM) synthesized over 8-day emissive data in the summers of 2000, 2010, and 2020 and inversed the daytime and nighttime land surface temperatures in the Yangtze River Basin.
(1)
Data preprocessing.
First, geometric correction and cloud removal were performed on MOD11A2 data using the MODIS Reprojection Tool (MRT). The LST_Day_1 km and LST_Night_1 km bands were extracted via ArcGIS 10.4. Spatial cropping and radiometric correction were completed using the study area’s vector boundary as a mask.
(2)
LST inversion.
A physical conversion model was established to transform the brightness temperature (BT) values into actual LSTs [38]. The calculation formula is
LST = 0.02 × DN − 273.15
where LST is the actual temperature value of the calculated pixel, and DN (digital number) is the grayscale value of the image pixel.
To reveal the spatiotemporal heterogeneity of the LST in the Yangtze River Basin, the study standardized the inversion results using the “mean–standard deviation classification method” within the ArcGIS 10.4 spatial analysis module. LST was categorized into five grades: low-temperature zone, lower-temperature zone, moderate-temperature zone, higher-temperature zone, and high-temperature zone. The classification criteria are shown in Table 1.

2.3.2. Buffer Analysis Method

As an important method in spatial analysis, the core principle of buffer analysis is to quantitatively express the influence range of geographical elements by constructing buffer zones with a certain width based on the spatial proximity characteristics of geographical elements [39]. This study employed a multiscale buffer analysis approach, integrating summer (June–August) daytime and nighttime LST remote sensing products and land use data, including cropland, forest land, grassland, and built-up land, for 2000, 2010, and 2020. Using ArcGIS 10.4, a gradient buffer system was established along third-order river networks in the Yangtze River Basin, with 14 equidistant buffer layers (50–700 m) and 8 equidistant buffer layers (700–1500 m). The mean LST values for each land use type were extracted per buffer layer. The study calculated the cooling magnitude and distance of various land use types at different buffer levels using Python 3.13; subsequently, a quadratic polynomial regression equation was employed to fit the relationship between land surface temperature and distance, and the threshold characteristics of the fitted curve were identified based on this model.

2.3.3. Optimal Parameter-Based Geographical Detector

The optimal parameter-based geographical detector (OPGD) is a set of statistical methods for detecting the spatial heterogeneity of variables and revealing their driving factors. It can automatically select optimal parameter combinations during the discretization of continuous data, reducing the subjectivity and errors associated with manual parameter settings [40]. In recent years, this method has been applied to investigate the factors influencing the spatial heterogeneity of the LST [41], vegetation dynamics [42], land use patterns [43], and other related domains. Consequently, this study employed the factor detection and interaction detection modules of the OPGD to explore the mechanisms underlying the cooling effect of rivers in the Yangtze River Basin.
(1)
Factor detection
This module quantified the explanatory power of a driving factor (X) on the spatial differentiation of the LST (Y) using the q-statistic, calculated as
q = 1 1 N σ 2 i = 1 L N i σ i 2
where q represents the spatial heterogeneity intensity, N denotes the total sample size, σ2 is the variance of the LST, and L indicates the number of strata. A higher q-value signifies stronger spatial stratified heterogeneity, while a lower value implies greater randomness.
(2)
Interaction detection
By comparing the q-values of individual factors q(X1) and q(X2) with their interaction term q(X1∩X2), this module evaluates whether the combined effect of two drivers on the LST was enhanced, weakened, or independent. In this study, we used 13 indicators (Table 2) spanning three categories: natural, socioeconomic, and meteorological factors as input parameters for the OPGD framework to analyze their impacts on LST. Among these, natural indicators include X1–X6 and X11, socioeconomic indicators include X7–X10, and meteorological indicators include X12 and X13.

3. Results

3.1. Land Use Patterns and LST Spatial Distribution in the Yangtze River Basin

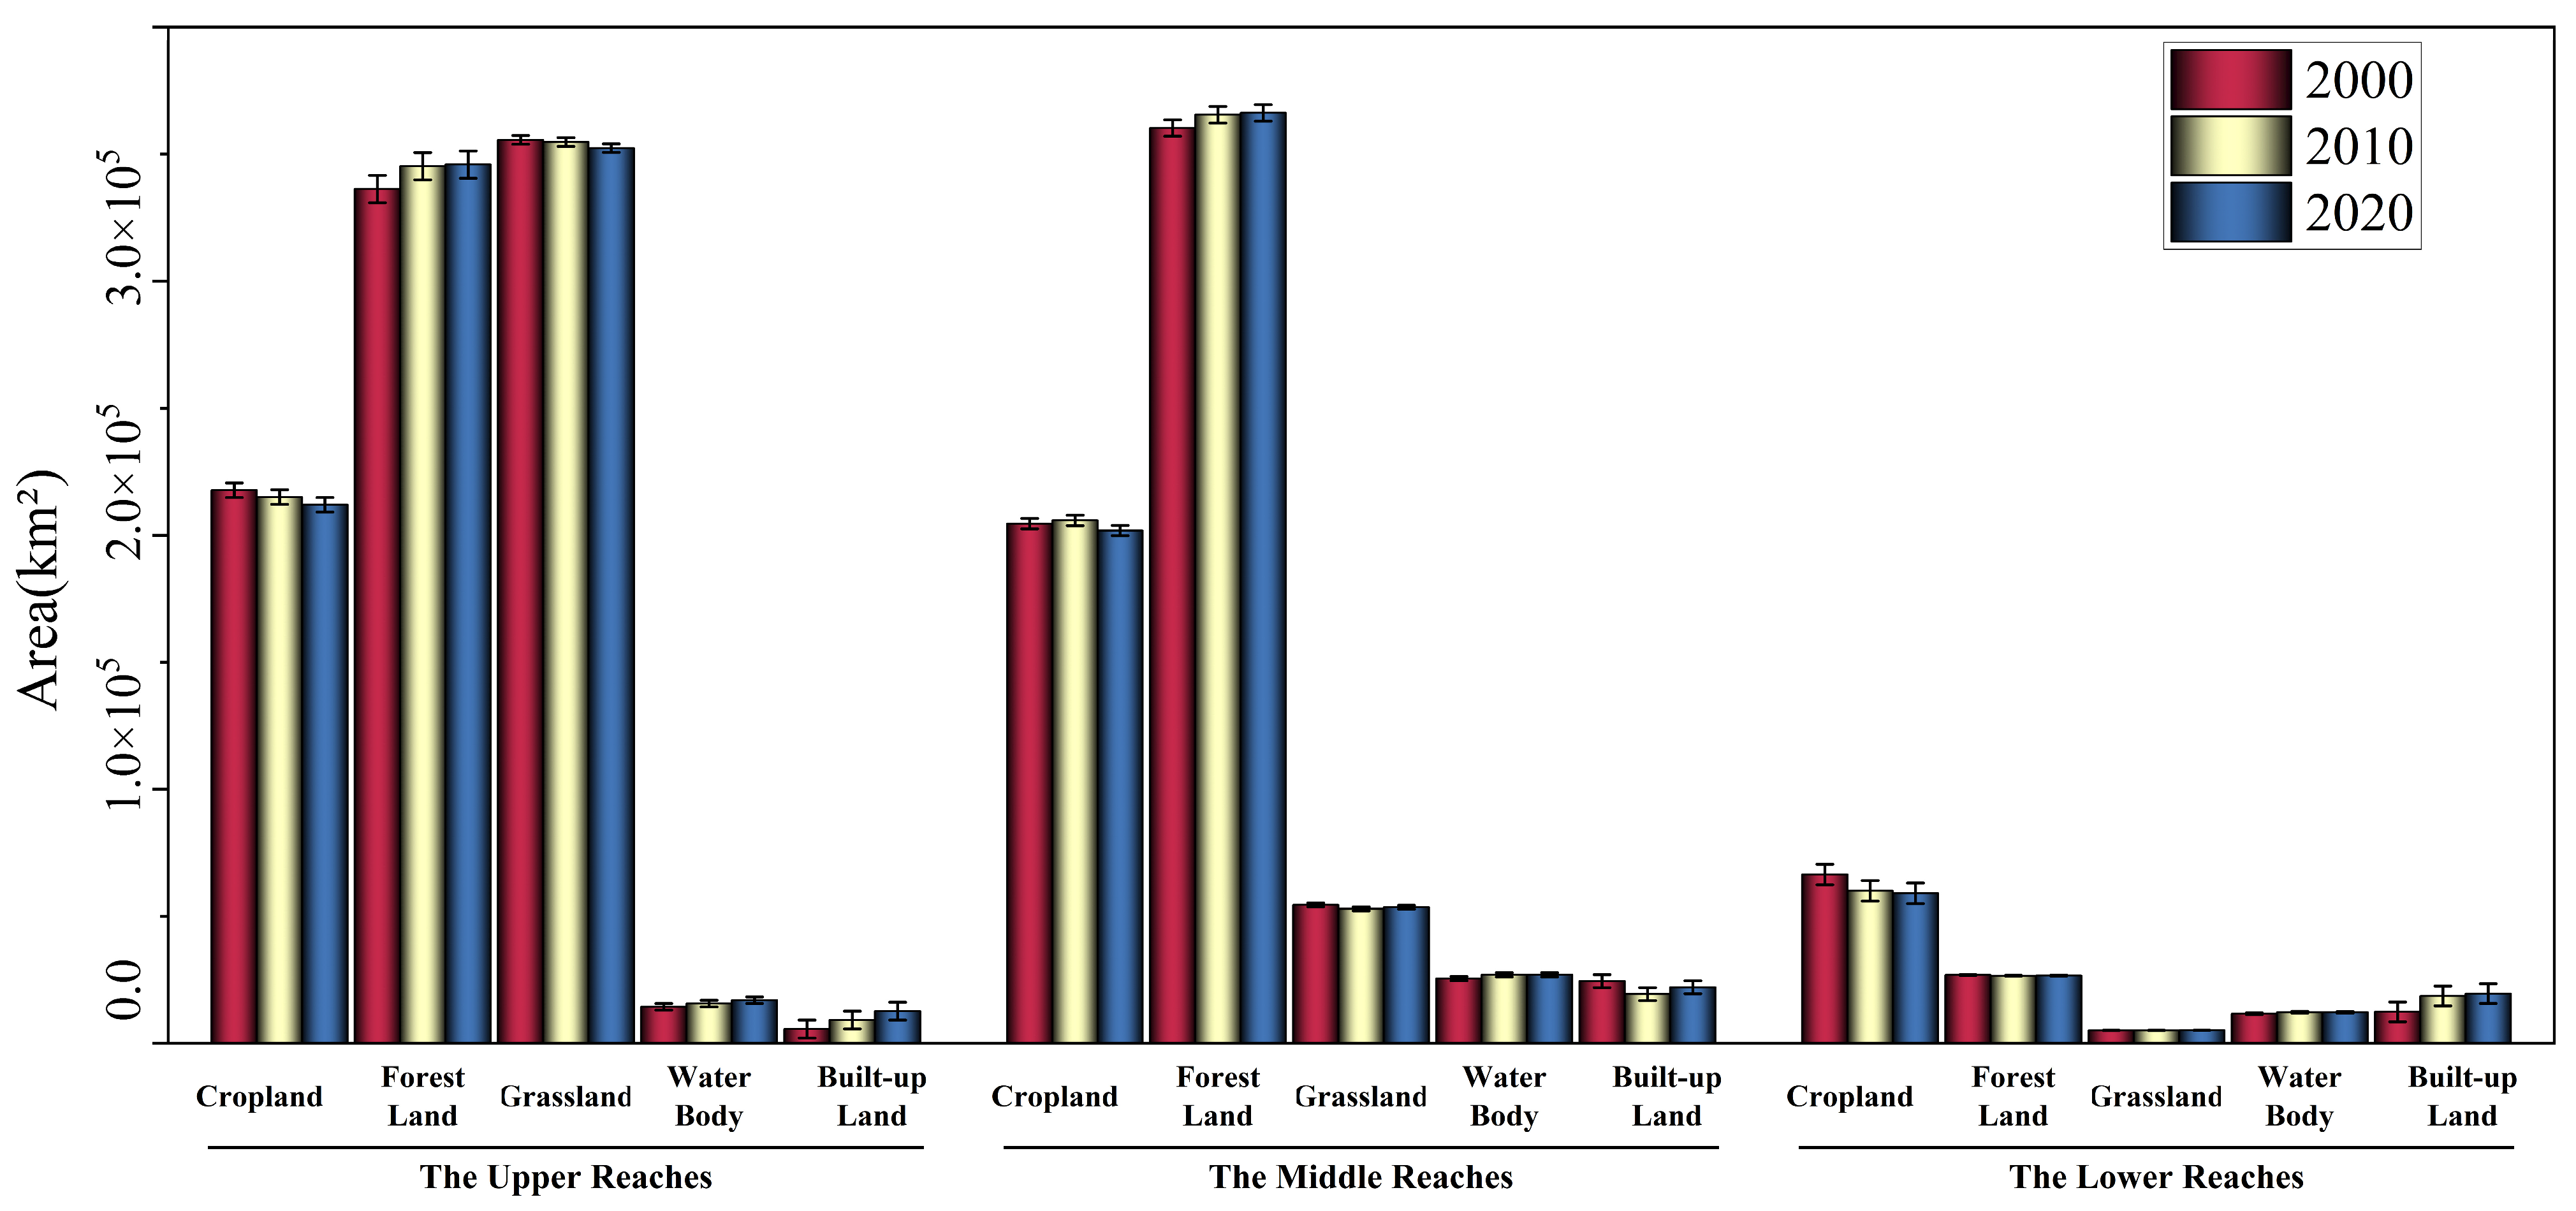
3.1.1. Spatiotemporal Dynamics of Land Use Patterns

To conduct an in-depth analysis of the spatiotemporal dynamics of land use patterns in the Yangtze River Basin, this study implemented a dual-scale analytical framework encompassing both the basin scale and urban agglomeration scale. Utilizing ArcGIS 10.4 software, we systematically extracted quantitative area data for distinct land use types. The principal findings are presented as follows.
At the basin scale (Figure 3), the spatial distribution of land use types in the Yangtze River Basin exhibited distinct regional differentiation across its upper, middle, and lower reaches. In the upper reaches, grassland predominated as the primary land cover, concentrated in the western sectors, while forest land constituted the secondary type with fragmented distribution patterns across the central and eastern areas. From 2000 to 2020, the expansion of built-up land exhibited a significant trend, continuously sprawling outward. In the middle reaches, forest land was the dominant type, followed by cropland. Forest land was relatively scattered in distribution patterns in the middle reaches, while cropland was concentrated in the area slightly to the north of the central part. Built-up land and water bodies exhibited sporadic distribution patterns within the central areas. In the lower reaches, cropland occupied approximately half of the total area. From 2000 to 2020, the area of cropland decreased sharply, while the expansion rate of built-up land was the most remarkable. At the urban agglomeration scale (Figure S1), the Chengdu–Chongqing urban agglomeration showed cropland dominance (>50% coverage) in its central part. Forest land and grassland were mainly distributed on the periphery of the urban agglomeration. Built-up land manifested high spatial concentration in the northwestern and southern sectors. From 2000 to 2020, the areas of cropland and grassland gradually decreased. Forest land expanded from the periphery towards the interior, and the expansion of construction land was obvious. The spatial distribution of land use types in both the middle reaches and Yangtze River Delta urban agglomerations maintained strong correspondence with their respective basin scale distributions.
As shown in Figure 4, there were certain differences in the area and proportion of land use types across different river basins. The upper reaches region was predominantly covered by grassland and forest, with their combined area exceeding 80% of the total upstream area. From 2000 to 2020, the cropland area gradually decreased year by year, showing a total reduction of 5733 km2, while the forest land area consistently increased by 9630 km2. In the middle reaches region, forest land accounted for over 50% of land cover. By 2020, the total forest land area reached 366,248 km2, making it the region with the largest forest land coverage among the three basins. From 2000 to 2020, built-up land in this area exhibited the most significant changes, first decreasing and then increasing, with respective change rates of a 22% decrease and a 13% increase. The lower reaches region was dominated by cropland, which accounted for 54.3% of total area in 2000 before showing a gradual decline. Built-up land in this area increased notably from 10.1% to 15.9% during 2000–2020, representing an expansion of 7148 km2. Water bodies remained relatively stable in this region. At the urban agglomeration scale (Figure S2), the Chengdu–Chongqing urban agglomeration was primarily characterized by cropland, followed by forest land. From 2000 to 2020, this region witnessed the largest reduction in grassland area (3485 km2 decrease) alongside the most significant forest land expansion (5615 km2 increase). The proportion of built-up land more than doubled, from 1.5% to 3.2%. The middle reaches urban agglomerations similarly featured forest land as the dominant land type, with cropland ranking second. Water body areas showed a fluctuating trend with a net increase of 1633 km2, while built-up land experienced a net reduction of 474 km2 after the initial decrease, followed by increase. In the Yangtze River Delta urban agglomeration, the cropland proportion dropped continuously from 55.2% in 2000 to below 50% by 2020. Built-up land demonstrated the most dramatic expansion, increasing from 11.5% to 18.9%, with an absolute growth of 6690 km2, representing a 62% growth rate over the two-decade period.

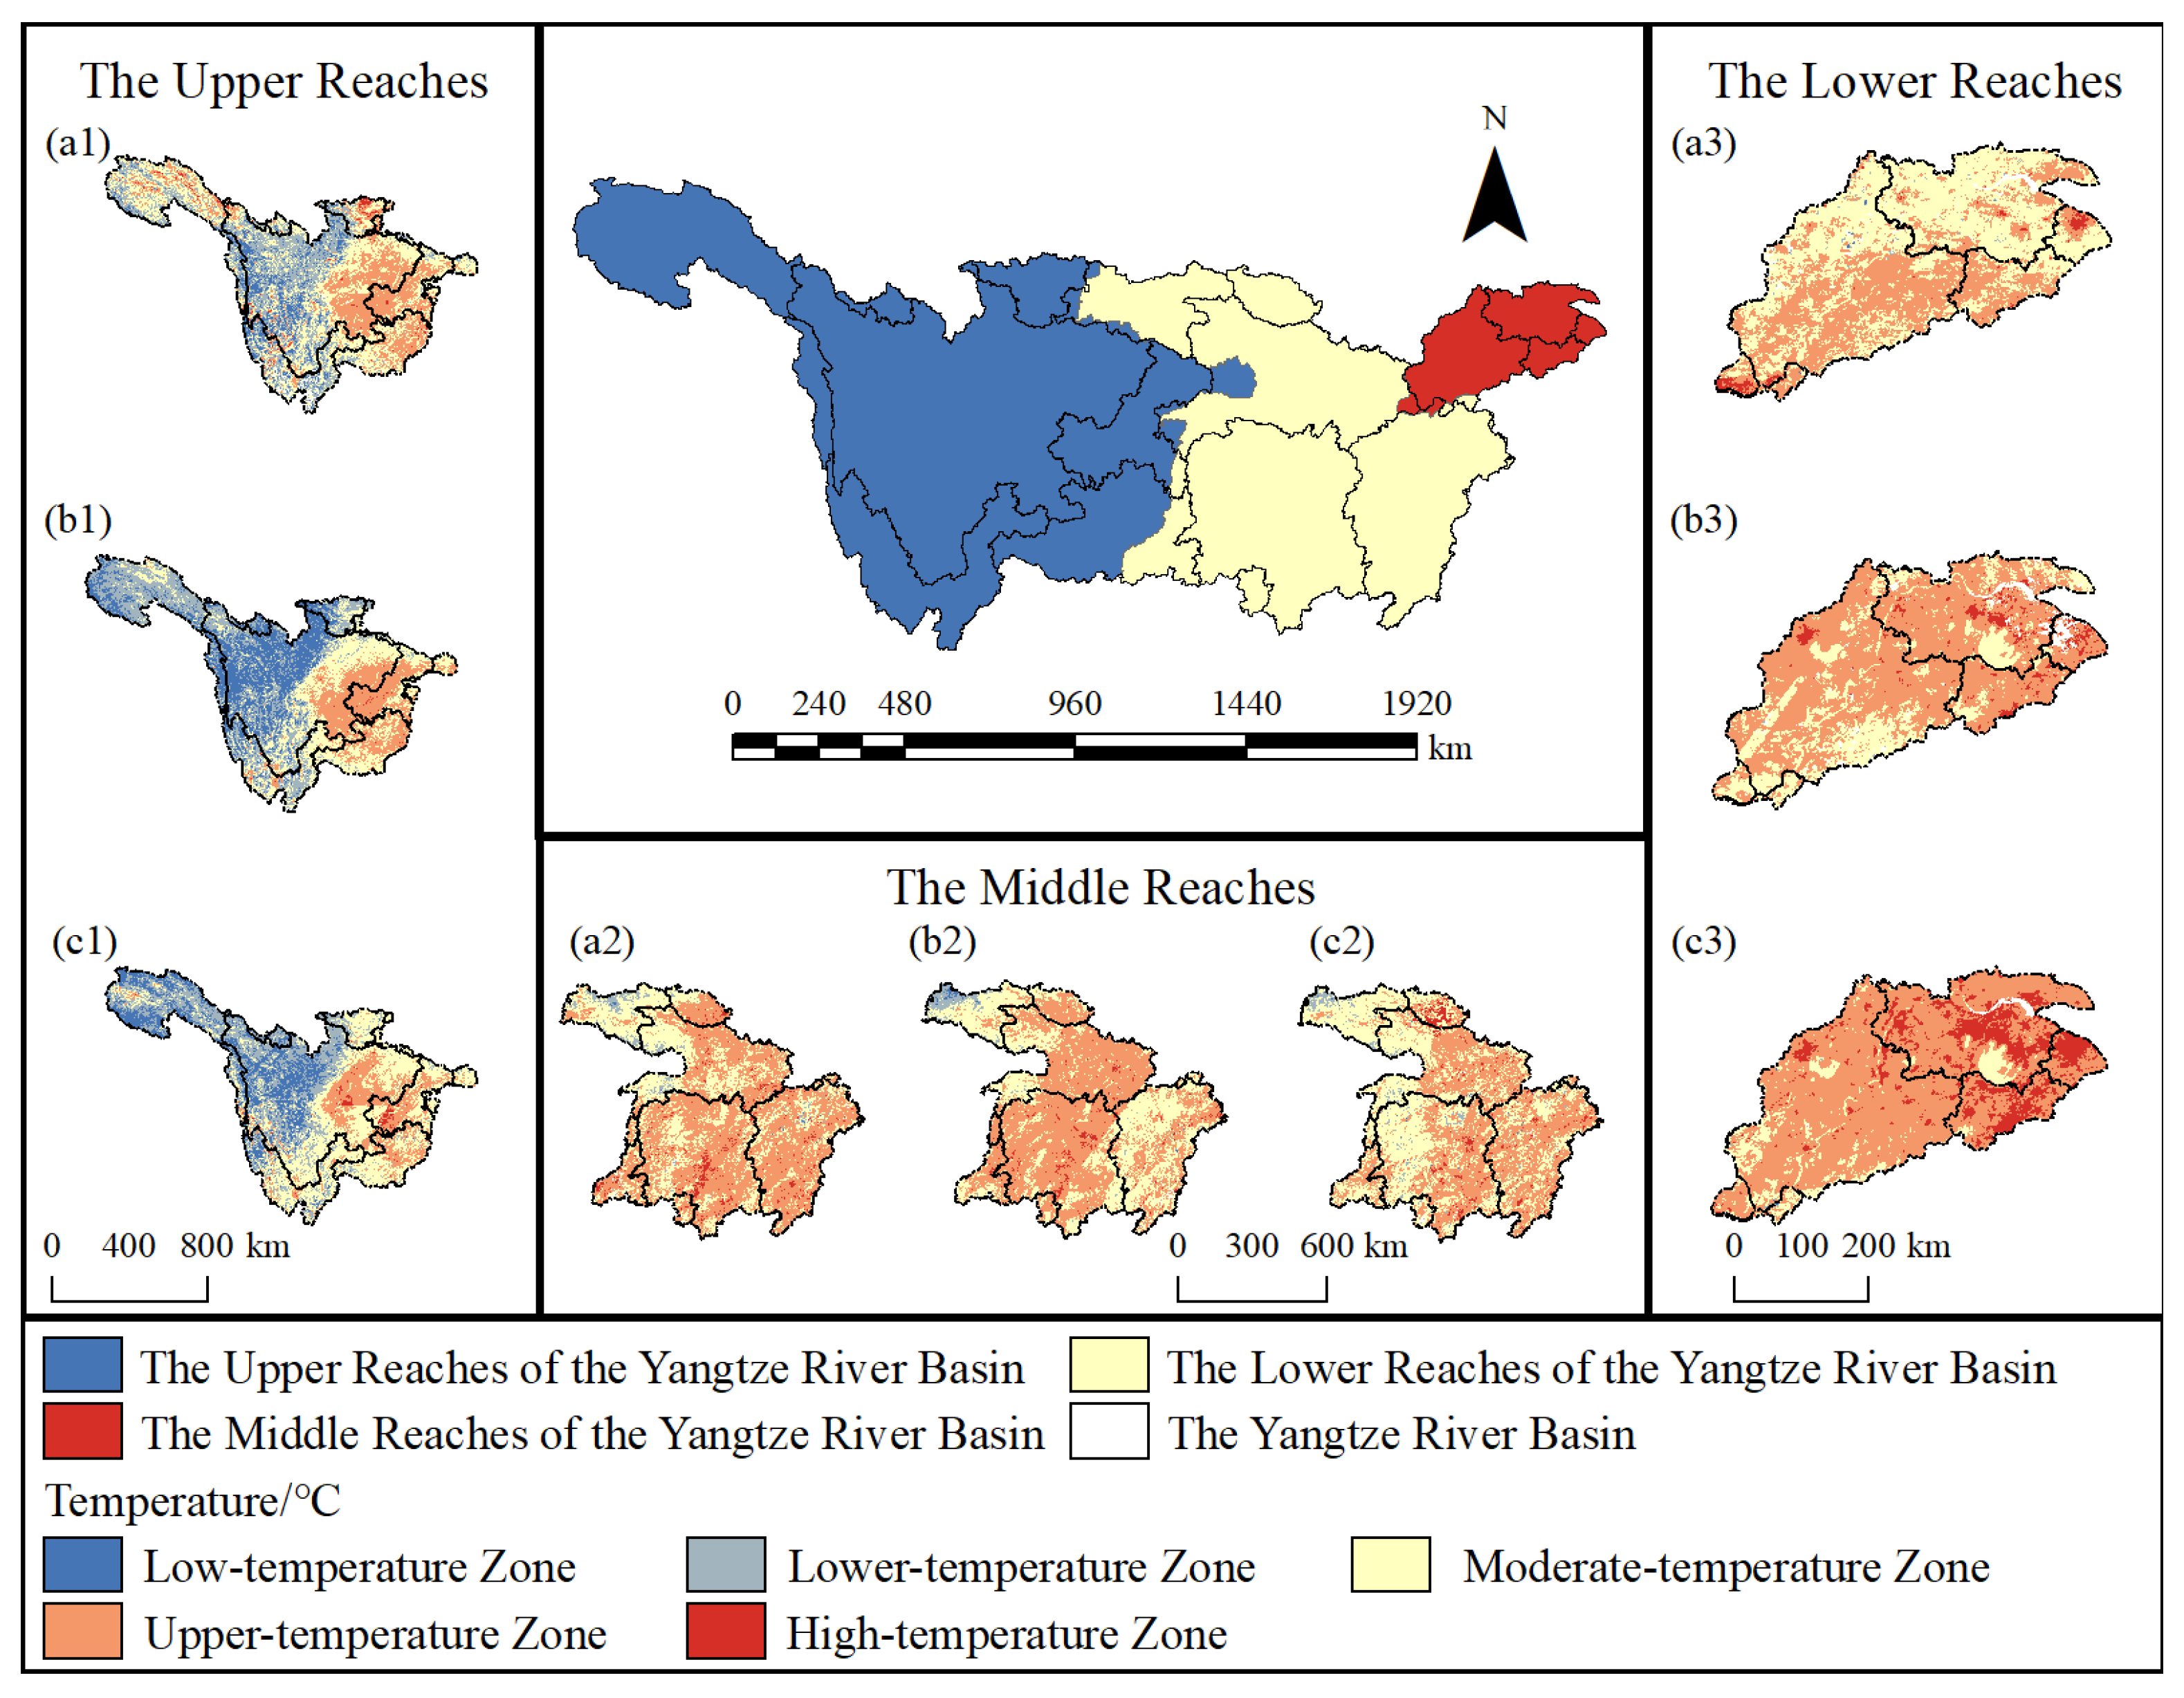
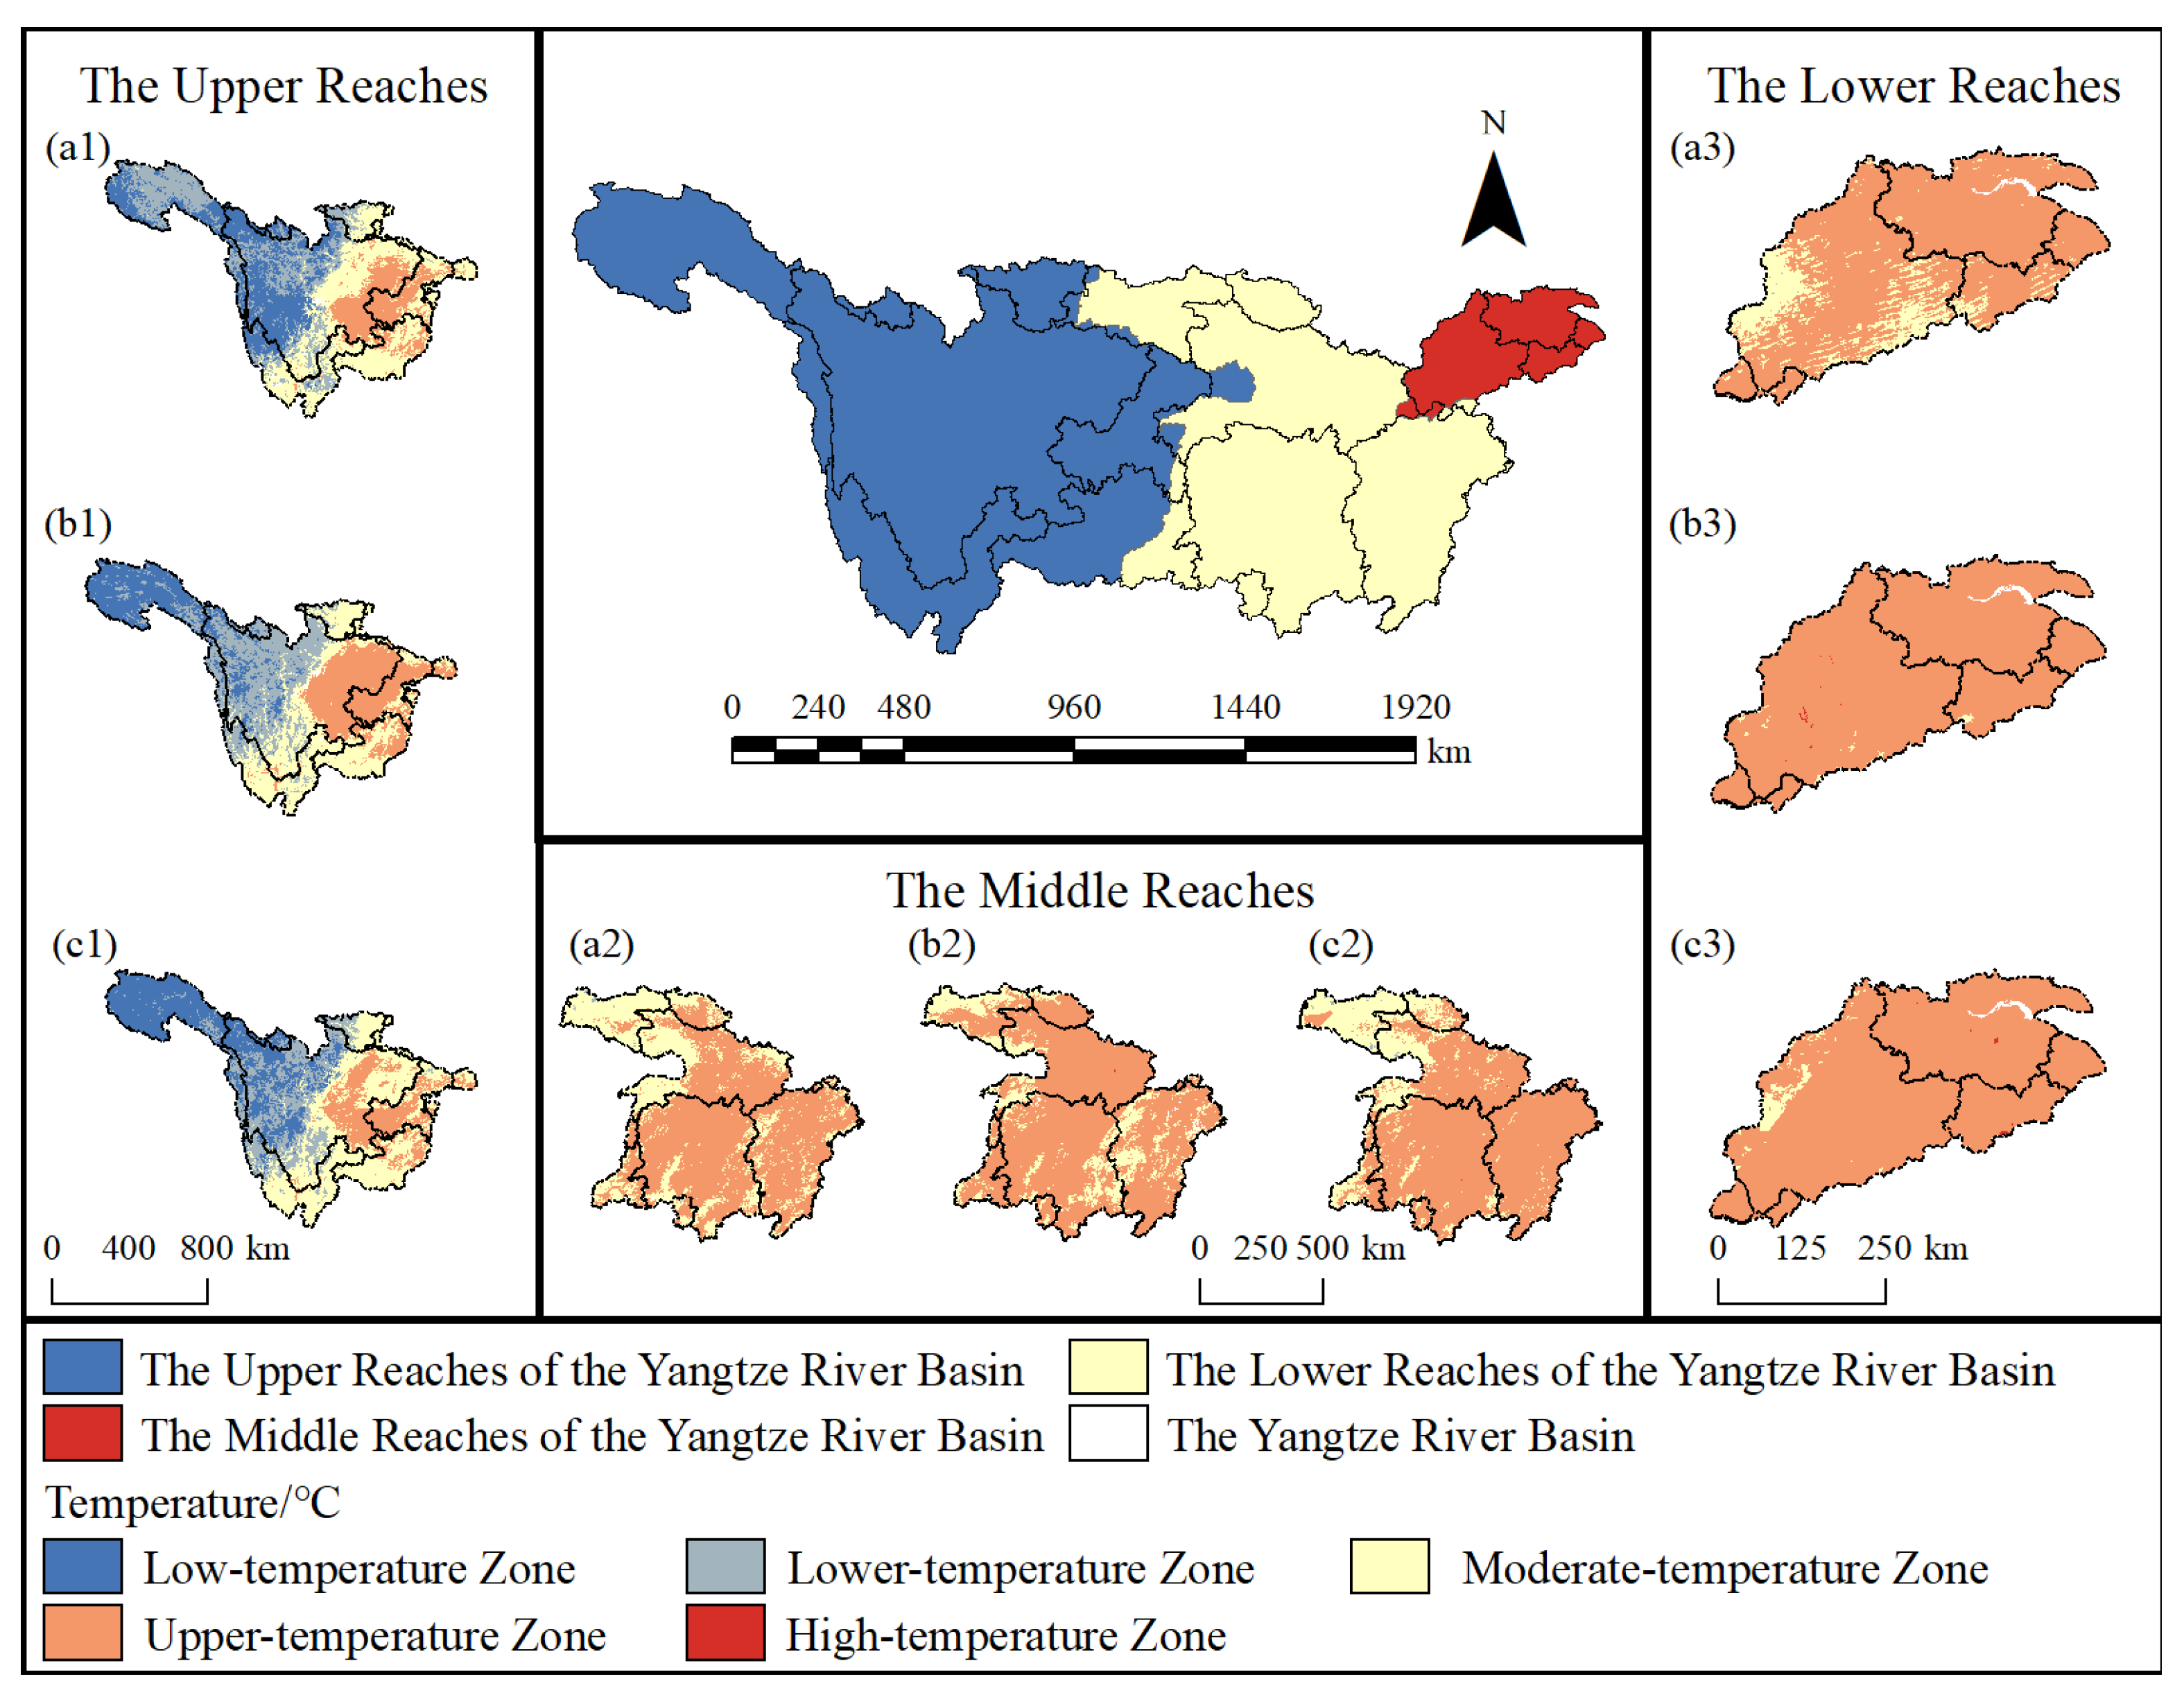
3.1.2. Spatial Distribution Patterns of the LST

Based on the LST and its classification in the Yangtze River Basin, this study conducted differential analyses of the LST in the upper, middle, and lower reaches and urban agglomerations. The results were as follows.
From 2000 to 2020, summer temperatures in the Yangtze River Basin exhibited a spatial pattern of “higher in the east and lower in the west, warmer in the south and cooler in the north”, with an overall upward trend and significant diurnal temperature variation (Figure 5 and Figure 6). The three-year mean daytime and nighttime temperatures were 26.49 ± 5.80 °C and 16.71 ± 8.94 °C, respectively. The three-year mean coefficient of variation for nighttime temperature (53.3%) was significantly higher than that for daytime (21.9%), indicating stronger asymmetric warming. Classification using the “mean–standard deviation classification method” revealed that higher-temperature zones covered 35.7 ± 1.2% of the basin area, concentrated in the mid-eastern monsoon region. Nighttime coverage (44.4 ± 1.5%) was 8.8% higher than daytime but contracted at a rate of −0.4%·decade−1, while the high-temperature zones, accounting for only 1.8% ± 0.3%, appeared as islands in the Yangtze River Delta and Wuhan metropolitan areas. Daytime coverage was 177 times that of nighttime, expanding at 0.1%·decade−1. The basin-segmented analysis showed that, for the upper reaches, daytime lower-temperature zones accounted for 31.5%, concentrated in the Western Sichuan Plateau and shrinking by 10.2% in 2020; nighttime moderate-temperature zones accounted for 32.9%, expanding in the Sichuan Hills at a rate of 3.1%·decade−1. In the middle reaches, daytime higher-temperature zones accounted for 53.5%, discretely distributed across the Two-Lake Plain and shrinking by 12.2% in 2020; nighttime higher-temperature zones accounted for 73.6%, with 41.3% higher spatial clustering than daytime and expanding at a rate of 9.3%·decade−1. For the lower reaches, daytime and nighttime higher-temperature zones accounted for 62.5% and 93.6%, respectively, expanding by 32.7% and 13.4% during these two decades; in the eastern lower reaches, daytime high-temperature zones increased from 0.03% to 0.6%, representing a 26.5% expansion.
The Yangtze River Basin urban agglomerations included the Yangtze River Delta urban agglomeration, Chengdu–Chongqing urban agglomeration, and middle reaches urban agglomeration, with significant differences in LSTs among these urban agglomerations (Figures S3 and S4). Spatiotemporal analysis of the Yangtze River Basin urban agglomerations from 2000 to 2020 revealed a spatial distribution pattern of “higher temperatures in the east and lower in the west” during the summer, with an overall warming trend and pronounced diurnal temperature variation. The three-year mean daytime and nighttime temperatures were 27.52 ± 5.37 °C and 19.07 ± 7.34 °C, respectively. The three-year mean coefficient of variation for nighttime temperature (38.2%) was significantly higher than that for daytime (19.7%). Classification using the “mean–standard deviation classification method” showed that higher-temperature zones, accounting for 46.3 ± 1.5% of the area, exhibited a “central clustering–eastern continuity” spatial pattern. During these two decades, these zones expanded at a rate of 1.2%·decade−1, with nighttime coverage (53.8 ± 2.1%) exceeding daytime by 7.5%. The Chengdu–Chongqing urban agglomeration was dominated by moderate-temperature zones, accounting for 47.0% daytime and 51.2% nighttime coverage, concentrated in the central hilly areas of the Chengdu–Chongqing urban agglomeration. During these two decades, the daytime moderate-temperature zones expanded by 9.9% and nighttime zones by 6.1%. The middle reaches urban agglomeration displayed asymmetric warming dominated by nighttime increases. The daytime higher-temperature zones (48.6%) were spatially dispersed, shrinking by 8.2% in 2020, while the nighttime zones (63.8%) became more concentrated, expanding at 29.9%·decade−1. The Yangtze River Delta urban agglomeration experienced intense urban heat island effects driven by high-intensity urbanization. Daytime higher-temperature zones (46.3%) formed continuous clusters in the central part of the lower reaches, expanding to 53.8% at night. Notably, high-temperature zones emerged in the eastern lower reaches, exhibiting concentrated spatial distribution and rapid expansion.

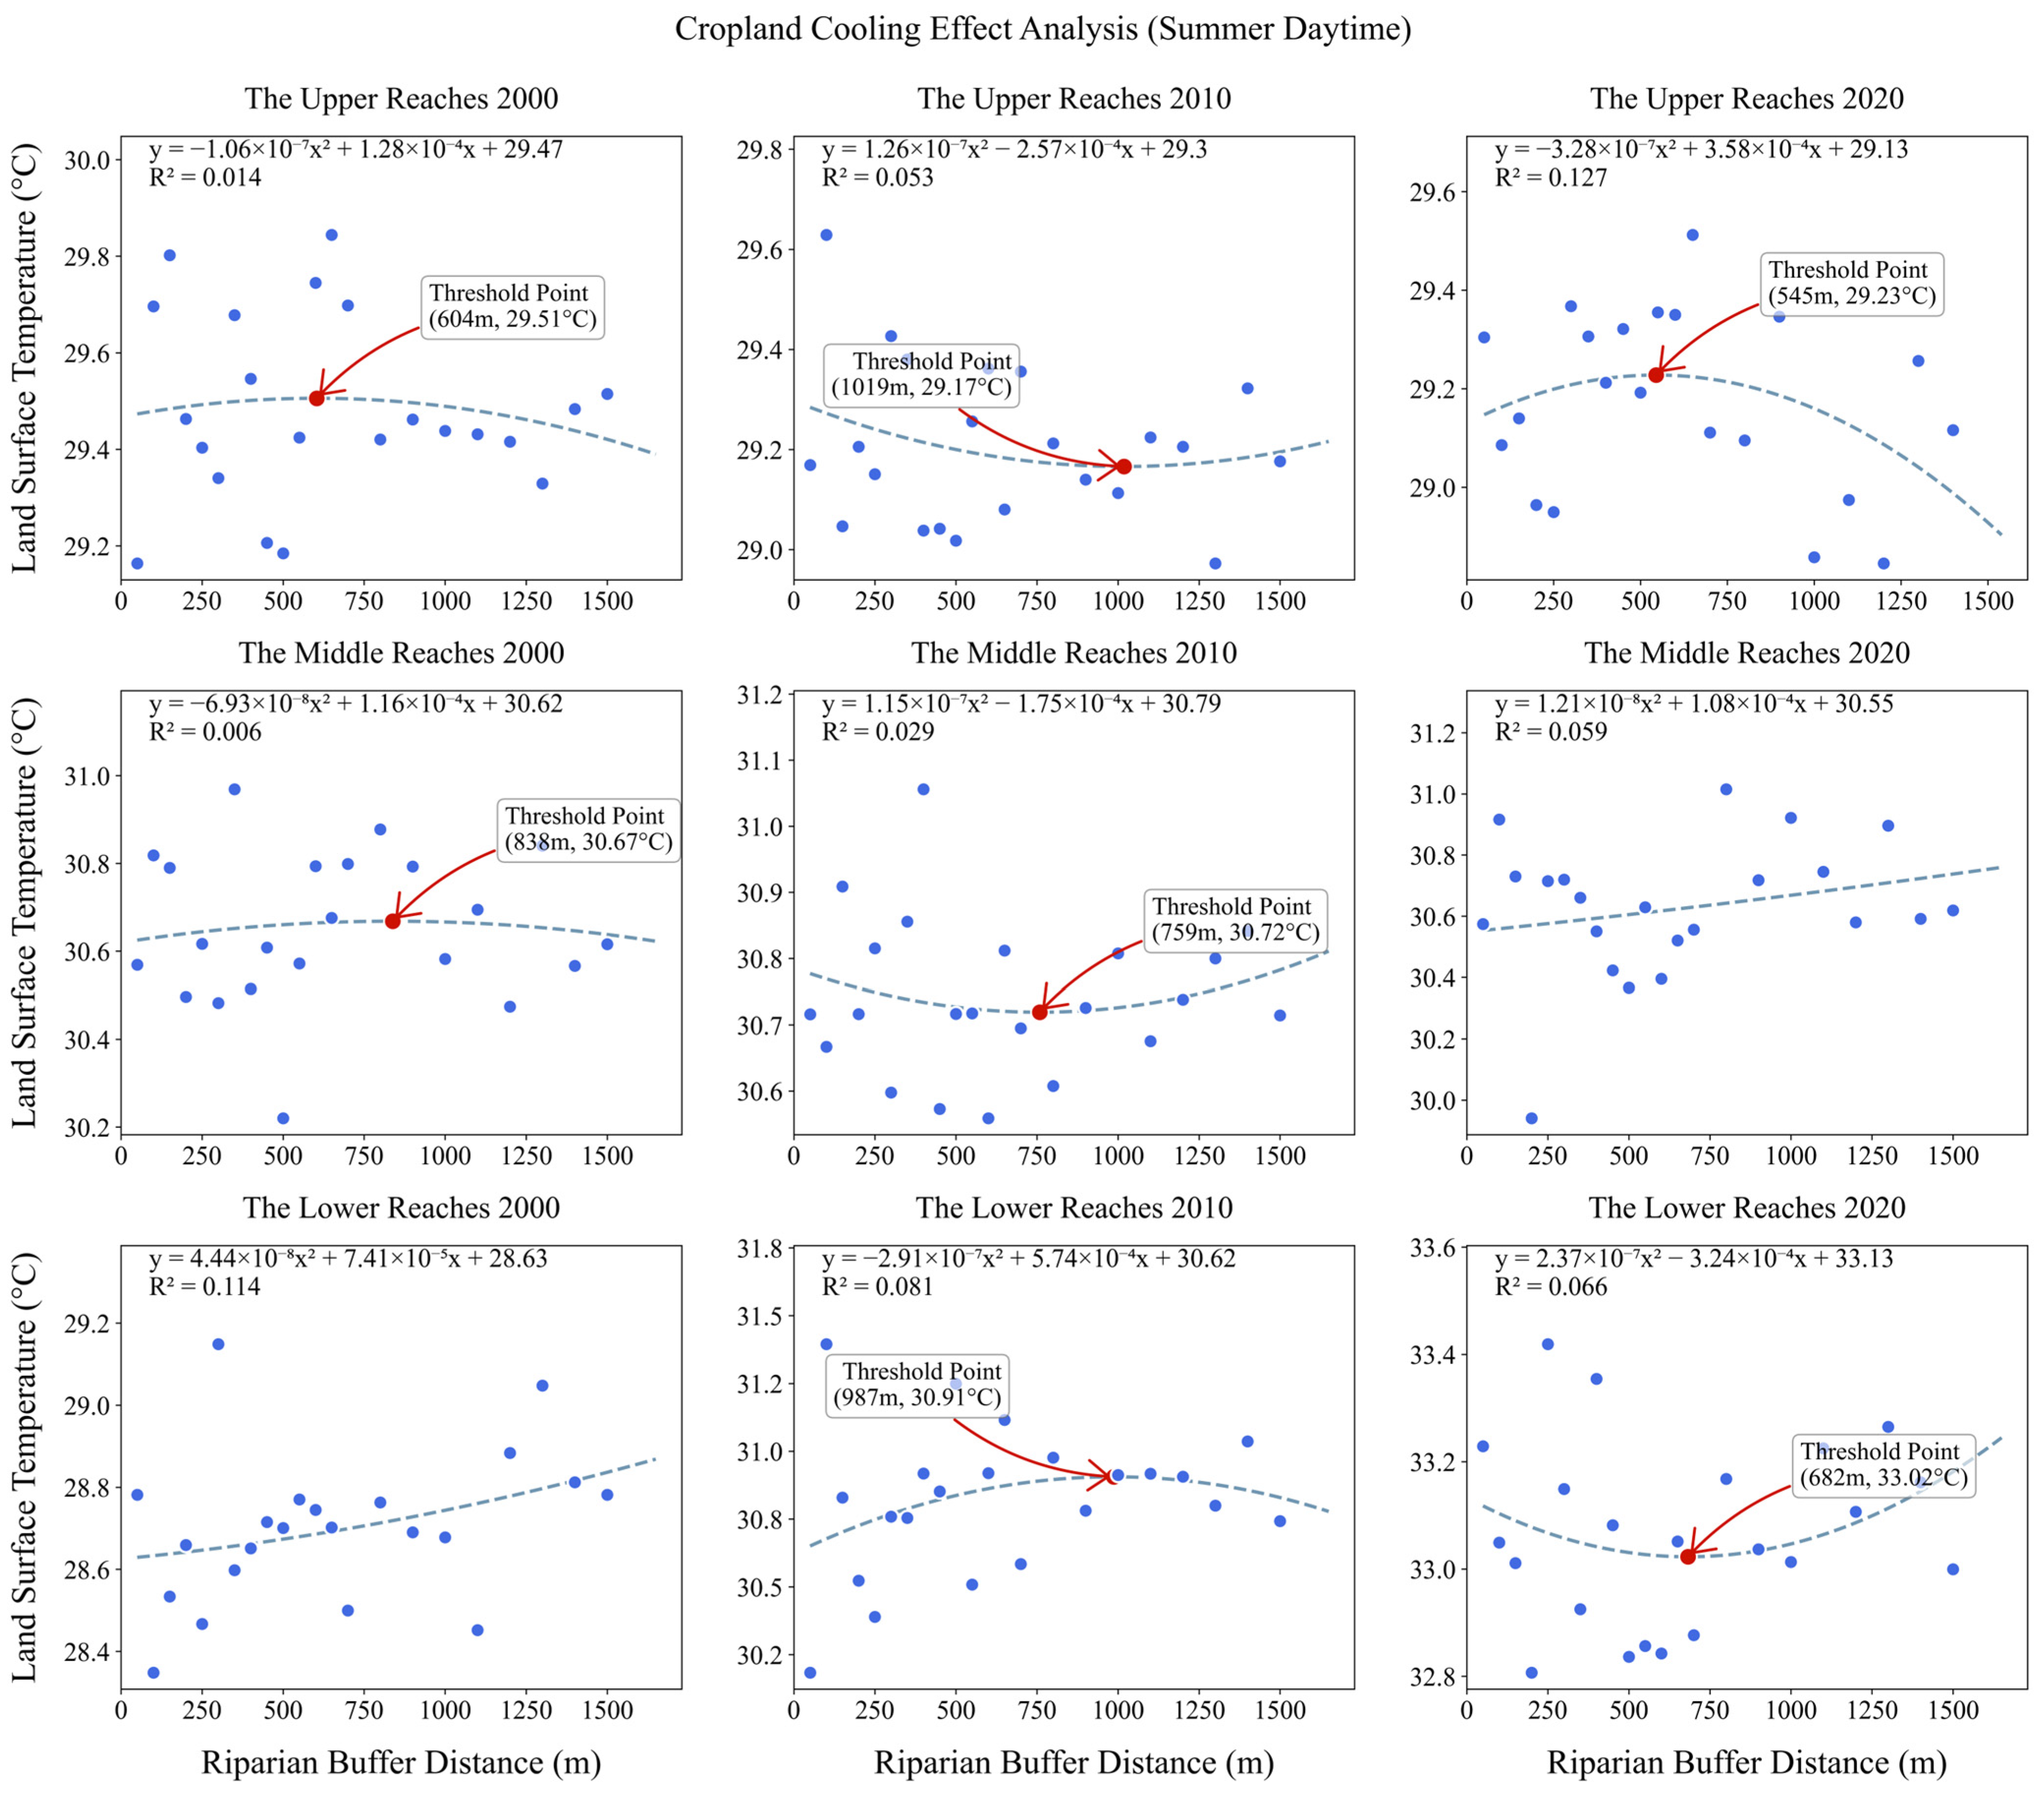
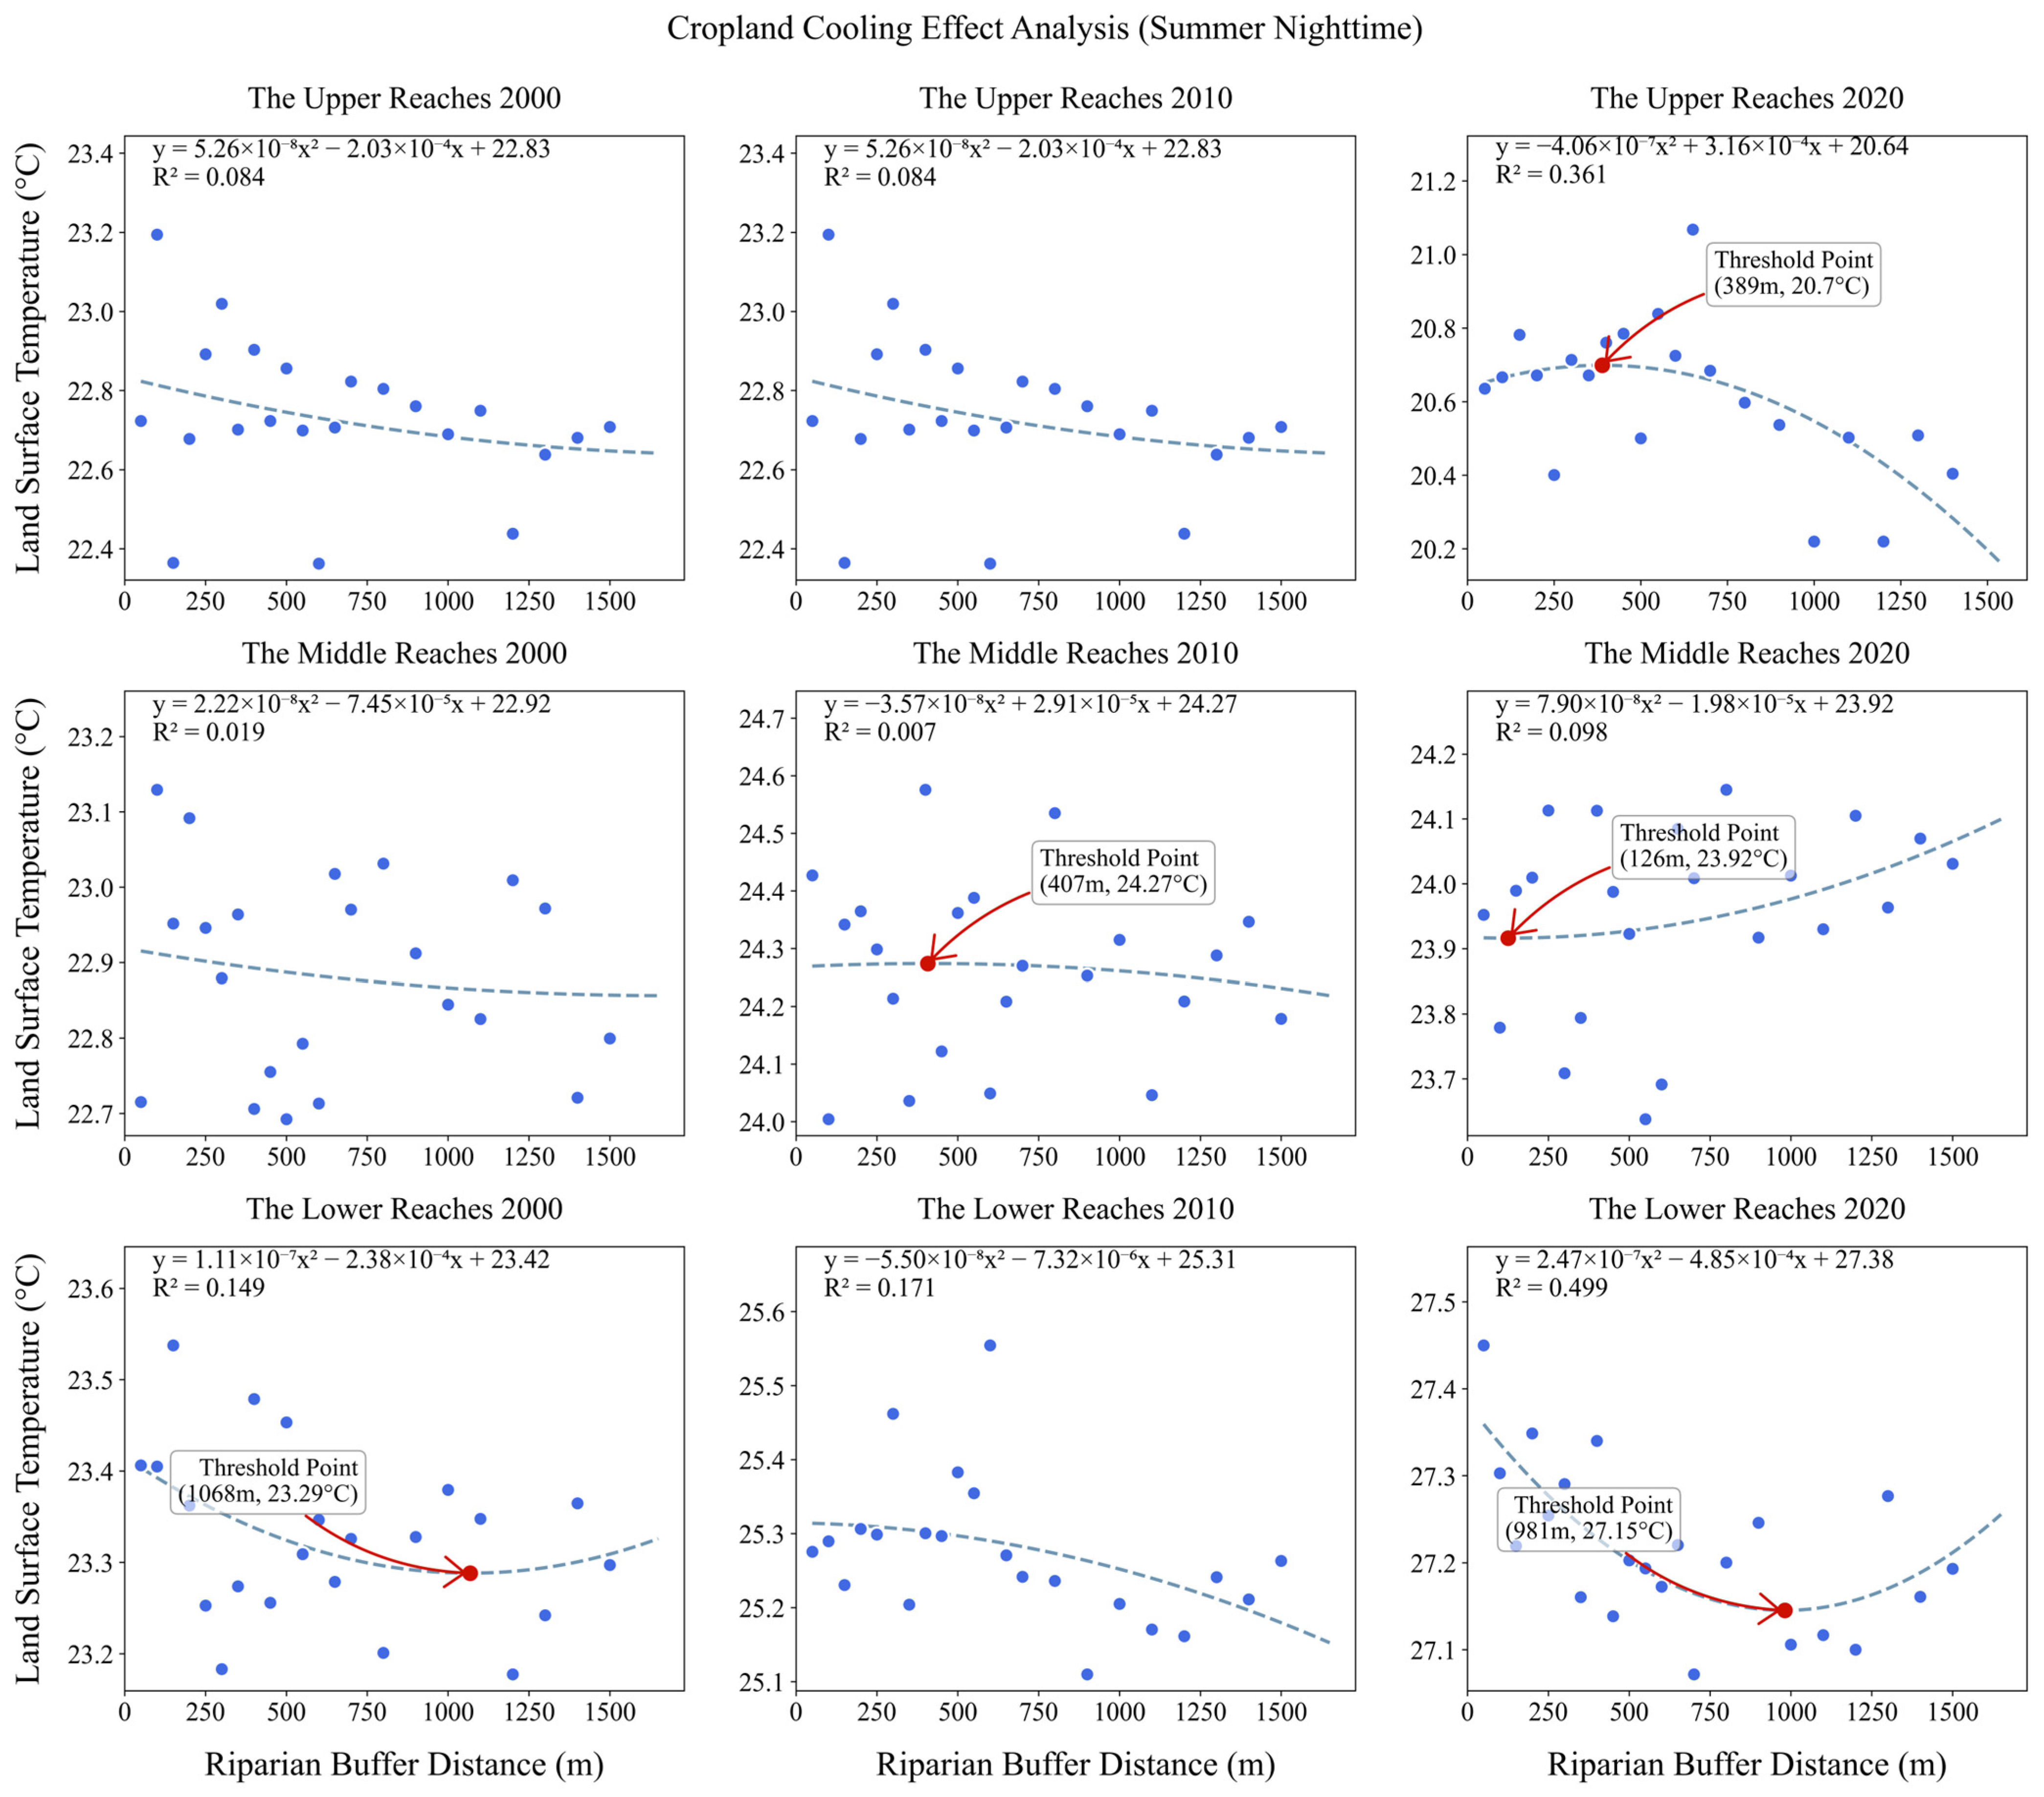
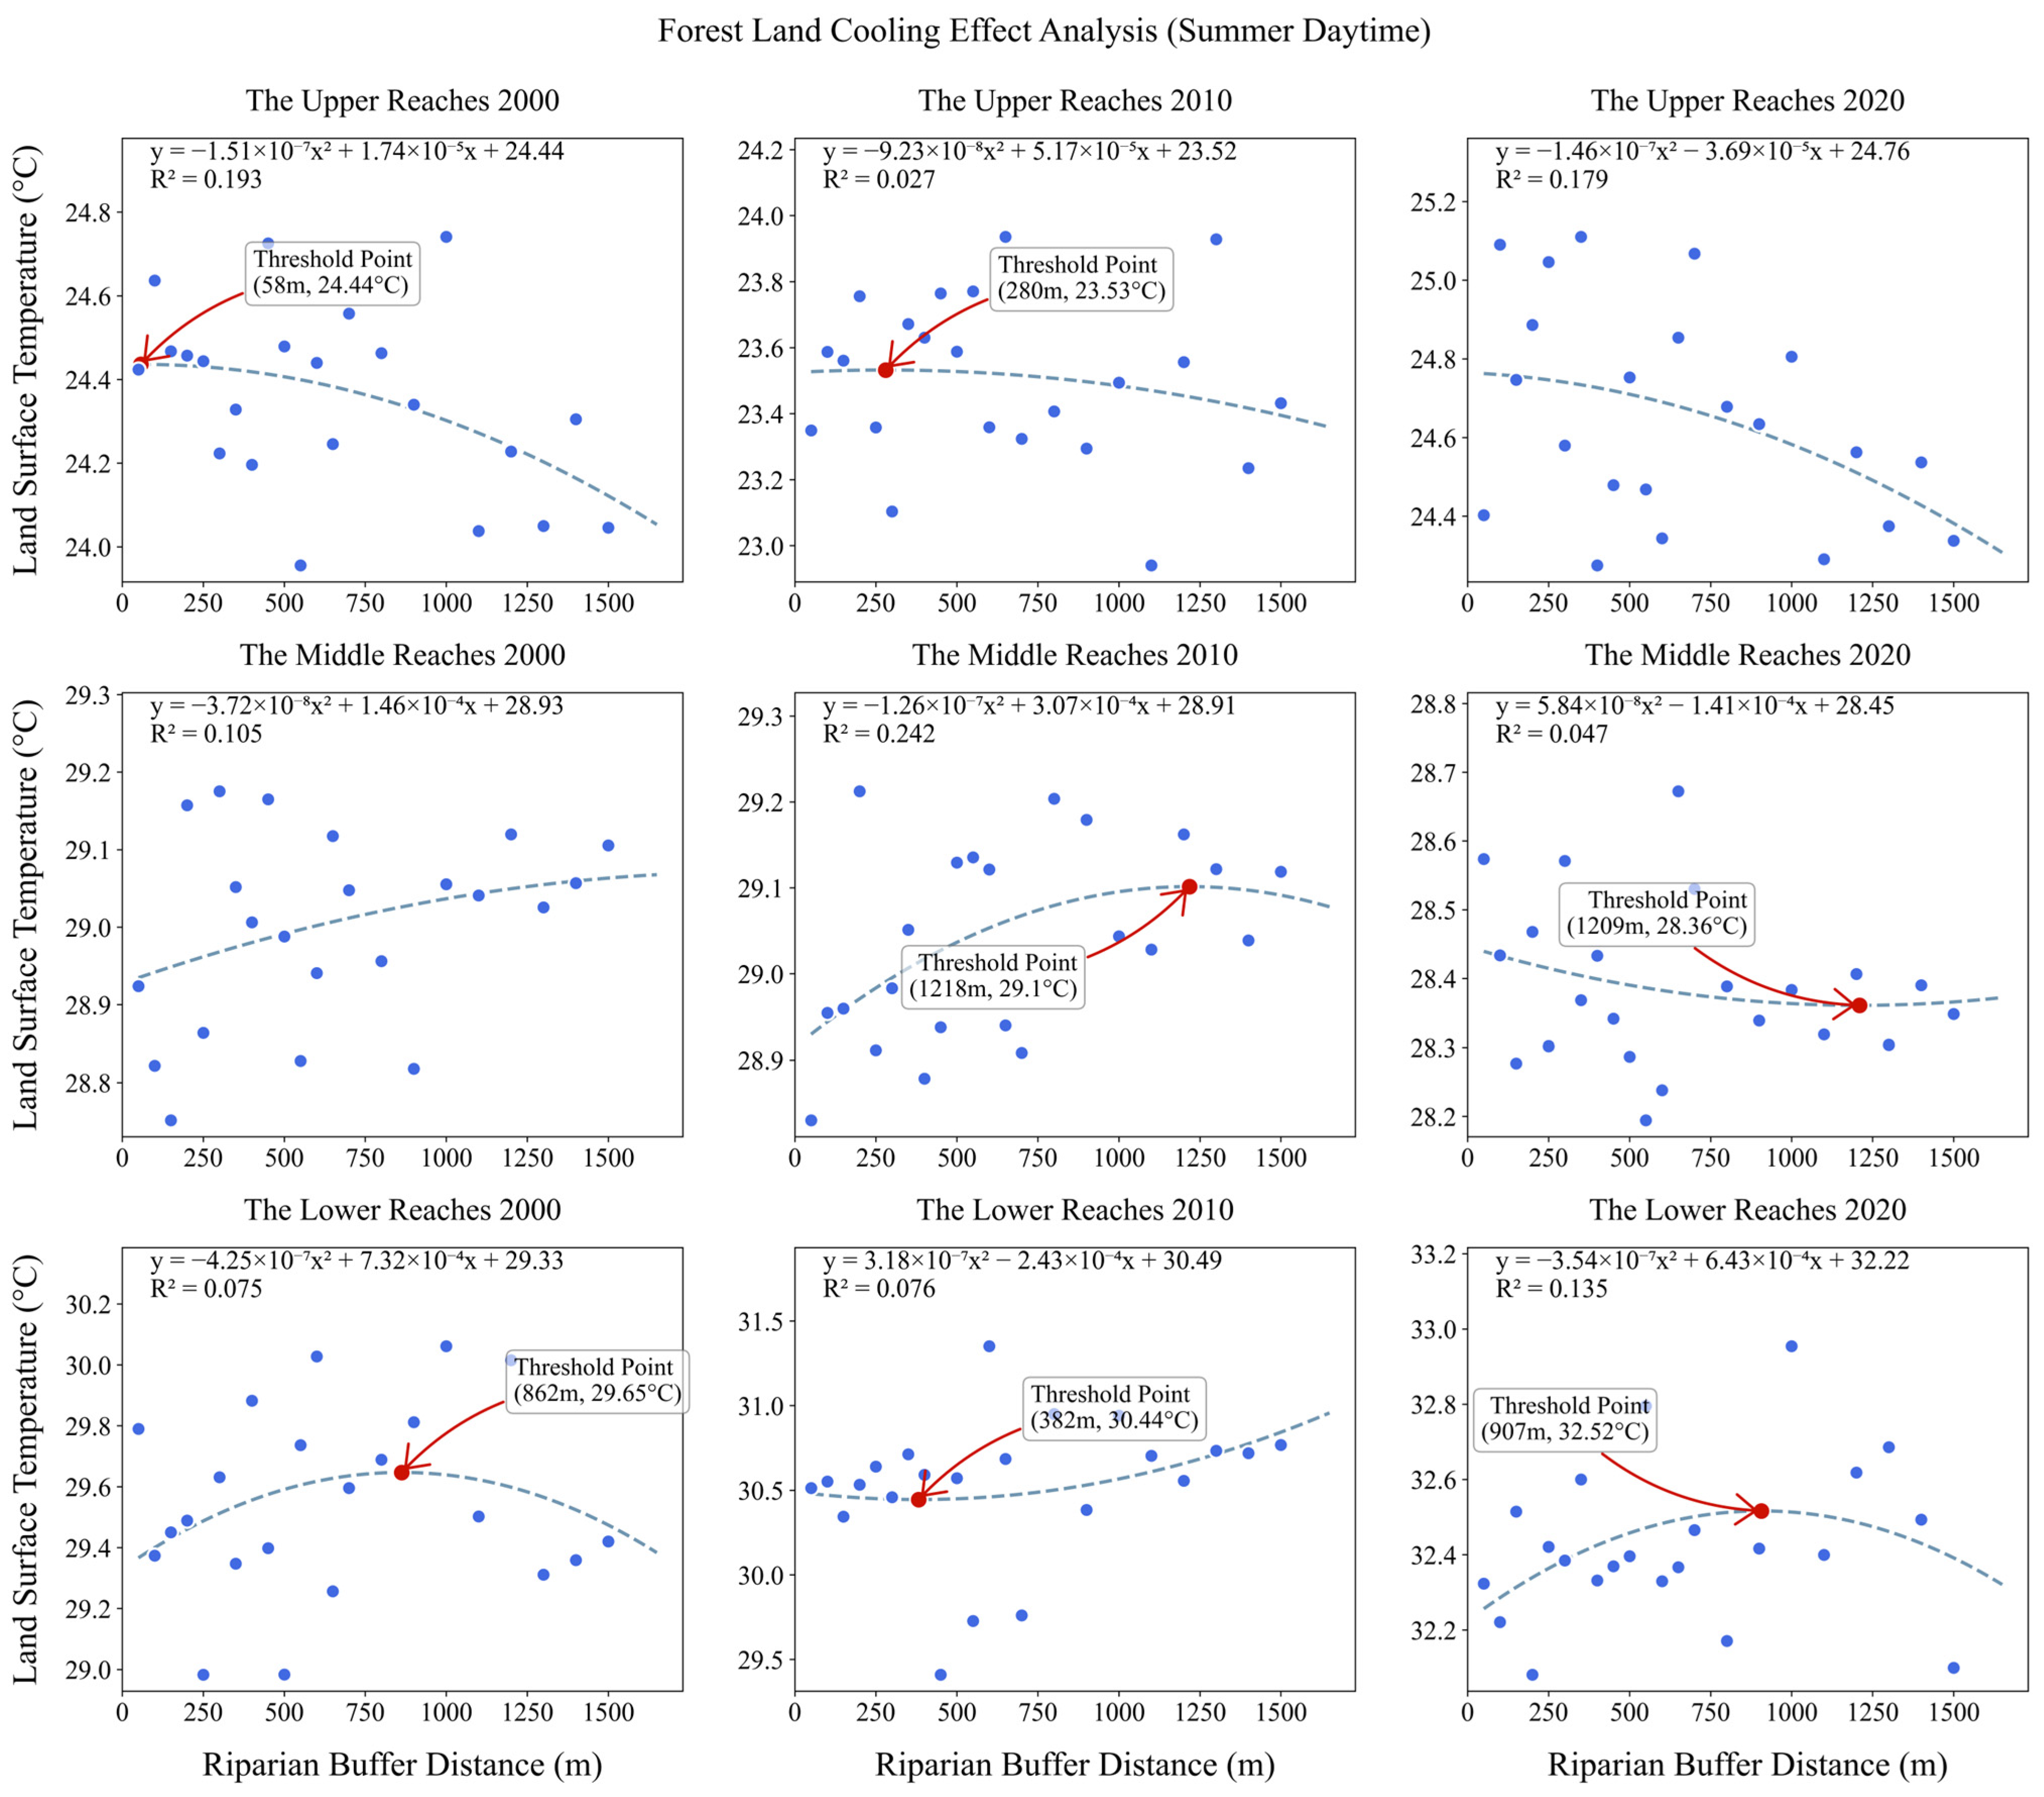
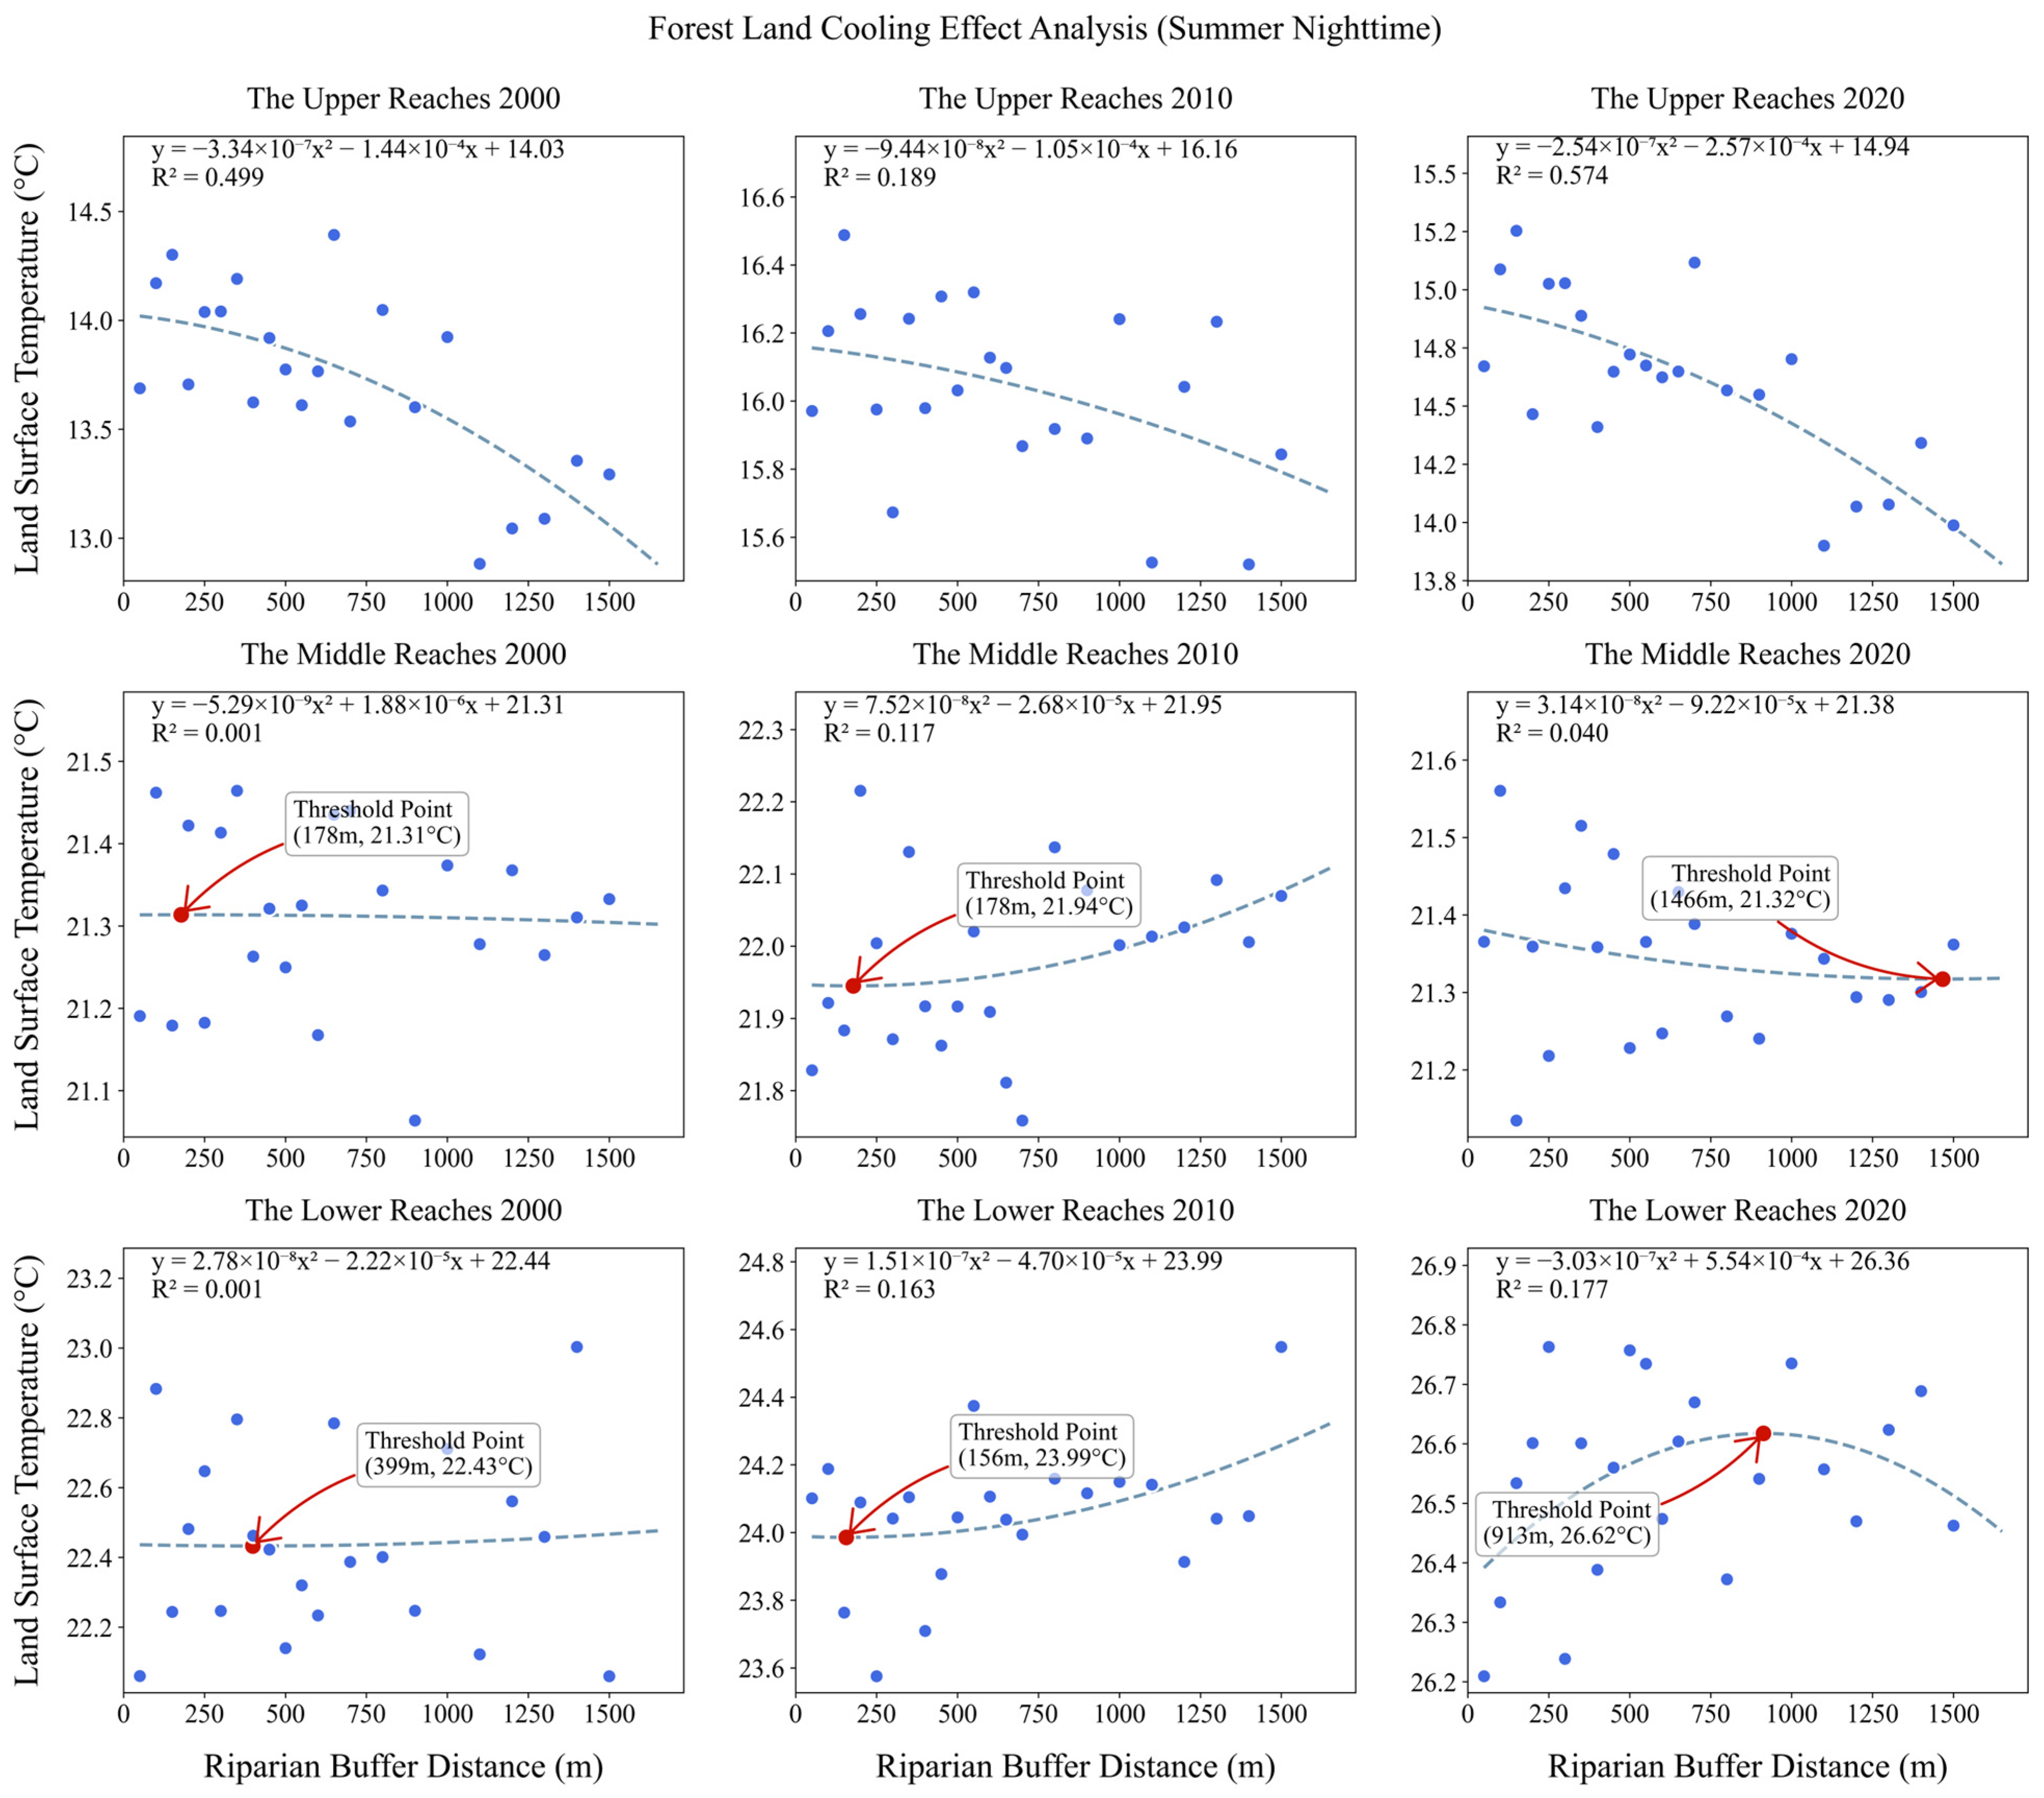
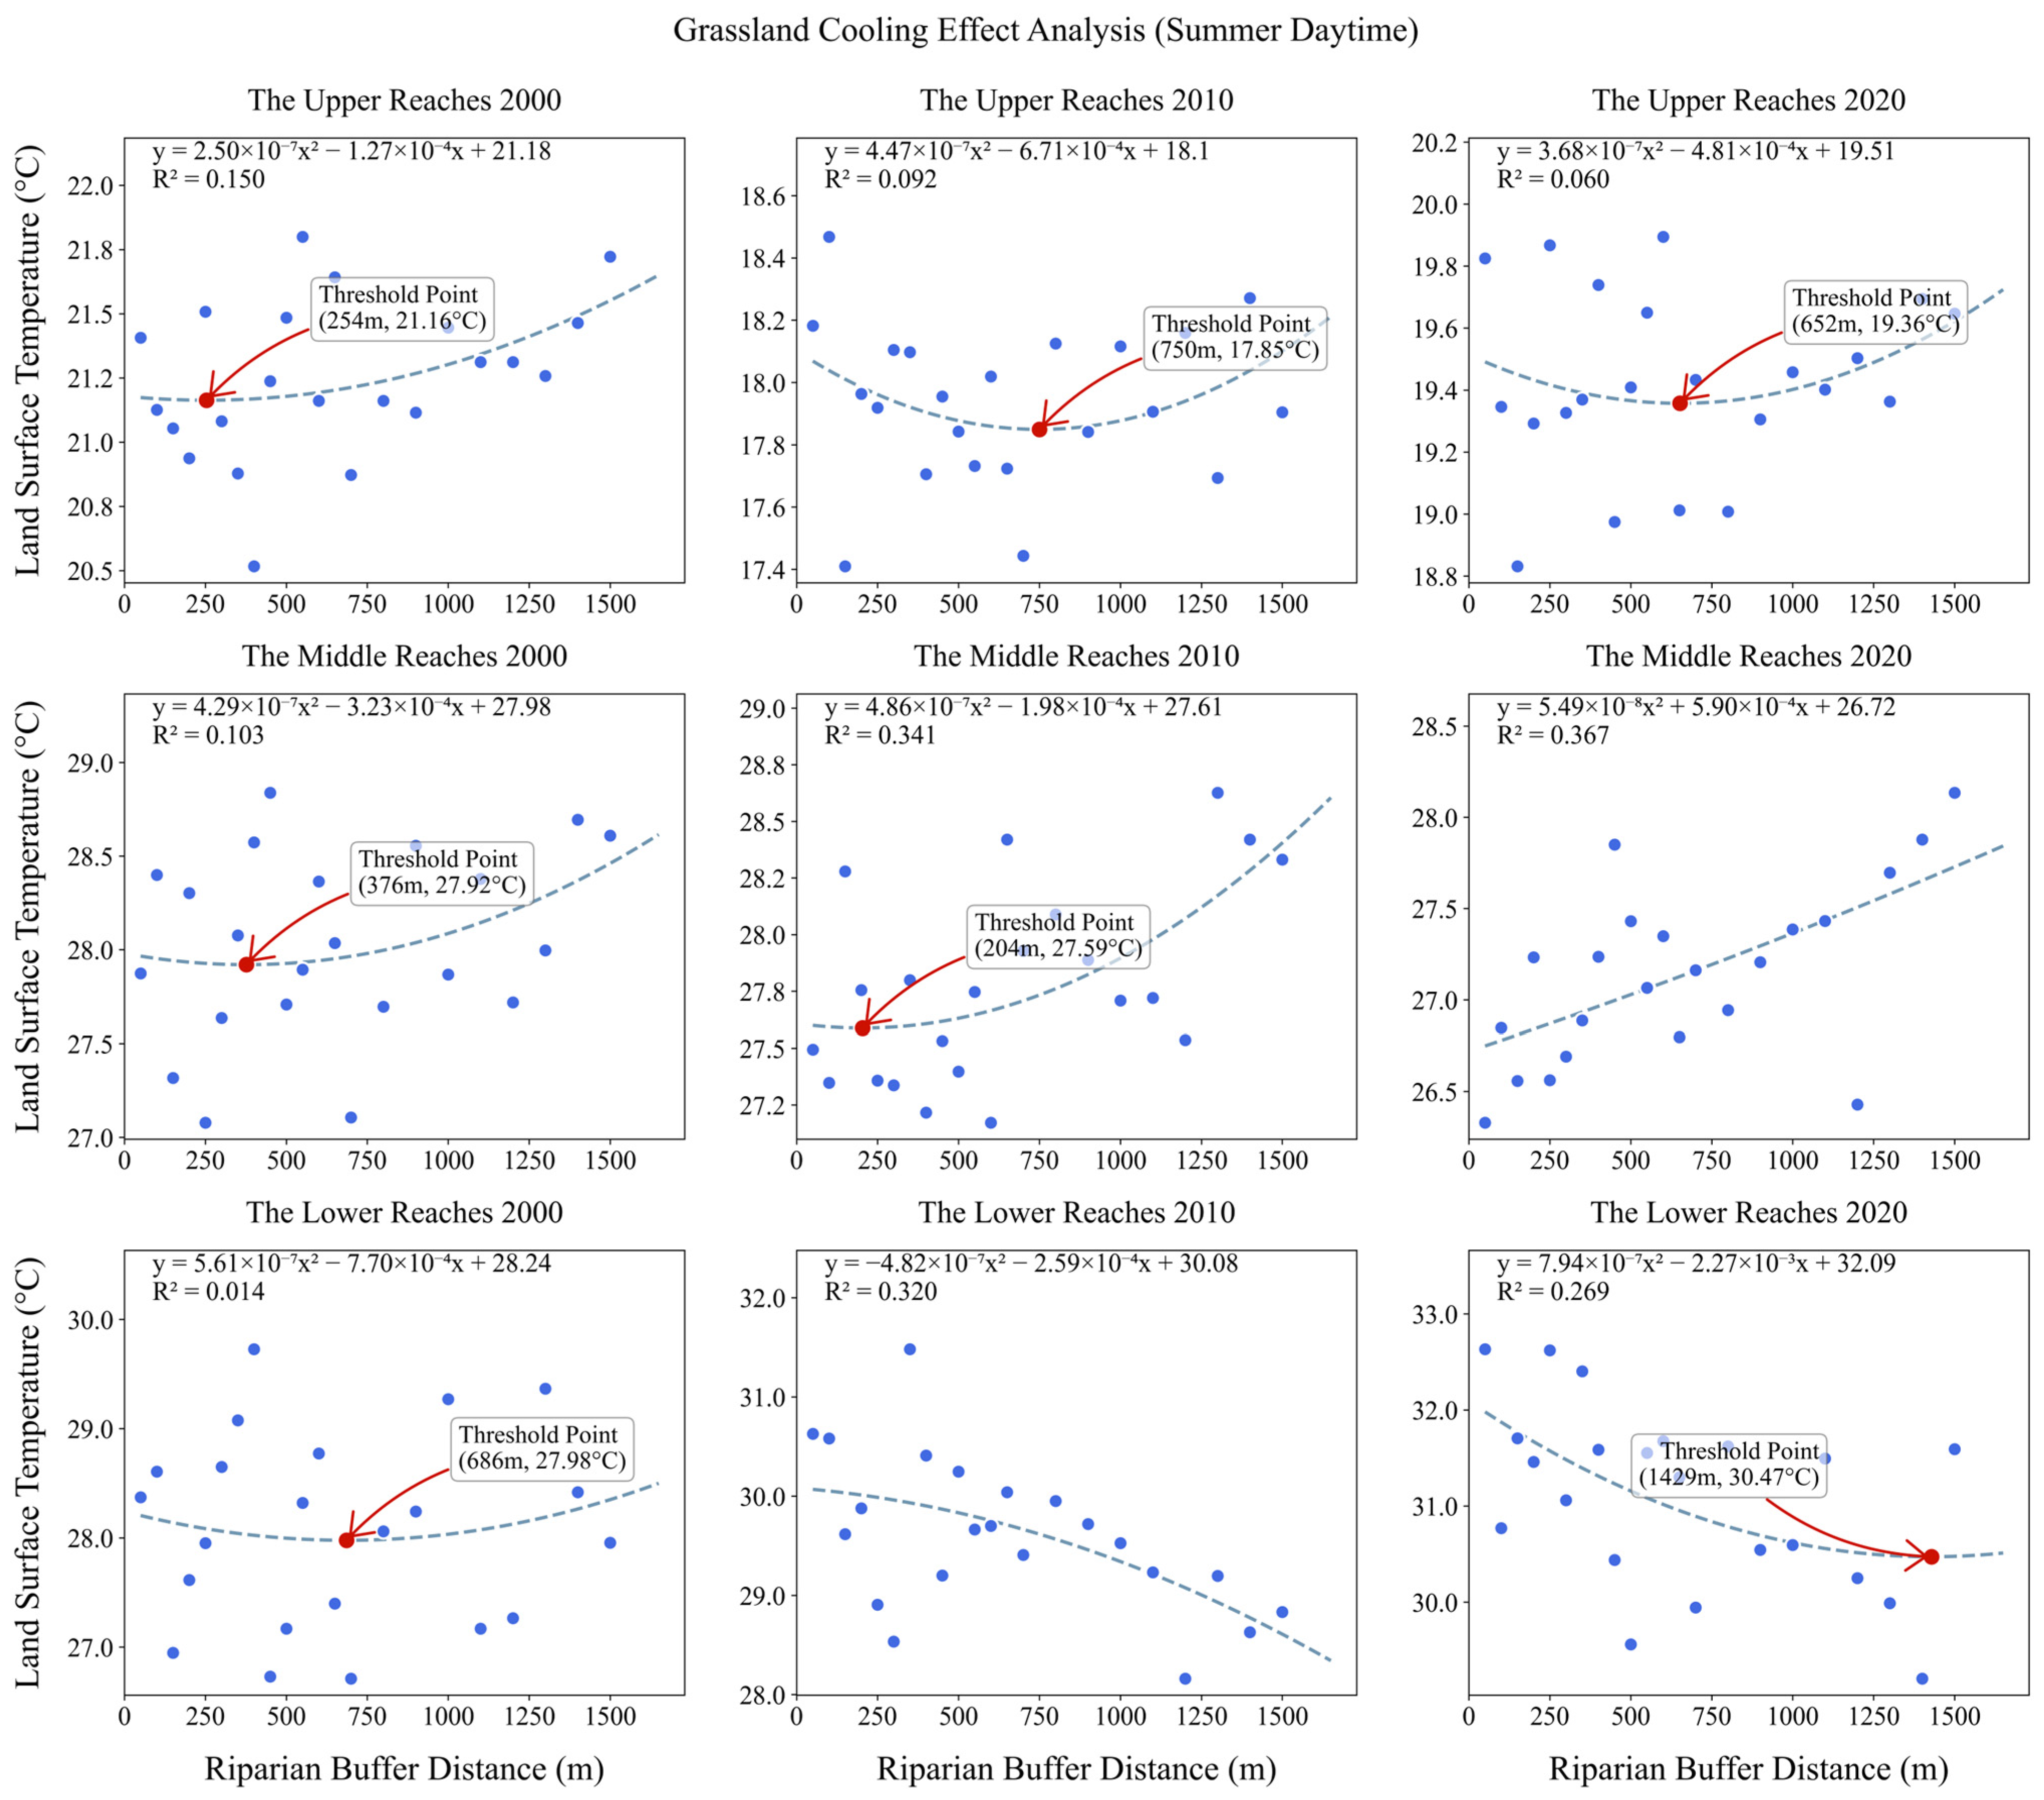
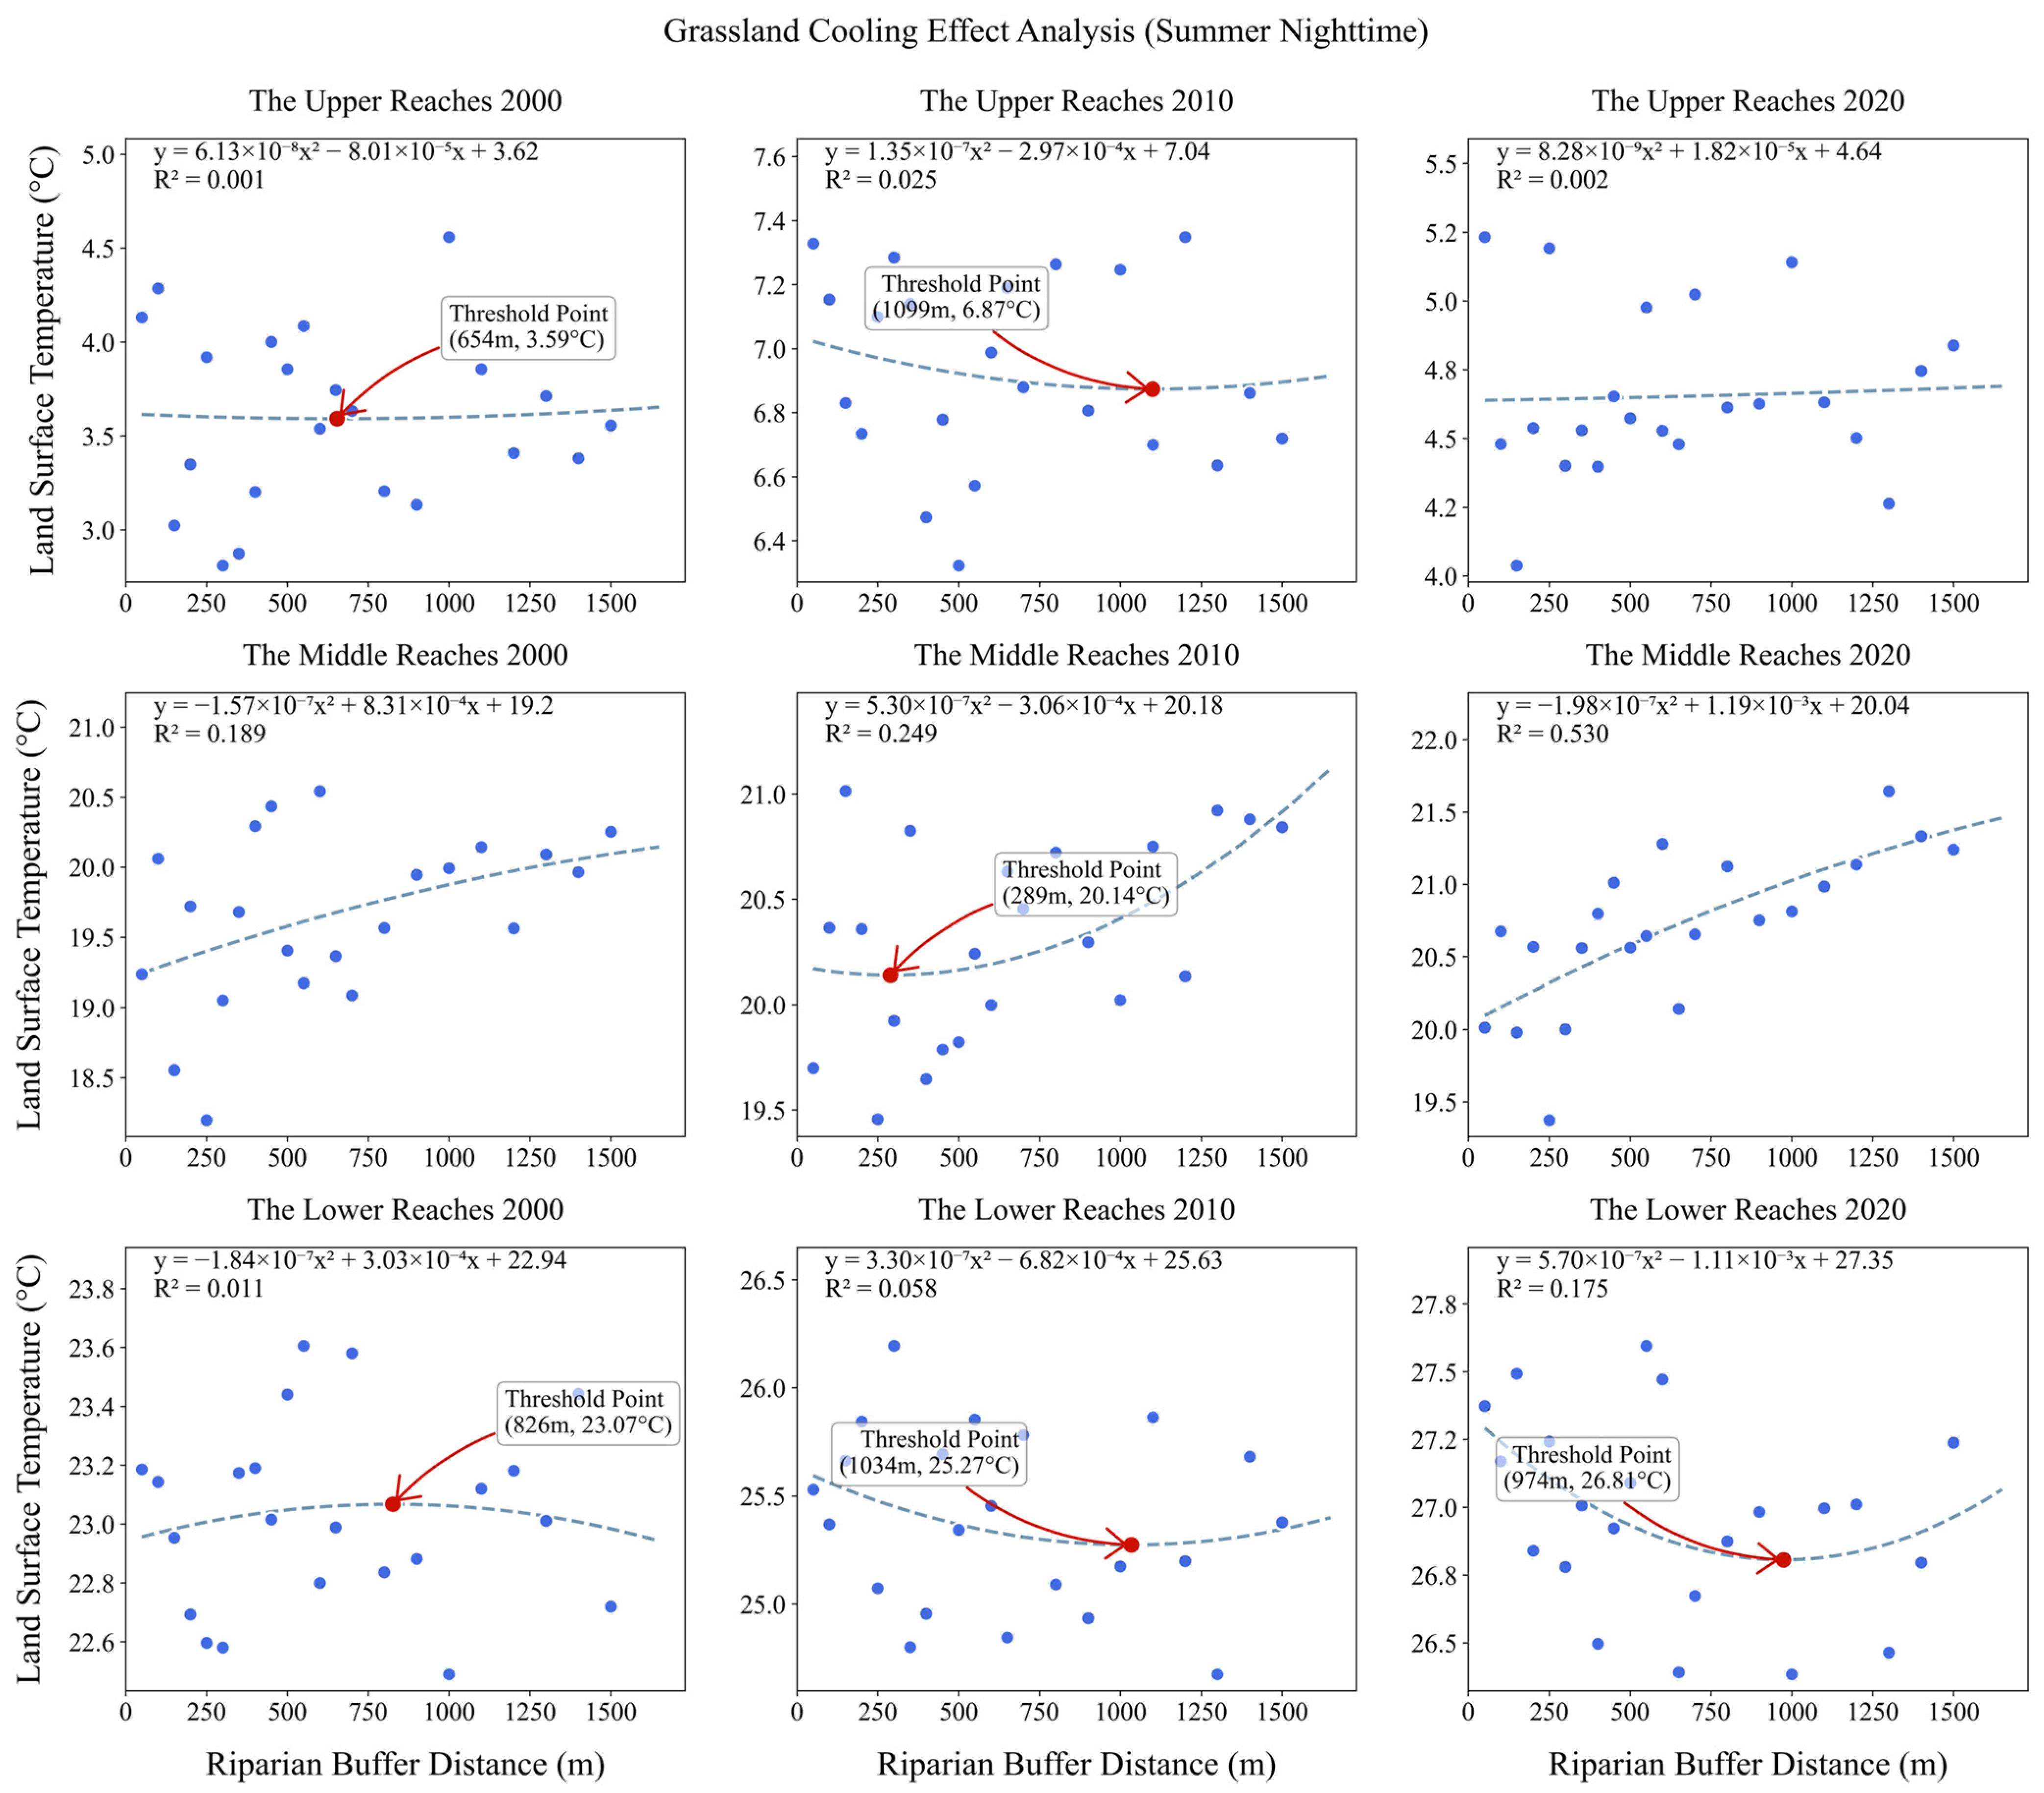
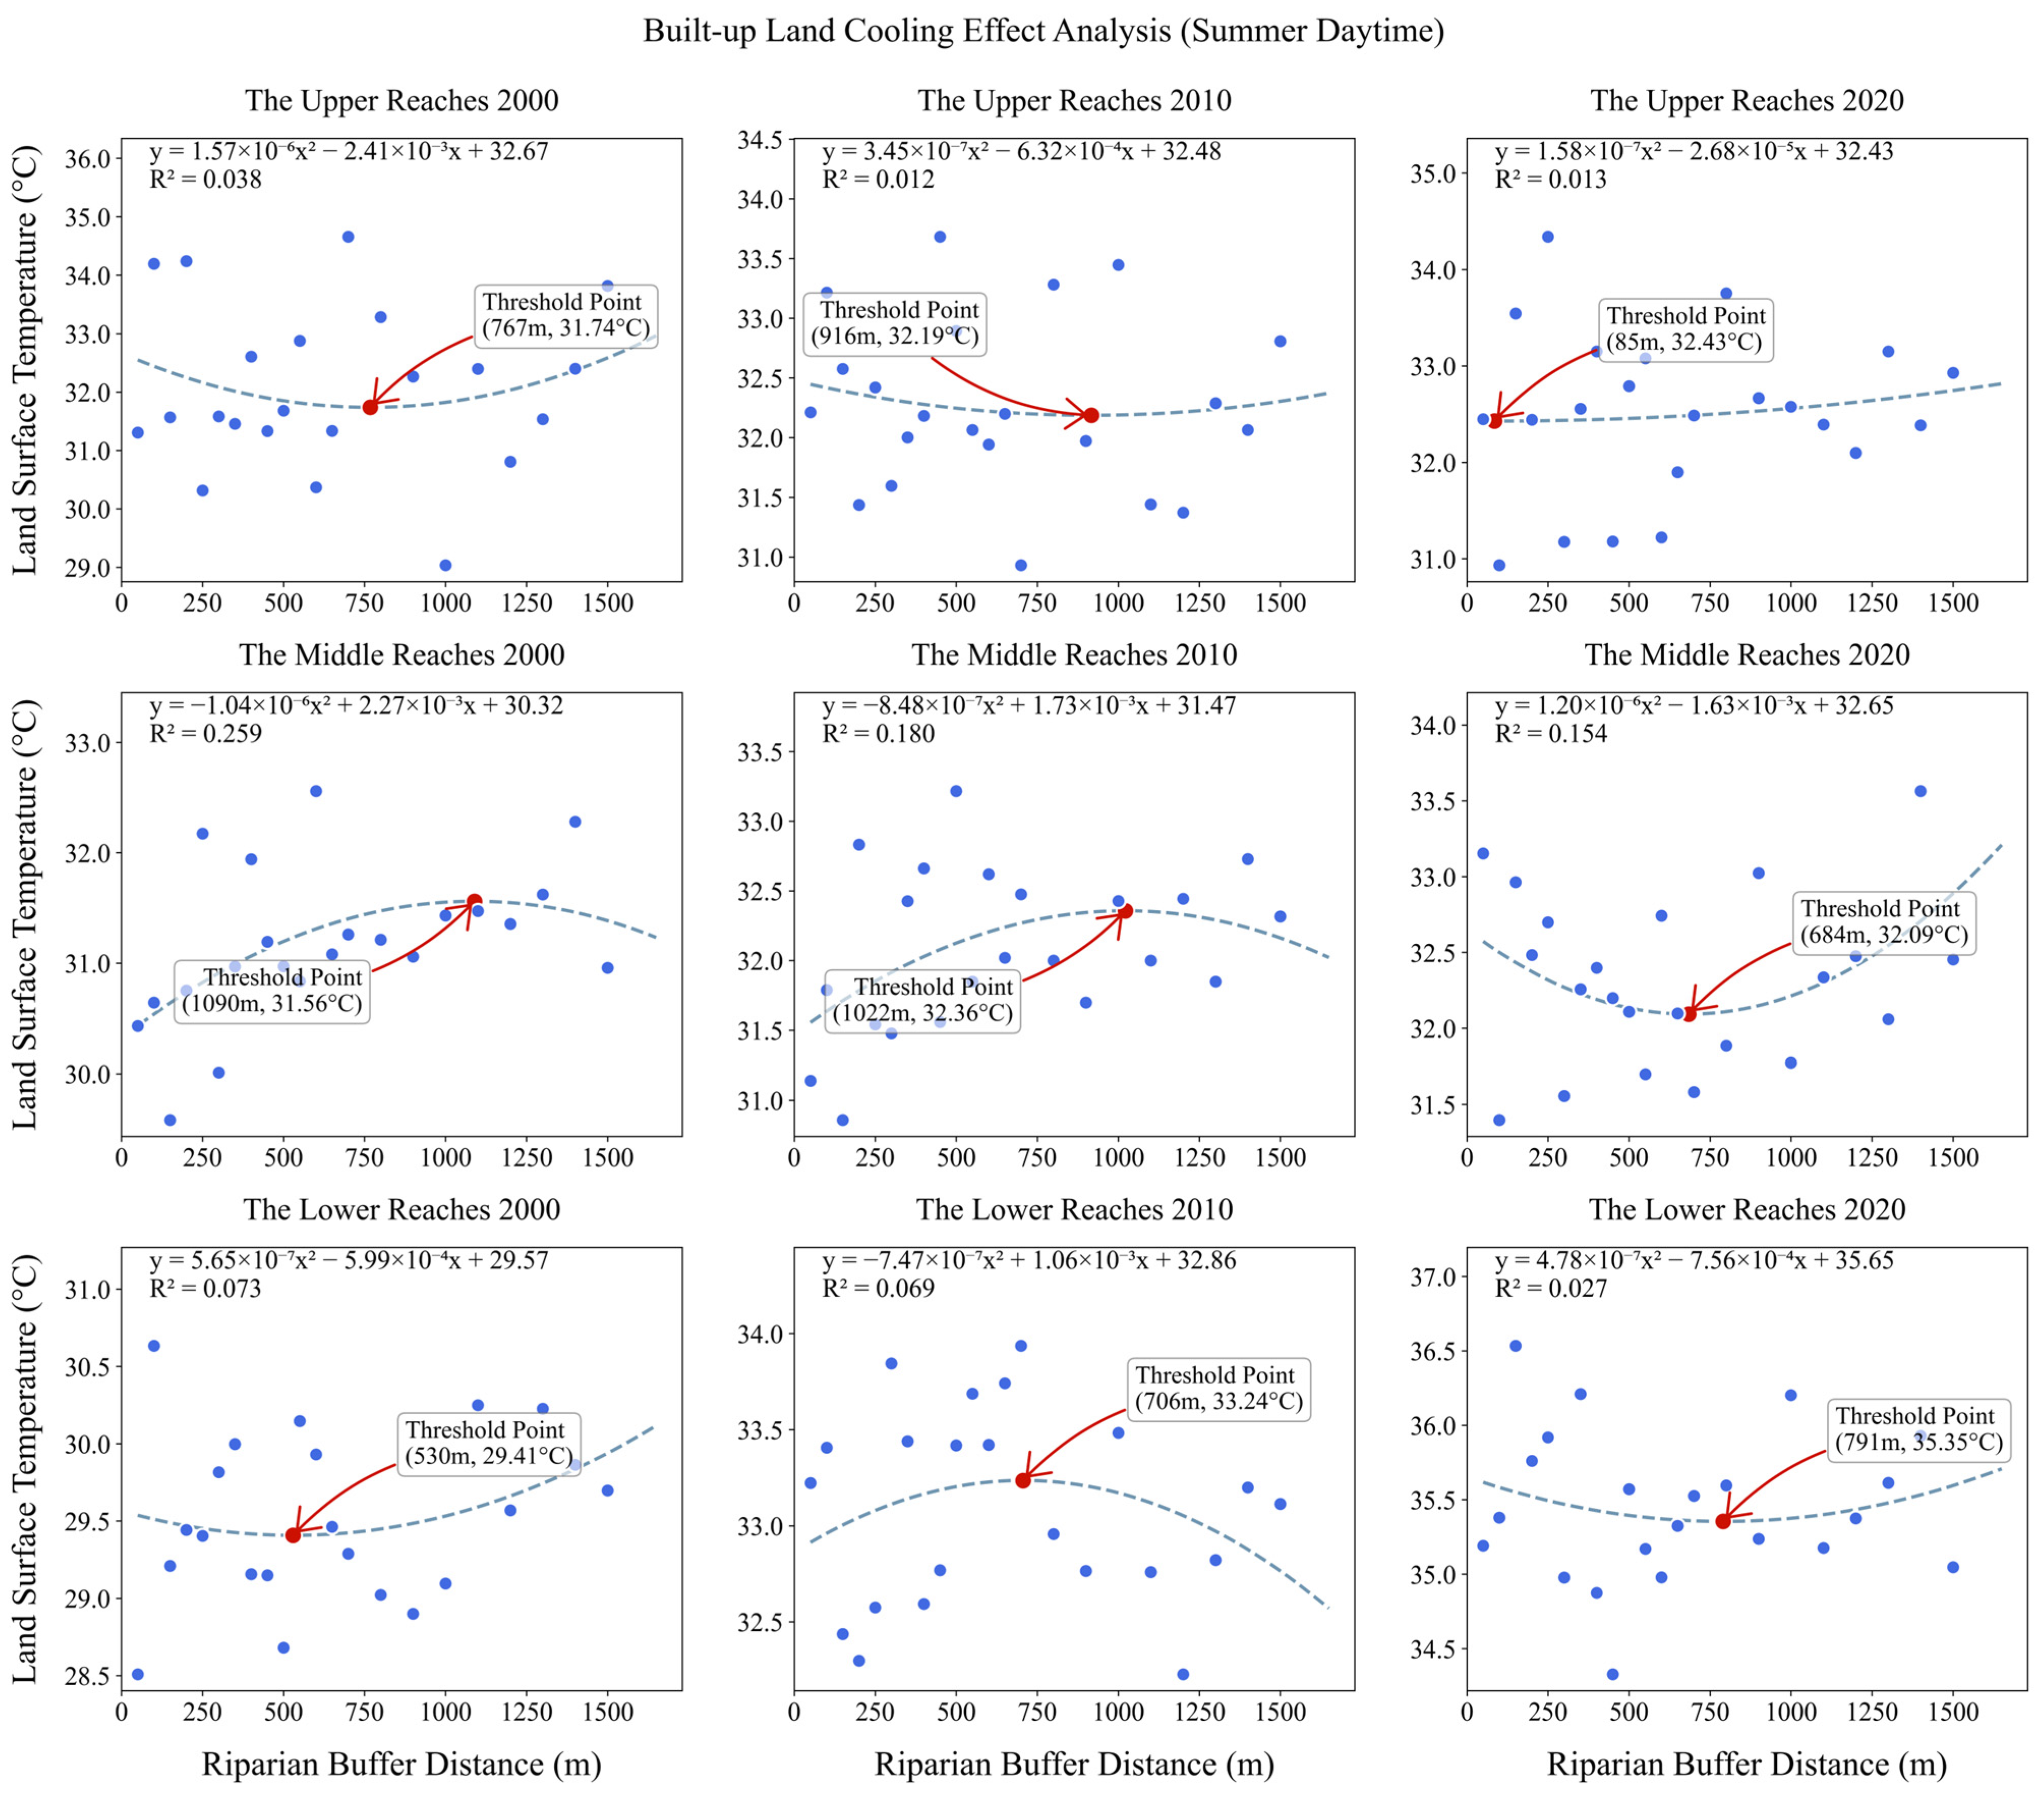
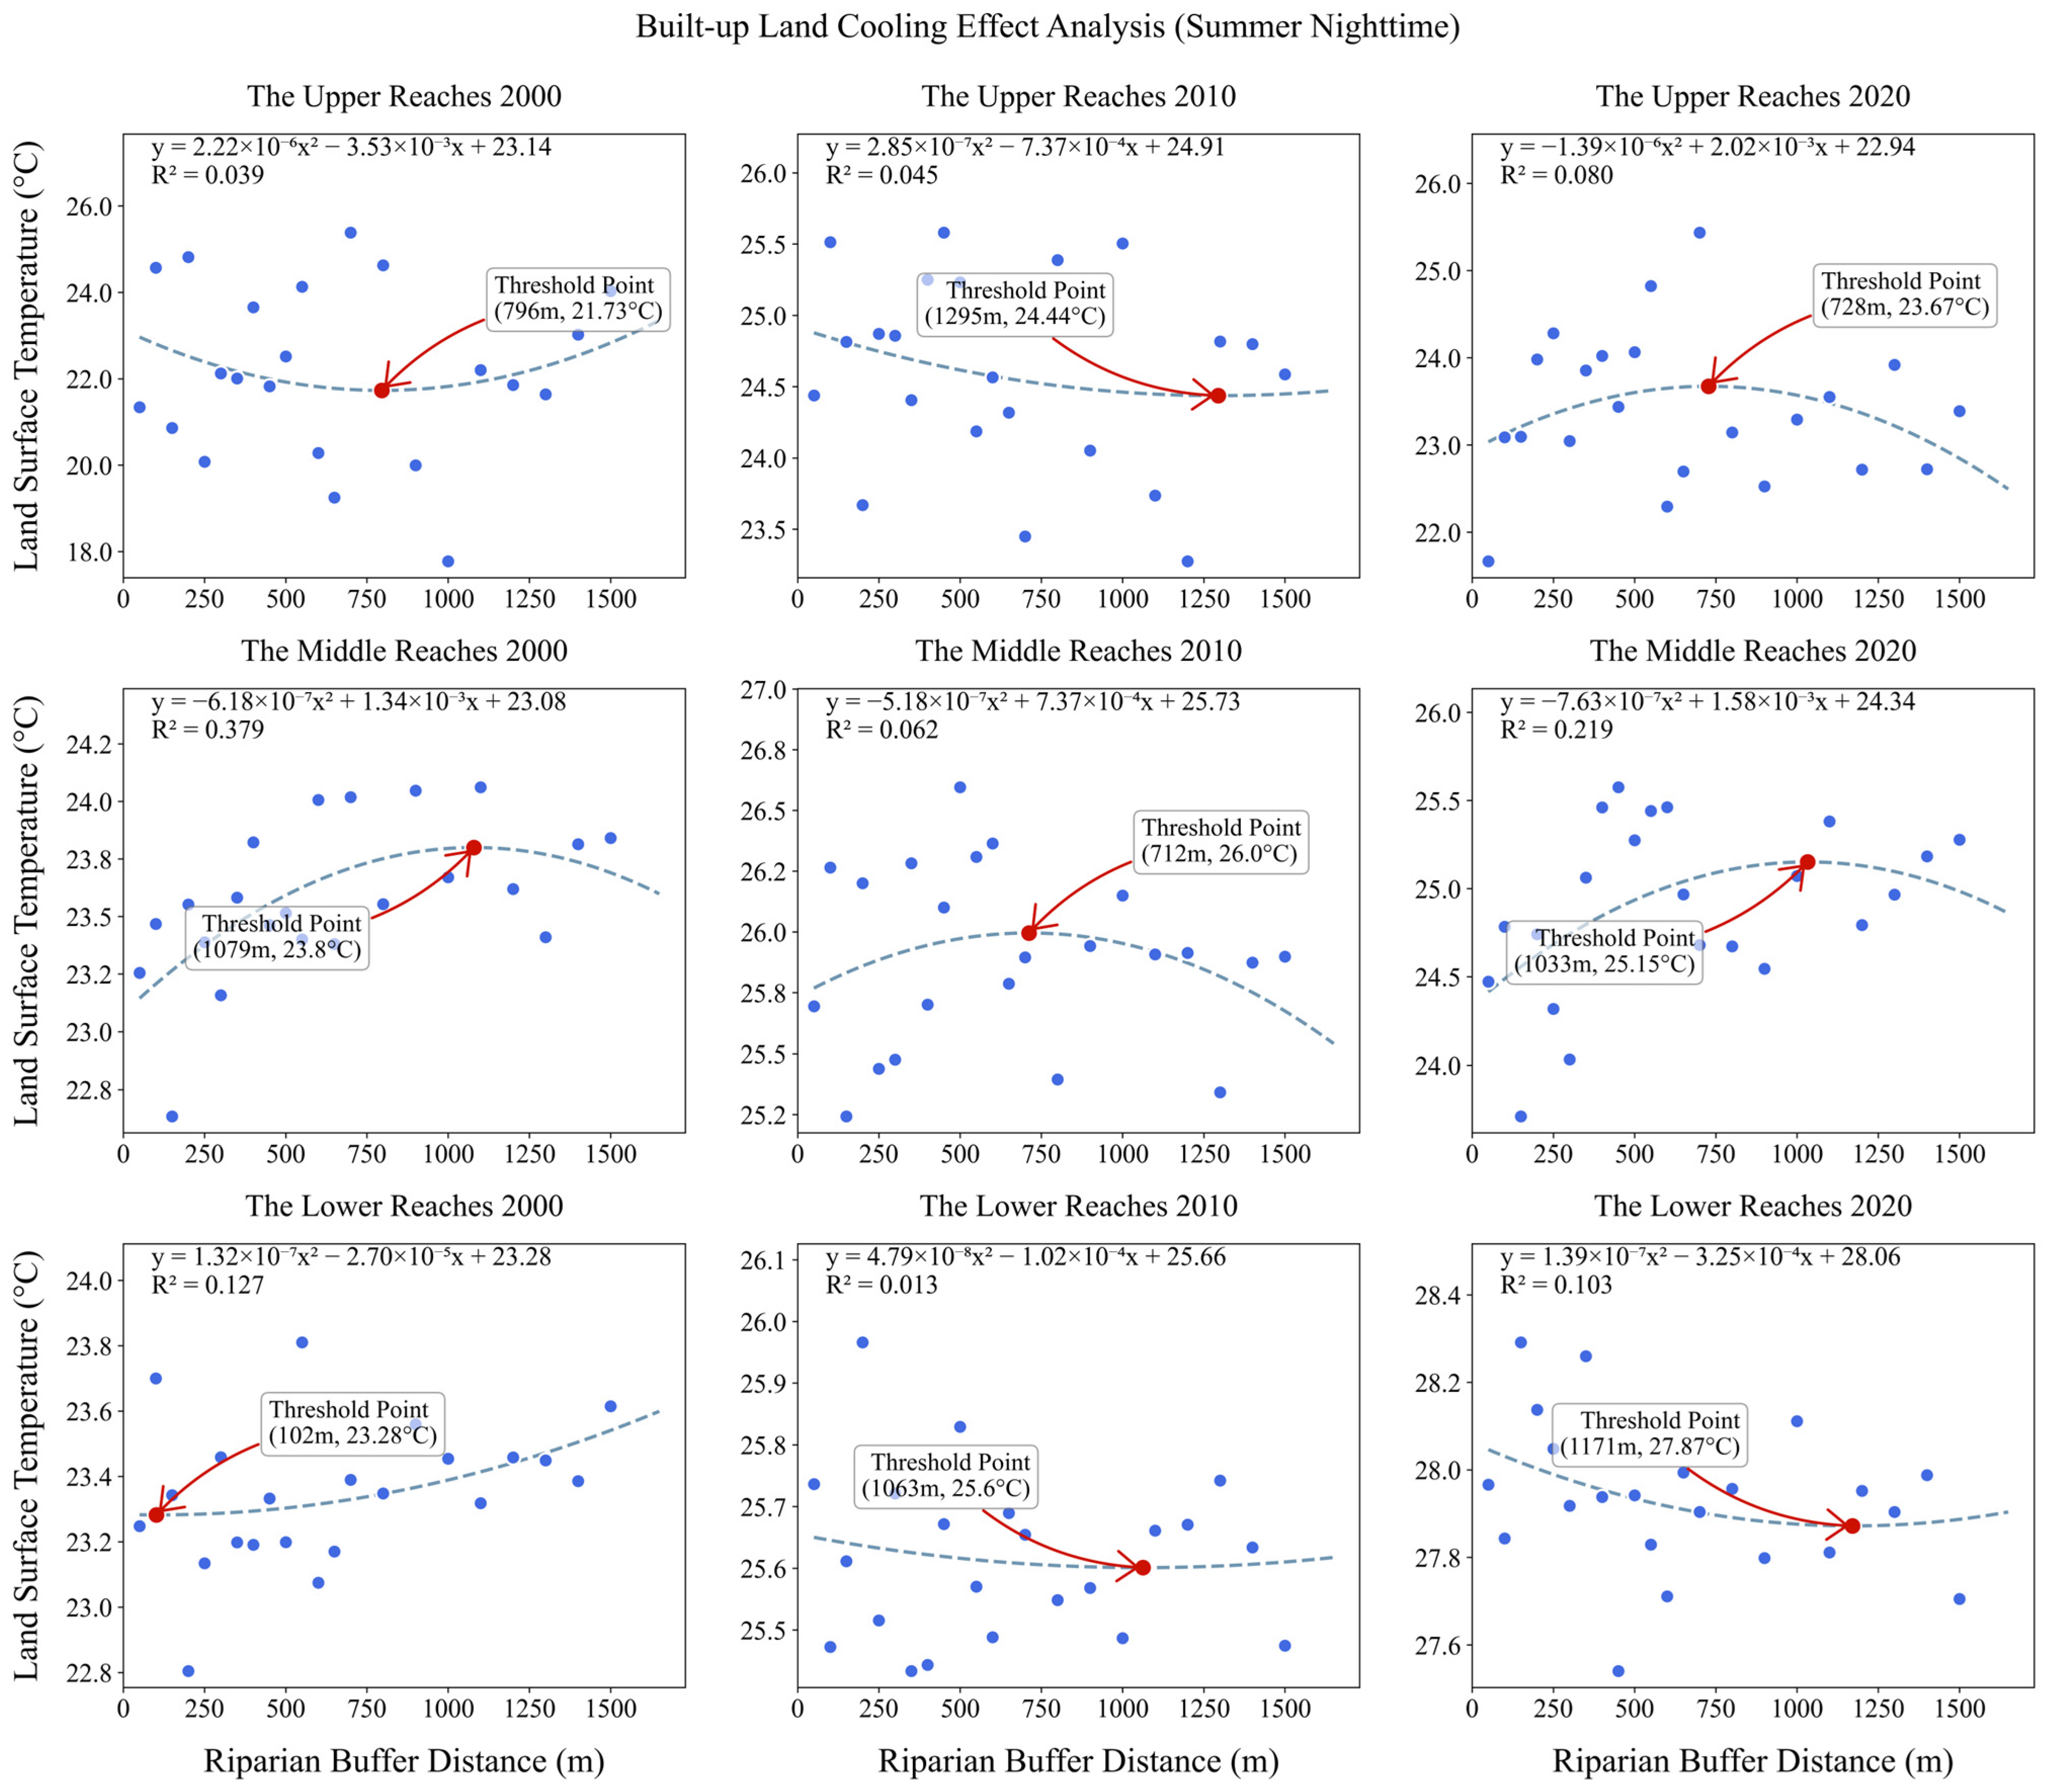
3.2. Cooling Effect Magnitude and Threshold Analysis

Based on MOD11A2 LST inversion data from 2000, 2010, and 2020, this study revealed significant land use-type specific differences in the thermal regulation effects of river ecosystems, with the summer mean LST generally showing a continuous upward trend over each decade. Specifically, cropland ecosystems exhibited a typical “steep rise–inflection point–sharp decline” triphasic cooling pattern: the daytime cooling intensity reached 0.48 °C at a 350 m buffer distance, decreasing to 0.28 °C at a 278-m buffer distance at night, closely correlated with the diurnal rhythm of crop transpiration. Yu et al. demonstrated that daytime evapotranspiration during growing seasons significantly exceeds the nighttime levels, showing a strong negative correlation with the daytime cooling magnitude [44]. This further confirms the linkage between cooling effects and crop transpiration rhythms. Forest ecosystems displayed a similar linear attenuation pattern, with the daytime threshold distance extending to 589 m (0.45 °C) and nighttime threshold distance shortening to 478 m (0.51 °C), attributed to the synergistic effects of canopy evapotranspiration and near-surface turbulent exchange. M. Breil et al. found that forest land regulates daytime temperature differences through enhanced hydrological cycles [45]. Its higher surface roughness enhances the turbulent mixing efficiency, jointly causing spatiotemporal variations in river cooling effects. Built-up land demonstrated a unique dual-intensity response whereby the threshold distance extended to approximately 485 m, with maximum daytime cooling intensity of 1.72 °C and nighttime cooling intensity decreasing to 1.43 °C, a difference linked to the spatiotemporal distribution of anthropogenic heat emissions and the thermal inertia of building materials. Zhang et al. observed significantly higher daytime LSTs in industrial zones versus other functional areas, coinciding with peak anthropogenic heat emissions [46]. Simultaneously, factors like the building density regulate cooling variations through material thermal inertia, ultimately causing slower nighttime cooling rates in urban areas than natural surfaces. Grassland ecosystems followed a dual-inflection N-shaped attenuation curve, with the primary daytime inflection point at 539 m (0.76 °C) shifting to 583 m (0.67 °C) at night, likely related to variations in herbaceous plant stomatal conductance and differences in near-surface roughness. Jing et al. confirmed that higher stomatal conductance in daytime enhances transpiration cooling for grasses [47]. Diurnal variations in the morphological indicators alter the near-surface roughness, consequently affecting heat dispersion ranges.
Based on gradient analysis of multi-temporal remote sensing data, the cooling effect of rivers exhibited significant spatial heterogeneity across the upper, middle, and lower reaches of the basin (Figure 7, Figure 8, Figure 9, Figure 10, Figure 11, Figure 12, Figure 13 and Figure 14). In the upper reaches, the cooling effect of built-up land was most prominent, with the daytime cooling intensity reaching 2.24 °C within 417 m and nighttime cooling intensity peaking at 2.98 °C within 567 m, the highest values across the entire basin, forming a stark diurnal contrast. Grassland displayed the weakest cooling intensity: 0.25 °C (367 m) during the daytime and 0.15 °C at night. However, its nighttime cooling distance (700 m) was the largest in the upper reaches. Cropland exhibited the shortest nighttime cooling distance in the upper reaches (233 m), with an intensity of 0.46 °C. In the middle reaches, grassland demonstrated the strongest cooling effect, with a daytime cooling distance of 1033 m (1.30 °C), the largest in the basin. Conversely, forest land had the shortest nighttime cooling distance (167 m/0.28 °C) across the entire basin. Built-up land exhibited the maximum daytime cooling intensity (1.54 °C/783 m), serving as the core cold source in the middle reaches. In contrast, the cropland nighttime cooling intensity (0.25 °C/383 m) represented the minimum value for the middle reaches. In the lower reaches, cropland exhibited the weakest cooling efficiency across the basin: daytime cooling distance was the shortest (0.59 °C/167 m), and nighttime cooling intensity was the lowest (0.14 °C/217 m). However, forest land nighttime cooling distance ranked second in the basin (1000 m/0.65 °C), while built-up land daytime cooling intensity (1.39 °C/267 m) was the highest in the lower reaches.
The three major urban agglomerations in the Yangtze River Basin exhibited cooling effects from surface cover similar to the basin-scale patterns, showing significant spatial differentiation characteristics (Figures S5–S12). In the Chengdu–Chongqing urban agglomeration, the nighttime cooling effects were pronounced. Cropland exhibited the weakest nighttime cooling intensity (0.23 °C) and shortest cooling distance (250 m) within the agglomeration, while grassland displayed the maximum nighttime cooling intensity (2.05 °C). Forest land demonstrated the second-largest nighttime cooling distance (867 m/0.65 °C) in the agglomeration. In the middle reaches urban agglomeration, grassland exhibited the strongest nighttime cooling effect, with the largest nighttime cooling distance (917 m) and maximum nighttime cooling intensity (1.52 °C) within the agglomeration. Grassland cooling distance displayed pronounced diurnal variation, with the shortest daytime cooling distance (1.22 °C/317 m) observed in the middle reaches region. The Yangtze River Delta urban agglomeration displayed the weakest cooling effects, particularly in cropland (0.12 °C/233 m) and forest land (0.43 °C/150 m) at night. Grassland exhibited the strongest daytime cooling intensity (1.22 °C/317 m) in the lower reaches urban agglomeration, while its nighttime cooling distance (0.8 °C/550 m) was the shortest in the region.

3.3. Analysis of the Cooling Effect Mechanisms

The GeoDetector model emphasizes the hierarchical and heterogeneous nature of spatial attributes. Consequently, when applying this model for analysis, both the response variables and driving variables require discretization of the input data. The discretization processes and results for continuous variables in 2000, 2010, and 2020 are detailed in the Supplementary Materials (Figures S13–S15).

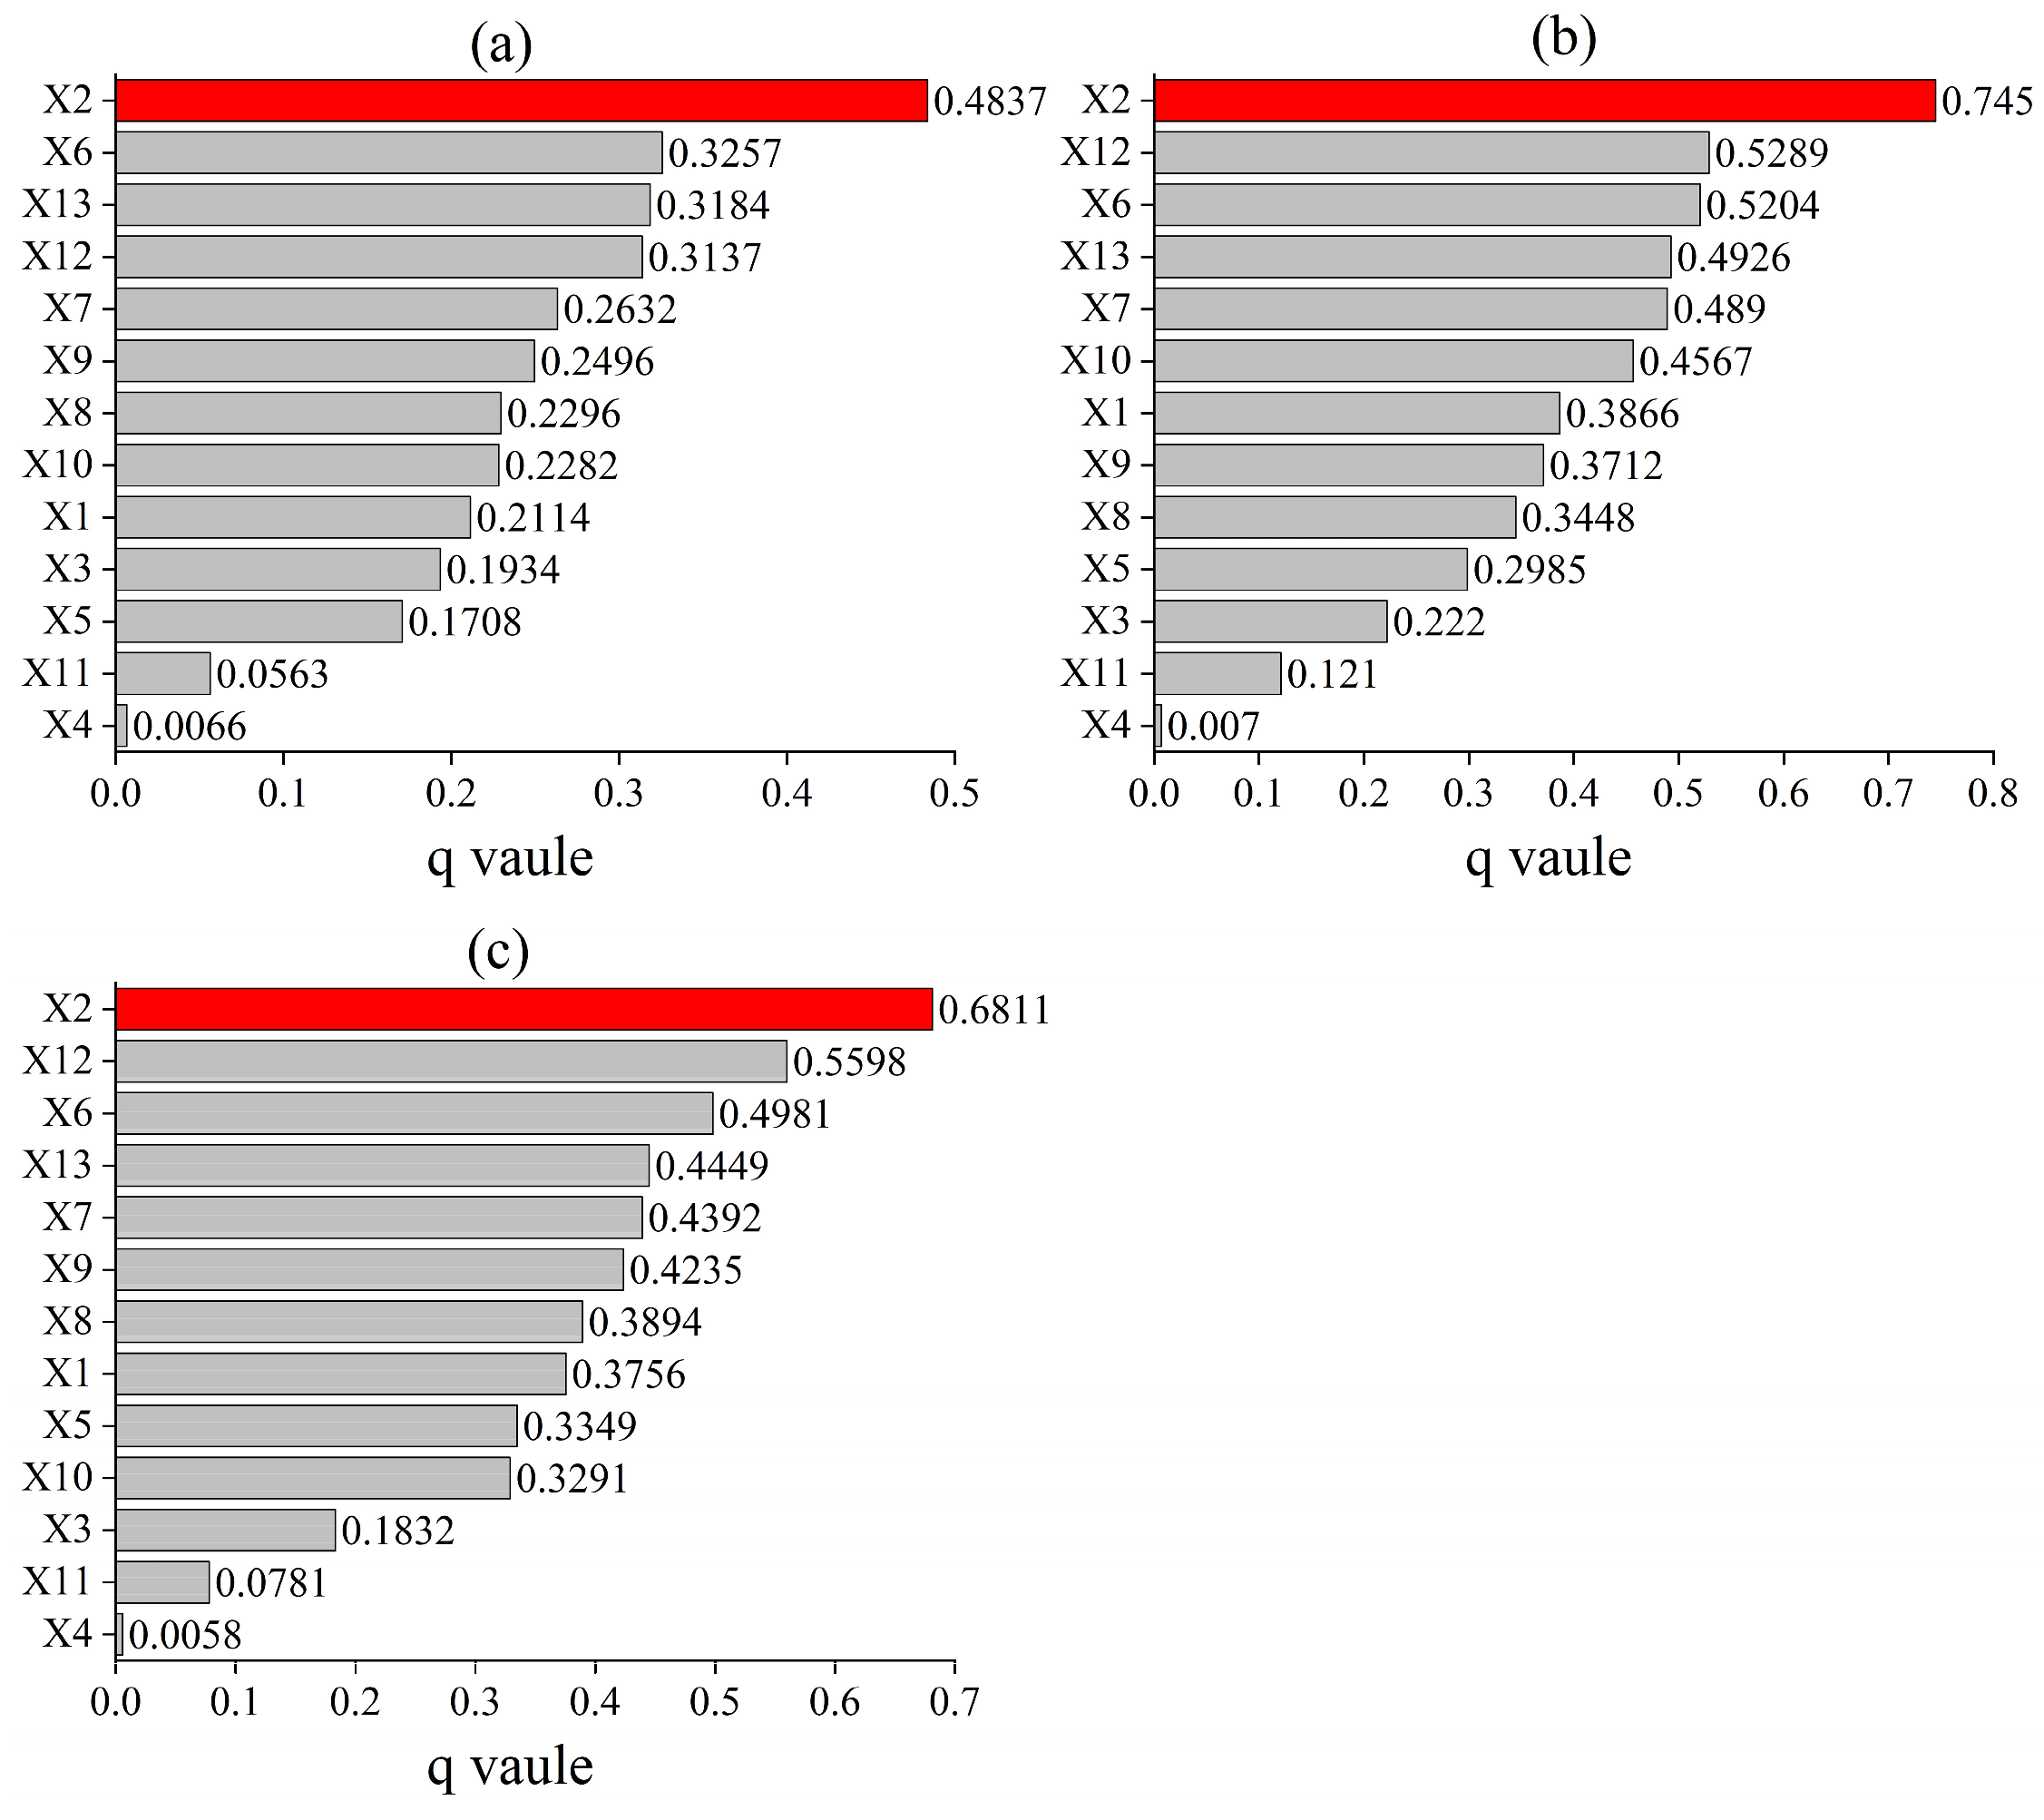
3.3.1. Single-Factor Detection

As shown in Figure 15, each of the influencing factors selected in this paper had varying degrees of influence on the cooling effect of rivers in the Yangtze River Basin. In 2000, the order of the explanatory power (q-value) of each influencing factor for the LST in the study area was elevation > soil type > humidity > wind speed > population density > per capita secondary industry output > per capita primary industry output > per capita tertiary industry output > basin area > slope > land use type > normalized difference vegetation index (NDVI) > aspect. In 2010, the explanatory power of each factor showed a systematic increase. Among them, the increases in the q-values of elevation, population density, per capita tertiary industry output, and wind speed were particularly significant (Δq > 0.2). In 2020, elevation remained the most important driving factor, with a q-value of 0.6811, followed by wind speed and soil type, while the NDVI and slope aspect were weak influencing factors.
Overall, elevation consistently exhibited the highest explanatory power across all three years, confirming its dominance in LST regulation. The explanatory power of the slope aspect was the weakest compared with that of the other factors, followed by the NDVI, and its explanatory power did not fluctuate significantly with the increase of the years. Notably, the q-values for elevation, population density, soil type, wind speed, and per capita secondary industry output increased significantly over the study period, indicating that both natural and socioeconomic factors increasingly influenced the LST in the Yangtze River Basin.

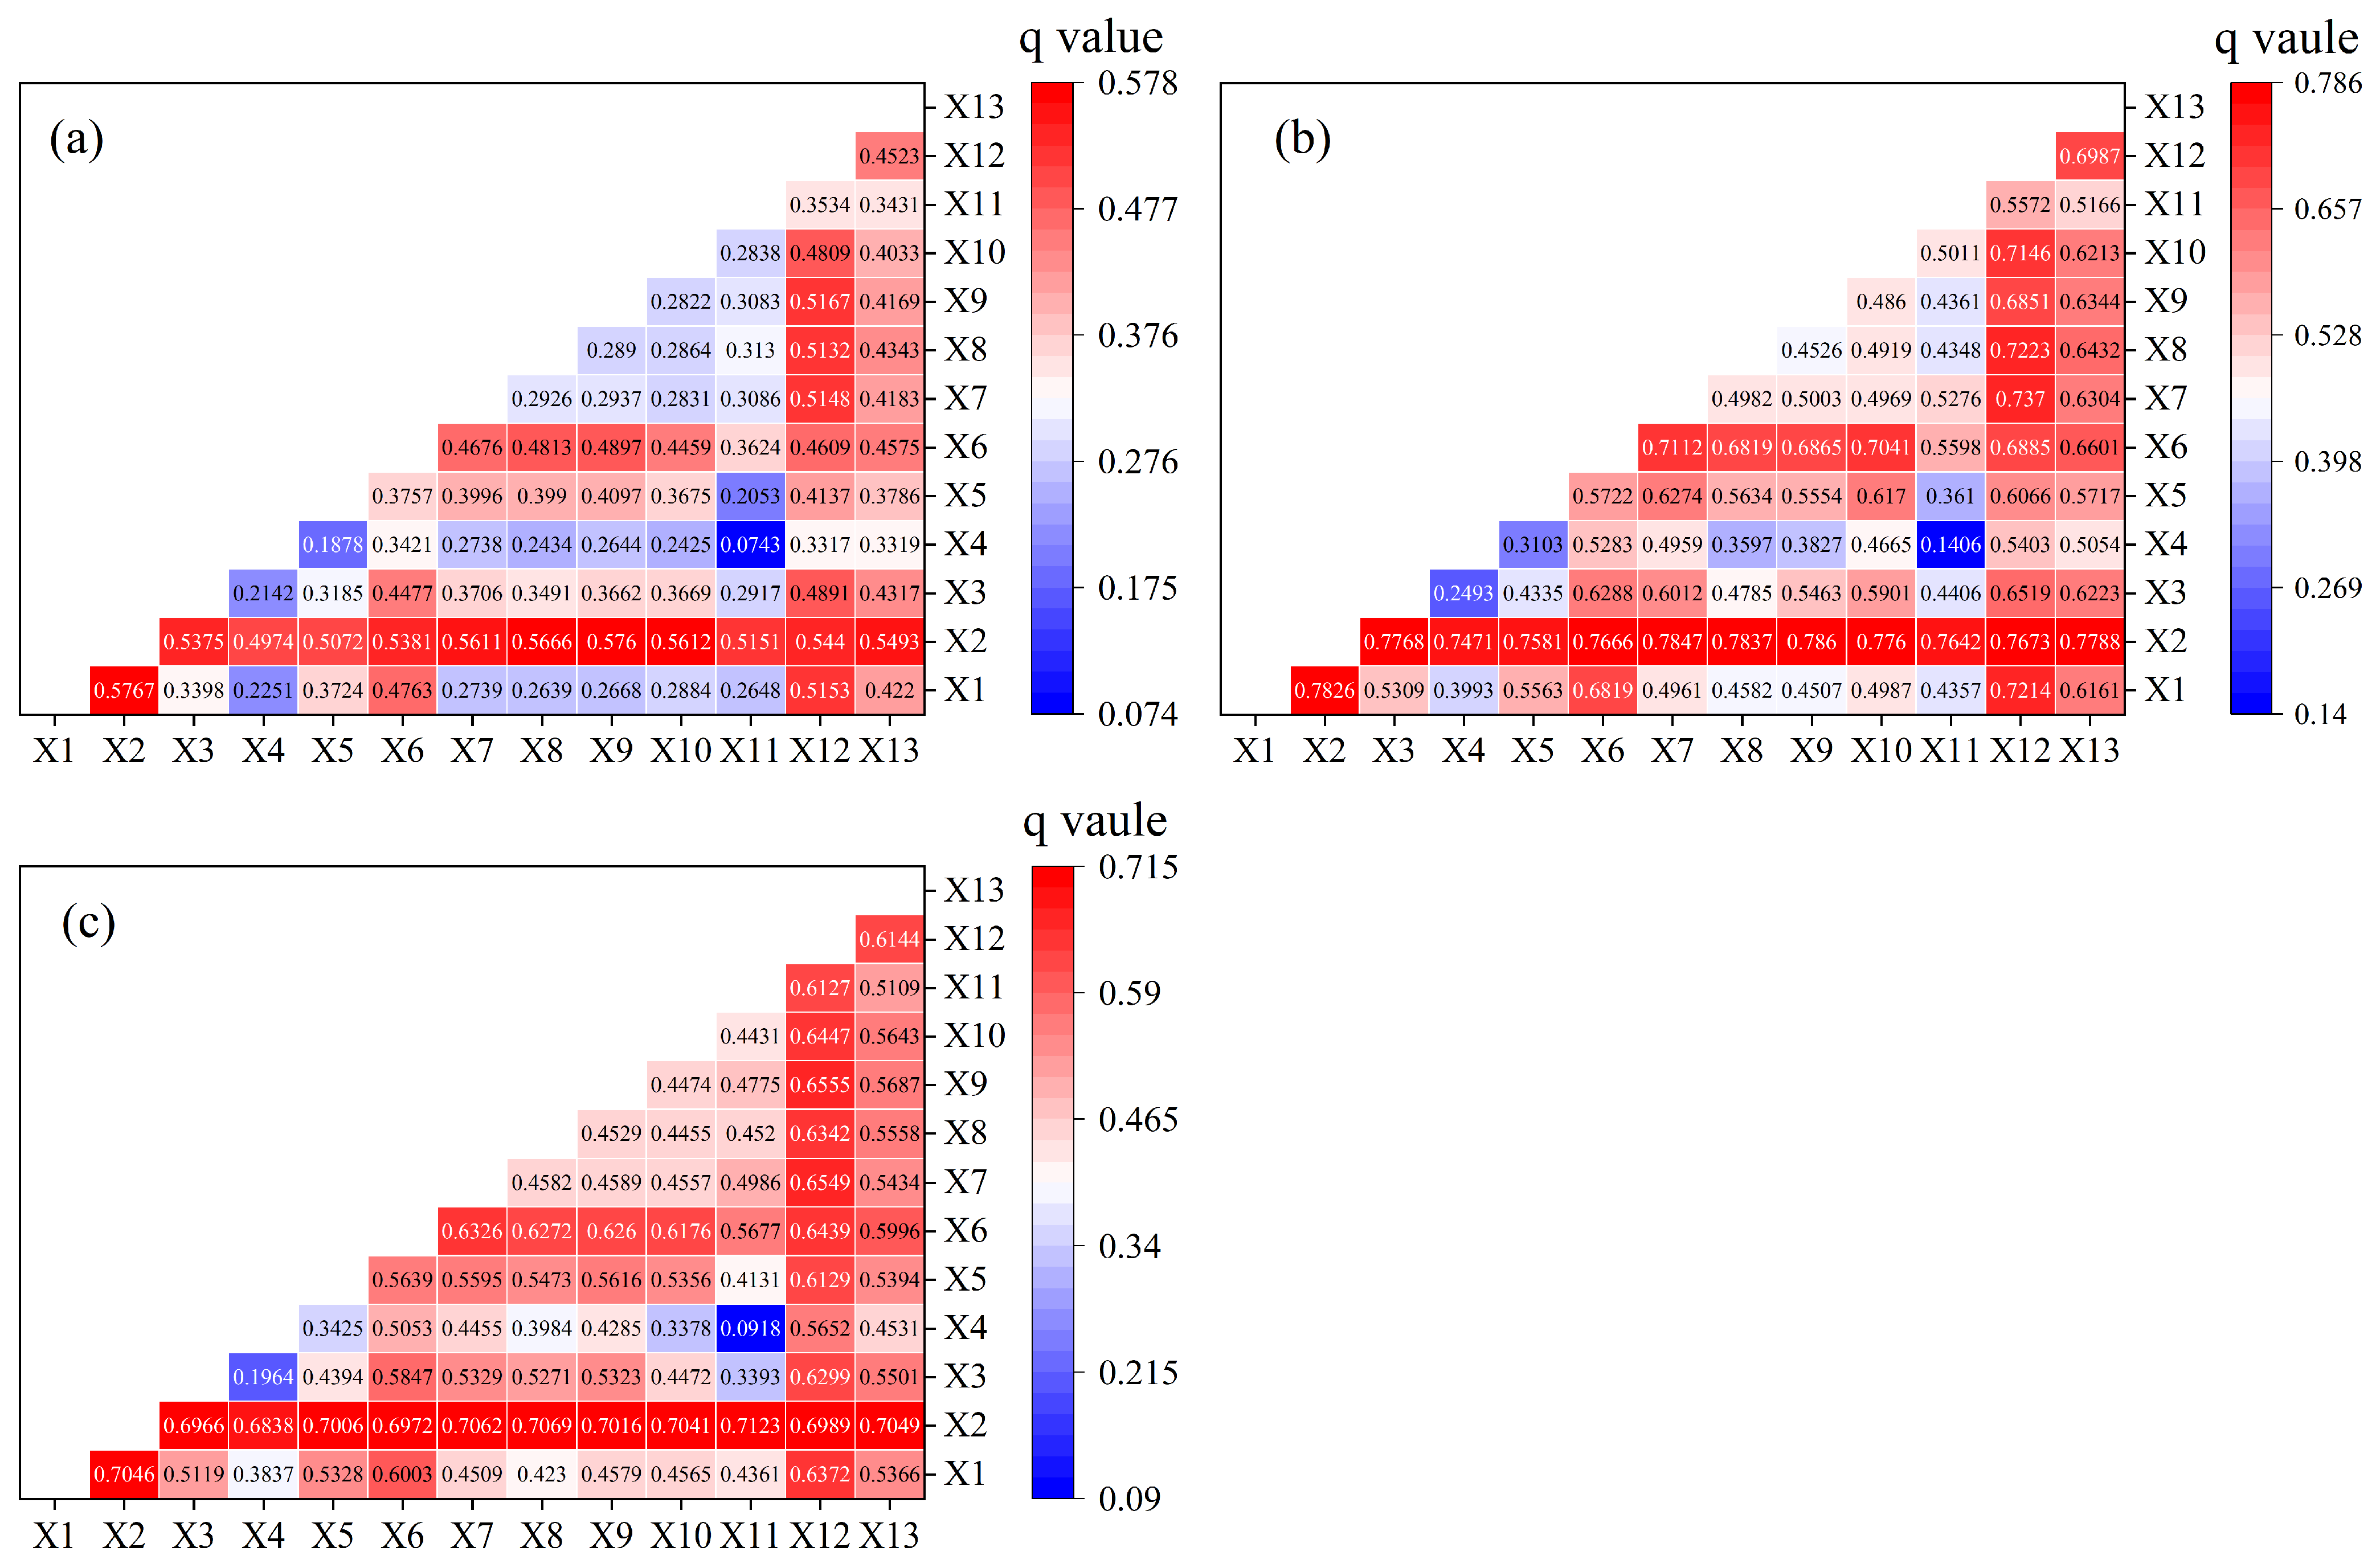
3.3.2. Factor Interaction Detection

According to the detection results from the interaction detector (Figure 16), the interactive effects of different factors significantly influenced the explanatory power on the LST. Among them, the elevation factor demonstrated the most prominent interactive effects with other factors in the selected years, which aligned with the single-factor analysis results. In all three years studied, the superposition of any two factors exhibited synergistic enhancing effects on the land surface temperature, with two-factor enhancement being the predominant pattern. This indicates that the variations in the LST were not solely caused by individual factors but rather driven by the combined effects of multiple interacting factors.
From a numerical perspective, the most significant interaction effects across all years involved X2 interacting with the other factors. In 2000, the interaction between X1 and X2 was the strongest, with a q-value of 0.5767, corresponding to Figure 16a. In 2010, the interaction between X9 and X2 was the most prominent, with a q-value of 0.7860, corresponding to Figure 15b, and in 2020, the interaction between X11 and X2 was the most significant, with a q-value of 0.7123, corresponding to Figure 16c. However, when analyzing X1, X9, and X11 individually, their explanatory power for the LST was relatively low. The q-value of X1 as a single factor was 0.2114 in 2000 (Figure 15a). The q-value of X9 as a single factor was 0.3712 in 2010 (Figure 15b), and the q-value of X11 as a single factor was 0.0781 in 2020 (Figure 15c). This indicated that these factors primarily influenced the LST through synergistic interactions with other variables rather than in isolation. In addition to the enhanced influence observed when elevation interacted with the aforementioned factors, interactions between elevation and social factors such as population density and per capita primary industry output also exerted significant impacts on the LST. Notably, while the social factors showed moderate individual explanatory power in the single-factor analyses (maximum q-value: 0.4890), after interacting with natural factors such as elevation, their explanatory power is improved, with the lowest q-value being 0.5611 and the highest being 0.7860. This indicated that socioeconomic factors do not affect the LST but work synergistically with natural factors to jointly shape the distribution pattern of LST in the Yangtze River Basin.

4. Discussion

4.1. Analysis of the Differentiation of the Magnitude and Threshold of the Basin Cooling Effect

The findings of this study revealed distinct cooling patterns between land cover types: built-up land exhibited the highest temperature reduction amplitude, while forest land demonstrated the most extensive cooling distance. This divergence likely stems from contrasting thermal regulation mechanisms: urban areas dissipate heat rapidly through adjacent rivers, whereas forest ecosystems rely on gradual cooling via canopy shading and evapotranspiration. This mechanistic framework aligned with previous research findings [18]. Notably, significant spatial gradients in the cooling effects were observed: the cooling effects in the upper Yangtze River Basin (with the Chengdu–Chongqing urban agglomeration being particularly prominent) were stronger than those in the middle and lower reaches (with the Yangtze River Delta showing the weakest response), which could be attributed to the synergistic interactions among the lower baseline water temperatures, higher flow velocities, and steep topographic gradients. When compared with arid region rivers like the Sabarmati [5], the Yangtze River exhibited stronger cooling persistence due to enhanced evaporative cooling efficiency supported by greater discharge volumes. Based on these findings, a “topography–hydrology–urban morphology” coupled planning framework is proposed: the Chengdu–Chongqing urban agglomeration needs to prioritize the protection of terrain cold sources, while the Yangtze River Delta should construct width-oriented ventilation corridors. These recommendations provide a scientific basis for mitigating heat island effects in the basin and optimizing climate-adaptive planning.
This study compared the cooling effect amplitudes between domestic and international rivers in Table 3, revealing that Chinese rivers generally exhibit higher temperature reduction amplitudes (0.79–8.01 °C), a phenomenon likely attributable to the enhanced evaporative cooling efficiency under humid-hot climatic conditions. In contrast, international cases demonstrated relatively lower cooling amplitudes (0.46–2.25 °C), potentially constrained by the climatic limitations of arid or temperate regions. The Xiangjiang River in China showed the highest cooling amplitude (8.01 °C), a mechanism potentially linked to synergistic interactions between extensive wetland systems and low-density urban morphology [9]. Shenyang’s Honghe River achieved the longest cooling distance (2500–4000 m), a result closely associated with high vegetation coverage and flat topography that facilitates cold air dispersion [10]. International comparisons highlighted distinct patterns: Indian rivers exhibited significantly lower cooling amplitudes (1.57 °C) compared to their Chinese counterparts (average 4.33 °C), primarily due to arid climate conditions suppressing evaporation efficiency. While U.S. cases demonstrated extended cooling distances (1000 m), their lower amplitudes (2.25 °C) reflected a “breadth-prioritized” strategy for optimizing ventilation corridors in low-density urban areas [8].
As a key indicator for measuring the thermal characteristics of the regional ecological environment, the explanation of the spatial differentiation mechanism of LST has important scientific value for optimizing the human settlement environment and enhancing the service functions of the ecosystem [51]. Previous studies mostly focused on the effect of a single factor on LST, and the study areas were mostly of small scales. This study used the optimal parameter-based geographical detector model to systematically analyze the influencing mechanisms of natural, socioeconomic, and meteorological factors on the LST in the Yangtze River Basin. The results showed that LST was affected by the synergistic effect of multiple factors, and the influence of two factors was stronger than that of a single factor. Natural factors played a dominant role, which was consistent with the research results on the influencing factors of LST in typical cities in China [52].
Among the natural factors, the significant topographic height difference in the Yangtze River Basin means that the elevation factor had a great influence on the LST [53]. In high-altitude areas, the air is thin, the heat preservation effect of the atmosphere is weak, and the surface heat dissipates quickly, resulting in a lower LST. Meanwhile, in low-altitude areas, heat is easy to accumulate, and the LST is relatively high. At the same time, meteorological factors such as wind speed and humidity also had a relatively large impact on the LST [54]. The Yangtze River Basin is affected by the monsoon in the summer, and in areas with higher wind speeds, air flow accelerates heat exchange. In terms of humidity, higher humidity can reduce the LST through evaporation that absorbs heat. It is worth noting that this study found that the impact of the NDVI on the LST in the Yangtze River Basin was not significant, which differed from the conclusions of previous studies. The abundant water resources in the Yangtze River Basin maintain high and stable vegetation coverage, forming a spatially homogeneous pattern, which may weaken the thermal regulation effect of NDVI changes on the LST.
In addition, when socioeconomic factors acted alone, their explanatory power for LST was relatively weak, but when combined with natural factors such as elevation, their influence was significantly enhanced. For example, in the Yangtze River Delta urban agglomeration in the lower reaches, the proportion of built-up land increased from 11.5% in 2000 to 18.9% in 2020 due to the urbanization process (Figure S2). Heat is inherently easy to accumulate in low-elevation areas [52]. Moreover, dense reinforced concrete buildings, hardened pavements in cities, and substantial anthropogenic emissions further intensify the temperature rise [55], making the summer LST in this area higher than that of the surrounding non-urbanized low-elevation farmland. In recent years, with the acceleration of China’s urbanization process, urban economic activities have become more active, and socioeconomic factors such as the increase in population density and the adjustment of the industrial structure have increasingly prominent impacts on the LST [52].

4.2. Policy Suggestions

This study revealed the coupling relationships between the cold island effect and land use, topographic features, and human activities by analyzing the magnitude, thresholds, and multi-factor driving mechanisms of the river cold island effect in the Yangtze River Basin. As the urbanization process continues to advance, the spatial contradiction between high thermal load areas and river cold sources will become increasingly prominent. To effectively enhance the thermal regulation function of the river cold island effect, the following policy recommendations are proposed:
Implement refined spatial layout optimization: For areas with a high proportion of forest land, make full use of the maximum cooling distance of rivers on forest land, delimit ecological protection zones within 589 m of riverbanks, strictly restrict the occupation of built-up land, and strengthen the diffusion effect of the cold island effect. In areas with concentrated built-up land, focusing on the strongest cooling magnitude of rivers on such areas, ecological buffer spaces such as greenways and constructed wetlands can be planned around riverbanks to alleviate the urban heat island pressure.
Implement hierarchical management and control: In the upper reaches, efforts should be made to strengthen the protection of the integrity of river ecosystems and maintain the natural cold source function of high-elevation areas. At the urban agglomeration scale, incorporate the river cold island effect into the urban agglomeration planning system. Delimit “river cold island effect core zones”, control the floor area ratio of built-up land in the core zones, and expand the influence range of rivers through measures such as “returning banks to greenery”.
Construct a “natural–societal” dual-dimensional synergistic regulation system: At the natural factors level, focus on protecting the combined system of forest land and rivers in high-elevation areas, improve vegetation coverage through closing hillsides for afforestation, and enhance the spatial superposition effect with the river cold island effect. At the socioeconomic factors level, in response to the continuous growth trend of built-up land, incorporate the threshold of the river cold island effect into the urban planning indicator system and restrict industrial land and high-density building clusters with high heat island contribution from being distributed near riverbanks.

4.3. Uncertainty Analysis of the Research

This study quantified the cooling intensity and effective distance of different land use types in the Yangtze River Basin, but the following uncertainties persist: First, constrained by 1-km-resolution remote sensing data, the accuracy in capturing localized cooling boundaries is limited, whereas field measurements (e.g., Seoul’s Cheonggyecheon [11] and Sheffield’s River Don project [20]) and Jie et al.’s 30-m Landsat data [9] collectively demonstrate the superior effectiveness of higher-resolution data in identifying extreme cooling phenomena. Second, despite optimized sampling via 22 variably spaced buffers, the discrete fixed-distance buffer design inadequately simulates the nonlinear decay of land surface temperature (LST) with distance, potentially overestimating the actual cooling contribution of water bodies—research on Tokyo’s Arakawa River reveals significant spatial gradients in urban morphology within riparian buffers, providing quantitative support for targeted urban heat island mitigation strategies [56]. Third, the LST retrieved via the split window algorithm is susceptible to signal distortion from 8-day composites and mixed-pixel errors. These multiscale errors may collectively compromise the reliability of the estimated cooling magnitudes and threshold distances.
In addition, although this study revealed through the optimal parameter-based geographical detector model that the interaction between natural and socioeconomic factors is the core mechanism driving LST changes in the Yangtze River Basin, the analysis results of this model are significantly sensitive to the scale of spatial statistical units and strategies for handling outliers. Wang et al. explored the dominant factors of LSTs on the Qinghai–Tibet Plateau by combining the geographical detector, random forest, and SHAP, which effectively improved the reliability of the results [57]. In follow-up studies, the importance ranking of the features in random forest could be combined with geographically weighted regression to conduct multi-model robustness verification. Moreover, although the 13 selected indicators in this study explain the impacts on LSTs from different dimensions, the absence of indicators such as surface radiation balance elements and urban morphology may weaken the depth of the mechanistic analysis. For example, the study by Wang et al. revealed the influence of urban morphology indicators on LSTs in plain and plateau areas [58]. Thus, subsequent studies should incorporate parameters like the normalized difference moisture index (NDMI) and normalized difference built-up index (NDBI) to strengthen the scientific rigor of the explanatory chain.

5. Conclusions

From 2000 to 2020, forest land remained the dominant land use type in the Yangtze River Basin, primarily distributed in the western and central regions, with its area increasing from 723,383 km2 to 738,746 km2. Built-up areas experienced significant expansion, particularly in the eastern coastal zones, showing an annual growth rate of 13.89%. Water bodies expanded mainly in the western regions, with a total increase of 4595 km2 in area. The overall LST in the Yangtze River Basin exhibited a spatial distribution pattern of “higher in the east and lower in the west, lower in the northern and southern edges and higher in the central regions”, with significant diurnal temperature variations. Notably, urban agglomerations experienced elevated temperatures, and the overall temperature showed an upward temporal trend. Among these, higher-temperature zones accounted for the largest proportion of the total area, while high-temperature zones occupied the smallest proportion.
There were significant differences in the diurnal cooling magnitude of rivers for different land types: the cooling distance for ecological land was approximately 547 m, and the magnitude of the cooling effect was 0.60 °C; the cooling distance for urban land was about 486 m, and the magnitude of the cooling effect was 1.72 °C during the day and 1.43 °C at night. At the basin scale, the cooling magnitude in the upper reaches was relatively the largest, reaching 0.96 °C, with an average cooling distance of 448 m. At the urban agglomeration scale, the fluctuations in the Chengdu–Chongqing urban agglomeration were the greatest, with a cooling magnitude of 0.90 °C and an average cooling distance of 358 m. The fluctuations in the urban agglomeration in the middle reaches of the Yangtze River were the smallest.
The cooling effect of rivers in the Yangtze River Basin was driven by the combined influence of natural, socioeconomic, and meteorological factors, with the synergistic effects of multiple factors exceeding those of individual factors alone. Among these, elevation demonstrated the highest factor detection results across all three study years. In contrast, the NDVI and slope aspect showed relatively low q-values, indicating weaker influencing effects. The interaction between socioeconomic factors and elevation had a strong impact on the LST in all three years, and its explanatory power was significantly improved compared with that in single-factor detection.

Supplementary Materials

The following supporting information can be downloaded at https://www.mdpi.com/article/10.3390/land14081511/s1.

Author Contributions

Conceptualization, D.G.; Methodology, P.X., D.G. and Y.S.; Formal Analysis, P.X., Y.S. and S.Z.; Writing—Original Draft Preparation, P.X., Y.S. and S.Z.; Writing—Review and Editing, D.G. and S.Z.; Supervision, D.G.; Funding Acquisition, D.G.; Software, P.X., Y.S. and S.Z. All authors have read and agreed to the published version of the manuscript.

Funding

This research was funded by the National Natural Science Foundation of China (No. U24A20580 and No. 42171298), Chongqing Talents Plan (No. CQYC20220302420), and Natural Science Foundation of Chongqing (No. CSTB2023NSCQ-LZX0009).

Data Availability Statement

The data presented in this study are available upon request from the corresponding author.

Acknowledgments

The insightful and constructive comments and suggestions from the anonymous reviewers are greatly appreciated.

Conflicts of Interest

The authors declare that they have no known competing financial interests or personal relationships that could have appeared to influence the work reported in this paper.

References

  1. Li, H.; Jombach, S.; Tian, G.; Li, Y.; Meng, H. Characterizing Temporal Dynamics of Urban Heat Island in a Rapidly Expanding City: A 39 Years Study in Zhengzhou, China. Land 2022, 11, 1838. [Google Scholar] [CrossRef]
  2. Xiang, R.; Hou, X.; Li, R. Health risks from extreme heat in China: Evidence from health insurance. J. Environ. Manag. 2024, 354, 120300. [Google Scholar] [CrossRef] [PubMed]
  3. Tian, P.; Zhang, F.; Yan, Y.; Liu, Y.; Zhang, H.; Li, J. Spatial inequalities in global population exposure to extreme heats and heatwaves. Appl. Geogr. 2025, 174, 103474. [Google Scholar] [CrossRef]
  4. Du, H.; Song, X.; Jiang, H.; Kan, Z.; Wang, Z.; Cai, Y. Research on the cooling island effects of water body: A case study of Shanghai, China. Ecol. Indic. 2016, 67, 31–38. [Google Scholar] [CrossRef]
  5. Gupta, N.; Mathew, A.; Khandelwal, S. Analysis of cooling effect of water bodies on land surface temperature in nearby region: A case study of Ahmedabad and Chandigarh cities in India. Egypt. J. Remote Sens. Space Sci. 2019, 22, 81–93. [Google Scholar] [CrossRef]
  6. Lin, J.; Yang, W.; Yu, K.; Geng, J.; Liu, J. Construction of Water Corridors for Mitigation of Urban Heat Island Effect. Land 2023, 12, 308. [Google Scholar] [CrossRef]
  7. Moazzam, M.F.U.; Lee, B.G. Urbanization influenced SUHI of 41 megacities of the world using big geospatial data assisted with google earth engine. Sustain. Cities Soc. 2024, 101, 105095. [Google Scholar] [CrossRef]
  8. Moyer, A.N.; Hawkins, T.W. River effects on the heat island of a small urban area. Urban Clim. 2017, 21, 262–277. [Google Scholar] [CrossRef]
  9. Tan, J.; Kuang, W.; Yu, D.; Zhou, W.; Li, X.; Liu, Q.; He, L. Investigating the cooling effects of land cover and landscape patterns surrounding rivers: Insights from the subtropical city of Changsha, China. Urban Clim. 2024, 55, 101975. [Google Scholar] [CrossRef]
  10. Guo, F.; Xu, S.; Zhao, J.; Zhang, H.; Liu, L.; Zhang, Z.; Yin, X. Study on the mechanism of urban morphology on river cooling effect in severe cold regions. Front. Public Health 2023, 11, 117062. [Google Scholar] [CrossRef] [PubMed]
  11. Park, C.Y.; Lee, D.K.; Asawa, T.; Murakami, A.; Kim, H.G.; Lee, M.K.; Lee, H.S. Influence of urban form on the cooling effect of a small urban river. Landsc. Urban Plan. 2019, 183, 26–35. [Google Scholar] [CrossRef]
  12. Jiang, L.; Liu, S.; Liu, C.; Feng, Y. How do urban spatial patterns influence the river cooling effect? A case study of the Huangpu Riverfront in Shanghai, China. Sustain. Cities Soc. 2021, 69, 102835. [Google Scholar] [CrossRef]
  13. Sökmen, E.D.; Eminel Kutay, M. Assessing the cooling effects of narrow urban rivers: A spatial analysis of the Porsuk River. Environ. Monit. Assess. 2025, 197, 800. [Google Scholar] [CrossRef] [PubMed]
  14. Liu, Q.; Zhang, H.; Peng, J.; Li, Q.; Liu, T.; Hu, F.; Huang, H.; Shen, Y.; Ye, B.; Guo, Y.; et al. Mitigation strategies for regional heat island effects: Integrated network construction of cold and heat islands. Ecol. Indic. 2025, 176, 113703. [Google Scholar] [CrossRef]
  15. Gao, J.; Qu, L.; Wu, W. Spatial-temporal variation of surface temperature and cold island network construction in the Yangtze River delta urban agglomeration: Perspectives from current and future scenarios. Sustain. Cities Soc. 2025, 126, 106396. [Google Scholar] [CrossRef]
  16. Peng, W.; Yuan, X.; Gao, W.; Wang, R.; Chen, W. Assessment of urban cooling effect based on downscaled land surface temperature: A case study for Fukuoka, Japan. Urban Clim. 2021, 36, 100790. [Google Scholar] [CrossRef]
  17. Jiao, Y.; Zhu, G.; Lu, S.; Ye, L.; Qiu, D.; Meng, G.; Wang, Q.; Li, R.; Chen, L.; Wang, Y.; et al. The Cooling Effect of Oasis Reservoir-Riparian Forest Systems in Arid Regions. Water Resour. Res. 2024, 60, e2024WR038301. [Google Scholar] [CrossRef]
  18. Cheng, L.; Guan, D.; Zhou, L.; Zhao, Z.; Zhou, J. Urban cooling island effect of main river on a landscape scale in Chongqing, China. Sustain. Cities Soc. 2019, 47, 101501. [Google Scholar] [CrossRef]
  19. Hu, C.; Zhang, M.; Huang, G.; Li, Z.; Sun, Y.; Zhao, J. Tracking the impact of the land cover change on the spatial-temporal distribution of the thermal comfort: Insights from the Qinhuai River Basin, China. Sustain. Cities Soc. 2024, 116, 105916. [Google Scholar] [CrossRef]
  20. Hathway, E.A.; Sharples, S. The interaction of rivers and urban form in mitigating the Urban Heat Island effect: A UK case study. Build. Environ. 2012, 58, 14–22. [Google Scholar] [CrossRef]
  21. Zhou, W.; Wu, T.; Tao, X. Exploring the spatial and seasonal heterogeneity of cooling effect of an urban river on a landscape scale. Sci. Rep. 2024, 14, 8327. [Google Scholar] [CrossRef] [PubMed]
  22. Yujie, R.; Tang, X.; Fan, T.; Kang, D. Does the spatial pattern of urban blue–green space at city-level affects its cooling efficiency? Evidence from Yangtze River Economic Belt, China. Landsc. Ecol. Eng. 2023, 19, 363–379. [Google Scholar] [CrossRef]
  23. Shi, D.; Song, J.; Huang, J.; Zhuang, C.; Guo, R.; Gao, Y. Synergistic cooling effects (SCEs) of urban green-blue spaces on local thermal environment: A case study in Chongqing, China. Sustain. Cities Soc. 2020, 55, 102065. [Google Scholar] [CrossRef]
  24. Tan, X.; Sun, X.; Huang, C.; Yuan, Y.; Hou, D. Comparison of cooling effect between green space and water body. Sustain. Cities Soc. 2021, 67, 102711. [Google Scholar] [CrossRef]
  25. Adamowski, J.; Prokoph, A. Assessing the impacts of the urban heat island effect on streamflow patterns in Ottawa, Canada. J. Hydrol. 2013, 496, 225–237. [Google Scholar] [CrossRef]
  26. Wang, H.; Chen, C. Quantifying the contributions of urban spatial morphology on the river cold island effect: Taking Changsha, China, as an example. Sustain. Cities Soc. 2025, 122, 106256. [Google Scholar] [CrossRef]
  27. Cruz, J.A.; Blanco, A.C.; Garcia, J.J.; Santos, J.A.; Moscoso, A.D. Evaluation of the cooling effect of green and blue spaces on urban microclimate through numerical simulation: A case study of Iloilo River Esplanade, Philippines. Sustain. Cities Soc. 2021, 74, 103184. [Google Scholar] [CrossRef]
  28. Xue, Z.; Hou, G.; Zhang, Z.; Lyu, X.; Jiang, M.; Zou, Y.; Shen, X.; Wang, J.; Liu, X. Quantifying the cooling-effects of urban and peri-urban wetlands using remote sensing data: Case study of cities of Northeast China. Landsc. Urban Plan. 2019, 182, 92–100. [Google Scholar] [CrossRef]
  29. Wu, S.; Yang, H.; Luo, P.; Luo, C.; Li, H.; Liu, M.; Ruan, Y.; Zhang, S.; Xiang, P.; Jia, H.; et al. The effects of the cooling efficiency of urban wetlands in an inland megacity: A case study of Chengdu, Southwest China. Build. Environ. 2021, 204, 108128. [Google Scholar] [CrossRef]
  30. Peng, J.; Liu, Q.; Xu, Z.; Lyu, D.; Du, Y.; Qiao, R.; Wu, J. How to effectively mitigate urban heat island effect? A perspective of waterbody patch size threshold. Landsc. Urban Plan. 2020, 202, 103873. [Google Scholar] [CrossRef]
  31. Deng, Y.; Yao, Y.; Zhang, L. Analysis of urban wetland park cooling effects and their potential influence factors: Evidence from 477 urban wetland parks in China. Ecol. Indic. 2023, 156, 111103. [Google Scholar] [CrossRef]
  32. Peng, J.; Dan, Y.; Yu, X.; Xu, D.; Yang, Z.; Wang, Q. Response of urban green space cooling effect to urbanization in the Three Ring Road area of Changsha City. Sustain. Cities Soc. 2024, 109, 105534. [Google Scholar] [CrossRef]
  33. Wang, C.; Zhang, R.; Zhang, S. A 2000-year spatiotemporal pattern and relationship between cities and floods in the Yangtze River Basin, China. River Res. Appl. 2023, 39, 1212–1223. [Google Scholar] [CrossRef]
  34. Zhang, S.; Ren, Y.; Ren, G.; Tysa, S.K. The change and urbanization effect on extreme temperature trends in the Yangtze River Basin. Theor. Appl. Climatol. 2024, 156, 22. [Google Scholar] [CrossRef]
  35. Chan, D.; Wu, Q.; Jiang, G.; Dai, X. Projected shifts in Köppen climate zones over China and their temporal evolution in CMIP5 multi-model simulations. Adv. Atmos. Sci. 2016, 33, 283–293. [Google Scholar] [CrossRef]
  36. Li, Z.-L.; Wu, H.; Duan, S.-B.; Zhao, W.; Ren, H.; Liu, X.; Leng, P.; Tang, R.; Ye, X.; Zhu, J.; et al. Satellite Remote Sensing of Global Land Surface Temperature: Definition, Methods, Products, and Applications. Rev. Geophys. 2023, 61, e2022RG000777. [Google Scholar] [CrossRef]
  37. Su, Q.; Meng, X.; Sun, L. Investigation and Validation of Split-Window Algorithms for Estimating Land Surface Temperature from Landsat 9 TIRS-2 Data. Remote Sens. 2024, 16, 3633. [Google Scholar] [CrossRef]
  38. Xin, J.; Yang, J.; Sun, D.; Han, T.; Song, C.; Shi, Z. Seasonal Differences in Land Surface Temperature under Different Land Use/Land Cover Types from the Perspective of Different Climate Zones. Land 2022, 11, 1122. [Google Scholar] [CrossRef]
  39. Xie, W.; Li, J.; Liu, Y.; Peng, K.; Zhang, K. Evaluation of ecological buffer zone based on landscape pattern for non-point source pollution control: A case study in Hanjiang River basin, China. J. Hydrol. 2023, 626, 130341. [Google Scholar] [CrossRef]
  40. Song, Y.; Wang, J.; Ge, Y.; Xu, C. An optimal parameters-based geographical detector model enhances geographic characteristics of explanatory variables for spatial heterogeneity analysis: Cases with different types of spatial data. GISci. Remote Sens. 2020, 57, 593–610. [Google Scholar] [CrossRef]
  41. Yu, Y.; Fang, S.; Zhuo, W. Revealing the Driving Mechanisms of Land Surface Temperature Spatial Heterogeneity and Its Sensitive Regions in China Based on GeoDetector. Remote Sens. 2023, 15, 2814. [Google Scholar] [CrossRef]
  42. Shi, S.; Wang, X.; Hu, Z.; Zhao, X.; Zhang, S.; Hou, M.; Zhang, N. Geographic detector-based quantitative assessment enhances attribution analysis of climate and topography factors to vegetation variation for spatial heterogeneity and coupling. Glob. Ecol. Conserv. 2023, 42, e02398. [Google Scholar] [CrossRef]
  43. An, B.; Wang, X.; Huang, X. Changing characteristics, driving factors and future predictions of land use in the Weigan-Kuqa River Delta Oasis, China. Sci. Rep. 2024, 14, 29318. [Google Scholar] [CrossRef] [PubMed]
  44. Yu, L.; Liu, Y.; Yang, J.; Liu, T.; Bu, K.; Li, G.; Jiao, Y.; Zhang, S. Asymmetric daytime and nighttime surface temperature feedback induced by crop greening across Northeast China. Agric. For. Meteorol. 2022, 325, 109136. [Google Scholar] [CrossRef]
  45. Breil, M.; Rechid, D.; Davin, E.L.; de Noblet-Ducoudré, N.; Katragkou, E.; Cardoso, R.M.; Hoffmann, P.; Jach, L.L.; Soares, P.M.M.; Sofiadis, G.; et al. The Opposing Effects of Reforestation and Afforestation on the Diurnal Temperature Cycle at the Surface and in the Lowest Atmospheric Model Level in the European Summer. J. Clim. 2020, 33, 9159–9179. [Google Scholar] [CrossRef]
  46. Zhang, Q.; Yang, J.; Ma, X.; Xin, J.; Ren, J.; Yu, W.; Xiao, X.; Xia, J. Influence of 2-D/3-D Urban Morphology on Diurnal Land Surface Temperature From the Perspective of Functional Zones. IEEE J. Sel. Top. Appl. Earth Obs. Remote Sens. 2024, 17, 17036–17051. [Google Scholar] [CrossRef]
  47. Jing, P.; Wang, D.; Zhu, C.; Chen, J. Plant Physiological, Morphological and Yield-Related Responses to Night Temperature Changes across Different Species and Plant Functional Types. Front. Plant Sci. 2016, 7, 1774. [Google Scholar] [CrossRef] [PubMed]
  48. Lin, Y.; Wang, Z.; Jim, C.Y.; Li, J.; Deng, J.; Liu, J. Water as an urban heat sink: Blue infrastructure alleviates urban heat island effect in mega-city agglomeration. J. Clean. Prod. 2020, 262, 121411. [Google Scholar] [CrossRef]
  49. Sharma, K.V.; Kumar, V.; Gautam, L.; Choudhary, S.; Mathew, A. Geo-physical seasonal deviations of land use, terrain analysis, and water cooling effect on the surface temperature of Pune city. J. Water Clim. Change 2023, 14, 4802–4820. [Google Scholar] [CrossRef]
  50. Feng, X.; Li, M.; Zhou, Z.; Li, F.; Wang, Y. Quantifying the cooling effect of river and its surrounding land use on local land surface temperature: A case study of Bahe River in Xi’an, China. Egypt. J. Remote Sens. Space Sci. 2023, 26, 975–988. [Google Scholar] [CrossRef]
  51. Fan, Q.; Song, X.; Shi, Y.; Gao, R. Influencing Factors of Spatial Heterogeneity of Land Surface Temperature in Nanjing, China. IEEE J. Sel. Top. Appl. Earth Obs. Remote Sens. 2021, 14, 8341–8349. [Google Scholar] [CrossRef]
  52. Cao, X.; Chen, W.; Xing, Y.; Chen, Y.; Chen, X.; Wang, X.; Wu, D.; Niu, X.; Pu, W.; Liu, J.; et al. The changes in remoted land surface temperature (LST) triggered by natural and socioeconomic factors in typical Chinese cities. Urban Clim. 2024, 58, 102151. [Google Scholar] [CrossRef]
  53. Abbas, A.; He, Q.; Jin, L.; Li, J.; Salam, A.; Lu, B.; Yasheng, Y. Spatio-Temporal Changes of Land Surface Temperature and the Influencing Factors in the Tarim Basin, Northwest China. Remote Sens. 2021, 13, 3792. [Google Scholar] [CrossRef]
  54. Lai, J.; Zhan, W.; Voogt, J.; Quan, J.; Huang, F.; Zhou, J.; Bechtel, B.; Hu, L.; Wang, K.; Cao, C.; et al. Meteorological controls on daily variations of nighttime surface urban heat islands. Remote Sens. Environ. 2021, 253, 112198. [Google Scholar] [CrossRef]
  55. Wang, Z.; Meng, Q.; Allam, M.; Hu, D.; Zhang, L.; Menenti, M. Environmental and anthropogenic drivers of surface urban heat island intensity: A case-study in the Yangtze River Delta, China. Ecol. Indic. 2021, 128, 107845. [Google Scholar] [CrossRef]
  56. Zhang, L.; Bagan, H.; Chen, C.; Yoshida, T. Exploring the impact of urban morphology on river cooling effects: A case study of the Arakawa river in Tokyo. Ecol. Indic. 2025, 172, 113288. [Google Scholar] [CrossRef]
  57. Zhang, Y.; Sheng, Q.; Wang, B.; Li, J.; Ling, X.; Wu, Z.; Li, K.; Wang, Q.; Gao, F. Analysis of Seasonal Dominant Factors Influencing Land Surface Temperature Over the Tibetan Plateau. IEEE J. Sel. Top. Appl. Earth Obs. Remote Sens. 2025, 18, 13635–13651. [Google Scholar] [CrossRef]
  58. Wang, Z.; Zhou, R.; Rui, J.; Yu, Y. Revealing the impact of urban spatial morphology on land surface temperature in plain and plateau cities using explainable machine learning. Sustain. Cities Soc. 2025, 118, 106046. [Google Scholar] [CrossRef]
Figure 1. Overview of the study area.
Land 14 01511 g001
Figure 2. Flow chart.
Land 14 01511 g002
Figure 3. Spatial distribution of different land use types in the upper, middle, and lower reaches of the Yangtze River Basin in 2000 (a1a3), 2010 (b1b3), and 2020 (c1c3).
Land 14 01511 g003
Figure 4. Quantity distribution of different land use types in the upper, middle, and lower reaches of the Yangtze River Basin from 2000 to 2020. Error bars represent the standard deviation (n = 3).
Land 14 01511 g004
Figure 5. Spatial distribution of summer daytime LST classification in the upper, middle, and lower Yangtze River Basin in 2000 (a1a3), 2010 (b1b3), and 2020 (c1c3).
Land 14 01511 g005
Figure 6. Spatial distribution of summer nighttime LST classification in the upper, middle, and lower Yangtze River Basin in 2000 (a1a3), 2010 (b1b3), and 2020 (c1c3).
Land 14 01511 g006
Figure 7. Distribution of the average summer daytime LSTs over cropland in the (upper, middle, and lower) reaches of the Yangtze River Basin from 2000 to 2020.
Land 14 01511 g007
Figure 8. Distribution of the average summer nighttime LSTs over cropland in the (upper, middle, and lower) reaches of the Yangtze River Basin from 2000 to 2020.
Land 14 01511 g008
Figure 9. Distribution of the average summer daytime LST over forest land in the (upper, middle, and lower) reaches of the Yangtze River Basin from 2000 to 2020.
Land 14 01511 g009
Figure 10. Distribution of the average summer nighttime LST over forest land in the (upper, middle, and lower) reaches of the Yangtze River Basin from 2000 to 2020.
Land 14 01511 g010
Figure 11. Distribution of the average summer daytime LST over grassland in the (upper, middle, and lower) reaches of the Yangtze River Basin from 2000 to 2020.
Land 14 01511 g011
Figure 12. Distribution of the average summer nighttime LST over grassland in the (upper, middle, and lower) reaches of the Yangtze River Basin from 2000 to 2020.
Land 14 01511 g012
Figure 13. Distribution of the average summer daytime LST over built-up land in the (upper, middle, and lower) reaches of the Yangtze River Basin from 2000 to 2020.
Land 14 01511 g013
Figure 14. Distribution of the average summer nighttime LST over built-up land in the (upper, middle, and lower) reaches of the Yangtze River Basin from 2000 to 2020.
Land 14 01511 g014
Figure 15. Results of single-factor detection of the LST in the Yangtze River Basin in 2000 (a), 2010 (b), and 2020 (c).
Land 14 01511 g015
Figure 16. The interaction between various factors on the LST in the Yangtze River Basin in 2000 (a), 2010 (b), and 2020 (c).
Land 14 01511 g016
Table 1. Classification criteria for the land surface temperature (LST) grades.
LST GradeValue Range
Low-temperature ZoneTs ≤ (a − 1.5 std)
Lower-temperature Zone(a − 1.5 std) < Ts ≤ (a − 0.5 std)
Moderate-temperature Zone(a − 0.5 std) < Ts ≤ (a + 0.5 std)
Higher-temperature Zone(a + 0.5 std) < Ts ≤ (a + 1.5 std)
High-temperature ZoneTs > (a + 1.5 std)
Note: Ts is the standardized LST, a is the regional mean of the standardized LST, and std is the standard deviation.
Table 2. Driving indicators of the changes in the land surface temperature (LST) in the Yangtze River Basin.
FactorIndicatorFactorIndicatorFactorIndicator
X1Basin AreaX6Soil TypeX10Per Capita Tertiary Industry Output
X2ElevationX7Population DensityX11Normalized Difference Vegetation Index
X3SlopeX8Per Capita Primary Industry OutputX12Wind Speed
X4AspectX9Per Capita Secondary Industry OutputX13Humidity
X5Land Use Type
Table 3. Comparative metrics of riparian cooling effects: magnitude (Δ°C) and effective distance (m) across selected river systems.
Study AreaCountryResearch MethodsCooling MagnitudeCooling DistanceInfluencing FactorsAuthors
CheonggyecheonSouth KoreaMobile measurement0.46 °C32.7 mStreet Width, Mean Building Height(Chae Yeon Park et al., 2019) [11]
Shenyang Hun RiverChinaRemote sensing data inversion, correlation analysis, and spatial regression models/2500–4000 mNDVI, building density(Fei Guo et al., 2023) [10]
The right bank of Sabarmati RiverIndiaLand surface temperature inversion, buffer analysis1.57 °C200–300 mRoad and building patterns(Neha Gupta et al., 2019) [5]
Pennsylvania RiverUSASite observation, linear regression2.25 °C/Building morphology(Ashley N. Moyer et al., 2017) [8]
Xiangjiang, Liuyang, and Weishui RiversChinaLand surface temperature inversion, buffer analysis8.01 °C, 7.35 °C, 2.79 °C/Land cover type, landscape metrics (Largest Patch Index)(Jie Tan et al., 2024) [9]
Huangpu RiverChinaLand surface temperature inversion, RCE calculation, and statistical analysis4.47 °C197.35 mBuilding height, density, wind direction(Li Jiang et al., 2021) [12]
Pearl River Delta RiversChinaGEE-based inversion of average SUHI intensity/100 mWater area, geometric features(Yi Lin et al., 2020) [48]
Lakes in PuneIndiaLand surface temperature calculation and statistical analysis/350 mLand use type(Kul Vaibhav Sharma et al., 2023) [49]
Bahe RiverChinaSingle-window algorithm, spatial buffer analysis, and linear regression3.2–3.7 °C300–600 mLand use type(Xiaogang Feng et al., 2023) [50]
Yangtze River BasinChinaSplit window algorithm, buffer analysis, parameter-optimized GeoDetector model0.79 °C472 mLand use type, natural factorsThis study
Disclaimer/Publisher’s Note: The statements, opinions and data contained in all publications are solely those of the individual author(s) and contributor(s) and not of MDPI and/or the editor(s). MDPI and/or the editor(s) disclaim responsibility for any injury to people or property resulting from any ideas, methods, instructions or products referred to in the content.

