Article

Mixed Temporal Measurement of Land Use Based on AOI Data and Thermal Data

1
School of Geography and Tourism, Shaanxi Normal University, Xi’an 710119, China
2
Shaanxi Key Laboratory of Tourism Informatics, Xi’an 710119, China
3
Shaanxi Province Tourism Informatization Engineering Laboratory, Xi’an 710119, China
4
Shaanxi Province Digital Culture and Tourism Technology and Application Laboratory, Xi’an 710119, China
*
Author to whom correspondence should be addressed.
Land 2025, 14(7), 1457; https://doi.org/10.3390/land14071457
Submission received: 1 June 2025 / Revised: 9 July 2025 / Accepted: 10 July 2025 / Published: 13 July 2025

Abstract

Land use mix is important for urban planning, and existing land use mix metrics frameworks have been developed comprehensively in terms of categories, distances, and attributes. However, most existing indices focus solely on the spatial dimension of land use mixing, neglecting the inherent temporal variation of land use within short time scales, which results in difficulties in comprehensively and accurately capturing the cyclical dynamic characteristics of land use. In response to this problem, this study introduces innovative modifications to the diversity indicator from the perspective of the temporal availability of land use, based on the business time characteristics of land use. Specifically, three time-sensitive indexes were proposed, including the temporal diversity index (TDI), the daily temporal diversity index (DTDI), and the temporal entropy index (TEI). With these indexes, this paper measures and analyzes the functional mix of street blocks in Xi’an City. The results of the study show that the indexes are effective in reflecting changes in the temporal dimension of the land use mix. Meanwhile, Xi’an’s land use mix pattern is more reasonable in terms of setting business hours, but the type of functional mix needs to be optimized. The proposed indicator system offers a novel perspective on the spatiotemporal mixing of land use and delivers more precise decision-making support for urban planning and management.

1. Introduction

Cities are complex complexes containing multiple land-use functions that interact with each other and support human socio-economic activities in the city [1]. Early urban functions were organized through disorganized mixed forms, and with the advent of the industrial era, problems of mixed use began to emerge gradually [2]. As a result, many European cities began to clearly delineate the types of land use within specific areas of the city. In 1933, the International Congresses of Modern Architecture mentioned for the first time in the Athens Charter the “functional zone” approach to urban planning, which became the main planning guideline for urban development for some time afterwards [3]. However, with a long history of strict zoning policies, it has come to be recognized that land use zoning creates an overly fragmented urban environment, leading to social segregation and inefficient functioning. Jacobs, an exponent of the New Urbanism, criticized this. Therefore, after the Second World War, as the development pattern of cities gradually changed from the initial incremental expansion to a mixed and efficient development pattern, land use mix also gradually became a principle supported by institutions and scholars in the field of urban planning. A series of design ideas have been derived from this context, such as the Congress for the New Urbanism [4] and the Smart Growth Network [5]. Major cities around the world have already begun actively implementing design concepts to accelerate the process of land use mix.
Land use mix has been shown to be beneficial in promoting socio-economic growth, improving the transportation environment, and enhancing public health. Complementary land uses have the potential to enhance land value and foster urban development. For instance, in terms of socio-economic aspects, research has indicated that the mix of land uses is correlated with housing prices in the real estate market, and that an optimal land-use mix can stimulate street activities and consumer spending [6]. From a transportation perspective, a mixed land use approach enhances trip frequency, creates a pedestrian-friendly community environment, and reduces commuting distances. This, in turn, helps decrease dependence on automobiles, alleviating traffic congestion and mitigating environmental issues [7]. From a public health perspective, land use mix can provide more interesting destinations that improve the built environment, increase people’s physical activity levels, and prevent cardiovascular disease and obesity [8]. In conclusion, land use mix is an important method of sustainable urban development today and is an effective solution to urban development problems.
Research on the impact of land use mix on social effects is very popular. However, how to more accurately measure the degree of land use mix is still a complex issue. Zhuo et al. conducted a systematic review of existing studies, categorizing the measurement indices into a three-dimensional structural framework based on “quantity-attribute-distance.” They further proposed three core dimensions: diversity, accessibility, and compatibility [2]. Currently, diversity metrics are the main paradigm in the design of metrics because of their ability to effectively reflect the richness and balance of land use types [9]. Diversity is mainly used to express the richness of land use types, of which the most basic indicator is the percentage indicator. However, since percentage indicators are too simple and intuitive and can provide limited information in studies, subsequent studies have further developed composite indicators for diversity measurement, which can be categorized into two types based on their scale characteristics: The first type includes indicators such as the balance index, entropy measure, and Herfindahl–Hirschman index, which are used to quantify the overall diversity of land use and are particularly suitable for assessing diversity in small-scale areas. The second type includes indicators such as the Atkinson index, clustering index, difference index, exposure index, and Gini index, which, by comparing the similarities between different areas, are more sensitive in capturing the diversity characteristics of land use in larger-scale regions. Most land use mix studies focus on the smaller-scale block level. At the same time, the entropy index is used in most land use mix studies because of its ability to measure the diversity of blocks containing more than two land use categories and its simplicity and intuition compared to other diversity indices used at the small-scale level.
With the continuous development of measurement methods, the existing research concluded that, in addition to the diversity of land use mix, the measurement of land use mix also contains two aspects of accessibility and compatibility measurement. Song et al. argue that land use mix represents different land uses interacting with each other over a limited spatial extent, and in addition to quantitative characteristics, it also contains distance characteristics [6,7]. Accessibility indicators can be used to measure this distance characteristic. Among related indicators, the distance metric is the most commonly used accessibility indicator, which expresses accessibility directly through spatial distance. In addition, due to the presence of distance attenuation effects, other scholars have considered setting weights, such as gravity-based measurements, cumulative chance metrics, and center-of-mass distance metrics.
In addition, compatibility between land use types is another easily overlooked and important aspect of land use mix measurement. Compatibility reflects the mutual relationship between two land blocks, referring to the interaction characteristics between different land use types. Taleai et al. have developed a compatibility evaluation matrix for exploring externalities between land uses through the Delphi method [10]. Later, Tian et al. developed the metric MDI to measure the compatibility relationship between residential and industrial blocks to indicate the compatibility of the land use mix [11]. However, both of these studies are limited to only some land use types. Based on this, Zhuo et al. combined the compatibility matrix and MDI indexes, incorporated area weighting, and constructed VMDI and WVMDI, which realized compatibility metrics that are more diverse in categories and more sensitive to spatial area [12]. In order to improve the precision of land use mix measurement in a spatial dimension, some studies have also constructed a comprehensive mix index by integrating diversity, accessibility, and compatibility indicators, such as LMDI and CMDI [13]. Existing mixing metrics, while achieving more accurate measurements in the spatial dimension, are still limited to static evaluations and do not yet address the periodic change characteristics of the land use in the time dimension.
Land use mix has a significant multidimensional character, covering three dimensions: horizontal space, vertical space, and temporal change [2]. Current research has mainly focused on the analysis of horizontal dimension measurement, and some scholars have begun to explore the vertical dimension of the three-dimensional measurement methods [13]. In the time dimension, the land use mix measure consists of both a functional land use change measure and a land use time availability measure. An important planning goal of land use mix is to enhance economic, transportation, and public health benefits by improving accessibility and promoting travel behaviors of residents. However, the ability of individuals to access and participate in activities at a given location is largely influenced by the temporal availability of that location [14]. Previous land use mix studies have often neglected the temporal availability of land use. Although some studies have begun to attempt to reveal the temporal availability characteristics of land use, collecting relevant operational information remains a challenge. The traditional approach is to collect opening hour data on land use, but this is often accompanied by significant cost issues. Another approach is to assume that similar land uses have the same opening hours. However, with the increasing complexity of land use patterns, the same land use type may have different opening hour characteristics, making this assumption less accurate. Developments in big data technologies and improved data policies provide a new source of data. Today, geo-tagged and time-stamped spatio-temporal big data and GPS information are widely used to understand the spatio-temporal patterns of human activity [15,16]. For example, using LBS data, Li et al. transformed the active characteristics represented by the data into entropy indicators to construct indicators to reveal the temporal active characteristics of different blocks in the Beijing area [17]. Patrizia et al. counted transport card data in London and analyzed temporal information to assess the dynamic diversity characteristics of the blocks [18]. These studies above involve the analysis of the characteristics of urban vitality in the time dimension and shed preliminary light on its relationship with land use mix. However, the evaluation of changes in the land use mix itself in the time dimension has not yet been addressed.
In summary, traditional measures of land use mix have mostly focused on the interactions of different land use types in the spatial dimension, while often neglecting the temporal availability of land use functions. Although there have been studies that leverage big data to reveal the urban vitality characteristics behind different land use functions and explore their relationship with land use mix, they have failed to apply time availability to land use mix measurement. Incorporating time availability into the land use mix measure not only can more accurately portray the constraints of land use in the spatial and temporal dimensions but also provides theoretical support for more time-sensitive land use policy formulation. To this end, this paper introduces AOI data and thermal data, and from the perspective of diversity measurement, proposes a method to integrate time availability into land use mix measurement and verifies the effectiveness of the index in portraying the spatial and temporal changes in the degree of land use mix through an empirical analysis of Xi’an City.

2. Materials and Methods

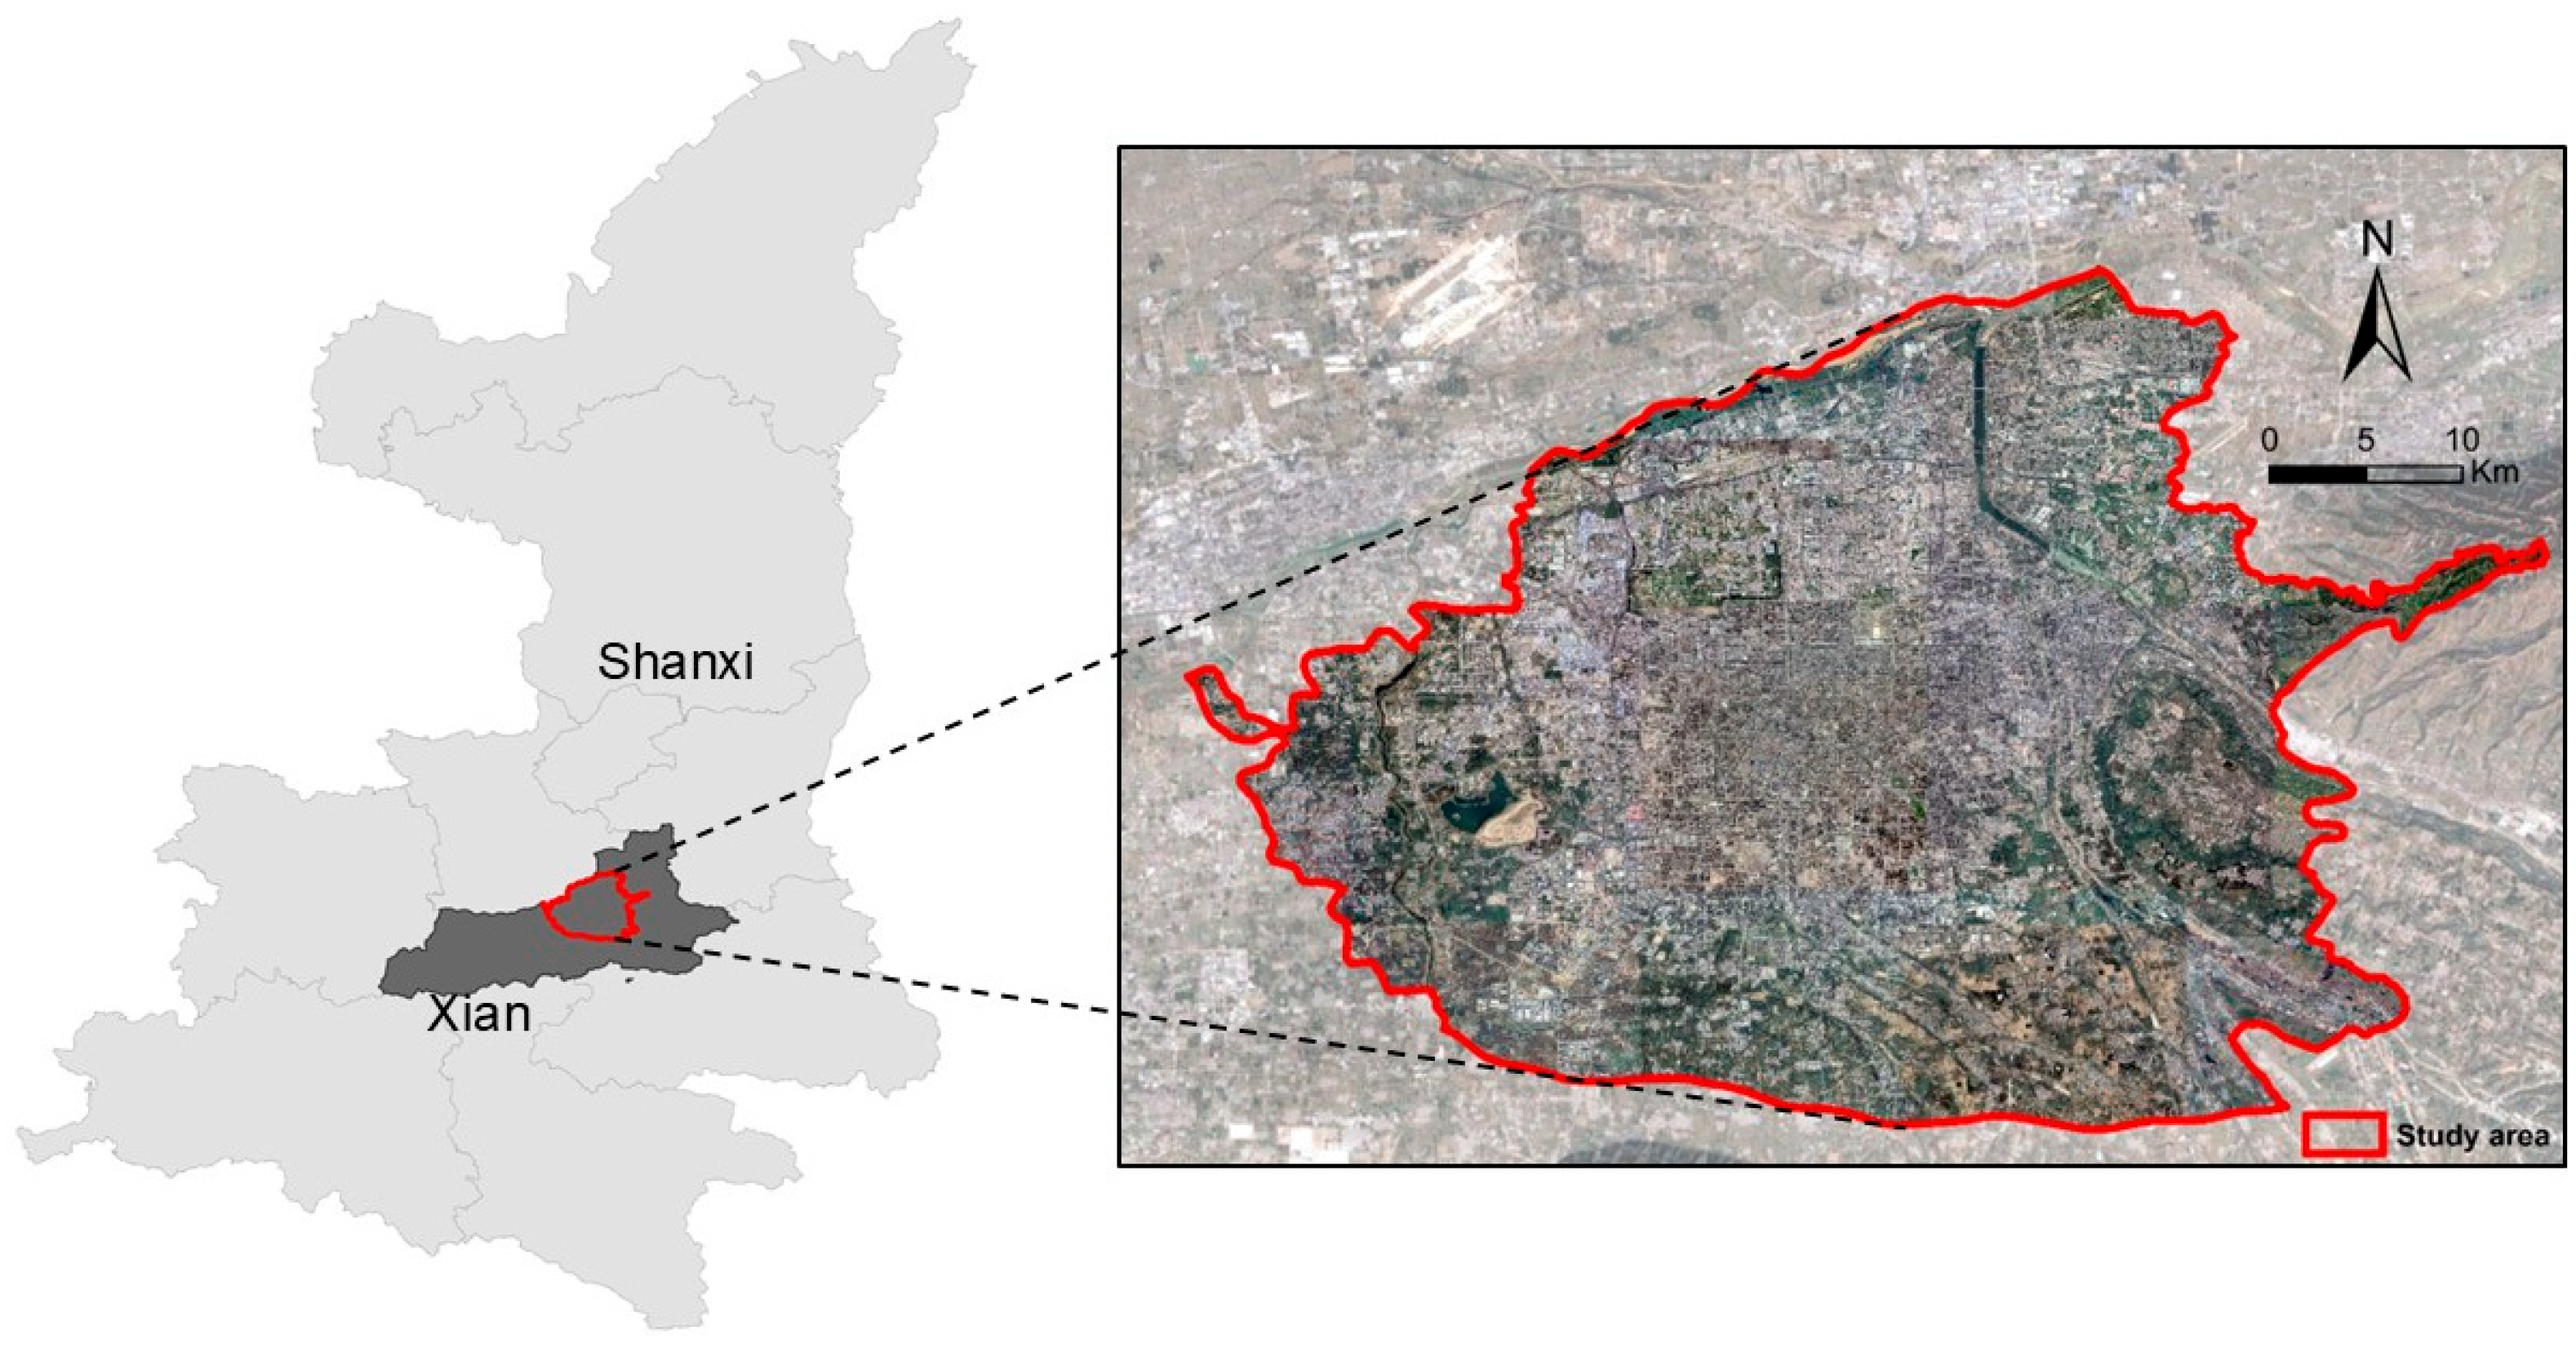
2.1. Study Area and Data

As an economic and cultural center with a long history in China (Figure 1), Xi’an has developed through many dynasties and has a profound foundation for urban construction planning. Currently, with the acceleration of urbanization, Xi’an’s urban development and land use patterns are receiving increasing attention. Xi’an has a total area of approximately 10,135 square kilometers, of which the urbanized area has reached 805.6 square kilometers. However, in recent years, Xi’an has faced the dual pressures of limited land resources and the need for urban expansion. According to “Shaanxi Province Territorial Spatial Planning (2021–2035)”, Shaanxi province will promote compact layout and intensive development through the rational delimitation of urban development boundaries. Meanwhile, Xi’an has been actively promoting the concept of the “15-min living circle” in recent years, aiming to enhance the functional complexity of urban spaces and improve residents’ convenience. In this context, the study of Xi’an’s land use structure not only serves as a representative case for urban spatial optimization and planning decision-making but also emerges as a key issue in advancing sustainable development strategies under current resource constraints. In addition, Xi’an has established a solid foundation in open data platform development and collaboration with internet map service providers. Its AOI and thermal data offer comprehensive coverage and a well-defined classification system, providing robust data support and technical assurance for the implementation of this study. Therefore, Xi’an is selected as the study area.
The traditional functional classification of urban blocks mainly relies on three types of data sources: first, on-site questionnaire survey data based on manual collection; second, the integration of land use survey reports from scientific research institutes and government departments; and third, spatial analysis by applying POI data in urban big data. Although POI data can effectively identify functional areas through spatial clustering of point elements, its discrete point features make it difficult to accurately characterize functional spatial patterns at the block scale. Compared to point data, AOI data has clear functional attribute labels and provides attributes such as area through the vector boundaries of the building’s physical contours, allowing for more accurate functional area identification. For this reason, this study introduces AOI data to construct a functional recognition model based on spatial units in the face domain.
The AOI data and thermal data used in this study were provided by Baidu Maps (http://map.baidu.com (accessed on 9 July 2025)), the largest Internet mapping service provider in China. The AOI data and thermal data were both acquired in October 2024. The AOI data include semantic attributes such as building boundaries, address information, building names, and functional type labels. Based on the inherent classification system, the data are categorized into 27 first-level, 159 second-level, and 480 third-level categories, covering major urban functional types such as residential housing, financial services, corporate enterprises, and governmental agencies. The AOI data provided by Baidu Map have been applied in recent years in research areas such as urban function identification and land use classification, with well-established empirical support for their classification accuracy and spatial completeness [19,20]. To enhance classification accuracy and interpretability, this study conducted data preprocessing, beginning with the manual removal of duplicate records and entries with missing information. In addition, AOIs deemed “not functionally representative” were further removed after manual inspection. These include (1) AOIs containing address-related information, such as village names, street names, or house numbers, which serve only to indicate spatial location without representing specific land use functions, and (2) AOIs related to access facilities, such as “Happy Gate” and other gateways or iconic entrances, which may serve as geographical landmarks but lack explicit functional attributes related to land use. Finally, 25,171 valid AOI data were obtained, which were analyzed in terms of data attributes, including business land (6842), residential land (7489), public administration and public service land (6494), industrial land (2963), green space plaza land (865), and transportation land (518).
This study adopts a multi-scale analysis approach, with blocks at the street block scale as the basic study units. Road network data is used to delineate blocks at this scale. The raw data were first subjected to consistency checking and topology cleaning, including the removal of duplicate and disconnected roads. Referring to the “Xi’an Urban and Rural Management Technical Provisions” regarding the control standards for urban road red-line widths, this study comprehensively considers the control widths associated with different road classifications and adopts a compromise value of 10 m as the road network buffer width for the delineation of blocks. To further analyze the fine-grained characteristics of land use functions, each street block was further divided into a regular grid of 30 × 30 m, which was used as a sub-analysis unit for business hours speculation and dynamic characterization. This spatial scale has been widely adopted in numerous existing land use analyses and urban structure studies [21,22].

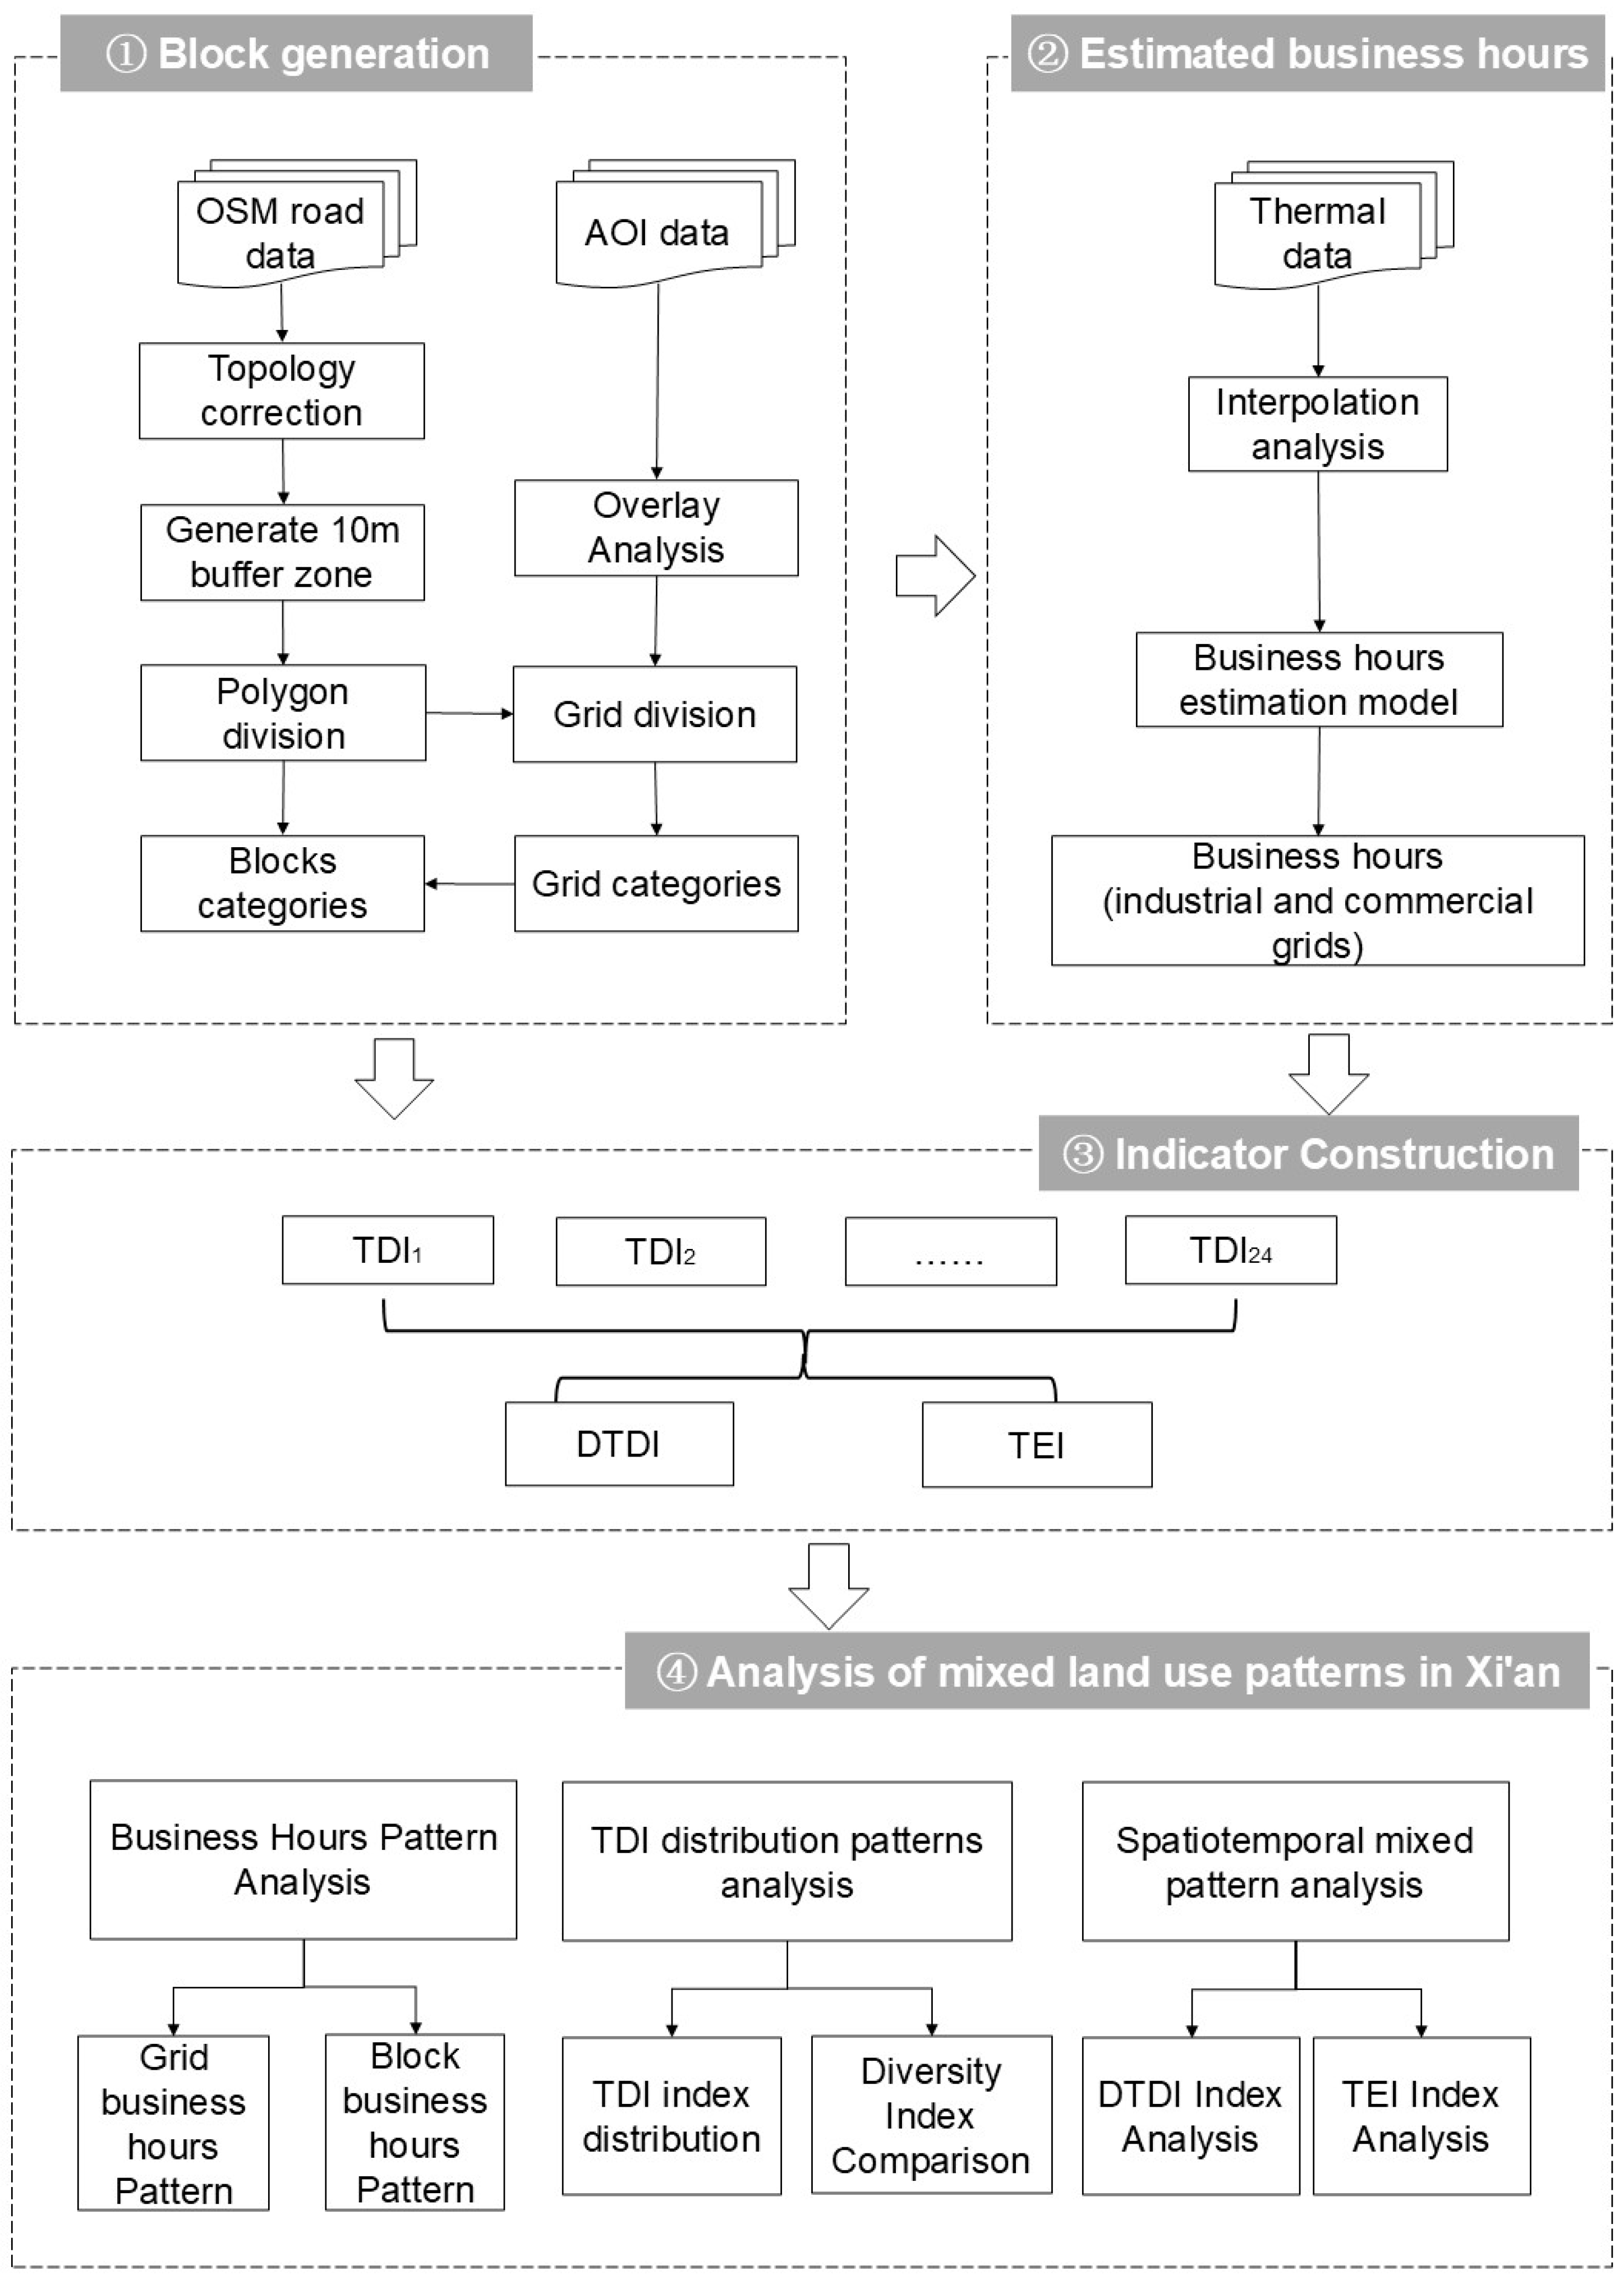
2.2. Framework for Characterizing Mixed Land-Use Patterns

Compositional patterns of land use mix usually include both the degree of mixing and the dominant type. In order to effectively identify land use mix patterns in Xi’an, this study identifies the dominant functional type of each block at the street block scale. Typically, the functional characteristics of urban areas are mostly characterized in percentage terms. However, this approach is often difficult to intuitively reflect the spatial characteristics of urban functions in complex functional mixing situations, especially when the AOI data covers ten or more functional types, as the high degree of mixing between functions may lead to increased complexity of spatial representation, thus making map interpretation difficult. Based on this, Kim et al. have proposed a triangular categorization model of “live-work-visit” based on the core purpose of human activities [23], which is widely used in related studies [2]. Referring to the results of previous studies and combined with the land use characteristics of Xi’an, this study finally divides the functions of the blocks into three major categories: residence (R), industrial (I), and business (B). Among them, “Residence” includes single residential land use, mixed residential land use and residential ancillary facilities; “Industry” includes corporate land, industrial parks and commercial office buildings; and“Business” integrates business, green space and public management and service functions, including business land for finance and insurance, automobile services, restaurants, hotels, shopping and consumption, and public service and management land for science, education and culture, health care, government organizations, sports and leisure, and green squares (Table 1).
In the calculation of the mixing indicator, the dominant function of land use is classified by calculating the proportion of the three types of land, When one function occupies more than 80% of the land area, it is recognized as a single-function type of functional area dominated by that function, and if the sum of the land areas of the two functions is greater than 80%, it is recognized as a mixed-function area consisting of these two functions. If all functions occupy more than 20% of the land, they are recognized as homogeneous mixed-function areas, from which the blocks in Xi’an can be classified into seven mixing types. In addition, for all the areas where the site area is less than 20% of the total area of the block and where data are missing, this paper identifies them as missing data blocks, and the classification framework is shown in Figure 2.

2.3. Methodology

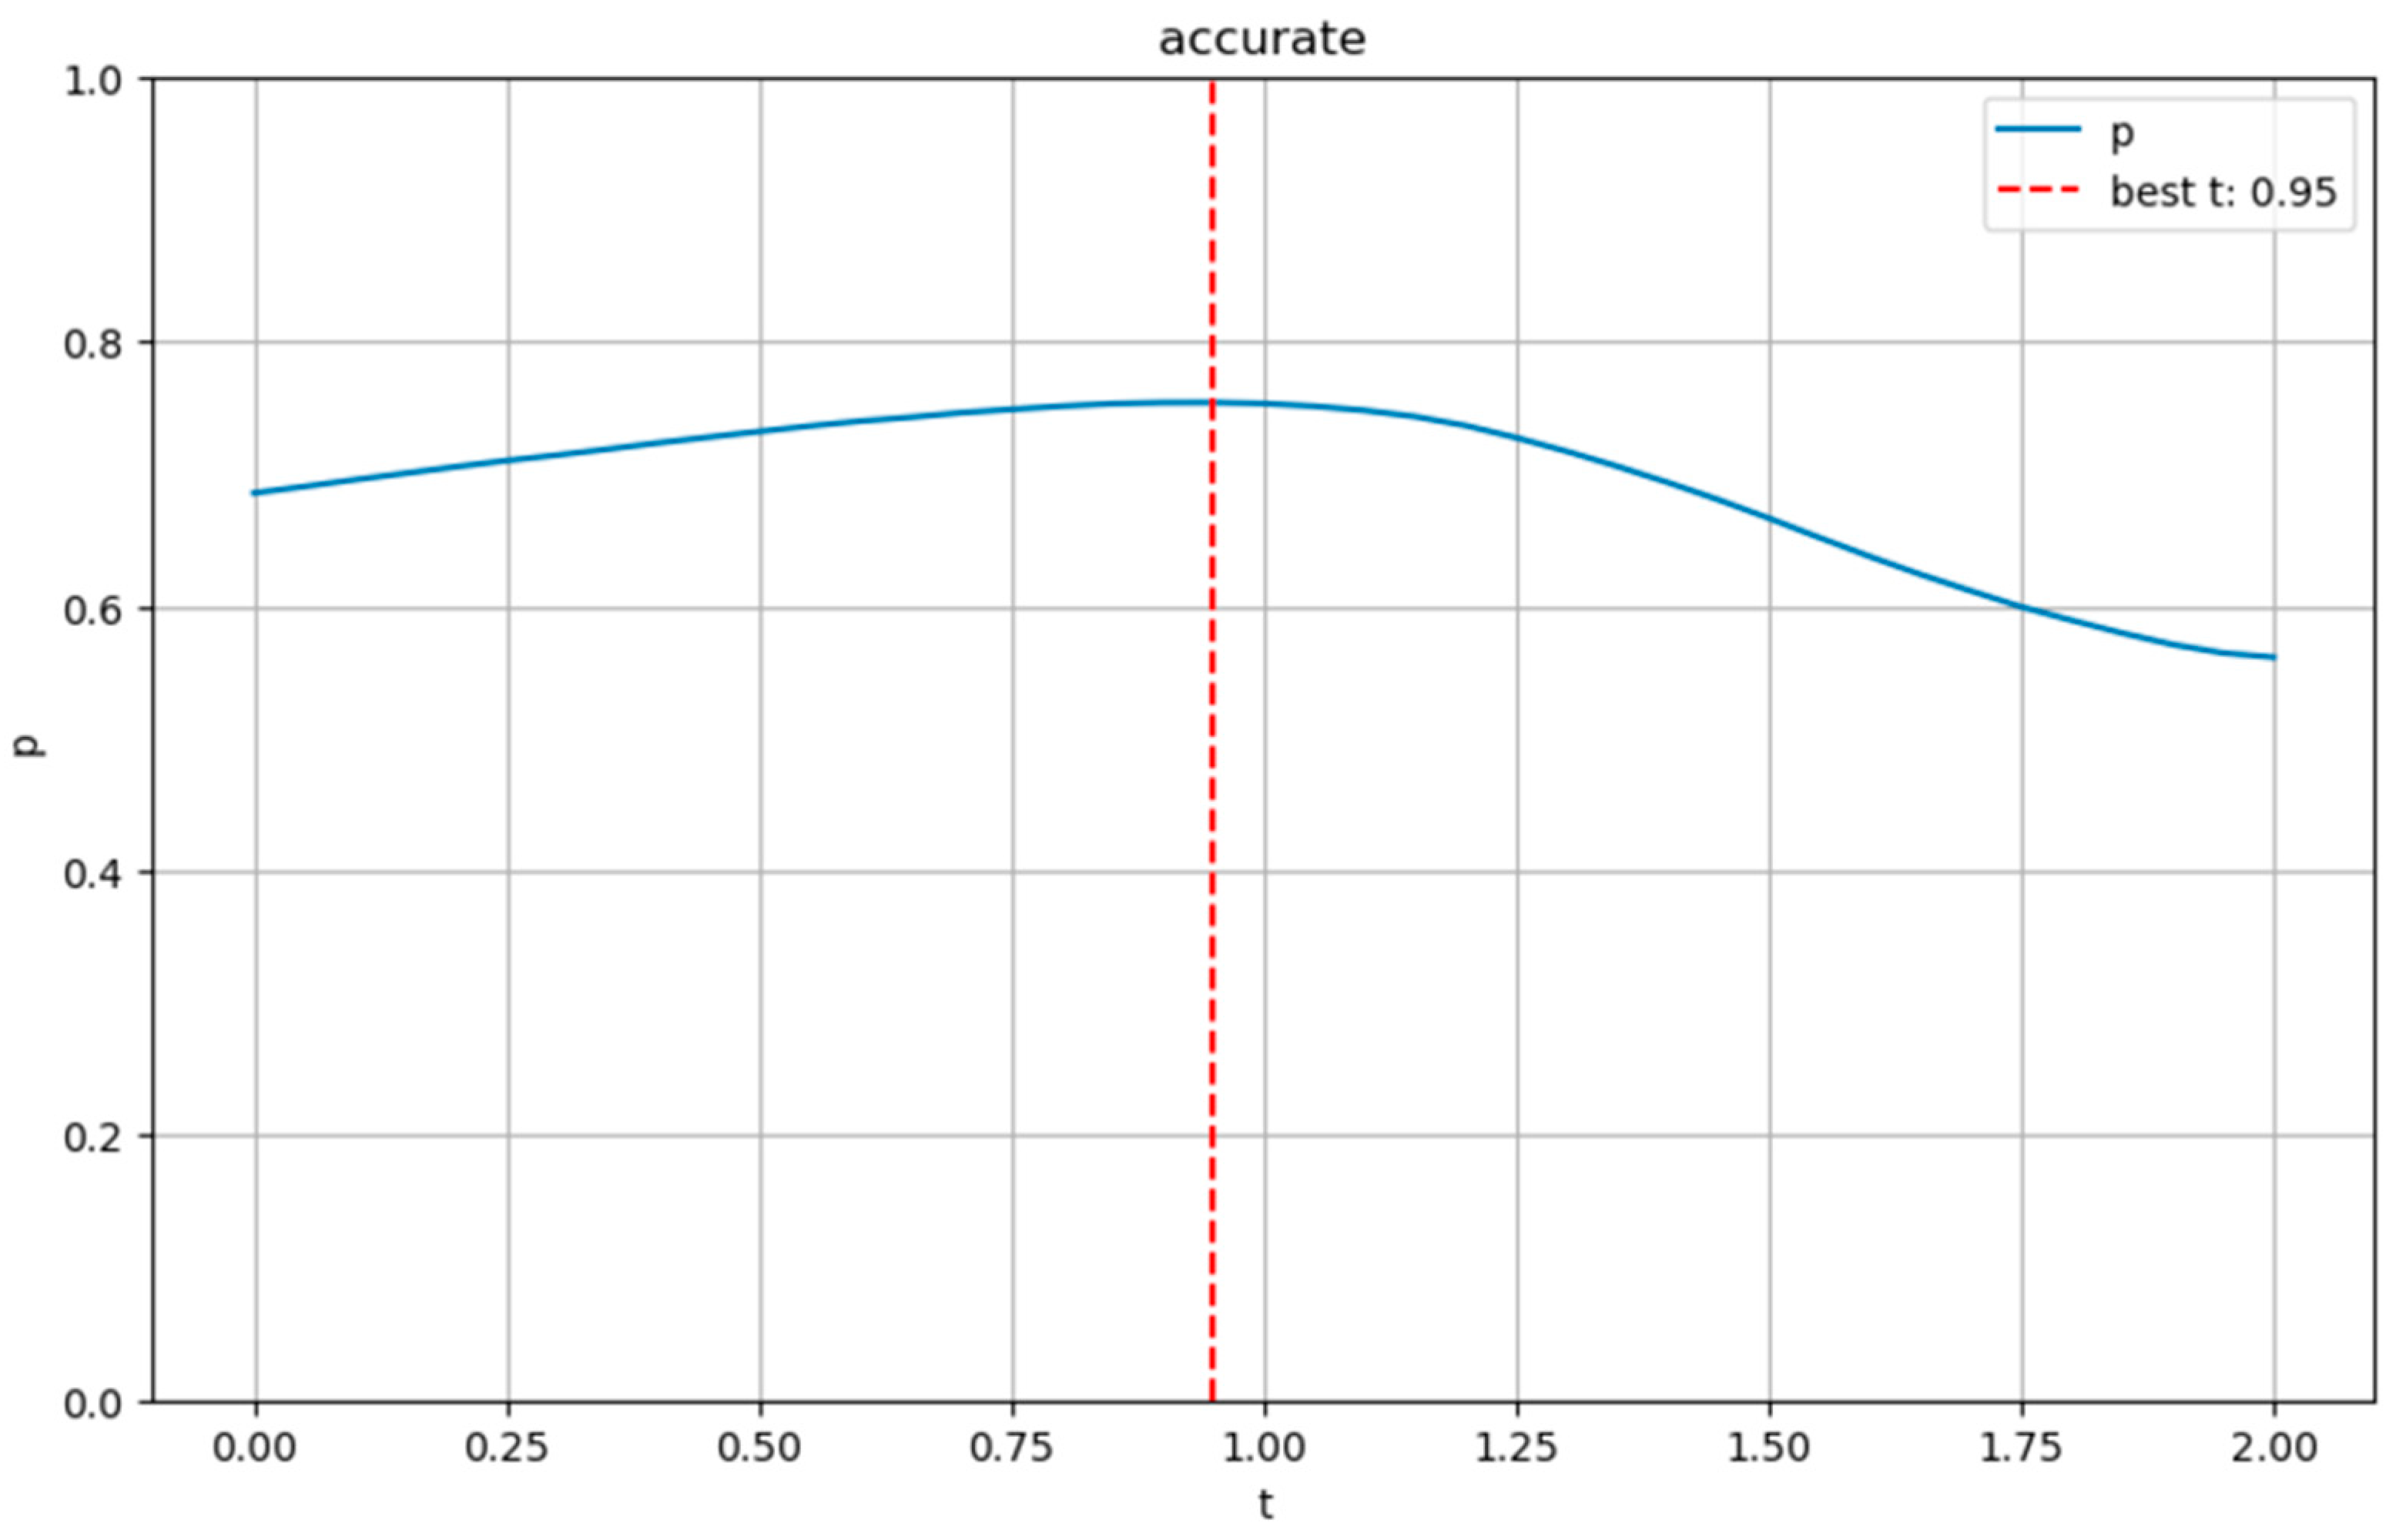
2.3.1. Business Hours Analysis Model

In this study, the thermal values for each grid over a 24 h period were extracted to generate thermal curves that depict the variation in pedestrian flow across plots over time. These curves were then further analyzed to determine business hours. To obtain reliable business hours, the thermal data underwent preprocessing: a Gaussian filtering method was applied to smooth the data within a defined time window, improving data quality by eliminating outliers. The time window was set to encompass two hours before and after the specific time point.
The slope plot of the thermal curve illustrates the rate of change in pedestrian flow over time, providing a clear visualization of the increase or decrease in pedestrian flow. Considering the difficulty of obtaining business hours for a wide range and multiple types of blocks in reality, this study uses thermal data as a proxy variable for block business hours on a theoretical basis: crowd activity, to a certain extent, reflects the opening status and service hours of block functions. Especially in commercial and public service land, the entry and stay of the crowd are usually closely associated with the activation of functions. Therefore, by identifying the starting and ending times of crowd activity intensity, the possible opening hours of block functions can be inferred. Specifically, when a land use enters or exits its business state, it is typically accompanied by rapid changes in crowd activity, reflected as significant fluctuations in the slope of the thermal intensity curve. Therefore, this study constructs a slope curve using the first-order difference of the thermal data, identifying the local maxima of the slope as opening times and the local minima as closing times. However, due to transient fluctuations, noise, and outliers present in the thermal data, a reasonable slope threshold must be established to exclude insignificant changes and thus avoid misclassification. In this study, based on the principle of statistical distribution, the threshold interval for the slope curve was constructed using the mean plus or minus K times the variance. Among them, some AOI sample data used in this study provide explicit business hour labels, based on which this paper conducts parameter training and fitting. Specifically, the 24 h period is broken down into hour-by-hour business states, the K value is continuously adjusted, and the overall recognition accuracy is calculated by comparing the predicted hourly business status with the ground truth labels. The K value corresponding to the optimal prediction accuracy is ultimately selected as the criterion for setting the slope threshold. The results indicate that the accuracy of business hour identification reaches a maximum of 75.37% when K ≈ 0.95 (Figure 3). Accordingly, the slope threshold is uniformly set as the mean slope plus or minus 0.95 times the variance.
Further, the local maxima in the slope curve exceeding the upper threshold are identified as opening times, while the local minima below the lower threshold are identified as closing times, thereby constructing the sets of opening time points T o p e n = T o p e n 1 , T o p e n 2 , , T o p e n N and closing time points T c l o s e = T c l s o e 1 , T c l o s e 2 , , T c l o s e N , points in time where the slope value is within the upper and lower threshold lines are considered insufficient to significantly change the business status. Due to the absence of data from the previous and following days, this study does not identify opening and closing behavior at 00:00 and 23:00.
Build a collection of time points by sorting the extracted set of closing time points in the order of 0–24 h T = T 1 , T 2 , , T N . In order to extract the Business hours period, the following rules are followed:
(1)
If there are adjacent T o p e n time points, keep the previous one;
(2)
If there are adjacent T c l o s e time points, keep the one that is next to it;
(3)
If the first time point is a closing time and the last time point is an opening time, i.e., T 1 T c l o s e , T N T o p e n , it is considered an inter-night case and is retained;
(4)
Delete if there is only a single closing time point or opening time point.
After processing according to the above rules, removing the duplicate points, and checking that the data is correct, the business hours of all grids can be extracted.

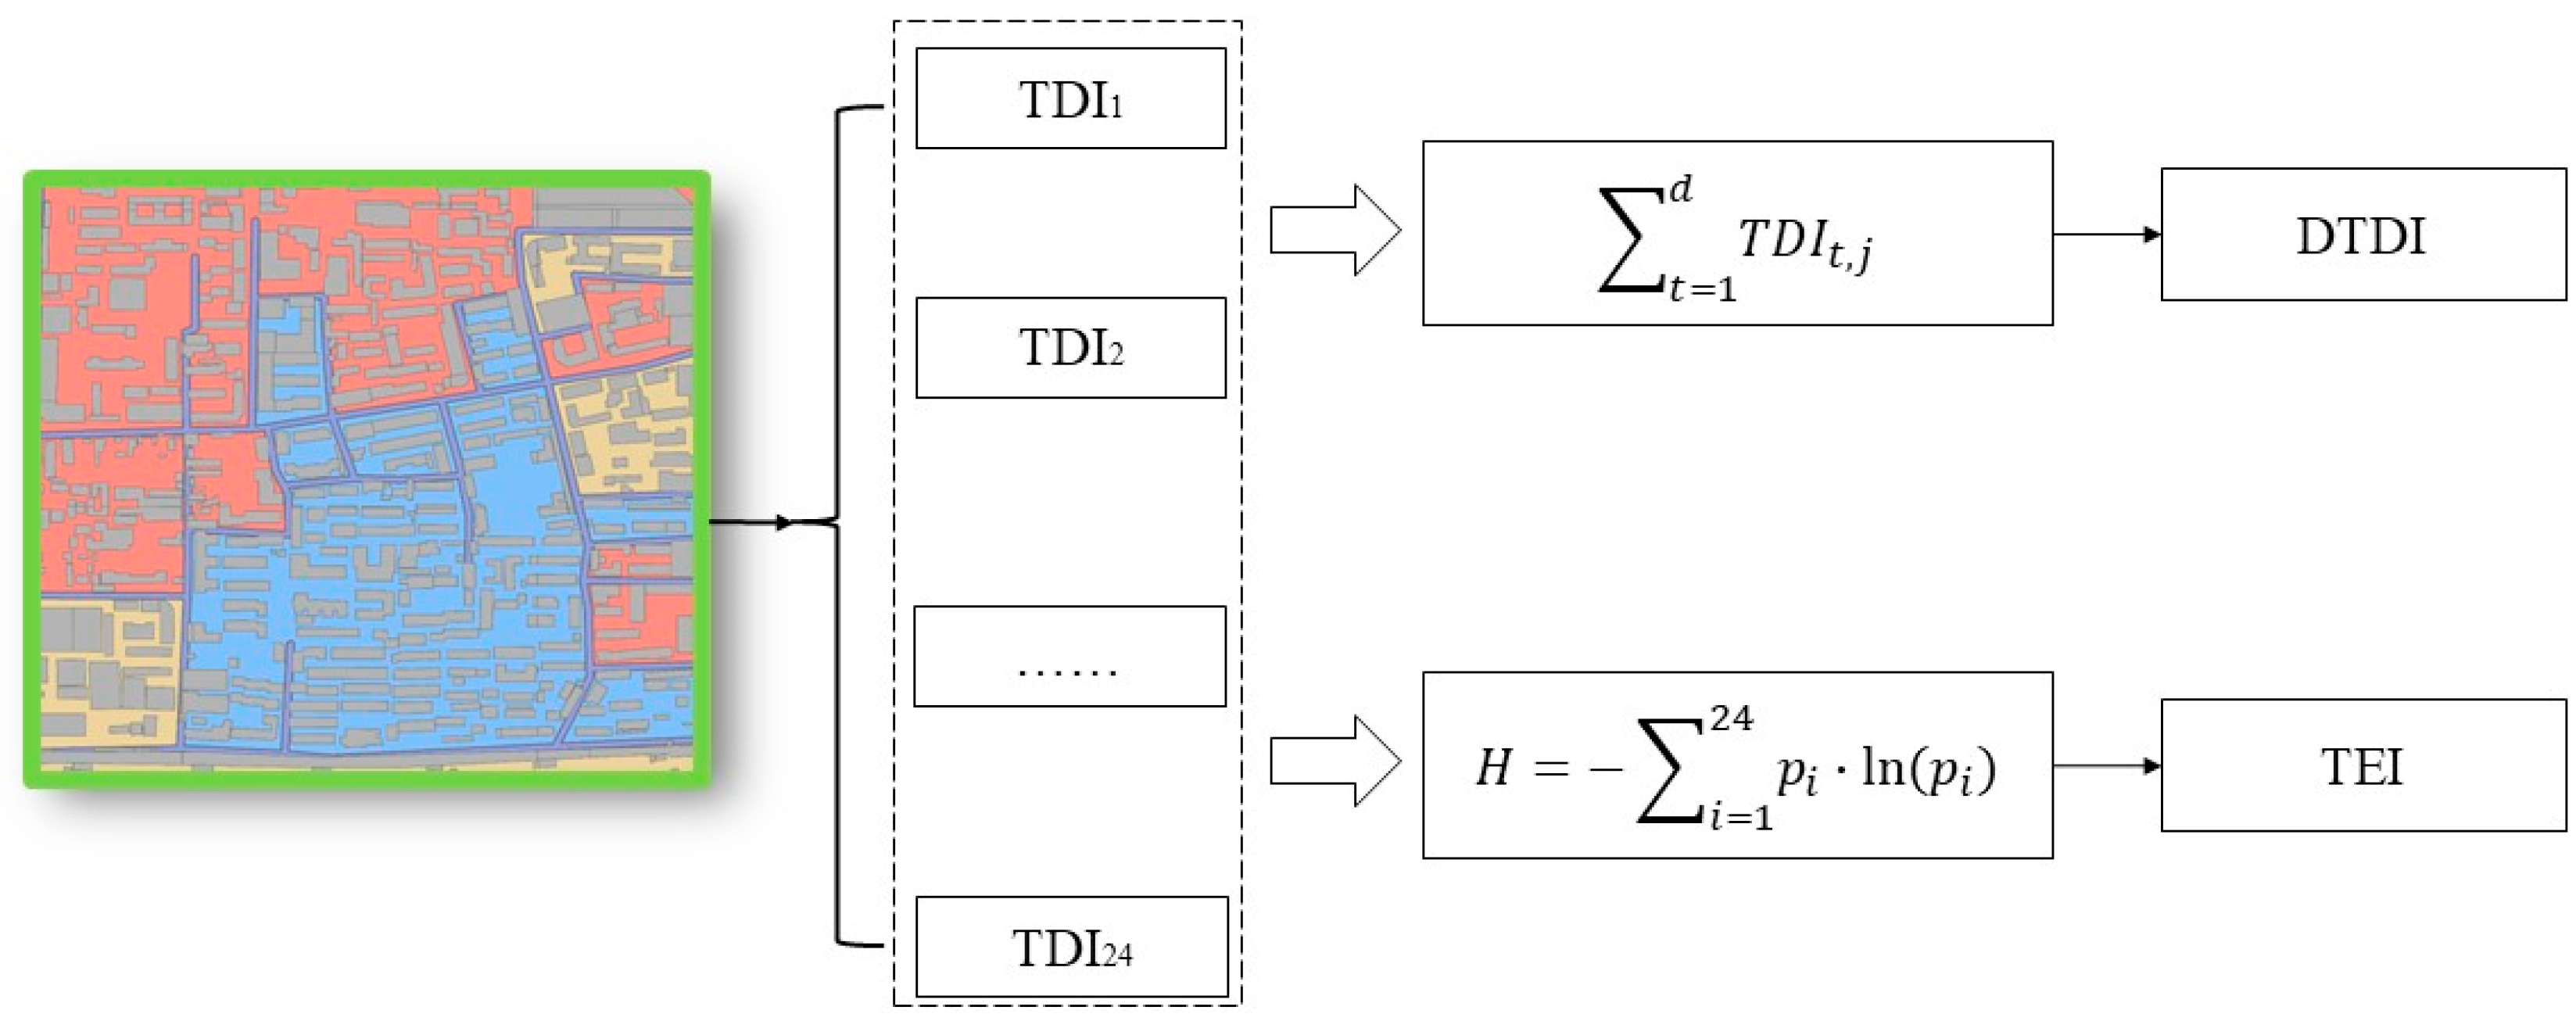
2.3.2. Construction of the Indicator System

This paper constructs an indicator system based on the business hours of the extracted land use grids, consisting of three indicators: the temporal diversity index (TDI), the daily temporal diversity index (DTDI), and the temporal entropy index (TEI) of the blocks, as illustrated in Figure 4.
  • Temporal Diversity Index (TDI) and Daily Temporal Diversity Index (DTDI)
The measurement of diversity usually includes two aspects, richness and evenness. In biology, the former indicates the number of species, and the latter indicates the evenness of species. As this paper divides the study area blocks into each 30 × 30 m grid, it can be borrowed from the method of calculating Shannon’s index in biology to calculate the mixing degree of the blocks through the grids from the number of different land uses and the evenness of the distribution of the land uses to measure the degree of diversity of land use mix. In addition, the grid is screened and processed in combination with the business hours information of block functions to evaluate the diversity characteristics of the blocks across different time periods.
Specifically, at any given time, based on the Shannon diversity calculation method, the diversity is computed only for the grids that are in operation and classified as either commercial or industrial. The Shannon diversity index H t , j for block j at moment t is:
H t , j = i = 1 S t , j p i , t , j ln ( p i , t , j )
In the formula,
S t , j represents the number of land use types in operation in block j at time t .
p i , t , j represents the proportion of land area of type i land use in block j at time t .
H t , j represents the Shannon diversity index of block j at time t .
Meanwhile, based on the calculation method of the Shannon evenness index, the Shannon evenness of block j at time t is calculated as follows:
E t , j = H t , j ln ( S t , j )
In the formula,
E t , j represents the Shannon average index of block j at time t .
Combining the Shannon diversity index with the Shannon evenness index helps to more comprehensively capture the diversity characteristics of a block from multiple dimensions [24]. Therefore, this study takes the average of the two to construct the temporal diversity index T D I t , j for block j at moment t :
T D I t , j = H t , j + E t , j 2 ,
The larger the value of T D I t , j , the greater the diversity of land use types in block j at time t . The temporal diversity index is used to measure the diversity of a block at different times of the day. At the same time, for an integrated and comprehensive assessment of the diversity of land use mix in Xi’an City, this paper also calculates the average daily diversity index D T D I j of a block, and the average daily diversity index of block j is calculated as follows:
D T D I j = t = 1 d T D I t , j ,
In the formula,
d represents the total number of time periods in a day, usually d = 24.
This index effectively reflects the average daily diversity value of block j , fully considering the role of time dimension. The larger value of D T D I j indicates the higher land use diversity of block j in that day, which reflects the functional complexity and intensity of use of the block in a day.
2.
Diversity Time Entropy Index (TEI)
Shannon first introduced the concept of information entropy, after which entropy metrics were widely used to analyze the homogeneity and diversity of data [25]. Frank pioneered the application of entropy in urban planning by calculating the entropy value of different land uses in order to obtain the uniformity of the spatial distribution of land use [26]. In recent years, some scholars in the field of urban planning have also gradually used the entropy value for the measurement of land use diversity [27,28]. However, these studies have focused mainly on spatial data. Li et al. proposed to apply entropy to temporal analysis and constructed a temporal entropy index [17]. Specifically, the temporal entropy metric is based on a collection of points in time throughout the day. Assume that the number of metrics to be characterized per hour is T 1 , T 2 , , T n . A comparison of individual metrics with the total can be constructed with probabilities p 1 , p 2 , , p N :
p i = T i t = 1 n T n ,
Then, the entropy of time in a day H can be expressed as:
H = i = 1 N p i · ln p i ,
where N is the total number of time points in a day, since the time scale selected for this paper is hourly. Thus, N = 24 . If the probability value of i at a certain moment is p i = 0 , according to the limit property lim p 0 + p · ln p = 0 , its corresponding entropy component p i · ln p i is defined to be 0. From the above equation, when each hourly indicator volume T 1 = T 2 = , , = T n (i.e., p 1 = p 2 = , , = p n ), the time entropy can be maximized, indicating a more balanced variation of the statistic throughout the day.
In this study, in order to explore the diversity equilibrium of the block on a day, the characterization metric T is therefore the temporal diversity index T D I , which leads to the diversity temporal entropy metric of the block j :
T E I j = n = 1 24 p n · ln ( p n ) ,
where p n denotes the probability that the temporal diversity value of the block at time n is accounted for. Typically, higher temporal entropy indicates that the block has a balanced diversity across time and that the block’s hours of operation are reasonable, whereas lower temporal entropy indicates that the block may only have high diversity at certain times and low diversity at other times and unreasonable hours of operation.
The three indicators constructed in this study can be regarded as extensions of the classic Shannon diversity entropy in the temporal dimension. TDI measures the degree of land use type mixing at any given time, incorporating both richness and evenness based on the traditional entropy index. DTDI reflects the overall diversity level of the block throughout the day, representing the cumulative expression of TDI on a daily scale. TEI evaluates the temporal balance in the distribution of TDI across different time periods within a day, indicating the temporal stability of the functional diversity of the block.
In order to realize the analysis of the spatio-temporal mixing pattern of land use in Xi’an, this paper proposes a land use mix evaluation framework consisting of three indexes, namely TDI, DTDI, and TEI, based on the AOI data, thermal data, and OSM road network data, and analyzes the analysis with Xi’an as the study area. The process of the proposed framework consists of four steps, which are shown in Figure 5, as follows. First, the AOI data were subjected to topology correction, buffer generation, and polygonal delineation steps to delineate the study area blocks and further divided the blocks into grids, and the AOI data were utilized to determine the functional type of the grids. Second, the grid operating hours are speculated based on thermal data and available AOI operating hours data. Third, TDI, DTDI, and TEI indicators were constructed in order to measure the spatio-temporal mixing patterns of land use and facilitate the evaluation of spatio-temporal mixing patterns of land use. Finally, using Xi’an City as the study area, a business hours pattern analysis, a land use temporal diversity analysis, and a spatio-temporal mixing pattern analysis were performed. In addition, the superiority of the indicator system in the mixed spatio-temporal measurement of land use is demonstrated by comparing it with the original measurement method.

3. Results

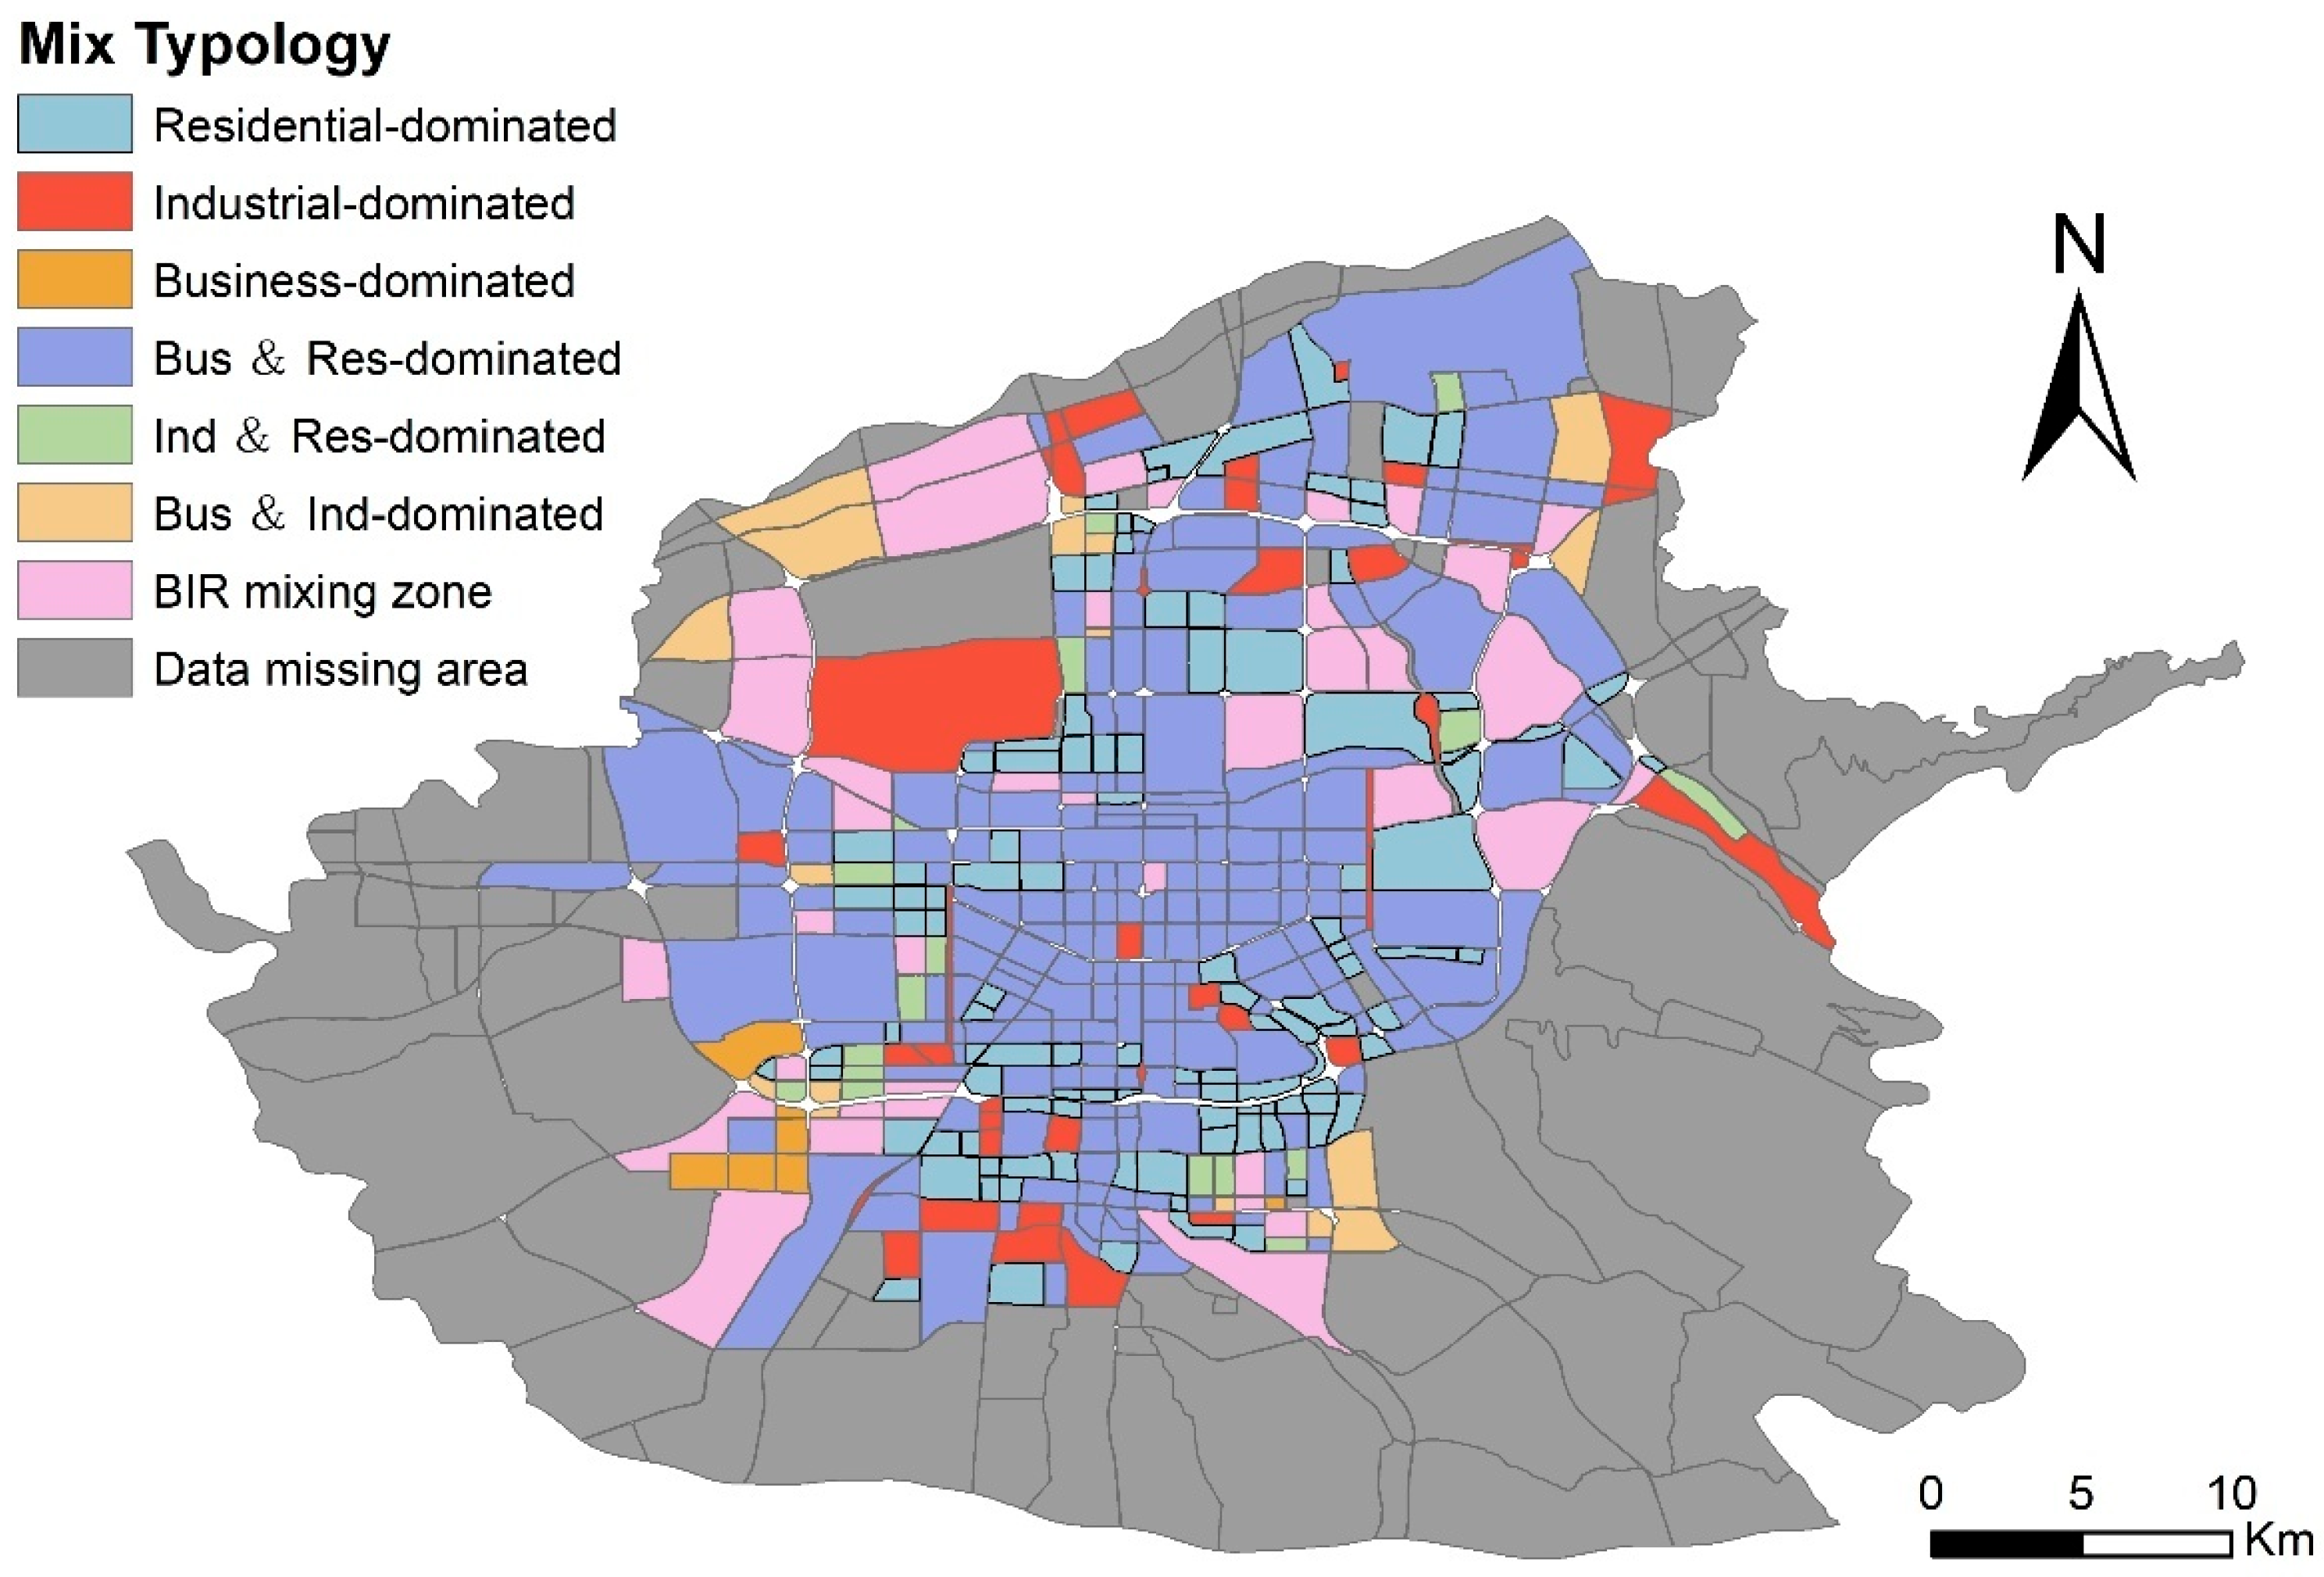
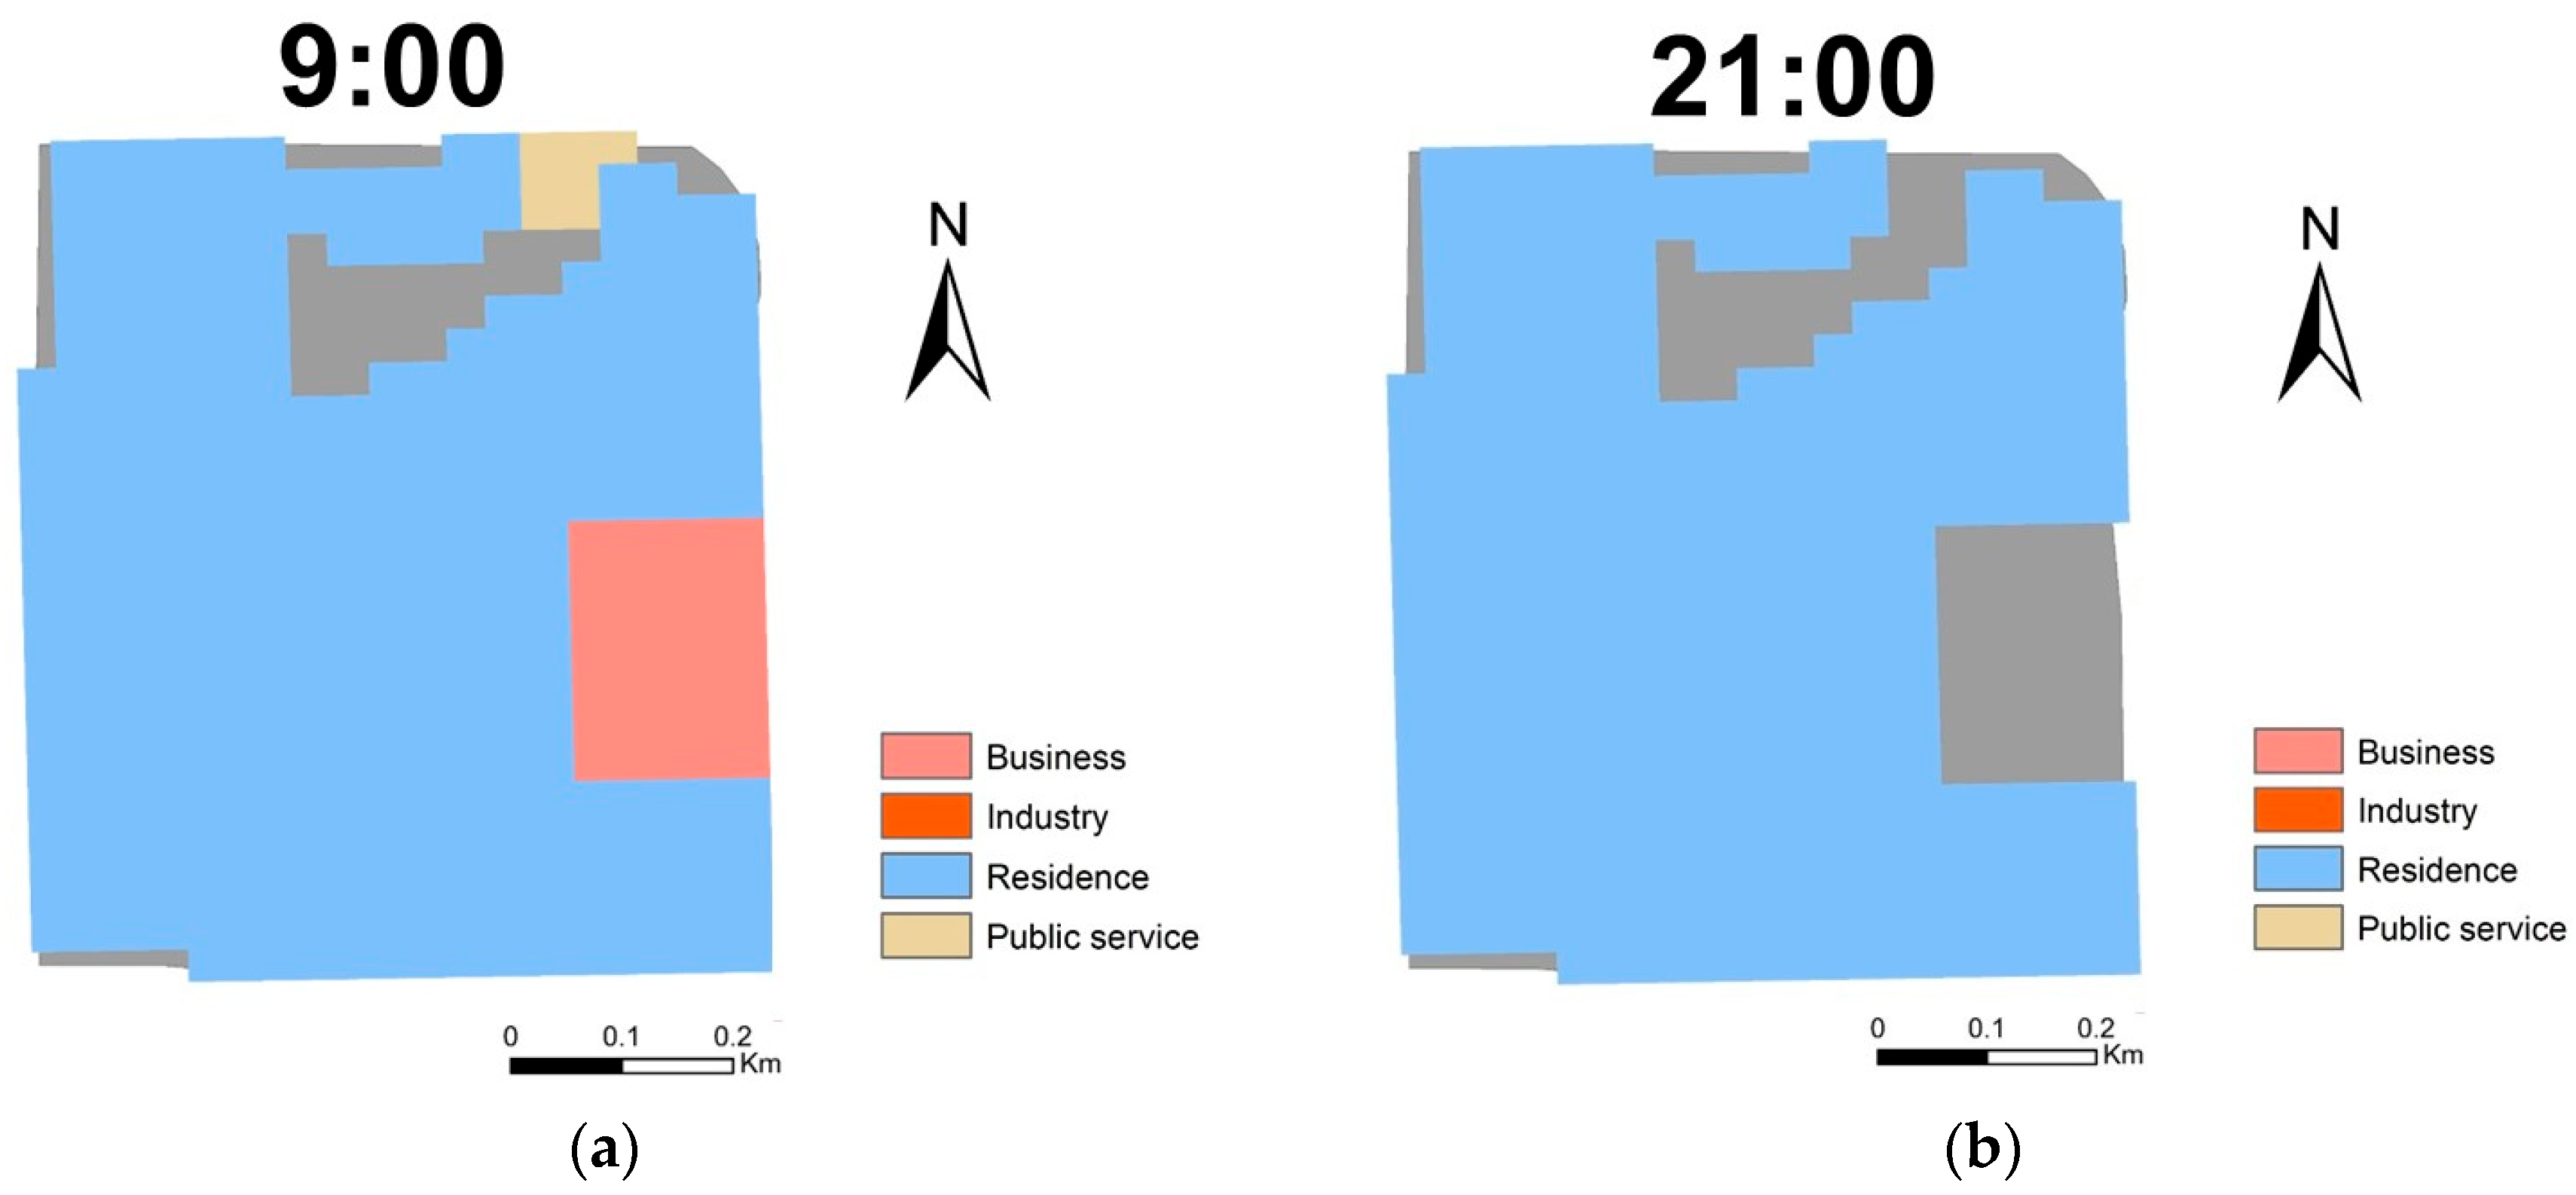
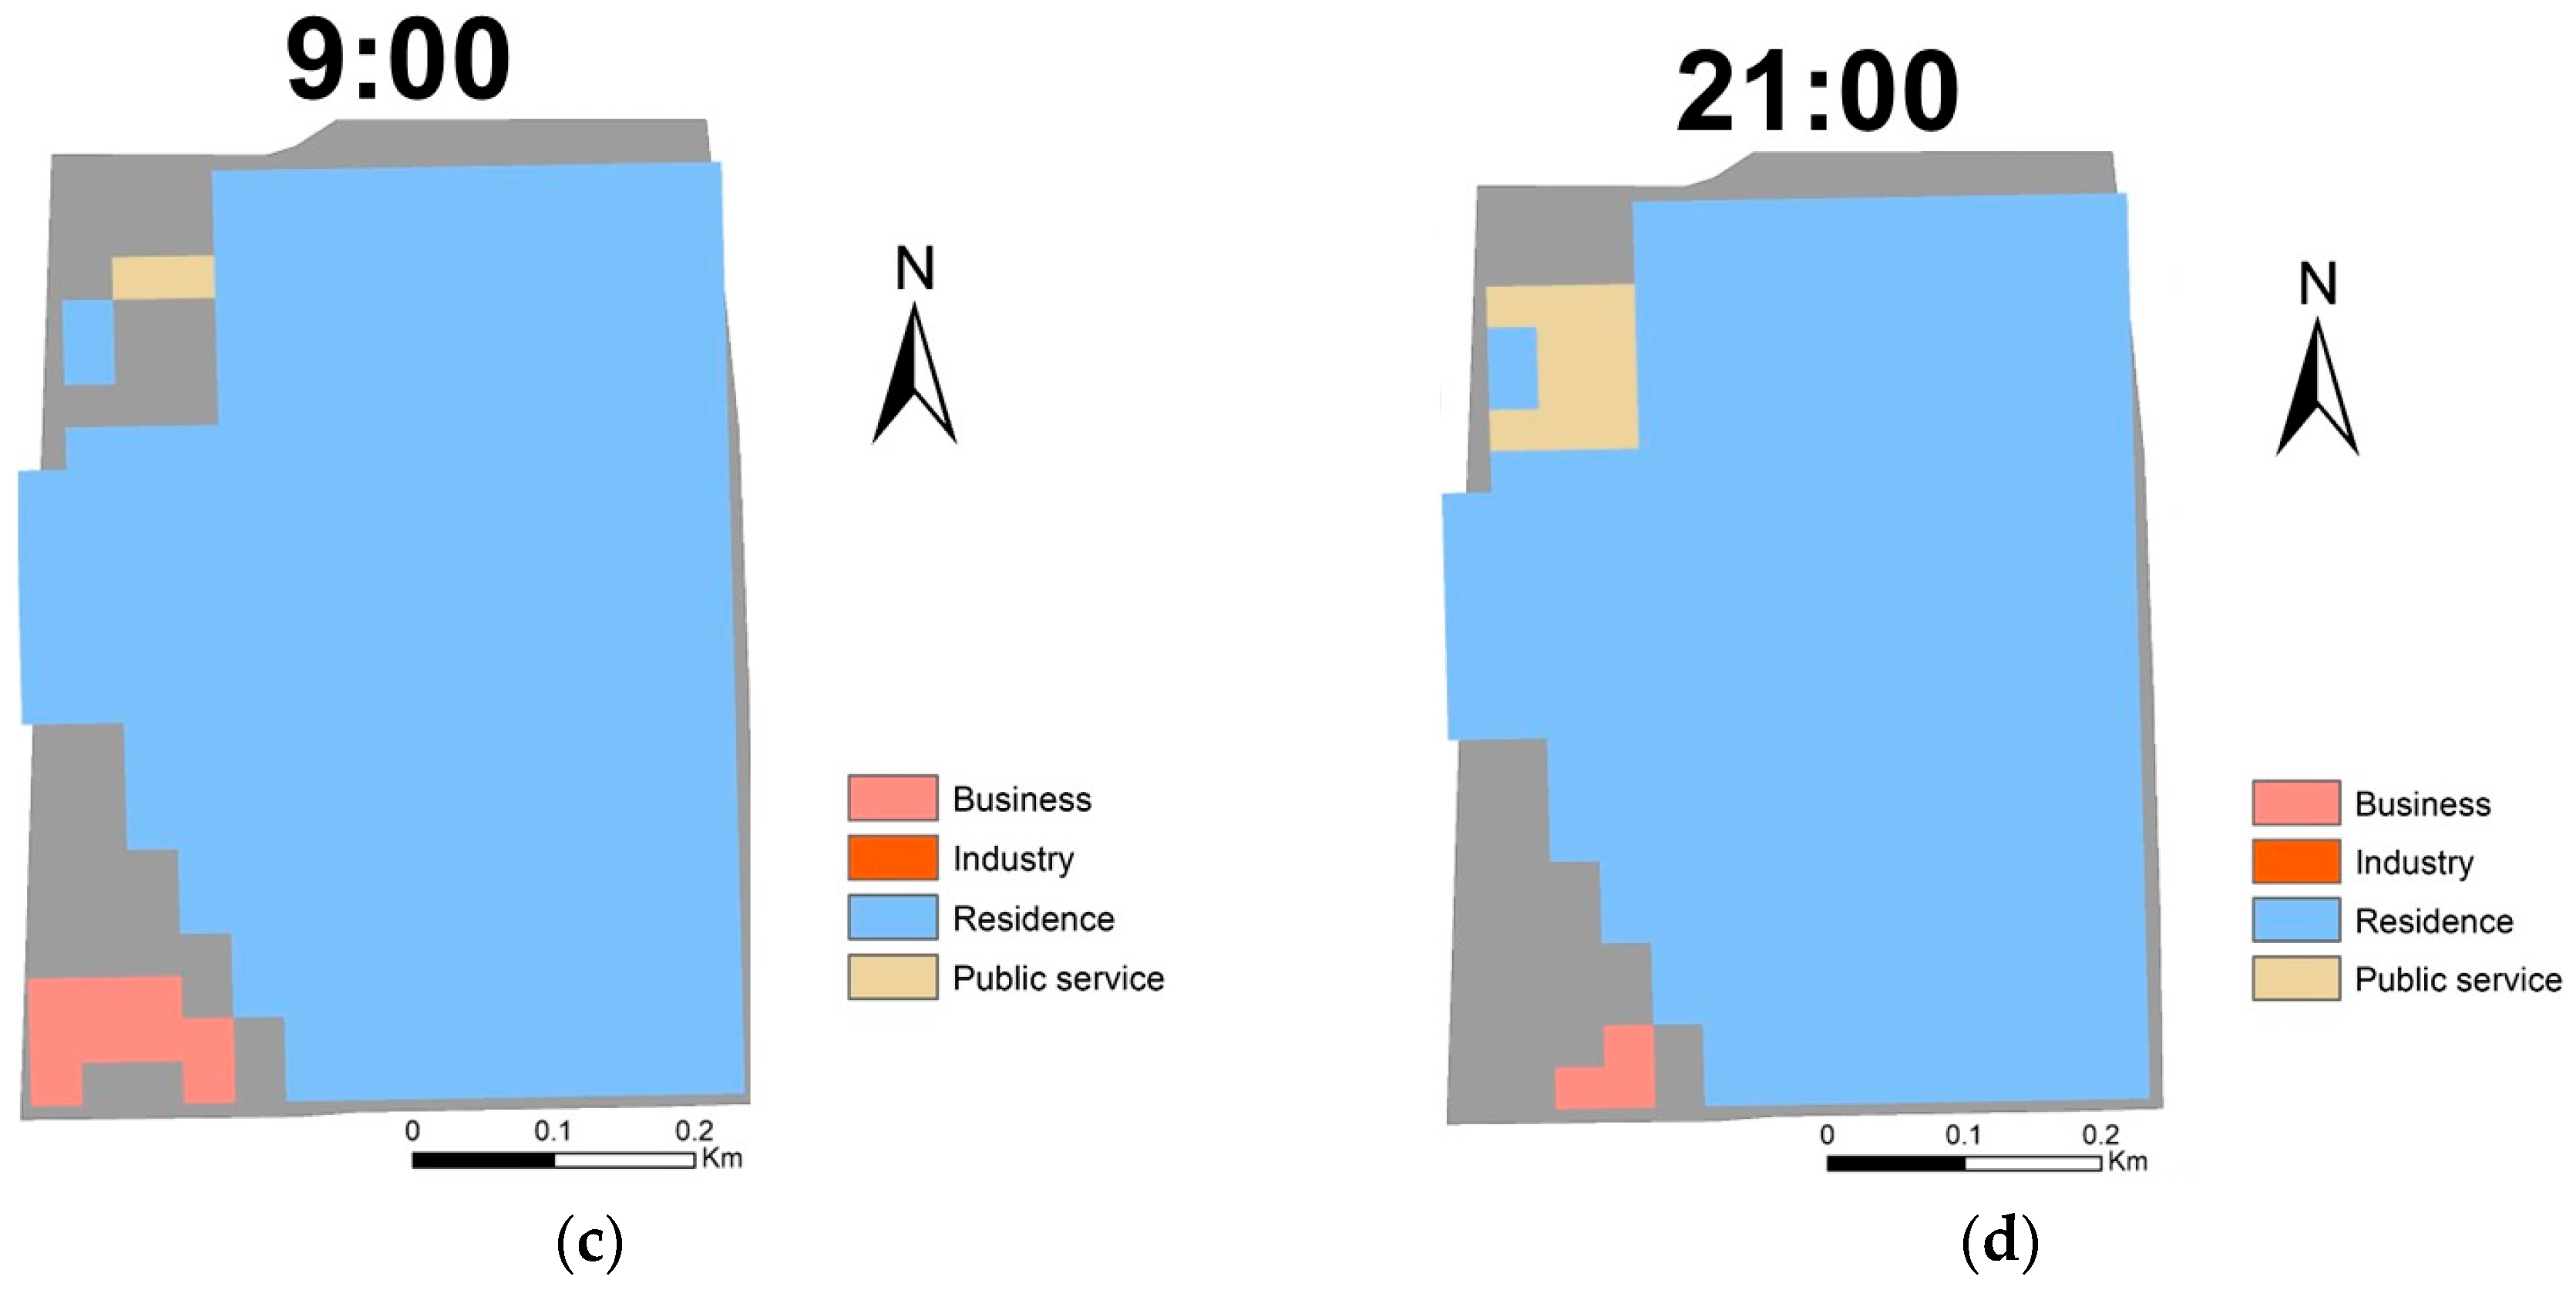
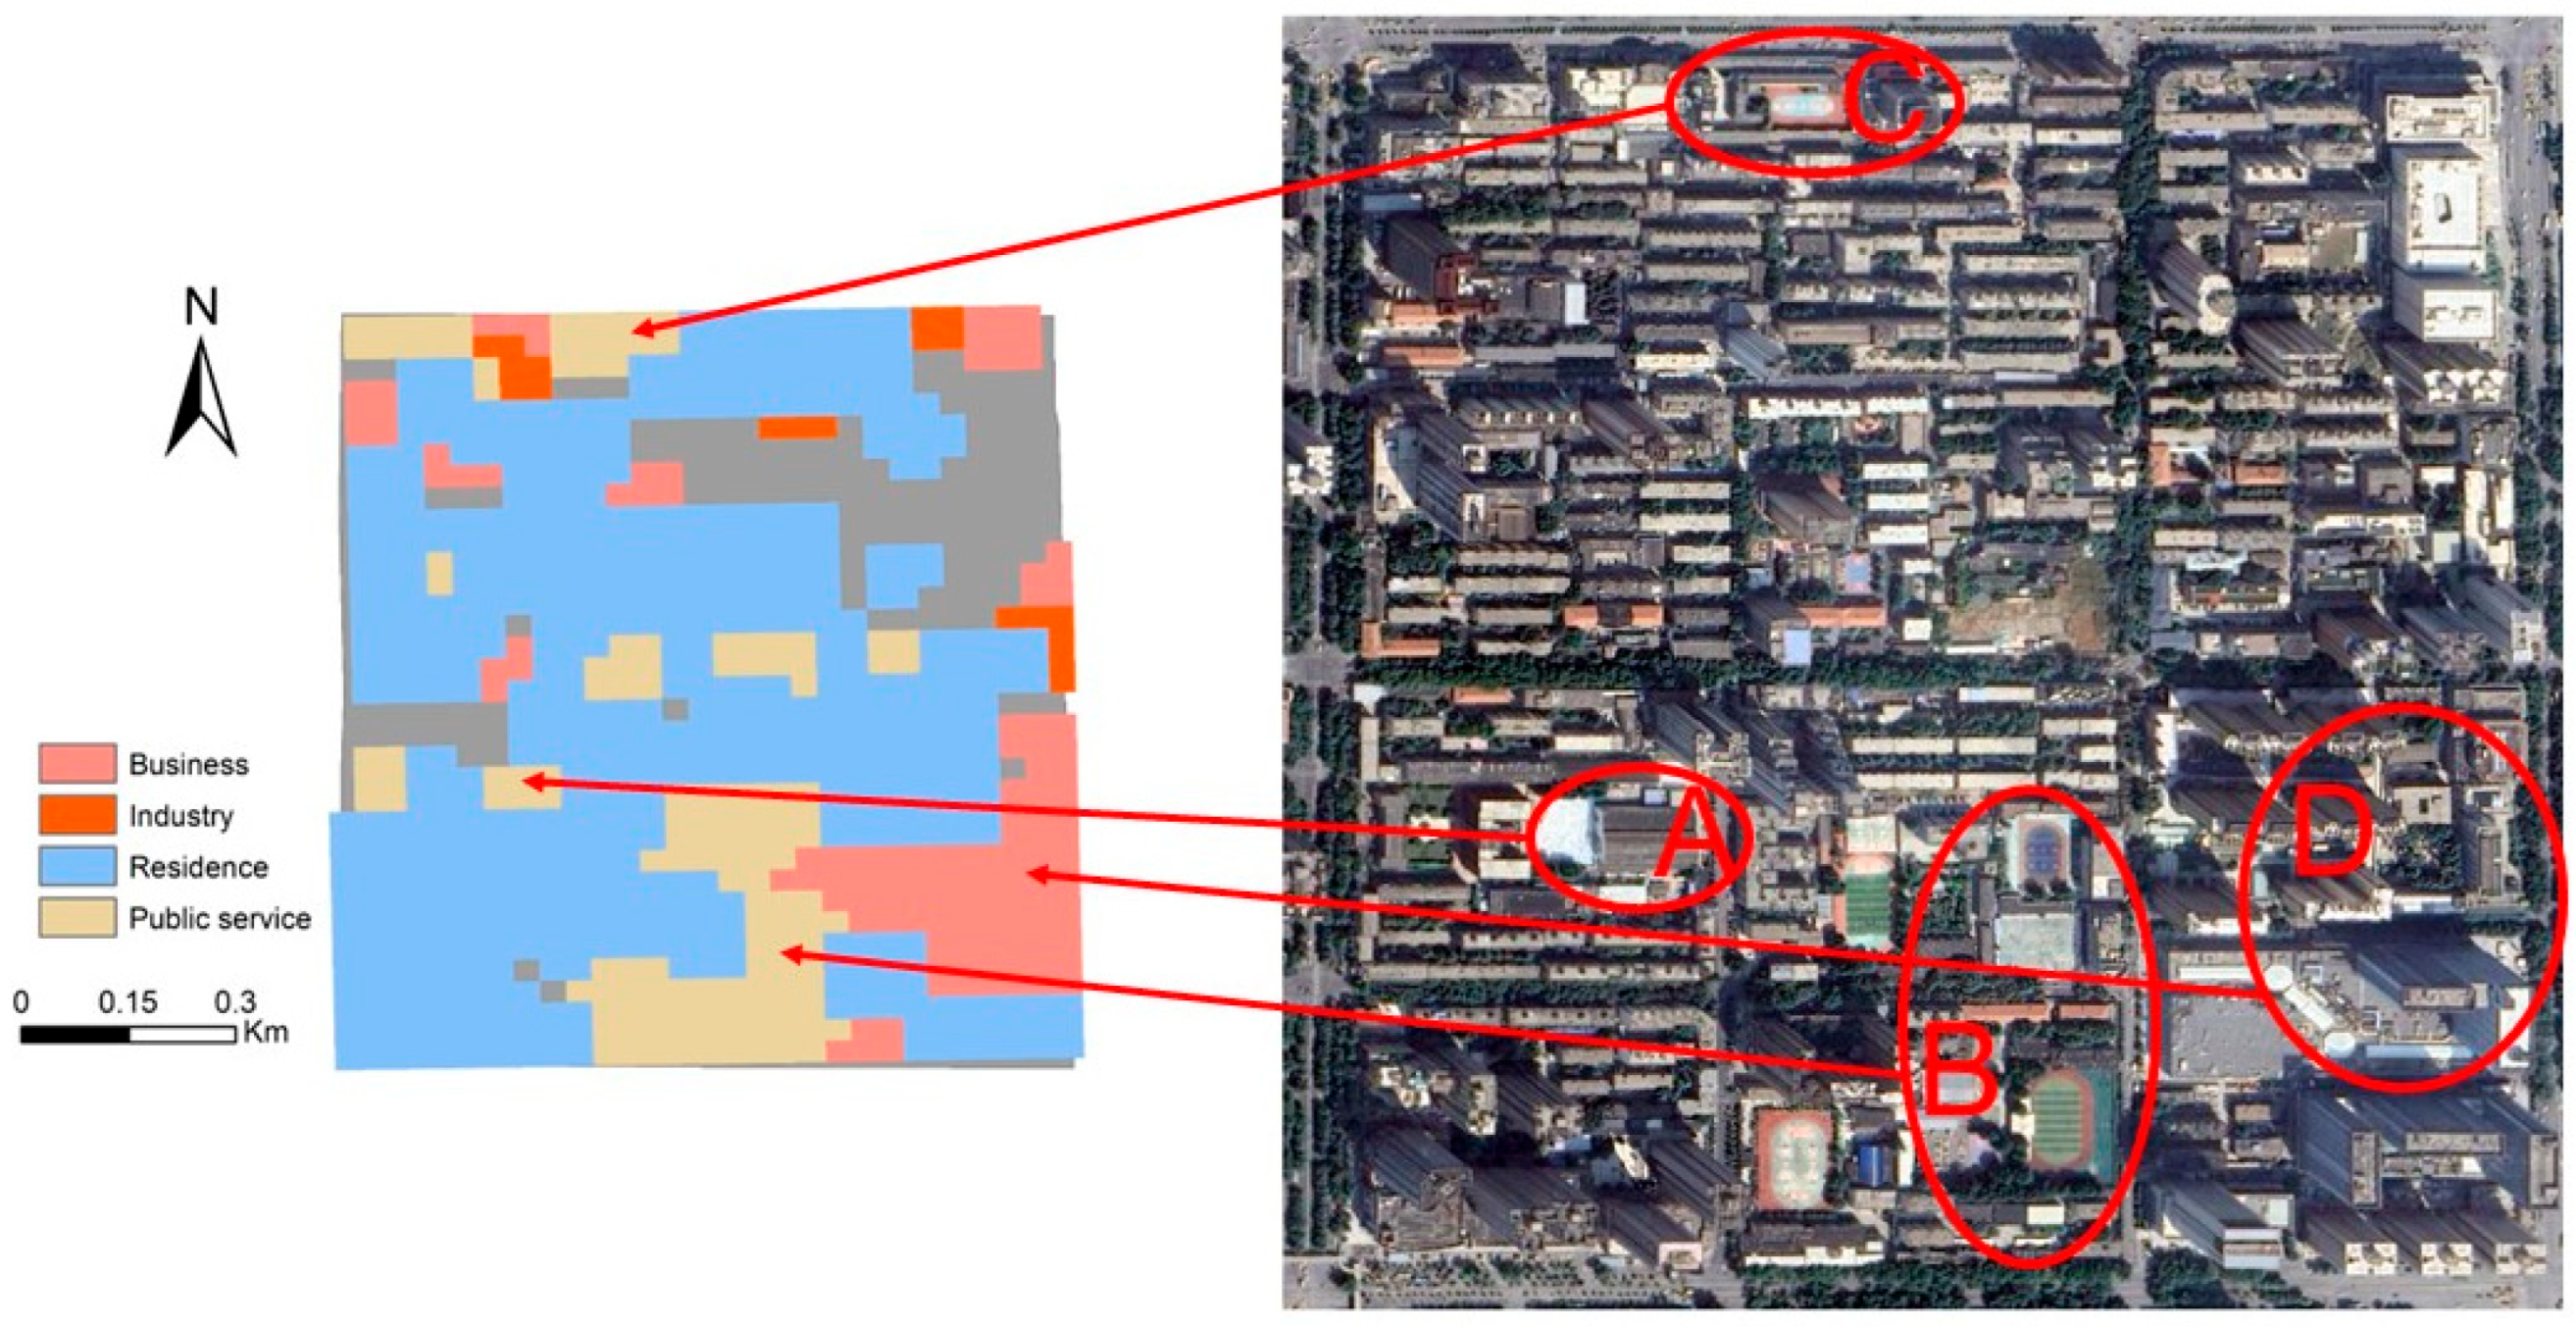
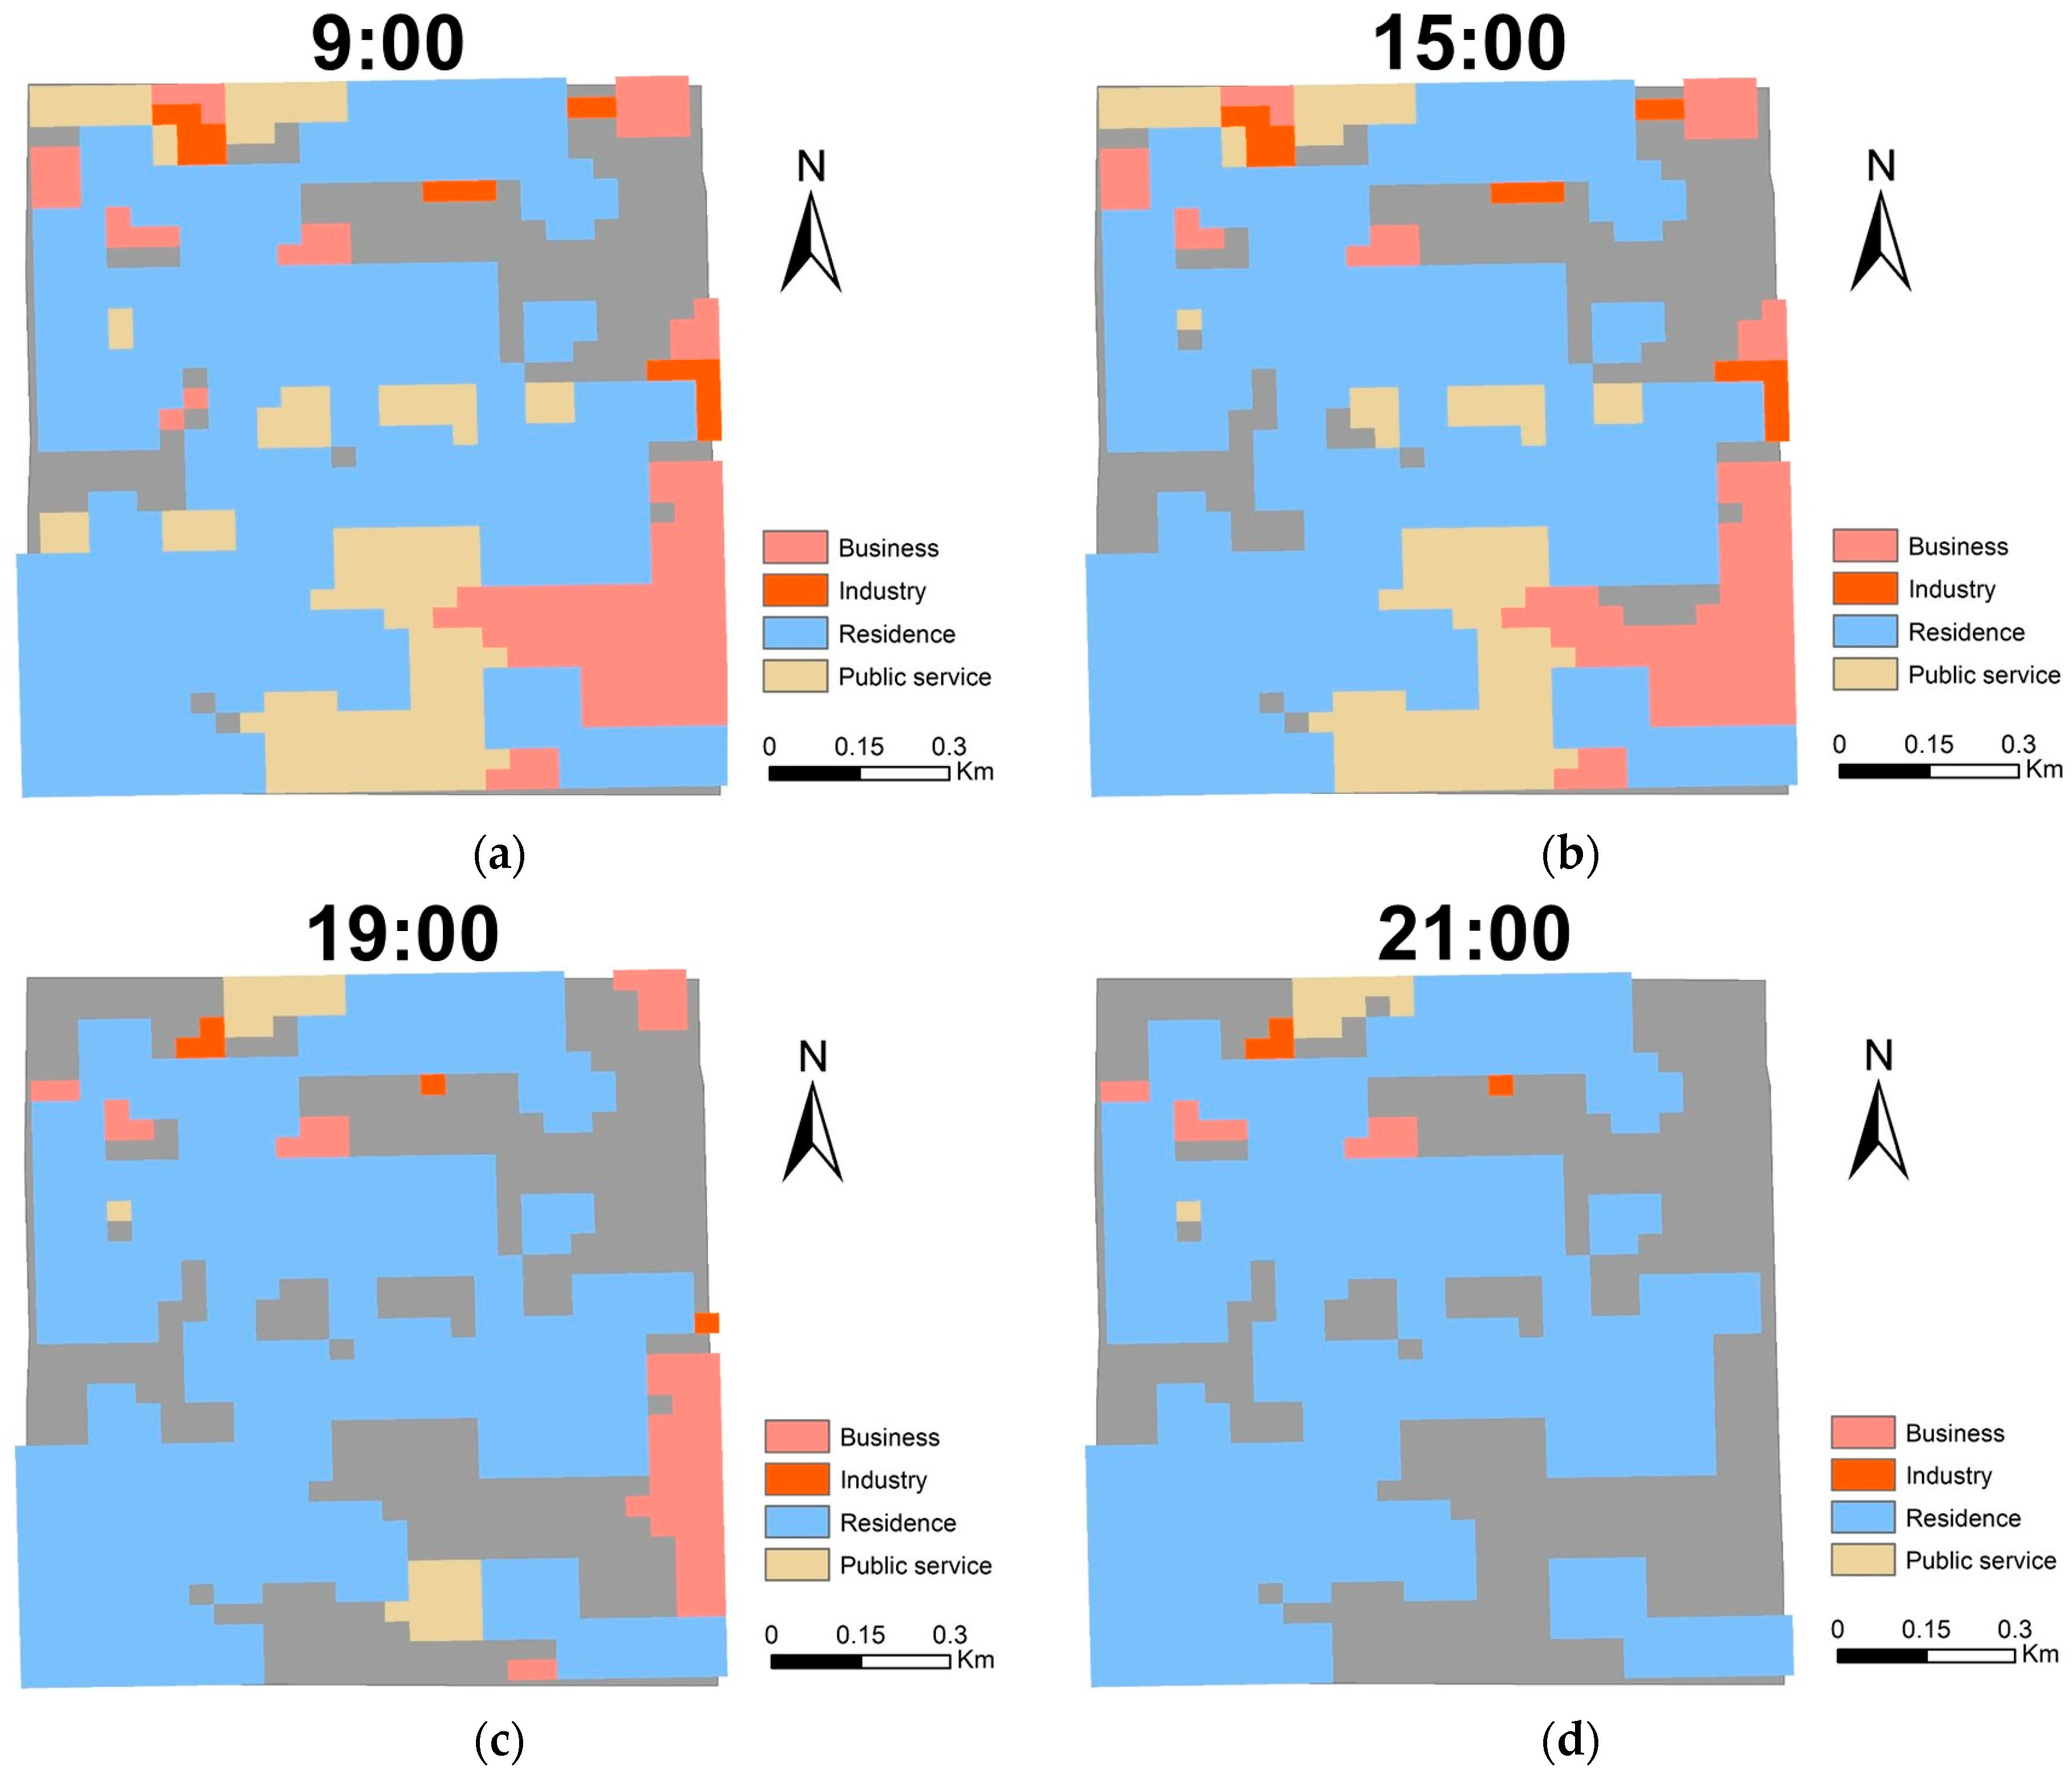
3.1. Spatial Distribution of Block Functions

Figure 6 presents the results of the dominant function classification for 669 street-scale blocks in Xi’an. According to the classification, the primary street types in Xi’an are residential-dominated (40%), business-dominated (26%), and Bus and Res-dominated (23%), with the distribution as shown in Figure 6. As can be seen in the figure, the areas near the city center of Xi’an are mainly business-dominated and Bus and Res-dominated. Residential-dominated blocks are mainly located in the area around the second ring road of the city and show clustering. Industrial-dominated, Ind and Res-dominated, and Bus and Ind-dominated blocks are scattered in low numbers in the peripheral areas of the city. Most areas outside the Second Ring are non-urban built-up zones or other special land uses, with missing data.

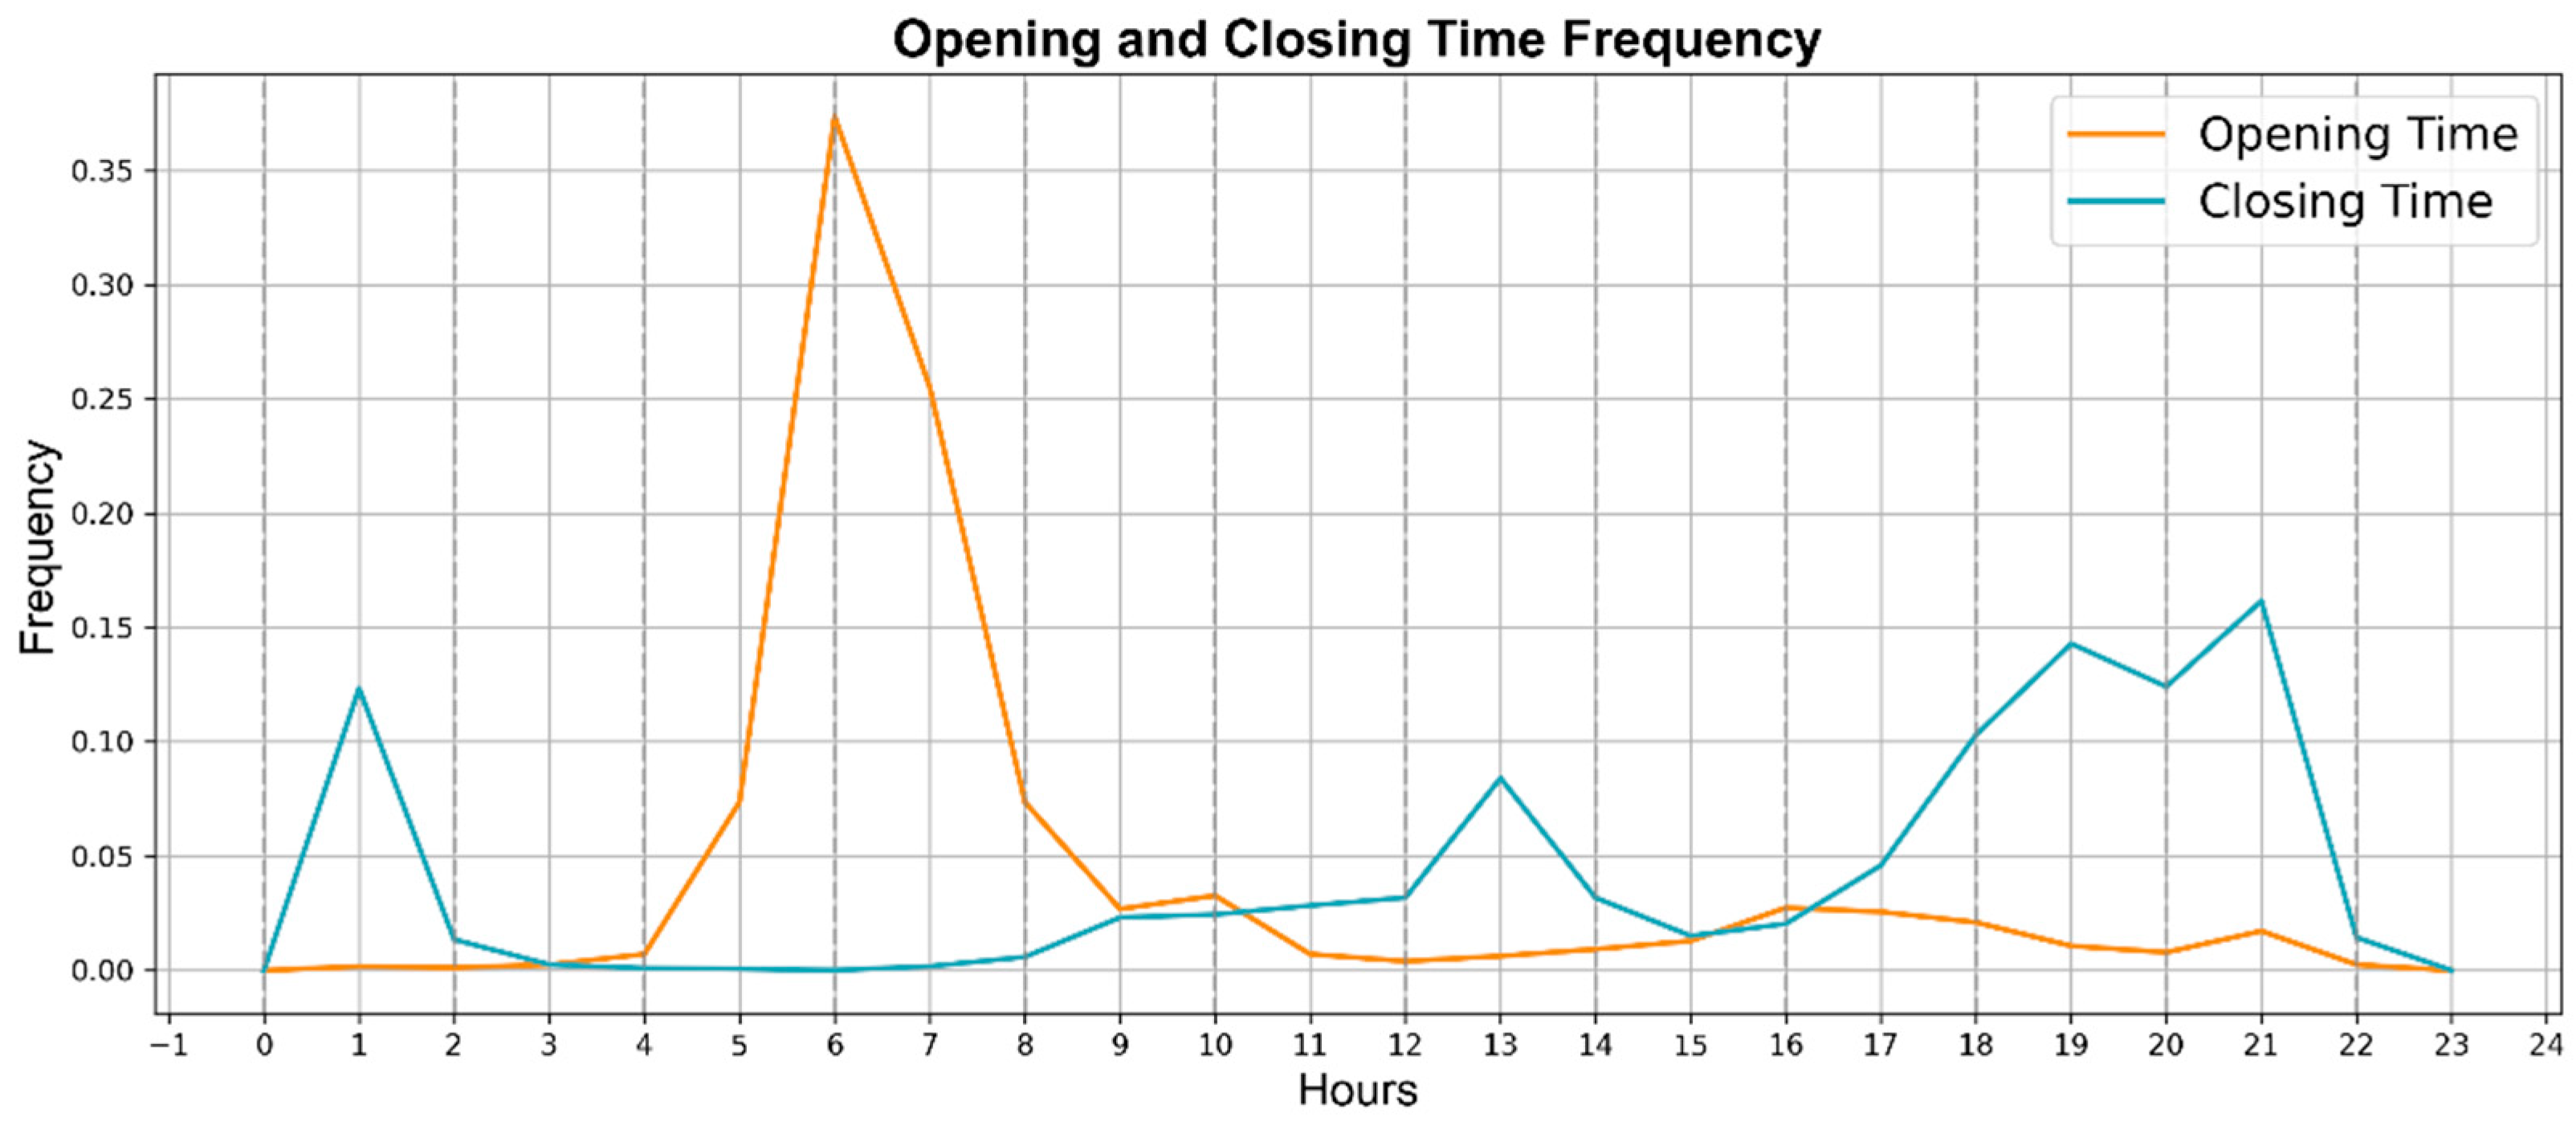
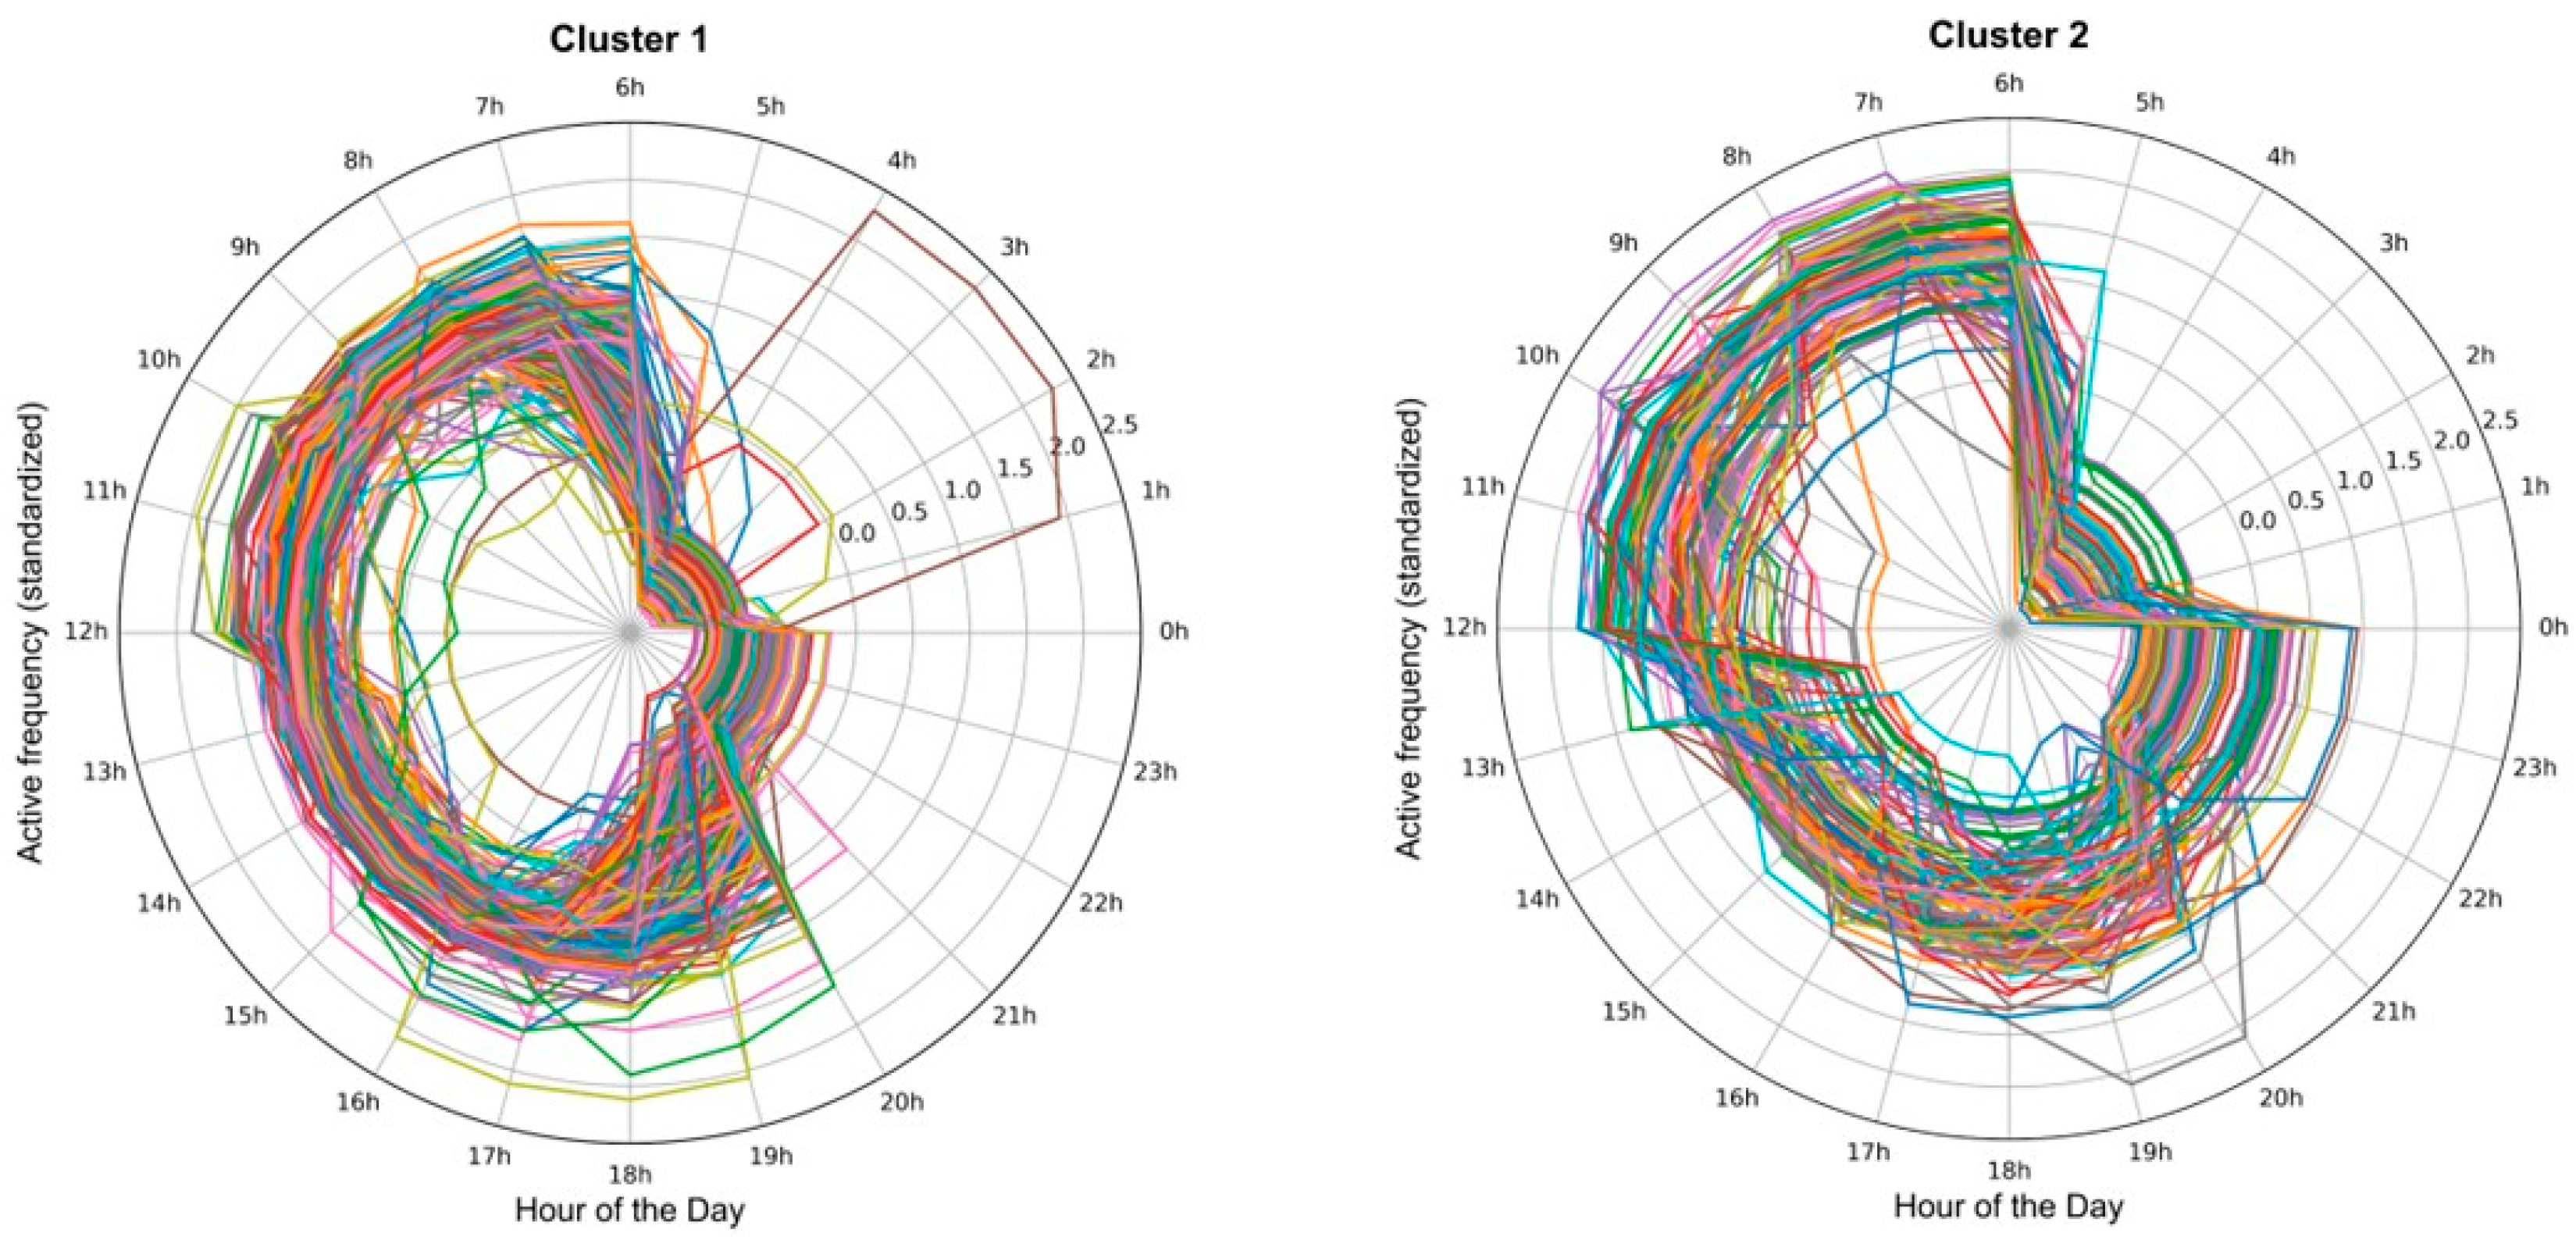
3.2. Analysis of Business Hours Model

It is found that the statistical curves of the opening and closing time statistics of the land use grids of business and industrial types in Xi’an have significant regularity (Figure 7). Opening times show a clear single-peak pattern, with peaks occurring between 5:00 and 8:00, especially at 6:00, when the largest proportion (27.9%) is reached. This phenomenon can be attributed to the gradual commencement of productive activities in the early morning, which creates a significant morning peak at that time of the day. The percentage of opening times gradually decreases over time, and the percentage of openings is significantly lower than during daytime hours, reflecting a gradual decrease in nighttime business activity.
In contrast to the single peak observed at opening time, the closing time for business and industrial land use grids in Xi’an exhibits a multi-peak distribution, with three distinct peaks of varying magnitudes occurring in the early morning, noon, and night, respectively. Specifically, closing time reaches an extreme value at 1:00 (10.16%), followed by a gradual decrease in the percentage. This peak may be closely related to the consumption pattern of specific industries during the early morning hours, especially some industries with more active night-time economic activities, such as bars, nightclubs, and other entertainment venues, which still maintain a high customer flow during this time of the day. Then, at 13:00, the proportion of closing briefly increased, a phenomenon that may be related to the lunch break habits of consumers and the behavior of some merchants in closing or suspending business during the midday hours. Some service-oriented commercial establishments may opt to close temporarily or adjust their operating hours in response to the reduced consumer demand during lunchtime. In addition, closing time rises gradually after 16:00, especially at 19:00 and 21:00, when it peaks at 8.07% and 15.98%, respectively. These two peaks are closely related to the shift to family life after the end of people’s productive activities, suggesting a significant reduction in consumer outings and a subsequent drop in business demand by merchants during this time. The nighttime peak reflects a significant decrease in pedestrian flow, and businesses are choosing to close as a result.
The K-means clustering algorithm is a widely employed technique in cluster analysis, particularly well-suited for studying population distribution patterns in time series data [29]. In this study, we apply the K-means clustering algorithm to normalize the number of active grids at each time point across the blocks in Xi’an and conduct a cluster analysis to investigate whether a consistent pattern exists in the business hours of these blocks. The clustering performance for different numbers of clusters is evaluated using the silhouette coefficient (Figure 8), and the results indicate that the clustering structure is relatively optimal when the number of clusters is set to two. Although the absolute values of the silhouette coefficients are relatively low—indicating a weakened clustering structure in the active time series of the grid cells in Xi’an—the selected number of clusters still effectively reveals the main patterns of block business hours and their variability.
The results of the cluster analysis are shown in Figure 9. The pattern of hours of operation for the Xi’an block can be broadly divided into two categories. With the exception of a few special blocks, the activity levels of these two types of blocks show a similar trend over part of the day: higher activity from 6:00 to 12:00 and lower activity from 0:00 to 6:00. The difference is that Category 1 blocks have a high level of activity from 12:00 to 20:00, with activity decreasing significantly after 20:00. Category 2 blocks, on the other hand, maintain a more even and moderate level of activity from 12:00 to 24:00. The following morning may be associated with some of the business-type blocks with nocturnal activity.

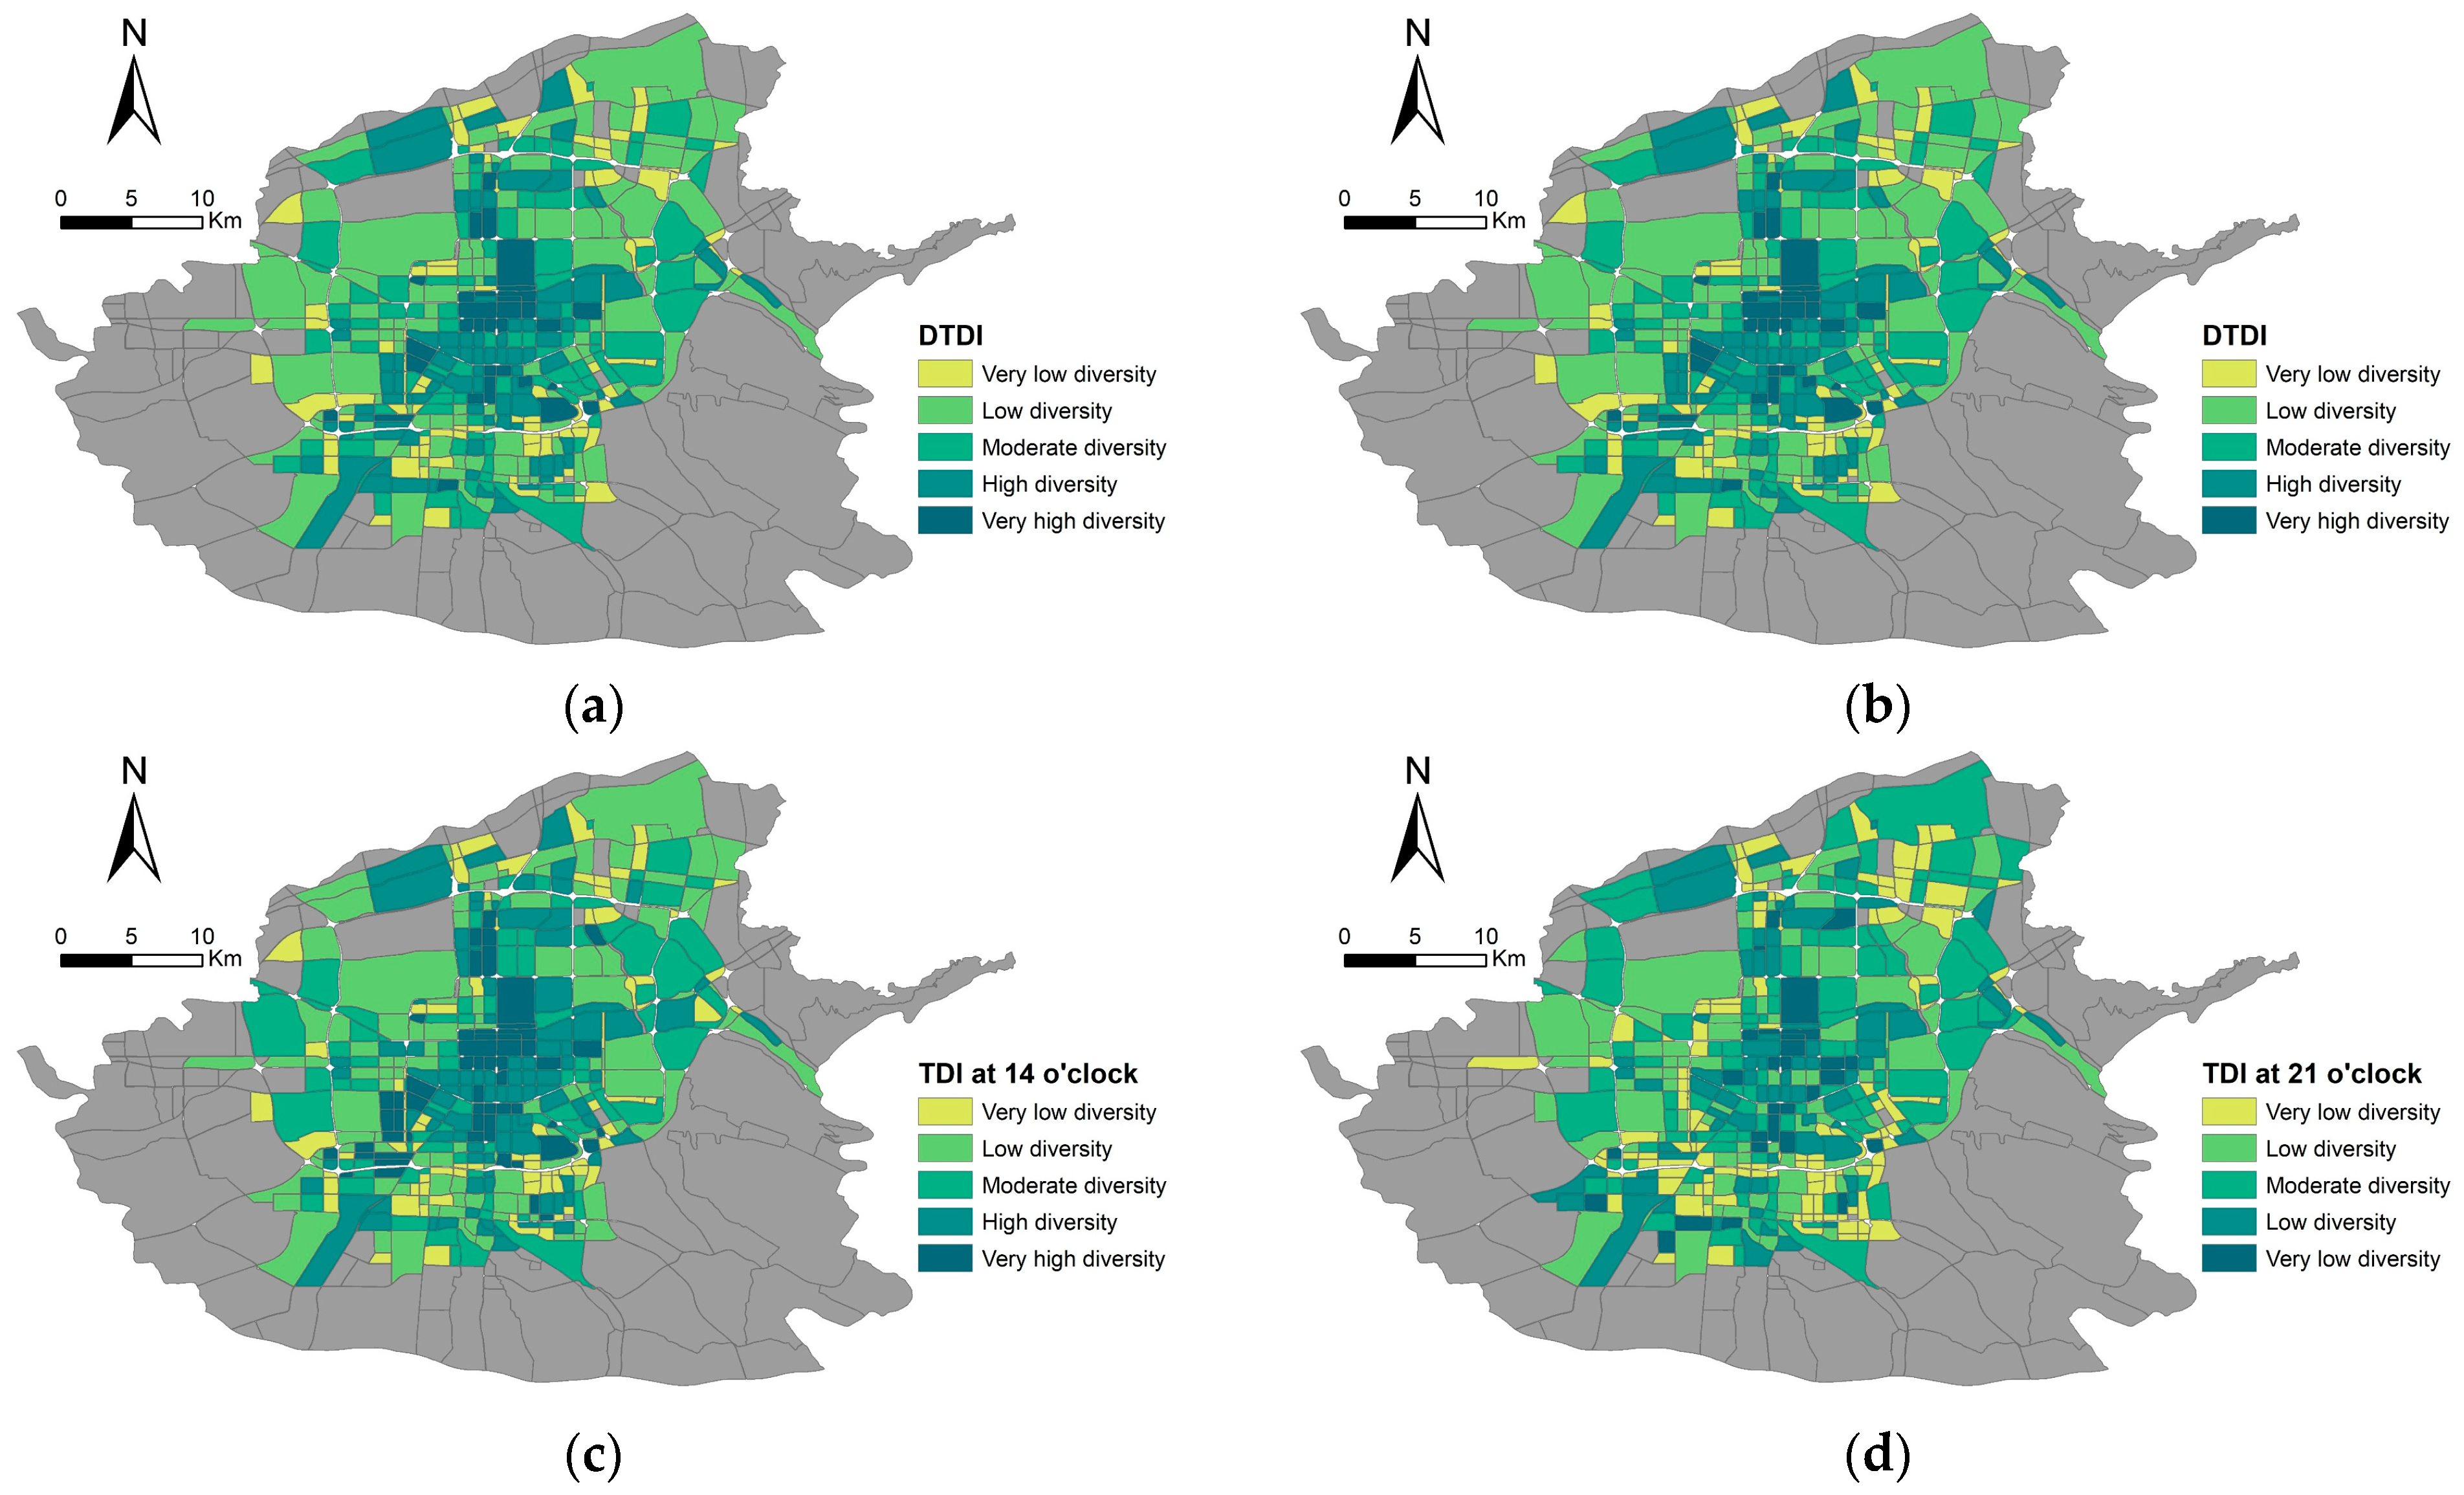
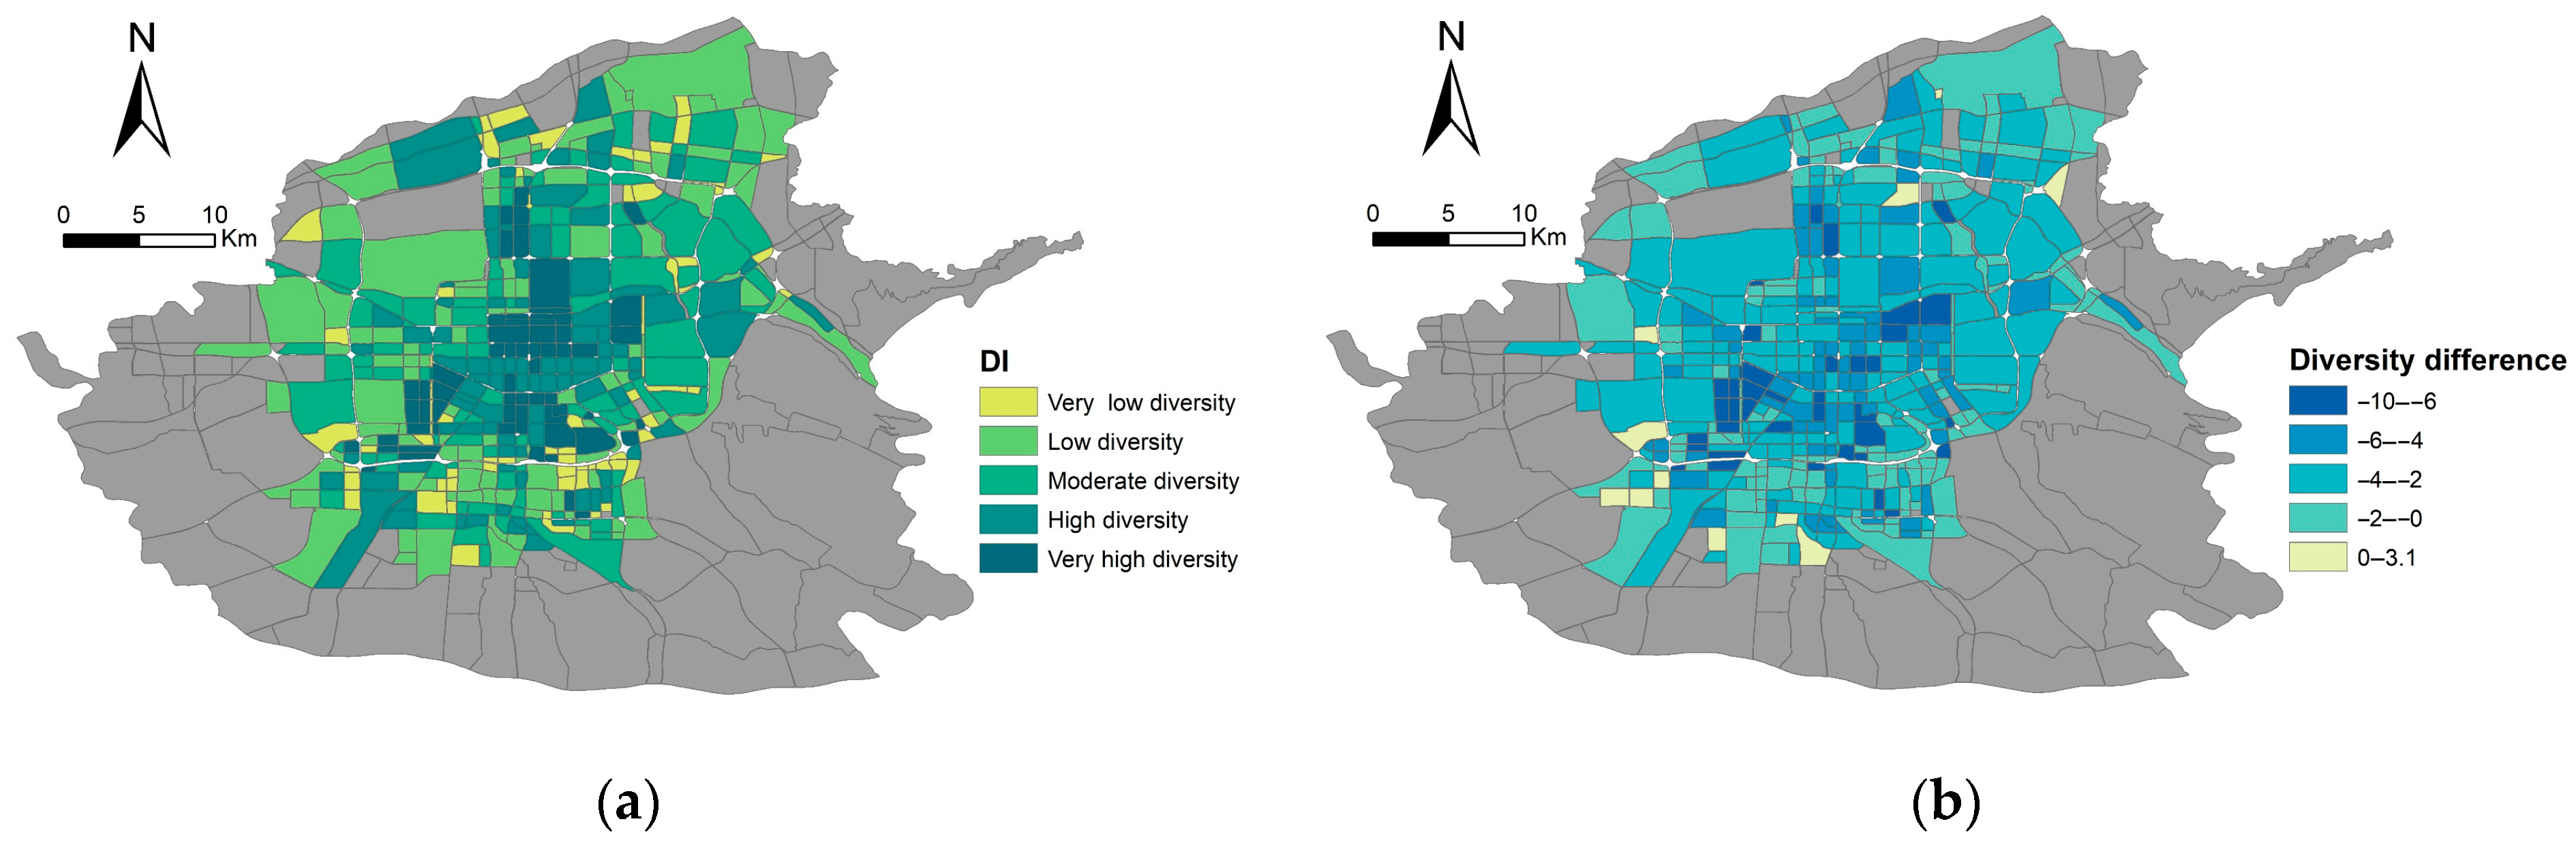
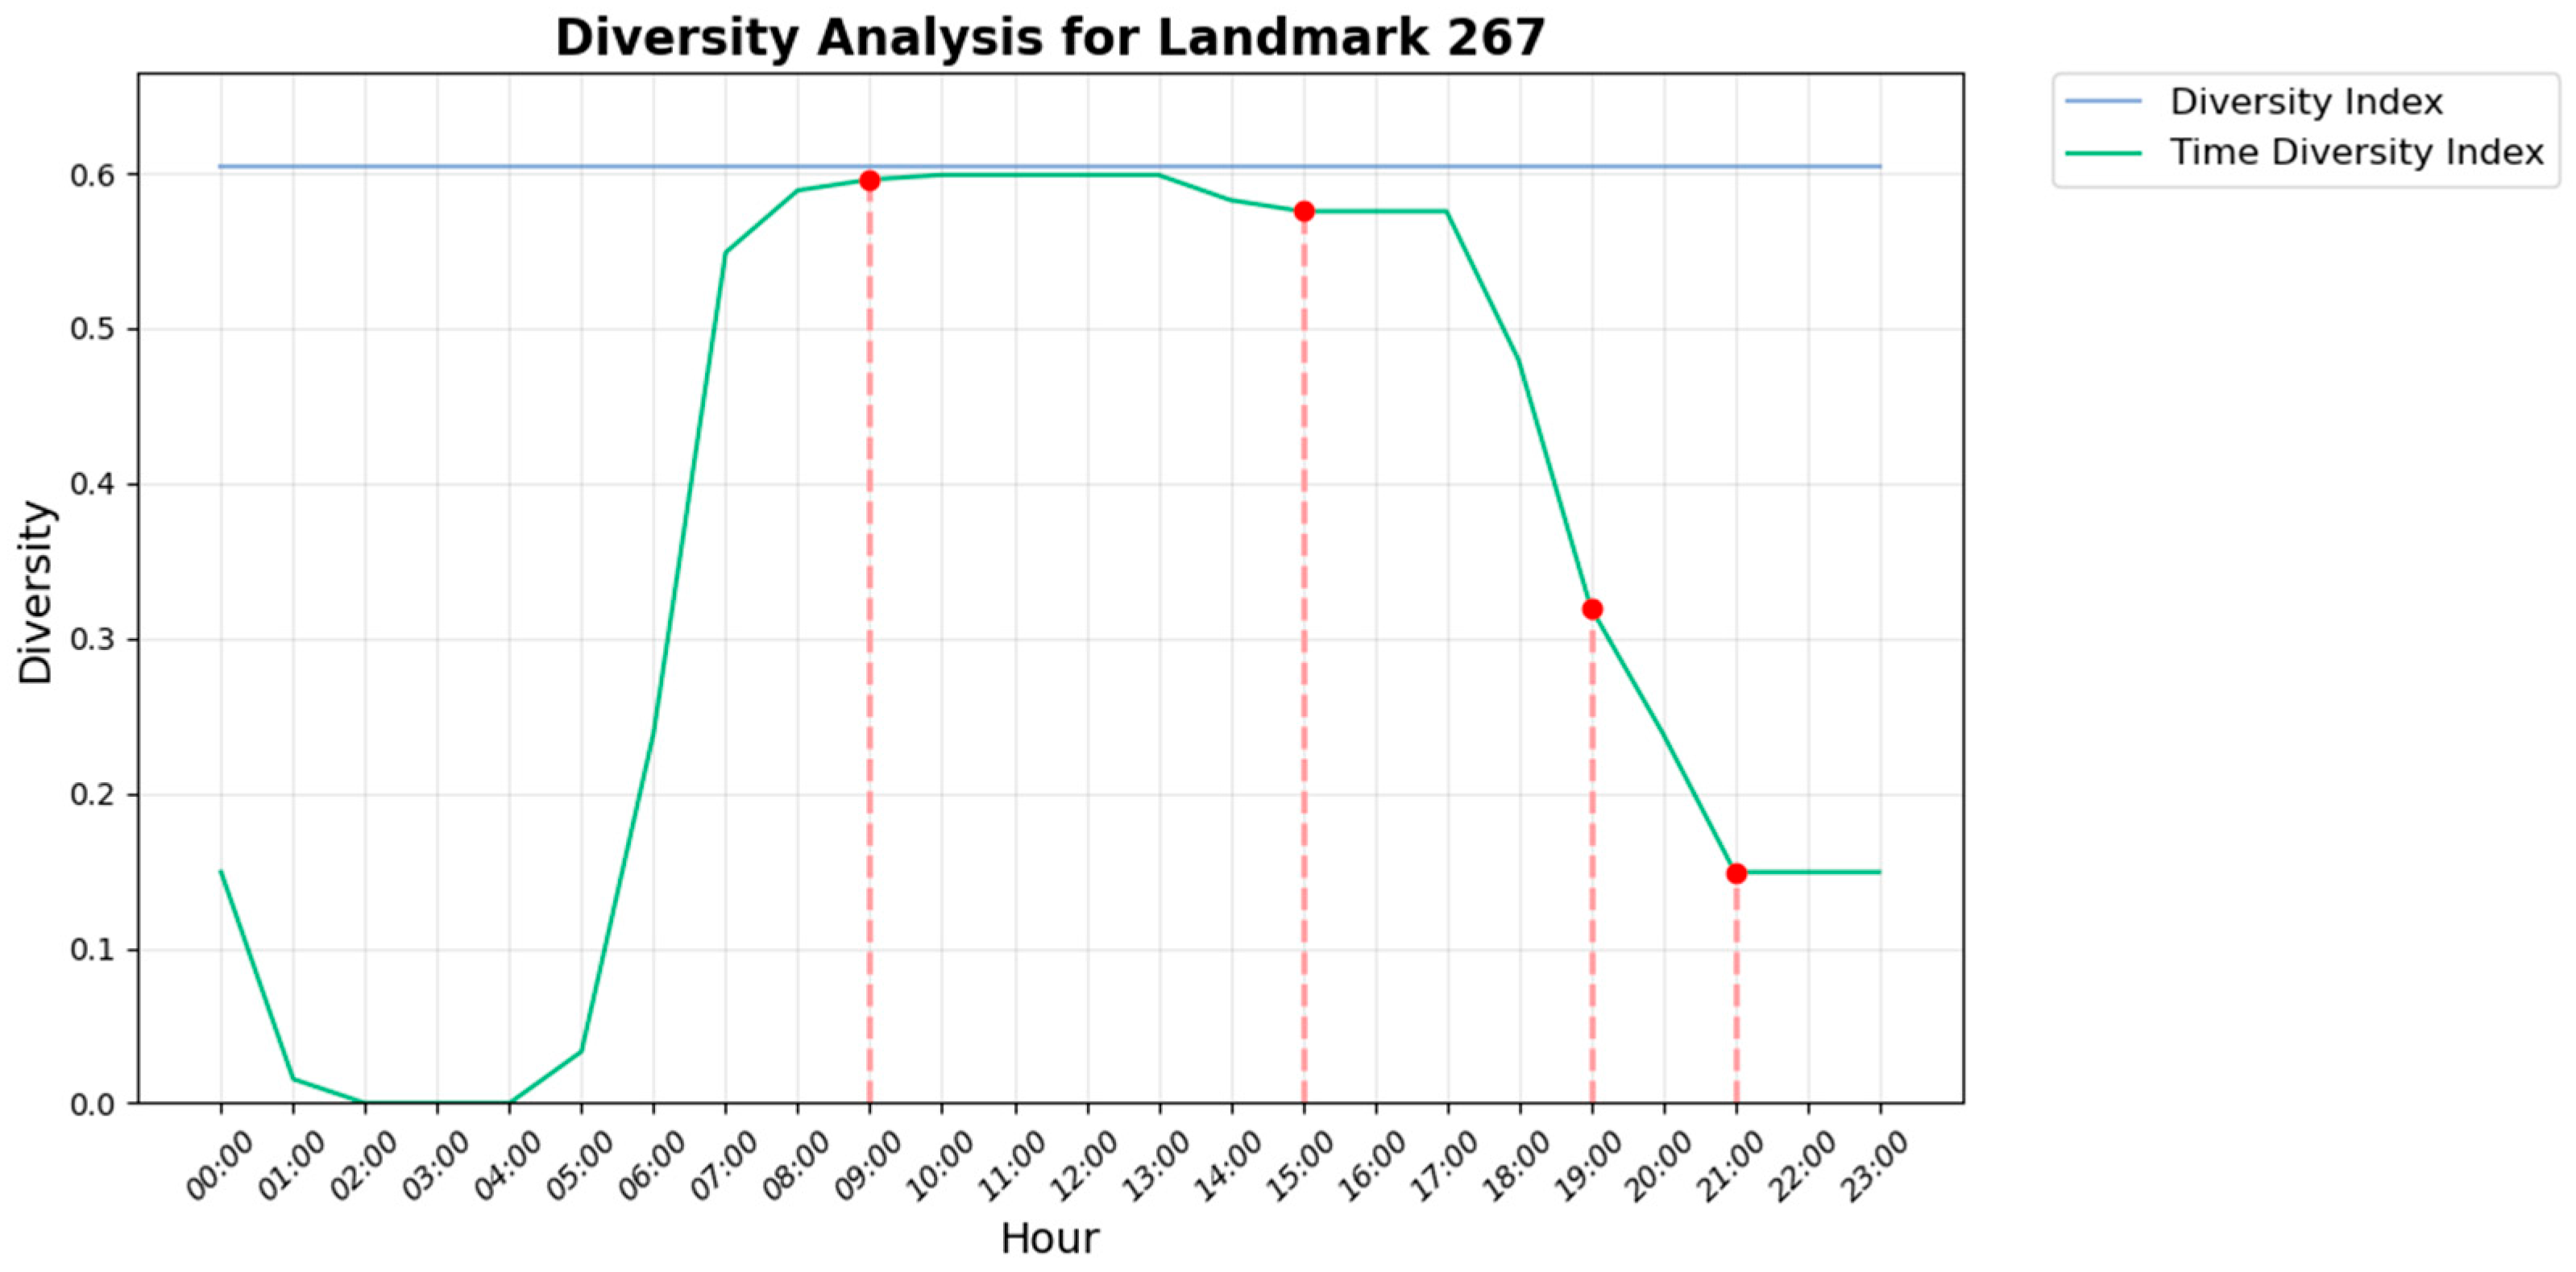
3.3. Spatial Distribution of TDI

The calculated temporal diversity index (TDI) and daily temporal diversity index (DTDI) at 8:00, 14:00, and 21:00 in Xi’an were plotted as shown in Figure 10. In each plot, the diversity indices were classified into five categories using the Jenks natural breaks method, including very low diversity, low diversity, moderate diversity, high diversity, and very high diversity. The distribution results of DTDI show that the areas with a higher DTDI in Xi’an are mainly located in the city center and some blocks within the second ring road.
From the results of the TDI distribution, it can be seen that the TDI distributions at 8:00 and 14:00 are approximately the same, suggesting that, although 13:00 was a peak closing time, complementary land uses did not result in a significant reduction in diversity. By 21:00, the TDI decreased for most blocks, with only a few central and peripheral city blocks maintaining higher diversity. This phenomenon may be attributed to the stronger complexity of the central blocks, which host a greater variety of nocturnal activities, while peripheral residential areas exhibit higher nocturnal diversity due to the concentration of pedestrian flow.

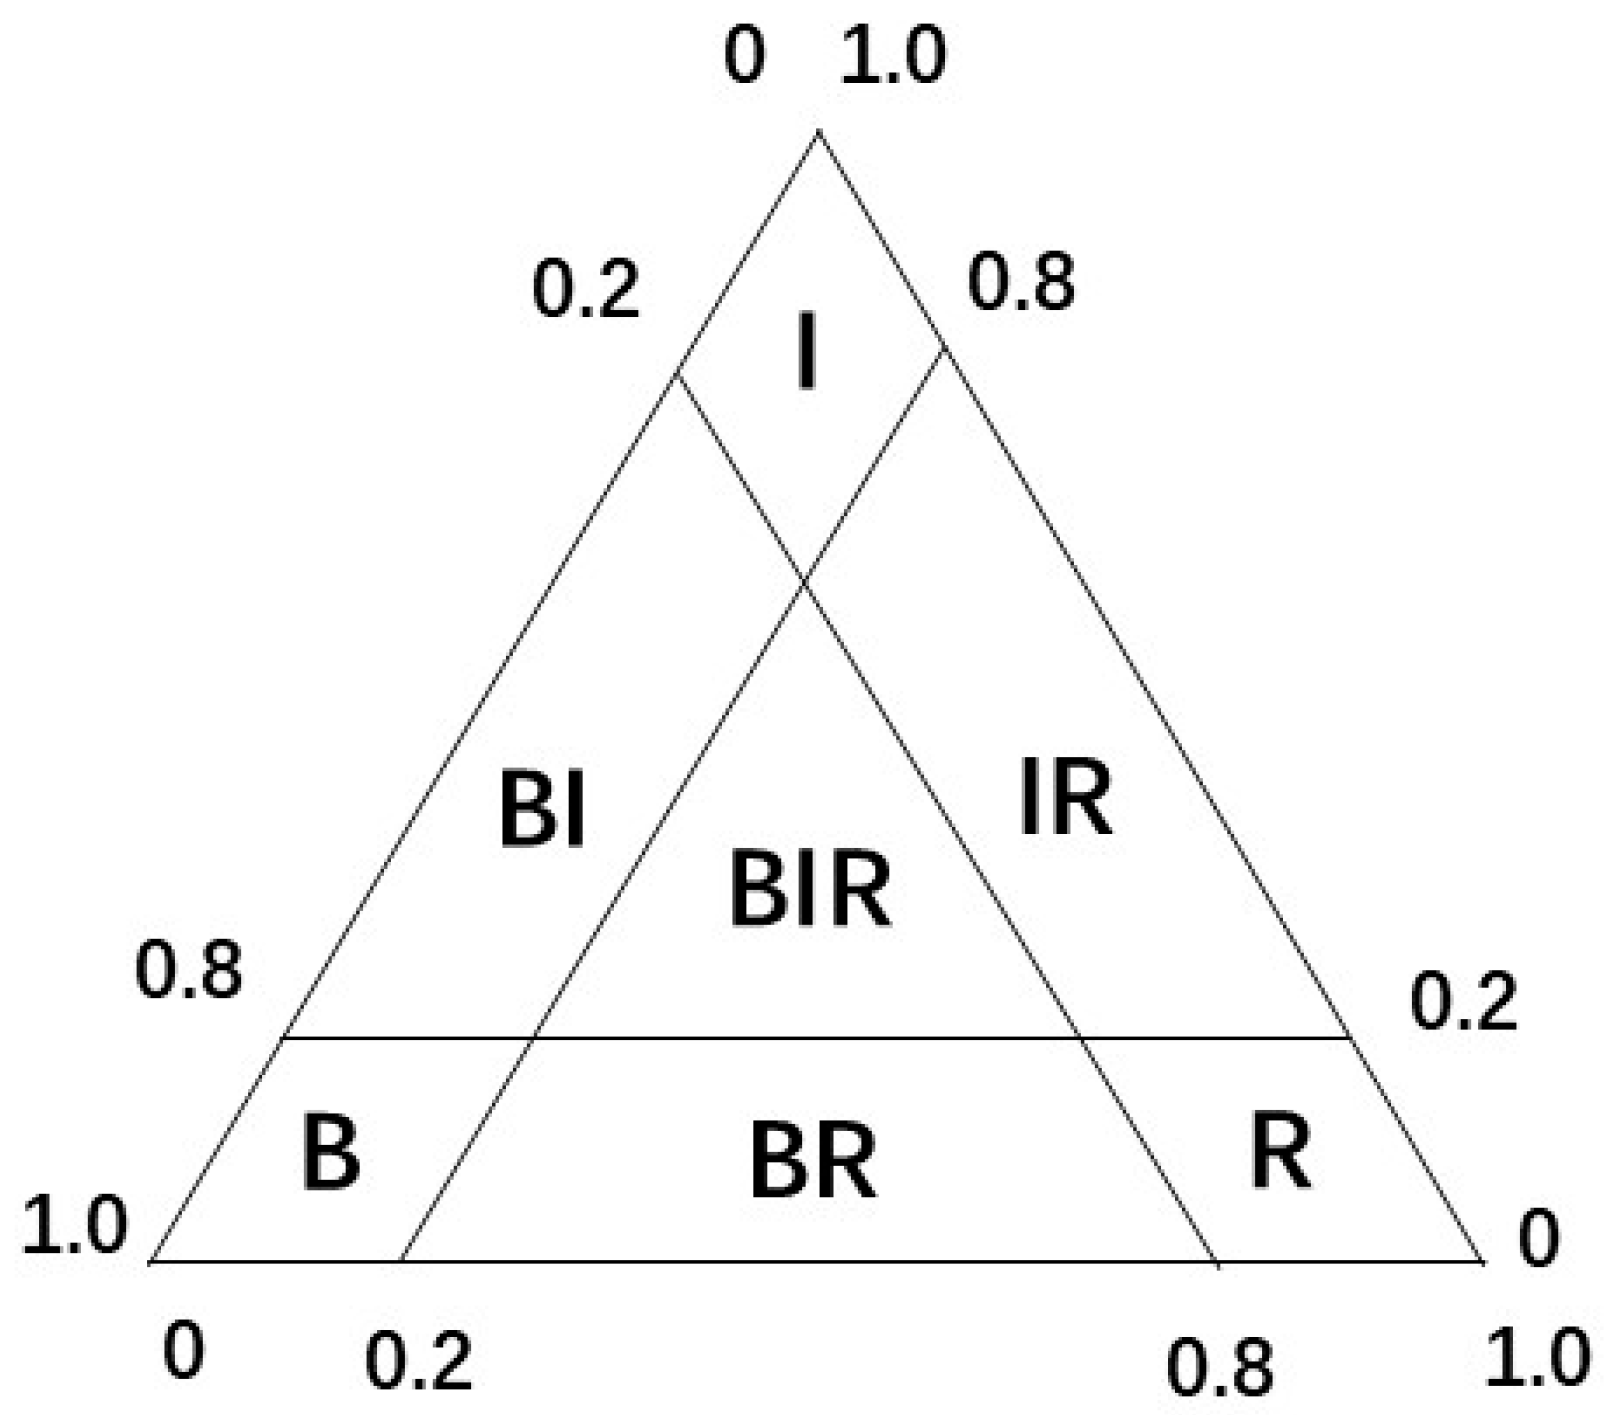
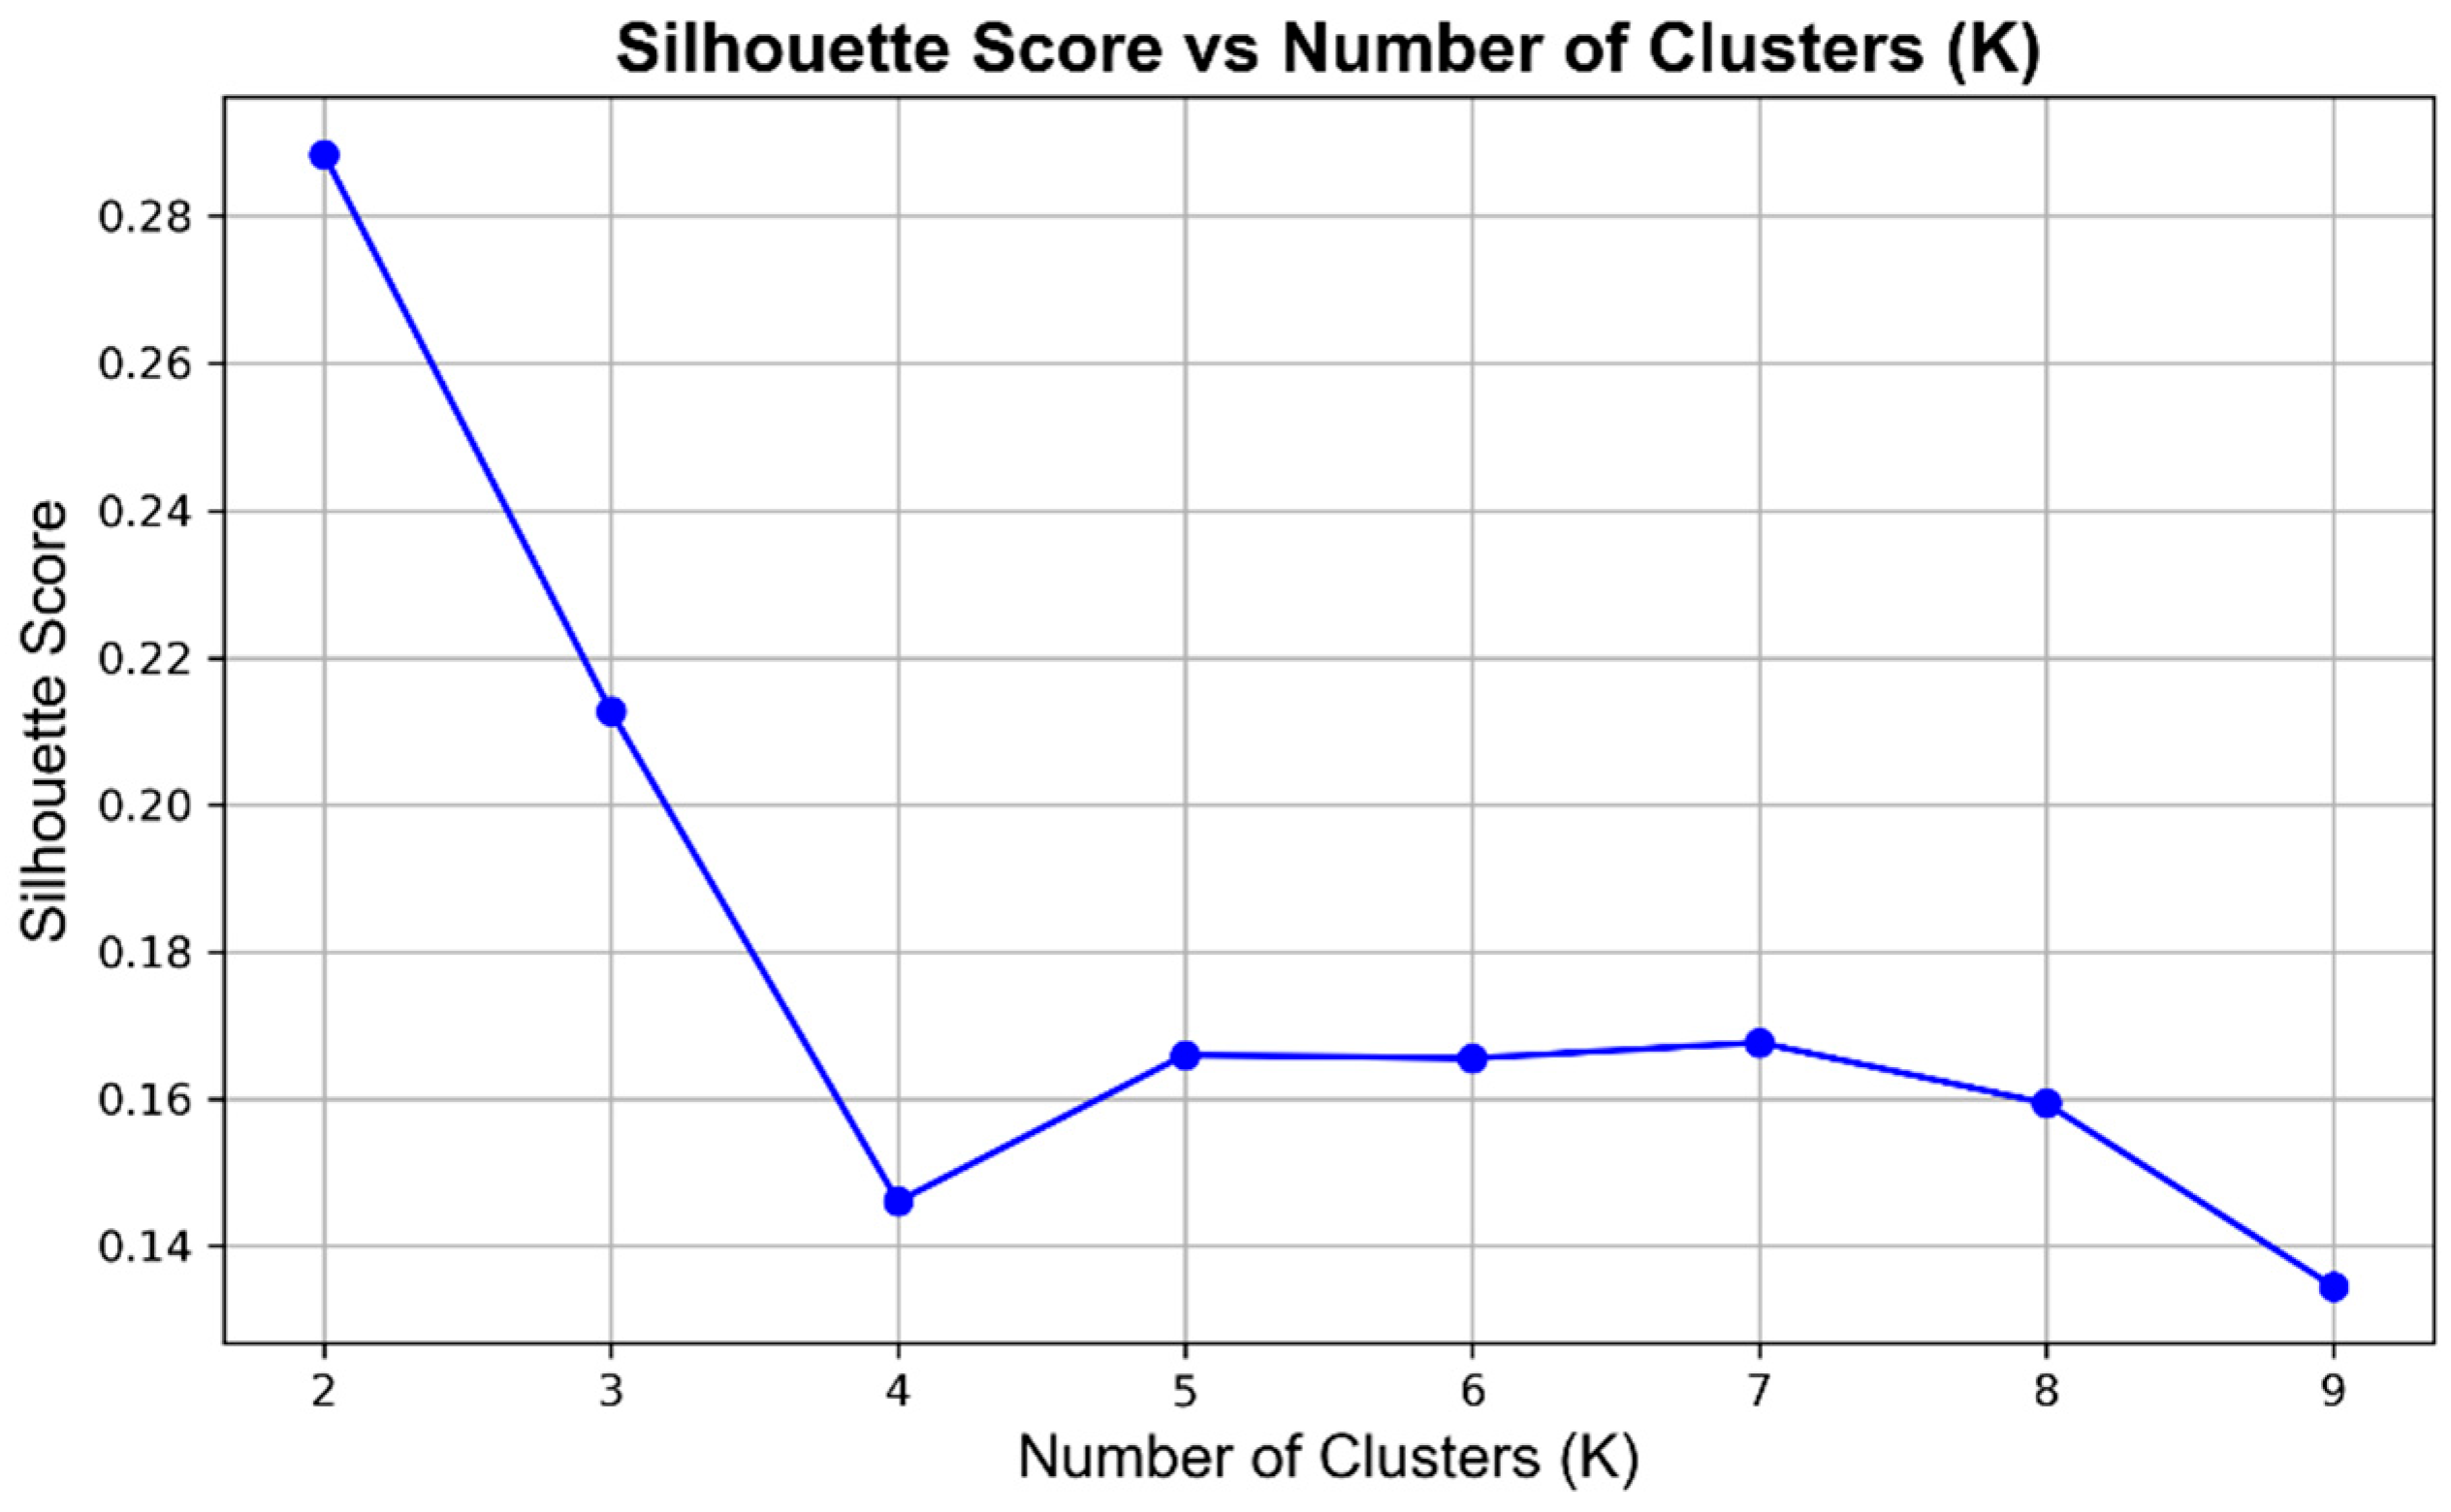
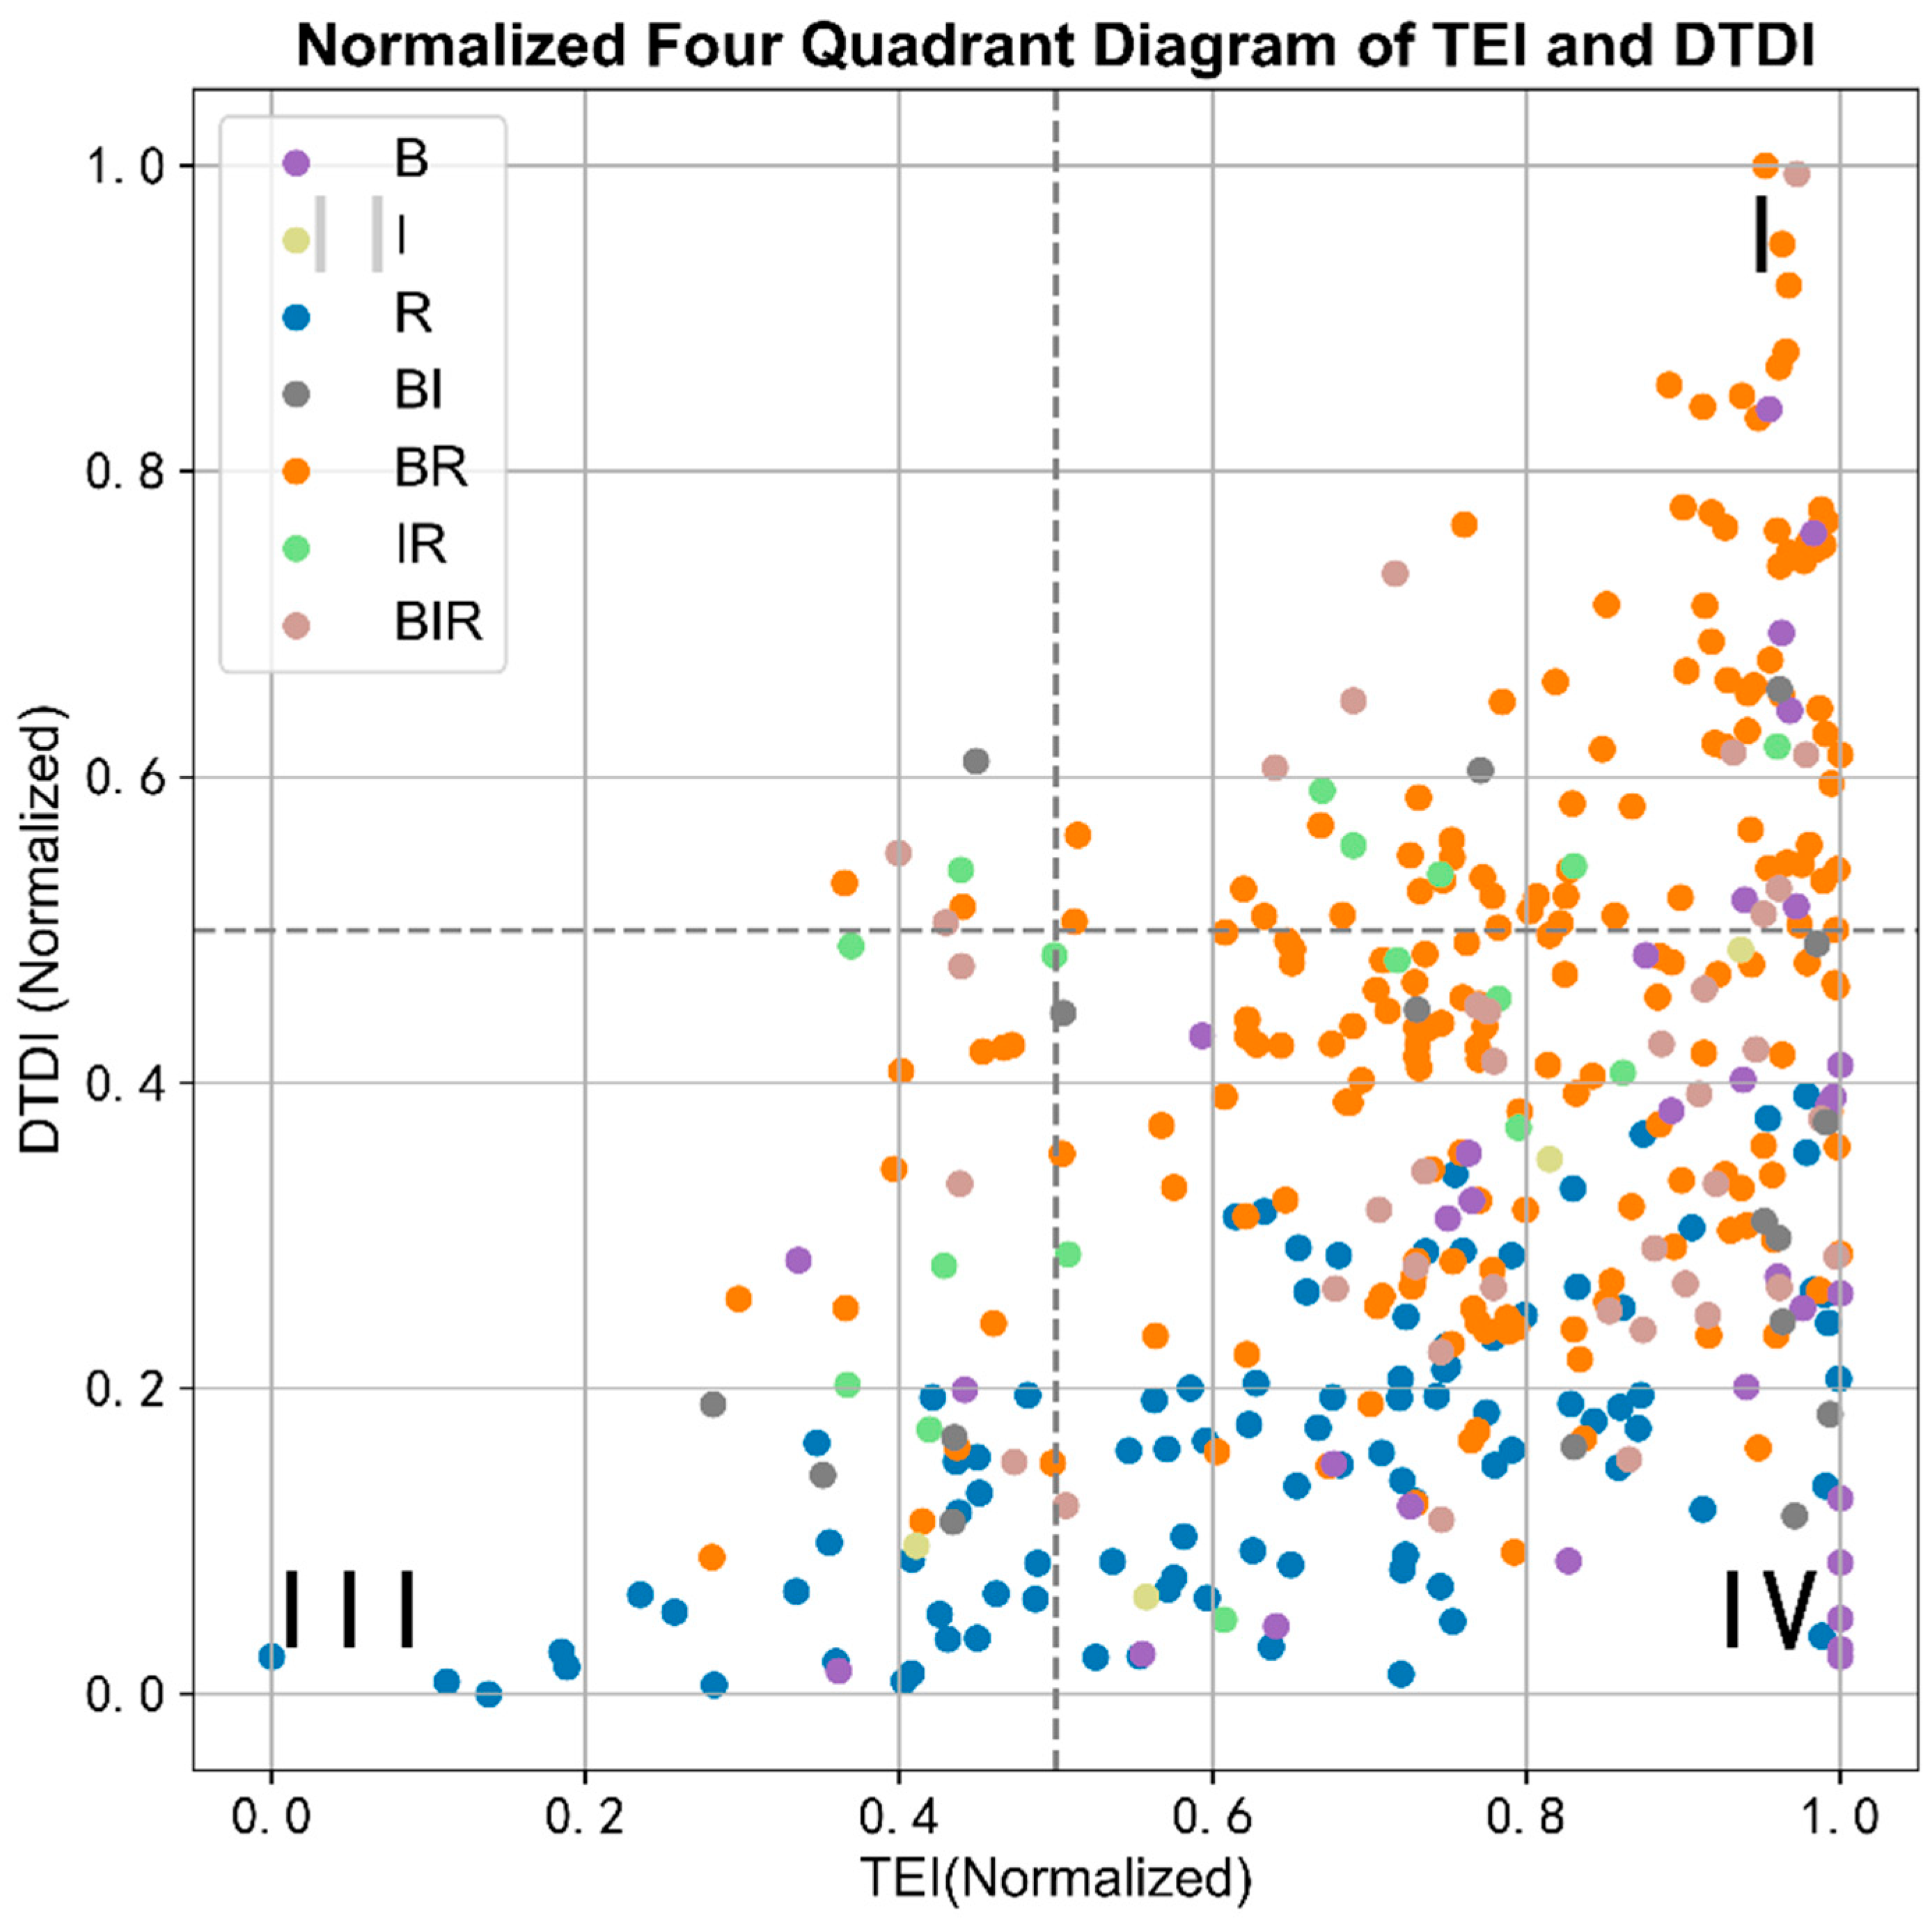
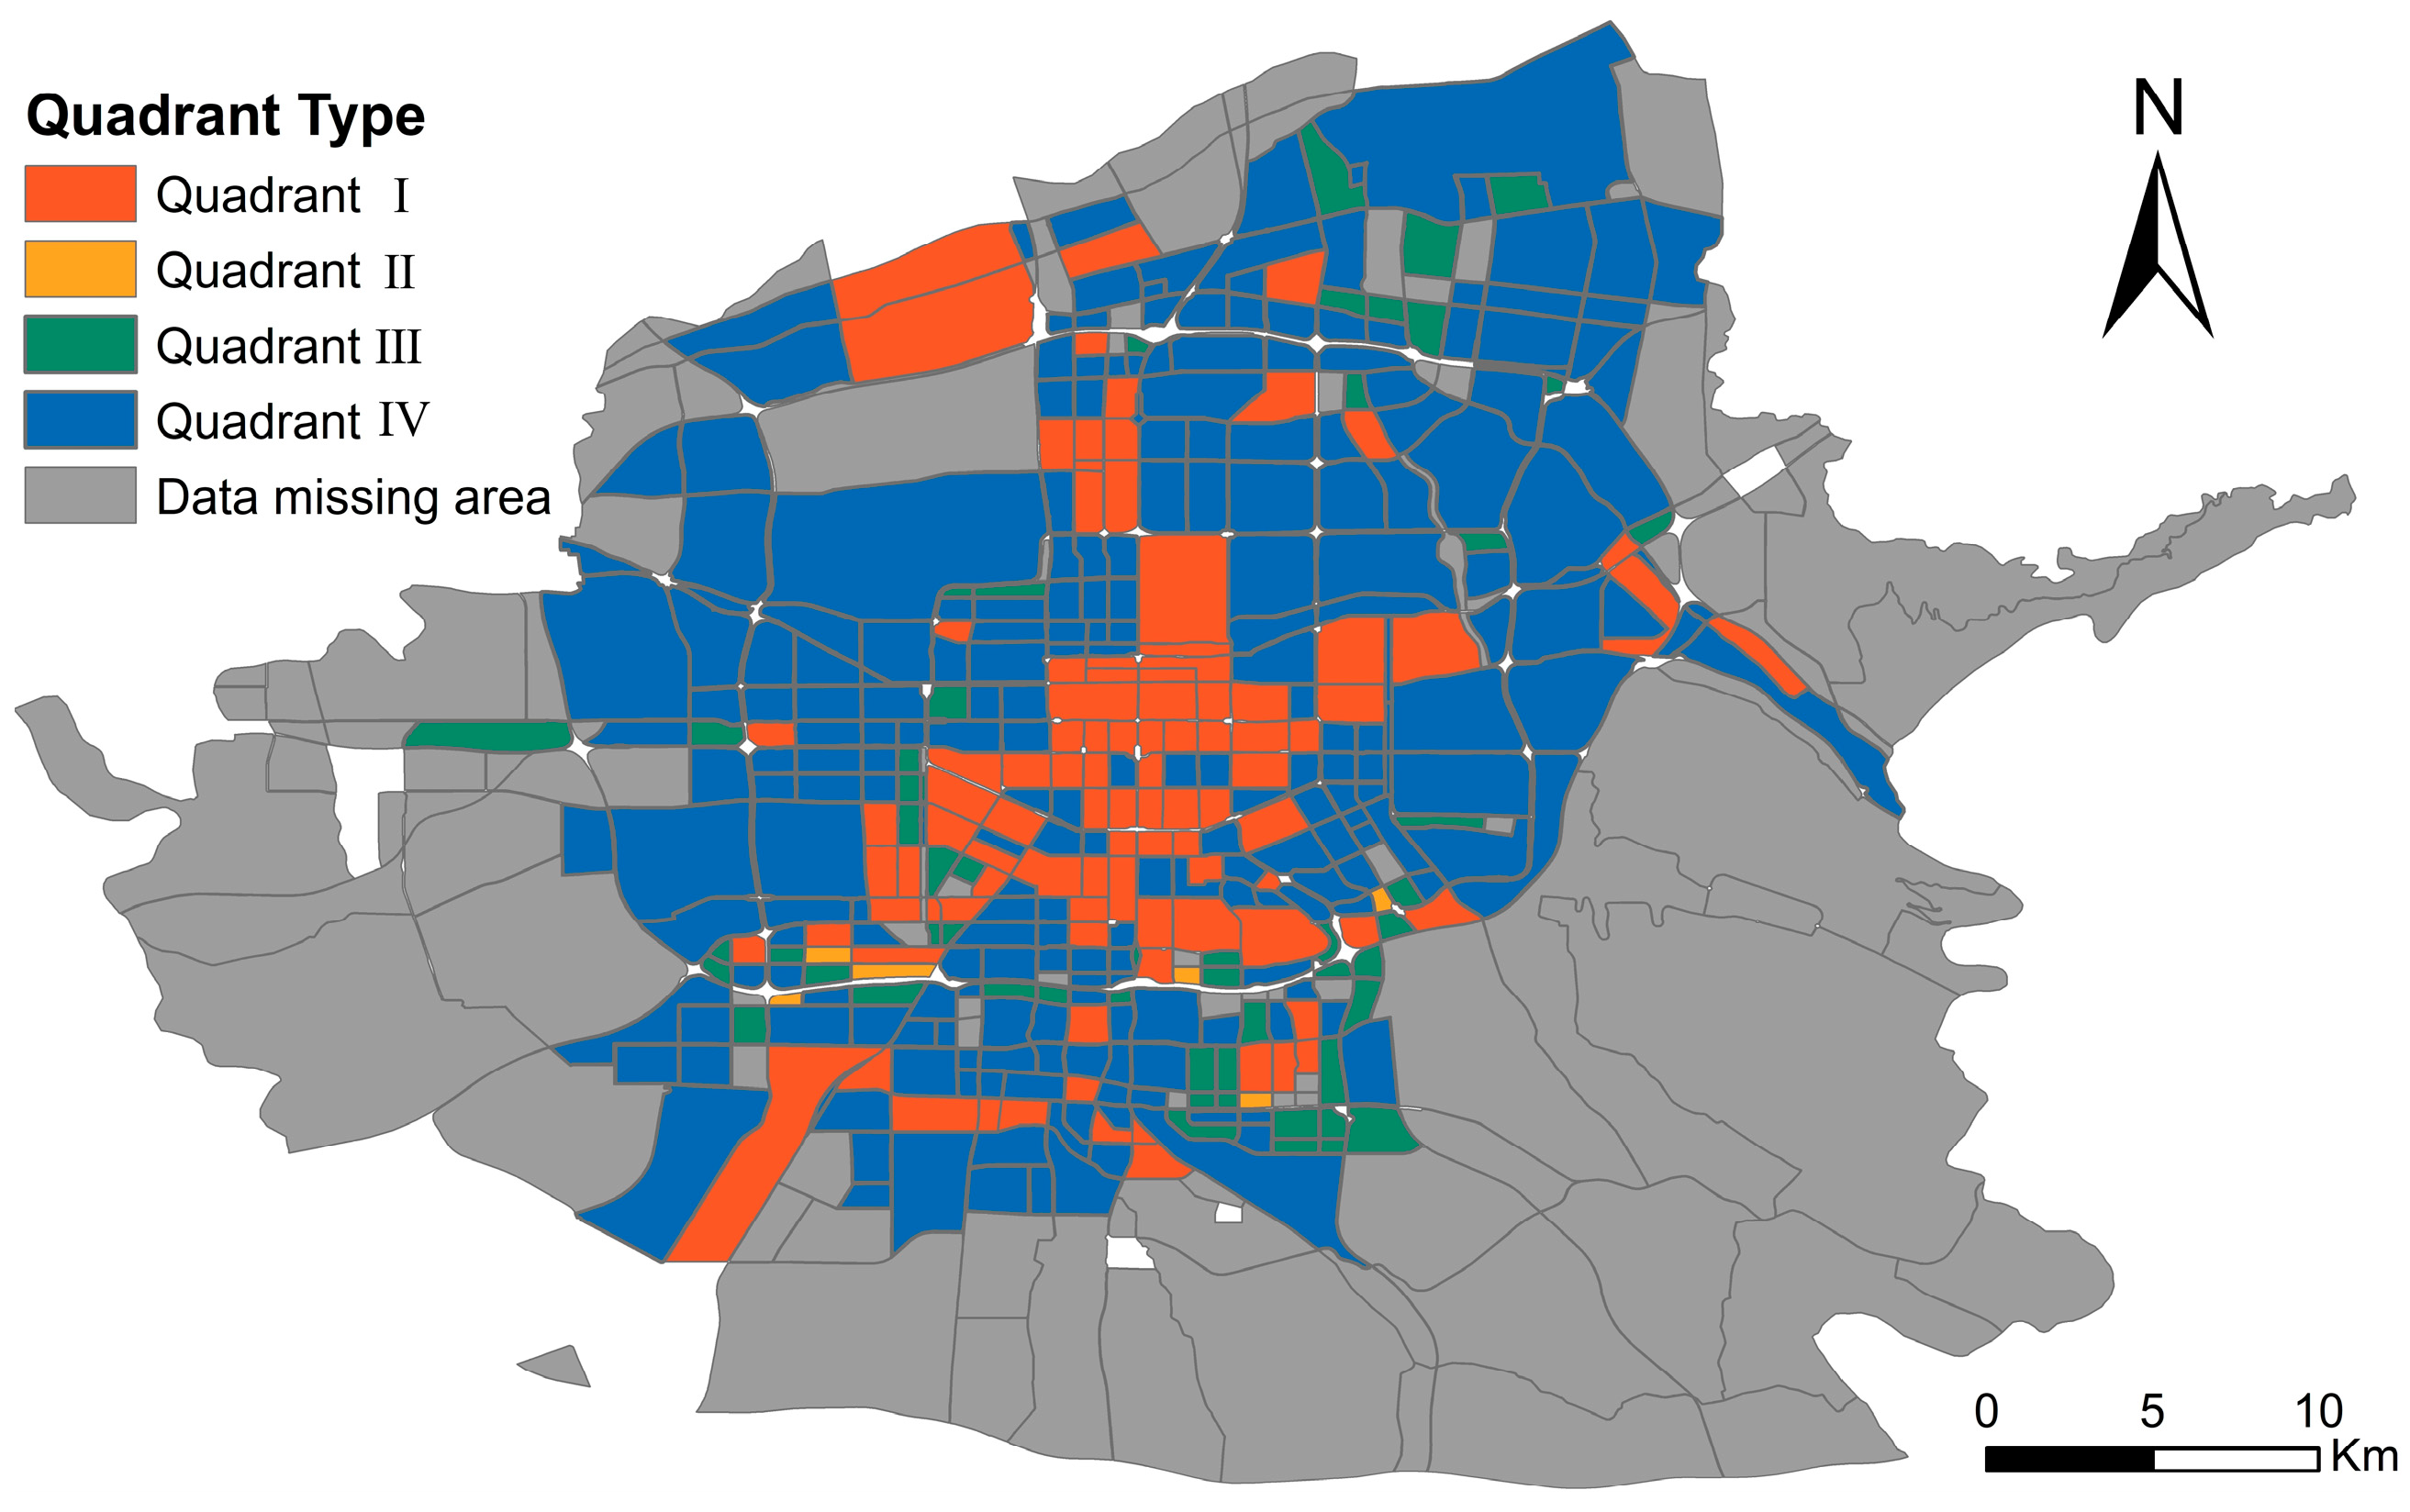
3.4. Spatial and Temporal Mixing Patterns of Land Use in Xi’an City

The pattern of the temporal diversity index for different block types in Xi’an can be portrayed by two indicators: the temporal entropy index (TEI) and the daily temporal diversity index (DTDI). We constructed TEIs for each block and combined them with their DTDIs to analyze the temporal diversity characteristics of the different blocks through binary scatter plots. As seen in Figure 11, the blocks can be categorized into four types based on the distribution of the DTDI and TEI values:
  • Quadrant I (high DTDI, high TEI): These blocks have high diversity and a more balanced distribution of temporal diversity, suggesting a more reasonable schedule of business hours and a variety of functional types;
  • Quadrant II (high DTDI, low TEI): This type of block has high diversity, but the distribution of temporal diversity is uneven, and may be characterized by a concentration of business activities or functional uses at specific times of day, rather than a balanced distribution throughout the day;
  • Quadrant III (low DTDI, low TEI): This represents areas with low overall diversity and a more homogenous distribution of temporal diversity, which may be dominated by single-function blocks, such as purely residential areas or areas with relatively monotonous functions;
  • Quadrant IV (low DTDI, high TEI): Despite low overall diversity, the temporal diversity is more evenly distributed, suggesting that the area needs to be improved in terms of its type of function, but it has a more stable pattern of business hours.
From the image results, most of the blocks in Xi’an have high TEI values, indicating a more balanced distribution of its business activities in time. However, most of the blocks have low DTDI values, reflecting the relative homogeneity of their land use types and the insufficient degree of functional mixing. Figure 12 further shows the spatial distribution pattern of different quadrant blocks in Xi’an.
The blocks in Quadrant I (high DTDI and high TEI) are primarily located in the urban core of Xi’an and in several peripheral local living centers. These areas are mainly composed of Bus and Res-dominated zones and BIR mixing zones. They exhibit a high level of functional mixing throughout the day and a relatively balanced distribution of business hours, reflecting the stable and diversified all-day land use characteristics typical of urban core areas. Such zones feature a high concentration of commercial, public service, and residential functions, such as, for example, the core area within the Xi’an city wall, the residential district of Aerospace City, and New Chang’an Square.
There are fewer blocks in Quadrant II (high DTDI, low TEI), primarily classified as Bus and Res-dominated and BIR mixing zones, and they are scattered along the southern edge of the Second Ring Road in Xi’an. These blocks mainly consist of commercial creative parks located around exhibition and financial centers, science and technology parks, and residential areas, such as the Xi’an High-tech Entrepreneurship Park, the Zhangba Road Financial Center, and Qujiang Creative Valley. Located in high-tech industrial cluster areas, these blocks are primarily used for office and business activities and are supported by relatively well-developed ancillary functions, resulting in high daily functional diversity. However, business activities are concentrated between 7:00 and 18:00, with pronounced peaks, leading to low time entropy. This reflects the characteristic of functional agglomeration but uneven temporal utilization.
The blocks in Quadrant III (low DTDI and low TEI) are scattered across areas outside the city center, primarily classified as residential-dominated and Bus and Res-dominated. These blocks are characterized by a singular overall function and concentrated business activities, such as, for example, Xi’an Aerospace City Industrial Park and Xi’an International Port Residential Area. These areas are dominated by a single function, typically consisting of industrial parks, idle land, or densely concentrated residential zones.
Quadrant IV (low DTDI, high TEI) contains the largest number of blocks. In terms of type, they are mainly residential-dominated and Bus and Res-dominated and are widely distributed along major roads or around ring roads outside the urban core area. These blocks exhibit low overall functional diversity, yet their business hours are relatively evenly distributed. This type of block is dominated by a single function, with commercial and industrial activities characterized by continuous operation or all-day service, reflecting a relatively stable but low-diversity land use pattern.
Overall, the blocks in each quadrant of Xi’an exhibit distinct structural distribution patterns within the urban space. While the business hours of most blocks are relatively reasonable, there remains a need to incorporate more diversified land use types within their functional structure. Notably, the blocks dominated by residential functions constitute a large proportion of the study area and are primarily concentrated in Quadrants III and IV. The internal commercial and industrial functions in these blocks are comparatively weak, indicating clear potential for optimization.
The following figures (Figure 13) illustrate the functional distribution characteristics of typical residential-dominated blocks in Quadrants III and IV at two distinct time points within a day:
As can be seen from the figure, the residential-dominated blocks in Quadrant III exhibit highly singular residential functional characteristics, with limited commercial and industrial activities that are primarily concentrated within specific time periods. The active period occurs at 9:00 in the morning, while the block remains inactive at 21:00 in the evening, resulting in low time entropy and relatively unreasonable business hour arrangements. Therefore, this type of block urgently requires the introduction of diversified supporting services with differentiated business hour distributions to enhance its functional diversity.
In contrast, the residential-dominated blocks in Quadrant IV demonstrate a more balanced temporal distribution of commercial and industrial activities: at 9:00, commercial facilities in the area are in operation, while public facilities are not yet active. By 21:00, commercial facilities have closed, and public facilities become active. This staggered operation increases the time entropy index of the block, reflecting a more balanced functional structure. However, despite the relatively reasonable time distribution, the overall functional composition of these blocks remains relatively singular, with a low degree of spatial mixing. Therefore, for this type of block—whether it is a nighttime economic potential area or a daytime economic potential area—it is necessary to further introduce a greater number and a wider variety of all-day commercial and industrial functions to optimize the functional structure and mixing level of the block. Meanwhile, in line with Xi’an’s “15-min living circle” planning strategy, the newly introduced functions should be spatially nested in a rational manner with residential functions to improve the accessibility and spatial integration of service facilities.

4. Discussion

4.1. Difference Between Temporal Diversity and Diversity Calculated in the Traditional Way

In order to explore the differences resulting from the inclusion of temporal availability in the diversity calculations, this study assumed that all functional types were open all day and calculated the raw diversity of the different blocks, which was subsequently compared to the daily temporal diversity index to generate a difference plot (Figure 14). As can be seen in Figure 14a, most of the blocks calculated through the traditional method had significantly higher diversity classes than their daily temporal diversity index classes. This result indicates a systematic overestimation of the diversity mix of land uses when temporal availability is not taken into account. This conclusion is further validated by the difference plots, which indicate the importance of the temporal dimension in diversity assessment, and that ignoring temporal availability may lead to a misjudgment of mixed land use diversity.
In order to reveal the differences more clearly, we have taken a typical block with large differences in diversity and started the analysis with block 267 as an example. Figure 15 shows the corresponding realistic areas of the block, where block A is a university stadium, blocks B and C contain several high schools, and block D is a shopping mall. Figure 16 illustrates the diversity characterizing block 267 over the course of the day, where the blue curve indicates the diversity calculated without considering the temporal availability of the block, and the green curve indicates the diversity characterization that will take into account temporal availability. Based on the characteristics of the curves, we selected four representative points in time after the block opened for business in the morning, namely 9:00, 15:00, 19:00, and 21:00, for in-depth analysis (Figure 17).
Combining the curves with the graphical analysis shows that the business status of the block function exhibits significant spatial and temporal differences over time. A specific analysis shows that, from 6:00 to 9:00, business, industry, and public land within the block gradually enter the morning operation phase, and by 9:00, all types of land are at the peak of activity, when the functional diversity reaches a high level. At 15:00 h, the university stadium represented by Area A was closed due to time factors, and so the business areas in Area D were also closed after the peak lunchtime consumption period, resulting in a slight decrease in the diversity of the block. After 19:00, most of the public land uses in Zone B and C go into non-operational status, a change that closely correlates with middle school dismissal times, resulting in a continued decline in diversity. At 21:00, most blocks were out of operation and diversity had dropped to low levels. It is worth noting that one middle school in Area C is still shown as open, which may be due to street traffic or other factors on the day, resulting in a slight bias in the data results. Overall, after considering the temporal availability of land use functions, the diversity of the blocks also showed a change in characteristics over time, with significant changes compared to the results of the original measurement method.

4.2. Model Transferability

The spatiotemporal hybrid land use measurement system constructed in this study relies on high-resolution thermal data and AOI data, demonstrating good applicability in urban environments characterized by high data accuracy and a relatively comprehensive information base. However, given the differences in data availability across cities, the transferability and applicability of this method must carefully consider the potential impacts of factors such as spatial and temporal resolution on the construction of the indicator system and the accuracy of its calculations.
In terms of spatial resolution, this study adopts a 30 × 30 m grid as the smallest basic unit of analysis, primarily relying on AOI data to annotate functional types. This scale exhibits strong adaptability in urban land use research and has been widely applied in related empirical studies. In urban environments with low spatial data accuracy, grid functions can be identified through kernel density analysis of POI data, remote sensing image classification, or street view image recognition. Meanwhile, low spatial resolution thermal data can be converted to a matching scale via spatial interpolation or multi-source fusion. From a spatial perspective, the research method demonstrates a certain degree of transferability.
In terms of temporal resolution, this study utilizes hourly-level crowd thermal data as the basis for identifying business hours. The high temporal precision facilitates the capture of dynamic changes in the operational status of blocks, thereby enhancing the discriminative capacity of the indicator system. Consequently, in cities lacking high-frequency dynamic behavioral data, the accuracy of business hour identification and the overall effectiveness of the model may be limited. To address this, different urban contexts may consider incorporating alternative time-series behavioral data, such as mobile payment records, traffic flow monitoring data, or social media check-ins, to reduce dependence on high temporal resolution thermal data and further improve the applicability and generalizability of the framework across diverse data environments.

5. Conclusions

Land use mix measurement is a key focus in urban development planning, and diversity indices can be employed to assess the degree of functional mixing within blocks. However, most traditional diversity measures are derived from a static spatial perspective, neglecting the temporal availability of land use. This study constructs a series of time-sensitive diversity metrics by incorporating thermal data that characterizes pedestrian activity, thereby inferring block operating hours and including the temporal diversity index (TDI), the daily temporal diversity index (DTDI), and the temporal entropy index (TEI). A methodology for measuring diversity based on the temporal availability of land use is proposed. Diversity was also characterized at both the street block (see DTDI measure results) and grid (see block 267 diversity measure results) scales. The results of the study show that:
(1)
TDI and DTDI indicators are more time-sensitive than traditional diversity measures, which often overestimate the diversity of land use mix. By incorporating the temporal availability of land use, TDI and DTDI provide a more accurate measurement of land use mix;
(2)
The opening times of business and industrial land uses in Xi’an exhibit a unimodal distribution, with a peak around 6:00. In contrast, the closing times show a multimodal distribution, with prominent peaks at 1:00, 13:00, 19:00, and 21:00. At the block level, land use business patterns can be categorized into two types: daytime–active (associated with daytime work activities) and nighttime–active (dominated by nighttime commercial activities);
(3)
The business hours of business and industrial land uses in Xi’an are generally reasonable. However, the combination of functional types still leaves room for optimization. Most blocks in Xi’an, particularly those dominated by residential functions, typically show lower DTDI and higher TEI, indicating that the business hours for business and industrial land uses within these areas are appropriately set, yet the overall functional diversity remains insufficient. Moreover, the introduction of business functions can enhance the overall diversity of residential-dominated blocks.
Despite the progress achieved in this study, several limitations remain. (1) This study primarily focuses on the diversity of functional types within land use mix, without incorporating indicators such as accessibility and compatibility, which are crucial for characterizing spatial and attribute features, into the improvement framework. Existing research has demonstrated that diversity indicators have limitations in capturing the interactions and externalities between blocks [12,30]. Future studies could consider introducing these factors to more fully assess the degree of land use mix. (2) This study infers the business hours of block functions based on urban vitality patterns revealed by thermal data. Although this approach offers high spatial–temporal resolution and dynamic responsiveness, it should be noted that thermal data primarily captures patterns of human aggregation rather than the institutional or policy-defined operating hours of specific functions. In areas such as commercial complexes or transportation hubs, where functional mixing is high and human activity is relatively unrestricted, discrepancies may arise, such as active crowd presence despite inactive functions, or sparse human presence despite active functions, which can affect the accurate identification of actual business hours. In addition, thermal data reflect the intensity of human aggregation but cannot effectively distinguish between different types of activity flows, such as “work flow” (e.g., employee commuting) and “consumption flow” (e.g., customer visits). This limitation increases the likelihood of misjudging actual business hours, particularly in areas where commercial and public land uses are functionally mixed. To enhance the accuracy of business hour inference, future studies could incorporate multi-source data with time-stamped attributes or stronger behavioral identification capabilities, such as social media check-ins, transaction records, or Wi-Fi usage data, to more comprehensively capture the actual utilization status and business hour characteristics of blocks. Overall, this study optimizes the measurement approach for land use mix from the perspective of time availability, providing novel analytical tools and practical insights for urban planning and land use optimization.

Author Contributions

Conceptualization, Y.H. and H.C.; Data curation, Y.H.; Funding acquisition, H.C.; Methodology, Y.H.; Project administration, H.C.; Resources, Y.H., H.C., and X.Y.; Supervision, H.C. and X.Y.; Validation, Y.H.; Visualization, Y.H.; Writing—original draft, Y.H.; Writing—review and editing, Y.H., H.C., X.Y., Y.C., T.C., and W.F. All authors have read and agreed to the published version of the manuscript.

Funding

This research was funded by the Shaanxi Federation of Social Sciences, grant number 2025HZ0762.

Data Availability Statement

The data presented in this study are available on request from the corresponding author. The data are not publicly available due to privacy or ethical restrictions.

Conflicts of Interest

The authors declare no conflicts of interest.

References

  1. Hu, T.; Yang, J.; Li, X.; Gong, P. Mapping Urban Land Use by Using Landsat Images and Open Social Data. Remote Sens. 2016, 8, 151. [Google Scholar] [CrossRef]
  2. Zhuo, Y.; Jing, X.; Wang, X.; Li, G.; Xu, Z.; Chen, Y.; Wang, X. The Rise and Fall of Land Use Mix: Review and Prospects. Land 2022, 11, 2198. [Google Scholar] [CrossRef]
  3. Ma, Y.; Liu, S.; Xue, G.; Gong, D. Soft Sensor with Deep Learning for Functional Region Detection in Urban Environments. Sensors 2020, 20, 3348. [Google Scholar] [CrossRef] [PubMed]
  4. Congress for the New Urbanism. Charter of the New Urbanism; Congress for the New Urbanism: New York, NY, USA, 2013. [Google Scholar]
  5. Smart Growth Principles-Mixed Land Uses. Available online: https://www.epa.gov/smartgrowth/about-smart-growth (accessed on 1 June 2025).
  6. Song, Y.; Merlin, L.; Rodriguez, D. Comparing measures of urban land use mix. Comput. Environ. Urban Syst. 2013, 42, 1–13. [Google Scholar] [CrossRef]
  7. Gehrke, S.R.; Clifton, K.J. An activity-related land use mix construct and its connection to pedestrian travel. Environ. Plan. B Urban Anal. City Sci. 2019, 46, 9–26. [Google Scholar] [CrossRef]
  8. Duncan, M.J.; Winkler, E.; Sugiyama, T.; Cerin, E.; Dutoit, L.; Leslie, E.; Owen, N. Relationships of Land Use Mix with Walking for Transport: Do Land Uses and Geographical Scale Matter? J. Urban Health 2010, 87, 782–795. [Google Scholar] [CrossRef]
  9. Yue, Y.; Zhuang, Y.; Yeh, G.O.A. Measurements of POI-based mixed use and their relationships with neighbourhood vibrancy. Int. J. Geogr. Inf. Sci. 2017, 31, 658–675. [Google Scholar] [CrossRef]
  10. Taleai, M.; Sharifi, A.; Sliuzas, R.; Mesgari, M. Evaluating the compatibility of multi-functional and intensive urban land uses. Int. J. Appl. Earth Obs. Geoinf. 2007, 9, 375–391. [Google Scholar] [CrossRef]
  11. Tian, L.; Liang, Y.; Zhang, B. Measuring residential and industrial land use mix in the peri-urban areas of China. Land Use Policy 2017, 69, 427–438. [Google Scholar] [CrossRef]
  12. Zhuo, Y.; Zheng, H.; Wu, C.; Xu, Z.; Li, G.; Yu, Z. Compatibility mix degree index: A novel measure to characterize urban land use mix pattern. Comput. Environ. Urban Syst. 2019, 75, 49–60. [Google Scholar] [CrossRef]
  13. Zhao, X.; Xia, N.; Li, M. 3-D multi-aspect mix degree index: A method for measuring land use mix at street block level. Comput. Environ. Urban Syst. 2023, 104, 102005. [Google Scholar] [CrossRef]
  14. Kwan, M.P.; Richardson, D.; Wang, D.; Zhou, C. Beyond Space (As We Knew It): Toward Temporally Integrated Geographies of Segregation, Health, and Accessibility. Ann. Assoc. Am. Geogr. 2013, 103, 1078–1086. [Google Scholar] [CrossRef]
  15. Wang, Y.D.; Wang, T.; Tsoh, M.H.; Li, H.; Jiang, W.; Guo, F.Q. Mapping Dynamic Urban Land Use Patterns with Crowdsourced Geo-Tagged Social Media (Sina-Weibo) and Commercial Points of Interest Collections in Beijing, China. Sustainability 2016, 8, 1202. [Google Scholar] [CrossRef]
  16. Jacobs-Crisioni, C.; Rietveld, P.; Koomen, E.; Tranos, E. Evaluating the Impact of Land-Use Density and Mix on Spatiotemporal Urban Activity Patterns: An Exploratory Study Using Mobile Phone Data. Environ. Plan. A Econ. Space 2014, 46, 2769–2785. [Google Scholar] [CrossRef]
  17. Li, M.; Shen, Z.; Hao, X. Revealing the relationship between spatio-temporal distribution of population and urban function with social media data. GeoJournal 2016, 81, 919–935. [Google Scholar] [CrossRef]
  18. Sulis, P.; Manley, E.; Zhong, C.; Batty, M. Using mobility data as proxy for measuring urban vitality. J. Spat. Inf. Sci. 2018, 16, 384. [Google Scholar] [CrossRef]
  19. Li, X.; Hu, T.; Gong, P.; Du, S.; Chen, B.; Li, X.; Dai, Q. Mapping Essential Urban Land Use Categories in Bejing with a Fast Area of Interest (AOI)-Based Method. Remote Sens. 2021, 13, 477. [Google Scholar] [CrossRef]
  20. Li, M.; Zhu, N. Research on the Method of Artificial Intelligence for Identifying Urban Land-Use Types Based on Areas of Interest (AOI) and Multi-Source Data. Land 2025, 13, 2040. [Google Scholar] [CrossRef]
  21. Mo, Y.; Huang, Y.F.; Zhong, R.F.; Wang, B.; Guo, Z.C. Investigating the Effects of 2D/3D Urban Morphology on Land Surface Temperature Using High-Resolution Remote Sensing Data. Buildings 2025, 15, 1256. [Google Scholar] [CrossRef]
  22. Lv, H.; Wu, Z.N.; Guan, X.J.; Meng, Y.; Wang, H.L.; Zhou, Y.H. Threshold effect of data amount and grid size on urban land use type identification using multi-source data fusion. Sustain. Cities Soc. 2023, 98, 104855. [Google Scholar] [CrossRef]
  23. Dovey, K.; Pafka, E. What is functional mix? An assemblage approach. Plan. Theory Pract. 2017, 18, 249–267. [Google Scholar] [CrossRef]
  24. Zheng, H.Y.; Zhuo, Y.F.; Xu, Z.G.; Wu, C.F.; Huang, J.H.; Fu, Q. Measuring and characterizing land use mix patterns of China’s megacities: A case study of Shanghai. Growth Change 2021, 52, 2509–2539. [Google Scholar] [CrossRef]
  25. Jones, R. Landscape ecology: In theory and practice, pattern and process. Geography 2002, 87, 369–370. [Google Scholar]
  26. Frank, L.D.; Pivo, G. Impacts of Mixed Use and Density on The Utilization of Three Modes of Travel: The Single-Occupant Vehicle, Transit, and Walking. Transp. Res. Board. 1994, 1466, 44–52. [Google Scholar]
  27. Li, J.W.; Chen, Y.; Zhao, D.; Zhai, J.G. The Impact of Built Environment on Mixed Land Use: Evidence from Xi’an. Land 2024, 13, 2214. [Google Scholar] [CrossRef]
  28. Da Fontoura, L.C.; Kanashiroal, M.; Urbanoa, M.R. Comparing land use mix measures for different urban areas: An application in a Brazilian city. Urbe-Rev. Bras. Gest. Urbana. 2025, 17, 02023031. [Google Scholar] [CrossRef]
  29. Macqueen, J.B. Some Methods for Classification and Analysis of Multivariate Observations. Proc. Fifth Berkeley Symp. Math. Stat. Probab. 1967, 1, 281–297. [Google Scholar]
  30. Zhang, M.Z.; Zhao, P.J. The impact of mixed land-use on residents’ travel energy consumption: New evidence from Beijing. Transp. Res. Part D-Transp. Environ. 2016, 57, 224–236. [Google Scholar] [CrossRef]
Figure 1. Location of the study area.
Land 14 01457 g001
Figure 2. Land use mix model characterization framework (“B” for business, “I” for industry, and “R” for residence).
Land 14 01457 g002
Figure 3. Business hours prediction accuracy.
Land 14 01457 g003
Figure 4. System of indicators composed of TDI, DTDI, and TEI (The dashed box represents the set of 24-hour TDI indices).
Land 14 01457 g004
Figure 5. Research technology roadmap.
Land 14 01457 g005
Figure 6. Functional spatial distribution of street blocks in Xi’an City, China.
Land 14 01457 g006
Figure 7. Patterns of business hours for business and industrial grids in Xi’an.
Land 14 01457 g007
Figure 8. Silhouette score coefficients for different values of K.
Land 14 01457 g008
Figure 9. Cluster analysis of business model of Xi’an blocks (Curves in different colors represent different blocks).
Land 14 01457 g009
Figure 10. Distribution of temporal diversity index of blocks in Xi’an. (a) The DTDI; (b) TDI at 8:00; (c) TDI at 14:00; (d) TDI at 21:00. (Grey areas indicate regions with no data).
Land 14 01457 g010
Figure 11. Relationship between DTDI and TEI for different categories of blocks in Xi’an City.(The dashed lines represent the boundaries between different quadrants.)
Land 14 01457 g011
Figure 12. Spatial distribution patterns of blocks in different quadrants in Xi’an City.
Land 14 01457 g012
Figure 13. Functional distribution of different quadrants at different time points. (a) Functional distribution of typical blocks in Quadrant III at 9:00; (b) Functional distribution of typical blocks in Quadrant III at 21:00; (c) Functional distribution of typical blocks in Quadrant IV at 9:00; (d) Functional distribution of typical blocks in Quadrant IV at 9:00. (Grey areas indicate regions with no data).
Land 14 01457 g013aLand 14 01457 g013b
Figure 14. Diversity of Xi’an blocks calculated by the traditional method and difference plots. (a) The diversity of blocks in Xi’an obtained by the traditional calculation method. (b) The difference between it and the DTDI in Xi’an. (Grey areas indicate regions with no data).
Land 14 01457 g014
Figure 15. Functional distribution of block 267 and its corresponding remote sensing map of the real area. (A, B, C, and D indicate the selected case areas).
Land 14 01457 g015
Figure 16. Changes in temporal diversity in block 267. (The red points and the red dashed lines represent the four selected time points used for analysis).
Land 14 01457 g016
Figure 17. Functional distribution of land use for different time periods for block 267. (a) The functional distribution of land use at 9:00. (b) The functional distribution of land use at 15:00. (c) The functional distribution of land use at 19:00. (d) The functional distribution of land use at 21:00. (Grey areas indicate regions with no data).
Land 14 01457 g017
Table 1. Characterization of AOI data.
FormClassification at the First LevelClassification at the Second LevelQuantities
BusinessBusiness4 s services, Media organizations, Shopping complexes, Financial services, Hotel accommodation, Gourmet food and Drinks, Agriculture, Forestry, Animal husbandry and Fishery bases, Training institutes, Automobile services, Automobile maintenance, Commercial buildings (buildings), Living services, Sports venues (golf, golf-related), Entertainment and Recreation, No major category (sports and recreation service venues), Commercial buildings (industrial parks (logistics, logistics and express))6842
TransportationRoad information, Transportation facilities (bus stops, train stations, parking lots)518
Land for public administration and public servicesScientific research institutions, Humanities education, Social organizations, Sports related (sports stadiums, sports venues), Healthcare, Government offices, No major category (science, education, and cultural venues, sports and leisure venues, government and social organizations, government and social organizations related)6494
Green space and plazaScenic spots865
ResidenceResidenceResidential housing, Business buildings (business housing, business housing related)7489
IndustryIndustryCorporate enterprises, Commercial buildings (industrial park), No major category (corporate enterprises)2963
Disclaimer/Publisher’s Note: The statements, opinions and data contained in all publications are solely those of the individual author(s) and contributor(s) and not of MDPI and/or the editor(s). MDPI and/or the editor(s) disclaim responsibility for any injury to people or property resulting from any ideas, methods, instructions or products referred to in the content.

