Article

Spatiotemporal Coupling Characteristics Between Urban Land Development Intensity and Population Density from a Building-Space Perspective: A Case Study of the Yangtze River Delta Urban Agglomeration

by
Xiaozhou Wang
,
Lie You
and
Lin Wang
*
School of Design, Shanghai Jiao Tong University, Shanghai 200240, China
*
Author to whom correspondence should be addressed.
Land 2025, 14(7), 1459; https://doi.org/10.3390/land14071459
Submission received: 21 May 2025 / Revised: 8 July 2025 / Accepted: 11 July 2025 / Published: 13 July 2025

Abstract

As China shifts from rapid to high-quality development, urban growth has exhibited allometric patterns. This study evaluated land use efficiency from the perspective of architectural space, focusing on 41 cities in the Yangtze River Delta urban agglomeration from 2010 to 2020. A land development intensity index was constructed at both the provincial and municipal levels using the entropy weight method, integrating floor area ratio, building density, and functional mix. The spatiotemporal characteristics of land development intensity and population density were analyzed, and a coordination coupling model was applied to identify mismatches between land and population. The results reveal: (1) Temporally, the imbalance of “more people, less land” in the Yangtze River Delta diminished. Spatially, leading regions exhibit a diffusion effect. Shanghai showed a decline in both population density and development intensity; Zhejiang maintained balanced development; Jiangsu experienced accelerated growth; and Anhui showed signs of catching up. (2) Although the two indicators showed a high coupling degree and strong correlation, the coordination degree remained low, indicating poor quality of correlation. The land-population relationship demonstrated a fluctuating pattern of “strengthening–weakening” over time. Shanghai exhibited the highest coordination, while more than half of the cities in Jiangsu, Zhejiang, and Anhui still needed optimization. (3) Unlike previous findings that linked such patterns to shrinking cities, in this transformation stage, the number of cities where land development intensity exceeded population density continued to grow in advanced regions. This study first applied 3D building data at the macro scale to support differentiated spatial policies.

1. Introduction

Against the backdrop of a global urbanization rate reaching 57% and a population surpassing 8 billion, land scarcity has emerged as a critical constraint on sustainable development [1]. In 2022, per capita arable land dropped to 0.217 hectares, down by 37.5% from 0.347 hectares in 1985 [2]. Meanwhile, per capita built-up land increased from 109 m2 in 1985 to 143 m2 in 2020—an approximate 31% rise [3]. Sustainable Development Goal 11 (SDG 11) advocates for the creation of inclusive, safe, resilient, and sustainable cities and human settlements [4]. China faces an acute shortage of land resources—only 27% of the national territory is arable, per capita arable land is less than 40% of the global average, and more than 60% of high-quality farmland is concentrated in eastern coastal areas such as the Yangtze River Delta [5,6]. At the same time, per capita built-up land has reached 130 m2, exceeding the national guideline of 65–115 m2, indicating inefficient land use [3]. Accurately and rationally measuring urban land development intensity and systematically examining its relationship with population density are key to addressing these challenges.
The coordination between population density and urban land development intensity cannot be resolved through simple linear analysis. Globally, studies have shown that urban land expansion in many cities has outpaced population growth [7,8,9,10]. Unlike the United States—with vast land and low development intensity—or Japan—with both high population density and development intensity—China presents a structural contradiction: vast territory with limited usable land, and a large but unevenly distributed population. As the country approaches the late stage of rapid urbanization, with an urbanization rate of 65.22% [11], mismatches between urban development and population growth are increasingly prominent. Some cities, driven by land finance, exhibit faster urban construction than population growth, while others experience population influxes that exceed their development capacity [12,13,14]. The Yangtze River Delta urban agglomeration, accounting for only 3.7% of the national land area, accommodates 16.7% of the national population [15,16]. It is therefore necessary to explore the structural relationship between land development intensity and population density by integrating global experience with China’s local practices, to improve land use efficiency and advance toward sustainable urban development.
Scholars have examined land use efficiency from economic, social, and ecological perspectives. This study analyzed land use efficiency by examining the relationship between land development intensity and population density. Urban planning researchers define land development intensity as the dense clustering of buildings per unit of construction land, emphasizing spatial characteristics of cities, and typically associating it with indicators such as floor area ratio, building density, and land-use diversity [17,18,19]. This study adopts this definition. Most studies are confined to individual cities and lack spatiotemporal comparisons across different urban scales [20]. At the macro scale, scholars have established comprehensive land use efficiency indicators from two-dimensional perspectives, focusing on built-up area, and economic and ecological dimensions [21,22]. The two-dimensional perspective fails to capture vertical urban development, whereas three-dimensional building data more accurately reflect land development capacity. The “high development intensity–low population density” imbalance in East Asian cities, driven by vertical expansion, is often overlooked when relying solely on two-dimensional data, as low building density may mask overdevelopment and vacancy issues [23].
This study took 41 cities in the Yangtze River Delta urban agglomeration as its research subjects. Using land and building information data from 2010, 2015, and 2020, a land development intensity index is constructed through the entropy weighting method. The study analyzed the coupling coordination degree between land development intensity and population density, and explored their spatial and temporal matching and mismatching relationships. The contributions of this study are as follows. (1) It proposes a new method for evaluating land development intensity by incorporating architectural characteristics into the assessment framework, offering a novel perspective for large-scale analysis of urban land development intensity. (2) By applying a coordination coupling model, the concept of dynamic coupling is introduced into the study of human–land relationships, thereby extending the conventional assumption that mismatches only occur in shrinking cities to include economically developed regions. (3) The study reveals the specific disparities between land development intensity and population density across different cities, providing important data support for formulating tailored sustainable development policies.

2. Literature Review

2.1. Urban Land Development Studies

Land serves as the spatial carrier for urban economic and social activities [24]. Scholars have approached the study of land use efficiency from multiple perspectives. At the macro-regional scale, some researchers define land use efficiency as the economic output generated under actual land resource input, while others view it as an assessment of the comprehensiveness of land utilization during urban development processes [25,26,27]. Using methods such as the entropy weight method and analytic hierarchy process (AHP), researchers have constructed integrated evaluation systems incorporating demographic, economic, social, and ecological dimensions to assess the efficiency of industrial, agricultural, and development zone land use [27,28,29,30,31]. Land use efficiency is also often defined as the ratio between urban land expansion (land consumption) and population growth [8,32,33,34,35]. However, this study focused not on land use efficiency in the conventional economic sense, but rather on whether the built structures on land were effectively utilized—that is, the efficiency of built form.
At the micro-urban scale, urban designers, architects, and landscape architects have investigated land use efficiency through the lens of architectural space [17,18]. Key indicators such as floor area ratio (FAR), land use diversity, and building density are commonly used to analyze land development intensity [20,36,37,38]. For instance, Xia, Yeh [20] established a land development intensity evaluation framework using building density and FAR, revealing a strong positive correlation between development intensity and urban vitality across five major Chinese cities at the block level. However, they also identified areas of overbuilt or underutilized spaces. Lu, Shi [39] quantitatively measured urban vitality in central areas of Beijing and Chengdu and used regression models to demonstrate a strong association between the built environment and urban vibrancy. The influence of building density and FAR on urban vitality differs across cities at various development stages. Due to challenges in obtaining critical data such as FAR, building density, and land-use mix (LUM), studies focusing on building-based land development intensity are mostly concentrated at the micro level—typically within individual cities—while large-scale investigations across urban agglomerations remain scarce.

2.2. Relationship Between Urban Land and Population

Studies on the relationship between urban land and population have long relied on classical theories, with extensive work focused on data acquisition and analytical methods. Thomson [40] first proposed the theory of allometric growth, later defined in biology as the disproportionate development of different subsystems within a system [41]. The theory was subsequently applied to urban studies to describe the uneven growth between urban subsystems, highlighting their interactive dynamics [42,43]. Allometric models reveal that in China, early urbanization featured faster land expansion than population growth, while the reverse occurred in later stages [44]. Measurement methods for land-population coordination have also evolved. Traditional approaches include constructing integrated land use efficiency models based on economic, social, and environmental indicators to explore spatiotemporal relationships with population dynamics [29,30,31]. Chen [45] constructed an urban development intensity (UDI) index using 3D building volume and population density to assess spatial inequality between cities in the Global North and South. Related studies have focused on the ratio of built-up area to total population [8,46], land-use composition and population density [47], and vegetation cover in relation to population density [48]. The use of nighttime light data combined with gridded population estimates has made it possible to track changes in land–population dynamics over time [49]. However, due to the recent emergence of large-scale 3D building data, research on the relationship between land development intensity and population remains limited.

2.3. Research Gaps

Firstly, at the macro scale, due to the lack of data on floor area ratio, building density, and building height, researchers have rarely used architectural information to construct land development intensity indicators. The release of China’s first nationwide 10 m-resolution building height raster dataset for the year 2020 in 2023 [50] has made it possible to investigate the relationship between land development intensity and population density from an architectural perspective at a macro scale. Secondly, existing studies on land use efficiency focus on measuring the coordination degree between indicators [30,31,51], but lack further analysis of the specific conditions under which mismatches occur.

3. Data and Methodology

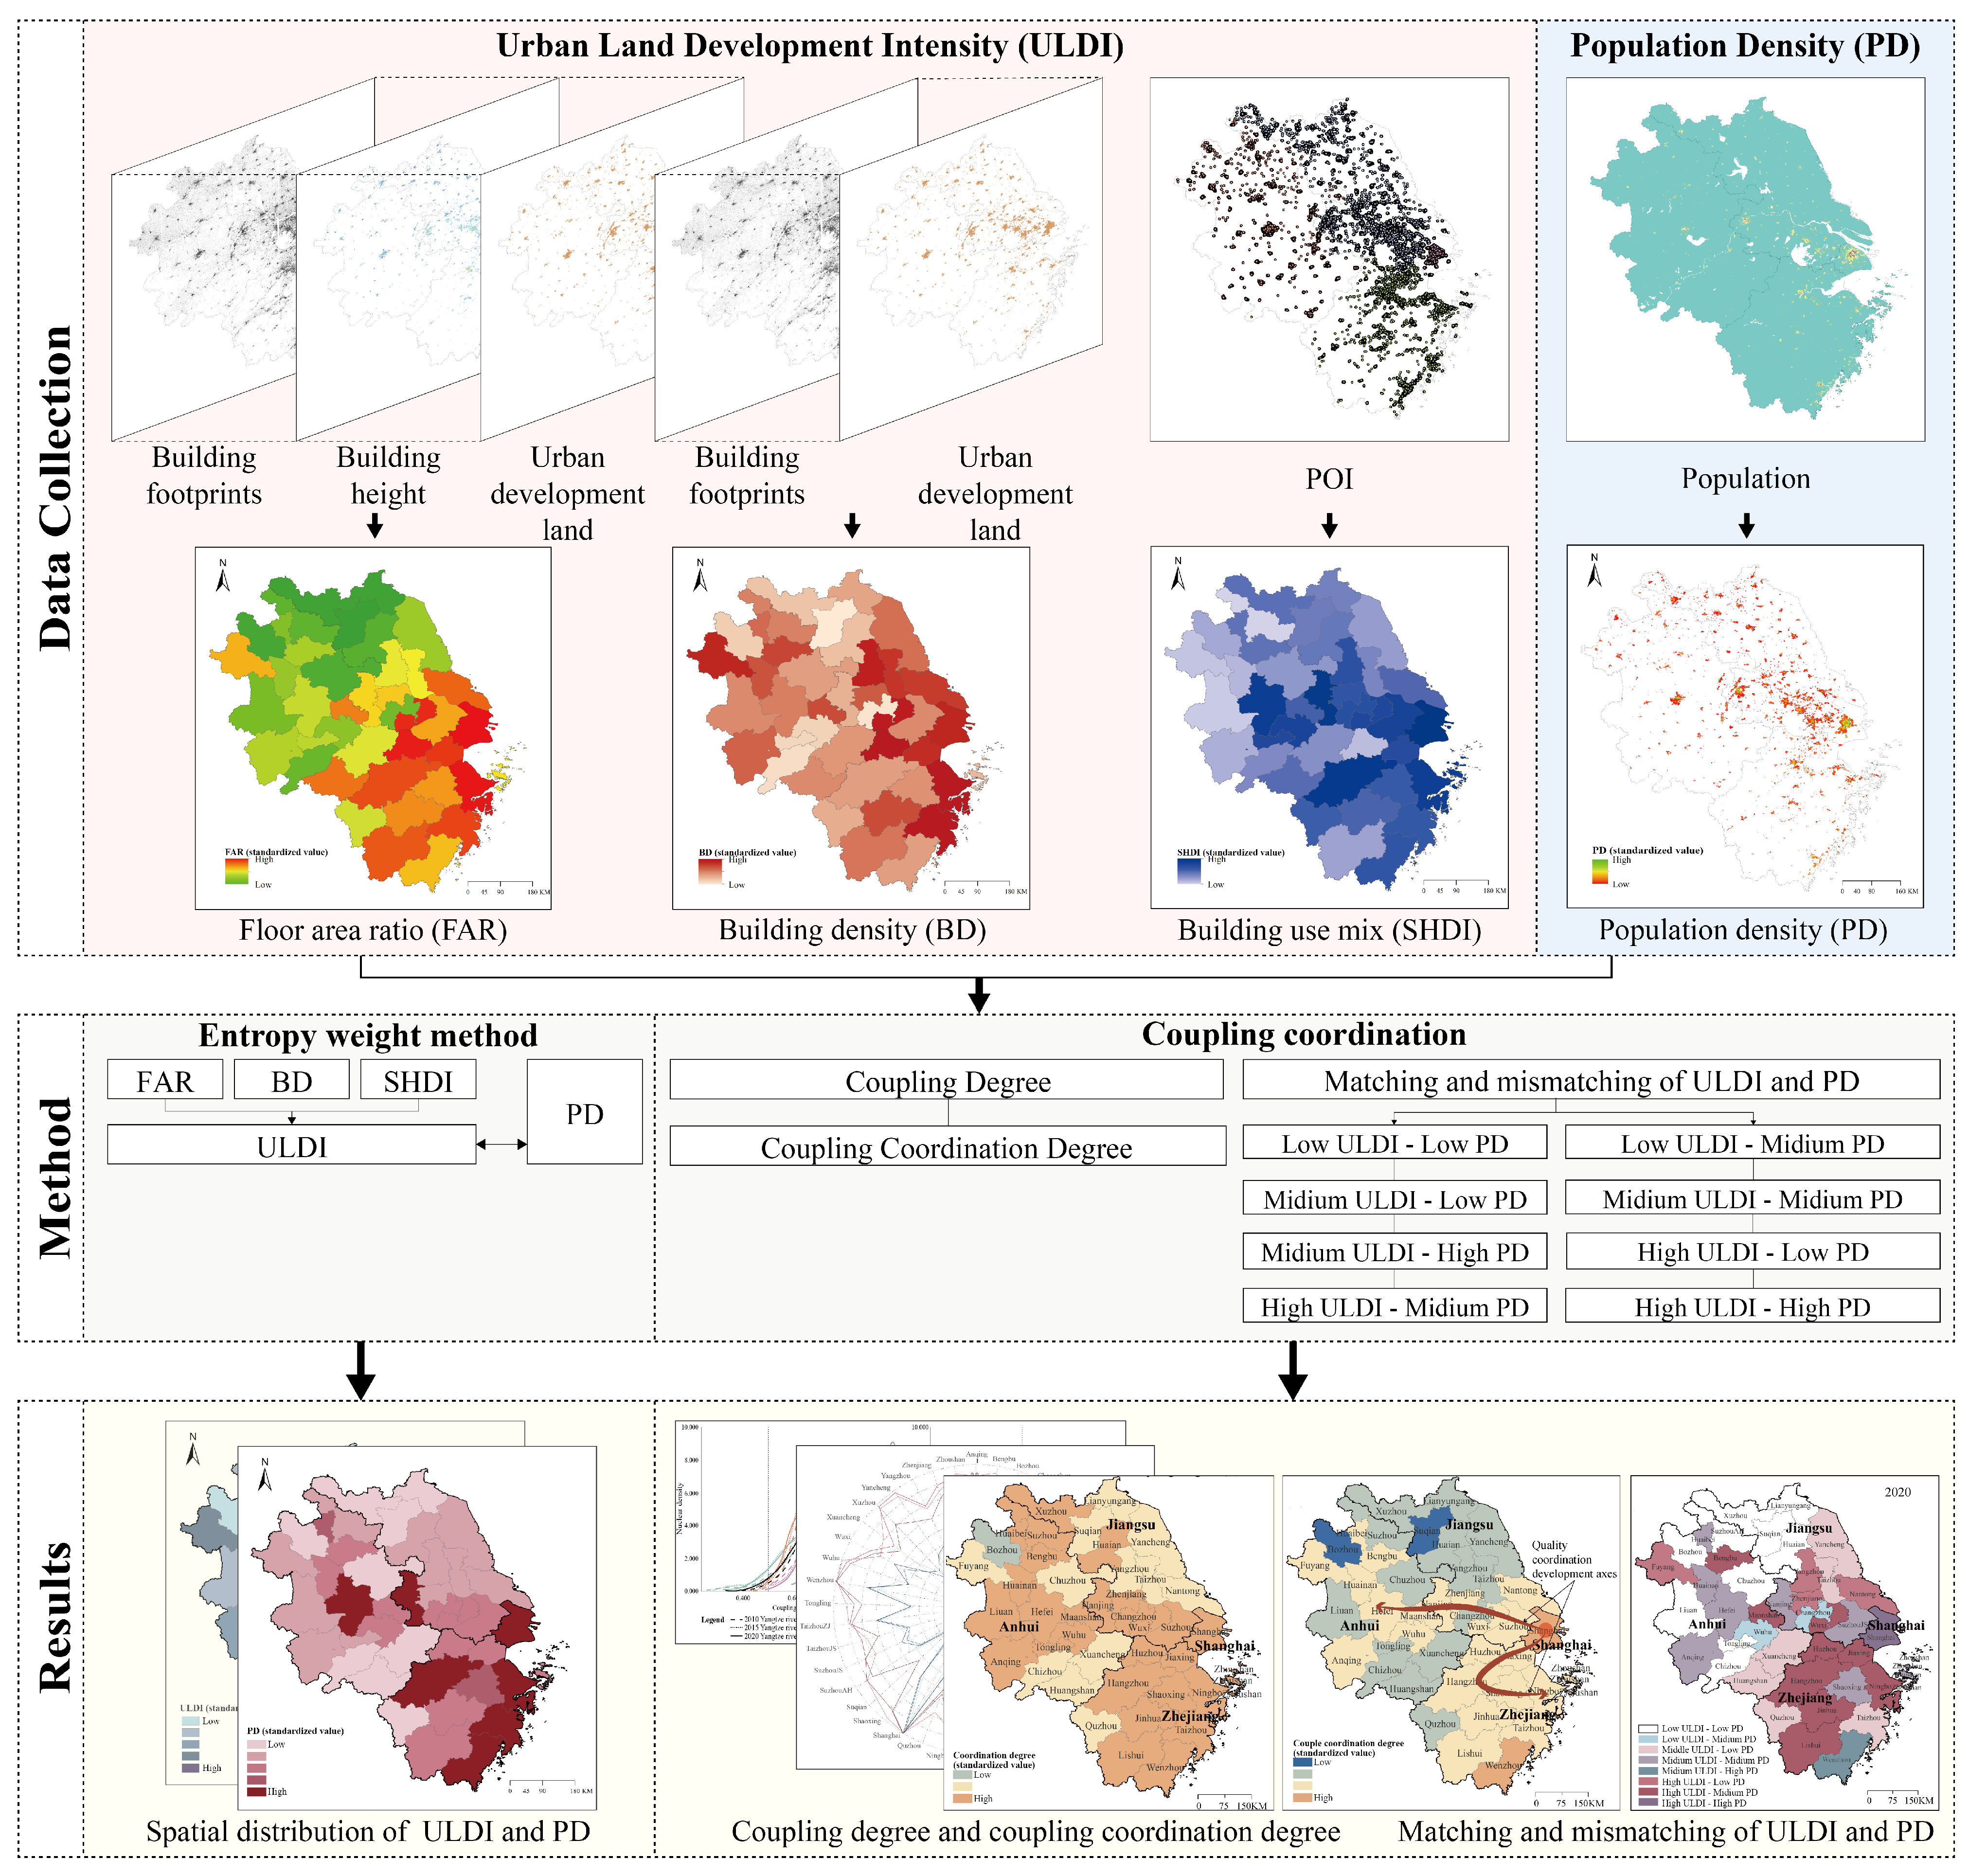
3.1. Research Framework

This study employed a quantitative research approach to analyze the relationship between urban land development intensity (ULDI) and population density (PD) (Figure 1). China’s urbanization rate increased from 17.92% in 1978 to 64.72% in 2020 [15,52]. It is generally acknowledged that an urbanization rate between 30% and 70% represents a phase of rapid urban development [53]. Since 2010, China’s population urbanization rate has approached the global average [54]. The National New-type Urbanization Plan, released in 2014, signaled a formal shift from land-driven development to people-centered urbanization, marking the beginning of a new stage focused on high-quality growth [55]. The period 2010–2015 corresponded to rapid urbanization, whereas 2015–2020 marked the transition toward high-quality development [32]. Therefore, this study selected these two time periods to investigate human–land conflicts during urban expansion.
First, open-access administrative data at the provincial and municipal levels for the Yangtze River Delta urban agglomeration were collected for 2010, 2015, and 2020. This included data related to land development intensity—such as building height, building footprints, urban development land, and points of interest (POI)—as well as population density data. Second, the study analyzed the relationship from both temporal (2010, 2015, 2020) and spatial (provincial and municipal scales) perspectives. Using the entropy weighting method, a comprehensive ULDI index was constructed to assess the coupling and coordination degree between ULDI and PD. Moreover, existing studies have predominantly focused on shrinking urban areas, revealing spatial mismatches where land development intensity exceeds population density. However, it remains uncertain whether similar issues also exist in developed regions. Finally, the study identified the spatiotemporal distribution patterns of ULDI and PD and detected the specific mismatches between the two.

3.2. Study Area

The Yangtze River Delta (YRD) urban agglomeration is located on the alluvial plain of the Yangtze River estuary, spanning from 29°20′ N to 32°24′ N latitude and from 115°46′ E to 123°25′ E longitude. Centered on the Taihu Plain, most of the region lies at an elevation between 200 and 300 m above sea level. According to the Outline of the Yangtze River Delta Regional Integrated Development Plan issued by the State Council in 2019, the YRD urban agglomeration is centered on Shanghai and includes 13 cities in Jiangsu Province, 11 cities in Zhejiang Province, and 16 cities in Anhui Province (Figure 2). The total study area covers approximately 358,000 square kilometers. As of the end of 2020, the built-up area in this region was 10,825.16 square kilometers, accounting for 18.52% of the national total built-up area. The region’s permanent population was 235 million, approximately 16.7% of the national total, and its gross regional product (GRP) was RMB 24.47 trillion (USD 33,746 billion), accounting for about 24.1% of the national GDP [15,16]. Despite accounting for only 3.7% of the country’s land area, this region contributes nearly one-quarter of the national GDP, making it one of China’s most dynamic and developed areas and a model for other urban agglomerations.

3.3. Statistical Analysis

3.3.1. Measurement of ULDI

This study constructed an urban land development intensity (ULDI) index using open-access data sources, including building footprints, building height, urban land development, and points of interest (POI). Based on these datasets, three key indicators were derived: floor area ratio (FAR), building density (BD), and Shannon’s diversity index (SHDI). These indicators were then integrated using the entropy weight method to construct the composite ULDI index. FAR is used in urban planning to regulate land development intensity, as it reflects the three-dimensional bulk of buildings. BD captures the extent of land use in the horizontal dimension [17,18,19]. SHDI measures the functional diversity of buildings, where higher diversity indicates more complete land development and a greater provision of urban services [20].
Urban development land was identified through impervious surface detection, which reflected the physical extent of cities [45]. Therefore, built-up areas were used instead of administrative urban boundaries to better reflect the relationship between urban physical space and human activity. Built-up area data were obtained from the remote sensing land use monitoring database (CNLUCC) of the Institute of Geographic Sciences and Natural Resources Research (igsnrr.ac.cn), Chinese Academy of Sciences [56]. CNLUCC classifies land into six major categories and 25 subcategories. This study adopted the subcategory of urban land, defined as built-up areas of large, medium, and small cities, as well as towns at or above the county level. Data from the China Urban-Rural Construction Statistical Yearbook was used for cross-validation and showed general consistency with the CNLUCC dataset.
Building information included spatial coordinates, footprint area, and building height. Wu, Ma [50] released the first nationwide 10 m-resolution building height raster dataset for China in 2020 (available at https://zenodo.org/record/7827315, accessed on 24 January 2024). For 2010 and 2015, building footprints and coordinates were extracted using object detection methods applied to Google satellite imagery. Due to the absence of large-scale building height data for 2010 and 2015, the 2020 height data were used to estimate persistent buildings. Given the study period coincided with rapid urbanization, small-scale urban renewal in older districts was considered negligible in this large-scale analysis.
This study focused on the urban agglomeration level. POI data, classified into 14 categories, were obtained from Amap’s open platform (https://lbs.amap.com, accessed on 24 January 2024). The earliest available POI data for the study area were collected in 2012, with subsequent updates every two years. Therefore, POI data from 2012 and 2016 were used as proxies for the years 2010 and 2015, respectively.
The definitions and calculation formulas for FAR, BD, and SHDI are presented in Table 1.
In Table 1, SHDI refers to the Shannon diversity index, a measurement based on information theory first proposed by Shannon [57]. In this study, points of interest (POI) were used to calculate the Shannon diversity index to represent building use mix [58]. When the proportions of different types of POIs are evenly distributed, SHDI reaches its maximum value, indicating high land-use diversity and stronger development intensity. Conversely, when only one POI type is present, the index value is zero, signifying low diversity and weak development intensity.
A critical step in constructing the urban land development intensity (ULDI) index lay in the determination of indicator weights. The entropy weight method is an objective weighting technique widely used in comprehensive evaluation [59,60]. In this study, entropy weighting was adopted to determine the weights of each indicator, which not only avoided the randomness inherent in subjective weighting methods but also effectively addressed the issue of information overlap among multiple variables.
The weights W i for FAR, BD, and SHDI were derived using the entropy method. The final ULDI indicator was then calculated by multiplying each standardized indicator value by its corresponding weight and summing the results, as expressed by the following formula:
U L D I i = F A R i × W i + B D i × W i + S H D I i × W i

3.3.2. Population Density

Population density (PD) data were obtained from the open-access datasets provided by the WorldPop platform (https://hub.worldpop.org, accessed on 24 January 2024). Raster data with a spatial resolution of 1 km were selected for the years 2010, 2015, and 2020, limited to the built-up areas of cities. These data were cross-validated against population figures from statistical yearbooks and local government reports, and the results demonstrated strong consistency.

3.3.3. Coupling Coordination of ULDI and PD

The coupling coordination degree model (CCDM) was applied to measure the relationship between ULDI and PD. Coupling coordination refers to the phenomenon in which two or more systems interact and influence each other through specific mechanisms. The model quantifies the extent to which these systems develop harmoniously. The calculation formulas were as follows [61]:
C i = 2 U L D I i × P D i 2 / U L D I i + P D i
T i = α U L D I i + β P D i
D i = C i × T i
To assess the relationship between ULDI and PD, this study employed the coupling coordination degree model (CCDM), which consists of three core indicators: coupling degree (C), coordination index (T), and coupling coordination degree (D). The value of C reflects the intensity of interaction between ULDI and PD—higher values indicate stronger mutual influence, while lower values imply a lack of association and system disorder. Based on prior studies and the context of this research, C was divided into three levels: low coupling (0 ≤ C < 0.5), where ULDI and PD were largely disconnected; moderate coupling (0.5 ≤ C < 0.75), where their interaction strengthens; and high coupling (0.75 ≤ C ≤ 1), indicating mutual reinforcement and an orderly development trend. Since C alone does not distinguish between positive and negative interactions, D was introduced to evaluate the coordination quality. In this study, ULDI and PD were treated as equally important, thus the weight coefficients α and β were both set to 0.5. The D value as classified into four stages: extreme imbalance (0 ≤ D < 0.25), imbalance (0.25 ≤ D < 0.5), primary coordination (0.5 ≤ D < 0.75), and quality coordination (0.75 ≤ D < 1), indicating progressively stronger alignment between urban development and population distribution [29,30].

4. Results

4.1. Evolutionary Trends of ULDI and PD

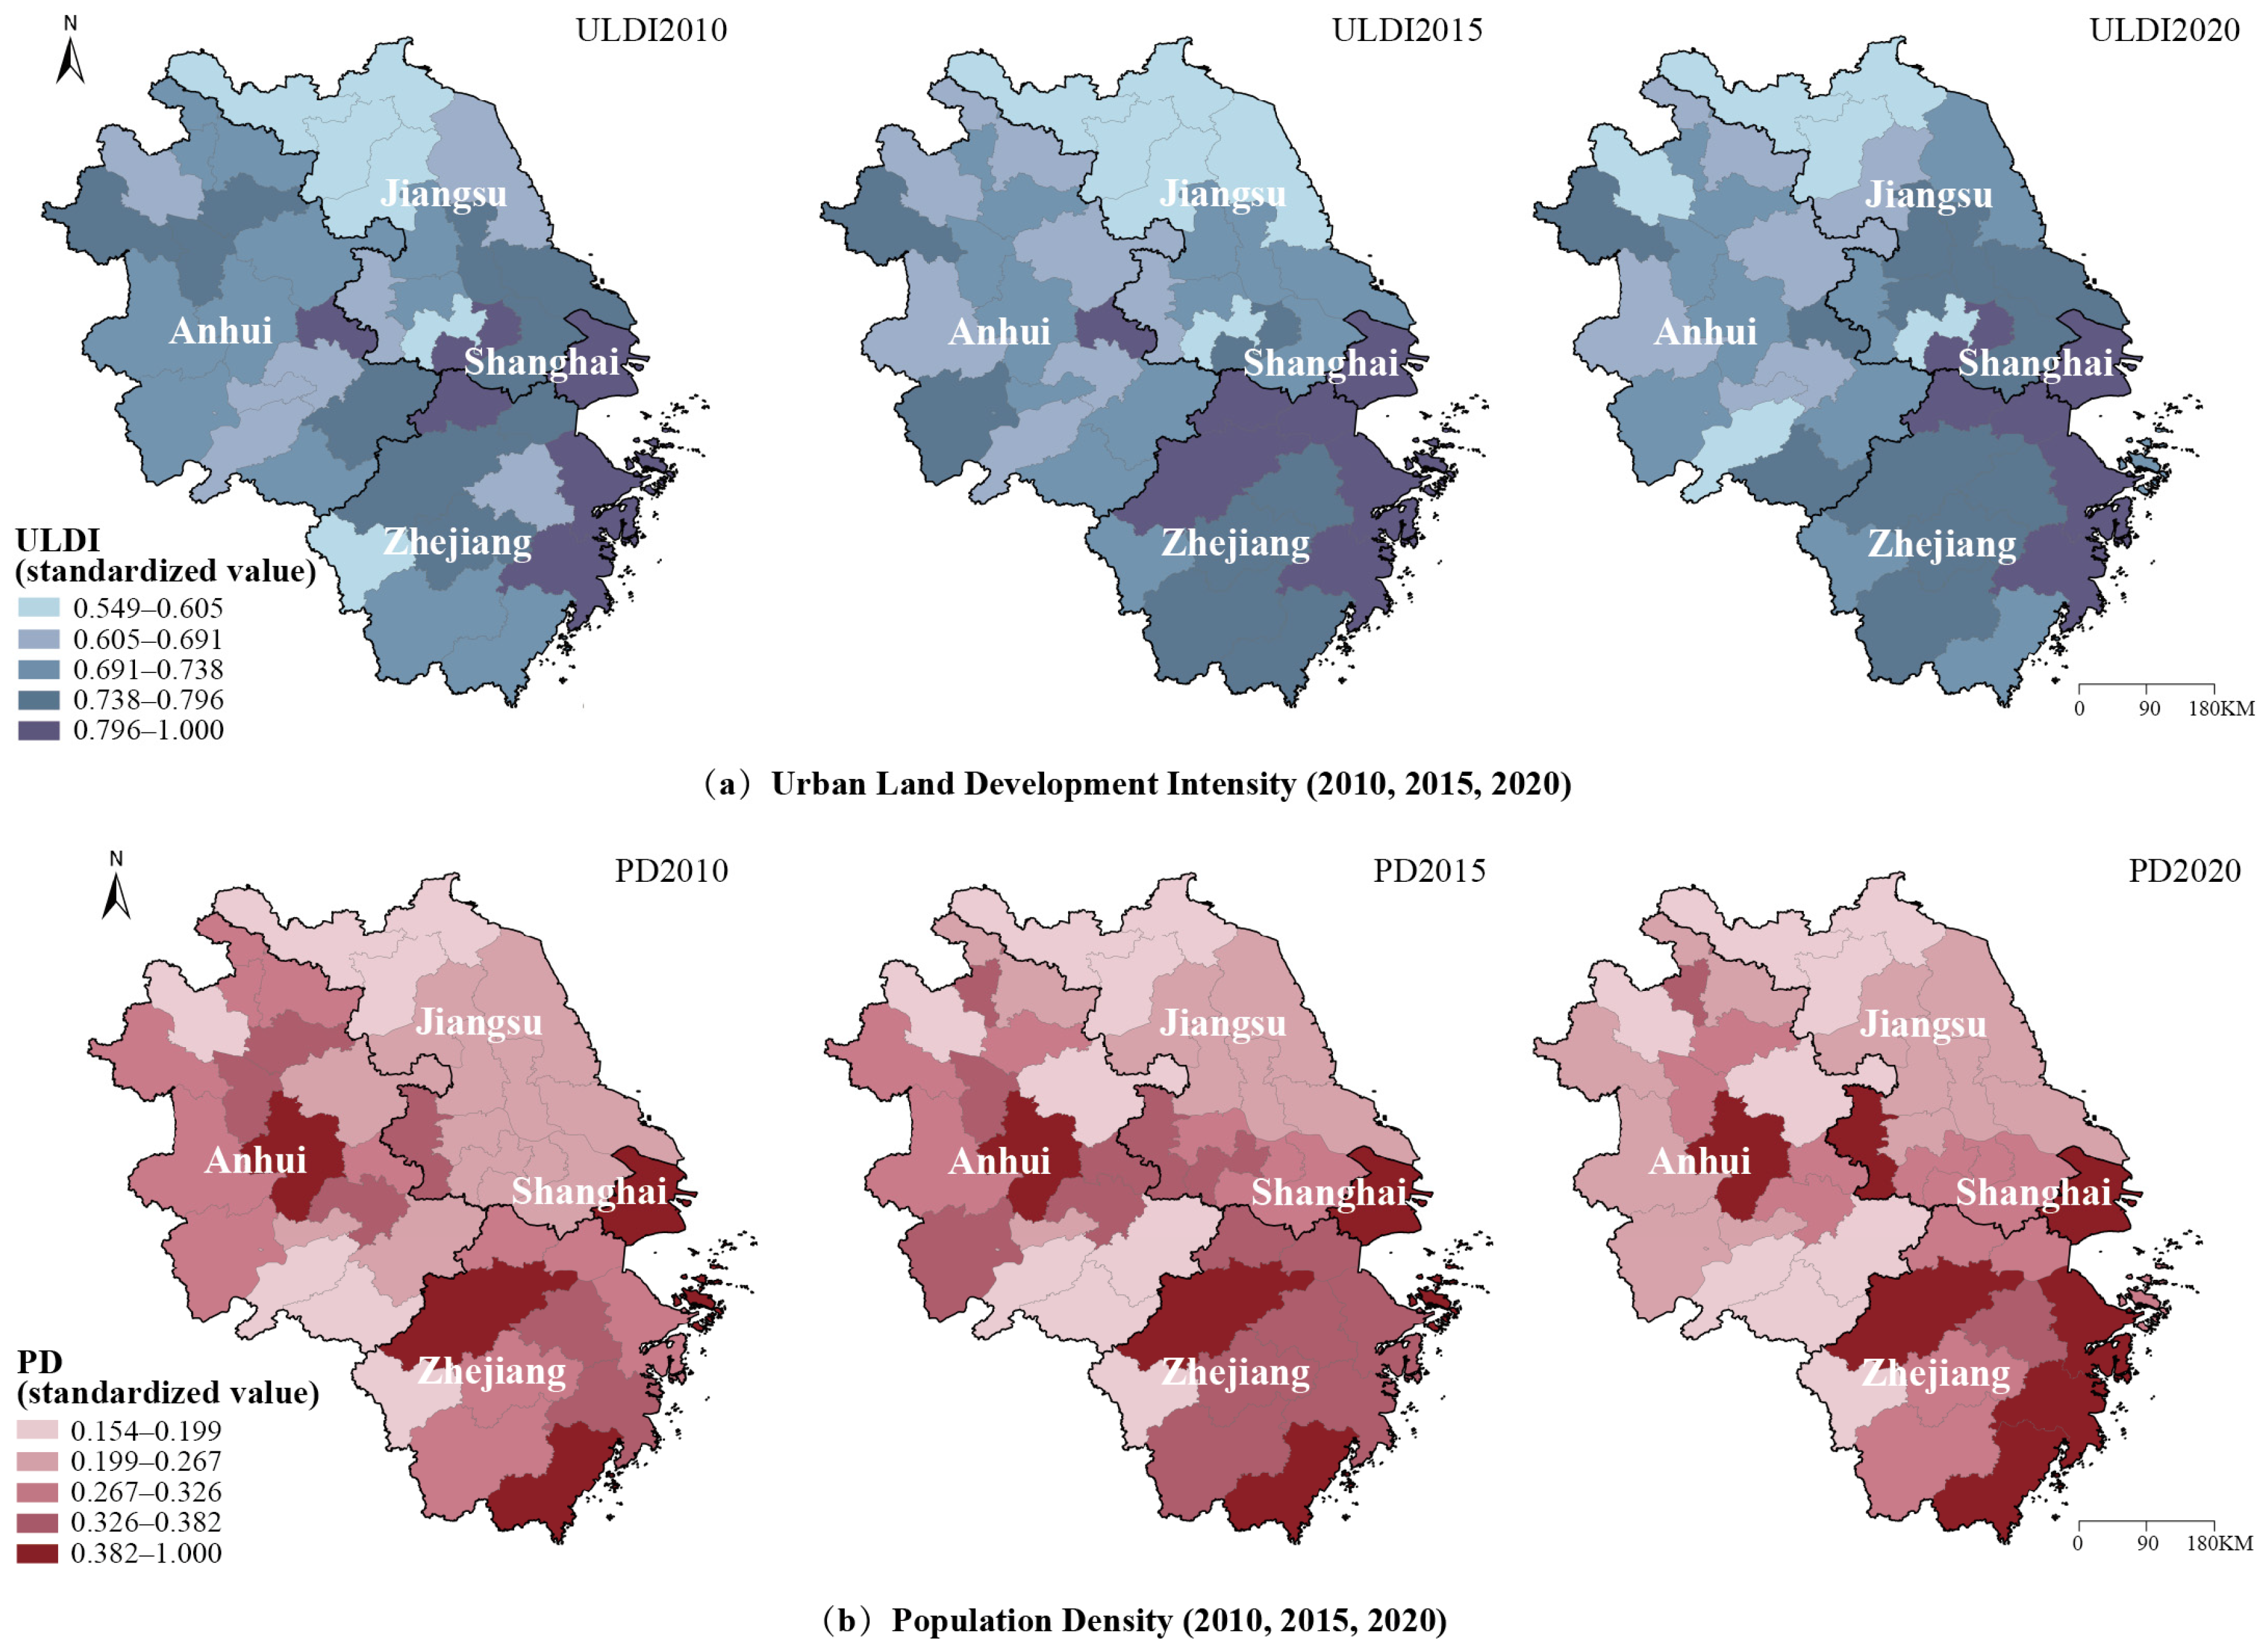
4.1.1. Spatial Distribution of ULDI and PD

After classifying the ULDI and PD of 41 cities in the Yangtze River Delta during 2010–2020 using the natural breaks method, their spatial distribution was mapped (Figure 3). The results show that both indicators exhibited spatial clustering, but the clustering patterns differed. Economically developed cities (e.g., Nantong, Jiaxing, Ningbo, Wuxi) displayed relatively high land development intensity, while provincial capitals (e.g., Hangzhou, Nanjing, Hefei) exhibited higher population density. Over time, ULDI became increasingly concentrated around the Shanghai metropolitan circle, whereas PD was more dispersed but gradually clustered around provincial capital cities. Overall, both land development intensity and population density were higher in Shanghai and Zhejiang compared to Jiangsu and Anhui.

4.1.2. Analysis of ULDI and PD Change Rates

From 2010 to 2020, the overall development of the Yangtze River Delta urban agglomeration exhibited a coordinated trend, with both ULDI and PD located in the first quadrant of the change rate coordinate system, indicating simultaneous increases in land development intensity and population density. However, the growth rate of PD consistently exceeded that of ULDI, reflecting a structural imbalance characterized by “more people, less land”. Nevertheless, the gap between the two growth rates gradually narrowed over time (Figure 4). Across the 41 cities, growth trajectories tended to be similar within the same province, exhibiting a pattern of intra-provincial clustering that became more pronounced over time, suggesting a reduction in regional disparities.
In terms of provincial trends, Shanghai showed a deceleration in both ULDI and PD after 2015, maintaining coordinated growth but at a reduced pace. During the two sub-periods (2010–2015 and 2015–2020), its ULDI and PD growth rates were 2.906%, 2.777%, 16.405%, and 11.389%, respectively, indicating the highest PD growth among all provinces. Zhejiang maintained relatively balanced growth throughout the study period, with most cities in the first quadrant from 2010 to 2015. From 2015 to 2020, ULDI slightly declined while PD continued to rise. Jiangsu also remained in the first quadrant overall, but most cities experienced a decline in ULDI from 2010 to 2015, shifting to rapid growth in both indicators after 2015. In contrast, Anhui was located in the third quadrant during 2010–2015, with simultaneous decreases in both ULDI and PD, but showed a clear upward trend in both from 2015 to 2020, reflecting a catch-up phase. It should be noted that Zhoushan, composed of offshore islands, has large areas that are undevelopable and unsuitable for habitation, and thus its data are not considered representative for intercity comparisons.

4.2. Coupling Coordination Relationship Between ULDI and PD

4.2.1. Analysis of ULDI and PD Coupling Degree and Coordination Degree

Figure 5 illustrates the coupling and coordination relationship between ULDI and PD for 41 cities in the Yangtze River Delta in 2010, 2015, and 2020. The results show that although the coupling degree between the two indicators was generally high—indicating strong interdependence—the coupling coordination degree remained relatively low, suggesting that the quality of the relationship was weak. Over time, the coupling coordination exhibited a “strengthening–weakening” wave-like dynamic trend, indicating both fluctuations in system alignment and potential for further optimization. With the exception of Bozhou, all other cities had a coupling degree greater than 0.5, placing them in the moderate coupling or high coupling stages. However, a substantial proportion of cities had coordination degrees below 0.5, indicating a lack of strong synergy between development and population distribution. Specifically, the share of cities in the imbalance or primary coordination stages was 29.268% in 2010, 48.780% in 2015, and 36.585% in 2020, reflecting persistent mismatches in a significant portion of the region.
Figure 6 presents kernel density plots illustrating the normal distribution characteristics of the coupling and coordination relationships among the 41 cities in the Yangtze River Delta for the years 2010, 2015, and 2020. In this figure, all districts of Shanghai were included in the analysis. Along the X-axis, the coupling degree and coordination degree of Shanghai’s districts were noticeably higher than those of other provinces, consistently falling within the high coupling and coordination stages. However, the number of districts with a coordination degree below 0.5 increased over time, indicating growing internal imbalance. In Zhejiang, more than 50% of the cities had both coupling and coordination degrees above 0.5, and the number of cities reaching strong coupling and coordination stages increased steadily. In Jiangsu, most cities showed relatively high coupling degrees. The number of cities in the moderate coupling stage first declined and then increased, while coordination degrees remained relatively low but showed gradual improvement over time. In Anhui, most cities maintained low coordination degrees, with both coupling and coordination degrees first declining and then increasing. From the Y-axis perspective, the coordination degrees of Shanghai’s districts were more widely dispersed, indicating low concentration. In contrast, the other three provinces exhibited higher distribution concentration, with Zhejiang showing the highest degree of clustering.

4.2.2. Spatial Analysis of ULDI and PD Coupling Degree and Coordination Degree

Based on the classification criteria established in Section 3.3.3, the coupling degree of ULDI and PD for the 41 cities in the Yangtze River Delta in 2010, 2015, and 2020 was categorized into three levels, while the coordination degree was classified into four stages. Figure 7a,b illustrate the spatial distribution of coupling degree and coupling coordination degree, with detailed classification results provided in Table 2.
(1)
The coupling degree of cities exhibited a clear spatial clustering effect. Most cities fell into the high coupling category, although the proportion gradually declined over time—from 92.683% in 2010 to 87.805% in 2015 and 68.29% in 2020. Meanwhile, the share of cities in the moderate coupling category increased from 7.317% in 2010 to 12.195% in 2015 and 29.268% in 2020, respectively. The number of cities in the low coupling category remained minimal, with Bozhou being the only one.
(2)
The coupling coordination degree also demonstrated a notable spatial clustering pattern. Cities in the primary coordination stage outnumbered those in the imbalance stage and are located within the Shanghai metropolitan circle and along the development axis of provincial capital cities (e.g., Hefei, Nanjing, Shanghai, Jiaxing, Hangzhou). However, the share of cities in this stage declined over time—from 70.73% in 2010 to 51.22% in 2015, and 58.54% in 2020—indicating a need for further improvement. Cities in the imbalance stage are mainly concentrated in northern Jiangsu and cities across Anhui, with 11, 19, and 15 cities identified in this category in 2010, 2015, and 2020, respectively.

4.2.3. Matching and Mismatching of ULDI and PD

The ULDI and PD of 41 cities in the Yangtze River Delta for the years 2010, 2015, and 2020 were classified into eight matching degree categories using the natural breaks method and then mapped accordingly. Figure 7c illustrates three conditions: where development intensity matched population density, where development intensity exceeded population density, and where development intensity fell below population density.
(1)
The overall situation shows that approximately half of the cities had a balanced relationship between ULDI and PD, while around 40% of the cities exhibited higher ULDI than PD. Fewer than 10% of cities had PD greater than ULDI. From 2010 to 2020, the proportion of cities with matched ULDI and PD first increased and then declined (46.341% in 2010, 56.098% in 2015, and 46.341% in 2020). Meanwhile, the share of cities with higher ULDI than PD decreased over time (48.78%, 34.146%, and 46.341%), while the proportion of cities with higher PD than ULDI increased (4.879%, 9.756%, and 7.318%).
(2)
Cities with matched ULDI and PD can be divided into three categories. High ULDI–High PD cities included Shanghai and Hangzhou, both economically developed and serving as provincial administrative centers. Shanghai remained in this category throughout the period, while Hangzhou shifted to high ULDI–medium PD in 2020. Medium ULDI–medium PD cities were mainly located in Anhui (e.g., Hefei, Huai’an, Anqing) and southern Jiangsu (e.g., Suzhou, Nanjing), reflecting medium-to-high economic development levels. Nanjing changed from medium ULDI–medium PD to low ULDI–medium PD and later returned, while Hefei shifted from medium ULDI–high PD to medium ULDI–medium PD. Low ULDI–low PD cities were concentrated in northern Jiangsu (e.g., Xuzhou, Suqian, Lianyungang, Huai’an) and northern Anhui (e.g., Chuzhou, Suzhou, Bozhou, Tongling), forming a spatial cluster characterized by slow economic growth and population outflow. Yancheng shifted from matched status to medium ULDI–low PD. Chuzhou, Bozhou, and Chizhou moved from medium ULDI–low PD to low ULDI–low PD. Lu’an shifted from medium ULDI–medium PD to low ULDI–low PD.
(3)
Cities where ULDI exceeded PD fell into three categories and were mainly distributed in Zhejiang, southern Jiangsu, and neighboring parts of Anhui. These cities displayed spatial clustering beyond administrative boundaries and were generally economically advanced. High ULDI–low PD cities, with the greatest mismatch, were mostly located in Jiangsu, with numbers decreasing over time (six in 2010, none in 2015, and four in 2020). In 2010, these included Nantong, Taizhou, Wuxi, Suzhou, Xuancheng, and Taizhou (Zhejiang); in 2020, the group included Nantong, Zhenjiang, Yangzhou, and Fuyang. High ULDI–medium PD cities were in Zhejiang (e.g., Huzhou, Jinhua, Ningbo, Jiaxing, Lishui) and Anhui (e.g., Ma’anshan, Bengbu). Medium ULDI–low PD cities were mostly in southern Anhui (e.g., Xuancheng, Huangshan) and parts of Jiangsu (e.g., Yancheng, Taizhou).
(4)
Cities where PD exceeded ULDI fell into two categories, with only one or two cities per province. Low ULDI–medium PD cities included Changzhou and Wuhu. Medium ULDI–high PD cities included Wenzhou and Hefei, though Hefei shifted to the matched category by 2020.

5. Discussion

5.1. ULDI Indicator Construction and Its Relationship with PD

This study constructed an ULDI indicator by integrating three-dimensional building metrics—FAR, BD, and building use mix. It explored the correlation between ULDI and PD at a broad spatial scale and reveals spatial governance contradictions often overlooked under the traditional two-dimensional view of land expansion. Previous studies have mostly focused on land area, ecological conditions, and economic aspects when evaluating land use efficiency [8,21,62], overlooking the spatial implications of building configurations, which can lead to various systemic issues. Low building density in newly developed areas weakens spatial affinity; lack of functional diversity leads to insufficient public services such as schools and hospitals, forming dormitory towns; and ignoring FAR results in structural conflicts, for instance, a high proportion of single-story factories causing low industrial land efficiency, or loose planning for educational land clashing with high-intensity residential development. This framework holds broad application potential for both academic research and urban planning practices.
Moreover, the results show that both ULDI and PD exhibited spatial clustering. Economically advanced cities tended to have higher ULDI, while provincial administrative centers showed higher PD (Figure 3). This distinction mainly stems from the population attraction effect of services such as education and healthcare offered by political centers. At the same time, local governments’ reliance on land finance has driven land development. GDP remains the core metric for assessing economic performance, and governments often boost it by selling residential land or attracting factory investment to increase fixed-asset input [63]. Previous studies have also highlighted economic growth as the dominant driver of land expansion in the Yangtze River Delta [64,65].
Finally, from 2010 to 2020, PD in the Yangtze River Delta grew faster than ULDI, although the difference in their growth rates became smaller during the two periods, 2010 to 2015 and 2015 to 2020. This narrowing gap indicates a trend toward dynamic equilibrium between land development and population growth, reflecting the region’s transition from rapid expansion to quality-oriented development [42,43,55]. Research shows that during the mature stage of urbanization, population growth often surpasses land expansion [44]. This study supports previous findings, showing that PD continues to outpace ULDI in three-dimensional terms. The region’s strong economic performance attracts significant population inflows, while its small share of national land area (only 3.7%) limits the potential for further expansion. The leading provinces experienced divergent trajectories: Shanghai showed retreat in both population and ULDI, indicating compact development; Zhejiang experienced balanced increases in ULDI and PD; Jiangsu witnessed rapid ULDI growth; and Anhui showed upward trends in both indicators, reflecting its catching-up process.

5.2. Further Analysis and Comparative Research

Another key finding of this study is the detailed identification of the matching conditions between ULDI and PD. Results indicate a significant interaction between the two, consistent with previous research [66], yet the degree of alignment between these systems remains insufficient. Prior studies have mainly reported general coupling coordination scores without revealing city-specific mismatches [29,30]. Moreover, the number of highly coordinated cities first declined (2010–2015) and then increased (2015–2020), indicating improved coordination as the region shifted from rapid growth to quality-oriented development.
This study categorized spatial structural mismatches into two types (Figure 7): (1) high PD with lagging ULDI, and (2) high ULDI with low PD. The first type reflects a shortage of urban spatial supply due to strict land development control, making it difficult to accommodate growing human activity; as a result, activity becomes highly concentrated in compact urban areas. The second type indicates overdevelopment and potential land-use waste. In the Yangtze River Delta, the second type is more prevalent and has been increasing over the past decade. This aligns with earlier findings that rapid land expansion in mainland China has outpaced urban population growth [20]. The mismatch can be partly attributed to the household registration system, which has historically restricted rural-to-urban migration [67]; the children of migrants often remain in their rural hometowns, further limiting intergenerational mobility. On the other hand, GDP growth and fiscal revenue have been the primary metrics for evaluating local government performance. Their reliance on land finance and rapid industrialization to accumulate capital has intensified the issue. Governments sold high-priced residential and commercial land to raise revenue and allocated low-cost industrial land to attract factory investment, which was counted as fixed-asset input in GDP statistics [68]. During the high-growth period from 2010 to 2015, intensive land development reduced the number of highly coordinated cities. In the quality-oriented transition from 2015 to 2020, performance evaluations shifted toward broader indicators such as environmental efficiency and government debt [69], prompting local governments to adopt a more cautious approach to land expansion and industrial investment. This led to reduced intensity of new land development.
Previous studies have associated large volumes of vacant housing and commercial buildings—so-called ghost cities—mainly with shrinking regions [27]. However, this study finds that mismatches remain widespread in the economically developed Yangtze River Delta. In addition to idle commercial and residential spaces, excessive industrial land density may also contribute to the issue. In flatland cities such as Ningbo, Jiaxing, and Wuxi, large areas of single-story, high-density industrial facilities have raised land development intensity. Recent efforts to promote “vertical industrialization” aim to conserve land through multi-story factories. However, capital investments such as reconfiguring production lines do not always yield proportional economic returns. The coexistence of high land development intensity and low population density in these areas represents a structural imbalance between the built environment and population distribution, rather than an indication of land use inefficiency.

5.3. Policy Implications

This study provides important insights for the formulation of sustainable urban development policies.
(1) The findings reveal a widespread structural mismatch between urban development and population density, which policymakers have often failed to monitor or assess dynamically. For instance, in 2015, Yancheng and Fuyang shifted from a balanced ULDI–PD relationship to a state where ULDI exceeded PD, while Wuhu moved toward a PD exceeding ULDI condition. These changes highlight the need for timely policy adjustments in response to such transitions. (2) Planners can intervene through policies related to land management, household registration reform, and industrial distribution to optimize urban development models. Examples include setting deadlines for the development of idle land and relaxing the rigid rural–urban household registration system. From a longer-term perspective, local governments in China are gradually reducing their reliance on land finance and diversifying revenue sources. For example, the Anhui provincial government has launched a USD 6.9 billion government-led industrial fund to invest in strategic emerging industries (e.g., semiconductors, new energy vehicles), explicitly prohibiting investment in infrastructure and real estate [68]. For cities where PD exceeds ULDI, increasing land supply and improving public facilities can help enhance residents’ quality of life. In cities with both low ULDI and PD, such as Xuzhou and Suqian in Jiangsu, and Chuzhou and Bozhou in Anhui, economic development should be strengthened—where natural conditions permit—to drive broader urban progress. (3) With the increasing accessibility of building-related data, this study demonstrates the feasibility of applying multi-source data to globally assess the evolving relationship between ULDI and PD. This offers a replicable method for monitoring development–population mismatches across different regions and planning contexts.

5.4. Limitations

Our study has several limitations. First, due to the lack of historical data, building heights for 2010 and 2015 were partially estimated based on 2020 data. Buildings were categorized as either existing or newly constructed. For existing buildings, 2020 height data were used directly. New buildings included those in new development areas and a small portion of redeveloped sites. Given the dominance of new development during rapid urbanization, the proportion of redeveloped buildings was likely negligible at the regional scale, thus exerting limited influence on the results. The 2010 POI data were replaced with the earliest available dataset from 2012. As core public facilities are relatively stable over time, this substitution is considered acceptable. Future studies may address these limitations by integrating multi-temporal remote sensing data to reconstruct historical building characteristics. Second, this study used a coupling model to objectively evaluate the relationship between ULDI and PD; future studies could also apply direct correlation analysis to enrich the results. Third, due to time and resource constraints, our analysis was limited to the highly developed Yangtze River Delta. Future research could expand the geographic scope to the national scale, yielding more diversified conclusions. Finally, this study lacks causal inference. Due to space constraints, we focused on presenting the spatial mismatches without analyzing their underlying causes. Future research could use Bayesian networks or more complex regression models to explain the formation mechanisms of such mismatches.

6. Conclusions

This study focused on the Yangtze River Delta urban agglomeration, covering three provinces and one municipality. Based on multi-source open data from 2010, 2015, and 2020, a composite ULDI index was constructed from a building-space perspective using the entropy weighting method. A coupling coordination model was applied to explore the correlation and spatial matching between ULDI and PD. The main findings are as follows: (1) Temporally, the imbalance of “more people, less land” in the region gradually eased. Spatially, areas with stronger economies tended to have higher ULDI, while administrative centers tended to have higher PD. (2) A diffusion effect was observed in more developed areas. Shanghai experienced declines in both PD and ULDI; Zhejiang maintained balanced development; Jiangsu exhibited accelerated growth; and Anhui showed a catching-up trend. (3) The coupling degree between ULDI and PD was generally high, indicating strong correlation, however, the coordination degree remained low, suggesting poor correlation quality. The coupling process followed a fluctuating pattern of “strengthening–weakening” over time. Among all cities, Shanghai demonstrated the best coordination between ULDI and PD, while more than half the cities in Jiangsu, Zhejiang, and Anhui still require improvement. (4) Despite the Yangtze River Delta being a leading urbanized region, mismatches between ULDI and PD remain widespread, with most mismatched cities showing ULDI exceeding PD.
Unlike previous macro-scale studies that primarily adopted a two-dimensional planar perspective, this study innovatively constructed a land development intensity index from a three-dimensional building-space perspective. The two-dimensional perspective fails to capture vertical expansion, whereas the three-dimensional building-space approach enables the quantification of vertical space utilization, offering a more accurate assessment of urban spatial efficiency during the transition to high-quality development. Although prior studies typically associated mismatches between land development and population density with shrinking regions, this study revealed their presence in economically advanced transitional regions as well. These mismatches are the result of interactions between land finance practices, the hukou system, and rapid industrialization. Whether this was caused by vacant commercial and residential buildings or dense single-story industrial facilities remains a case-specific issue requiring further investigation. From a broader perspective, this study responded to UN SDG 11’s call to “make cities inclusive, safe, resilient, and sustainable.” By incorporating building-level spatial characteristics into the evaluation of land use efficiency, it provides an objective measurement indicator that complements the SDG 11.3.1 ratio of land consumption rate to population growth rate. Two-dimensional land use data reflect only surface occupation and cannot capture the intensity of vertical development. Building-space characteristics provide a more accurate representation of urban land use efficiency. Based on this replicable data framework, the study provides robust support for formulating differentiated spatial governance policies, holding practical significance for advancing high-quality, sustainable urban development.

Author Contributions

Conceptualization, X.W.; methodology, X.W.; software, X.W.; validation, L.W. and L.Y.; formal analysis, X.W.; investigation, X.W.; resources, L.W.; data curation, X.W.; writing—original draft preparation, X.W.; writing—review and editing, L.Y. and L.W.; visualization, X.W.; supervision, L.W.; project administration, L.W.; funding acquisition, L.W. All authors have read and agreed to the published version of the manuscript.

Funding

This research received no external funding.

Data Availability Statement

The data presented in this study are available within the article.

Acknowledgments

The authors acknowledge any support given which is not covered by the author’s contribution or funding sections.

Conflicts of Interest

The authors declare no conflicts of interest.

Abbreviations

The following abbreviations are used in this manuscript:
ULDIUrban land development intensity
PDPopulation density

References

  1. Desa, U. World Population Prospects 2022; United Nations Department of Economic and Social Affairs Population Divisio: New York, NY, USA, 2022.
  2. Zhao, T.; Zhang, X.; Liu, W.; Wang, J.; Li, Z.; Liu, L. Increase in global per capita cropland imbalance across countries from 1985 to 2022: A threat to achieving Sustainable Development Goals. Geogr. Sustain. 2025, 6, 100239. [Google Scholar] [CrossRef]
  3. van Vliet, J.; Yang, H.; Bakker, V.; Li, M. Global inequality in built-up land per capita and its change trajectories between 1985 and 2020. Geogr. Sustain. 2024, 5, 541–547. [Google Scholar] [CrossRef]
  4. United Nations. Sustainable Development Goals; United Nations: New York, NY, USA, 2015.
  5. Nations, F.A.O.U. World Food and Agriculture—Statistical Yearbook 2022; FAO: Rome, Italy, 2022.
  6. Chinese Academy of Sciences. 2002 China Sustainable Development Strategy Report; Science Press: Beijing, China, 2002. [Google Scholar]
  7. Chakraborty, S.; Maity, I.; Dadashpoor, H.; Novotnẏ, J.; Banerji, S. Building in or out? Examining urban expansion patterns and land use efficiency across the global sample of 466 cities with million+ inhabitants. Habitat Int. 2022, 120, 102503. [Google Scholar] [CrossRef]
  8. Koroso, N.H.; Lengoiboni, M.; Zevenbergen, J.A. Urbanization and urban land use efficiency: Evidence from regional and Addis Ababa satellite cities, Ethiopia. Habitat Int. 2021, 117, 102437. [Google Scholar] [CrossRef]
  9. Xu, G.; Jiao, L.; Yuan, M.; Dong, T.; Zhang, B.; Du, C. How does urban population density decline over time? An exponential model for Chinese cities with international comparisons. Landsc. Urban Plan. 2019, 183, 59–67. [Google Scholar] [CrossRef]
  10. Sumari, N.S.; Cobbinah, P.B.; Ujoh, F.; Xu, G. On the absurdity of rapid urbanization: Spatio-temporal analysis of land-use changes in Morogoro, Tanzania. Cities 2020, 107, 102876. [Google Scholar] [CrossRef]
  11. National Bureau of Statistics of China. China Statistical Yearbook 2022; China Statistics Press: Beijing, China, 2023.
  12. He, C.; Huang, Z.; Wang, R. Land use change and economic growth in urban China: A structural equation analysis. Urban Stud. 2014, 51, 2880–2898. [Google Scholar] [CrossRef]
  13. Li, H.; Wei, Y.D.; Liao, F.H.; Huang, Z. Administrative hierarchy and urban land expansion in transitional China. Appl. Geogr. 2015, 56, 177–186. [Google Scholar] [CrossRef]
  14. Liu, Y.; Zhang, X.; Kong, X.; Wang, R.; Chen, L. Identifying the relationship between urban land expansion and human activities in the Yangtze River Economic Belt, China. Appl. Geogr. 2018, 94, 163–177. [Google Scholar] [CrossRef]
  15. National Bureau of Statistics of China. China Statistical Yearbook 2020; China Statistics Press: Beijing, China, 2021.
  16. Ministry of Housing and Urban-Rural Development of China. China Urban-Rural Construction Statistical Yearbook 2020; China Statistics Press: Beijing, China, 2021.
  17. Gehl, J. Life Between Buildings: Using Public Space Copenhagen; Island Press: Washington, WA, USA, 1971. [Google Scholar]
  18. Jacobs, J. The Death and Life of Great American Cities; Random House: New York, NY, USA, 1961. [Google Scholar]
  19. Erb, K.-H. How a socio-ecological metabolism approach can help to advance our understanding of changes in land-use intensity. Ecol. Econ. 2012, 76, 8–14. [Google Scholar] [CrossRef]
  20. Xia, C.; Yeh, A.G.-O.; Zhang, A. Analyzing spatial relationships between urban land use intensity and urban vitality at street block level: A case study of five Chinese megacities. Landsc. Urban Plan. 2020, 193, 103669. [Google Scholar] [CrossRef]
  21. Paul, C.; Weber, M.; Knoke, T. Agroforestry versus farm mosaic systems–Comparing land-use efficiency, economic returns and risks under climate change effects. Sci. Total Environ. 2017, 587–588, 22–35. [Google Scholar] [CrossRef] [PubMed]
  22. Briassoulis, H. Analysis of Land Use Change: Theoretical and Modeling Approaches; Regional Research Institute, West Virginia University: Morgantown, WV, USA, 2000. [Google Scholar]
  23. Zhou, Y.; Li, X.; Chen, W.; Meng, L.; Wu, Q.; Gong, P.; Seto, K.C. Satellite mapping of urban built-up heights reveals extreme infrastructure gaps and inequalities in the Global South. Proc. Natl. Acad. Sci. USA 2022, 119, e2214813119. [Google Scholar] [CrossRef] [PubMed]
  24. Ahmad, M.; Rehman, A.; Shah, S.A.A.; Solangi, Y.A.; Chandio, A.A.; Jabeen, G. Stylized heterogeneous dynamic links among healthcare expenditures, land urbanization, and CO2 emissions across economic development levels. Sci. Total Environ. 2021, 753, 142228. [Google Scholar] [CrossRef]
  25. Herzig, A.; Nguyen, T.T.; Ausseil, A.-G.E.; Maharjan, G.R.; Dymond, J.R.; Arnhold, S.; Koellner, T.; Rutledge, D.; Tenhunen, J. Assessing resource-use efficiency of land use. Environ. Model. Softw. 2018, 107, 34–49. [Google Scholar] [CrossRef]
  26. Liu, J.; Jin, X.; Xu, W.; Gu, Z.; Yang, X.; Ren, J.; Fan, Y.; Zhou, Y. A new framework of land use efficiency for the coordination among food, economy and ecology in regional development. Sci. Total. Environ. 2020, 710, 135670. [Google Scholar] [CrossRef]
  27. Wang, Y.; Liu, Y.; Zhou, G.; Ma, Z.; Sun, H.; Fu, H. Coordinated Relationship between Compactness and Land-Use Efficiency in Shrinking Cities: A Case Study of Northeast China. Land 2022, 11, 366. [Google Scholar] [CrossRef]
  28. Li, S.; Fu, M.; Tian, Y.; Xiong, Y.; Wei, C. Relationship between Urban Land Use Efficiency and Economic Development Level in the Beijing–Tianjin–Hebei Region. Land 2022, 11, 976. [Google Scholar] [CrossRef]
  29. Xu, D.; Hou, G. The Spatiotemporal Coupling Characteristics of Regional Urbanization and Its Influencing Factors: Taking the Yangtze River Delta as an Example. Sustainability 2019, 11, 822. [Google Scholar] [CrossRef]
  30. Song, C.; Sun, C.; Xu, J.; Fan, F. Establishing coordinated development index of urbanization based on multi-source data: A case study of Guangdong-Hong Kong-Macao Greater Bay Area, China. Ecol. Indic. 2022, 140, 109030. [Google Scholar] [CrossRef]
  31. Gao, Y.; Li, H.; Song, Y. Interaction Relationship between Urbanization and Land Use Multifunctionality: Evidence from Han River Basin, China. Land 2021, 10, 938. [Google Scholar] [CrossRef]
  32. You, L.; Liu, X.; Wang, J. Spatial and temporal correlation patterns of population and construction land in the 41 cities of the Yangtze River Delta from the perspective of transformative development and their implications. Geogr. Res. 2024, 43, 2158–2175. [Google Scholar]
  33. Corban, C.; Politis, P.; Siragusa, A.; Kemper, T.; Pesaresi, M. LUE User Guide: A Tool to Calculate the Land Use Efficiency and the SDG 11.3 Indicator with the Global Human Settlement Layer; Publications Office of the European Union: Luxembourg, 2017. [Google Scholar]
  34. Zitti, M.; Ferrara, C.; Perini, L.; Carlucci, M.; Salvati, L. Long-Term Urban Growth and Land Use Efficiency in Southern Europe: Implications for Sustainable Land Management. Sustainability 2015, 7, 3359–3385. [Google Scholar] [CrossRef]
  35. Zhang, L.; Zhang, L.; Xu, Y.; Zhou, P.; Yeh, C.-H. Evaluating urban land use efficiency with interacting criteria: An empirical study of cities in Jiangsu China. Land Use Policy 2020, 90, 104292. [Google Scholar] [CrossRef]
  36. Gómez-Varo, I.; Delclòs-Alió, X.; Miralles-Guasch, C. Jane Jacobs reloaded: A contemporary operationalization of urban vitality in a district in Barcelona. Cities 2022, 123, 103565. [Google Scholar] [CrossRef]
  37. Lan, F.; Gong, X.; Da, H.; Wen, H. How do population inflow and social infrastructure affect urban vitality? Evidence from 35 large- and medium-sized cities in China. Cities 2020, 100, 102454. [Google Scholar] [CrossRef]
  38. Paköz, M.Z.; Işık, M. Rethinking urban density, vitality and healthy environment in the post-pandemic city: The case of Istanbul. Cities 2022, 124, 103598. [Google Scholar] [CrossRef]
  39. Lu, S.; Shi, C.; Yang, X. Impacts of Built Environment on Urban Vitality: Regression Analyses of Beijing and Chengdu, China. Int. J. Environ. Res. Public Health 2019, 16, 4592. [Google Scholar] [CrossRef]
  40. Thomson, J.A. On Growth and Form. Nature 1917, 100, 21–22. [Google Scholar] [CrossRef]
  41. Huxley, J.S.; Churchill, F.B.; Strauss, R.E. Problems of Relative Growth; Johns Hopkins University Press: Baltimore, MA, USA, 1993. [Google Scholar]
  42. Batty, M. The Size, Scale, and Shape of Cities. Science 2008, 319, 769–771. [Google Scholar] [CrossRef]
  43. Bettencourt, L.M.A. The Origins of Scaling in Cities. Science 2013, 340, 1438–1441. [Google Scholar] [CrossRef] [PubMed]
  44. Qiao, W.; Yin, S.; Huang, X. Assessing the Imbalances in Growth between Urban Land and Urban Population and the Influencing Factors: An Allometric Growth Perspective. Land 2024, 13, 1657. [Google Scholar] [CrossRef]
  45. Chen, L.; Chen, M.; Zhang, X.; Xian, Y. Evaluating inequality divides in urban development intensity between the Global North and South. Land Use Policy 2024, 145, 107291. [Google Scholar] [CrossRef]
  46. Li, Y.; Kong, X.; Zhu, Z. Multiscale analysis of the correlation patterns between the urban population and construction land in China. Sustain. Cities Soc. 2020, 61, 102326. [Google Scholar] [CrossRef]
  47. Peng, Y.; Liu, J.; Zhang, T.; Li, X. The Relationship between Urban Population Density Distribution and Land Use in Guangzhou, China: A Spatial Spillover Perspective. Int. J. Environ. Res. Public Health 2021, 18, 12160. [Google Scholar] [CrossRef]
  48. Wellmann, T.; Schug, F.; Haase, D.; Pflugmacher, D.; van der Linden, S. Green growth? On the relation between population density, land use and vegetation cover fractions in a city using a 30-years Landsat time series. Landsc. Urban Plan. 2020, 202, 103857. [Google Scholar] [CrossRef]
  49. Lv, T.; Hu, H.; Han, H.; Zhang, X.; Fan, H.; Yan, K. Towards sustainability: The spatiotemporal patterns and influence mechanism of urban sprawl intensity in the Yangtze River Delta urban agglomeration. Habitat Int. 2024, 148, 103089. [Google Scholar] [CrossRef]
  50. Wu, W.-B.; Ma, J.; Banzhaf, E.; Meadows, M.E.; Yu, Z.-W.; Guo, F.-X.; Sengupta, D.; Cai, X.-X.; Zhao, B. A first Chinese building height estimate at 10 m resolution (CNBH-10 m) using multi-source earth observations and machine learning. Remote Sens. Environ. 2023, 291, 113578. [Google Scholar] [CrossRef]
  51. Luo, X.; Cheng, C.; Pan, Y.; Yang, T. Coupling Coordination and Influencing Factors of Land Development Intensity and Urban Resilience of the Yangtze River Delta Urban Agglomeration. Water 2022, 14, 1083. [Google Scholar] [CrossRef]
  52. National Bureau of Statistics of China. China Statistical Yearbook 1978; China Statistics Press: Beijing, China, 1979.
  53. Davis, K.; Golden, H.H. Urbanization and the Development of Pre-Industrial Areas. Econ. Dev. Cult. Change 1954, 3, 6–26. [Google Scholar] [CrossRef]
  54. Chen, M.; Liu, W.; Lu, D.; Chen, H.; Ye, C. Progress of China’s new-type urbanization construction since 2014: A preliminary assessment. Cities 2018, 78, 180–193. [Google Scholar] [CrossRef]
  55. Bai, X.; Shi, P. China’s urbanization at a turning point—Challenges and opportunities. Science 2025, 388, eadw3443. [Google Scholar] [CrossRef]
  56. Zhang, Z.; Wang, X.; Zhao, X.; Liu, B.; Yi, L.; Zuo, L.; Wen, Q.; Liu, F.; Xu, J.; Hu, S. A 2010 update of National Land Use/Cover Database of China at 1:100000 scale using medium spatial resolution satellite images. Remote Sens. Environ. 2014, 149, 142–154. [Google Scholar] [CrossRef]
  57. Balch, T. Hierarchic Social Entropy: An Information Theoretic Measure of Robot Group Diversity. Auton. Robot. 2000, 8, 209–238. [Google Scholar] [CrossRef]
  58. Li, X.; Bu, R.; Chang, Y.; Hu, Y.; Wen, Q.; Wang, X.; Xu, C.; Li, Y.; He, H. The response of landscape metrics against pattern scenarios. Acta Ecol. Sin. 2004, 24, 123–134. [Google Scholar]
  59. Zhang, H.; Zhang, X.; Yu, H.; Li, J.; Zhou, H.; Li, D. Comprehensive evaluation of shaped charge blasting effect of rock roadway based on entropy-weighted matter-element extension model. Arab. J. Geosci. 2021, 14, 716. [Google Scholar] [CrossRef]
  60. Phillips, S.J.; Dudik, M. Modeling of species distributions with Maxent: New extensions and a comprehensive evaluation. Ecography 2008, 31, 161–175. [Google Scholar] [CrossRef]
  61. Tapio, P. Towards a theory of decoupling: Degrees of decoupling in the EU and the case of road traffic in Finland between 1970 and 2001. Transp. Policy 2005, 12, 137–151. [Google Scholar] [CrossRef]
  62. Briassoulis, H. Analysis of Land Use Change: Theoretical and Modeling Approaches; Regional Research Institute, West Virginia University: Morgantown, WV, USA, 2020. [Google Scholar]
  63. Wu, F. Land financialisation and the financing of urban development in China. Land Use Policy 2022, 112, 104412. [Google Scholar] [CrossRef]
  64. Seto, K.C.; Kaufmann, R.K. Modeling the Drivers of Urban Land Use Change in the Pearl River Delta, China: Integrating Remote Sensing with Socioeconomic Data. Land Econ. 2003, 79, 106–121. [Google Scholar] [CrossRef]
  65. Xu, W. The Changing Dynamics of Land-Use Change in Rural China: A Case Study of Yuhang, Zhejiang Province. Environ. Plan. A Econ. Space 2004, 36, 1595–1615. [Google Scholar] [CrossRef]
  66. Seto, K.C.; Fragkias, M.; Güneralp, B.; Reilly, M.K. A Meta-Analysis of Global Urban Land Expansion. PLoS ONE 2011, 6, e23777. [Google Scholar] [CrossRef] [PubMed]
  67. Mullan, K.; Grosjean, P.; Kontoleon, A. Land Tenure Arrangements and Rural–Urban Migration in China. World Dev. 2011, 39, 123–133. [Google Scholar] [CrossRef]
  68. Lan, X. Being Involved: The Chinese Government and Economic Development; Shanghai People’s Publishing House: Shanghai, China, 2021. [Google Scholar]
  69. Du, J.; Yi, H. Environmental Target and Government Performance in China. Public Perform. Manag. Rev. 2023, 46, 793–819. [Google Scholar] [CrossRef]
Figure 1. Analytical framework.
Land 14 01459 g001
Figure 2. Study area.
Land 14 01459 g002
Figure 3. Spatial distribution of ULDI and PD by city.
Land 14 01459 g003
Figure 4. ULDI and PD growth rate.
Land 14 01459 g004
Figure 5. Radar chart of coupling degree and coupling coordination degree.
Land 14 01459 g005
Figure 6. Kernel density diagram of coupling degree and coupling coordination degree.
Land 14 01459 g006
Figure 7. Spatial and temporal trends in coupling degree and coupling coordination degree.
Land 14 01459 g007
Table 1. Meaning of ULDI criteria and formula.
CriteriaMeaningIndicatorsFormulaEntropy Weight
Floor area ratio (FAR)The ratio of total building area to built-up area; a unitless index Building   footprint   B i (m2)
Estimated floor number Ni = building height Hi (m)/3 (m)
Built-up   area   A i (m2)
F A R i = B i × H i / 3 A i (1) 0.484
Building density (BD)The ratio of building footprint area to built-up area Building   footprint   B i (m2)
Built-up   area   A i (m2)
B D i = B i A i (2)0.401
Shannon’s diversity index (SHDI)Calculate building function mix based on POI as a fundamental indicator Proportion   of   a   single   type   of   POI   to   the   total   number   of   POI   types   P i   (%)
Total number of POI types
S H D I i = i = 1 m   P i × I n P i (3)0.115
Table 2. Interpretation of C and D Classifications.
DegreeTypesFeatures
Coupling
degree (C)
0 ≤ C < 0.5Low couplingAgricultural-oriented cities shifted from initial coupling to an almost decoupled state between ULDI and PD (e.g., Bozhou, Anhui).
0.5 ≤ C < 0.75Moderate coupling(1) Due to enhanced urban economic performance, the interaction between land development intensity and population density strengthened (e.g., Chizhou, Anhui).
(2) Over time, some economically stronger cities have exhibited a siphoning effect, where ULDI and PD declined from high coupling to initial coupling levels, reflecting a weakening internal balance (e.g., Lianyungang, Suqian, Yancheng, Yangzhou, Taizhou, Nantong in northern Jiangsu, Quzhou in Zhejiang, and Xuancheng in southern Anhui).
0.75 ≤ C < 1High couplingThe remaining cities in the Yangtze River Delta showed mutual reinforcement and coordination between ULDI and PD, indicating a transition toward orderly and sustainable urban development.
Coupling
coordination degree (D)
0 ≤ D < 0.25Extreme imbalance(1) Some cities showed severe mismatch between land development intensity and population density, reflecting low coordination levels (e.g., Suqian, Jiangsu).
(2) In certain cases, cities shifted from imbalance to extreme imbalance, such as Bozhou, Anhui, which also exhibited low coupling degree.
0.25 ≤ D < 0.5Imbalance(1) In several cities, land development intensity and population density remained imbalanced, such as Lianyungang, Xuzhou, Yancheng, Huai’an, and Yangzhou in northern Jiangsu; Quzhou in Zhejiang; and Bozhou in northern Anhui, as well as Tongling, Chizhou, and Huangshan in southern Anhui.
(2) Some cities experienced a decline from primary coordination to imbalance over time, including Taizhou in Jiangsu, and Suzhou, Chuzhou, Xuancheng, and Lu’an in Anhui.
(3) A group of cities in southern Jiangsu showed a dynamic pattern—shifting from primary coordination to imbalance and then returning to primary coordination. These cities included Zhenjiang and Nantong, indicating a southward extension of more stable coordination.
0.5 ≤ D < 0.75Primary
coordination
In several cities, ULDI and PD were well-coordinated, indicating stable and balanced urban development. These included most cities in Zhejiang, as well as Nanjing, Suzhou, Wuxi, and Zhenjiang in Jiangsu, and Hefei and its surrounding cities in Anhui—such as Wuhu, Ma’anshan, Huaibei, Anqing, and Fuyang.
0.75 ≤ D < 1Quality
coordination
(1) Some cities demonstrated high matching between ULDI and PD, with stable and orderly urban development that was minimally affected by temporal changes. A typical example is Shanghai, which may be attributed to its status as a megacity that has entered a mature stage of urban development.
(2) Certain cities evolved from primary coordination to full coordination, such as Hangzhou and Wenzhou in Zhejiang, reflecting improved alignment between land development and population growth over time.
Disclaimer/Publisher’s Note: The statements, opinions and data contained in all publications are solely those of the individual author(s) and contributor(s) and not of MDPI and/or the editor(s). MDPI and/or the editor(s) disclaim responsibility for any injury to people or property resulting from any ideas, methods, instructions or products referred to in the content.

