


Land-Use Changes Largely Determine the Trajectory of Plant Species Distributions Under Climatic Uncertainty in a Mediterranean Landscape
 , , , and
Abstract
1. Introduction
2. Materials and Methods
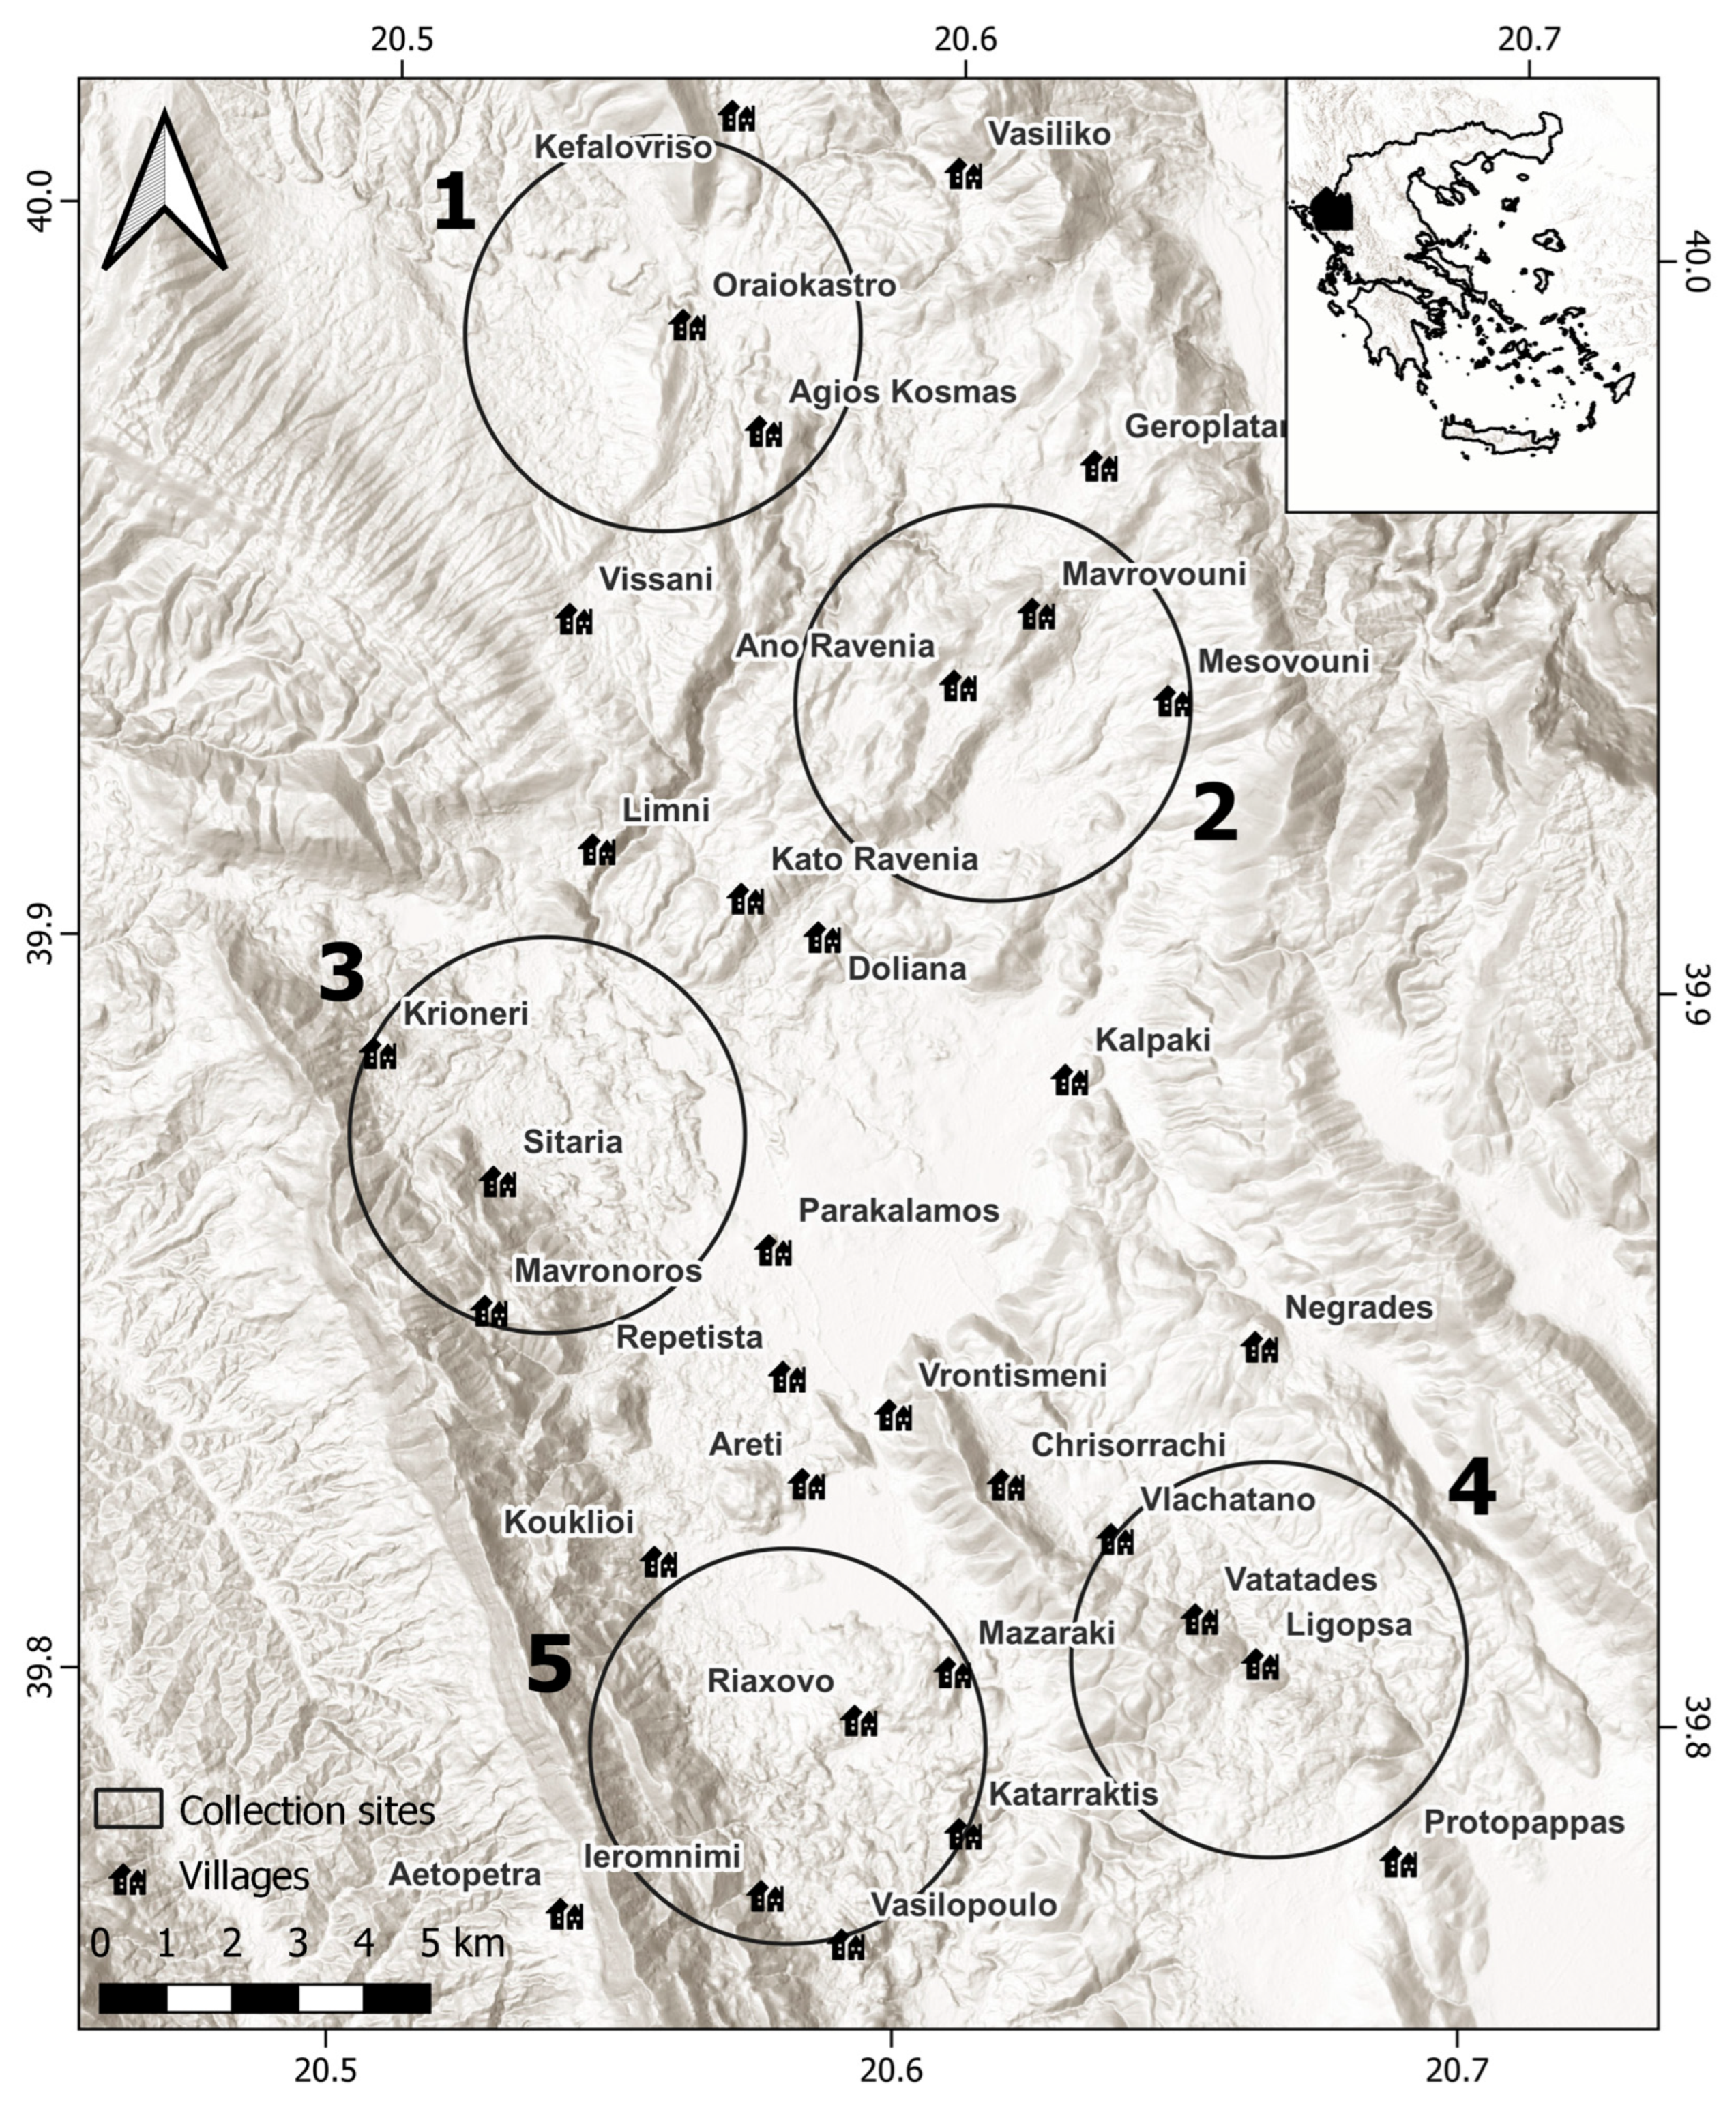
2.1. Study Area
2.2. Vegetation Sampling and Plant Communities
2.3. Land Cover Mapping
2.4. Species Distribution Modelling
2.5. CSR Life Strategies and Ecological Indicator Values of Species
2.6. Vegetation Communities’ Distribution
3. Results
4. Discussion
4.1. Characteristics of Our Case Study
4.2. Impact of Climate and Land-Use Change on Species Distribution
4.3. Ecological Characteristics of Species Distribution Changes
4.4. Concluding Remarks and Conservation Implications
Supplementary Materials
Author Contributions
Funding
Data Availability Statement
Conflicts of Interest
References
- IPBES. Global Assessment Report on Biodiversity and Ecosystem Services | IPBES Secretariat. Available online: https://www.ipbes.net/node/35274 (accessed on 27 January 2024).
- Urban, M.C. Accelerating extinction risk from climate change. Science 2015, 348, 571–573. [Google Scholar] [CrossRef] [PubMed]
- Wiens, J.J.; Zelinka, J. How many species will earth lose to climate change? Glob. Change Biol. 2024, 30, e17125. [Google Scholar] [CrossRef]
- Davison, C.W.; Rahbek, C.; Morueta-Holme, N. Land-use change and biodiversity: Challenges for assembling evidence on the greatest threat to nature. Glob. Change Biol. 2021, 27, 5414–5429. [Google Scholar] [CrossRef]
- Ellis, E.C.; Klein Goldewijk, K.; Siebert, S.; Lightman, D.; Ramankutty, N. Anthropogenic transformation of the biomes, 1700 to 2000. Glob. Ecol. Biogeogr. 2010, 19, 589–606. [Google Scholar] [CrossRef]
- Watson, J.E.M.; Shanahan, D.F.; Di Marco, M.; Allan, J.; Laurance, W.F.; Sanderson, E.W.; Mackey, B.; Venter, O. Catastrophic declines in wilderness areas undermine global environment targets. Curr. Biol. 2016, 26, 2929–2934. [Google Scholar] [CrossRef]
- Plieninger, T.; Hui, C.; Gaertner, M.; Huntsinger, L. The impact of land abandonment on species richness and abundance in the mediterranean basin: A meta-analysis. PLoS ONE 2014, 9, e98355. [Google Scholar] [CrossRef]
- Plieninger, T.; Draux, H.; Fagerholm, N.; Bieling, C.; Bürgi, M.; Kizos, T.; Kuemmerle, T.; Primdahl, J.; Verburg, P.H. The driving forces of landscape change in europe: A systematic review of the evidence. Land Use Policy 2016, 57, 204–214. [Google Scholar] [CrossRef]
- Perpiña Castillo, C.; Coll Aliaga, E.; Lavalle, C.; Martínez Llario, J.C. An assessment and spatial modelling of agricultural land abandonment in Spain (2015–2030). Sustainability 2020, 12, 560. [Google Scholar] [CrossRef]
- Pereira, H.M.; Navarro, L.M. (Eds.) Rewilding European Landscapes; Springer International Publishing: Cham, Switzerland, 2015; ISBN 978-3-319-12038-6. [Google Scholar]
- Janssen, J. European Red List of Habitats: Part 2. Terrestrial and Freshwater Habitats; Publications Office of the European Union: Luxembourg, 2016. [Google Scholar]
- Normile, D. Nature from nurture. Science 2016, 351, 908–910. [Google Scholar] [CrossRef]
- Prangel, E.; Kasari-Toussaint, L.; Neuenkamp, L.; Noreika, N.; Karise, R.; Marja, R.; Ingerpuu, N.; Kupper, T.; Keerberg, L.; Oja, E.; et al. Afforestation and abandonment of semi-natural grasslands lead to biodiversity loss and a decline in ecosystem services and functions. J. Appl. Ecol. 2023, 60, 825–836. [Google Scholar] [CrossRef]
- Prévosto, B.; Kuiters, L.; Bernhardt-Römermann, M.; Dölle, M.; Schmidt, W.; Hoffmann, M.; Van Uytvanck, J.; Bohner, A.; Kreiner, D.; Stadler, J.; et al. Impacts of land abandonment on vegetation: Successional pathways in European habitats. Folia Geobot. 2011, 46, 303–325. [Google Scholar] [CrossRef]
- Williams, J.J.; Newbold, T. Local climatic changes affect biodiversity responses to land use: A review. Divers. Distrib. 2020, 26, 76–92. [Google Scholar] [CrossRef]
- Newbold, T.; Oppenheimer, P.; Etard, A.; Williams, J.J. Tropical and mediterranean biodiversity is disproportionately sensitive to land-use and climate change. Nat. Ecol. Evol. 2020, 4, 1630–1638. [Google Scholar] [CrossRef]
- Santos, M.J.; Smith, A.B.; Dekker, S.C.; Eppinga, M.B.; Leitão, P.J.; Moreno-Mateos, D.; Morueta-Holme, N.; Ruggeri, M. The role of land use and land cover change in climate change vulnerability assessments of biodiversity: A systematic review. Landsc. Ecol. 2021, 36, 3367–3382. [Google Scholar] [CrossRef]
- Zolotova, E.; Ivanova, N.; Ivanova, S. Global overview of modern research based on Ellenberg indicator values. Diversity 2023, 15, 14. [Google Scholar] [CrossRef]
- Grime, J. Plant Strategies, Vegetation Processes, and Ecosystem Properties, 2nd ed.; John Wiley & Sons: New York, NY, USA, 2001. [Google Scholar]
- Grime, J. Vegetation classification by reference to strategies. Nature 1974, 250, 26–31. [Google Scholar] [CrossRef]
- Chontos, K.; Tsiripidis, I. Open habitats under threat in mountainous, mediterranean landscapes: Land abandonment consequences in the vegetation cover of the thessalian part of Mt Agrafa (central Greece). Land 2023, 12, 846. [Google Scholar] [CrossRef]
- Kiziridis, D.A.; Mastrogianni, A.; Pleniou, M.; Karadimou, E.; Tsiftsis, S.; Xystrakis, F.; Tsiripidis, I. Acceleration and relocation of abandonment in a mediterranean mountainous landscape: Drivers, consequences, and management implications. Land 2022, 11, 406. [Google Scholar] [CrossRef]
- Sidiropoulou, A.; Chouvardas, D.; Mantzanas, K.; Stefanidis, S.; Karatassiou, M. Impact of transhumant livestock grazing abandonment on pseudo-alpine grasslands in Greece in the context of climatic change. Land 2022, 11, 2126. [Google Scholar] [CrossRef]
- Xystrakis, F.; Psarras, T.; Koutsias, N. A process-based land use/land cover change assessment on a mountainous area of Greece during 1945–2009: Signs of socio-economic drivers. Sci. Total Environ. 2017, 587–588, 360–370. [Google Scholar] [CrossRef]
- Nakos, G. Classification, Mapping and Evaluation of Soils; Institute of Mediterranean Forest Ecosystems and Forest Products Technology, Ministry of Agriculture: Athens, Greece, 1991. (In Greek) [Google Scholar]
- Peel, M.C.; Finlayson, B.L.; McMahon, T.A. Updated world map of the Koppen-geiger climate classification. Hydrol. Earth Syst. Sci. 2007, 11, 1633–1644. [Google Scholar]
- Bohn, U.; Neuhäusl, R.; Gollub, G.; Hettwer, C.; Neuhäuslová, Z.; Raus, T.; Schlüter, H.; Weber, H. (2000/2003): Karte der natürlichen vegetation Europas/Map of the Natural Vegetation of Europe. Maßstab/Scale 1:2 500 000; Münster (Landwirtschaftsverlag), Bundesamt für Naturschutz: Bonn, Germany, 2004. [Google Scholar]
- Mastrogianni, A.; Kiziridis, D.A.; Karadimou, E.; Pleniou, M.; Xystrakis, F.; Tsiftsis, S.; Tsiripidis, I. Community-level differentiation of grime’s csr strategies along a post-abandonment secondary successional gradient. Flora 2023, 308, 152399. [Google Scholar] [CrossRef]
- Braun-Blanquet, J. Pflanzensoziologie, 3rd ed.; Springer: Berlin, Germany; New York, NY, USA, 1964; ISBN 086054928. [Google Scholar]
- Wilmanns, O. Ökologische Pflanzensoziologie, 4th ed.; Aufl. Quelle & Meyer: Heidelberg, Germany, 1989. [Google Scholar]
- Kiziridis, D.A.; Mastrogianni, A.; Pleniou, M.; Tsiftsis, S.; Xystrakis, F.; Tsiripidis, I. Simulating future land use and cover of a mediterranean mountainous area: The effect of socioeconomic demands and climatic changes. Land 2023, 12, 253. [Google Scholar] [CrossRef]
- Mastrogianni, A.; Kiziridis, D.A.; Eleftheriadou, A.; Paradisiotis, M.; Pleniou, M.; Xystrakis, F.; Tsiftsis, S.; Tsiripidis, I. Contribution to the functional flora of Greece: A case study in the northwestern Pindus mountains. Willdenowia 2024, 53, 269–295. [Google Scholar] [CrossRef]
- Phillips, S.J.; Dudík, M. Modeling of species distributions with Maxent: New Extensions and a comprehensive evaluation. Ecography 2008, 31, 161–175. [Google Scholar] [CrossRef]
- Phillips, S.J.; Anderson, R.P.; Dudík, M.; Schapire, R.E.; Blair, M.E. Opening the black box: An open-source release of Maxent. Ecography 2017, 40, 887–893. [Google Scholar] [CrossRef]
- Pearson, R.G.; Raxworthy, C.J.; Nakamura, M.; Townsend Peterson, A. Predicting species distributions from small numbers of occurrence records: A test case using cryptic geckos in Madagascar. J. Biogeogr. 2007, 34, 102–117. [Google Scholar] [CrossRef]
- Elith, J.; Leathwick, J. The contribution of species distribution modelling to conservation prioritization. In Spatial Conservation Prioritization: Quantitative Methods and Computational Tools; Moilanen, A., Wilson, K.A., Possingham, H.P., Eds.; Oxford University Press: Oxford, UK, 2009; ISBN 978-0-19-954776-0. [Google Scholar]
- O’Neill, B.C.; Tebaldi, C.; van Vuuren, D.P.; Eyring, V.; Friedlingstein, P.; Hurtt, G.; Knutti, R.; Kriegler, E.; Lamarque, J.-F.; Lowe, J.; et al. The Scenario Model Intercomparison Project (ScenarioMIP) for CMIP6. Geosci. Model Dev. 2016, 9, 3461–3482. [Google Scholar] [CrossRef]
- Poggio, L.; de Sousa, L.M.; Batjes, N.H.; Heuvelink, G.B.M.; Kempen, B.; Ribeiro, E.; Rossiter, D. SoilGrids 2.0: Producing soil information for the globe with quantified spatial uncertainty. Soil 2021, 7, 217–240. [Google Scholar] [CrossRef]
- European Environment Agency. Copernicus Land Monitoring Service -EU-DEM (European Digital Elevation Model). Version 1.1. 2016. Available online: http://Land.copernicus.eu/imagery-in-situ/eu-dem/eu-dem-v1.1/ (accessed on 10 January 2022).
- Hijmans, R.J.; Van Etten, J.; Cheng, J.; Mattiuzzi, M.; Sumner, M.; Greenberg, J.A.; Lamigueiro, O.P.; Bevan, A.; Racine, E.B.; Shortridge, A. Package ‘Raster’. 2015. Available online: https://cran.r-project.org/web/packages/raster/raster.pdf (accessed on 7 July 2025).
- Liu, C.; Newell, G.; White, M. On the selection of thresholds for predicting species occurrence with presence-only data. Ecol. Evol. 2016, 6, 337–348. [Google Scholar] [CrossRef]
- Hijmans, R.J.; Phillips, S.; Leathwick, J.; Elith, J. Dismo: Species distribution modeling. 2017. Available online: https://cran.r-project.org/web/packages/dismo/dismo.pdf (accessed on 7 July 2025).
- Ellenberg, H.; Weber, H.E.; Düll, R.; Wirth, V.; Werner, W.; Paulissen, D. Zeigerwerte von Pflanzen in Mitteleuropa, 2nd ed.; Scripta Geobotanica; Verlag Wrich Goltze: Gottingen, Germany, 1992; Volume 18, ISBN 978-3-88452-518-0. [Google Scholar]
- Grime, J. Evidence for the existence of three primary strategies in plants and its relevance to ecological and evolutionary theory. Am. Nat. 1977, 111, 1169–1194. [Google Scholar] [CrossRef]
- Dengler, J.; Jansen, F.; Chusova, O.; Hüllbusch, E.; Nobis, M.P.; Meerbeek, K.V.; Axmanová, I.; Bruun, H.H.; Chytrý, M.; Guarino, R.; et al. Ecological Indicator Values for Europe (EIVE) 1.0. Veg. Classif. Surv. 2023, 4, 7–29. [Google Scholar] [CrossRef]
- Pierce, S.; Negreiros, D.; Cerabolini, B.E.L.; Kattge, J.; Díaz, S.; Kleyer, M.; Shipley, B.; Wright, S.J.; Soudzilovskaia, N.A.; Onipchenko, V.G.; et al. A global method for calculating plant CSR ecological strategies applied across biomes world-wide. Funct. Ecol. 2017, 31, 444–457. [Google Scholar] [CrossRef]
- De Cáceres, M.; Legendre, P.; Moretti, M. Improving indicator species analysis by combining groups of sites. Oikos 2010, 119, 1674–1684. [Google Scholar] [CrossRef]
- De Cáceres, M.; Legendre, P. Associations between species and groups of sites: Indices and statistical inference. Ecology 2009, 90, 3566–3574. [Google Scholar] [CrossRef]
- Myers, N.; Mittermeier, R.A.; Mittermeier, C.G.; Da Fonseca, G.A.B.; Kent, J. Biodiversity hotspots for conservation priorities. Nature 2000, 403, 853–858. [Google Scholar] [CrossRef]
- Newbold, T. Future Effects of Climate and land-use change on terrestrial vertebrate community diversity under different scenarios. Proc. R. Soc. B 2018, 285, 20180792. [Google Scholar] [CrossRef] [PubMed]
- Oliver, T.H.; Morecroft, M.D. Interactions between climate change and land use change on biodiversity: Attribution problems, risks, and opportunities. Wiley Interdiscip. Rev. Clim. Change 2014, 5, 317–335. [Google Scholar] [CrossRef]
- Margules, C.R.; Pressey, R.L. Systematic Conservation Planning. Nature 2000, 405, 243–253. [Google Scholar] [CrossRef]
- Newbold, T.; Hudson, L.N.; Hill, S.L.L.; Contu, S.; Lysenko, I.; Senior, R.A.; Börger, L.; Bennett, D.J.; Choimes, A.; Collen, B.; et al. Global effects of land use on local terrestrial biodiversity. Nature 2015, 520, 45–50. [Google Scholar] [CrossRef]
- Sodhi, N.S.; Butler, R.; Laurance, W.F.; Gibson, L. Conservation successes at micro-, meso- and macroscales. Trends Ecol. Evol. 2011, 26, 585–594. [Google Scholar] [CrossRef] [PubMed]
- Selwood, K.E.; McGeoch, M.A.; Mac Nally, R. The effects of climate change and land-use change on demographic rates and population viability. Biol. Rev. 2015, 90, 837–853. [Google Scholar] [CrossRef] [PubMed]
- Di Marco, M.; Harwood, T.D.; Hoskins, A.J.; Ware, C.; Hill, S.L.L.; Ferrier, S. Projecting impacts of global climate and land-use scenarios on plant biodiversity using compositional-turnover modelling. Glob. Change Biol. 2019, 25, 2763–2778. [Google Scholar] [CrossRef]
- Piqueray, J.; Cristofoli, S.; Bisteau, E.; Palm, R.; Mahy, G. Testing coexistence of extinction debt and colonization credit in fragmented calcareous grasslands with complex historical dynamics. Landsc. Ecol. 2011, 26, 823–836. [Google Scholar] [CrossRef]
- Rathore, P.; Roy, A.; Karnatak, H. Predicting the future of species assemblages under climate and land use land cover changes in Himalaya: A geospatial modelling approach. Clim. Change Ecol. 2022, 3, 100048. [Google Scholar] [CrossRef]
- Schulte To Bühne, H.; Tobias, J.A.; Durant, S.M.; Pettorelli, N. Improving predictions of climate change–land use change interactions. Trends Ecol. Evol. 2021, 36, 29–38. [Google Scholar] [CrossRef] [PubMed]
- Bellard, C.; Marino, C.; Courchamp, F. Ranking threats to biodiversity and why it doesn’t matter. Nat. Commun. 2022, 13, 2616. [Google Scholar] [CrossRef]
- Tuan, L.Q.; Thong, V.D.; Son, N.T.; Tu, V.T.; Tuan, T.A.; Luong, N.T.; Vy, N.T.; Thanh, H.T.; Huang, J.C.-C.; Csorba, G.; et al. Potential individual and interactive effects of climate and land-cover changes on bats and implications for conservation planning: A case study in Vietnam. Biodivers. Conserv. 2023, 32, 4481–4508. [Google Scholar] [CrossRef]
- Ah Koo, K.; Uk Park, S. The effect of interplays among climate change, land-use change, and dispersal capacity on plant redistribution. Ecol. Indic. 2022, 142, 109192. [Google Scholar] [CrossRef]
- Perring, M.P.; Bernhardt-Römermann, M.; Baeten, L.; Midolo, G.; Blondeel, H.; Depauw, L.; Landuyt, D.; Maes, S.L.; De Lombaerde, E.; Carón, M.M.; et al. Global environmental change effects on plant community composition trajectories depend upon management legacies. Glob. Change Biol. 2018, 24, 1722–1740. [Google Scholar] [CrossRef]
- Saatkamp, A.; Argagnon, O.; Noble, V.; Finocchiaro, M.; Meineri, E. Climate change impacts on mediterranean vegetation are amplified at low altitudes. Glob. Ecol. Biogeogr. 2023, 32, 1113–1126. [Google Scholar] [CrossRef]
- Scherrer, D.; Guisan, A. Ecological indicator values reveal missing predictors of species distributions. Sci. Rep. 2019, 9, 3061. [Google Scholar] [CrossRef]
- Zellweger, F.; De Frenne, P.; Lenoir, J.; Rocchini, D.; Coomes, D. Advances in microclimate ecology arising from remote sensing. Trends Ecol. Evol. 2019, 34, 327–341. [Google Scholar] [CrossRef]
- Sanna, F.; Campesi, G.; Deligios, P.; Ledda, L.; Piluzza, G.; Sulas, L.; Re, G.A. Combined effects of microenvironment and land use on C fluxes in a mediterranean agro-silvopastoral system. Eur. J. Agron. 2021, 130, 126348. [Google Scholar] [CrossRef]
- De Frenne, P.; Zellweger, F.; Rodríguez-Sánchez, F.; Scheffers, B.R.; Hylander, K.; Luoto, M.; Vellend, M.; Verheyen, K.; Lenoir, J. Global buffering of temperatures under forest canopies. Nat. Ecol. Evol. 2019, 3, 744–749. [Google Scholar] [CrossRef]
- Zellweger, F.; De Frenne, P.; Lenoir, J.; Vangansbeke, P.; Verheyen, K.; Bernhardt-Römermann, M.; Baeten, L.; Hédl, R.; Berki, I.; Brunet, J.; et al. Forest microclimate dynamics drive plant responses to warming. Science 2020, 368, 772–775. [Google Scholar] [CrossRef] [PubMed]
- Bricca, A.; Tardella, F.M.; Ferrara, A.; Panichella, T.; Catorci, A. Exploring assembly trajectories of abandoned grasslands in response to 10 years of mowing in sub-mediterranean context. Land 2021, 10, 1158. [Google Scholar] [CrossRef]
- Dalle Fratte, M.; Brusa, G.; Pierce, S.; Zanzottera, M.; Cerabolini, B.E.L. Plant trait variation along environmental indicators to infer global change impacts. Flora 2019, 254, 113–121. [Google Scholar] [CrossRef]
- Zanzottera, M.; Dalle Fratte, M.; Caccianiga, M.; Pierce, S.; Cerabolini, B.E.L. Community-level variation in plant functional traits and ecological strategies shapes habitat structure along succession gradients in alpine environment. Community Ecol. 2020, 21, 55–65. [Google Scholar] [CrossRef]
- Chai, Y.; Yue, M.; Wang, M.; Xu, J.; Liu, X.; Zhang, R.; Wan, P. Plant functional traits suggest a change in novel ecological strategies for dominant species in the stages of forest succession. Oecologia 2016, 180, 771–783. [Google Scholar] [CrossRef]
- Sirami, C.; Caplat, P.; Popy, S.; Clamens, A.; Arlettaz, R.; Jiguet, F.; Brotons, L.; Martin, J. Impacts of global change on species distributions: Obstacles and solutions to integrate climate and land use. Glob. Ecol. Biogeogr. 2017, 26, 385–394. [Google Scholar] [CrossRef]
- Navarro, L.; Proença, V.; Kaplan, J.; Pereira, H. Maintaining disturbance-dependent habitats. In Rewilding European Landscapes; Springer: Berlin/Heidelberg, Germany, 2015; pp. 143–167. ISBN 978-3-319-12038-6. [Google Scholar]
- Viljur, M.-L.; Abella, S.R.; Adámek, M.; Alencar, J.B.R.; Barber, N.A.; Beudert, B.; Burkle, L.A.; Cagnolo, L.; Campos, B.R.; Chao, A.; et al. The effect of natural disturbances on forest biodiversity: An ecological synthesis. Biol. Rev. 2022, 97, 1930–1947. [Google Scholar] [CrossRef] [PubMed]

| Scenario | Farmlands | Grasslands | Open Scrubs | Closed Scrubs | Forests |
|---|---|---|---|---|---|
| 2015 | 4.49 | 21.24 | 11.26 | 14.75 | 86.66 |
| SS126-EXT | 30.02 | 23.58 | 17.49 | 21.58 | 45.72 |
| SS126-INT | 3.89 | 7.88 | 6.93 | 10.86 | 108.84 |
| SS126-USU | 0.58 | 9.4 | 7.63 | 11.26 | 109.53 |
| SS370-EXT | 30.02 | 23.58 | 17.49 | 21.58 | 45.72 |
| SS370-INT | 3.89 | 7.88 | 6.93 | 10.86 | 108.84 |
| SS370-USU | 0.58 | 9.4 | 7.63 | 11.26 | 109.53 |
| SS585-EXT | 30.02 | 23.58 | 17.49 | 21.58 | 45.72 |
| SS585-INT | 3.89 | 7.88 | 6.93 | 10.86 | 108.84 |
| SS585-USU | 0.58 | 9.4 | 7.63 | 11.26 | 109.53 |
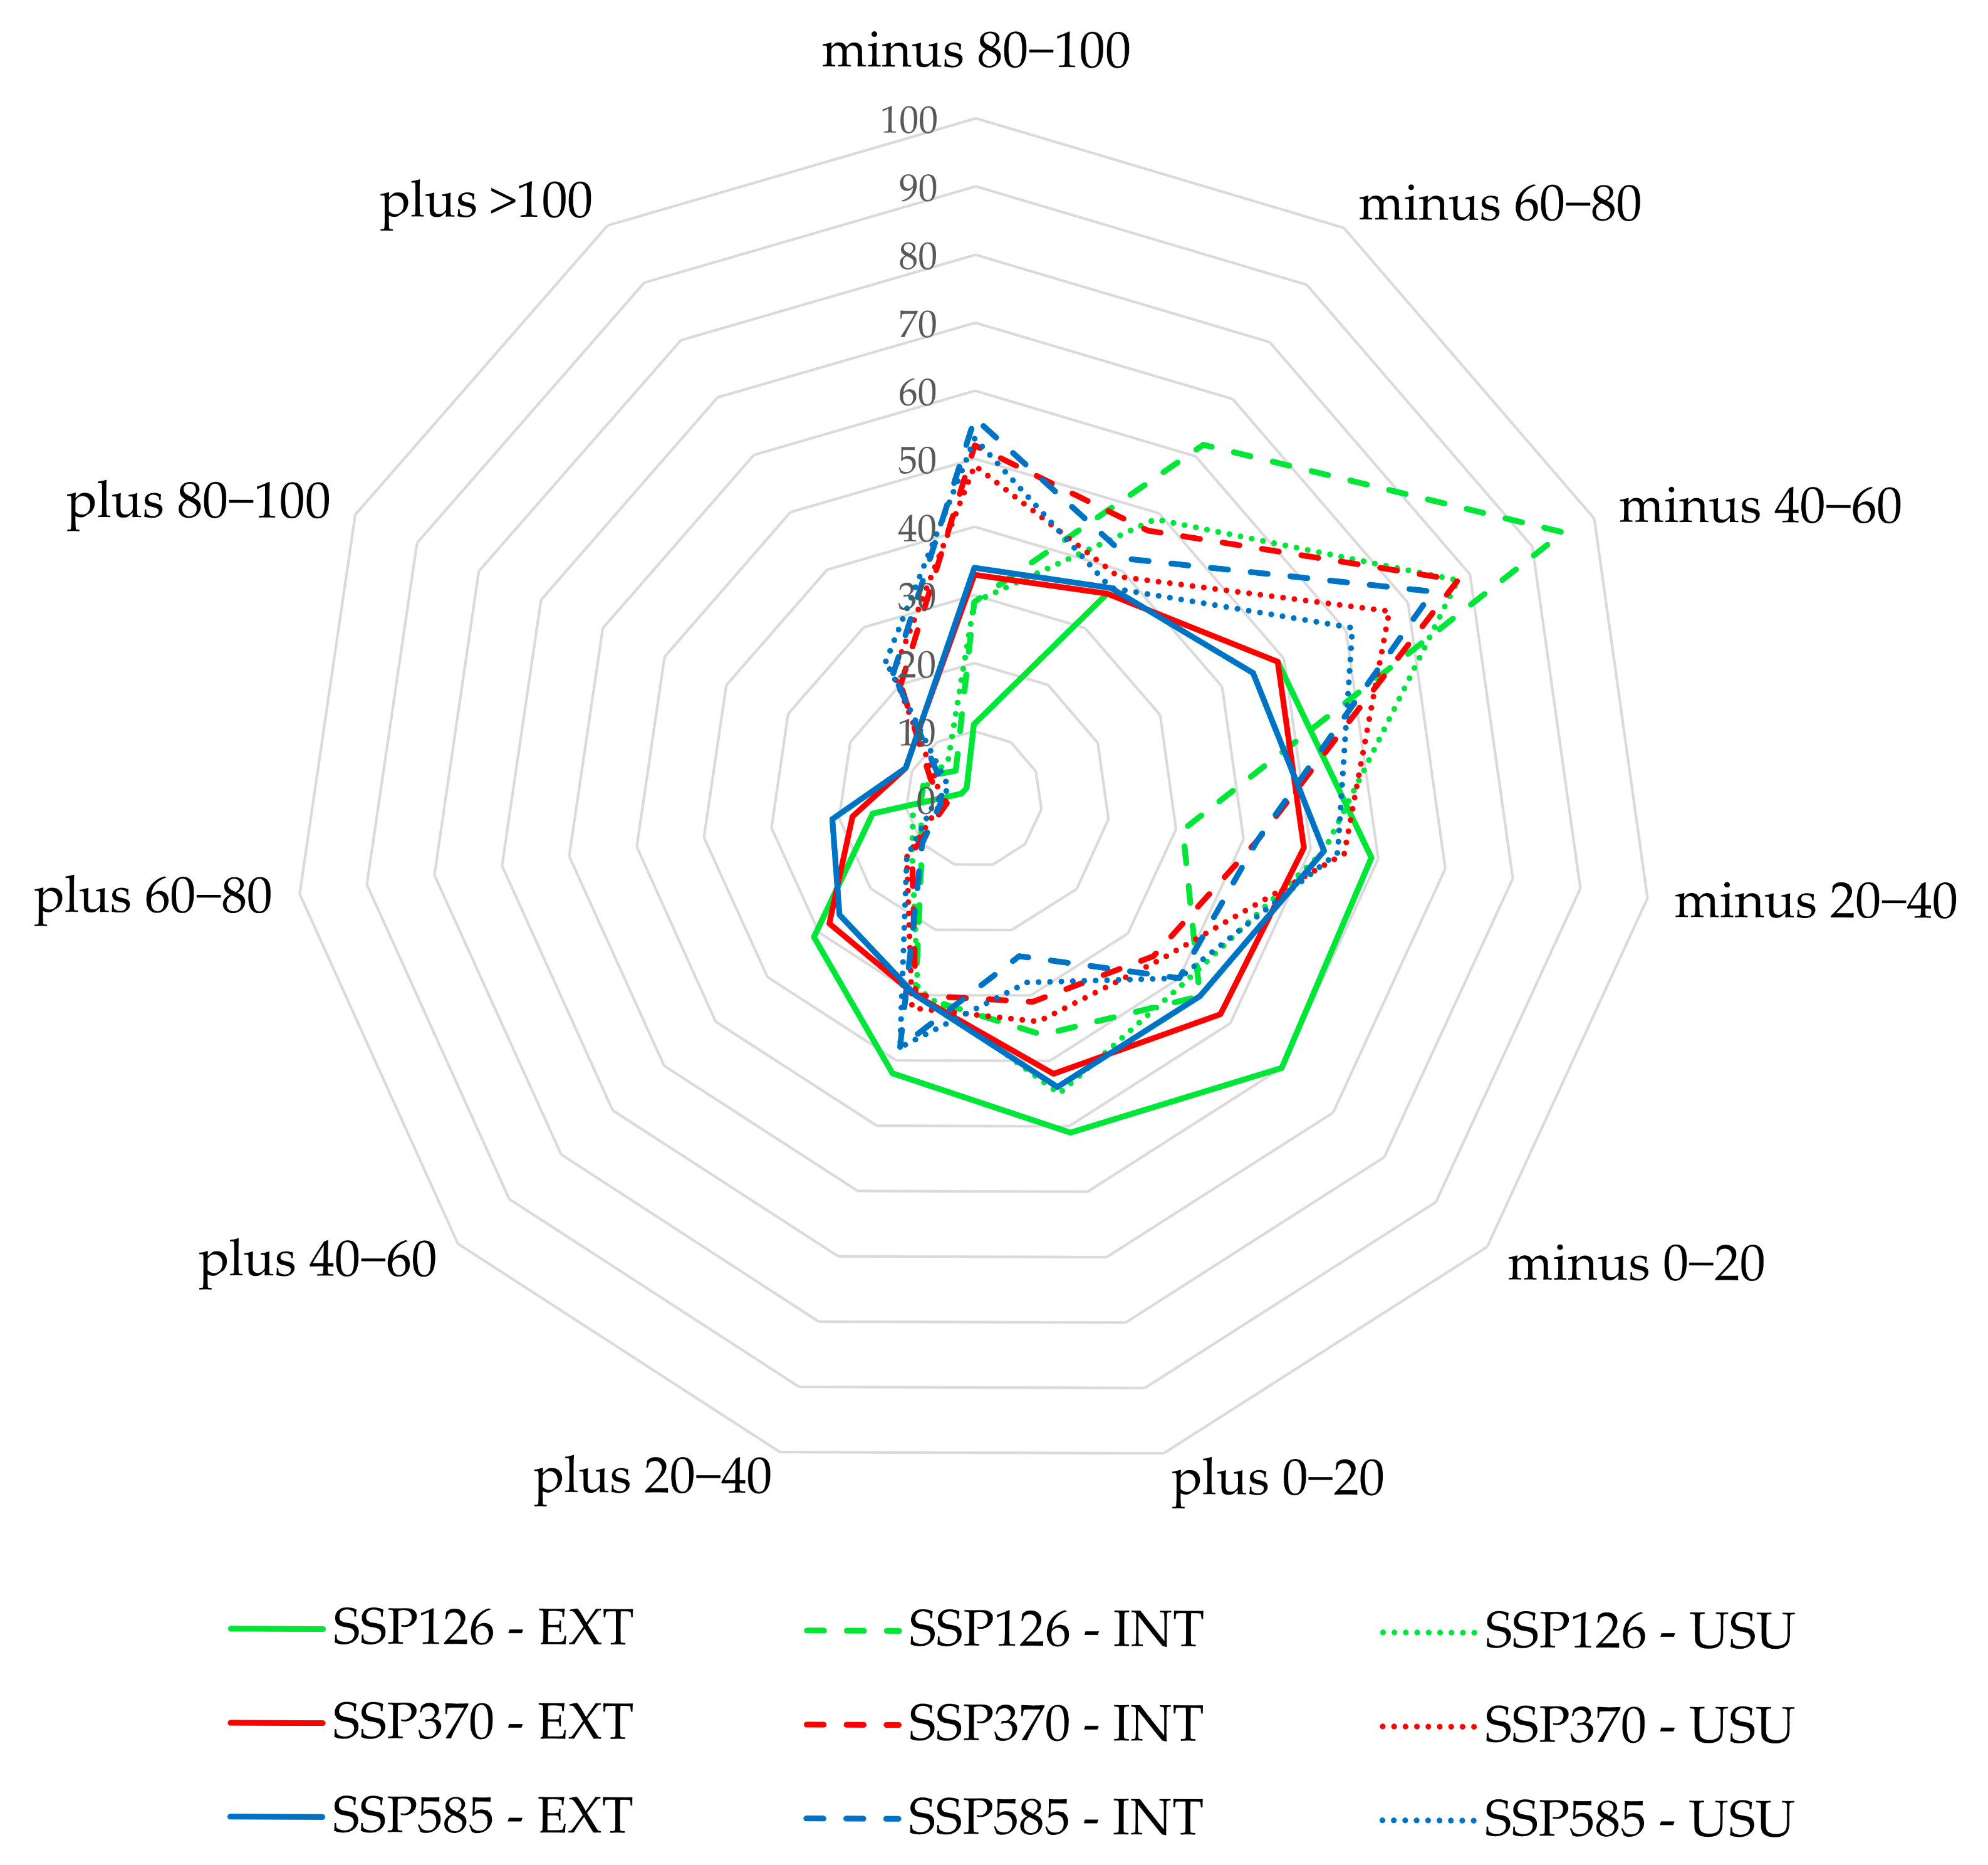
| SSP126 EXT | SSP126 INT | SSP126 USU | SSP370 EXT | SSP370 INT | SSP370 USU | SSP58 EXT | SSP585 INT | SSP585 USU | |
|---|---|---|---|---|---|---|---|---|---|
| minus 80–100 | 11 | 29 | 29 | 33 | 52 | 49 | 34 | 56 | 53 |
| minus 60–80 | 36 | 62 | 49 | 36 | 47 | 39 | 37 | 42 | 37 |
| minus 40–60 | 49 | 95 | 78 | 49 | 78 | 67 | 45 | 74 | 61 |
| minus 20–40 | 59 | 31 | 52 | 49 | 42 | 55 | 52 | 42 | 54 |
| minus 0–20 | 60 | 44 | 41 | 48 | 35 | 36 | 44 | 40 | 40 |
| plus 0–20 | 51 | 36 | 45 | 42 | 31 | 34 | 44 | 24 | 28 |
| plus 20–40 | 42 | 30 | 29 | 30 | 30 | 32 | 30 | 38 | 38 |
| plus 40–60 | 31 | 10 | 12 | 28 | 12 | 13 | 26 | 10 | 13 |
| plus 60–80 | 15 | 8 | 9 | 18 | 4 | 5 | 21 | 5 | 6 |
| plus 80–100 | 2 | 8 | 7 | 11 | 7 | 6 | 11 | 5 | 4 |
| plus >100 | 2 | 5 | 7 | 14 | 20 | 22 | 14 | 22 | 24 |
Disclaimer/Publisher’s Note: The statements, opinions and data contained in all publications are solely those of the individual author(s) and contributor(s) and not of MDPI and/or the editor(s). MDPI and/or the editor(s) disclaim responsibility for any injury to people or property resulting from any ideas, methods, instructions or products referred to in the content. |
© 2025 by the authors. Licensee MDPI, Basel, Switzerland. This article is an open access article distributed under the terms and conditions of the Creative Commons Attribution (CC BY) license (https://creativecommons.org/licenses/by/4.0/).
Share and Cite
Tsiftsis, S.; Mastrogianni, A.; Kiziridis, D.A.; Xystrakis, F.; Pleniou, M.; Tsiripidis, I. Land-Use Changes Largely Determine the Trajectory of Plant Species Distributions Under Climatic Uncertainty in a Mediterranean Landscape. Land 2025, 14, 1438. https://doi.org/10.3390/land14071438
Tsiftsis S, Mastrogianni A, Kiziridis DA, Xystrakis F, Pleniou M, Tsiripidis I. Land-Use Changes Largely Determine the Trajectory of Plant Species Distributions Under Climatic Uncertainty in a Mediterranean Landscape. Land. 2025; 14(7):1438. https://doi.org/10.3390/land14071438
Chicago/Turabian StyleTsiftsis, Spyros, Anna Mastrogianni, Diogenis A. Kiziridis, Fotios Xystrakis, Magdalini Pleniou, and Ioannis Tsiripidis. 2025. "Land-Use Changes Largely Determine the Trajectory of Plant Species Distributions Under Climatic Uncertainty in a Mediterranean Landscape" Land 14, no. 7: 1438. https://doi.org/10.3390/land14071438
APA StyleTsiftsis, S., Mastrogianni, A., Kiziridis, D. A., Xystrakis, F., Pleniou, M., & Tsiripidis, I. (2025). Land-Use Changes Largely Determine the Trajectory of Plant Species Distributions Under Climatic Uncertainty in a Mediterranean Landscape. Land, 14(7), 1438. https://doi.org/10.3390/land14071438