2. Materials and Methods
2.1. Study Area
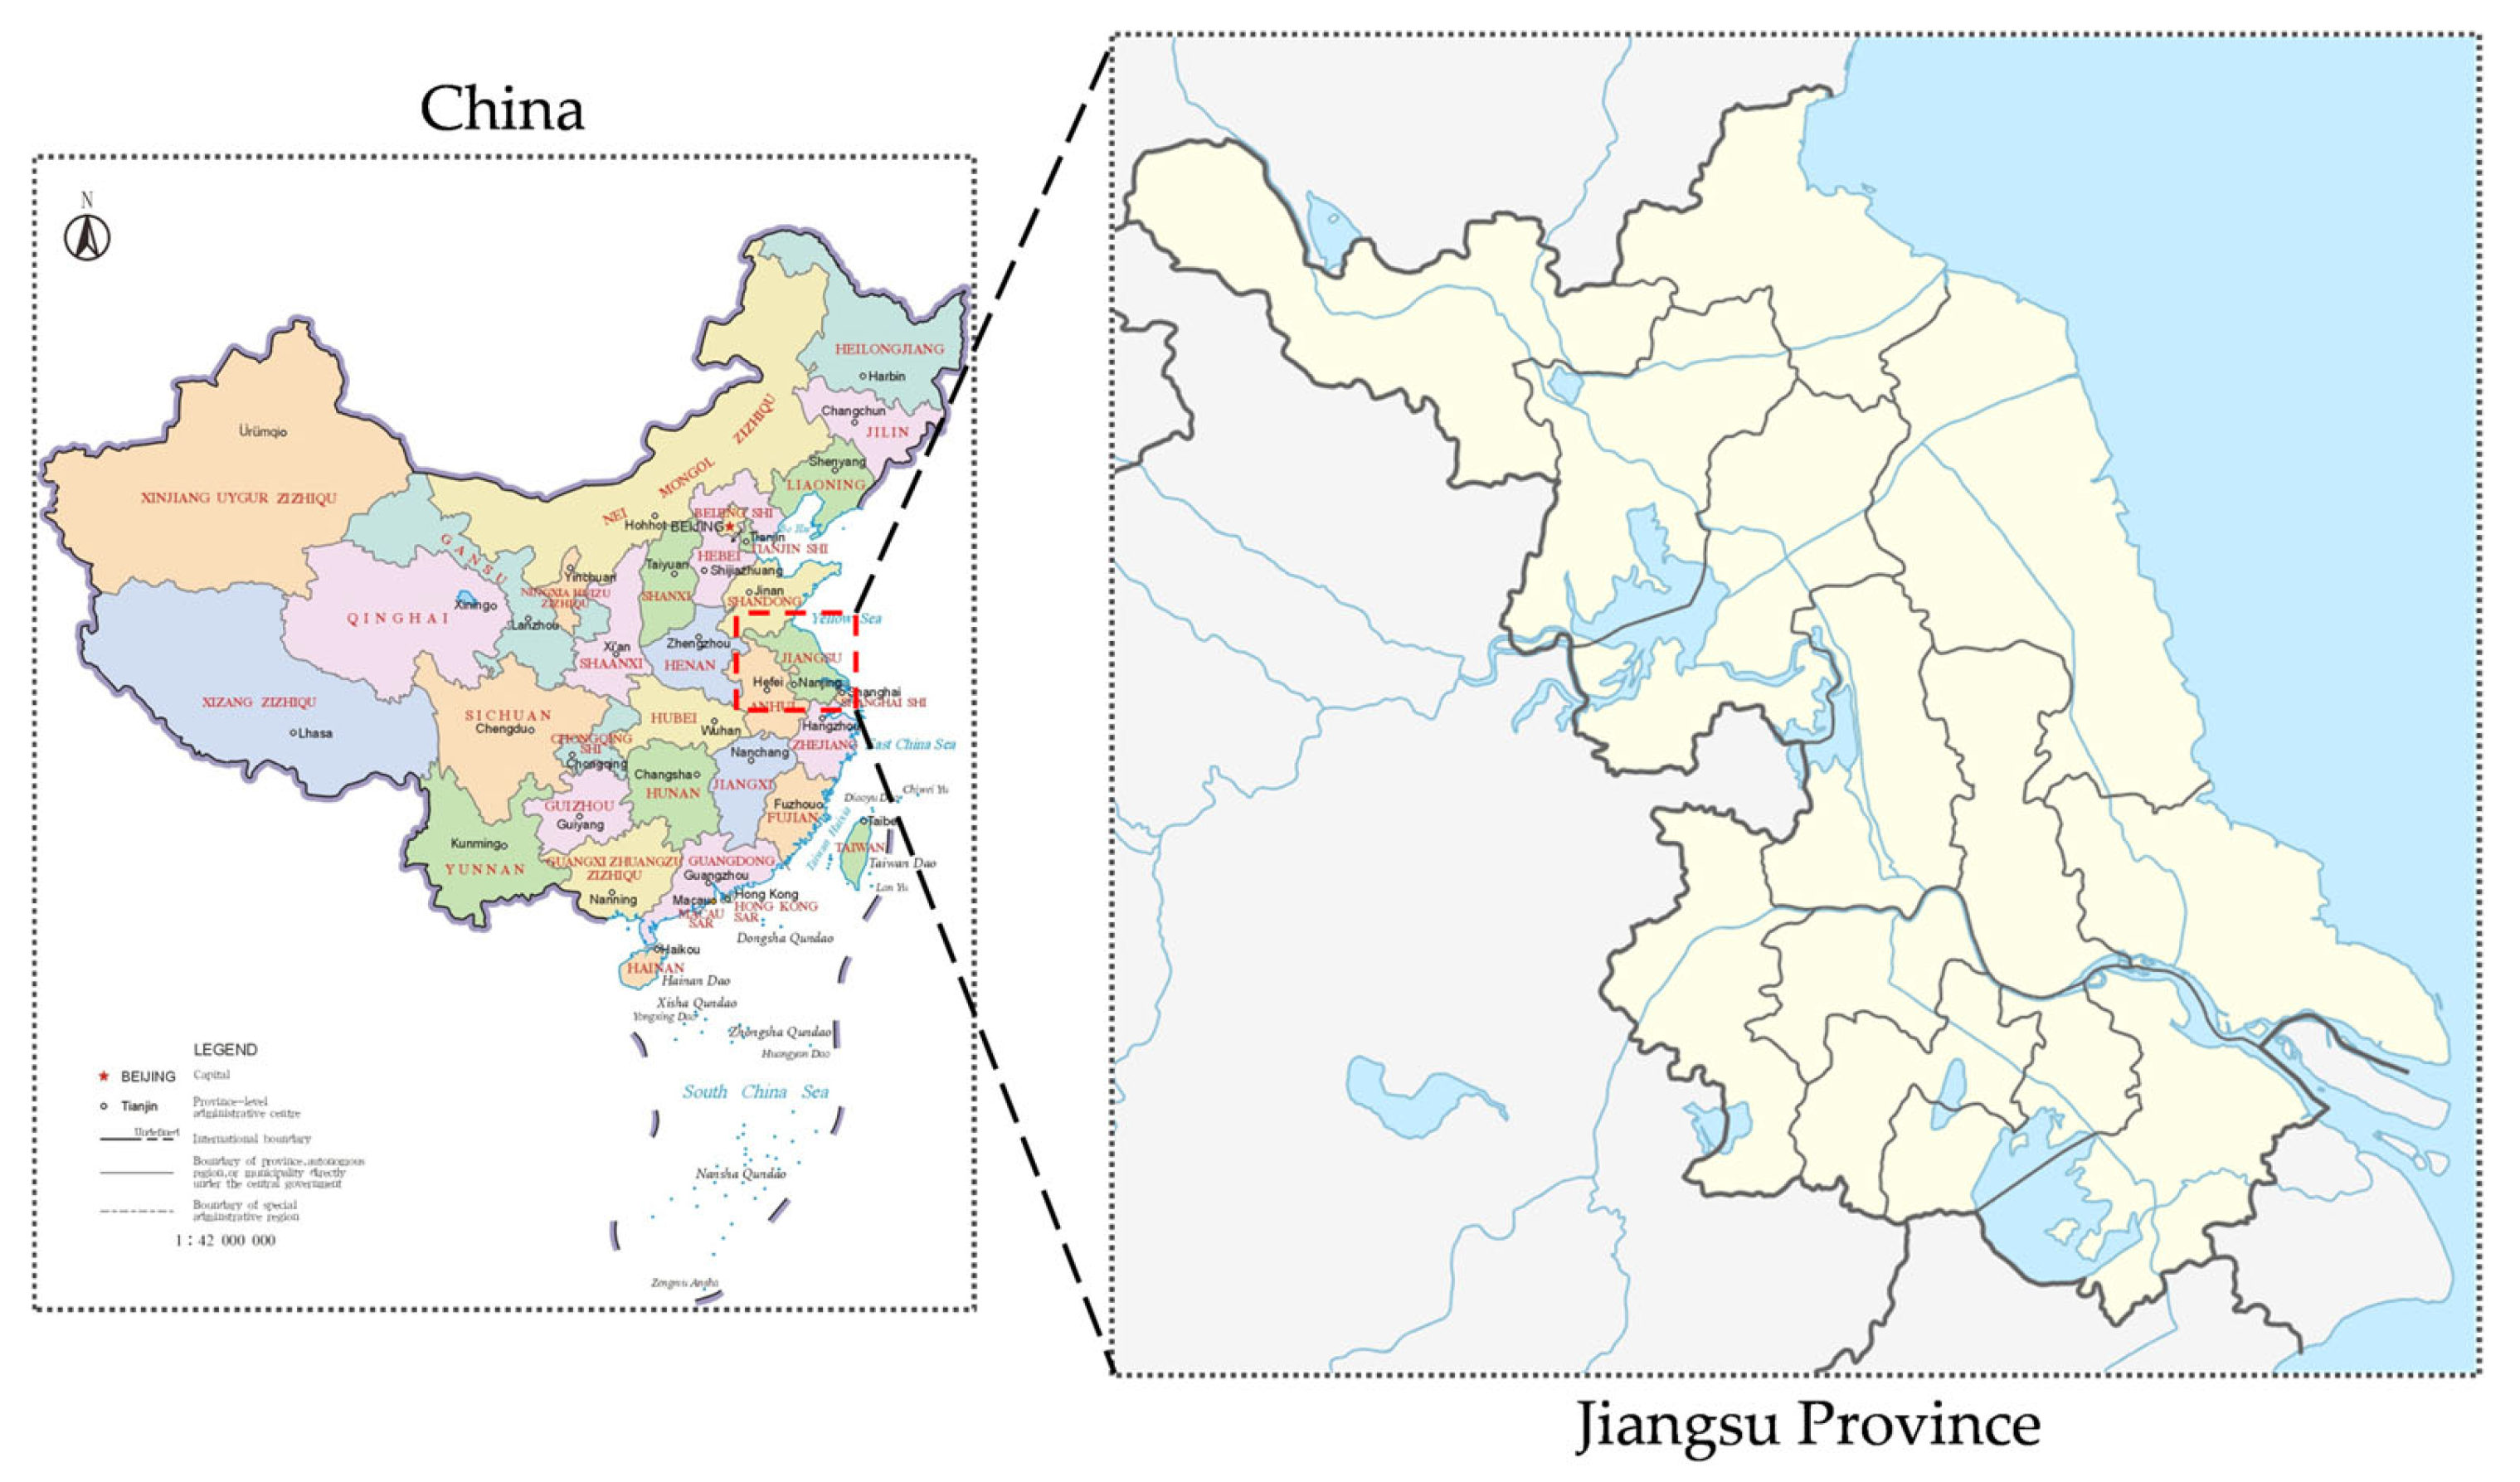
Jiangsu Province is situated in the central eastern coastal region of China, occupying the lower reaches of the Yangtze and Huai River basins. Its geographical coordinates span 116°18′ E to 121°57′ E longitude and 30°45′ N to 35°20′ N latitude. Bordered by the Yellow Sea to the east, Shandong Province to the north, Anhui Province to the west, and Shanghai/Zhejiang Province to the southeast, Jiangsu constitutes a vital component of the Yangtze River Delta. The provincial topography is predominantly composed of plains with low-lying terrain, featuring extensive water surfaces and an intricate river network. The Yangtze River traverses the province east–west, while the Beijing–Hangzhou Grand Canal crosses north–south, forming a dense hydrological system. Jiangsu remains China’s only province that integrates fluvial (rivers), lacustrine (lakes), and coastal geographical characteristics and is endowed with diverse natural conditions and abundant resources [
51]. The climate exhibits transitional characteristics from temperate to subtropical zones, marked by distinct seasons and synchronized precipitation–thermal patterns [
52]. The geographical profile of Jiangsu Province is illustrated in
Figure 2.
Jiangsu stands as one of China’s most rapidly urbanizing regions and is characterized by a robust real economy and highly developed urban agglomerations [
53]. In 2023, Jiangsu Province’s resident population reached 85.26 million, with a population density of 796 persons per square kilometer. The provincial gross regional product totaled CNY 12,822.22 billion, representing a 5.8% year-on-year growth in constant prices. Specifically, the value-added of the primary sector amounted to CNY 507.58 billion, up 3.5% year-on-year; the secondary sector contributed CNY 5690.97 billion, rising 6.7%; while the tertiary sector generated CNY 6623.67 billion, representing an increase of 5.1%. As a cradle of modern national industries, the province was early in establishing comprehensive industrial systems and open economic patterns, accumulating substantial experience in urban modernization [
54]. In 2023, the output value of strategic emerging industries and high-tech industries within Jiangsu Province’s industrial enterprises above designated size accounted for 41.3% and 49.9% of the total above-designated-size industrial output value, respectively. In infrastructure and public services, Jiangsu boasts advanced transportation networks, with expressway and high-speed-rail densities ranking among the highest nationally, complemented by abundant port resources [
55]. However, regional economic development exhibits pronounced gradient disparities, which are correspondingly reflected in the urban resilience differentials [
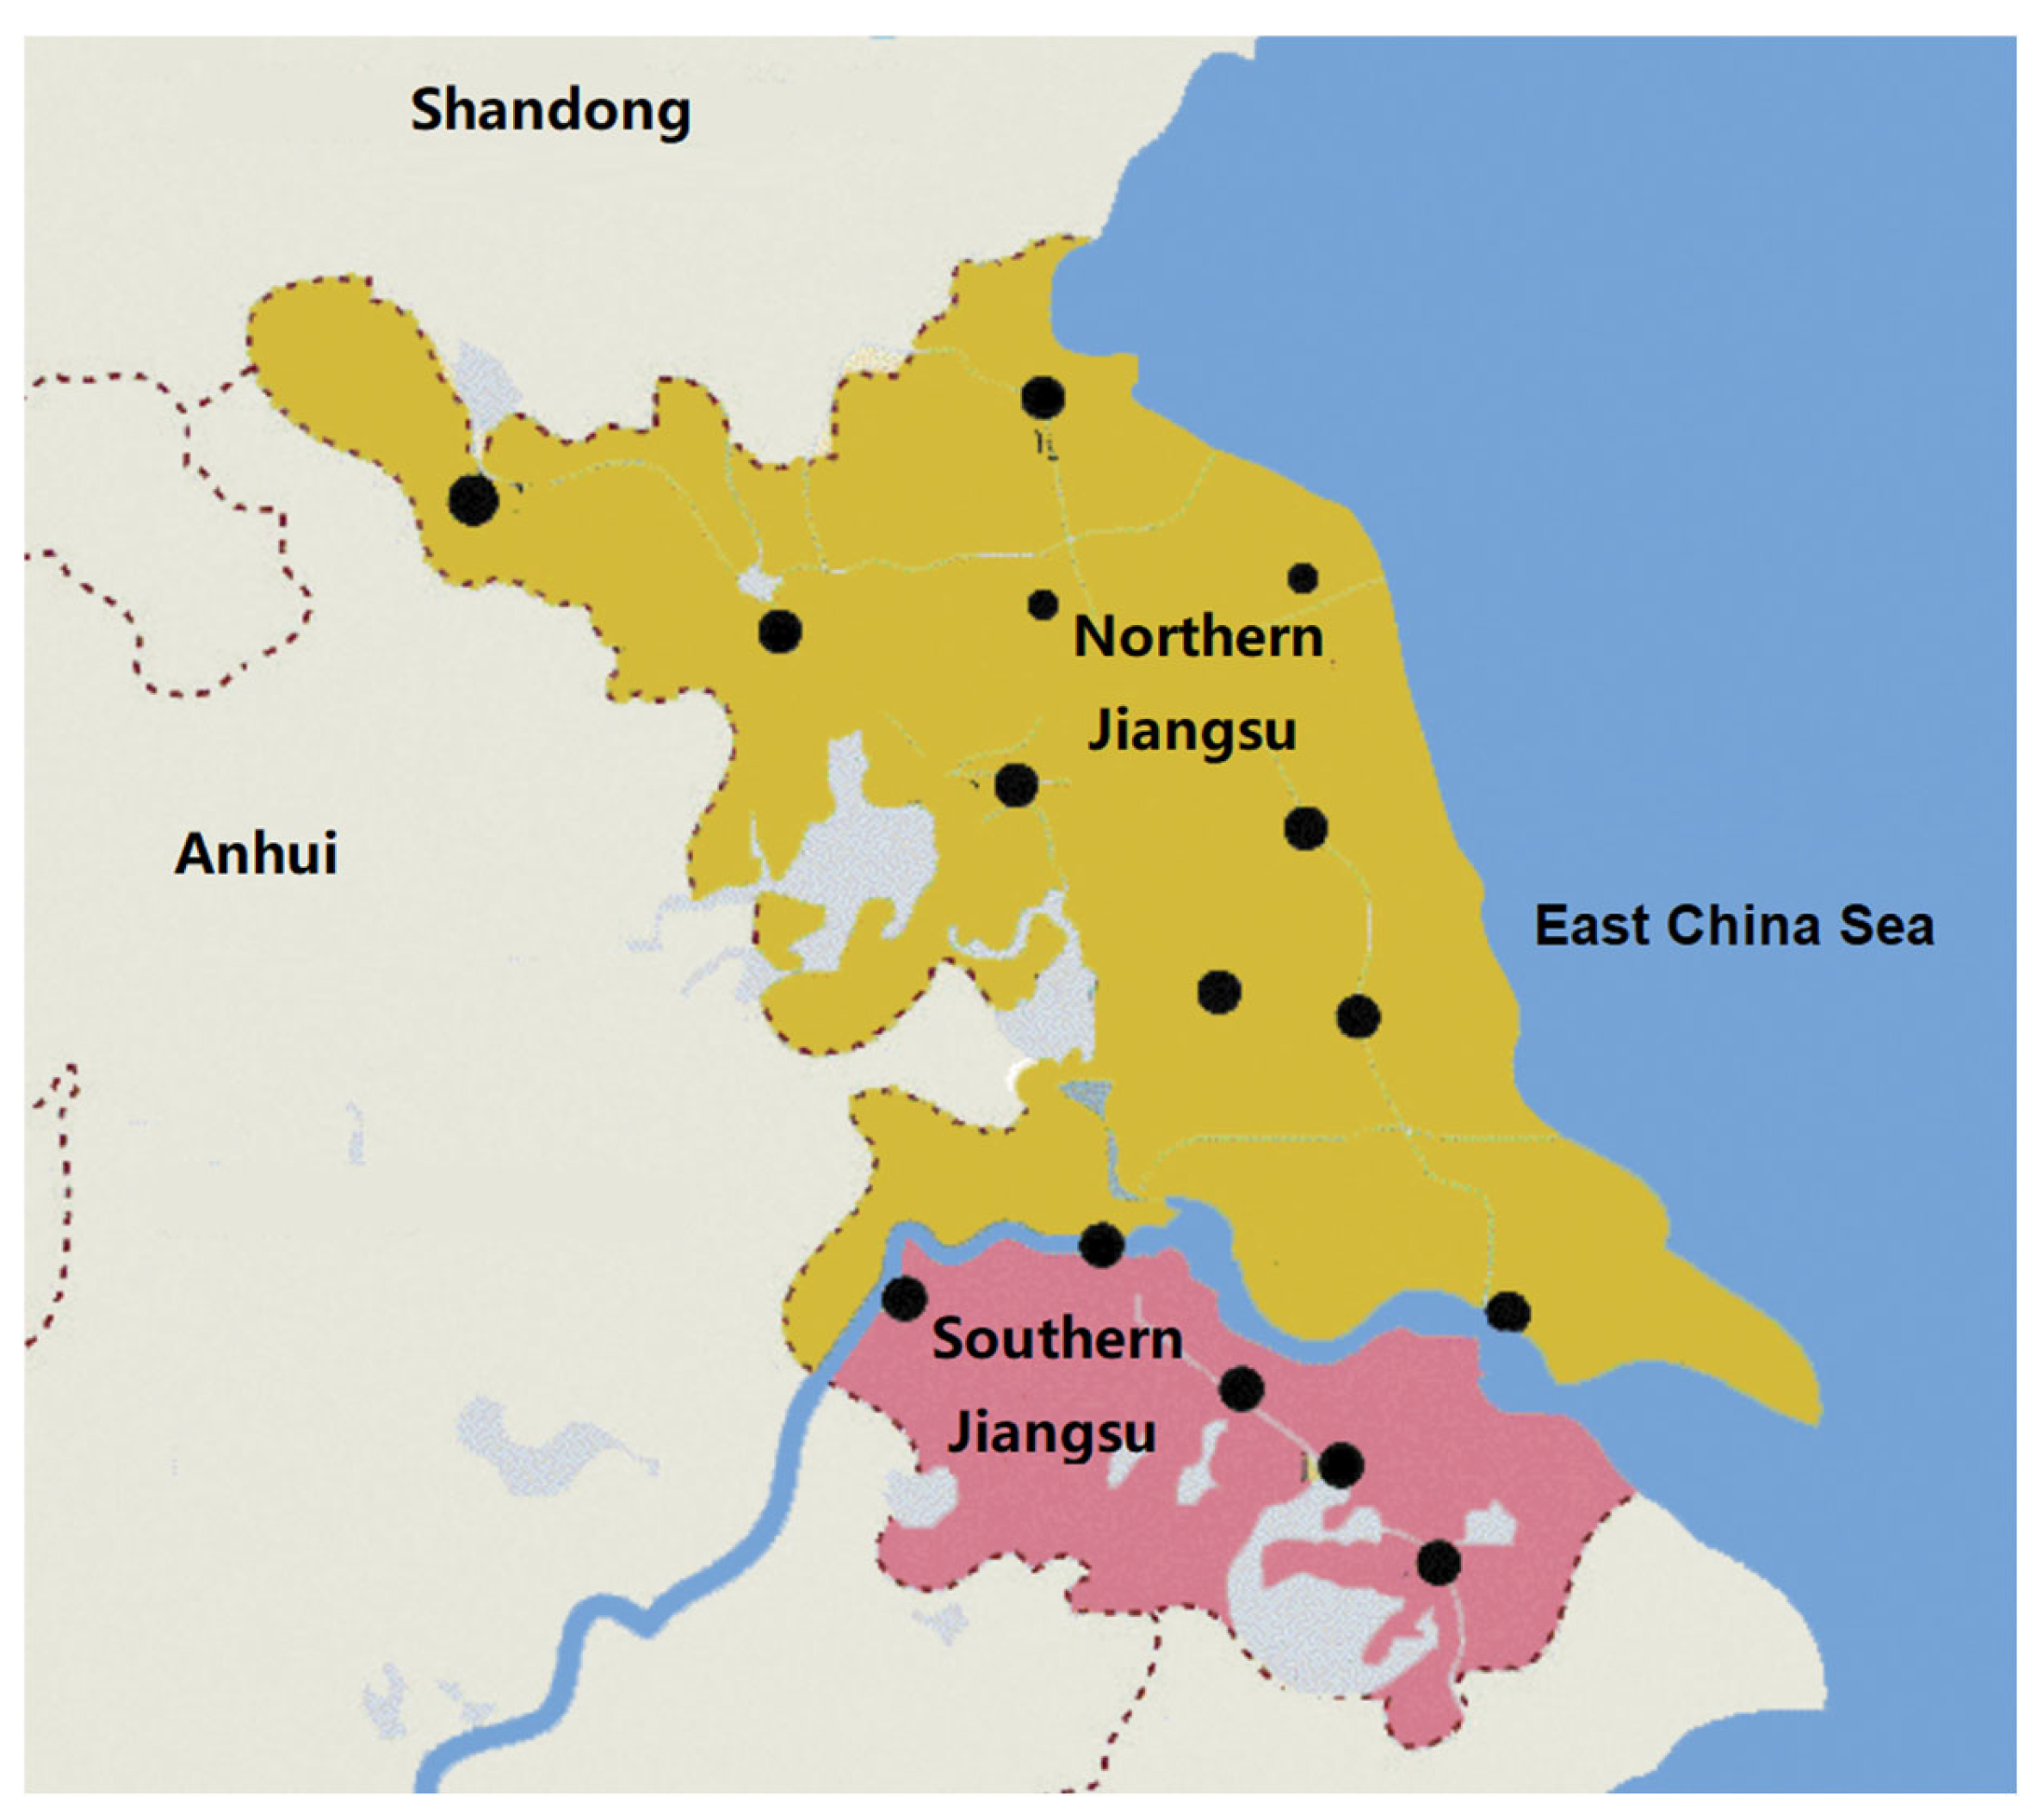
56]. The geographical demarcation of Southern Jiangsu and Northern Jiangsu is illustrated in
Figure 3. Southern Jiangsu, leveraging the Yangtze River’s golden waterway and Shanghai’s economic radiation, clusters high-end manufacturing and modern service industries with outstanding innovation capacity. Central Jiangsu specializes in industrial transfer reception and characteristic industrial clusters. Northern Jiangsu, which is predominantly reliant on agriculture and traditional industries, experiences relatively lagged development [
57]. Simultaneously, infrastructure distribution imbalances persist across Jiangsu’s regions, which are manifested in transportation accessibility and medical–educational resource disparities [
58]. Recent years have witnessed provincial efforts to optimize industrial structures, with emerging industries and digital economies achieving rapid growth. Nevertheless, some cities continue grappling with the dual pressures of traditional industry transformation and modern financial risks [
59]. Ecologically, Jiangsu’s industrial expansion has generated severe environmental carrying pressures and land resource pollution, highlighting how imperative it is to enhance synergy between ecological security and urban development—a critical constraint on urban resilience [
60].
As the strategic confluence point of the Belt and Road Initiative and a pivotal node in Yangtze River Delta integration, Jiangsu Province occupies a pivotal position in China’s national strategic framework [
61]. While endowed with favorable policy support and resource endowments, the province faces novel governance challenges in their urban agglomeration systems’ capacity to withstand external shocks. The comprehensive development status of Jiangsu’s cities across the areas of population mobility, industrial collaboration, and ecological conservation constitutes a critical determinant shaping its overall regional resilience levels. Therefore, resilience evaluation research targeting Jiangsu’s cities encompasses both a theoretical need and paradigmatic significance.
2.2. Data Sources
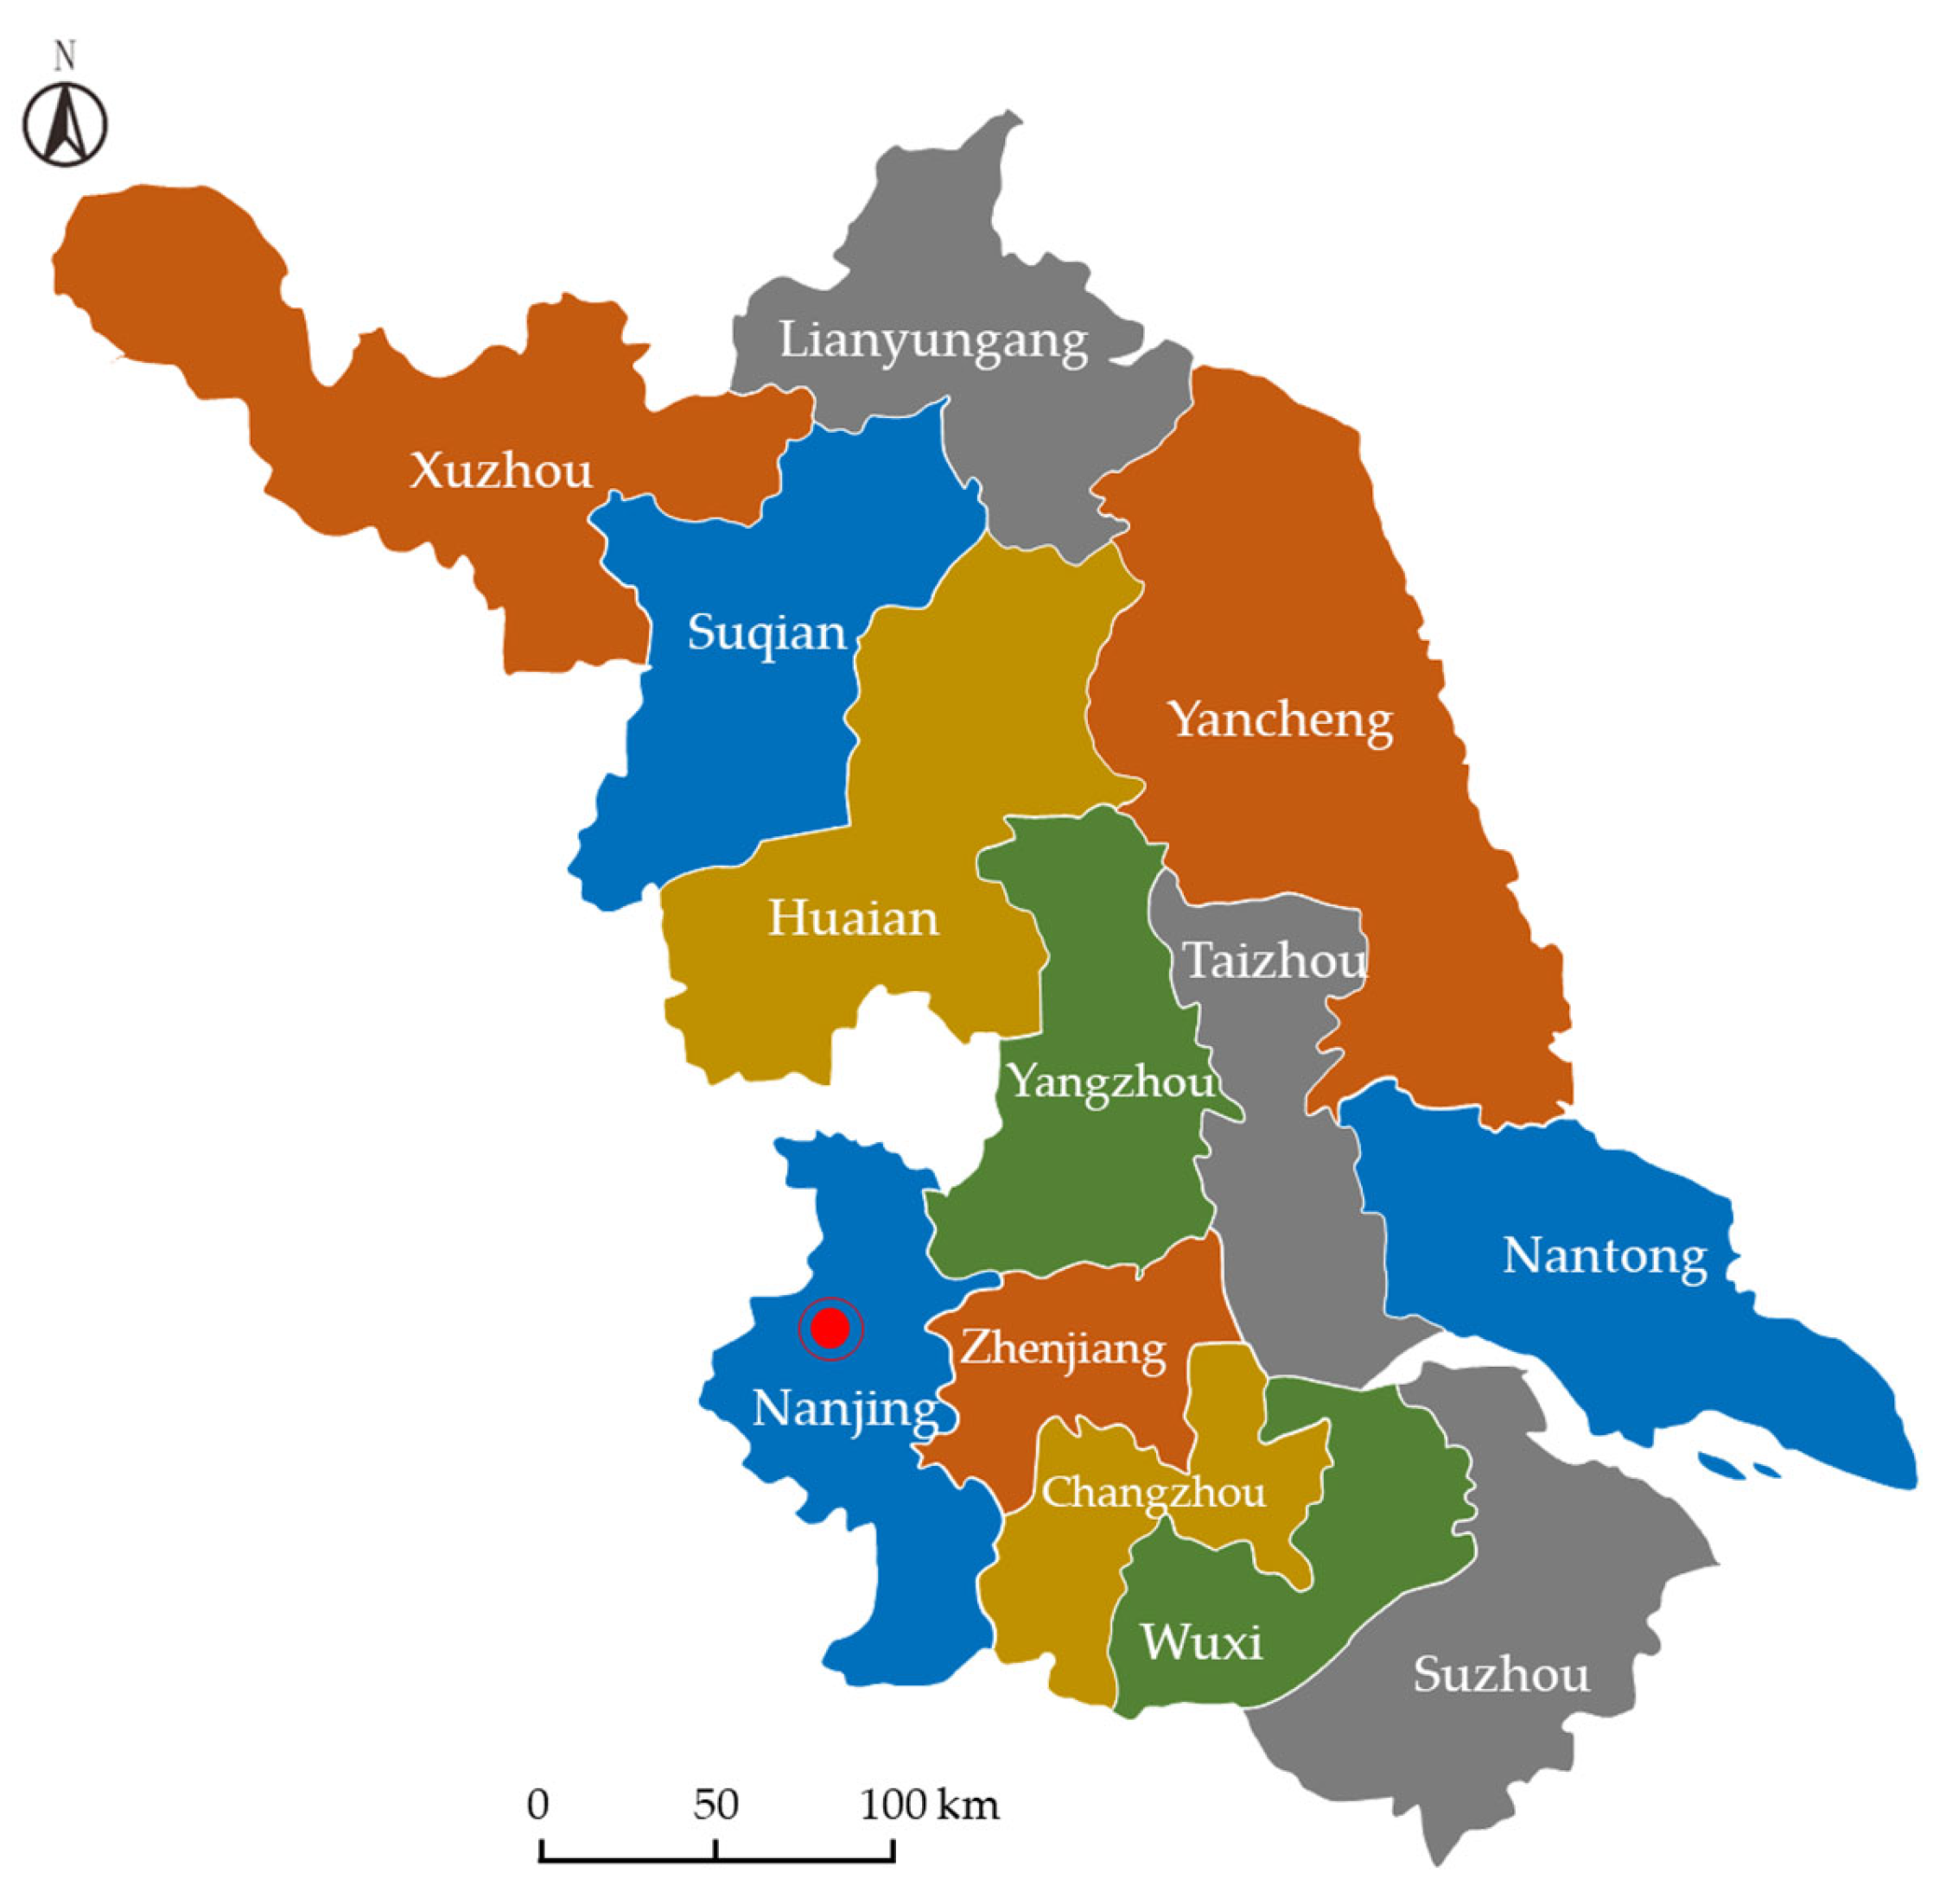
Jiangsu Province comprises thirteen prefecture-level cities (administering districts): Nanjing, Wuxi, Xuzhou, Changzhou, Suzhou, Nantong, Lianyungang, Huai’an, Yancheng, Yangzhou, Zhenjiang, Taizhou, and Suqian. Among these, Nanjing serves as the provincial capital.
Figure 4 illustrates the spatial distribution of the thirteen cities within Jiangsu Province.
To ensure data integrity, accuracy, consistency, and timeliness, the indicator data were sourced from authoritative publications including the China Urban Construction Statistical Yearbook 2024, the China Regional Economic Statistical Yearbook 2024, the Jiangsu Statistical Yearbook 2024, the Jiangsu Provincial Government Work Report 2024, and statistical yearbooks/socioeconomic development bulletins from all 13 prefecture-level cities. Where data were missing for specific cities or indicators, we implemented rigorous processing through the SPSS 27.0 software, employing mean imputation or linear interpolation methods after a comprehensive evaluation of the data-missing mechanisms.
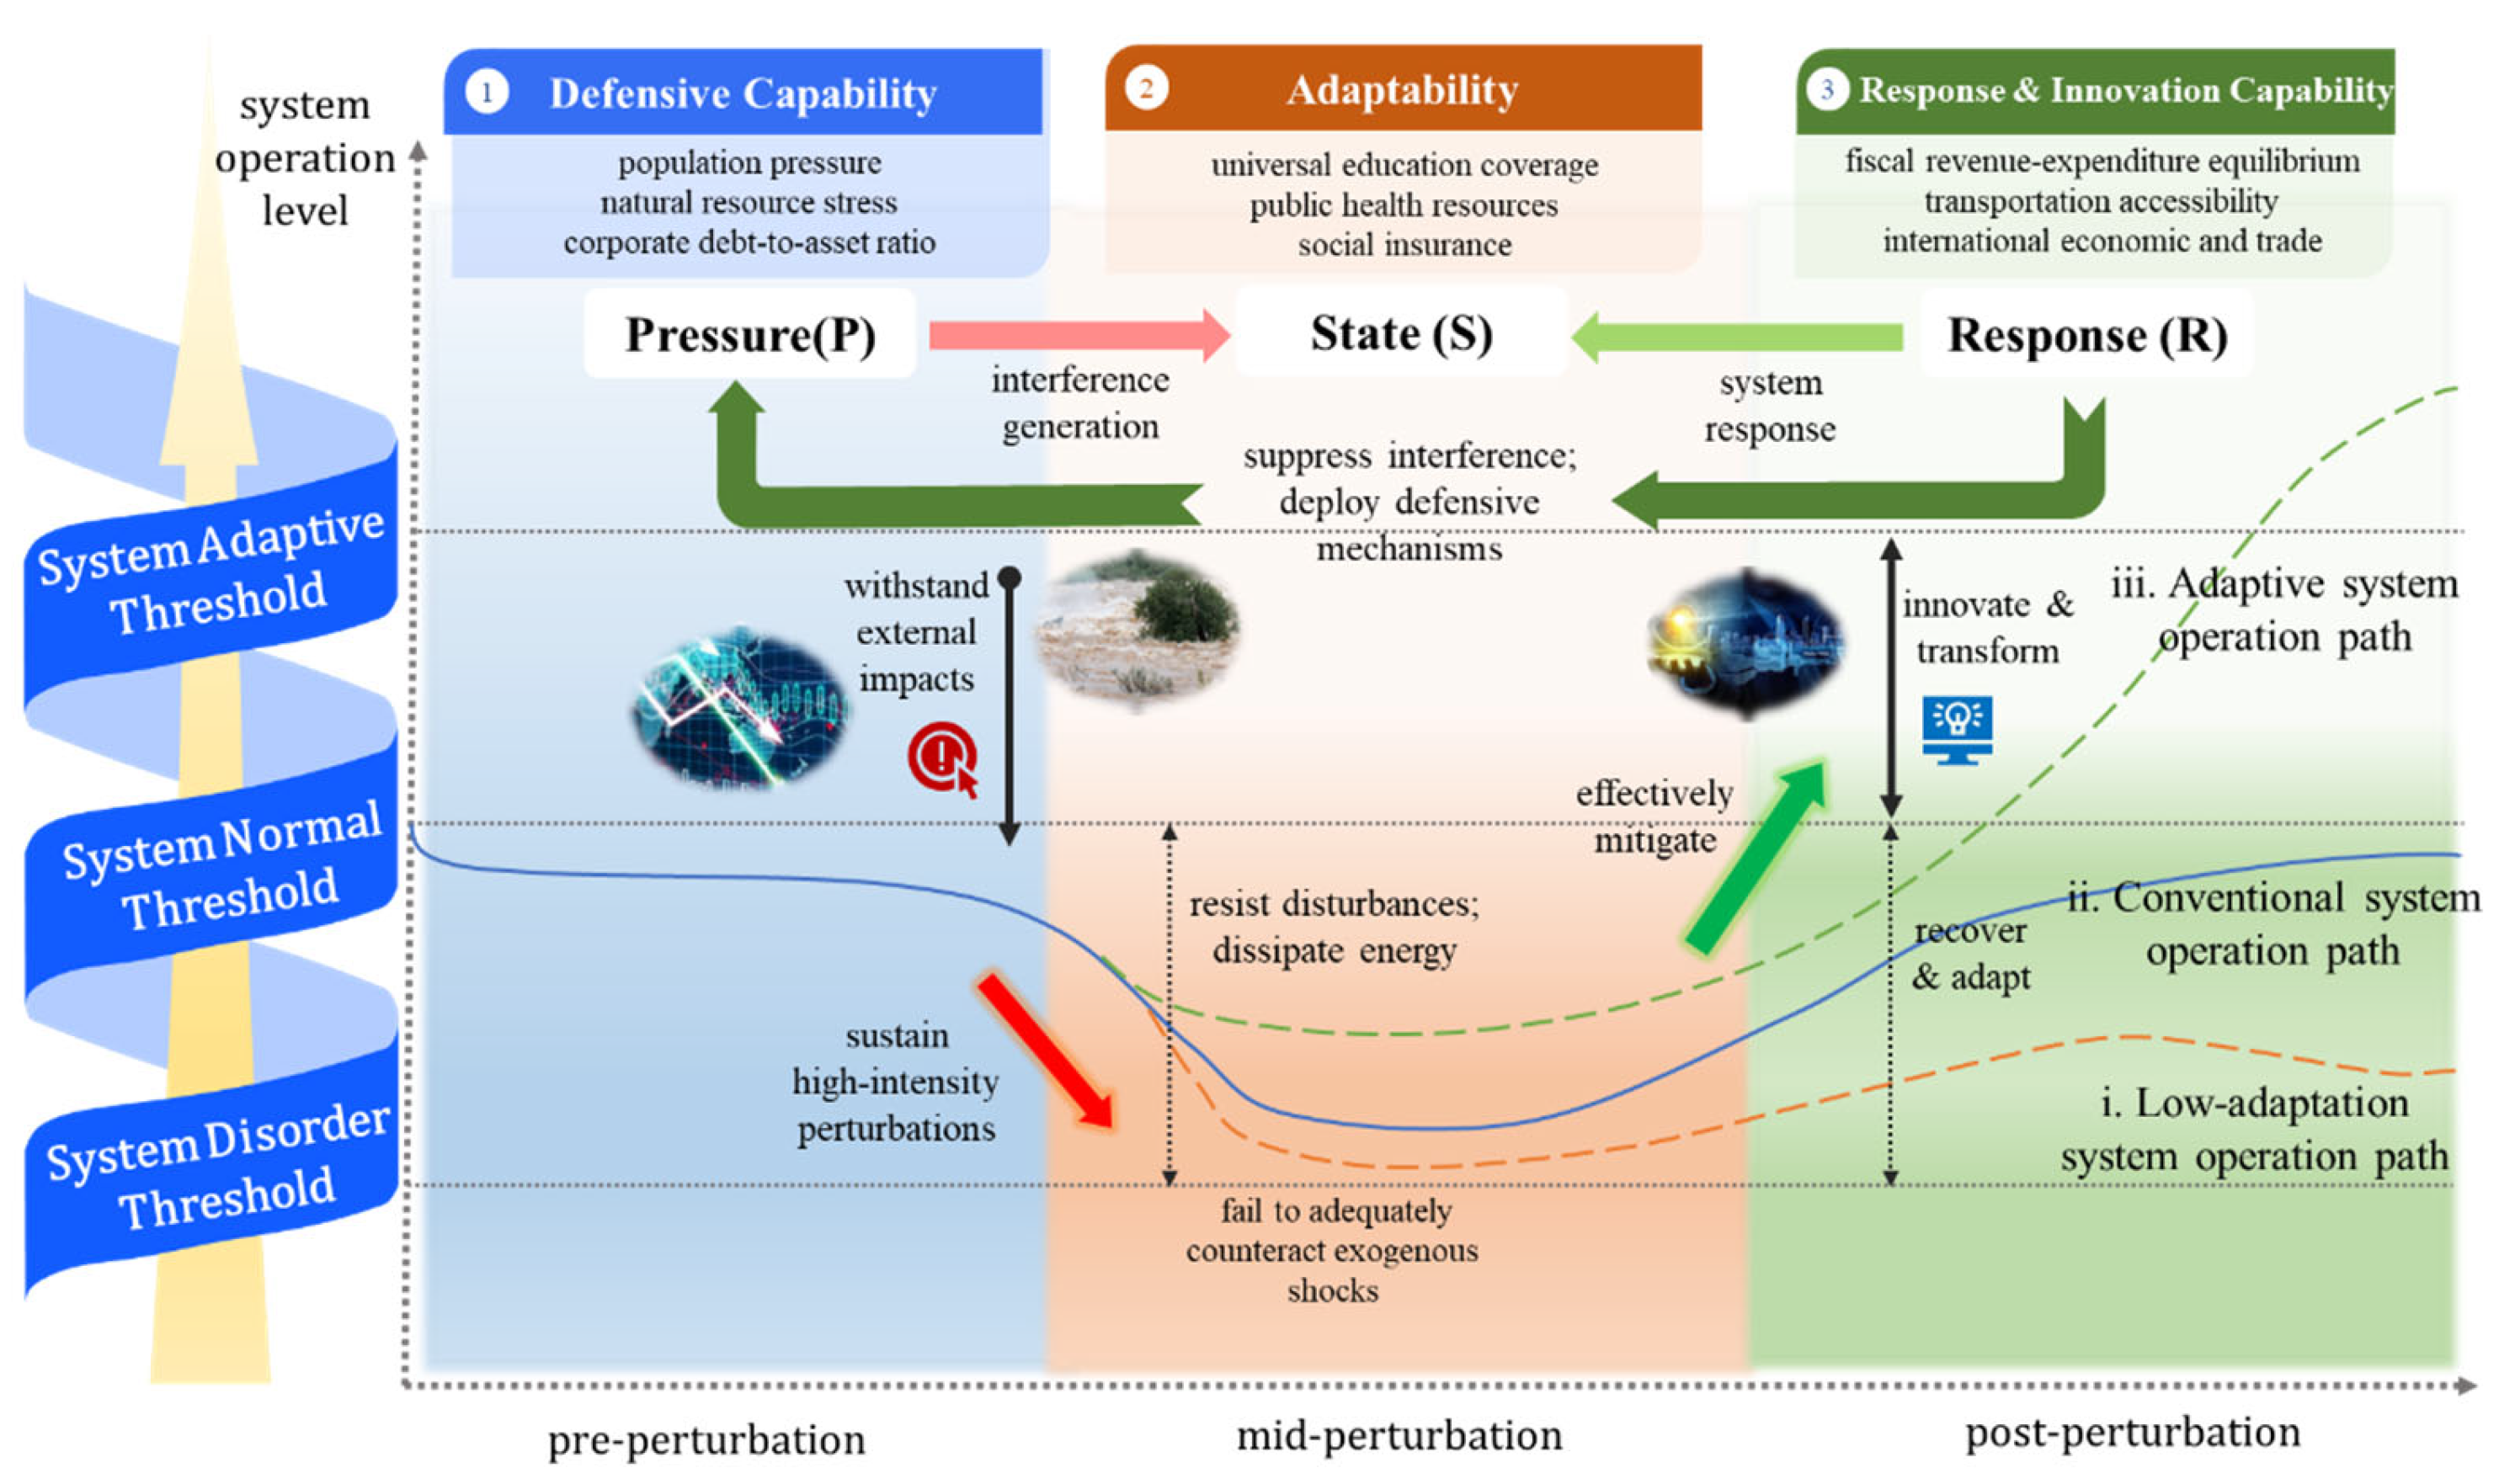
2.3. Construction of the Indicator System
Building upon the theoretical framework, the criterion layers are structured into three dimensions: the Pressure layer, the State layer, and the Response layer. Each criterion layer contains multiple indicators, collectively forming the comprehensive urban resilience evaluation system. The indicator screening process followed a rigorous methodological protocol: First, preliminary selection of 34 candidate indicators was conducted through bibliometric analysis, considering regional characteristics and data availability, supplemented by derivations from raw datasets. Where there were missing data from specific cities, differentiated imputation approaches were implemented based on the data characteristics. Using the SPSS 27.0 software, linear interpolation was applied to indicators with missing completely at random (MCAR) patterns. For missing not at random (MNAR) indicators, multiple imputations combining an Expectation–Maximization (EM) algorithm with industry averages was performed to ensure data integrity and unbiased estimation.
This study employs Pearson correlation coefficients to systematically examine indicator redundancy within each criterion layer, thereby mitigating multicollinearity interference among the indicators. The Pearson correlation coefficient is calculated as
where
xi and
yi represent the observed values of any two indicators under the same criterion layer,
and
denote their respective means, and
n indicates the number of city samples. Indicators demonstrating absolute correlation coefficients exceeding 0.9 are identified as exhibiting high collinearity and subsequently removed in accordance with data integrity principles.
In the correlation analysis of Pressure-dimension indicators, the absolute correlation coefficients between “commercial housing sales area density” and “population density”/“resident-to-registered population ratio” were 0.918 and 0.902, respectively. Given the strong influence of population scale and urbanization progress on commercial housing transactions, this indicator was therefore eliminated. Regarding State-dimension indicators, “per capita disposable income” exhibited absolute correlation coefficients of 0.946, 0.941, and 0.963 with “per capita GDP”, “patent application density”, and “basic pension insurance coverage rate”, respectively. Considering the direct driving effects of regional economic aggregates, social security, and innovation capacity on resident income, this indicator was removed. After two rounds of rigorous screening, a three-tier evaluation system comprising 32 indicators was finalized. All the variance inflation factors (VIFs) across dimensions remained below 5, satisfying model construction requirements.
Following indicator screening, the Pressure dimension (P) incorporates ten indicators: population density, built-up area ratio, resident population proportion, motor vehicle ownership per capita, per capita electricity consumption, industrial electricity consumption per unit output value, agricultural machinery power intensity, secondary–tertiary industry output ratio, and per capita residential floor area. These metrics collectively reflect population agglomeration pressures, industrial structure risks, and energy consumption challenges during urbanization [
62].
The State dimension (S) comprises eleven indicators: per capita GDP, GDP index, tertiary sector contribution to GDP, Engel coefficient, student–teacher ratio in primary/secondary schools, per capita hospital beds, per capita licensed physicians, per capita public library collections, patent application density, per capita deposit balance, and basic pension insurance coverage rate. This cluster evaluates urban systems’ inherent risk-resistance capacity and stability maintenance during disturbances [
63].
The Response dimension (R) includes eleven indicators: fiscal revenue–expenditure ratio to GDP, tax revenue to GDP ratio, total retail sales of consumer goods to GDP ratio, import–export volume to GDP ratio, per capita grain output, industrial enterprise operating profit margin, loan-to-deposit ratio, highway network density, and per capita passenger/freight volume. These parameters assess urban systems’ potential to achieve functional recovery and structural optimization through policy interventions, infrastructure development, and resource allocation. Detailed indicators are presented in
Table 2 [
64]. The positive or negative impact of each indicator on resilience is marked in the table.
2.4. Determination of Indicator Weights
2.4.1. Data Standardization
To eliminate dimensional heterogeneity interference in multi-indicator evaluation systems, this study employs Min-Max linear transformation for data standardization. Let the original data matrix be X = (xij)m×n, where m = 13 represents the 13 prefecture-level city samples in Jiangsu Province, and n = 32 denotes the screened three-level PSR indicator system.
For positive indicators (where higher values indicate enhanced system resilience), the standardization formula is defined as follows:
For negative indicators (where higher values reflect reduced system resilience), the standardization formula is
where
The standardized data preserve essential mathematical properties: order preservation, comparability, and boundedness. Through this processing, the Pressure–State–Response indicators are transformed into positive, dimensionless values within the [0, 1] interval.
2.4.2. Subjective Weight Determination via the Analytic Hierarchy Process (AHP)
The Analytic Hierarchy Process (AHP) was employed to ascertain subjective indicator weights. Initially proposed by American operations researcher Thomas L. Saaty in the 1970s, this method addresses multi-criteria weight allocation challenges in complex decision-making. Through expert judgments, the relative importance of hierarchical indicators can be quantified numerically. In a 1985 study on U.S. urban livability rankings, Saaty employed a six-expert panel comprising university professors, corporate executives, students, and other stakeholders. Through weighted geometric means of integrated judgment matrices, he demonstrated that multi-expert independent evaluations effectively counteracted subjective biases [
65]. In a 1994 review article, Saaty further emphasized that when expert participation reaches ≥5 individuals, the geometric mean matrix of group judgments significantly reduces individual random errors while maintaining the consistency ratio (CR) below critical thresholds [
66].
Considering the interdisciplinary research focus, eight experts specializing in urban planning and public policy were invited, all holding associate senior or higher professional titles with over a decade of practical experience, ensuring judgment professionalism and authority. Following Saaty’s 1–9 scale method, experts conducted pairwise importance comparisons among same-level indicators to construct judgment matrices. The scaling rules are defined as: 1 (equally important), 3 (moderately more important), 5 (strongly more important), 7 (very strongly more important), 9 (extremely more important), with even values representing intermediate judgments. The judgment matrix configuration is presented in
Table 3.
To mitigate extreme value interference, this study adopts the geometric mean method to aggregate individual expert judgment matrices into a group consensus matrix. Based on the group judgment matrix, the eigenvector method is employed to derive the weight vectors of the criteria, concurrently calculating the maximum eigenvalue
λmax (computational procedures detailed in
Appendix A.1).
To verify the judgment matrix’s logical consistency, the Consistency Index (CI) and Consistency Ratio (CR) were computed:
where
RI denotes the Random Index, whose values depend on the matrix order
k (see
Table 4). A
CR value below 0.1 indicates an acceptable consistency; otherwise, the expert scoring requires recalibration. In this study, all three criterion-layer judgment matrices passed the
CR threshold.
2.4.3. Objective Weight Determination via the Entropy Weight Method
The Entropy Weight Method (EWM), grounded in information entropy theory, serves as an objective weighting approach that quantifies the data dispersion degrees to determine the indicator weights, thereby circumventing subjective judgment biases. This study independently applies the EWM to the Pressure (P), State (S), and Response (R) dimensions to calculate objective weights, ensuring intra-dimensional weight allocation independence while preventing cross-dimensional interference. Let standardized data matrices for each criterion layer be defined as
where
x′
∗,ij ∈ [0, 1] denotes standardized values, with subscript
i representing cities (
i = 1, 2, …, 13) and
j indicating the indicator sequence within each dimension.
Weight calculation proceeds via a three-stage process: initially, the information entropy value of each criterion is computed, followed by derivation of the divergence coefficients to quantify discrete variations among the indicators and concluding with normalization to obtain the final weights. The complete computational workflow is detailed in
Appendix A.2.
2.4.4. Combined Weighting Method
In multi-criteria decision-making research, subjective weighting methods relying on expert knowledge can capture the theoretical importance of indicators but remain susceptible to cognitive biases. Conversely, objective weighting methods based on data statistics circumvent human interference but may overlook practical significance. To synthesize their respective strengths, this study adopts a combined weighting approach.
For weight vectors generated by AHP and Entropy methods within the same criterion layer, a coefficient
α ∈ [0, 1] is introduced to calculate comprehensive indicator weights through
where
WΛ,j = combined weight of indicator j in dimension Λ (Λ ∈ {P, S, R}, representing the Pressure, State, and Response dimensions);
wAHPΛ,j = subjective weight from the Analytic Hierarchy Process;
wEntropyΛ,j = objective weight from the Entropy Weight Method.
This study equalizes methodological contributions by setting α = 0.5.
Assuming equilibrium contributions of Pressure (
P), State (
S), and Response (
R) dimensions to urban resilience, the global weight vector integrating all criterion layers is formulated as
where ⊕ denotes the vector concatenation operation.
2.5. TOPSIS Comprehensive Evaluation Model
This study employs the Technique for Order Preference by Similarity to Ideal Solution (TOPSIS) method for urban resilience assessment. Originally proposed by Hwang and Yoon in 1981, TOPSIS is a multi-attribute decision-making technique based on distance measurement that ranks evaluation objects by calculating their relative closeness to idealized positive and negative benchmark solutions [
67]. Compared with conventional evaluation methods, TOPSIS effectively handles complex indicator systems with multiple dimensions and measurement units while intuitively demonstrating the evaluation objects’ deviation from optimal and inferior states. The method demonstrates strong compatibility with multi-dimensional information integration scenarios. Aligned with the comprehensive and hierarchical characteristics of urban resilience assessment, this research constructs a PSR-framework-based TOPSIS model.
First, Hierarchical Weighted Matrices are constructed. For the standardized matrix
X′ = (
x′
ij)
13×32, where the Pressure (
P), State (
S), and Response (
R) dimensions contain 10, 11, and 11 indicators, respectively, hierarchical weighted matrices are defined via the Hadamard product for each dimension Λ ∈ {
P,
S,
R}, with the combined weight vectors
WΛ satisfying ∑
j∈ΛWΛ,j = 1:
Next, the Ideal Solutions per Dimension is determined. For each dimension Λ, positive and negative ideal solutions
VΛ+ and
VΛ− are defined based on the indicator directionality:
Then, weighted Euclidean distances between cities and ideal solutions are computed for dimension Λ:
The dimension-level closeness coefficient for city
i is calculated:
Global closeness coefficients are then synthesized considering equal resilience contributions from the P-S-R dimensions as defined in the weight analysis:
2.6. Obstacle Degree Calculation Model
This study introduces an obstacle degree model to identify critical indicators constraining urban resilience enhancement. The model quantifies the indicators’ deviation from ideal states and calculates their contribution to systemic obstacles through integrated weights. For the standardized matrix
X′ = (
x′
ij)
13×32, the deviation degree
Oij is defined as the gap between actual values and the full ideal state (
x′
ij = 1):
Using the combined weights
Wj from the integrated weighting method, the obstacle factor
Fij is formulated as the product of the weight and the deviation. Higher values indicate more pronounced shortboard effects:
To eliminate inter-city total obstacle variations, the obstacle percentage Obstacle
ij is defined as indicator
j’s contribution ratio to city
i’s total obstacles:
Finally, ranking Obstacle values per city identifies and facilitates in-depth analysis of critical resilience-constraining factors.
5. Conclusions and Recommendations
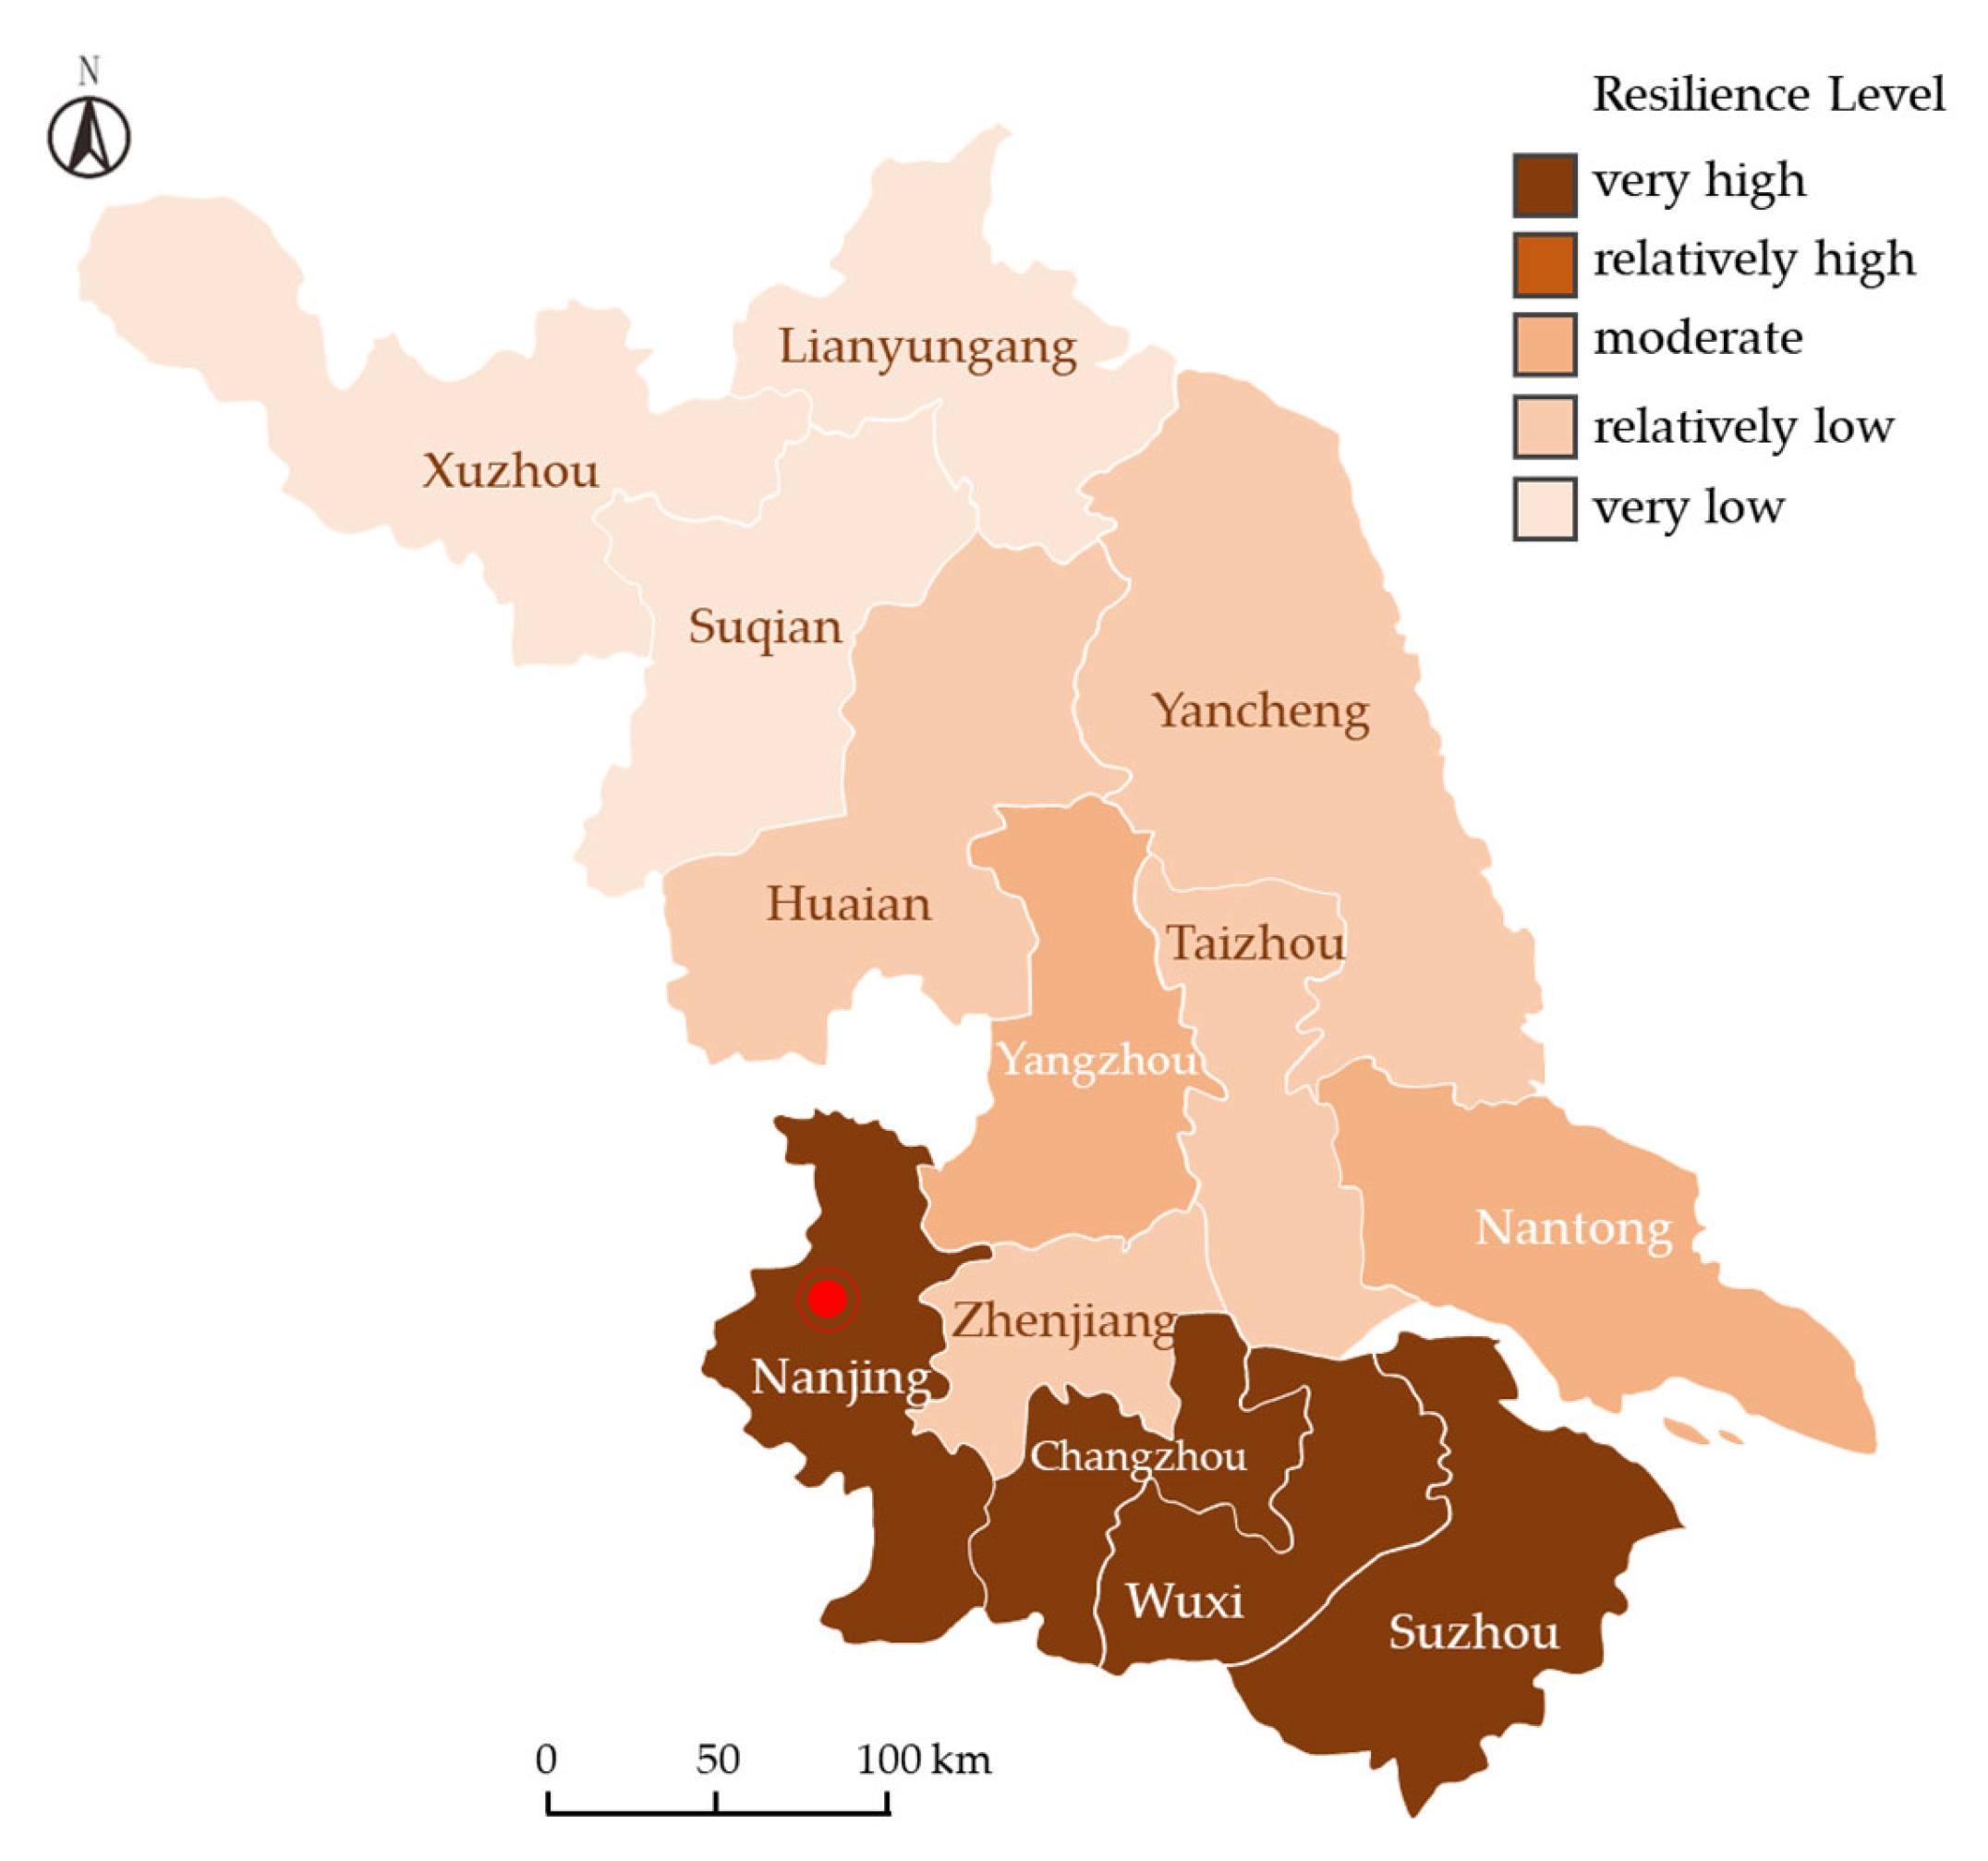
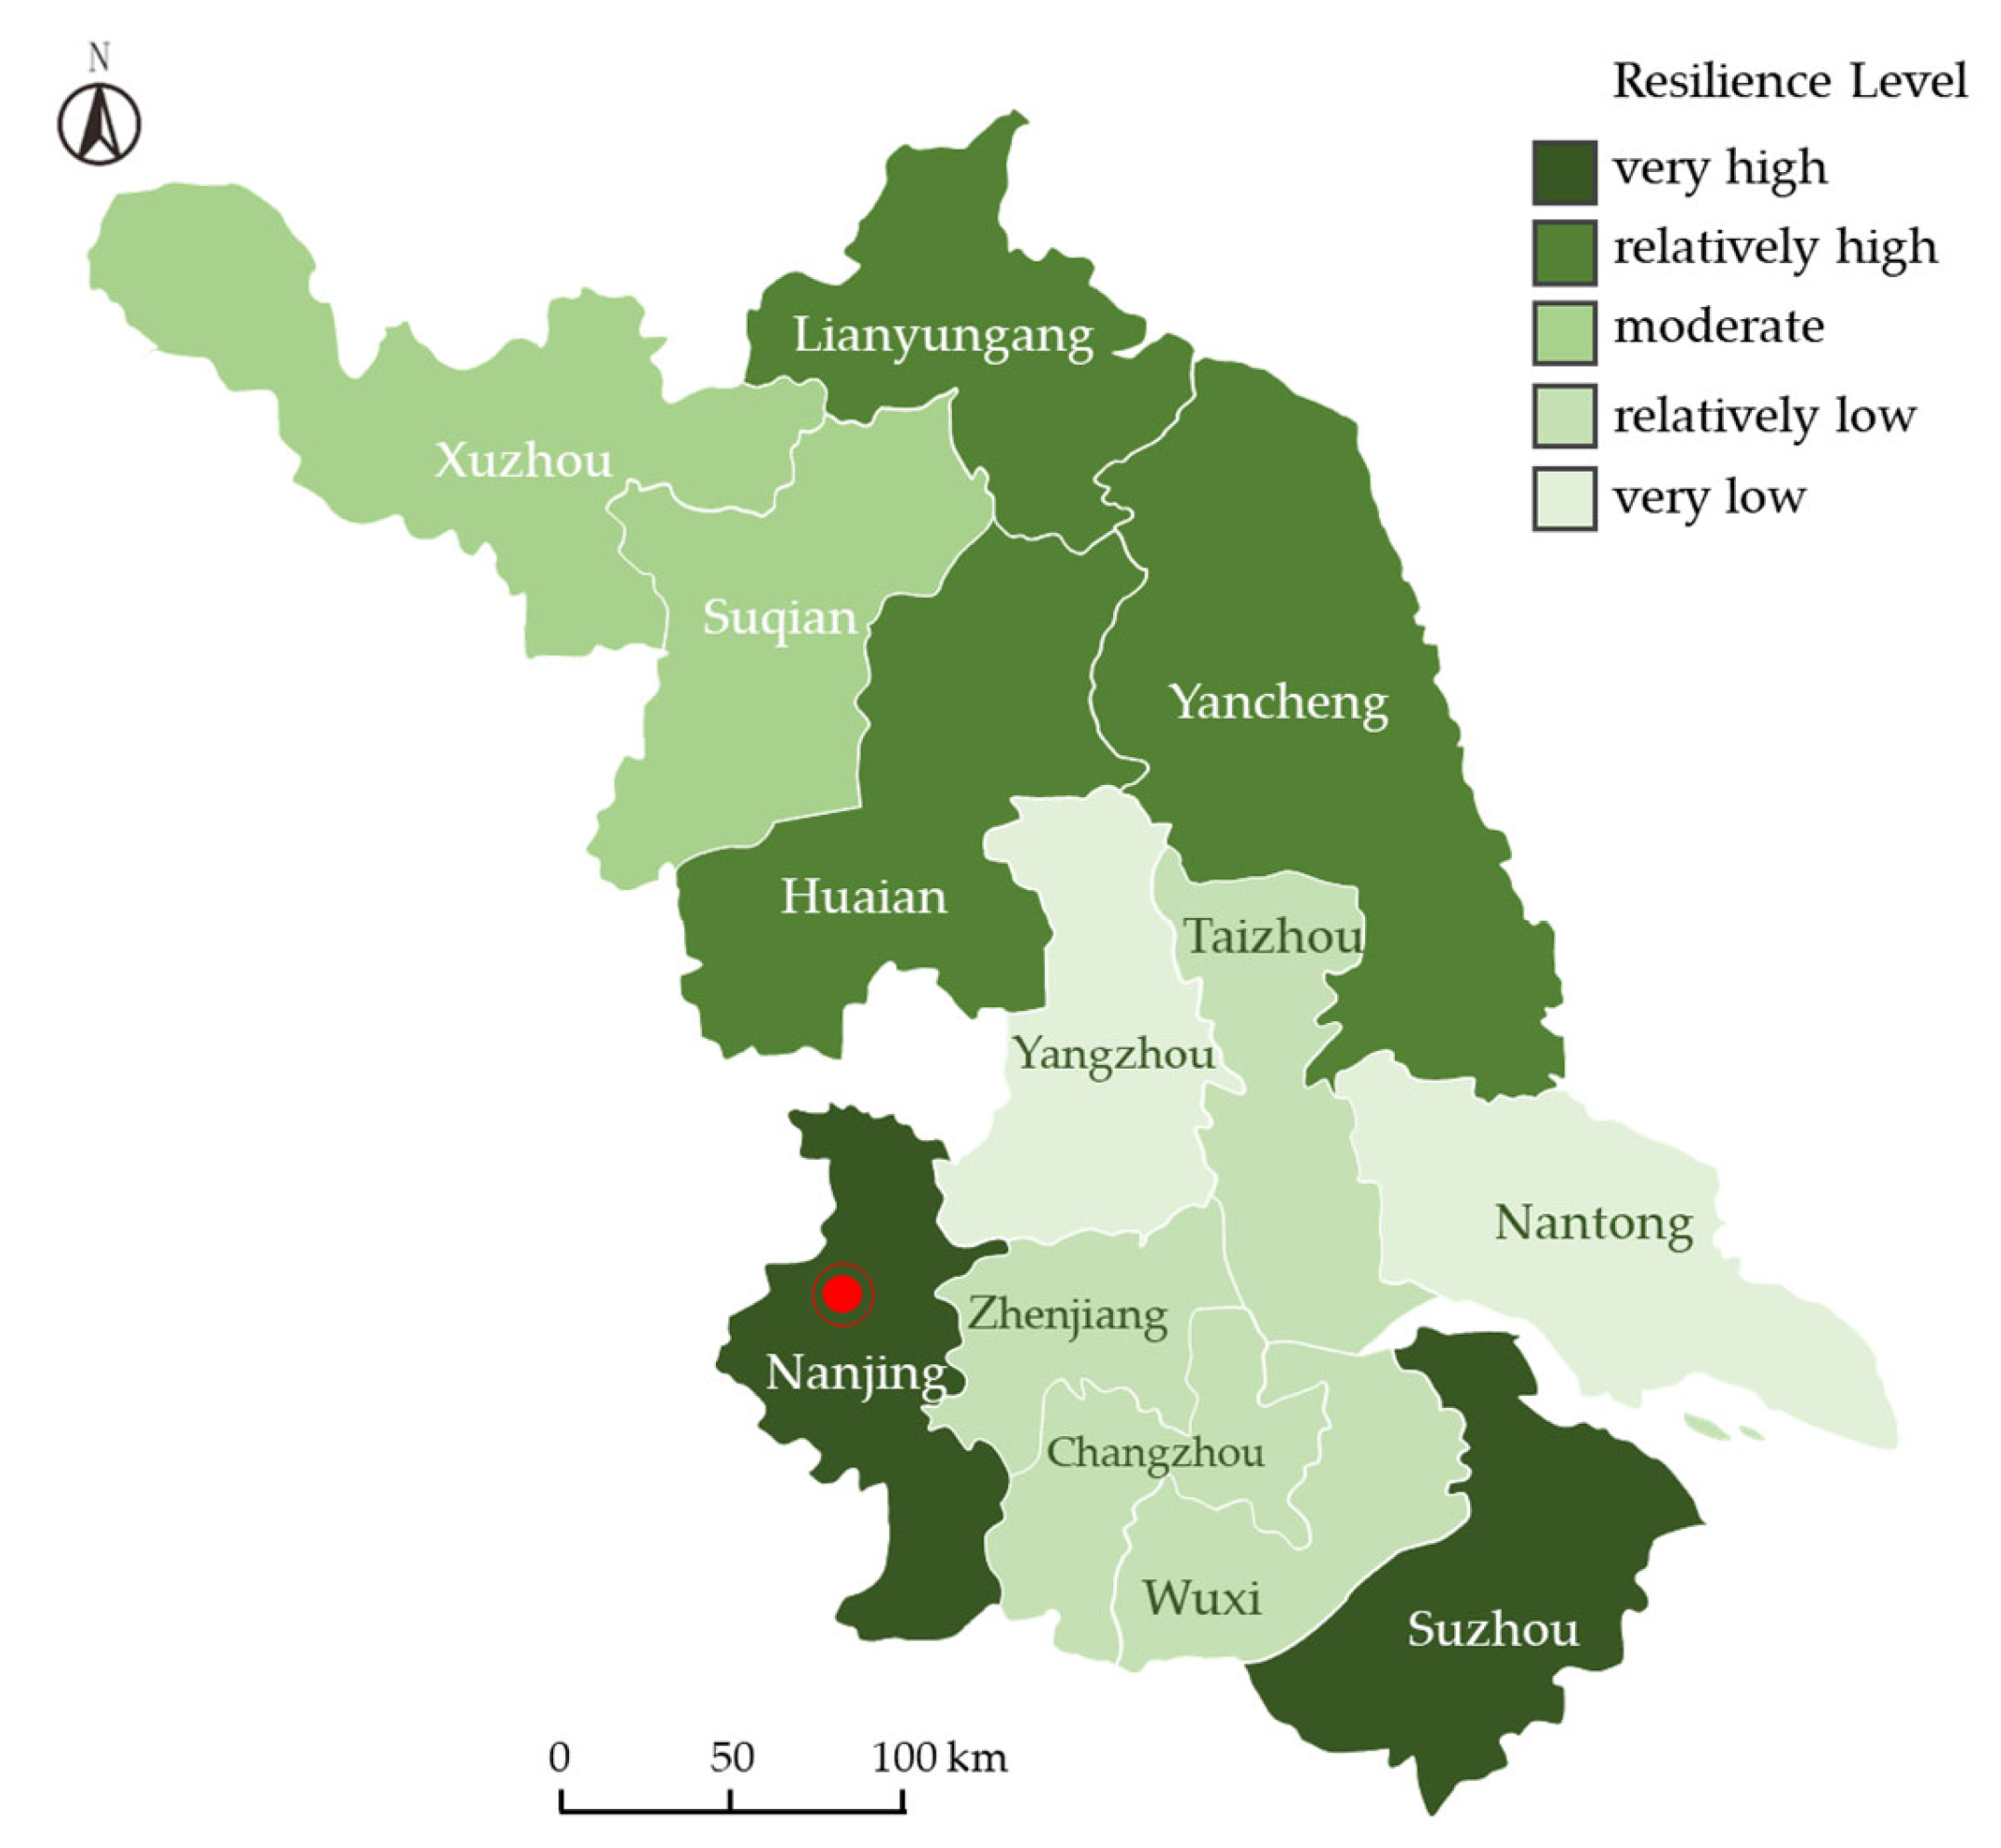
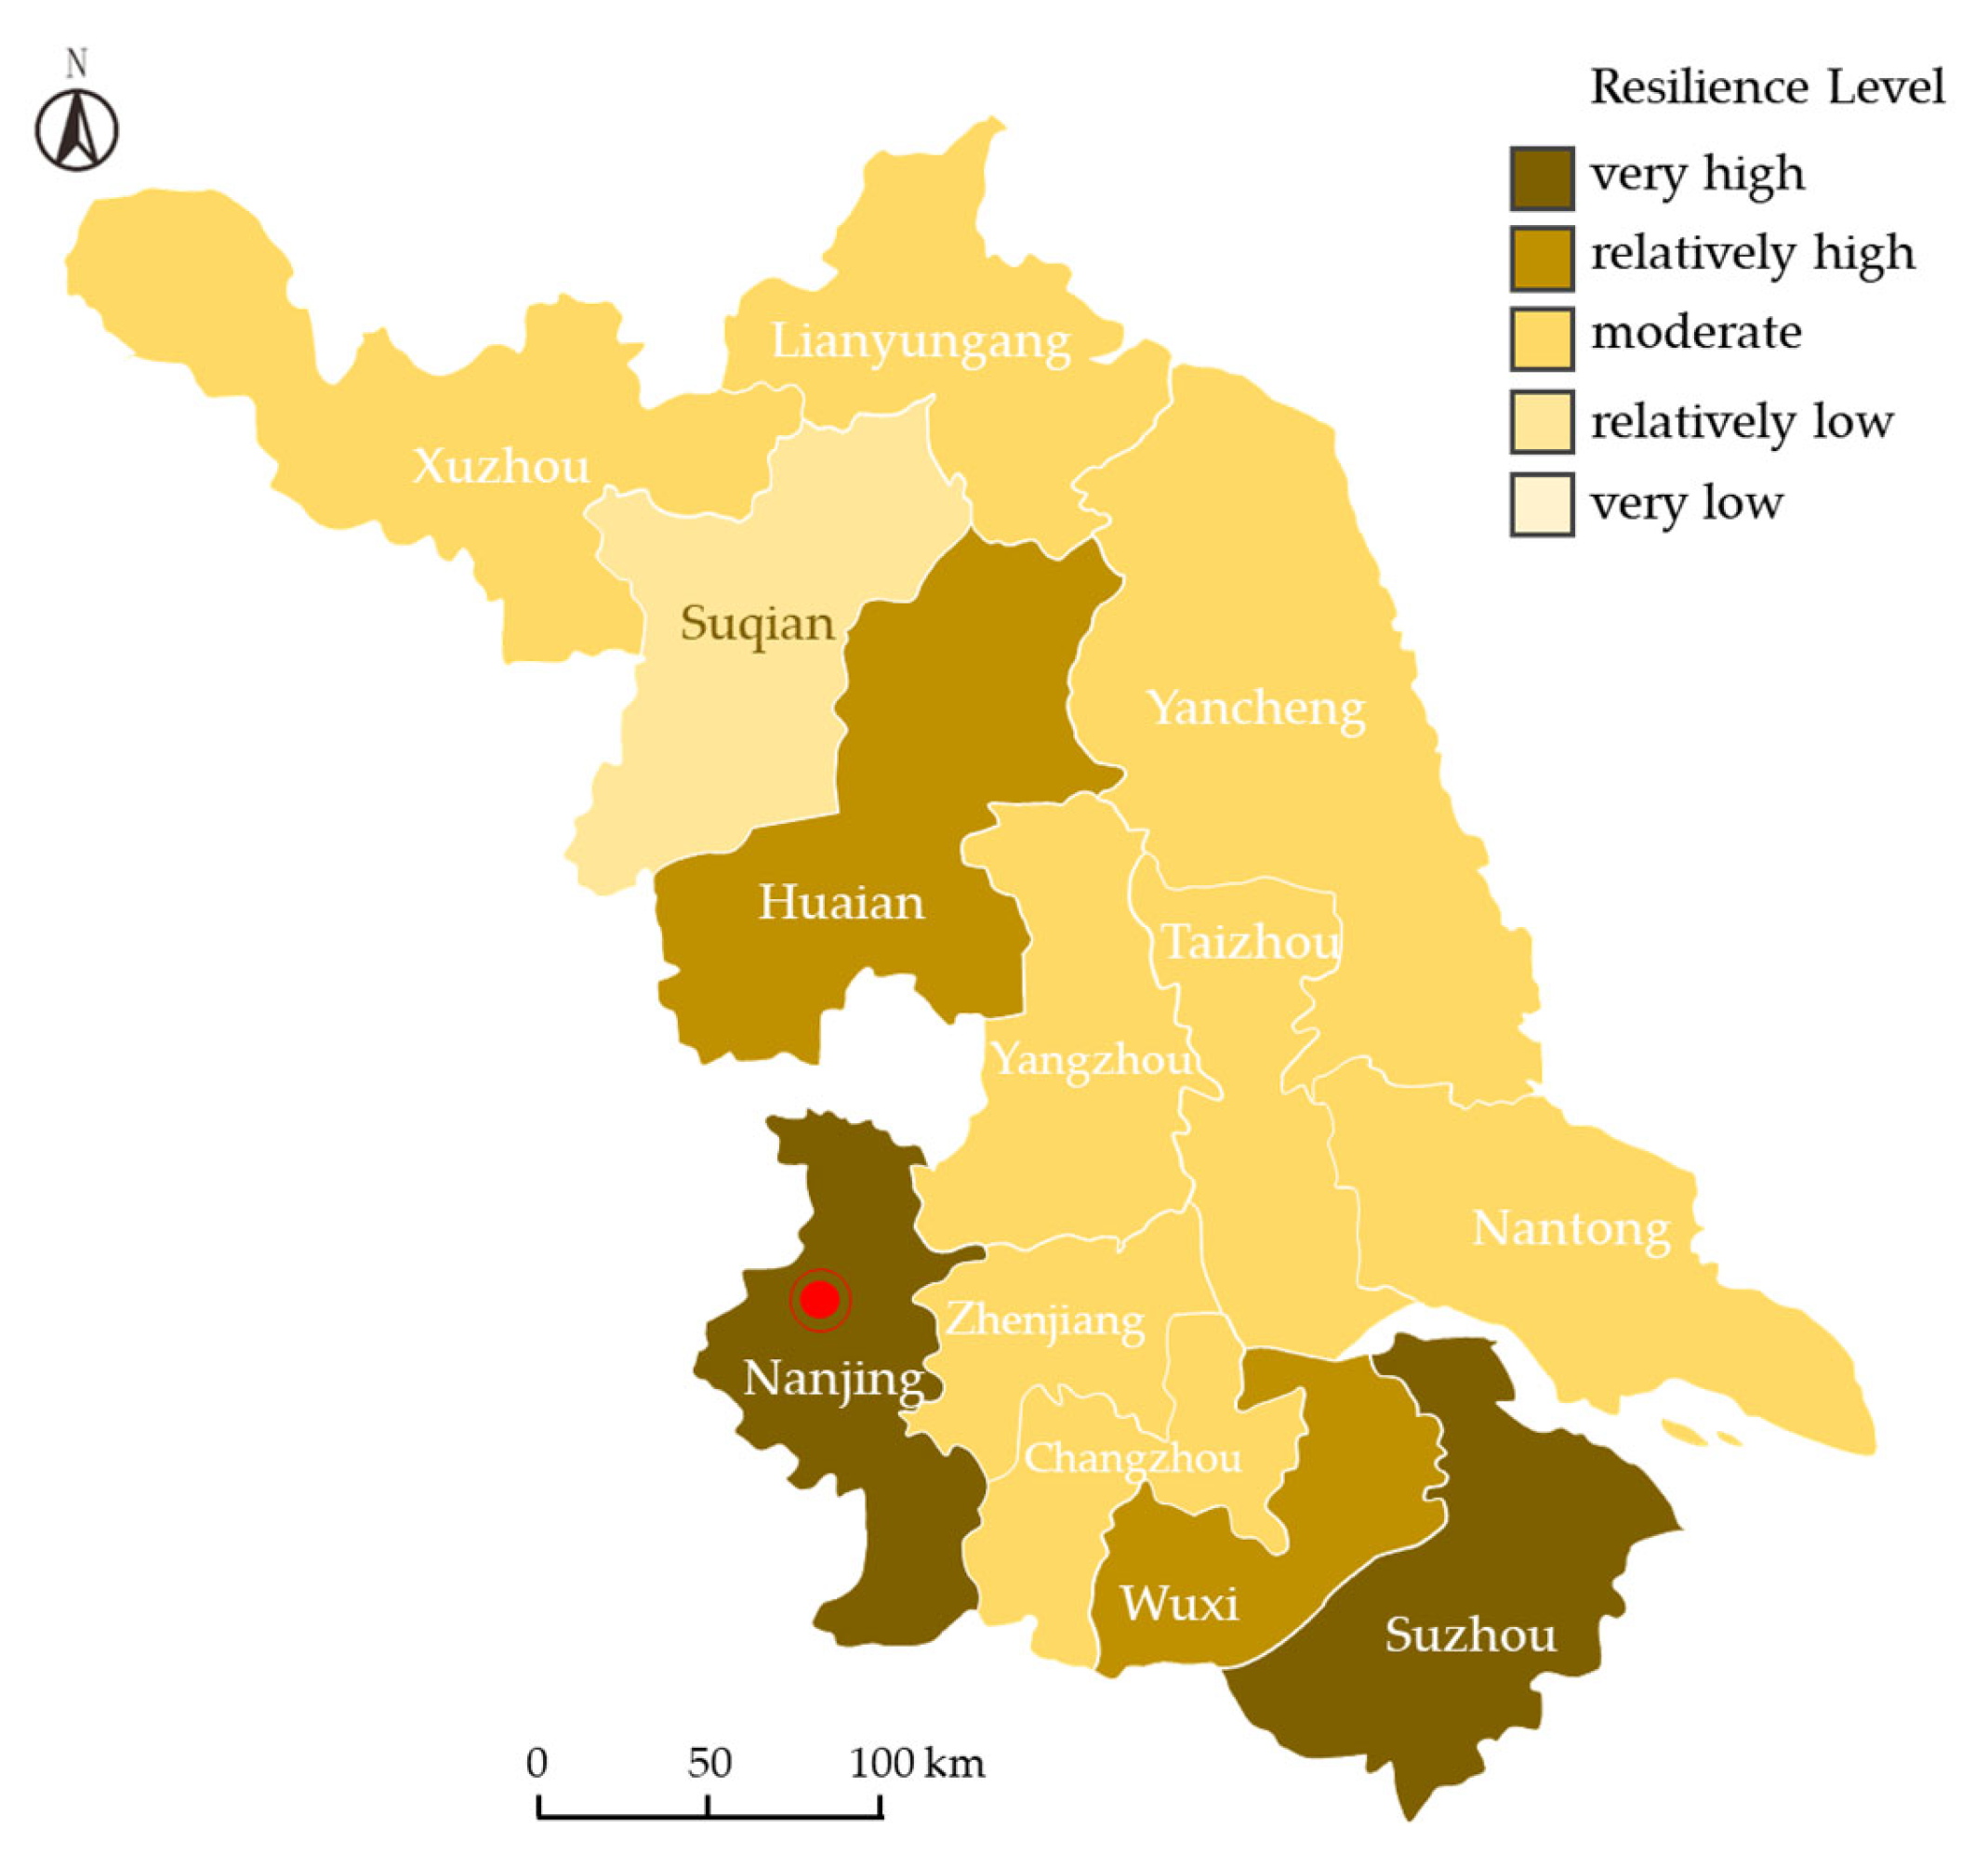
As a developed coastal province in eastern China, Jiangsu exhibits pronounced north–south gradient disparities in comprehensive urban resilience, with Southern Jiangsu cities demonstrating markedly higher resilience levels than their northern counterparts. Through the PSR-TOPSIS modeling framework, these disparities emerge from dynamic interactions across the Pressure–State–Response dimensions. High-resilience cities such as Nanjing, Suzhou, and Wuxi in Southern Jiangsu exhibit superior performance in the State and Response dimensions, leveraging robust economic foundations, innovation capacities, and fiscal resources to construct effective risk-resistant mechanisms. The crux lies in establishing a virtuous cycle that simultaneously alleviates pressures and fortifies responsive capacities. Conversely, Northern Jiangsu cities like Suqian and Xuzhou face systemic fragility due to mono-industrial structures, insufficient social security, and infrastructure deficiencies.
Evolutionary pathways for risk resistance diverge across resilience tiers. High-resilience cities can establish positive feedback mechanisms through stress mitigation and response enhancement, enabling transitions to higher-order stability. Medium-resilience cities exhibit constrained capacity for transforming accumulated strengths into systemic resilience due to internal coordination deficits. Low-resilience cities struggle to alleviate severe shocks due to compounded vulnerabilities from multi-factor negative synergies.
From the perspective of the Pressure dimension, industrial structure imbalances, demographic pressures, and energy consumption intensity constitute primary stressors constraining urban resilience. Southern Jiangsu alleviates resource–environmental pressures through tertiary-industry-led structural optimization, while Northern Jiangsu’s reliance on traditional industrial models undermines its systemic disturbance resistance. In the State dimension, medical resource shortages and innovation capacity deficits represent province-wide systemic vulnerabilities. Inadequate investments in public health and technological innovation exacerbate these weaknesses. In the Response dimension, inefficient fiscal expenditure allocation and insufficient open-economy resilience emerge as critical bottlenecks. Even cities with substantial fiscal inputs fail to convert resources into effective risk-countering capacities due to suboptimal allocation strategies.
The obstacle degree model identifies fiscal expenditure efficiency, medical resource allocation, and innovation-driven capacities as three core constraints. Research confirms that single-dimensional advantages cannot sustain systemic resilience, necessitating functional upgrading through cross-element synergy. For instance, Nanjing’s substantial fiscal investments yield limited responsiveness due to inefficient utilization. Suzhou and Wuxi’s innovation capacities are structurally constrained by technology transfer inefficiencies and insufficient regional synergy, thus failing to fully harness innovation dividends, while pervasive knowledge silos impede technological diffusion; concurrently, cities in Northern Jiangsu exhibit a significant developmental lag in public service equalization.
Methodologically, integrated weighting effectively balances subjective–objective deviations, while TOPSIS modeling and obstacle diagnostics enhance the analytical rigor. These findings provide empirical foundations for resilience governance in the Yangtze River Delta urban agglomeration, revealing structural contradictions in current urban management practices. The study offers actionable insights for cross-regional collaborative governance, innovation-driven development, and risk-mitigation strategies. We propose the following actionable strategies:
Refine fiscal fund performance evaluation systems by incorporating resilience enhancement metrics into government budget assessments. For cities like Nanjing and Suzhou with high fiscal expenditure ratios yet low efficiency, prioritize funding allocations to resilience-critical sectors, including public health and emergency infrastructure, within defined thresholds while reducing inefficient administrative expenditures. Northern Jiangsu cities should focus on strengthening medical and transportation infrastructure deficiencies.
In cities with subpar medical resources like Xuzhou and Suqian, enhance grassroot service capacities through tiered support systems in which provincial tertiary hospitals partner with township clinics, complemented by telemedicine coverage. Incentivize south-to-north medical resource flows by offering professional title evaluation bonuses and housing subsidies for physicians practicing in the northern regions.
Establish technology transfer centers in innovation hubs to diffuse patented technologies to underperforming regions. Provide tax incentives and innovation subsidies for SMEs in Northern Jiangsu. Support coastal port cities like Yancheng and Lianyungang in developing marine economy pilot zones and port-adjacent industrial innovation clusters.
For cities with low demographic pressures like Yangzhou and Taizhou, enhance migrant integration through affordable housing provision and vocational skills training. In cities experiencing resident-registered population imbalances like Wuxi and Changzhou, incorporate resilience-building metrics (e.g., community emergency training participation) into points-based household registration systems.
Establish a Yangtze River Delta import–export risk monitoring platform to intensify the supply chain surveillance for export-dependent cities like Suzhou and Nantong. Improve enterprise credit insurance mechanisms to mitigate exchange-rate volatility impacts on SMEs. Support Yancheng and Lianyungang in diversifying export markets to reduce single-market dependency risks.
Implement tiered energy-saving retrofit programs for high-consumption industries in Xuzhou and Zhenjiang, recognizing compliant enterprises as low-carbon exemplars. Establish pilot carbon quota trading systems in steel and chemical sectors, allocating saved quotas to fund enterprise resilience infrastructure.
This study’s methodological framework exhibits significant potential for international dissemination. The PSR framework accommodates complex system analyses across diverse scales; through flexible indicator system adjustments, it can be adapted to ecological resilience assessments or climate adaptation research in global cities ranging from European–American to Southeast Asian contexts. The distance measurement approach of the TOPSIS model—being independent of region-specific statistical standards—enables cross-regional comparative analyses of urban resilience after appropriate calibration. For instance, applications for African cities could employ TOPSIS and barrier diagnosis models to identify critical constraints within water scarcity and urbanization processes, thereby providing evidence-based analytical toolkits for global urban resilience governance.
This study acknowledges several limitations warranting further research. First, the reliance on static statistical yearbook data may inadequately capture dynamic socioeconomic transitions, with real-time impacts of industrial restructuring insufficiently reflected. Second, the Pressure–State–Response model’s assumption of equal dimensional weighting potentially obscures nonlinear feedback mechanisms within systems, limiting its explanatory power for cities with institutional misalignments. Third, risk factors such as natural disasters and industrial accidents remain underrepresented in the indicator system. Future research should extend the temporal dimensions by integrating real-time monitoring data to enhance timeliness, develop dynamic weighting models to accommodate resilience evolution patterns across development stages, and refine the assessment framework through ecological safety and public security indicators. Cross-provincial comparative validation of the model’s generalizability and an analysis of residents’ collective behavioral impacts on systemic resilience constitute additional critical avenues.


