Abstract
Ecological security patterns (ESPs) are fundamental to safeguarding regional ecological integrity and enhancing human well-being. Consequently, research on conservation and restoration in critical regions is vital for ensuring ecological security and optimizing territorial ecological spatial configurations. Focusing on the Henan section of the Yellow River Basin, this study established the regional ESP and conservation–restoration framework through an integrated approach: (1) assessing four key ecosystem services—soil conservation, water retention, carbon sequestration, and habitat quality; (2) identifying ecological sources based on ecosystem service importance classification; (3) calculating a comprehensive resistance surface using the entropy weight method, incorporating key factors (land cover type, NDVI, topographic relief, and slope); (4) delineating ecological corridors and nodes using Linkage Mapper and the minimum cumulative resistance (MCR) theory; and (5) integrating ecological functional zoning to synthesize the final spatial conservation and restoration strategy. Key findings reveal: (1) 20 ecological sources, totaling 8947 km2 (20.9% of the study area), and 43 ecological corridors, spanning 778.24 km, were delineated within the basin. Nineteen ecological barriers (predominantly located in farmland, bare land, construction land, and low-coverage grassland) and twenty-one ecological pinch points (primarily clustered in forestland, grassland, water bodies, and wetlands) were identified. Collectively, these elements form the Henan section’s Ecological Security Pattern (ESP), integrating source areas, a corridor network, and key regional nodes for ecological conservation and restoration. (2) Building upon the ESP and the ecological baseline, and informed by ecological functional zoning, we identified a spatial framework for conservation and restoration characterized by “one axis, two cores, and multiple zones”. Tailored conservation and restoration strategies were subsequently proposed. This study provides critical data support for reconciling ecological security and economic development in the Henan Yellow River Basin, offering a scientific foundation and practical guidance for regional territorial spatial ecological restoration planning and implementation.
1. Introduction
Amid socioeconomic development and intensified human activities, ecological degradation, resource depletion, and biodiversity loss are escalating globally, posing threats to ecological security [1]. We define ecological security narrowly as ecosystem integrity—reflecting systemic health and stability. Broadly conceived, it encompasses the capacity of ecosystems to sustain human well-being and socioeconomic resilience [2,3]. As an integral component of ecological civilization, national ecological security demands strategic prioritization [3]. Structurally, ecological security patterns comprise habitat patches interconnected by functional corridors [4]; optimizing these patterns is critical for safeguarding regional ecological stability.
Research on ecological security patterns globally focuses on land-use optimization [5], landscape security refinement [6], and ecological network construction [7]. This field has evolved from theoretical conceptualization to quantitative pattern analysis and establishes a paradigm of ‘ecological sources–resistance surface–ecological corridors’ for regional security frameworks through corridor extraction [4]. Ecological corridors—functioning as linear connectors between habitat patches—facilitate material/energy exchange and serve as critical conduits for species migration and dispersal [8], thereby maintaining regional ecological security and biodiversity. Key corridor extraction methodologies include: (i) minimum cumulative resistance (MCR) modeling [9,10]; (ii) hydrological analysis [11,12]; (iii) circuit theory applications [13,14]. The MCR approach identifies least-cost paths (LCPs) between sources via ArcGIS 10.8’s cost-path tool. However, it requires iterative computations, generates redundant corridors [15], and neglects biological stochasticity—limiting identification of critical nodes. Hydrological methods delineate corridors through valley line extraction from cumulative cost surfaces, where low-resistance drainage basins indicate ecological nodes [12]. Circuit theory models analyze resistance dynamics in ecological flows using physics principles to pinpoint network barriers [13,14]. Linkage Mapper advances corridor identification by [15,16] (i) automatically removing redundant paths via MCR principles; (ii) generating width-attributed corridors; (iii) incorporating spatial barrier data for node detection (beyond corridor intersections). This tool leverages random walk behavior of electrons to model species movement, providing biologically aligned pathway predictions that enhance ecological network efficiency [17,18]. Notably, existing studies often constrain analyses within administrative boundaries [19], despite ecological security dynamics transcending jurisdictional limits. Effective pattern construction requires integrating broader natural spatial factors [4].
Recent research prioritizes constructing ecological networks based on the landscape ecology framework of ‘ecological sources–resistance surface–ecological corridors’ to identify key ecological restoration areas. Guo et al. applied this framework to establish an ecological security pattern and identify critical restoration zones in the Huaihe River Basin [20]. Similarly, Li et al. utilized InVEST and minimum cumulative resistance (MCR) models to delineate ecological sources, construct resistance surfaces, and extract corridors, building an ecological security pattern for the urban agglomeration on the northern slope of the Tianshan Mountains, Xinjiang [21]. The accuracy of ecological corridor extraction depends critically on precise source identification and resistance surface construction. Current methods for delineating ecological sources include protected area designation [22], Morphological Spatial Pattern Analysis (MSPA) [7], and ecosystem service functionality assessment [23]. Among these, selecting high-suitability patches through quantitative ecosystem service evaluation enhances source delineation accuracy. Resistance surfaces typically assign land-use coefficients, as land-use patterns integrate natural processes and anthropogenic influences, directly reflecting species movement impedance [24,25]. Advanced approaches incorporate (i) topographic variables (relief, slope, aspect) [19]; (ii) socioeconomic indicators (e.g., nighttime light intensity) [26]; and (iii) human activity metrics [27]. Resistance factor weighting employs two paradigms: (i) subjective methods (e.g., direct assignment [28], analytic hierarchy process [29]), susceptible to expert bias; and (ii) objective methods (e.g., principal component analysis [7], entropy weighting [15]), deriving weights from intrinsic data patterns. Weight determination based on inherent data characteristics is essential for enhancing resistance surface precision. Critically, effective security pattern construction extends beyond corridor and node extraction. Optimal corridor width requires further investigation [30,31], while operational viability necessitates integration with regional territorial ecological restoration projects—forming the foundation for implementable ecological networks [32,33].
The Outline of the Plan for Ecological Protection and High-Quality Development in the Yellow River Basin establishes a strategic ‘One Belt, Five Zones, Multiple Nodes’ spatial configuration. This framework centers on an ecological corridor along the Yellow River’s main stem and major lakes, structurally connecting the Qinghai-Tibet Plateau, Loess Plateau, Northern Sand Prevention Belt, and Yellow River Estuary coastal zone. Henan Province has formulated implementation measures to build a model ecological protection zone within this basin. Through comprehensive execution of national directives for Yellow River conservation and high-quality development, the province will (i) enhance interregional coordination among riverside municipalities; (ii) strengthen cross-provincial integration with neighboring basin jurisdictions; and (iii) elevate ecosystem governance standards to advance ecological civilization provincially. The Henan segment spans the middle-lower reaches of the Yellow River, characterized by flat terrain and fertile soils. This area constitutes Henan’s primary grain production base and ranks among China’s vital agricultural regions. However, rapid urbanization has triggered (i) extensive cropland conversion to construction; (ii) resource-intensive development; and (iii) unregulated urban expansion, resulting in severe depletion of arable land and progressive ecosystem degradation. In 2009, the area of ecological land within the Henan segment of the Yellow River Basin was 32.037 million mu, accounting for 37.66% of the total regional area. Between 2009 and 2017, this ecological land area decreased by 865,000 mu. Concurrently, the cultivated land area in this segment was 35.569 million mu in 2009, declining to 35.071 million mu by 2017—a reduction of 498,000 mu. In May 2020, the General Office of the People’s Government of Henan Province issued the Implementation Opinions on Strengthening the Construction of High-Standard Farmland and Building a National Core Grain Production Area, thus elevating the planning for Henan’s core grain production zone to a new strategic national priority. Subsequently, in September 2021, Henan Province promulgated the Decision of the Standing Committee of the Henan Provincial People’s Congress on Promoting Ecological Protection and High-Quality Development in the Yellow River Basin. This signifies the comprehensive advancement and local implementation of ecological protection and high-quality development strategies for the Henan segment of the Yellow River Basin, originating from the national level.
Compounding the inherent ecological fragility of the Henan Yellow River Basin segment, declining proportions of ecological land have exacerbated regional soil erosion and water pollution. These intensifying issues not only impede ecosystem health but also constrain economic development, severely compromising basin-wide ecological security and sustainable development [34].
Current research on this segment predominantly addresses ecosystem quality dynamics, ecosystem service assessments, and ecological risk evaluations [35], with limited systematic studies on ecological security pattern (ESP) optimization and ecological network enhancement. This study quantifies four key ecosystem services: soil retention; water conservation; carbon sequestration; and habitat quality. Using core protected area patches, ecological sources were identified, and a composite resistance surface was developed. Applying minimum cost path and circuit theories, we then (i) delineated ecological corridors; (ii) constructed the basin-scale ecological security pattern (ESP); and (iii) defined protection/restoration zones based on ecological functional zoning. This framework delivers four key contributions: (i) implementation guidance for ecological restoration projects; (ii) advancement mechanisms for territorial spatial governance; (iii) scientific foundations for landscape ecological risk management; and (iv) optimization pathways for landscape patterns in Henan’s Yellow River Basin region.
2. Materials and Methods
2.1. Study Area
The Henan segment of the Yellow River Basin, 34°34’ N–36°08’ N and 110°22’ E–116°07’ E, spans the middle-lower reaches in central China (Figure 1). This region exhibits diverse topography transitioning west to east from mountains through hills to plains, with progressively decreasing elevation. The Yellow River enters Henan from Shaanxi Province, originating at Lingbao City and traversing eight prefecture-level cities—Sanmenxia, Jiyuan, Luoyang, Jiaozuo, Zhengzhou, Xinxiang, Kaifeng, and Puyang—before flowing into Shandong. Within Henan, the river stretches approximately 711 km, encompassing a drainage area of approximately 36,200 km2. This represents 5.1% of the total Yellow River Basin area and 21.7% of Henan’s territory. The lower basin comprises an alluvial plain characterized by fertile soils and flat terrain. As one of China’s primary grain-producing regions, it features advanced agriculture but a less industrialized economy dominated by light manufacturing. Recent socioeconomic acceleration and rapid urbanization have triggered significant construction land expansion, with substantial cropland conversion causing severe ecological function degradation [36].
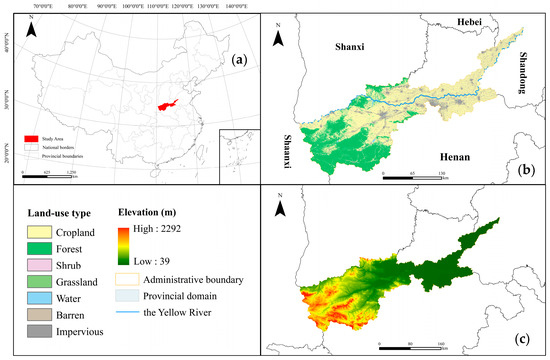
Figure 1.
Location (a), land-use type (b) and elevation soil (c) of the Henan section of the Yellow River Basin.
2.2. Data Sources
In this study, the data used included vector data and raster data, the sources and resolutions of which are shown in Table 1. To ensure the continuity and accuracy of the data, the data coordinate system was set to WGS_1984_UTM_Zone_49 N, and all spatial data were resampled to a raster layer with a resolution of 500 m × 500 m.

Table 1.
Data sources and spatial scales.
2.3. Assessment of Ecosystem Services
Based on the ecological characteristics of the Henan section of the Yellow River Basin and in combination with previous studies [31,33], the InVEST model version 3.9.0 was used to assess four ecosystem services in the Yellow River Basin: soil conservation, water conservation capacity, carbon sequestration, and habitat quality. Soil conservation was evaluated using the Sediment Delivery Ratio (SDR) module of the InVEST model, while water conservation capacity, carbon sequestration, and habitat quality were calculated using the Water Yield, Carbon, and Habitat Quality modules, respectively, within the InVEST model.
2.3.1. Water Conservation Capacity
Based on the Budyko water–energy balance hypothesis [34] and annual average precipitation data, the water yield in the study area was calculated to assess the water supply regulation capacity of the watershed. The water conservation capacity of the study area was measured using the InVEST model based on the water balance principle [37]. The calculation formula is as follows:
In the formula, represents the actual water yield, represents the actual evapotranspiration, represents the annual rainfall, and represents the evapotranspiration component in the water balance. The calculation formula is as follows:
In the formula, is a parameter related to the soil available water content and annual rainfall, and is the aridity index, which is related to potential evapotranspiration and rainfall. The calculation formula is as follows:
In the formula, represents the soil available water content, which is related to land-use types. Z is the seasonal constant, representing the distribution and depth of seasonal rainfall. represents the potential evapotranspiration of grid i, and is the associated correction coefficient. The parameter settings can be referred to the InVEST model user guide and relevant literature [33].
2.3.2. Habitat Quality
Assessment was conducted in the study area using the Habitat Quality module of the InVEST model, which reflects the impact of human activities on the environment. The greater the human activity is, the greater the threat is to the habitat. Based on previous studies [38,39,40], Urban Constructive Land, Highway, and Railway were selected as the sources of threat for calculating and simulating the habitat quality in the study area. Specific parameter settings were determined according to the model user manual and previous research, as shown in Table 2 and Table 3. The disturbance to the habitat decreases based on the intensity of human activity. The habitat quality value ranges from 0 to 1, with higher values indicating less environmental threat and higher ecological quality. The calculation formula is as follows:
Table 2.
Ecological threat factor scale.
Table 3.
Table of sensitivity of habitat types to various threat factors.
In the formula, represents the computed habitat quality; represents habitat suitability; K represents the half-saturation constant; Z represents the normalization constant, typically taken as 2.5; and Dij represents the level of habitat threat.
In the formula, r represents the threat source of the habitat, y represents the grid of the rth threat source, and represents the sensitivity of habitat types to the threat source. represents the threat level of the threat source to the habitat grid, which can be categorized as linear threat or exponential threat. The calculation formulas are as follows:
In the formula, dxy represents the distance between the habitat grid and the threat source, and drmax represents the influence range of threat source r.
2.3.3. Carbon Storage
Total carbon storage includes aboveground biomass, belowground biomass, soil carbon content, and dead organic carbon. In this study, carbon sequestration services were calculated using the carbon stocks module from the InVEST model. The calculation formula is as follows:
In the formula, represents the total carbon storage, represents the aboveground biomass carbon storage, represents the belowground biomass carbon storage, represents the soil carbon storage, and represents the dead organic matter carbon storage. The aboveground biomass is calculated based on the net primary productivity (NPP) of each ecosystem type [37]. The ratio coefficient between belowground and aboveground biomass is calculated using the root-to-shoot ratio to obtain belowground biomass [35]. The soil carbon density and dead organic carbon density are referred to the parameters in the literature (Table 4) [41].
Table 4.
Carbon pool coefficients for different land types.
2.3.4. Soil Conservation
In this study, the ability of ecosystems to accumulate and retain sediment was used to reflect the soil conservation function within the watershed [42,43,44]. The calculation formula is as follows.
In the equation, represents the rainfall erosivity factor [41], and represents the soil erodibility factor calculated using the EPIC model [43]. represents the topographic factor, represents the slope length factor, represents the slope gradient factor, represents the vegetation cover factor, and represents the soil and water conservation measure factor.
2.4. Ecological Source Identification
Ecological source areas are key ecological patches that promote ecological processes, maintain ecosystem integrity, and provide ecosystem services [45]. Quantifying the importance of ecosystem services can provide a basis for identifying critical ecological source areas in a given region. The natural breakpoint method was used to categorize each ecosystem service into five levels (1–5), with higher numerical values indicating higher levels of importance, namely: general importance, comparative importance, moderate importance, high importance, and extremely important. The classified ecosystem services were then overlapped with equal weights and reclassified into four levels (1–4), representing general importance, moderate importance, high importance, and extremely important, respectively. These levels represent the spatial distribution of the importance of ecosystem services. The areas classified as extremely important were extracted and cross-referenced with data from nature reserves to carry out verification. Patches with an area equal to or greater than 35 km2 were selected as ecological source areas.
2.5. Resistance Surface Construction
Ecological resistance refers to the resistance that biological species need to overcome when migrating and dispersing between different ecological source areas. Based on previous research findings [30] and the current status of the Henan segment in the Yellow River Basin [19], four resistance factors were selected: land-use type, normalized vegetation index, relief, and slope. The distribution ranges of the resistance factors vary for different elements, as referenced in relevant studies setting the resistance coefficients for different factors [25]. ArcGIS 10.8 was used to classify and standardize each resistance factor, with unified resistance values ranging from 1 to 5. The entropy weighting method measures the importance of each indicator by quantifying the differences in indicator parameters, thereby avoiding the randomness of subjective weighting. In this study, the entropy weighting method was employed to calculate the weights of each resistance factor (Table 5). The resistance factor layers were then overlapped according to their weights to obtain the final resistance surface.
Table 5.
Resistance factor assignment and entropy weight.
2.6. Extraction of Ecological Corridor
Ecological corridors serve as communication bridges for species, information, and energy flow, playing a fundamental role in species migration, survival, reproduction, as well as providing ecological restoration functions such as wind protection, pollution filtration, and protection from isolation [46]. In this study, the Linkage Pathways-Build Network and Map Linkages tool within the Linkage Mapper toolbox was employed. The minimum cost path method was used to calculate the cumulative resistance values of species for migration and dispersal between different ecological source areas. A cost-weighted distance threshold of 20 km was set, and the resulting minimum cost path represents the ecological corridor.
2.7. Identification of Ecological “Pinch Points” and Ecological Obstacles
Ecological “pinch points” are key landscape points that represent habitat connectivity, and their degradation or loss may disconnect connectivity between source areas. Priority should be given to the protection of these regions that play a crucial role in the connectivity within the study area [18]. In this study, the Pinchpoint Mapper module within the Linkage Mapper toolbox was utilized to identify ecological pinch points.
The Barrier Mapper tool within the Linkage Mapper toolbox was employed in “Maximum” mode for iterative calculations to compute improvement scores. Higher improvement scores indicate a greater need for enhanced connectivity, and restoring these areas can improve regional connectivity. High-score areas of improvement were selected as high barrier node regions. To identify barrier node regions, improvement scores within the optimal radius were filtered, and a natural breakpoint method was employed to classify the layers into different levels. The high-value areas of the resulting layers represent the barrier node regions. The “Feature To Point” tool in ArcGIS 10.8 was used to extract the ecological barrier points.
2.8. Ecological Restoration Zoning Research Framework
Ecological restoration zoning is formulated based on ecological regionalization, with the dominant ecological function central to its framework. Building upon functional zoning studies that underpin regional ecological divisions within the study area [46], this study integrated the constructed ecological security pattern and key areas identified from the ecological context. The dominant ecological function served as the primary objective for zoned restoration, ultimately delineating distinct restoration units to yield the final zoning results. The technical workflow is presented below (Figure 2).
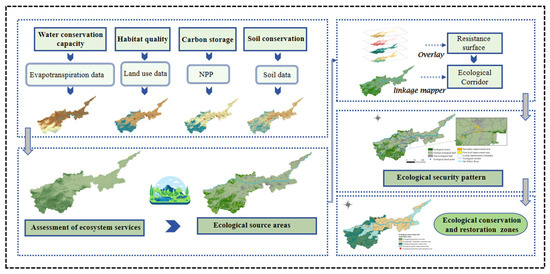
Figure 2.
The study framework and technical methodology.
3. Results
3.1. Extraction of Ecological Sources
Ecosystem services exhibit pronounced spatial heterogeneity in the study area (Figure 3). Soil retention importance generally decreases westward, with moderately important zones predominantly in downstream cultivated areas, and medium-to-high importance areas flanking upstream valleys. Water conservation importance declines along a southwest-to-northeast gradient, peaking in urban built-up areas due to enhanced moisture retention from high impervious surface coverage. Key functional zones include (i) the Lushi, Luanchuan, and Song Counties (southwest) as critical water conservation areas; and (ii) the Mangshan surface water source protection area (Luoning County), a major centralized drinking water source. Carbon sequestration high- and very-high-importance zones cover 24% and 19% of the study area, respectively, concentrated in (i) the Upper Yellow River reaches; (ii) the Southwest Funiu Mountains; and (iii) the Yiluo River Basin, with woodland and grassland as dominant vegetation types. Habitat quality very-high-importance zones cluster in (i) the Taihang Mountains (upper basin); and (ii) the Southwest Funiu Mountains. Luanchuan County exhibits uniformly high habitat quality, particularly along its eastern, western, and northern borders adjoining Song, Lushi, and Luoning Counties.
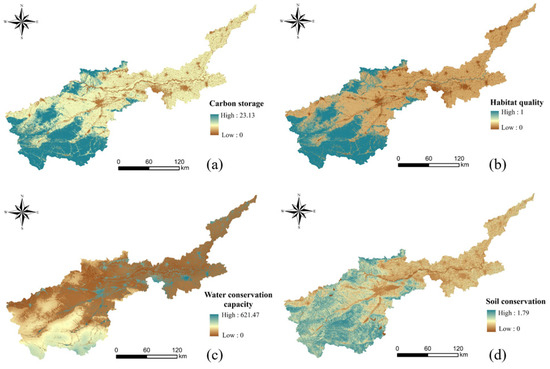
Figure 3.
Spatial distribution of carbon storage (a), habitat quality (b), water conservation capacity (c), and soil conservation (d).
Weighted overlay analysis of the ecosystem service raster layers for the Henan section of the Yellow River Basin yielded the spatial distribution of ecosystem service importance (Figure 4a). This importance was classified into four levels (1–4) using the natural breaks method: Level 1 (Generally Important), Level 2 (Moderately Important), Level 3 (Highly Important), and Level 4 (Extremely Important). Level 4 areas, constituting 20.9% of the study area, were predominantly located in the Dabie Mountain Nature Reserve (northern Jiyuan and Jiaozuo); the Fuxi Mountain Grand Canyon (southern Gongyi); the Xitaishan Reserve (southern Ruyang County); the Huaguoshan National Forest Park (southwestern Luoning County); northern Luanchuan County; and the border area between Songxian and Yiyang Counties. Level 3 areas covered 21.24% of the study area and were widely distributed. Level 2 areas, accounting for 24.68% of the total area, were concentrated in the middle and upper reaches. Ecological sources were identified by extracting Level 4 areas and selecting patches larger than 35 km2, verified against the spatial distribution data of protected areas within the study region. A total of 20 ecological sources were identified (Figure 4b), covering 8947 km2 (20.92% of the study area). These sources were primarily distributed in the Funiu Mountains (upper southwestern reaches); the Dabie Mountains (middle reaches); and the Songshan and Fuxi Mountain areas (southern Gongyi). Their distribution exhibited considerable overlap with mountainous terrain and lakes.
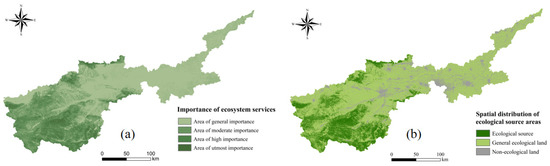
Figure 4.
Importance of ecosystem services (a) and spatial distribution of ecological sources (b).
3.2. Resistance Surface Distribution
Higher vegetation coverage and greater topographic complexity enhance connectivity for ecological source expansion. The comprehensive resistance surface for ecological sources (Figure 5) was generated by overlaying four resistance factors—land cover type, NDVI, topographic relief, and slope (Figure 6)—using their assigned weights. The highest resistance values clustered in urban built-up areas, including Zhengzhou, Luoyang, and Kaifeng. High-resistance areas distributed across the mid-reach region encompassed Yichuan County, Yanshi City, northern Gongyi, eastern Zhongmu County, and northeastern Wuzhi County. These predominantly consist of ecologically vulnerable cropland with low vegetation coverage. Lowest resistance values concentrated in the southwestern mountainous areas, northern Taihang Mountains, and northern Mianchi County.
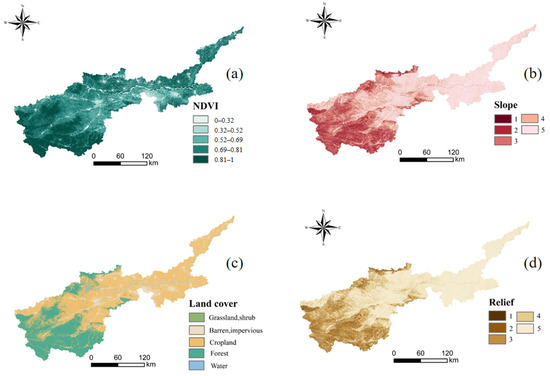
Figure 5.
The spatial distribution of NDVI (a), land-use cover (b), slope (c), and relief (d).
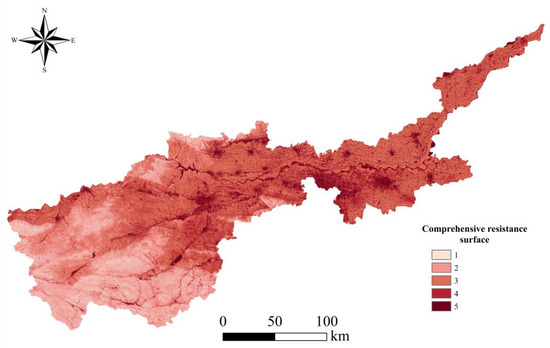
Figure 6.
Comprehensive resistance surface.
3.3. Identification of Ecological Corridor
Based on the identified ecological sources and the constructed comprehensive resistance surface, 43 ecological corridors were extracted using the least-cost path method (Figure 7). Total corridor length reached 778.24 km, with individual corridors ranging from 0.95 km to 76.84 km. Corridors were densest in the middle-upper reaches while absent west of Wenxian County and Gongyi City. This absence stemmed from extensive contiguous croplands in the eastern region, which lack suitable ecological sources for species habitation or dispersal and are unsuitable for corridor establishment due to high anthropogenic disturbance and ecological instability. Fragmented corridors clustered in the southern mountainous upper reaches, where large, contiguous ecological sources (e.g., forest-grassland complexes in the Funiu Mountains) exhibit high habitat quality and vegetation vigor. Low inter-source resistance and proximity enabled strong connectivity, resulting in short, densely distributed corridors (average length: 9.6 km; 49.75% below the basin-wide average). Conversely, middle-reach corridors were continuous and long (average length: 46.67 km; 149.65% above average). This reflects dispersed, distant ecological sources requiring passage through high-resistance urban areas (e.g., Luoyang City and surrounding county cores), resulting in weaker connectivity. As bridges for species migration, corridor width depends on target species and function. Given dispersal distances of 50–5000 m for key protected animals and birds in the study area [12], a corridor width of 1000 m was established based on threshold computation and existing research [47].
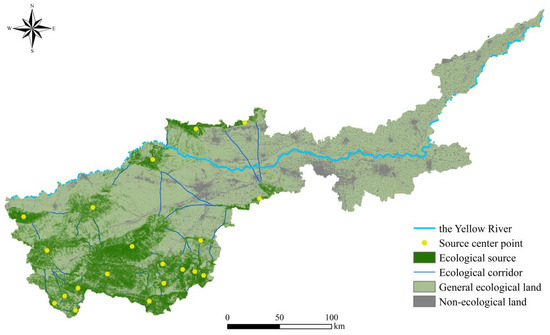
Figure 7.
Spatial pattern of ecological corridors.
3.4. Identification of Ecological Restoration Areas
3.4.1. Ecological Pinch Point Identification
Pinchpoint Mapper within the Linkage Mapper toolbox integrates the least-cost corridor model with circuit theory, visualizing the most efficient movement paths and critical pinch point regions. Current intensity was stratified into five classes using the natural breaks method, identifying 21 pinch points (Figure 8) totaling 87.95 km2, predominantly exhibiting linear configurations. The largest pinch point (19.08 km2), oriented northwest–southeast in southwestern Lingbao City, connects the largest southwestern source patch directly to the Luoxi Giant Salamander Provincial Nature Reserve via complex topography and high vegetation coverage. Its coincidence with an existing ecological corridor establishes it as a vital conduit between source patches, conferring high ecological value. Ten additional pinch points occurred along key mountainous corridors, with others located at source–corridor junctions and study area boundaries. This distribution arose because mountainous corridors inherently facilitate higher ecological flow with minimal anthropogenic disturbance, increasing pinch point likelihood. Junctions between corridors represent critical hubs for material and energy transfer. Notably, multiple pinch points occurred along corridors in eastern Yichuan County and northern Ruyang County, necessitating focused attention to preserve network integrity and guide ecological restoration efforts within a comprehensive framework.
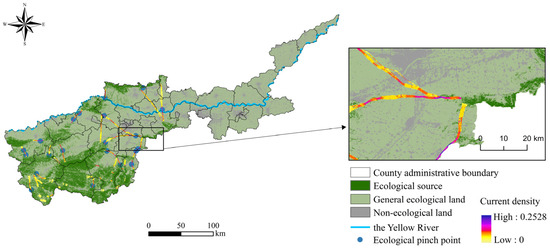
Figure 8.
Ecological “pinch point” analysis based on Pinchpoint Mapper.
3.4.2. Identification of Ecological Barrier Points and Construction of Ecological Safety Patterns
Barrier Mapper within the Linkage Mapper toolbox identified barrier points impeding ecological corridors. Improvement scores were calculated for radii of 100 m, 200 m, 300 m, 400 m, and 500 m. The 300 m radius barrier point layer was selected for final analysis (Figure 9). Identified barrier points were classified into three tiers. Tier 1 (barrier points proper), with improvement scores of 2.85–3.85, comprised 19 sites covering 226.68 km2. Of these, barrier points occupying 197.32 km2 intersected ecological corridors, significantly compromising regional landscape connectivity. This impact arises because these areas are dominated by bare land, cropland, and built-up areas, with ecological land cover (e.g., forest, grassland) constituting only 15.17%. The sparse ecological land base hinders corridor extension and stability, explaining their designation as barrier points. Furthermore, these large, predominantly built-up patches present high removal difficulty, limiting near-term connectivity enhancement between sources. Tier 2 (moderate improvement zones) encompassed five sites where ecological land cover reached 47.86%. Protecting existing ecological land in these zones offers potential for modest connectivity gains, facilitating future corridor expansion. Overlaying the identified ecological sources, corridors, and nodes yielded the ecological security pattern for the Henan section of the Yellow River Basin (Figure 10).
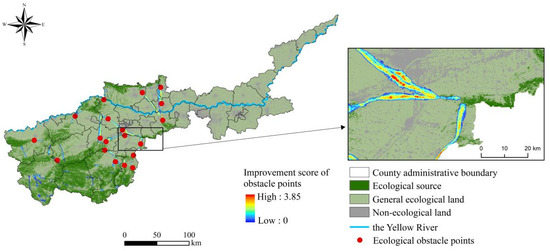
Figure 9.
Analysis of ecological barrier points based on Barrier Mapper.
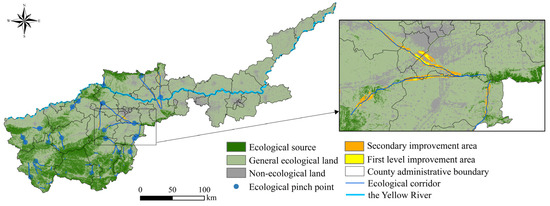
Figure 10.
Ecological security pattern in the Henan section of the Yellow River Basin.
3.5. Ecological Restoration Zoning and Optimization
3.5.1. Ecological Restoration Zoning
Based on the functional zoning of the research area’s ecological foundation and considering the distribution of ecological base, locations of nature reserves, and the composition of ecological security patterns in the research area (Figure 6 and Figure 7), this study proposes an ecological conservation and restoration pattern for the Huang River Basin in Henan Province, consisting of “One Axis, Two Cores, and Multiple Zones” (Figure 11) [48].
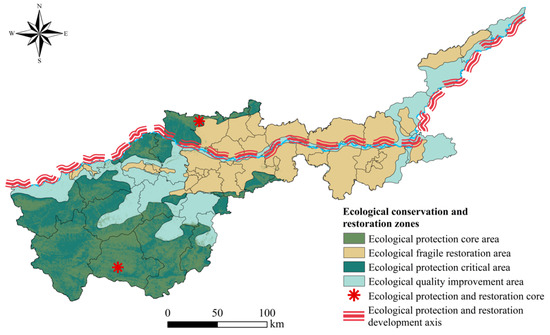
Figure 11.
Ecological protection and restoration pattern in the Henan section of the Yellow River Basin.
The “One Axis” refers to the ecological conservation and restoration development axis of the Huang River Basin in Henan Province. From the perspective of ecological security pattern, this axis includes 78.94% of the barrier point areas that impact landscape connectivity to the south. Due to low feasibility for restoration, the focus in this region is on ecological conservation. This area includes a national-level nature reserve and 80.95% of the “pinch point” areas, highlighting the critical importance of ecological conservation in this region. Therefore, this area was classified as the Southern Mountain Conservation and Restoration Zone, with an area of 16,071.96 km2. In the ecological “pinch points” to the north of this axis, 66.67% are located at the junction of ecological corridors and the Yellow River, making water ecological governance and protection of significant importance. From the perspective of ecological foundation and functional zoning, the emphasis in the northern part of this axis is on water conservation and biodiversity protection. This area was classified as the Northern Mountain Conservation and Restoration Zone, covering an area of 6790.29 km2.
The “Two Cores” represent two ecological conservation and restoration cores. The Northern Taihang Mountain Nature Reserve, a national-level protection area for Chinese macaques, is home to more than 200 species of wildlife and over 1836 plant species. It is designated as the core for ecological conservation and restoration in the northern region. The Southern Funiu Mountain Nature Reserve, situated at the junction of three major water systems in China–the Yangtze River, Yellow River, and Huai River–serves as a watershed and a vital water source area for the Huai River. It was identified as the core for ecological conservation and restoration in the southern region due to its significant conservation value.
The “Multiple Zones” comprise four ecological conservation and restoration zones. Ecological source sites refer to extremely important areas for the provision of ecosystem services and thus are designated as core ecological protection areas. The Northern Taihang Mountain region and the Southern Funiu Mountain region encompass 86.67% of the nature reserves within the study area. Taking into account the ecological functional zoning plan and the scope of nature reserves, these areas were defined as the key ecological protection regions in this study. The central part of the study area is a densely populated and industrially developed region in Henan Province, characterized by ecological vulnerability and significant human intervention. It was therefore classified as the ecological vulnerability restoration zone. The eastern and western regions of the study area are predominantly covered by large areas of cultivated land, which represents an unstable ecological land and experiences substantial human intervention. These areas were thus designated as the ecological quality improvement zones.
3.5.2. Ecological Conservation and Restoration Strategies
- (1)
- Northern Mountain Conservation and Restoration Zone: The Taihang Mountain region serves as an important ecological security barrier in the central part of China. It is traversed by the middle route of the South-to-North Water Diversion Project and is home to 19 national-level protected areas. In this region, it is necessary to scientifically delineate the scope and zoning of nature reserves; expedite the integration and optimization of various types of nature reserves; and establish a nature conservation system with national parks as the main body, nature reserves as the foundation, and various types of nature parks as supplements. Additionally, efforts should be made to continually advance the protection and restoration of important ecosystems, as well as the construction of major projects involving mountains, rivers, forests, farmlands, lakes, grasslands, and sand dunes. It is important to implement measures such as forest conservation, river restoration, and the rehabilitation of lakes and grasslands, with the aim of restoring and enhancing the functionality of ecosystem services. Key areas of focus should include the headwaters of major rivers, revolutionary old areas, and poverty-stricken regions. Scientific approaches should be employed to combat desertification, rocky desertification, and soil erosion, as well as restore ecosystems degraded by historical mining activities. In areas severely affected by soil erosion, the construction of clean small watersheds should be carried out, while comprehensive measures should be employed to address steep sloping farmlands, erosion gullies, and landslide-prone hillslopes. Emphasis should be placed on promoting green mining practices, formulating and implementing ecological restoration plans for mining areas, as well as strengthening the oversight and compliance of mineral resource extraction with geological and environmental protection obligations and land reclamation. Furthermore, it is essential to enhance the supervision and evaluation of ecological conservation and restoration efforts.
- (2)
- Central Ecological Vulnerability Restoration Zone: This region is located in a high-population-density area in Henan Province, accounting for approximately 72.44% of the total population in the study area. The largest proportion of land is dedicated to arable farming, followed by construction land. For the ecological conservation and restoration of this region, efforts should focus on strengthening the protection of arable land, strictly controlling development intensity, addressing non-point source pollution, establishing a national core area for food production, enhancing comprehensive agricultural production capacity, promoting modern agriculture, and developing characteristic industries tailored to local conditions to increase farmers’ income. It is important to coordinate the green development of both urban and rural areas, following a path of green and low-carbon development and advancing urban ecological construction. This includes promoting the “networking” of urban green spaces, improving the layout of urban green areas, and establishing a systematic, grid-based, ecological, interconnected urban greening system that connects urban and rural areas. Efforts should also be made to develop urban forest parks, suburban parks, green belts for urban protection, and artificial wetlands, creating an urban ecological protection zone and urban ventilation corridors. Emphasis should be placed on the protection of natural features such as urban mountains, rivers, and lakes, as well as the restoration of damaged mountains and abandoned industrial and mining land. Urban river and lake ecological restoration projects should be implemented, addressing the governance and restoration of urban rivers, lakes, wetlands, and shorelines systematically. With high standards, the construction of urban water networks, blue pathways, and ecological buffer zones along riverbanks should be advanced to restore the connectivity and flow dynamics of river and lake systems.
- (3)
- Southern Mountain Conservation and Restoration Zone: The Funiu Mountain region is a recognized reservoir of biodiversity and a gene bank for various rare and precious animal species. The area is characterized by extensive forest land with a high forest coverage rate. It possesses rich resources of pristine forests and rare wild flora and fauna, making it of great significance for the maintenance of biodiversity. For the ecological conservation and restoration of this region, an ecological priority approach should be adhered to, with strengthened protection of wildlife. Overexploitation and excessive hunting and gathering of species should be strictly prohibited to maintain and restore the balance of wild animal and plant species and populations, achieving sustainable and beneficial utilization of wildlife resources. Enhanced protection should be given to natural forests and public forests, promoting the protection and enclosure of natural forests; strengthening the construction of protective forests; addressing soil erosion issues; and maintaining and restoring wetlands, forests, and other ecosystems. In the headwaters and upstream areas of the Huai River, efforts should be intensified to promote afforestation and strictly protect natural vegetation that contributes to water conservation. The water source protection project for the South-to-North Water Diversion should be implemented, prohibiting activities such as unregulated mining and deforestation, and effectively preventing soil erosion. Measures should also be taken to control industrial pollution, non-point source pollution, pollution from livestock and poultry farming, as well as pollution from rural living, in order to further improve water quality in water source areas. The diversification of income sources for farmers should be expanded, ensuring their long-term livelihoods and consolidating the achievements of returning farmland to forest.
- (4)
- Ecological Protection and Restoration Development Axis in the Yellow River Basin: The region serves as an important ecological barrier for the North China Plain and is also a densely populated area for economic development in Henan Province. Promoting integrated management and restoration of ecological protection from Lingbao City to Taohuayu in the middle reaches of the Yellow River is crucial. The focus should be on strengthening natural forest protection, the construction of forest and grass vegetation belts, comprehensive soil erosion control, and the ecological restoration of mining areas to restore and enhance regional functions such as soil and water conservation and water source preservation. Comprehensive ecological management should be carried out from Taohuayu to Taiqian County in Puyang, downstream of the Yellow River. This includes promoting comprehensive ecological improvement in flood areas and the high-quality development of flood storage zones. Implementing zoned approaches for farmland, water bodies, and wetland protection and restoration will enhance the stability and diversity of the ecosystem. Additionally, efforts should be made to strengthen the restoration and construction of wetlands along the main course of the Yellow River. Measures such as wetland enclosure protection, restoring wetlands by returning farmland, ecological water replenishment for wetlands, and restoration and reconstruction of biological habitats should be implemented. Furthermore, the integration and connectivity of the ecological corridors between the main and tributary streams of the Yellow River should be promoted to establish a comprehensive and well-structured ecological corridor network that covers the entire region, ensuring complete coverage and a rational structure.
4. Discussion
4.1. Ecological Security Pattern Construction
Precisely defining the ecological sources, corridors, and nodes constituting an ecological network is central to establishing an ecological security pattern (ESP), with ecological corridor identification serving as the critical step connecting sources and nodes [49]. This study identified ecological sources by assessing the importance of key ecosystem services in the Henan section of the Yellow River Basin, validated against the spatial distribution of protected areas. The resistance surface incorporated topographic background and vegetation coverage. Resistance factor weights were determined using the entropy weight method rather than simple equal weighting, enhancing the scientific rigor and accuracy of the comprehensive resistance surface through a combination of qualitative and quantitative approaches.
Ecological corridors were extracted by calculating the least-cost paths between ecological sources across the comprehensive resistance surface using the minimum cumulative resistance (MCR) model. Pinch points and barrier points were identified based on circuit theory analysis. The Linkage Mapper toolbox integrated the MCR model and circuit theory, automatically removing duplicate corridors and enabling efficient iterative calculations for different corridor widths. Pinch points and barrier points were quantitatively screened based on current density, facilitating efficient extraction of ecological corridors and nodes.
The resulting ecological network spans the entire Henan section of the Yellow River Basin, aligning with the *Henan Provincial Plan for Natural Resource Protection and Utilization (14th Five-Year Plan)*. This network comprises (1) an upper-reach, natural-process-dominated zone focused on mountain protection; (2) a mid-reach, human-impacted zone with dense population and industry; and (3) a lower-reach, plain ecological conservation zone dominated by extensive cropland. This spatial correspondence validates the soundness of the constructed ESP.
4.2. Comparison with Existing Studies
This work demonstrates significant advantages over prior research in methodological innovation, result applicability, and practical guidance. Firstly, in identifying ecological sources, the quantification of ecosystem service importance mitigates the subjectivity inherent in traditional direct selection approaches and overcomes the limitations of InVEST model outputs, which often emphasize habitat quality or single ecosystem services [50]. This perspective of ecosystem service importance enables a more comprehensive and precise delineation of ecological sources.
Secondly, during resistance surface construction and corridor extraction, we integrated multiple factors—including topography, land-use types, human activity intensity, and natural environmental characteristics—specifically relevant to the Henan segment of the Yellow River Basin. Furthermore, incorporating the random walk behavior of charges from circuit theory effectively simulated the complexity and stochasticity inherent in species migration pathways, thereby enhancing the study’s scientific rigor and accuracy.
Additionally, leveraging Linkage Mapper outputs, we defined specific optimization and protection priorities for ecological corridors. We propose targeted solutions addressing: (i) utilization challenges of high-accessibility corridors in the western region; and (ii) weak connectivity between eastern corridors and the broader ecological network. These measures tangibly strengthen network connectivity and stability, providing a robust safeguard for regional ecological security.
Regarding practical value, the proposed “One Axis, Two Cores, Multiple Zones” ecological security pattern exhibits strong alignment with relevant strategies outlined in Henan Province’s *14th Five-Year Plan for Ecological Environmental Protection and Eco-Economic Development*, the *Henan Provincial Territorial Spatial Plan (2021–2035)*, and the Outline of the Plan for Ecological Protection and High-Quality Development in the Yellow River Basin. This consistency validates the scientific robustness of our results.
Building upon this foundation, we further pinpointed ecological pinch points and barrier points as priority areas for restoration. Tailored restoration strategies, designed according to their distinct characteristics, provide clear technical guidance for ensuring unimpeded species migration and the normal flow of material and energy.
4.3. Findings and Limitations
The study identified 20 patches as ecological sources, encompassing key protected areas within the Henan segment of the Yellow River Basin, including the Yellow River Gudao Wetland National Nature Reserve, Taihang Mountain Macaque Nature Reserve, Xiaolangdi Bird Wetland Park, Xiaoqinling National Nature Reserve, and Funiu Mountain National Nature Reserve. Dominated by woodland, shrubland, grassland, and wetland vegetation, these sources exhibit high levels of ecosystem service importance.
Ecological corridors, defined as linear zones facilitating the flow of material, energy, and species between ecological sources, structurally connect major nature reserves across the basin’s upper, middle, and lower reaches. This connectivity underscores the Yellow River’s critical ecological strategic role within the study area, indicating that enhancing basin-wide ecological quality should prioritize regions radiating outward from the river corridor.
Ecological pinch points and barrier points represent critical junctures in ecological flows. Analyzing the land cover composition at these nodes informs targeted adjustments for ecological planning. Barrier points within the Henan segment are predominantly concentrated in areas with poor vegetation cover—such as bare land, cultivated land, and construction land. Mitigating anthropogenic disturbances near these barrier points is essential to facilitate natural vegetation recovery.
Subsequent research should more explicitly integrate the regulatory effects of territorial spatial governance policies on land-use change to improve prediction accuracy. Given the multitude of factors influencing ecological security in this region, future work could expand analyses to include additional variables such as geological hazards, intensified human activities, and dynamic ecosystem service provision [51].
A key methodological limitation arises from the Linkage Mapper model’s corridor identification process. The approach:
- (i).
- lacks sufficient parameterization of corridor widths relative to species-specific requirements, as different species exhibit distinct habitat and migratory corridor preferences;
- (ii).
- faces practical constraints in comprehensively validating resistance surface settings and corridor widths across numerous corridors due to scale;
- (iii).
- encounters significant data acquisition challenges regarding species-specific migratory habits and life history traits [49].
Consequently, the constructed ecological security network may not fully encompass all critical ecological processes and species mobility needs, limiting its capacity to provide nuanced guidance for corridor-width-specific restoration. Future studies should systematically explore the ecological implications of varying corridor widths [52].
4.4. Future Research Directions
To enhance the accuracy and practical utility of the findings, future research should prioritize the following improvements [53]:
- (i).
- Integrate comprehensive assessments of migration and dispersal patterns across diverse ecological elements, particularly focusing on aquatic fauna, avian migration routes, and plant seed dispersal mechanisms, to achieve holistic ecological network coverage.
- (ii).
- Refine methodologies for ecological corridor identification, developing more adaptable algorithms to address the specific requirements of different regions.
- (iii).
- Validate and calibrate model outputs rigorously using high-resolution remote sensing data coupled with field survey data, ensuring enhanced reliability and operational applicability of the results.
- (iv).
- Calibrate corridor widths based on the behavioral characteristics of target species, leveraging established regional benchmarks and enabling dynamic optimization through the integration of remote sensing imagery and field observations, given the critical influence of corridor dimensions on biological flows.
5. Conclusions
This study established an ecological security pattern (ESP) for the Henan section of the Yellow River Basin (encompassing 43 counties/cities) by integrating the InVEST model, Linkage Mapper, and circuit theory. Building upon this ESP and existing ecological functional zoning, we delineated regional protection–restoration frameworks and proposed corresponding strategies. Key findings are:
- (1)
- Spatial Heterogeneity in Ecosystem Services:
Ecosystem service quality exhibited a southwest-high, northeast-low gradient, with higher values in mountainous areas and lower values in plains. Ecological sources totaled 8947 km2, predominantly comprising large, irregular patches of high-coverage forestland. We identified 43 key ecological corridors (total length: 778.24 km), predominantly short-distance and densely clustered in the southwest.
- (2)
- Critical Connectivity Elements:
Twenty-one pinch points and nineteen barrier points were identified. Pinch points frequently occurred along corridors and at source-corridor junctions. Barrier points, characterized by large individual size, low ecological land cover proportion (typically <15%), and high mitigation difficulty, were predominantly distributed on built-up land.
- (3)
- Protection-Restoration Framework:
A spatial framework of “One Axis, Two Cores, Multiple Zones” was proposed. Strategy differentiation was based on dominant ecological functions and ESP element distribution: Southern and Northern Mountain Protection–Restoration Zones: prioritize protection, supplemented by restoration. Central Degradation Recovery Zone: implement strict development control and guided land-use planning. Yellow River Basin Ecological Axis: employ integrated ecological management combining biological and engineering interventions. Tailored strategies were formulated for these four zones.
Author Contributions
Conceptualization, L.L. and S.C.; methodology, S.C.; software, S.C.; validation, L.L. and S.C.; formal analysis, Z.J. and S.C.; investigation, S.C. and L.L.; resources, L.L.; data curation, Z.J.; writing—original draft preparation, S.C. and Z.J.; writing—review and editing, Z.J.; visualization, S.C.; supervision, L.L.; project administration, L.L.; funding acquisition, L.L. All authors have read and agreed to the published version of the manuscript.
Funding
This research was funded by National Natural Science Foundation of China (Grant No. 42301288). The APC was funded by Satellite Application Center for Ecology and Environment, Ministry of Ecology and Environment.
Data Availability Statement
The original contributions presented in this study are included in the article. Further inquiries can be directed to the corresponding author.
Conflicts of Interest
The authors declare no conflicts of interest.
References
- Wen, J.; Hou, K. Research on the progress of regional ecological security evaluation and optimization of its common limitations. Ecol. Indic. 2021, 127, 107797. [Google Scholar] [CrossRef]
- Sun, M.; Zhang, L.; Yang, R.; Li, X.; Zhang, Y.; Lu, Y. Construction of an integrated framework for assessing ecological security and its application in Southwest China. Ecol. Indic. 2023, 148, 110074. [Google Scholar] [CrossRef]
- Liu, D.; Chang, Q. Ecological security research progress in China. Acta. Ecol. Sin. 2015, 35, 111–121. [Google Scholar] [CrossRef]
- Peng, J.; Zhao, H.; Liu, Y.; Wu, J. Research progress and prospect on regional ecological security pattern construction. Geogr. Res.-Aust. 2017, 36, 407–419. [Google Scholar]
- Wei, L.; Zhou, L.; Sun, D.; Yuan, B.; Hu, F. Evaluating the impact of urban expansion on the habitat quality and constructing ecological security patterns: A case study of Jiziwan in the Yellow River Basin, China. Ecol. Indic. 2022, 145, 109544. [Google Scholar] [CrossRef]
- Wu, J.; Liu, S.; Bai, S. Identification and optimization of ecological corridors in Shenmu City based on landscape ecological security. Arid. Zone Res. 2021, 38, 1120–1127. [Google Scholar] [CrossRef]
- Fan, C.; Wang, Z.; Dang, N.; Deng, G. Construction of Ecological Network in Guiyang Central City Based on Morphological Spatial Pattern and Spatial Principal Component. Acta Ecol. Sin. 2022, 42, 6620–6632. [Google Scholar]
- Hou, W.; Zhou, W.; Li, J.; Li, C. Simulation of the potential impact of urban expansion on regional ecological corridors: A case study of Taiyuan, China. Sustain. Cities Soc. 2022, 83, 103933. [Google Scholar] [CrossRef]
- Li, S.; He, W.; Wang, L.; Zhang, Z.; Chen, X.; Lei, T.; Wang, S.; Wang, Z. Optimization of landscape pattern in China Luojiang Xiaoxi basin based on landscape ecological risk assessment. Ecol. Indic. 2023, 146, 109887. [Google Scholar] [CrossRef]
- Pan, N.; Du, Q.; Guan, Q.; Tan, Z.; Sun, Y.; Wang, Q. Ecological security assessment and pattern construction in arid and semi-arid areas: A case study of the Hexi Region, NW China. Ecol. Indic. 2022, 138, 108797. [Google Scholar] [CrossRef]
- Zhou, G.; Huan, Y.; Wang, L.; Zhang, R.; Liang, T.; Han, X.; Feng, Z. Constructing a multi-leveled ecological security pattern for improving ecosystem connectivity in the Asian water Tower region. Ecol. Indic. 2023, 154, 110597. [Google Scholar] [CrossRef]
- Wei, Z.; Xu, Z.; Dong, B.; Xu, H.; Lu, Z.; Liu, X. Habitat suitability evaluation and ecological corridor construction of wintering cranes in Poyang Lake. Ecol. Eng. 2023, 189, 106894. [Google Scholar] [CrossRef]
- Zhou, G.; Huan, Y.; Wang, L.; Lan, Y.; Liang, T.; Shi, B.; Zhang, Q. Linking ecosystem services and circuit theory to identify priority conservation and restoration areas from an ecological network perspective. Sci. Total Environ. 2023, 873, 162261. [Google Scholar] [CrossRef] [PubMed]
- Huang, K.; Peng, L.; Wang, X.; Deng, W.; Liu, Y. Incorporating circuit theory, complex networks, and carbon offsets into the multi-objective optimization of ecological networks: A case study on karst regions in China. J. Clean Prod. 2023, 383, 135512. [Google Scholar] [CrossRef]
- Wei, B.; Su, J.; Hu, X.; Xu, K.; Zhu, M.; Liu, L. Comprehensive identification of eco-corridors and eco-nodes based on principles of hydrology Analysis and Linkage Mapper. Acta Ecol. Sin. 2022, 42, 2995–3009. [Google Scholar]
- Cao, Y.; Yang, R.; Carver, S. Linking wilderness mapping and connectivity modelling: A methodological framework for wildland network planning. Biol. Conserv. 2020, 251, 108679. [Google Scholar] [CrossRef]
- Song, L.; Qin, M. Identification of ecological corridors and its importance by integrating circuit theory. Chin. J. Appl. Ecol. 2016, 27, 3344–3352. [Google Scholar] [CrossRef]
- Liu, J.; Yin, H.; Kong, F.; Li, M. Structure optimization of circuit theory-based green infrastructure in Nanjing. Acta Ecol. Sin. 2018, 38, 4363–4372. [Google Scholar]
- Xie, Y.; Zhang, S.; Lin, B.; Zhao, Y.; Hu, B. Spatial zoning for land ecological consolidation in Guangxi based on the ecosystem services supply and demand. J. Nat. Resour. 2020, 35, 217–229. [Google Scholar]
- Guo, J.-L.; Li, C.; Zhao, J.; Luo, C.; Mei, Z. Identification of Key Areas for Territorial Ecological Restoration Based on Ecological Security Pattern: A Case Study of Huaihe River Basin. China Environ. Sci. 2025, 1–17. [Google Scholar] [CrossRef]
- Li, D.-Q.; Zhang, F.-Y.; Zhou, H.-T.; Ma, L.; Li, Q. Construction of Ecological Security Pattern for Urban Agglomeration on the Northern Slope of Tianshan Mountains in Xinjiang Based on Ecosystem Service Supply and Demand. China Environ. Sci. 2025, 1–12. [Google Scholar] [CrossRef]
- Closset-Kopp, D.; Wasof, S.; Decocq, G. Using process-based indicator species to evaluate ecological corridors in fragmented landscapes. Biol. Conserv. 2016, 201, 152–159. [Google Scholar] [CrossRef]
- Fan, W.; Song, X.; Liu, M.; Shan, B.; Ma, M.; Liu, Y. Spatio-temporal evolution of resources and environmental carrying capacity and its influencing factors: A case study of shandong peninsula urban agglomeration. Environ. Res. 2023, 234, 116469. [Google Scholar] [CrossRef] [PubMed]
- Liu, Z.; Liu, L.; Li, Y.; Li, X. Influence of urban green space landscape pattern on river water quality in a highly urbanized river network of Hangzhou city. J. Hydrol. 2023, 621, 129602. [Google Scholar] [CrossRef]
- Peng, J.; Li, H.; LIiu, Y.; Hu, Y.; Yang, Y. Identification and optimization of ecological security pattern in Xiong’an New Area. Acta Geogr. Sin. 2018, 73, 701–710. [Google Scholar]
- Fan, S.; Axmacher, J.C.; Shu, H.; Liu, Y. Ecological network design based on optimizing ecosystem services:case study in the Huang-Huai-Hai region, China. Ecol. Indic. 2023, 150, 110264. [Google Scholar] [CrossRef]
- Wang, X.; Chen, T.; Feng, Z.; Wu, K.; Lin, Q. Construction of ecological security pattern based on boundary analysis: A case study on Jiangsu Province. Acta Ecol. Sin. 2020, 40, 3375–3384. [Google Scholar]
- Keeley, A.T.H.; Beier, P.; Gagnon, J.W. Estimating landscape resistance from habitat suitability: Effects of data source and nonlinearities. Landsc. Ecol. 2016, 31, 2151–2162. [Google Scholar] [CrossRef]
- Ma, K.; Fu, B.; Li, X.; Guan, W. The regional pattern for ecological security (RPES): The concept and theoretical basis. Acta Ecol. Sin. 2004, 24, 761–768. [Google Scholar]
- Fu, Y.; Shi, X.; He, J.; Yuan, Y.; Qu, L. Identification and optimization strategy of county ecological security pattern: A case study in the Loess Plateau, China. Ecol. Indic. 2020, 112, 106030. [Google Scholar] [CrossRef]
- Li, L.; Huang, X.; Wu, D.; Yang, H. Construction of ecological security pattern adapting to future land use change in Pearl River Delta, China. Appl. Geogr. 2023, 154, 102946. [Google Scholar] [CrossRef]
- Xie, Y.; Wang, Q.; Luo, Y. Study on the ecological control zoning and ecological corridor network for the metropolitan area of Chongqing city from the land use perspective. Chin. Landsc. Archit. 2021, 37, 115–120. [Google Scholar] [CrossRef]
- Shu, R.; Ma, G.Q.; Zou, Y.B.; Guo, N.; Su, H.; Zhang, G. Bibliometric analysis of ecological security pattern construction: Current status, evolution, and development trends. Ecol. Indic. 2024, 169, 112754. [Google Scholar] [CrossRef]
- Du, L.; Dong, C.; Kang, X.; Qian, X.; Gu, L. Spatiotemporal evolution of land cover changes and landscape ecological risk assessment in the Yellow River Basin, 2015–2020. J. Environ. Manag. 2023, 332, 117149. [Google Scholar] [CrossRef] [PubMed]
- Guo, S. Research on the Coupling and Coordination of Ecosystem Health and Urbanization in the Yellow River Basin. Ph.D. Thesis, China University of Mining and Technology, Beijing, China, 2022. [Google Scholar]
- Zhang, Q.; Wang, G.; Yuan, R.; Singh, V.P.; Wu, W.; Wang, D. Dynamic responses of ecological vulnerability to land cover shifts over the Yellow river Basin, China. Ecol. Indic. 2022, 144, 109554. [Google Scholar] [CrossRef]
- Wang, S.; Li, C.; Yang, L.; Yang, W. Application of the Coupled Budyko Equation and Single Crop Coefficient Approach on Regional Evapotranspiration Estimation. J. Desert Res. 2015, 35, 683–689. [Google Scholar]
- Wu, D.; Yao, Y.; Liu, Y.; Liu, Y.; Wu, J. Study on the dynamic changes for ecological security of cultivated land in Panyu District of Guangzhou City. Ecol. Sci. 2016, 35, 160–168. [Google Scholar] [CrossRef]
- Peng, J.; Yang, Y.; Liu, Y.; Hu, Y.; Du, Y.; Meersmans, J.; Qiu, S. Linking ecosystem services and circuit theory to identify ecological security patterns. Sci. Total Environ. 2018, 644, 781–790. [Google Scholar] [CrossRef]
- Ma, S.; Xie, D.; Zhang, X.; Peng, Z.; Zhu, H.; Hong, H.; Xiao, J. Spatiotemporal variation in the ecological status of the Three Gorges Reservoir area in Chongqing. China Acta Ecol. Sin. 2018, 38, 8512–8525. [Google Scholar]
- Zhao, Z.; Xu, Z.; Cheng, S.; Lu, C.; Liu, G. Analysis on Dynamic of Carbon Storage in Tibet Attributable to Land Use and Land Cover Change. J. Nat. Resour. 2016, 31, 755–766. [Google Scholar]
- Li, P. Research on Land Ecological Security and Its Improvement Strategies in Henan Section of the Yellow River Basin. Master’s Thesis, Zhengzhou University, Zhengzhou, China, 2021. [Google Scholar]
- Fang, G.; Xiang, B.; Zhao, W.; Xie, Q.; Diao, Z.; Chi, W. Study on Soil Erosion in Lasa River Basin Based on GIS and RUSLE. J. Soil Water Conserv. 2015, 29, 6–12. [Google Scholar] [CrossRef]
- Zhang, K.; Peng, W.; Yang, H. Soil erodibility and its estimation for agricultural soil in China. Acta Pedol. Sin. 2007, 72, 1002–1011. [Google Scholar] [CrossRef]
- Wang, C.; Yu, C.; Chen, T.; Feng, Z.; Hu, Y.; Wu, K. Can the establishment of ecological security patterns improve ecological protection? An example of Nanchang, China. Sci. Total Environ. 2020, 740, 140051. [Google Scholar] [CrossRef]
- Wang, Z.; Wang, H.; Yang, S.; Liu, Q.; Gao, Y.; Heng, J.; Zhang, H. Identification and optimization strategy of ecological security pattern of Oasis in Xinjiang based on ecosystem service function:Taking Baicheng County as an example. Acta Ecol. Sin. 2022, 42, 91–104. [Google Scholar]
- Liu, M.; Li, L.; Wang, S.; Xiao, S.; Mi, J. Forecasting the future suitable growth areas and constructing ecological corridors for the vulnerable species Ephedra sinica in China. J. Nat. Conserv. 2023, 73, 126401. [Google Scholar] [CrossRef]
- Fang, Y.; Wang, J.; Huang, L.; Zhai, T. Determining and identifying key areas of ecosystem preservation and restoration for territorial spatial planning based on ecological security patterns: A case study of Yantai city. J. Nat. Resour. 2020, 35, 190–203. [Google Scholar]
- Cai, H.; Chen, Y.; Zha, D.; Zeng, H.; Shao, H.; Hong, T. Principle and method for ecological restoration zoning of territorial space based on the dominant function. Trans. Chin. Soc. Agric. Eng. 2020, 36, 261–270. [Google Scholar]
- Cheng, J.L.; Zhang, J.Y. Identification of Water-Land Coupled Ecological Security Patterns and Optimization of Ecological Resilience Assessment in Southwest China. Trans. Chin. Soc. Agric. Eng. 2025, 41, 272–281. [Google Scholar]
- Wang, Z.L.; Qiao, J.J.; Liu, H.L.; Wang, G.; Feng, Y. Spatiotemporal Evolution and Optimization Strategies of Ecological Security Patterns in the Middle Reaches of the Yellow River. Trans. Chin. Soc. Agric. Eng. 2024, 40, 231–239. [Google Scholar]
- Yang, R.Q.; MU, Z.X.; Huang, W.T.; Zhao, S. Construction of Ecological Security Pattern in Tarim River Basin Based on Ecosystem Sustainability. Environ. Sci. 2025, 1–19. [Google Scholar] [CrossRef]
- Huang, J.C.; Deng, X.Y.; QI, Y.F.; Wang, P. Construction of Ecological Security Pattern in Henan Province Based on MSPA, Circuit Theory and Space Syntax. Environ. Sci. 2025, 1–22. [Google Scholar] [CrossRef]
Disclaimer/Publisher’s Note: The statements, opinions and data contained in all publications are solely those of the individual author(s) and contributor(s) and not of MDPI and/or the editor(s). MDPI and/or the editor(s) disclaim responsibility for any injury to people or property resulting from any ideas, methods, instructions or products referred to in the content. |
© 2025 by the authors. Licensee MDPI, Basel, Switzerland. This article is an open access article distributed under the terms and conditions of the Creative Commons Attribution (CC BY) license (https://creativecommons.org/licenses/by/4.0/).