1. Introduction
Urban vibrancy, despite lacking a universally agreed definition, has been described from various perspectives, comprising human activities, urban spaces, and the interactions between them [
1]. For example, in her seminal works [
2,
3], Jacobs described urban vibrancy as the dynamic and ongoing activities of individual pedestrians in the streets. In contrast, Gehl [
4] and Lynch [
5] both focused on the aspects of urban spaces, with the former interpreting vibrancy as a sense of place and the latter considering vibrancy as a fundamental standard for good urban form. It has been widely recognized that urban vibrancy can promote urban productivity and economic sustainability since urban spaces with higher vibrancy can appeal to more people and capital [
6]. Also, higher urban vibrancy can breed more intensive interactions among urbanites and accelerate the spreading of ideas, which is particularly conducive for the development of innovative industries [
7]. Moreover, urban vibrancy has been proven to be beneficial for social inclusion and urban resilience [
8,
9]. Therefore, it is meaningful and indispensable to examine the nature of urban vibrancy and its influencing factors.
Indeed, recent years have witnessed the proliferation of urban vibrancy-related studies, with particular academic attention focusing on objectively quantifying urban vibrancy and disentangling the complicated associations between urban vibrancy and its influencing factors.
However, the quantification of urban vibrancy has long been challenging. As a matter of fact, the definition of vibrancy per se is controversial [
6]. Such challenges are largely due to the lack of appropriate data. Traditional data, such as questionnaires and census [
10,
11], are deft at revealing detailed information on people or things of interest. Yet, they are oftentimes costly to collect, updated infrequently, and limited in spatial and temporal resolution (in terms of spatial area and temporal duration) [
1]. Hence, traditional data can hardly capture the spatial and temporal dynamics of urban vibrancy. Fortunately, the increasing availability of big data, together with rapid development in data storage and computational technologies, has enabled researchers to measure urban vibrancy more scientifically [
12]. Broadly speaking, with the help of big data, researchers have used both single indicators and comprehensive indexes to quantitatively measure urban vibrancy. For the former, big data with location information, including cellphone call records data [
13], mobile phone signaling data [
14], social media check-in data [
15,
16], smart card data [
17], and Wi-Fi data [
18] are frequently used, with a variety of proxies applied for urban vibrancy. For the latter, since single indicators can be one-sided to a certain extent, some researchers have developed diverse comprehensive indexes for vibrancy measurement. For example, Tu et al. [
19] used multi-source urban sensing data (POIs, social media check-ins, and mobile records) and adaptively weighted these indicators to form an urban vibrancy index. Similarly, Huang et al. [
6] constructed a multi-dimensional evaluation framework including social activity intensity, economic intensity, and pedestrian intensity, based on social media data, Dianping life review data, and mobile phone GPS data. Recently, Jin et al. [
20] aggregated social, economic, and cultural dimensions to measure comprehensive vibrancy.
Meanwhile, identifying the influencing factors of urban vibrancy and revealing the associations between them have also been the core focuses of academic efforts in recent years. Among the factors, the built environment has gained the most attention. This can be traced back to Jane Jacobs’ pioneering explorations, as she stressed the significance of diversity in urban built environments at both the district and street levels in determining vibrancy [
2]. Also, in an anecdotal fashion, Jacobs pointed out the four conditions of urban vibrancy, including land use mix and urban function diversity, the diversity of buildings, small blocks, and density [
2,
3]. Afterwards, researchers all around the world have empirically (mainly quantitatively) examined Jacobs’ theory in non-American contexts (in particular, Asia and Europe) and confirmed the significant effects of built environment on urban vibrancy [
11,
17,
21,
22,
23]. More recently, the advancements in research regarding urban vibrancy-built environment associations include the three following aspects: (1) A more comprehensive delineation of the built environment. For example, Li et al. [
1] proposed a four-dimensional framework (i.e., morphology, function, configuration, and landscape) to measure the built environment and examined its impact on vibrancy in a historical district in Beijing. Lu et al. [
24] explored street-level visual and spatial features and revealed their influence on urban vibrancy; (2) The exploration of spatial and temporal heterogeneity in built-environment effects. For instance, Chen et al. [
25] and Chen and Huang [
26] delved into the spatially and temporally non-stationary effects of the built environment on urban vibrancy, applying spatial regression and geographically weighted regression models; (3) The examination of nonlinearity in built-environment effects has been stimulated and enabled by the introduction of machine learning methods into the domain of urban studies. For example, both Zhang et al. [
27], Xiao and Liu [
28], and Doan et al. [
29] verified the existence of salient nonlinear effects of built environment on urban vibrancy.
The aforementioned explorations helped disentangle the complicated relationships between urban vibrancy and its key determinant, i.e., built environment, providing valuable insights. However, research insufficiencies still exist. First, although streets have been recognized as vital for breeding and sustaining urban vibrancy by Jane Jacobs, seldom have researchers comprehensively delineated streets and clearly quantified their inherent characteristics, leaving the mechanisms underlying the role that streets play in urban vibrancy inadequately explained, particularly those reflecting spatial topology, geometric form, and flow capacity. Second, limited research has simultaneously examined the nonlinearity and spatial heterogeneity in the associations between built environment and urban vibrancy, thus potentially leading to oversimplifications or the miscalculations of those relationships. Addressing only one dimension—either nonlinearity or spatial heterogeneity—offers an incomplete picture. A more comprehensive understanding requires the concurrent analysis of both.
To fill the above gaps, this study takes Xiamen Island, China, as a case study to explore the nonlinear and spatially heterogenous effects of the built environment on urban vibrancy. The analysis employs a random forest (RF) model combined with the GeoShapley interpretation technique, with a particular focus on street configuration—a key component of the built environment—quantified through multiple metrics. The integration of RF and GeoShapley constitutes a geographical explainable artificial intelligence (GeoXAI) framework. GeoXAI extends conventional explainable artificial intelligence (XAI) techniques by incorporating spatial features into model interpretation, uncovering the spatial and nonspatial influence of model features on predictions. It enables the disentanglement of how the dependent variable nonlinearly responds to each independent variable and how these relationships vary across spaces. This makes the approach especially well-suited for investigating how the full spectrum of street configuration characteristics influences urban vibrancy. It makes three key contributions: (1) comprehensively quantifying economic vibrancy and street configuration at the community level using multi-source geospatial big data; (2) employing a GeoXAI approach to uncover the nonlinear and spatially heterogeneous relationships between built environment variables and urban vibrancy; (3) proposing both general and localized policy recommendations to support urban planning and design aimed at enhancing urban vibrancy.
The remainder of the paper unfolds as follows:
Section 2 describes the study area and data;
Section 3 introduces the methodology, including variable selection, modeling, and interpretation;
Section 4 and
Section 5 presents and discusses the research results;
Section 6 concludes the study.
4. Results
4.1. Vibrancy of Communities on Xiamen Island
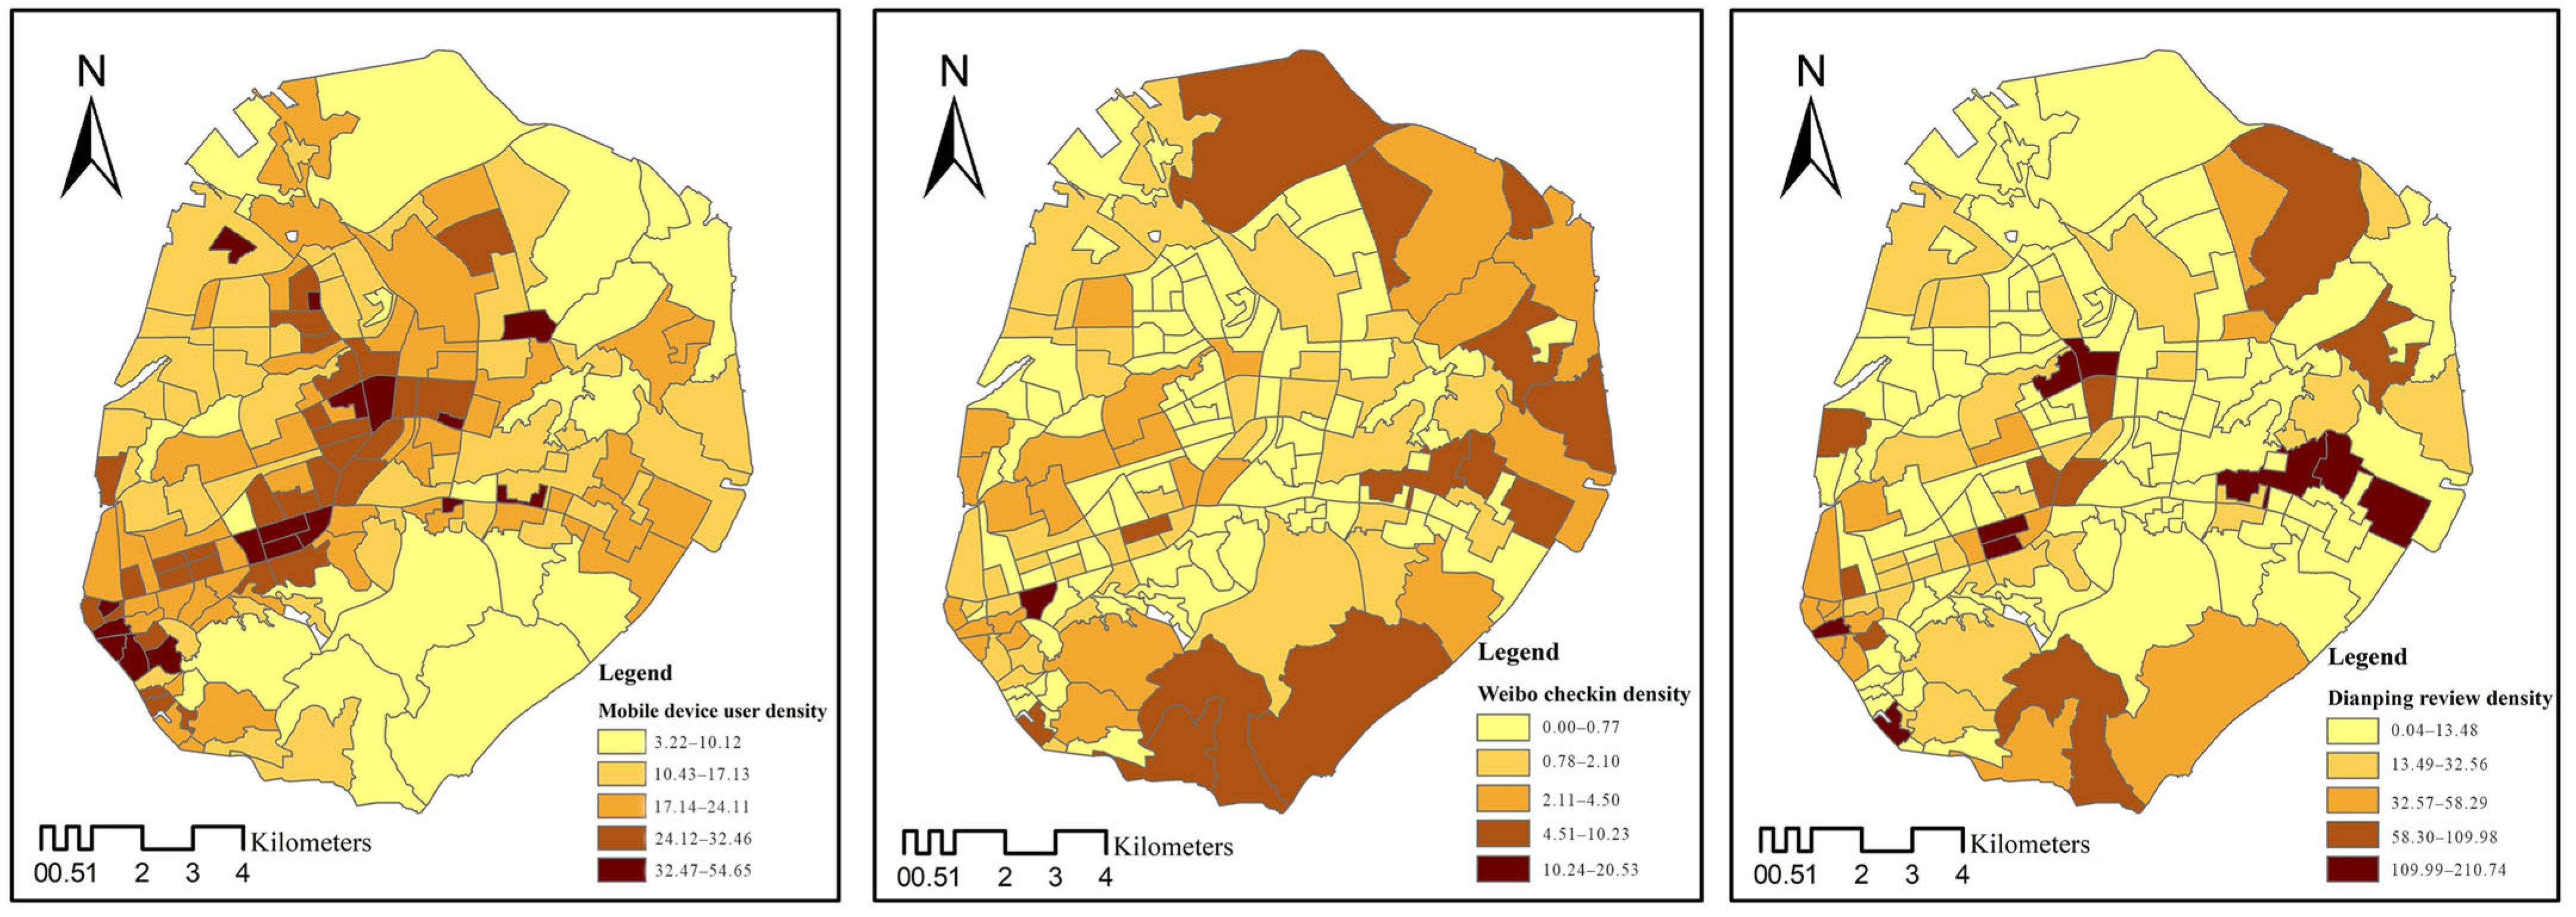
The vibrancy of communities on Xiamen Island is assessed by integrating mobile device user density, social media check-in density, and life service review density into a comprehensive vibrancy index using the entropy-weighting method, with weights of 0.083, 0.439, and 0.478, respectively.
Figure 2 and
Figure 3 illustrate the spatial distribution of these proxies and the resulting vibrancy index. As shown, the spatial distribution patterns of the three proxies for urban vibrancy vary considerably. The analysis reveals distinct spatial patterns, with high-vibrancy areas concentrated in historic urban districts (e.g., Zhongshan Road, Zengcuoan, and areas near the railway station) and newly developed zones (e.g., Wuyuan Bay in eastern Xiamen Island). These findings highlight the interplay of historical significance and modern development in shaping urban vibrancy.
4.2. Relative Importance of Location, Built Environment Variables, and Their Interactions
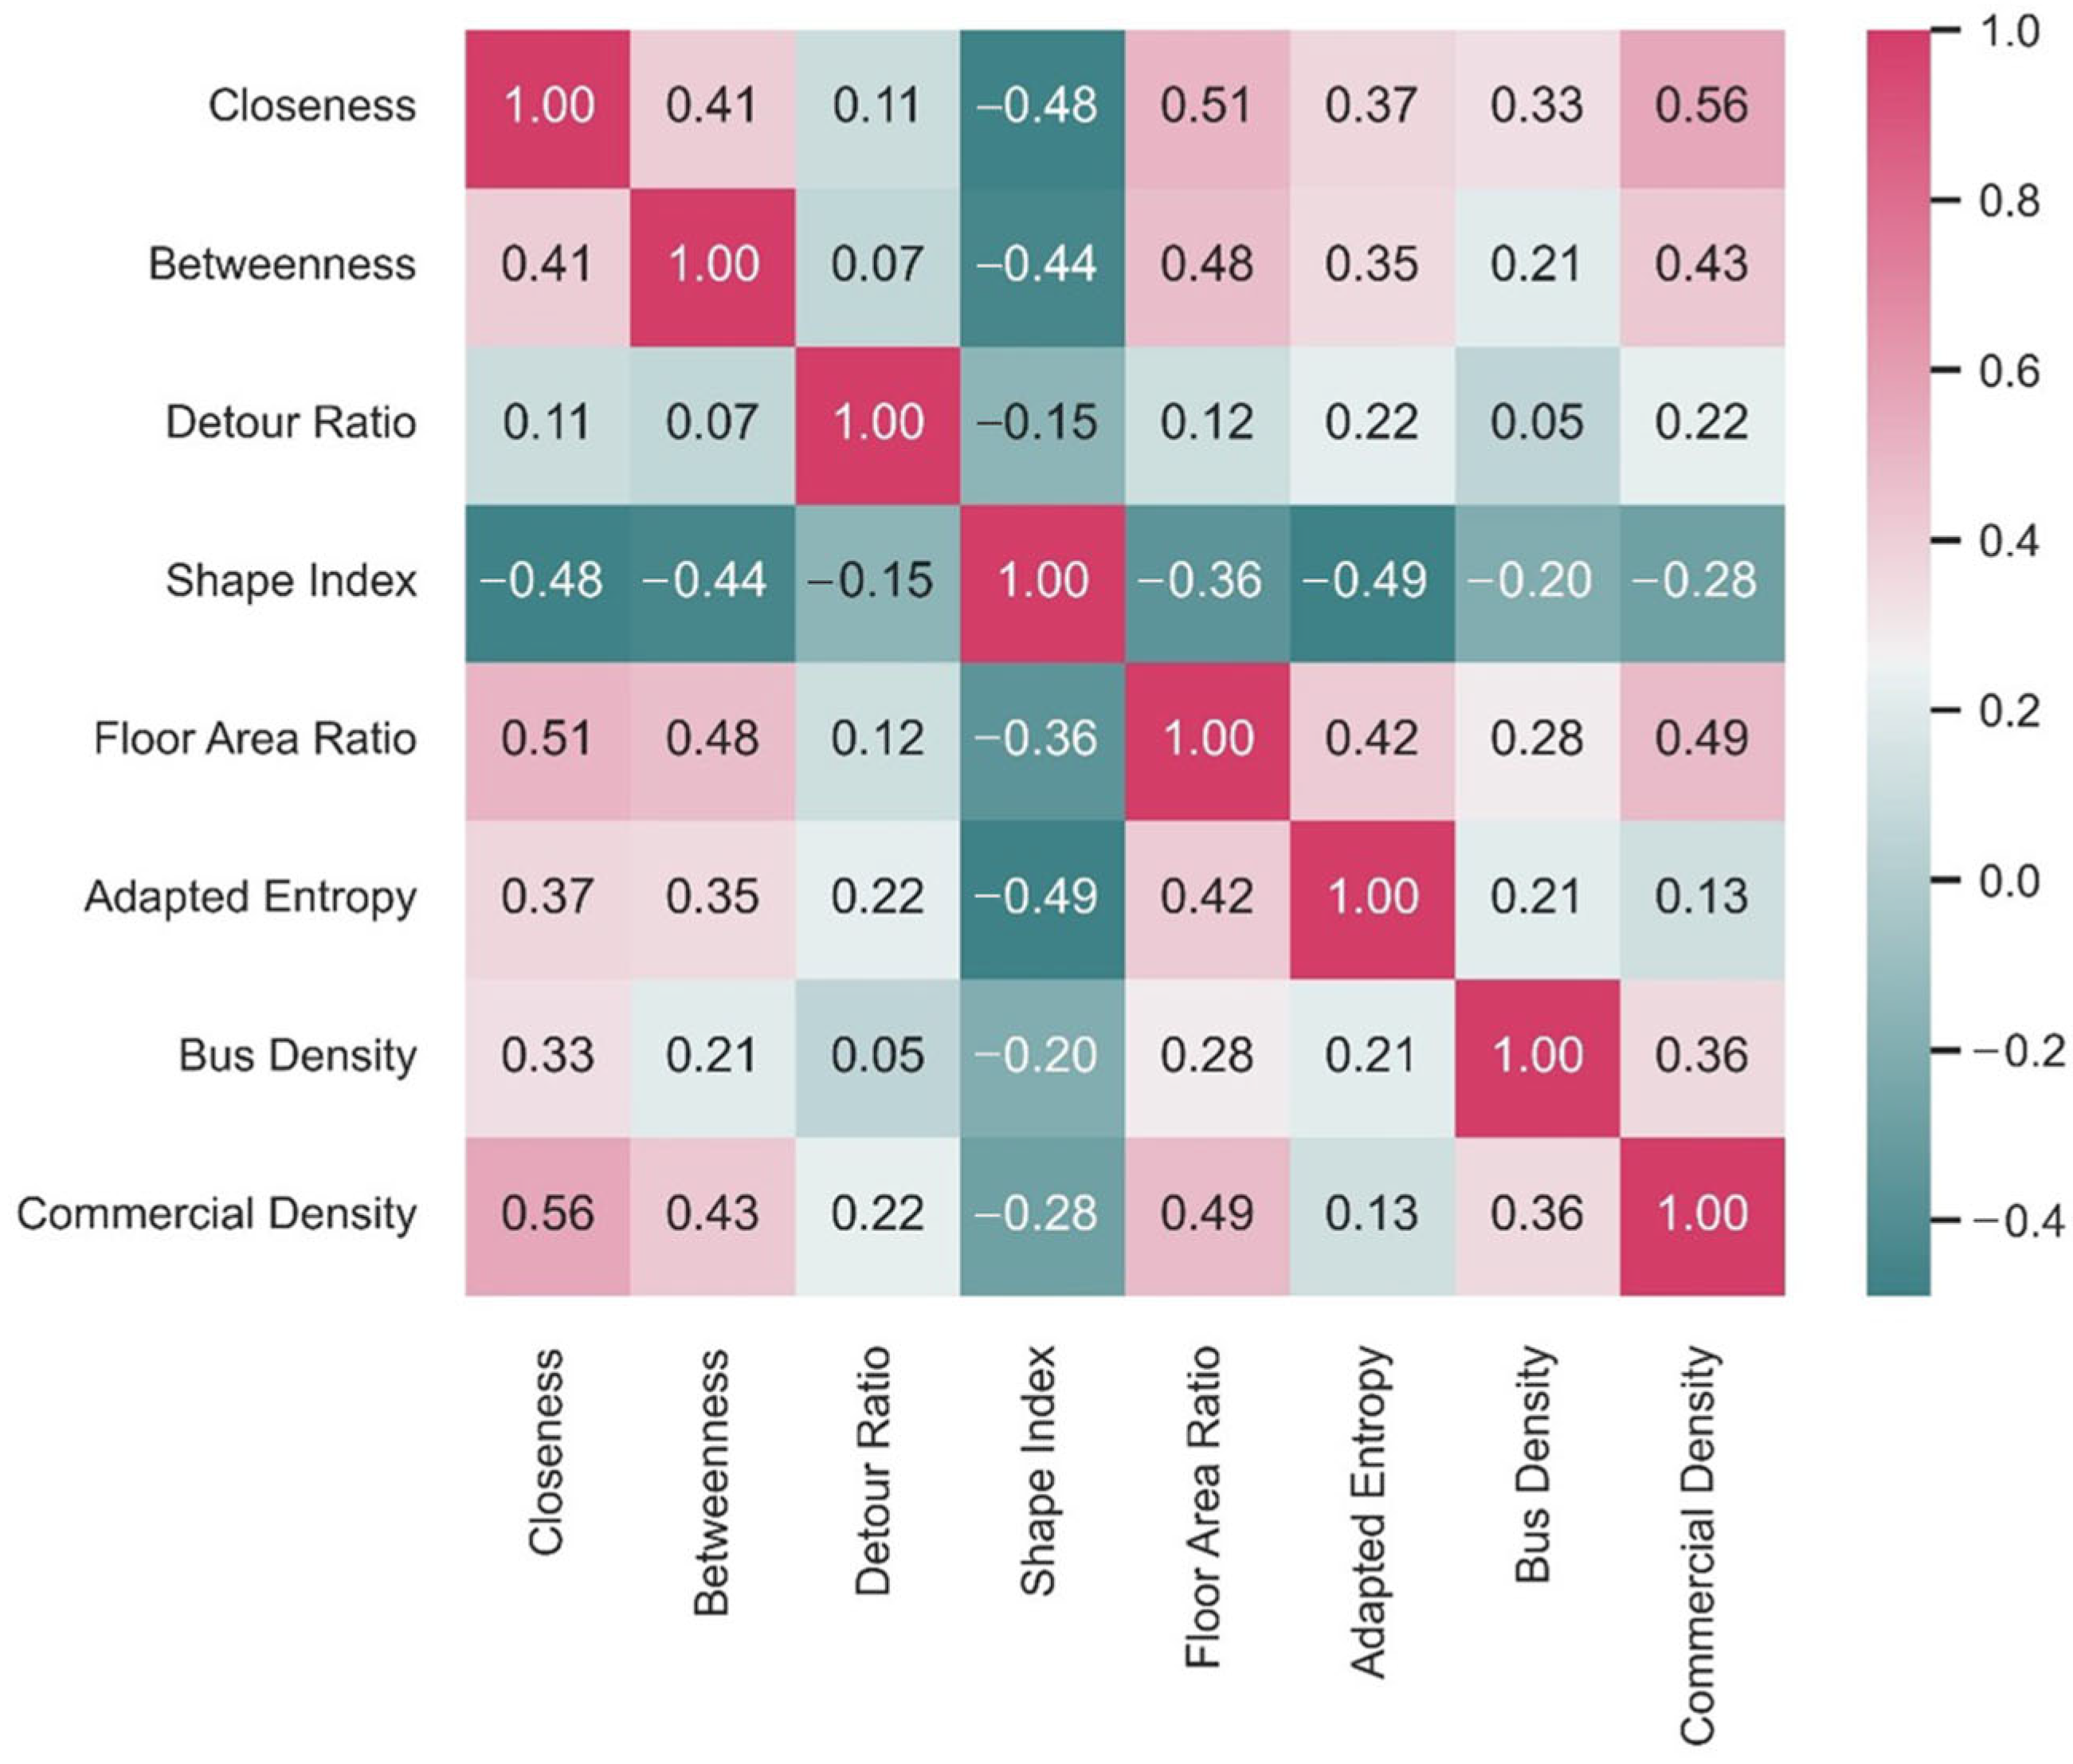
To examine potential multicollinearity among built environment variables, a Pearson correlation analysis is performed.
Figure 4 displays the resulting correlation matrix. It shows weak correlations (absolute Pearson coefficients < 0.3) for most variable pairs and moderate correlations (0.3–0.7) for a few, indicating minimal multicollinearity and supporting robust model interpretation.
A RF model is developed to predict urban vibrancy using built environment variables as inputs.
Table 3 summarizes the model’s performance, with the training set slightly outperforming the testing set. The GeoShapley method is applied to interpret the model, revealing the global, local, and spatial effects of built environment variables on urban vibrancy.
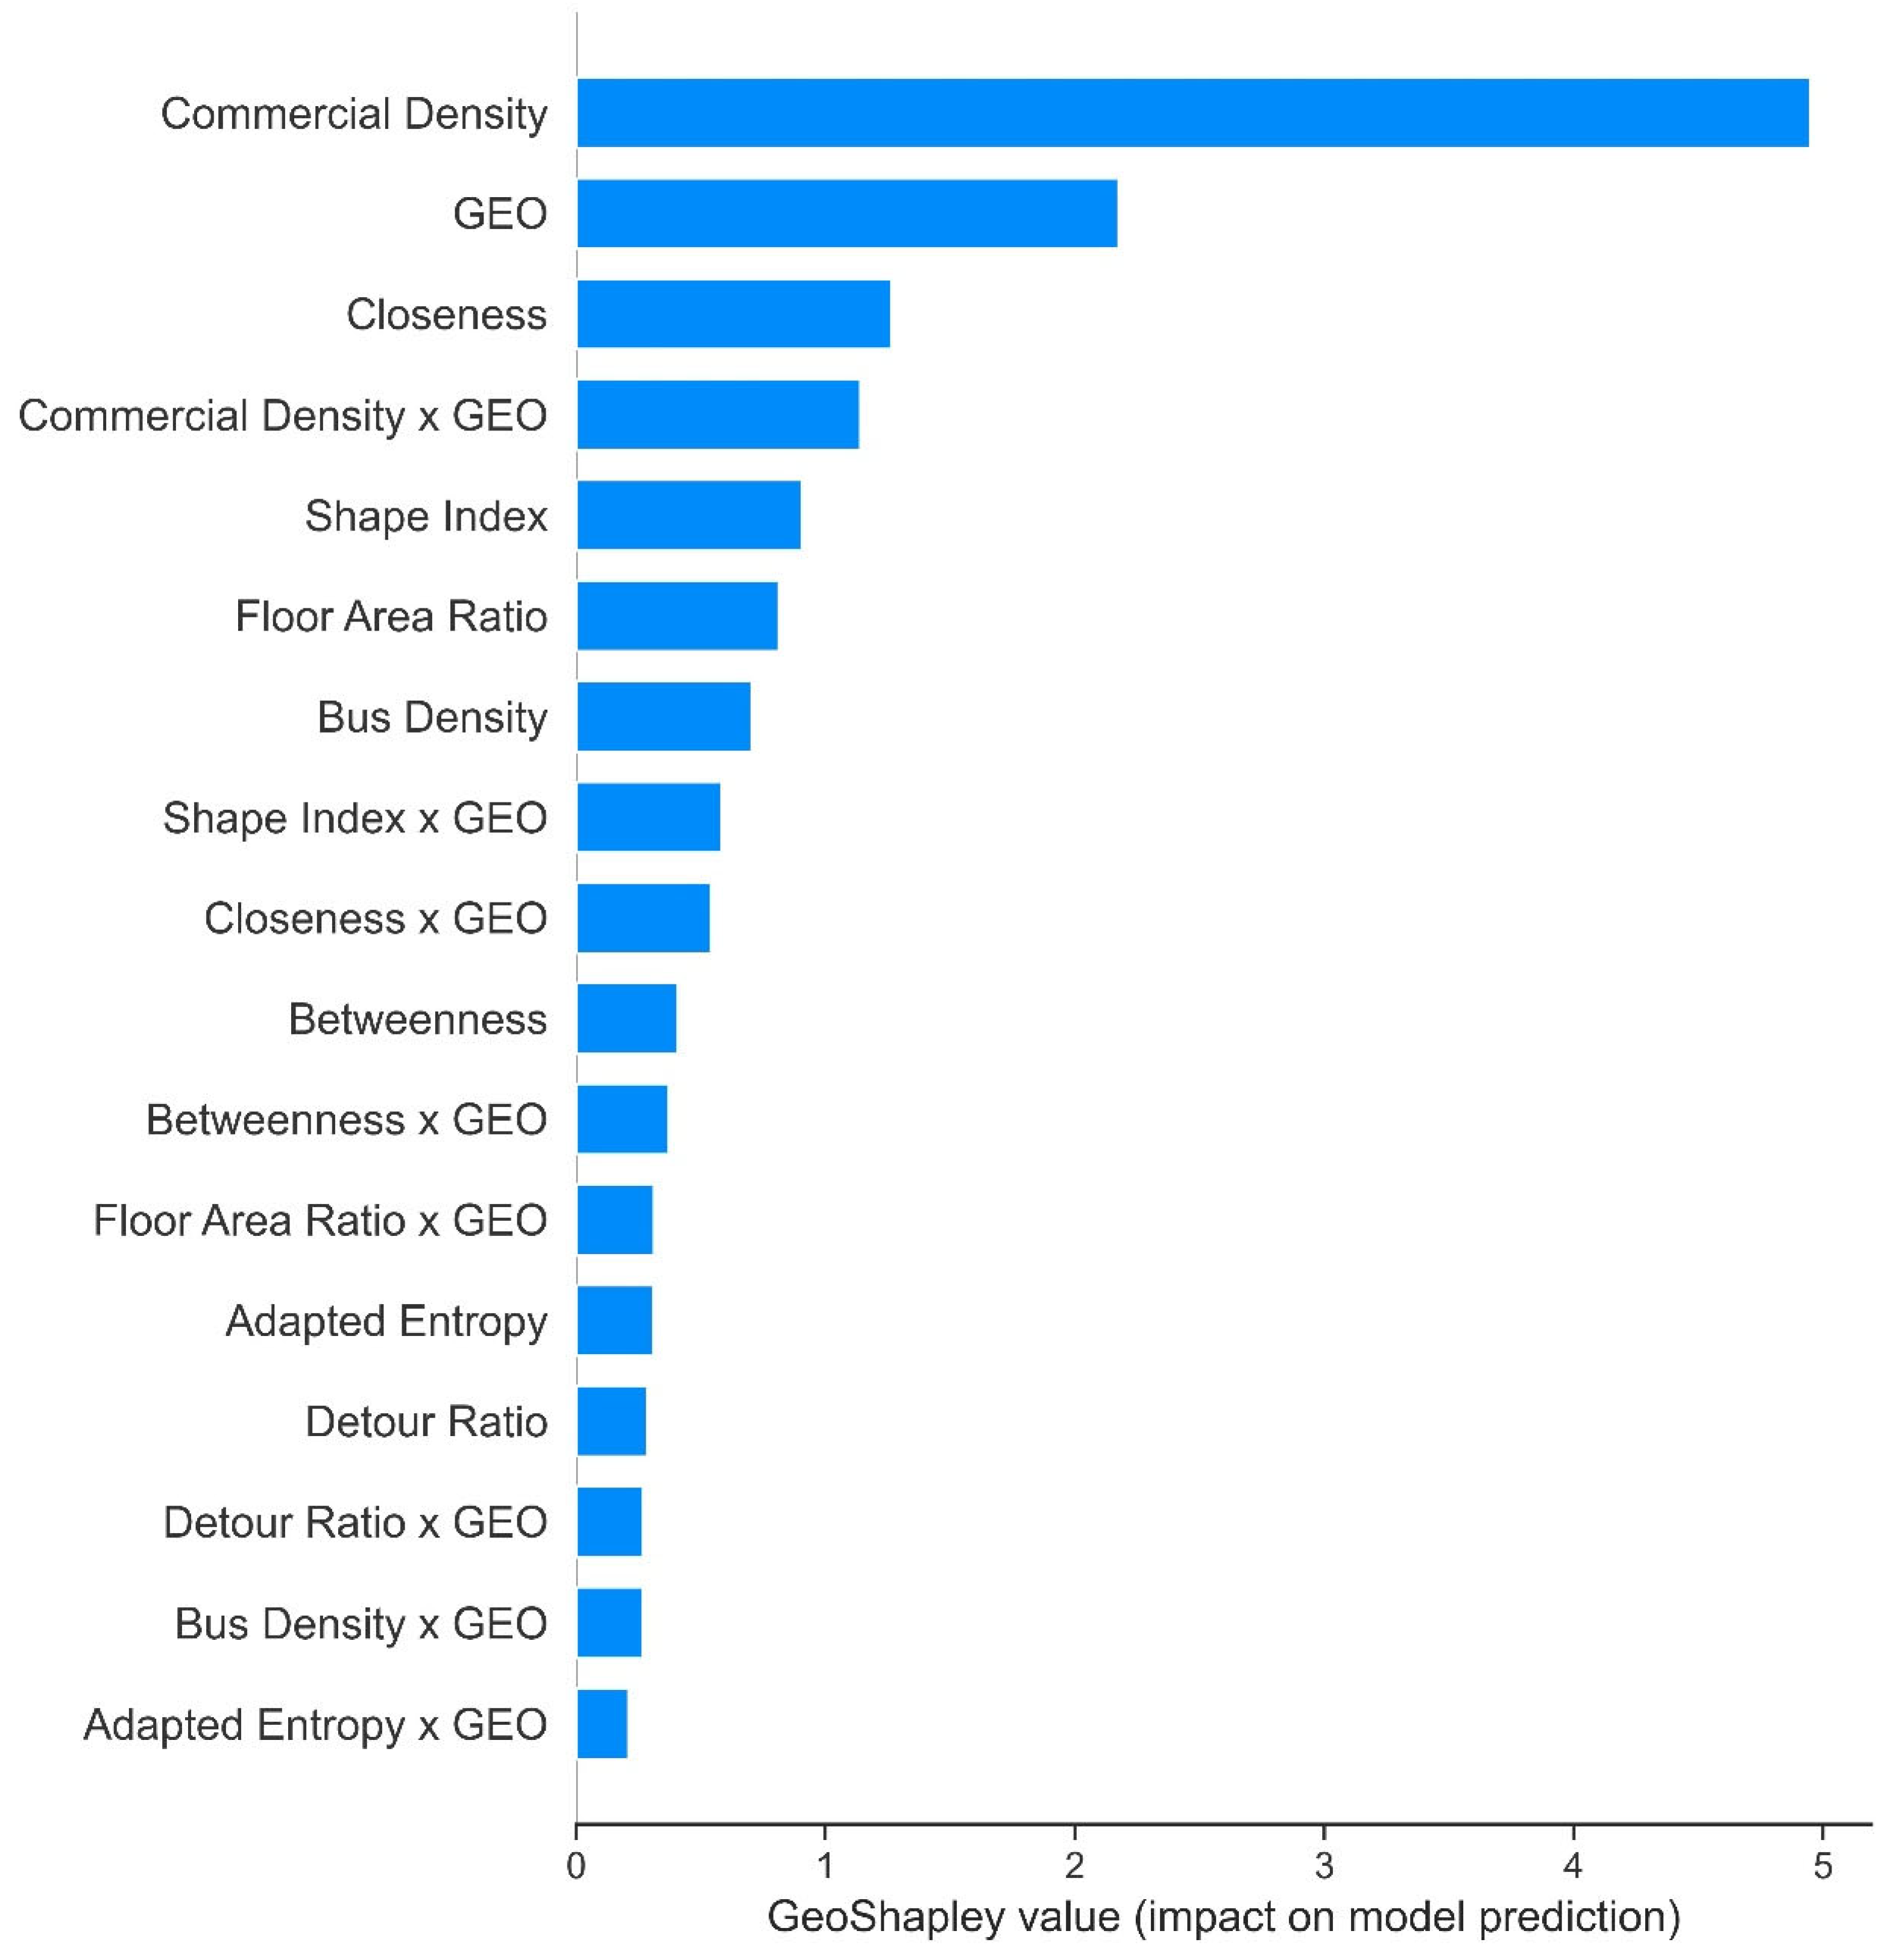
Figure 5 illustrates the global contributions of location, built environment variables, and their interactions to urban vibrancy (for summary statistics, please refer to
Table A1 in
Appendix A). Variables positioned closer to the top of the chart indicate greater relative importance in shaping the model’s predictions of urban vibrancy.
Location ranks as the second most important variable, highlighting its significant spatial effects on urban vibrancy. Among the built environment dimensions, destination accessibility and street configuration contribute most substantially at the global level, followed by building density and transit accessibility, while functional diversity shows relatively lower importance. Notably, commercial density stands out as the most influential predictor and shows a pronounced interaction effect with the location.
Street configuration indicators exhibit varying levels of relative importance in explaining urban vibrancy. Among them, closeness centrality and the shape index show stronger associations with urban vibrancy than betweenness centrality and the detour ratio. These indicators also display moderate spatial effects, with their importance rankings generally consistent with their respective main effects. Building density, measured by floor area ratio, significantly contributes but has limited interaction with location. Regarding the transit accessibility dimension, bus route density shows a moderate effect with relatively weak spatial effects, likely due to high transit coverage on the island. In terms of the functional diversity dimension, the adapted entropy index exhibits a relatively minor impact on urban vibrancy, accompanied by a low interaction effect with location.
4.3. Nonlinear Relationships Between Street Configuration and Urban Vibrancy
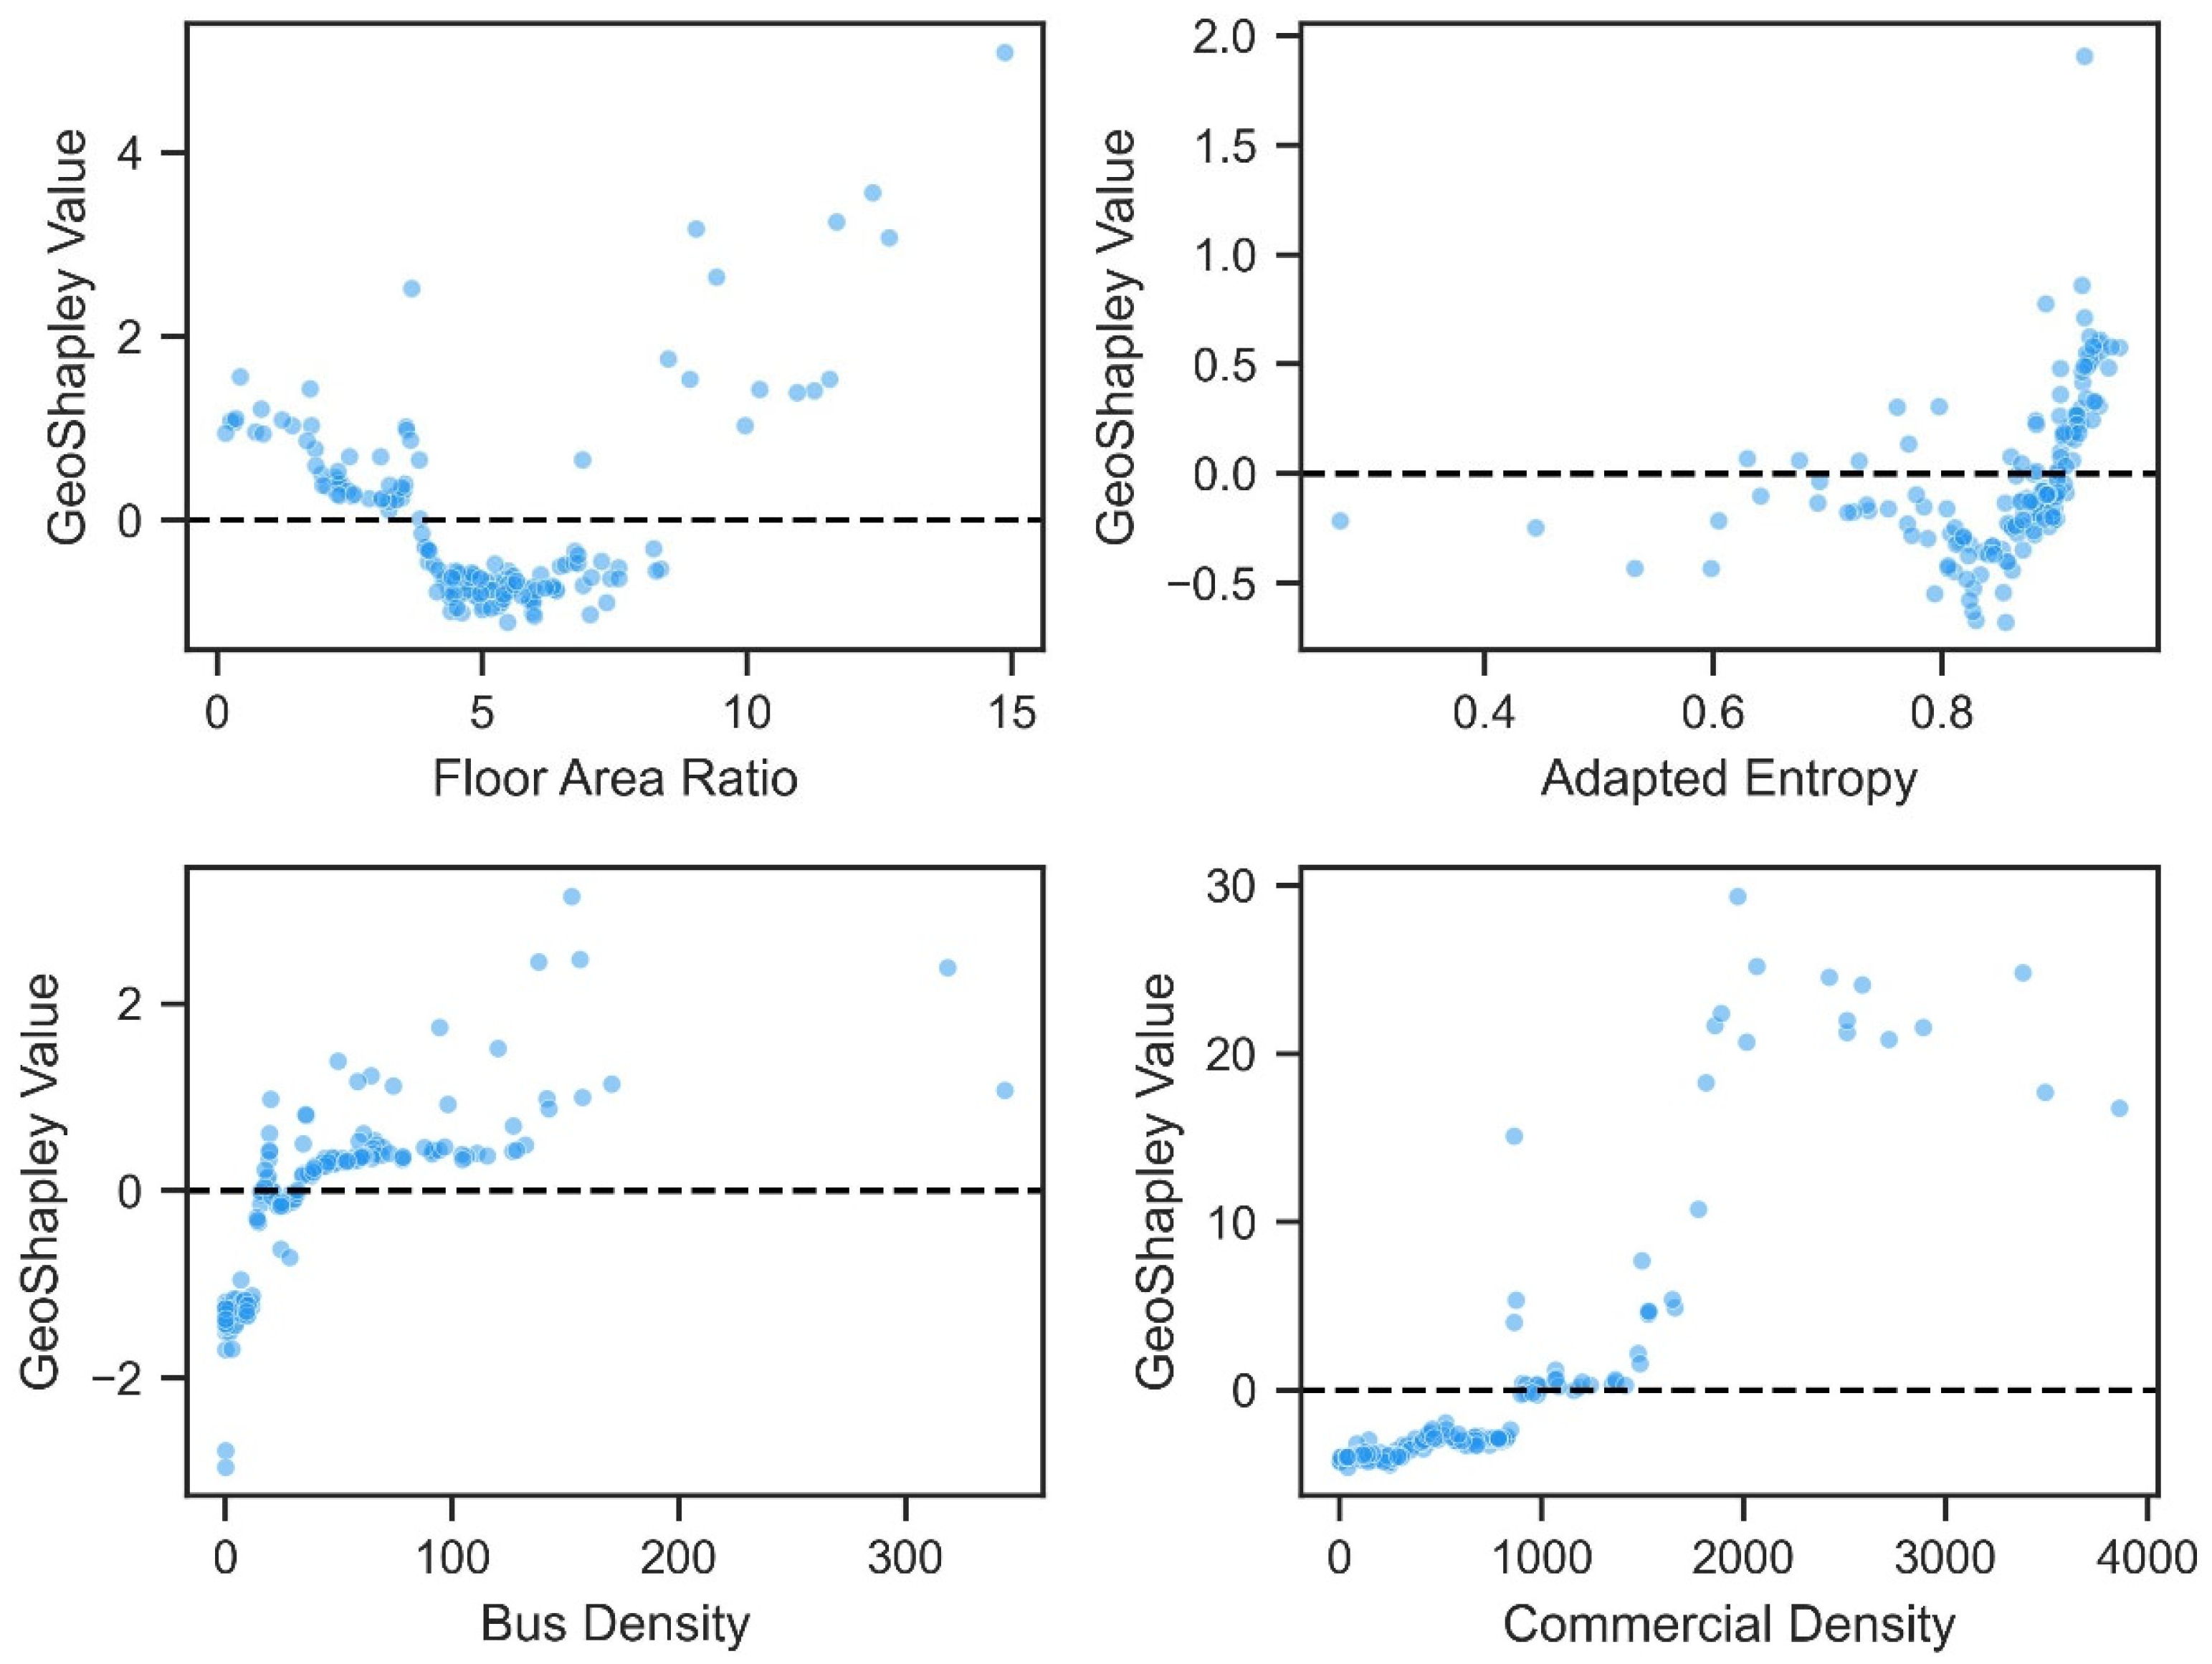
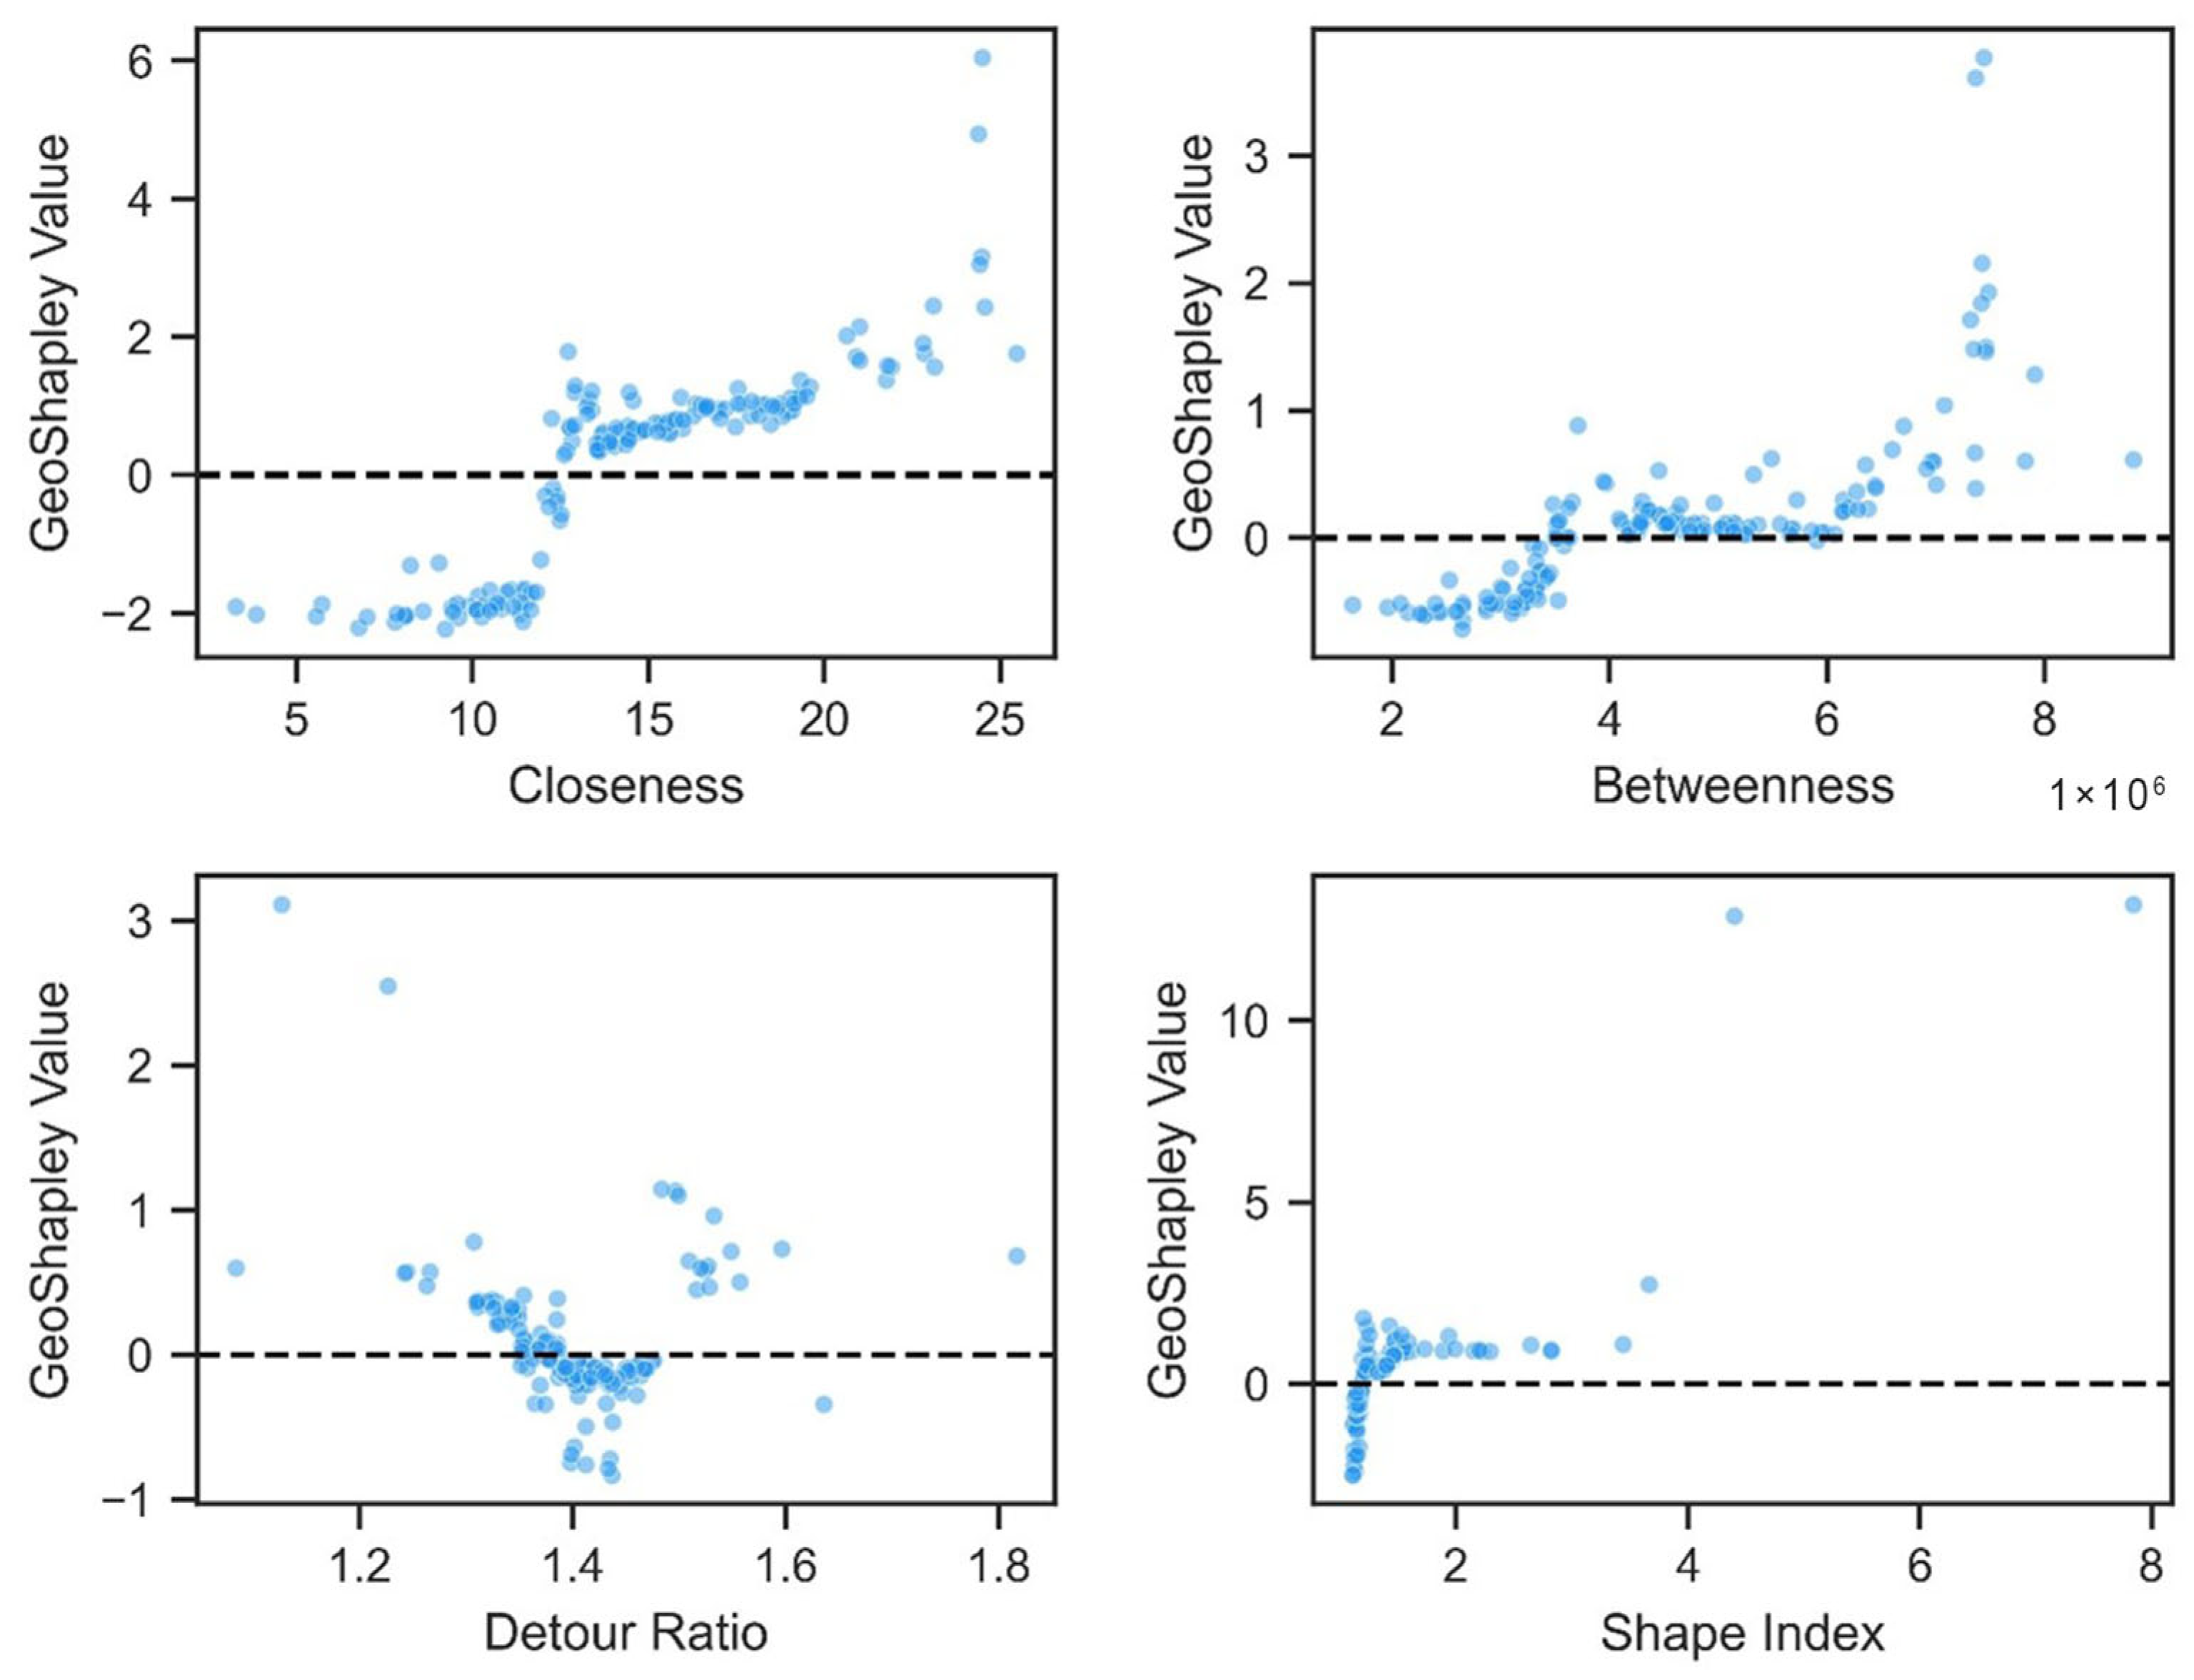
To further explore how street configuration variables influence urban vibrancy across different value ranges, this study employs local dependence plots to visualize their local effects. As shown in
Figure 6, each plot illustrates the local effects of a specific street configuration variable, with each point representing a community. The X axis indicates the value of the variable, while the Y axis represents its corresponding local effect on urban vibrancy. These plots reveal distinct nonlinear relationships between street configuration variables and urban vibrancy (for the relationships between urban vibrancy and other control variables, please refer to
Figure A1 in
Appendix A).
For closeness centrality, the relationship with urban vibrancy is generally positive but nonlinear. At lower values, the local effect remains relatively weak. However, a sharp increase occurs between the values of 11 and 13. Beyond this range, the effect continues to rise but at a slower rate. When the value exceeds 24, a second sharp increase emerges, suggesting an agglomeration effect on vibrancy. In the case of betweenness centrality, a similar nonlinear pattern is observed. When the value is below 4, the local effect on vibrancy rises gradually. Between the values of 4 and 6, the effect plateaus. After surpassing the value of 6, the local effect increases sharply again, similarly indicating an agglomeration effect. The detour ratio demonstrates a characteristic V-shaped relationship with vibrancy. Specifically, the local effect shows a downward trend when the ratio is below 1.45. After this threshold, the effect begins to recover and exhibits an upward trajectory again. Although this rebound may be partially affected by sample size limitations, the overall two-phase pattern remains observable. The shape index also exhibits a nonlinear relationship. Its local effect increases rapidly within the range of 1.0 to 1.5, indicating a rising contribution to vibrancy. Beyond this interval, the curve tends to flatten, suggesting saturation in its marginal contribution.
4.4. Spatially Varying Relationships Between Street Configuration and Urban Vibrancy
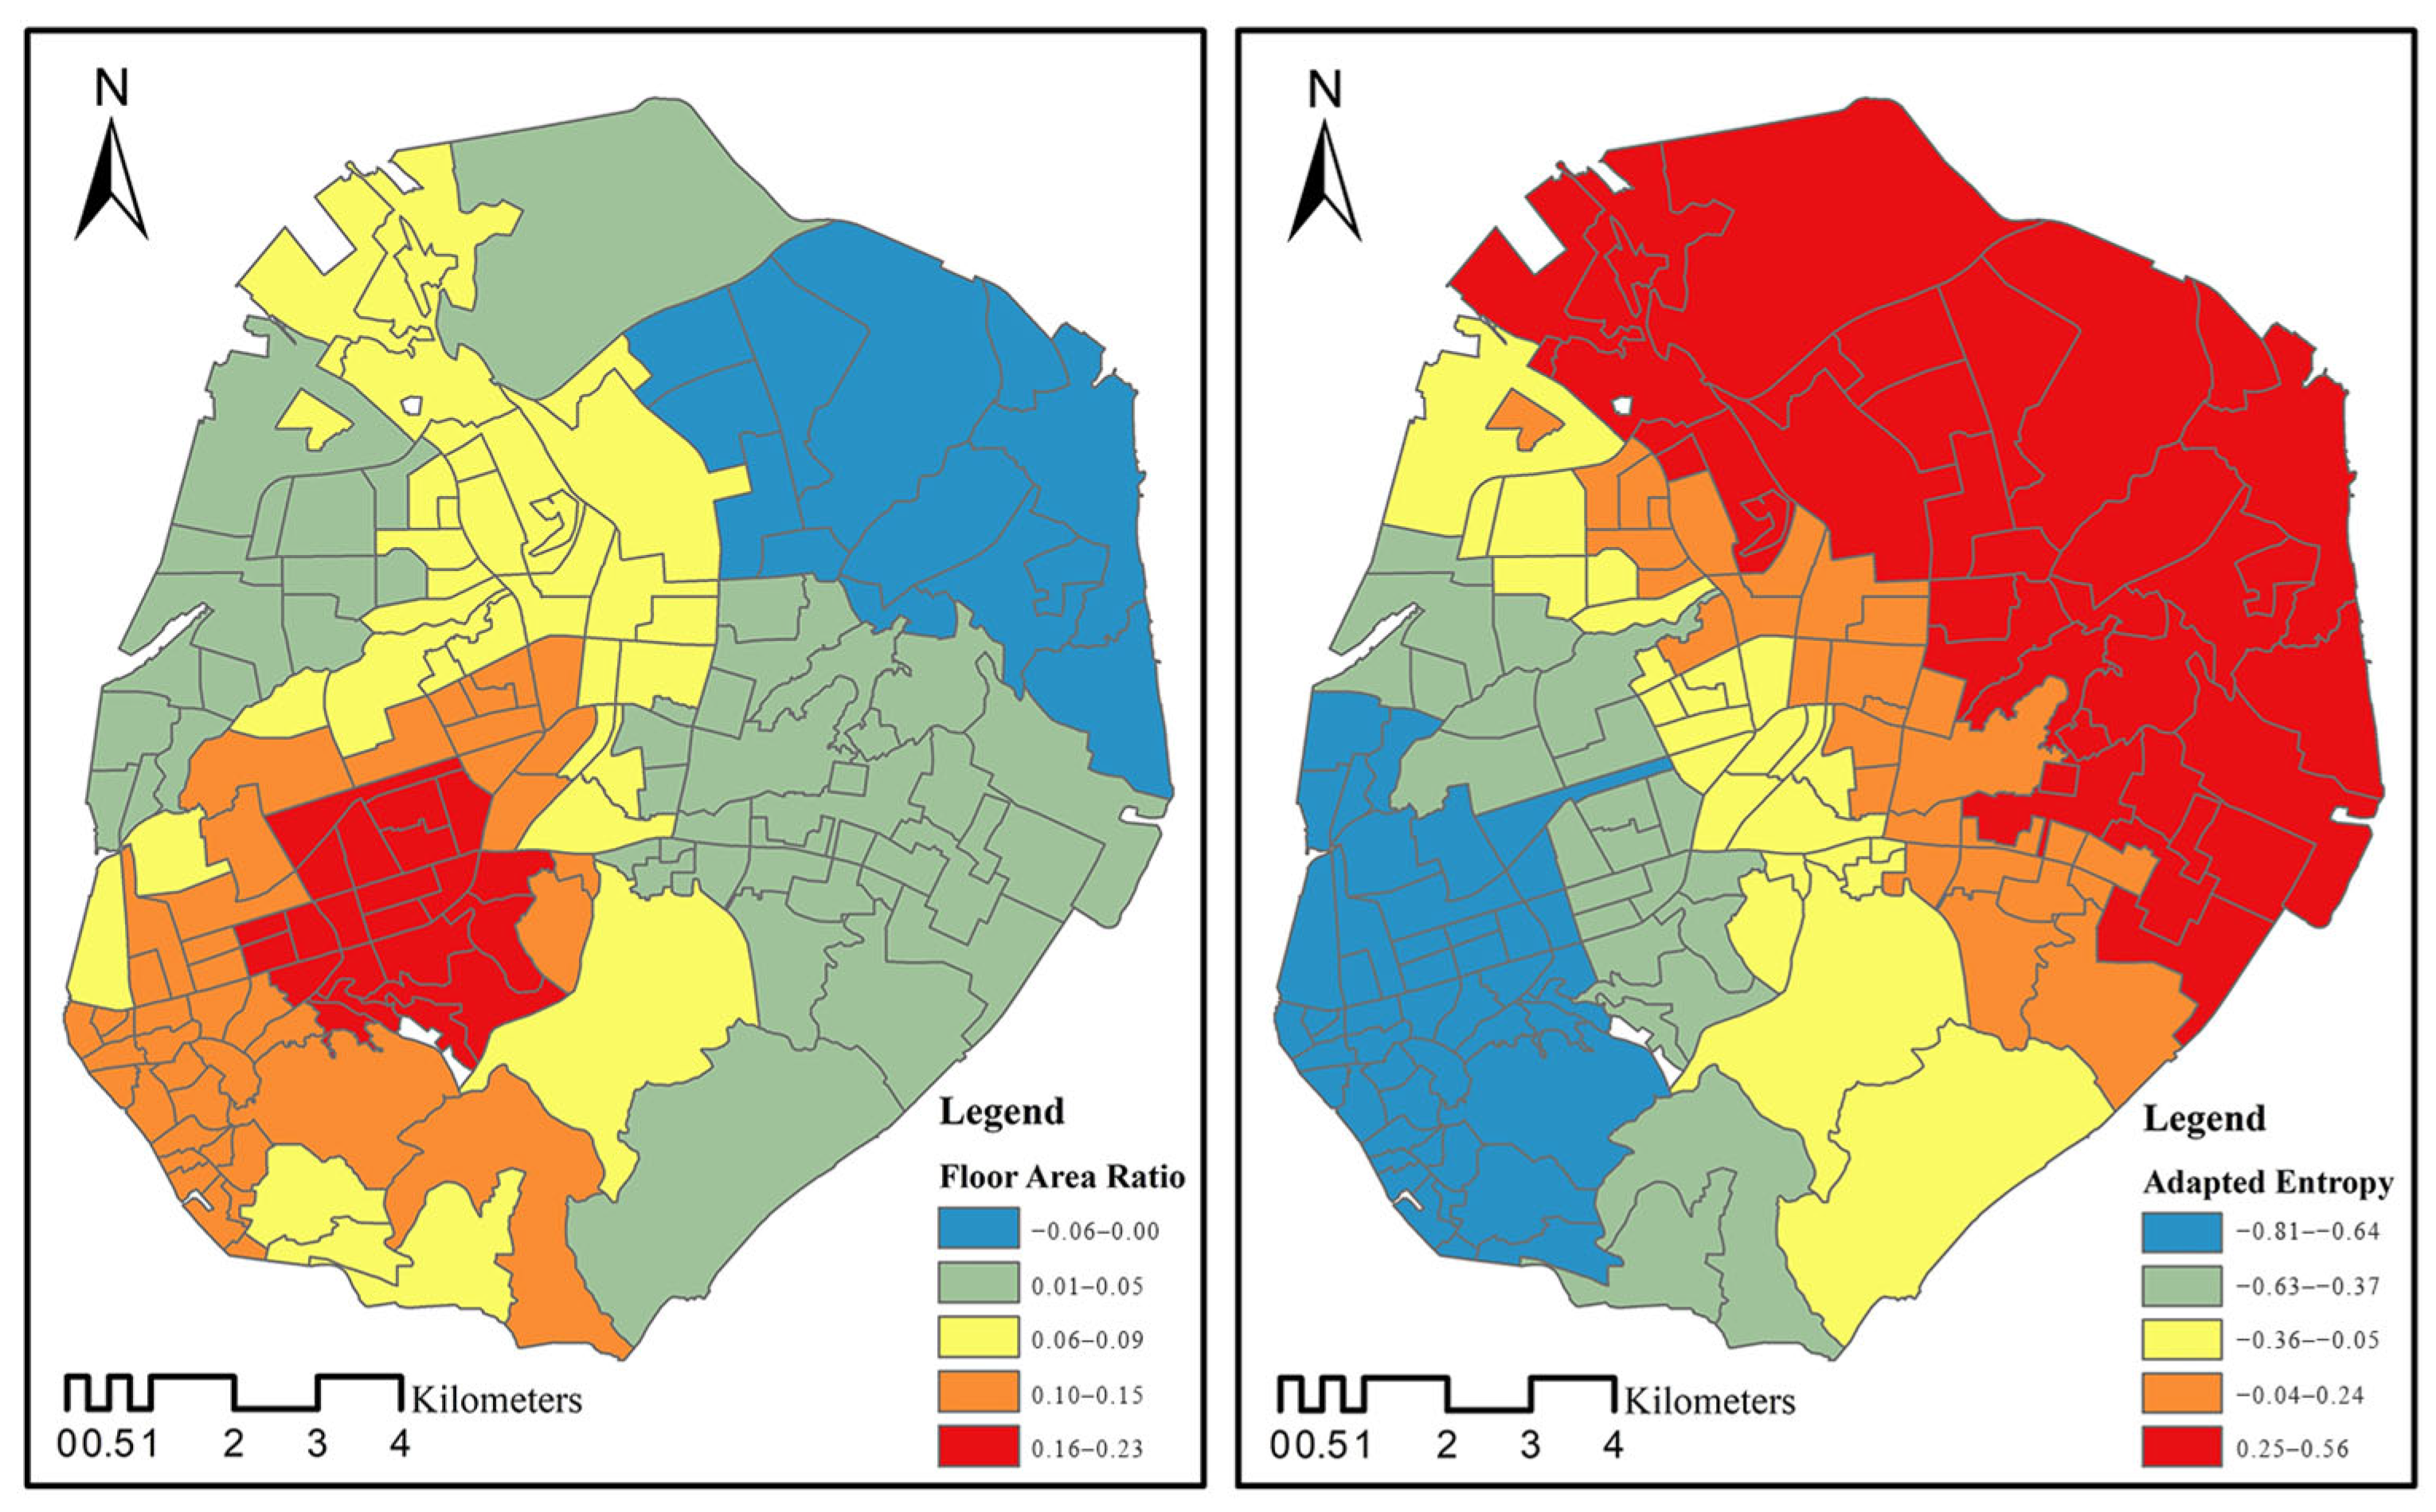
Figure 7 illustrates spatial varying relationships between street configuration variables and urban vibrancy (for the spatial varying relationships between urban vibrancy and other control variables, please refer to
Figure A2 in
Appendix A). The map colors represent regression-like coefficients, reflecting the change in urban vibrancy associated with a one-unit increase in each variable. The color gradient from blue (negative) to red (positive) captures the heterogeneous spatial effects of street configuration on urban vibrancy across different communities on Xiamen Island.
As shown, strong positive spatial effects of closeness centrality are observed in eastern, western, and northwestern areas, with negative spatial effects in the central region. Similarly, the eastern part of the island exhibits a significant positive correlation between betweenness and urban vibrancy. However, several areas in the southwestern and central parts of the island display a notable negative correlation. The central part of the island displays a negative correlation between detour ratio and urban vibrancy. The coefficient exhibits a spatial pattern of gradually increasing from the central area toward the eastern and southwestern parts of the island. When the shape index increases by one unit, the southwestern and central parts of the island exhibit a notable rise in urban vibrancy. By contrast, the eastern part of the island shows a negative correlation between shape index and urban vibrancy. These variations are likely attributable to the heterogeneous urban fabrics and land use patterns across different areas, highlighting the necessity of context-specific urban planning approaches.
5. Discussions
5.1. Interpreting the Relative Importance of Location, Built Environment Variables, and Their Interactions
The results demonstrate that location exerts a substantial influence on urban vibrancy, confirming the pronounced spatial heterogeneity in the associations between built environment and urban vibrancy. This reinforces the importance of incorporating spatial contexts into urban design and policy interventions.
The explanatory power of built environment variables varies depending on their roles in shaping spatial form, accessibility, functions, etc. Commercial density emerges as the most important variable. Fine-grained commercial establishments serve as catalysts for continuous pedestrian flow and diverse daily activities. When strategically distributed, they help foster a strong sense of place, thereby substantially enhancing urban vibrancy.
Street configuration variables generally rank high, followed by building density, transit accessibility, and functional diversity variables. Among street configuration variables, closeness centrality, and the shape index rank higher than betweenness centrality and the detour ratio. Closeness centrality reflects how easily people can reach a given location from other points within the network, serving as a proxy for spatial accessibility. The shape index captures the spatial compactness and morphological form of urban areas, which can influence how inviting or navigable a space feels. Both indicators are closely related to walkability, spatial enclosure, and the potential to support lingering, social interaction, and diverse human activity—key components of urban vibrancy. In contrast, betweenness centrality and detour ratio primarily represent network-level mobility characteristics, such as traffic flow and route efficiency. While essential for movement optimization, these indicators offer relatively limited explanatory power for the place-based, experiential, and social dimensions of urban vibrancy, which are more strongly shaped by local accessibility and spatial form.
The contribution of the floor area ratio is non-negligible. It reflects building concentration, which often correlates with higher population density, more efficient land-use, and greater potential for economic and social interactions. However, the interaction effect between floor area ratio and location is comparatively low, suggesting that its influence on vibrancy is relatively consistent across different spatial contexts. The moderate role played by bus route density as well as its weak spatial effects may stem from the saturation of public transportation services throughout most areas of the island, where the overall accessibility generally meets the daily mobility needs of local residents. Thus, the degree of spatial variation in transit accessibility is insufficient to manifest its spatial effects. The influence of adapted entropy on urban vibrancy is relatively limited. As suggested in previous studies [
14,
30], spatial functional orderliness’s impact on urban vibrancy appears to be nonlinear and context-dependent. Both low and high entropy values may, under different circumstances, contribute to increased levels of vibrancy, reflecting the complicated and subtle relationship between functional diversity and urban vibrancy.
5.2. Understanding the Nonlinear Effects of Street Configuration on Urban Vibrancy
The nonlinear associations imply that street configuration itself exerts nuanced, multi-dimensional, and threshold-sensitive effects on urban vibrancy, indicating that variations in street configuration variables can either enhance or inhibit pedestrian movement, social interaction, and spatial experience, depending on whether their values fall within or across certain critical thresholds.
The centrality in the patterns of closeness reveal a nonlinear relationship with urban vibrancy. At low levels, limited spatial centrality constrains the concentration of people, facilities, and activities, thereby weakening the urban fabric’ capacity to support vibrant social interactions. As closeness improves, enhanced accessibility facilitates pedestrian movement, fosters social interaction, and encourages participation in diverse urban activities, collectively promoting urban vibrancy. However, once accessibility reaches a certain threshold, its positive effects saturate, indicating diminishing marginal returns. Interestingly, at very high levels of closeness, an agglomeration effect emerges as the intensification of key destinations and the clustering of urban functions leads to a renewed surge in vibrancy. These findings suggest that planning interventions should aim to elevate closeness centrality toward critical ranges (e.g., 11–13 and above 24) through strategies such as introducing finer-grained street networks and strengthening pedestrian linkages between functional nodes. Such interventions are particularly effective for promoting vibrancy in areas with poor walkability.
A similar nonlinear pattern is observed for betweenness centrality, characterized by an initial rise in urban vibrancy, followed by a plateau and a subsequent resurgence. At low levels, street segments play a minor role within the network, contributing little to vibrancy. As betweenness increases, these segments begin to function as critical connectors between urban areas, facilitating both pedestrian movement and the integration of urban functions, thereby enhancing vibrancy. Once a certain threshold is reached, however, further increases in betweenness produce diminishing returns. Nevertheless, an exceptionally high level of betweenness may indicate the presence of major transportation corridors or urban hubs characterized by intense flows. In such a context, an agglomeration effect driven by intensified spatial interactions and concentrated activities may emerge, resulting in another substantial boost in urban vibrancy. Building on these insights, planners should consider enhancing the performance of underutilized street segments by increasing their betweenness to reach the critical threshold of approximately 4 × 10⁶, enabling them to serve more effectively as urban connectors. In areas with exceptionally high betweenness, planning strategies should actively leverage the agglomeration effect by strengthening multimodal integration and upgrading public spaces to support intense flows and encourage social interactions.
The detour ratio’s V-shape highlights its dual effects: low circuity supports efficiency-driven vibrancy, while high circuity in historical areas fosters exploration and localized vibrancy. At low detour ratios, increasing circuity tends to reduce travel efficiency, discourage pedestrian activity, and weaken residents’ willingness to engage with the surrounding environment, thereby suppressing urban vibrancy. However, once the ratio surpasses the critical threshold of about 1.4, its local effect begins to rebound. This rebound highlights the unique spatial configurations of certain areas with a high detour ratio, such as historical neighborhoods, where narrow alleys, nonlinear paths, and irregular networks promote pedestrian exploration, lingering, and localized social interactions. These spatial characteristics collectively nurture place-based vibrancy, suggesting that, in certain urban contexts, a high detour ratio can support a more immersive and vibrant urban experience. In practice, these findings underscore the need for context-sensitive planning strategies. In historically or culturally significant neighborhoods, planners should avoid over-simplifying street networks, as their complexity contributes to unique spatial experiences and localized vibrancy. Conversely, in modern urban settings, reducing excessive spatial complexity can help promote movement and engagement, thereby enhancing vibrancy.
The shape index’s rapid rise and subsequent plateau suggests that moderately irregular urban forms enhance adaptability, but excessive fragmentation may hinder spatial coherence. Moderately irregular urban forms may enhance the flexibility of space usage, improve navigability, and accommodate a broader range of urban functions and activities. Such forms often allow for more adaptable land uses, better integration with transport networks, and greater opportunities for social interaction, all of which contribute positively to urban vibrancy. However, once the shape index exceeds a threshold of 1.5, the vibrancy benefits begin to plateau. Excessively fragmented or elongated urban forms may reduce legibility, hinder orientation, and disrupt the coherence of public spaces, ultimately constraining further improvements in vibrancy. This pattern underscores the importance of balancing spatial complexity and clarity in urban design. Accordingly, planners are encouraged to adopt moderately irregular urban fabrics, such as curvilinear street patterns and flexible parcel layouts, to enhance spatial adaptability without comprising coherence. At the same time, care should be taken to avoid excessive fragmentation, particularly in newly developed areas where spatial legibility and functional integration are critical for fostering urban vibrancy. These insights guide planners to balance accessibility, connectivity, and spatial form in urban design.
5.3. Understanding Spatial Heterogeneity in the Associations Between Street Configuration and Urban Vibrancy
The spatially varying relationships identified in the
Section 4.4 reveal that the effects of street configuration on urban vibrancy are not uniform across the study area. Instead, they exhibit clear geographic heterogeneity, with the same variable showing different directions and magnitudes of influence across communities.
Closeness centrality’s positive spatial effects in peripheral areas reflects its role in reconnecting fragmented urban fabrics, while its negative effect in central residential areas suggests activity dispersion. Closeness enhances urban vibrancy by connecting people and urban functions. The urban fabric of the peripheral areas is fragmented by highways and overpasses, which reduce walkability and hinder direct access between adjacent parcels. In such contexts, an increase in closeness helps reconnect fragmented urban spaces, facilitates pedestrian circulation, and activates underutilized public spaces, thereby significantly enhancing urban vibrancy. In contrast, the central areas are predominantly residential neighborhoods characterized by relatively homogeneous land uses. In such single-function zones, improvements in closeness may improve residents’ access to services and amenities located in surrounding areas, but it does not necessarily stimulate local activity. This outward dispersion of activity may, paradoxically, dilute localized vibrancy, despite higher spatial accessibility.
As for betweenness, the eastern part of the island exhibits remarkably stronger spatial effects on urban vibrancy compared to the western and central areas. The positive correlations observed in the eastern region may be attributed to the fact that higher betweenness facilitates greater traffic flows, thereby enhancing the likelihood of pedestrian stopping, lingering, and the use of commercial facilities and public services. In such contexts, elevated betweenness improves the spatial integration of key routes, promoting interaction between people and the built environment. Conversely, the negative correlations identified in the southwestern area are likely related to its attributes as a historic district, where the existing traffic burden is already substantial. In such settings, further increases in betweenness may exacerbate congestion, reduce travel efficiency, and ultimately diminish opportunities for the interaction with the surrounding environment. Given that the central area is characterized by homogeneous residential neighborhoods, increases in betweenness tends to facilitate outward movement, encouraging residents to access services and amenities elsewhere rather than promoting local engagement. This can lead to a decline in urban vibrancy, even as network connectivity improves.
The detour ratio’s positive effects in historical areas and negative effects in the central district highlight both the value of circuitous street networks for urban exploration and the importance of network efficiency in high-density urban cores. The eastern area is characterized by a high concentration of commercial and public service facilities, while the southwestern area contains historical neighborhoods. In these contexts, an increase in detour ratio may promote pedestrian exploration, as circuitous street networks encourage individuals to linger in historical sites and navigate through a variety of destinations, thus positively contributing to urban vibrancy. In contrast, the central part of the island is predominantly composed of dense residential and industrial zones, where daily activities are largely purpose-driven and efficiency-oriented, such as commuting or freight transport. In such areas, an increase in detour ratio often translates into longer travel times, elevated transportation costs, and reduced travel efficiency. As a result, this may discourage spontaneous interactions and activities, ultimately leading to a decline in urban vibrancy.
The shape index’s stronger effects in the southwestern and central areas support the advantages of fine-grained urban elements in historical areas, whereas eastern modern areas benefit from spatial clarity. In the southwestern and central areas, increased morphological irregularity supports the development of corner shops, pocket plazas, and alleyway stalls. These fine-grained urban elements promote spontaneous social interactions, enhance pedestrian engagement, and act as important contributors to localized vibrancy. By contrast, the eastern part of the island, being a newly developed area, is primarily characterized by large-scale urban complexes integrating commercial and public amenities. Unlike small business establishments, these complexes rely more heavily on spatial legibility and accessibility to attract people. However, increases in the shape index often leads to greater morphological irregularity, which may reduce the clarity of the urban form and weaken the coherence of public spaces. This in turn impairs spatial orientation and limits intuitive access to those urban complexes, thereby dampening the potential for vibrancy gains. These findings advocate for spatially informed urban interventions to maximize vibrancy, including enhancing closeness in fragmented areas, managing congestion in high-betweenness zones, preserving circuitous networks in historical districts, and balancing morphological irregularity to maintain spatial legibility.
6. Conclusions
This study examines the nonlinear and spatially varying impacts of street configuration on urban vibrancy based on the multi-source data of 159 communities on Xiamen Island. We systematically depict street configuration from three dimensions: network centrality, network detour, and morphological compactness. By employing a GeoXAI approach (i.e., integrating RF model with GeoShapley), we conduct an in-depth analysis of the global, local, and spatial effects of built environment variables on urban vibrancy. Our findings provide insights for more nuanced and context-sensitive intervention for urban vibrancy enhancement.
This study highlights the multifaceted drivers of urban vibrancy. Location emerges as a key determinant, significantly contributing through both main effects and interaction effects. Among the built environment dimensions, commercial density, street configuration, and building density exert the most substantial influence on urban vibrancy. Within the street configuration dimension, closeness centrality and the shape index capturing spatial accessibility and morphological compactness show particularly strong associations with urban vibrancy. In contrast, functional diversity and transit accessibility demonstrate relatively lower importance, suggesting that simply increasing the land-use mix or transit coverage may be insufficient for fostering local vibrancy. These findings suggest that planning efforts should prioritize promoting fine-grained commercial development, enhancing street accessibility, and achieving moderate spatial irregularity, all of which are more strongly linked to cultivating vibrant urban environments.
The findings also underscore the nonlinear and threshold effects of street configuration variables on urban vibrancy. Both closeness centrality and betweenness centrality exhibit positive associations with vibrancy. Yet these relationships are marked by identifiable thresholds, beyond which the marginal benefits of increased accessibility either plateau or shift. The detour ratio displays a V-shaped relationship, suggesting that both low and high values may foster vibrancy, albeit under different conditions. The shape index highlights the benefits of moderate spatial irregularity, while cautioning against excessive morphological fragmentation. These results suggest that urban vibrancy responds unevenly to changes in the built environment. Instead, effects can be strong and positive within certain intervals, but weak or even negative in others. This challenges the conventional “more-is-better” paradigm and calls for a more nuanced and interval-sensitive approach. Rather than applying uniform increases across all variables, urban design and planning should focus on identifying and targeting optimal thresholds and effective intervals that collectively foster and sustain urban vibrancy.
Furthermore, this study reveals the spatial heterogeneity in how street configuration variables influence urban vibrancy. Closeness centrality and betweenness centrality exert stronger influences in destination-intensive areas, where improved accessibility to key destinations stimulates higher levels of activity and engagement. Conversely, in homogeneous residential neighborhoods, increased street network centrality may facilitate outward movement and thus reduce local engagement. The detour ratio and shape index also exhibit spatially varying impacts. In traditional fine-grained neighborhoods, these metrics positively correlate with vibrancy by encouraging exploration and interaction. However, in other contexts, particularly those prioritizing efficiency or lacking diverse functions, higher detour ratios and morphological irregularity may partially hinder movement or stay. These findings suggest that built environment interventions should be context-specific. Rather than applying universal strategies such as indiscriminately increasing accessibility or morphological irregularity, urban practitioners and policy makers should identify where and under what conditions certain street configurations, urban form, and land use patterns contribute to urban vibrancy, and tailor intervention strategies accordingly.
This study provides a systematic exploration of how street configuration influences urban vibrancy using GeoXAI, offering deeper insights into potential planning interventions. However, several limitations should be acknowledged. First, the measurement of urban vibrancy is based on life service reviews, social media check-ins, and mobile device positioning records. These data may underrepresent populations with limited digital engagement, such as the elderly, children, or individuals without access to smartphones. This could lead to a potential underestimation of vibrancy in areas where these demographic groups are more prevalent, thereby introducing bias into the quantification of urban vibrancy. Future research could explore the integration of complementary data sources (such as field surveys, census statistics, or sensor-based observations) to capture vibrancy patterns among digitally underrepresented populations. Second, urban vibrancy is inherently dynamic, fluctuating across times of day, days of the week, and seasons. While this study offers a valuable snapshot, it does not capture temporal variations in human activities. Future research should integrate temporal dimensions to achieve a more comprehensiveness understanding of urban vibrancy. Third, the study focuses on Xiamen Island. While the area possesses certain representative urban characteristics, future research should incorporate comparative case studies across diverse contexts to enhance the generalizability of the findings. Notably, while GeoXAI makes progress in bridging artificial intelligence interpretability and geographic context and is thus a powerful tool for disentangling intricate, nonlinear, and location-dependent relationships in urban studies, its effective application requires solid theoretical foundation, careful methodological design, and a cautious interpretation of model results.


