
Evaluation and Optimization Strategies for Provincial Culture and Tourism Integration from the Perspective of Landscape Narrative: A Case Study of Anhui Province, China

Abstract
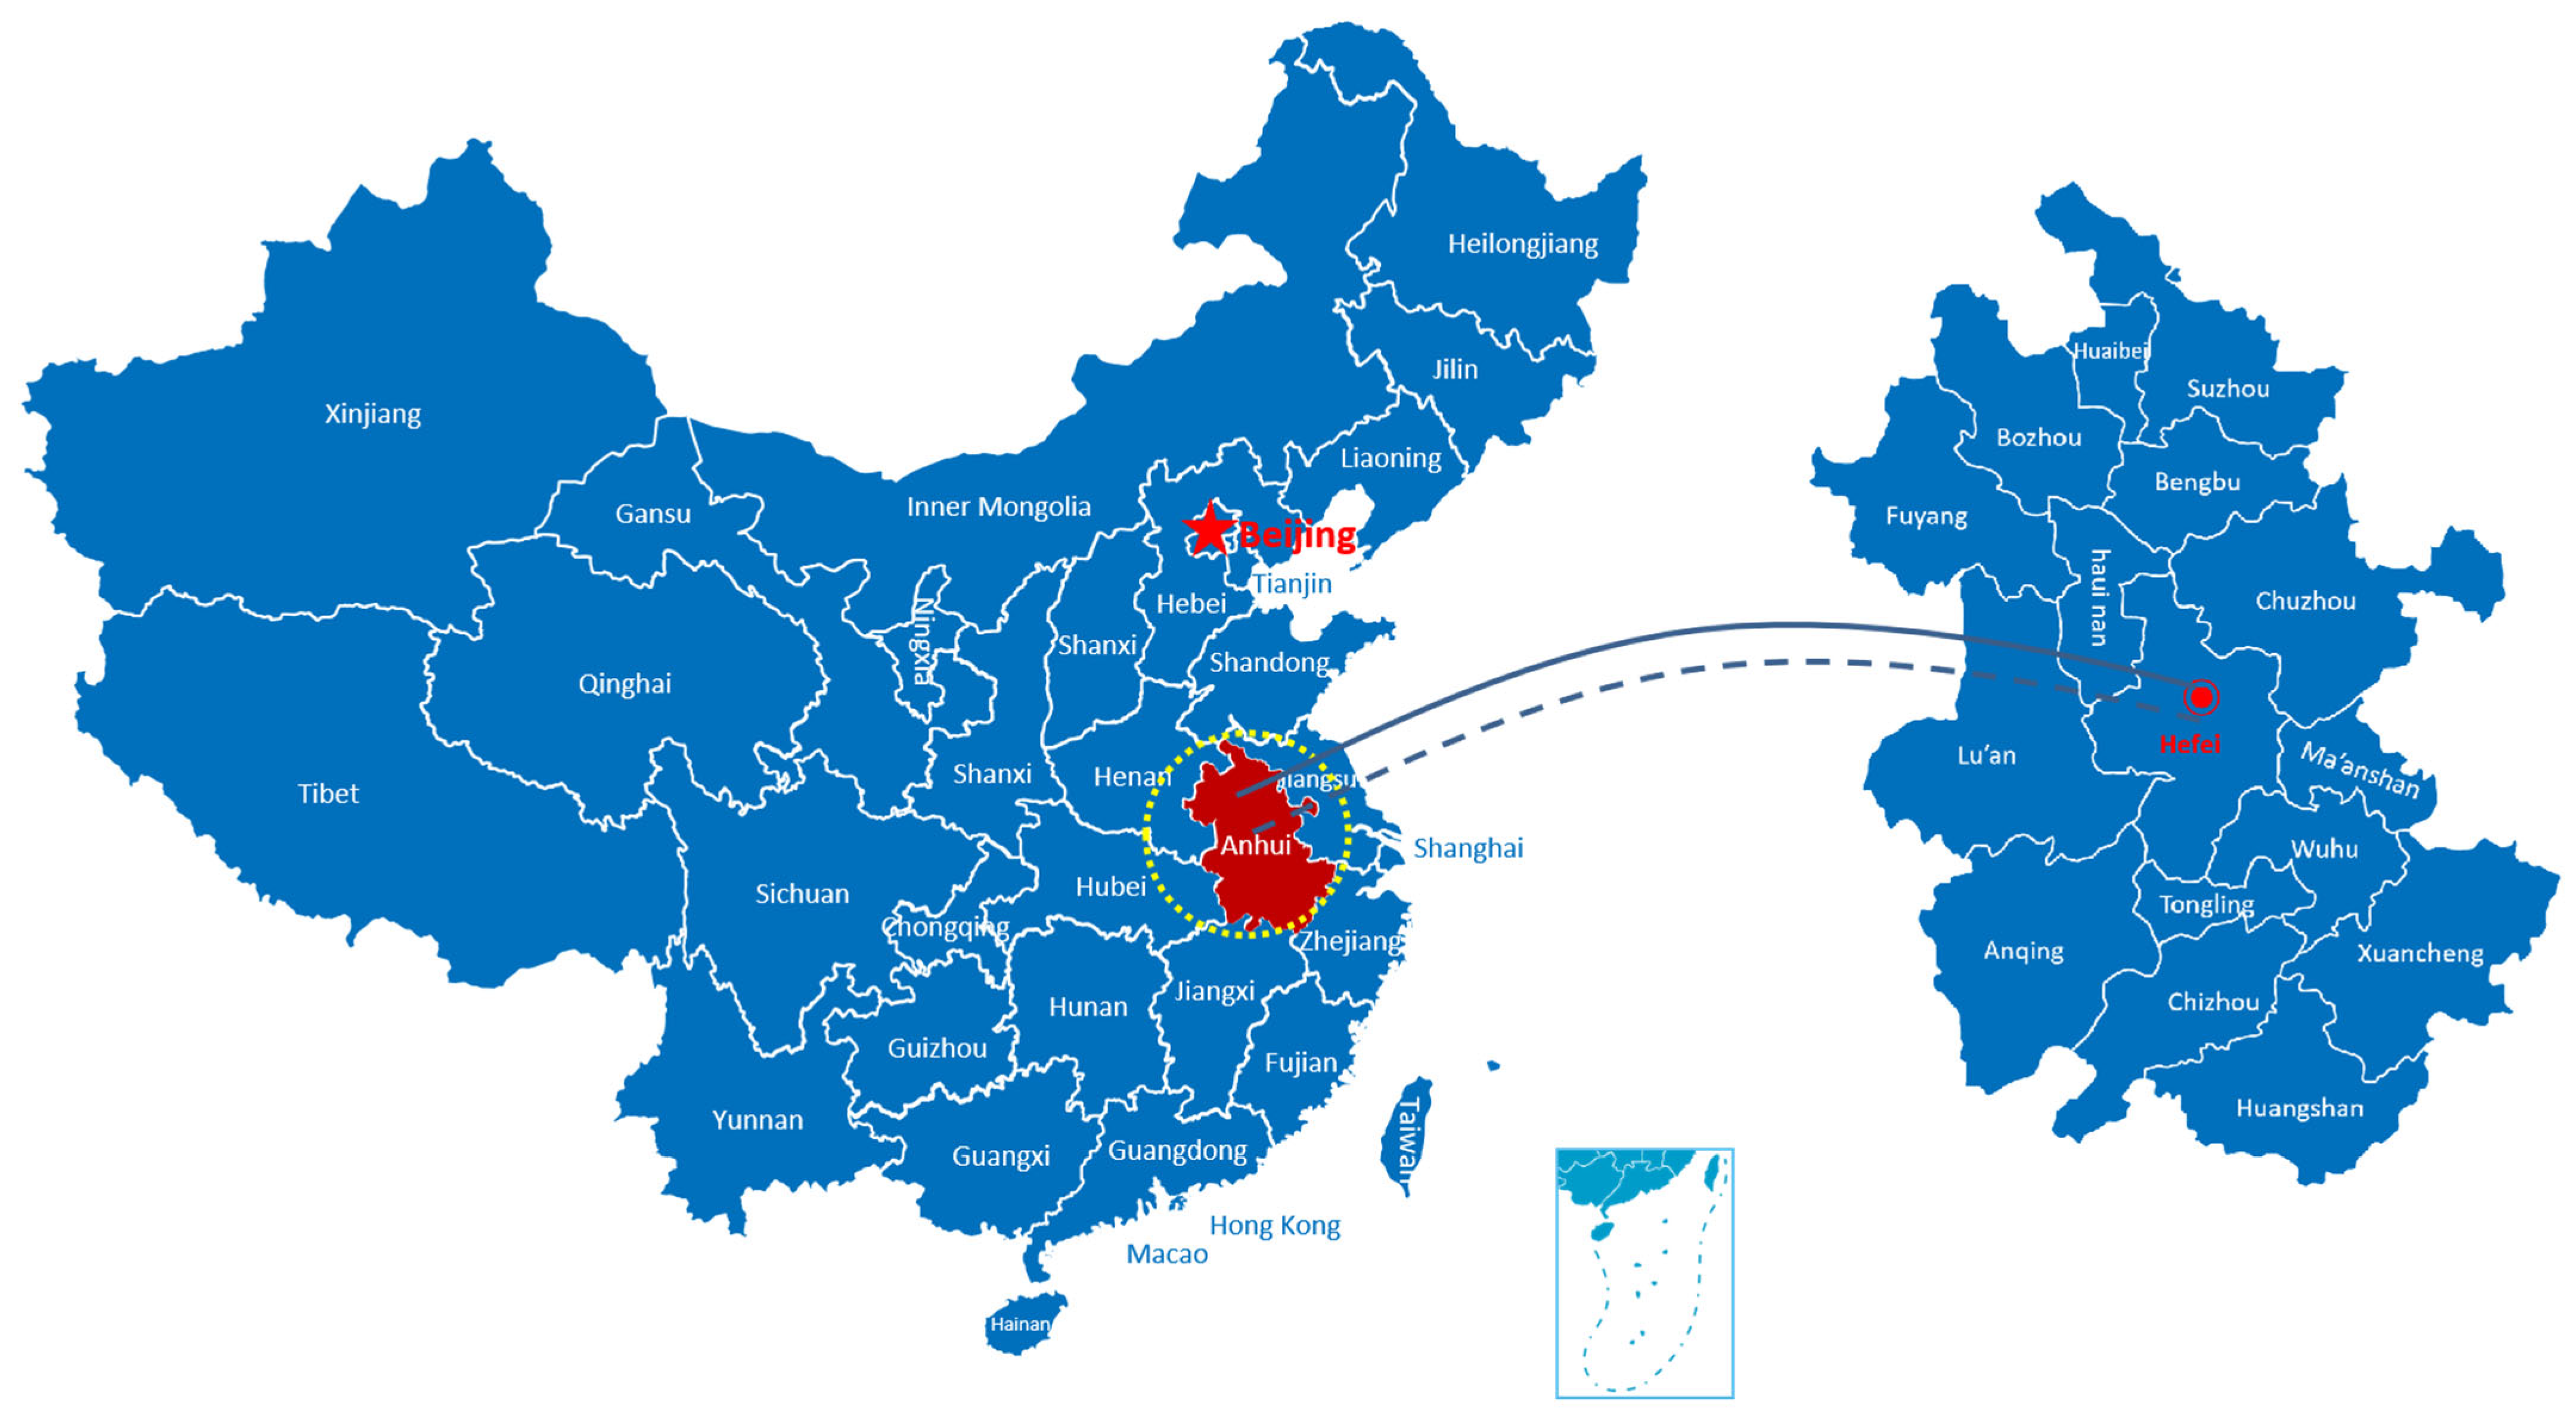
1. Introduction
- Clearly define an analytical framework and indicator system grounded in narrative logic for evaluating regional culture–tourism integration;
- Apply spatial analytical methods—including data standardization, spatial weight matrices, and the Moran’s I and Spatial Autoregressive (SAR) models—to investigate the spatial differentiation and driving mechanisms of integration;
- Propose optimization strategies grounded in narrative logic to promote more coherent, emotionally engaging, and spatially coordinated regional culture–tourism development.
2. Materials and Methods
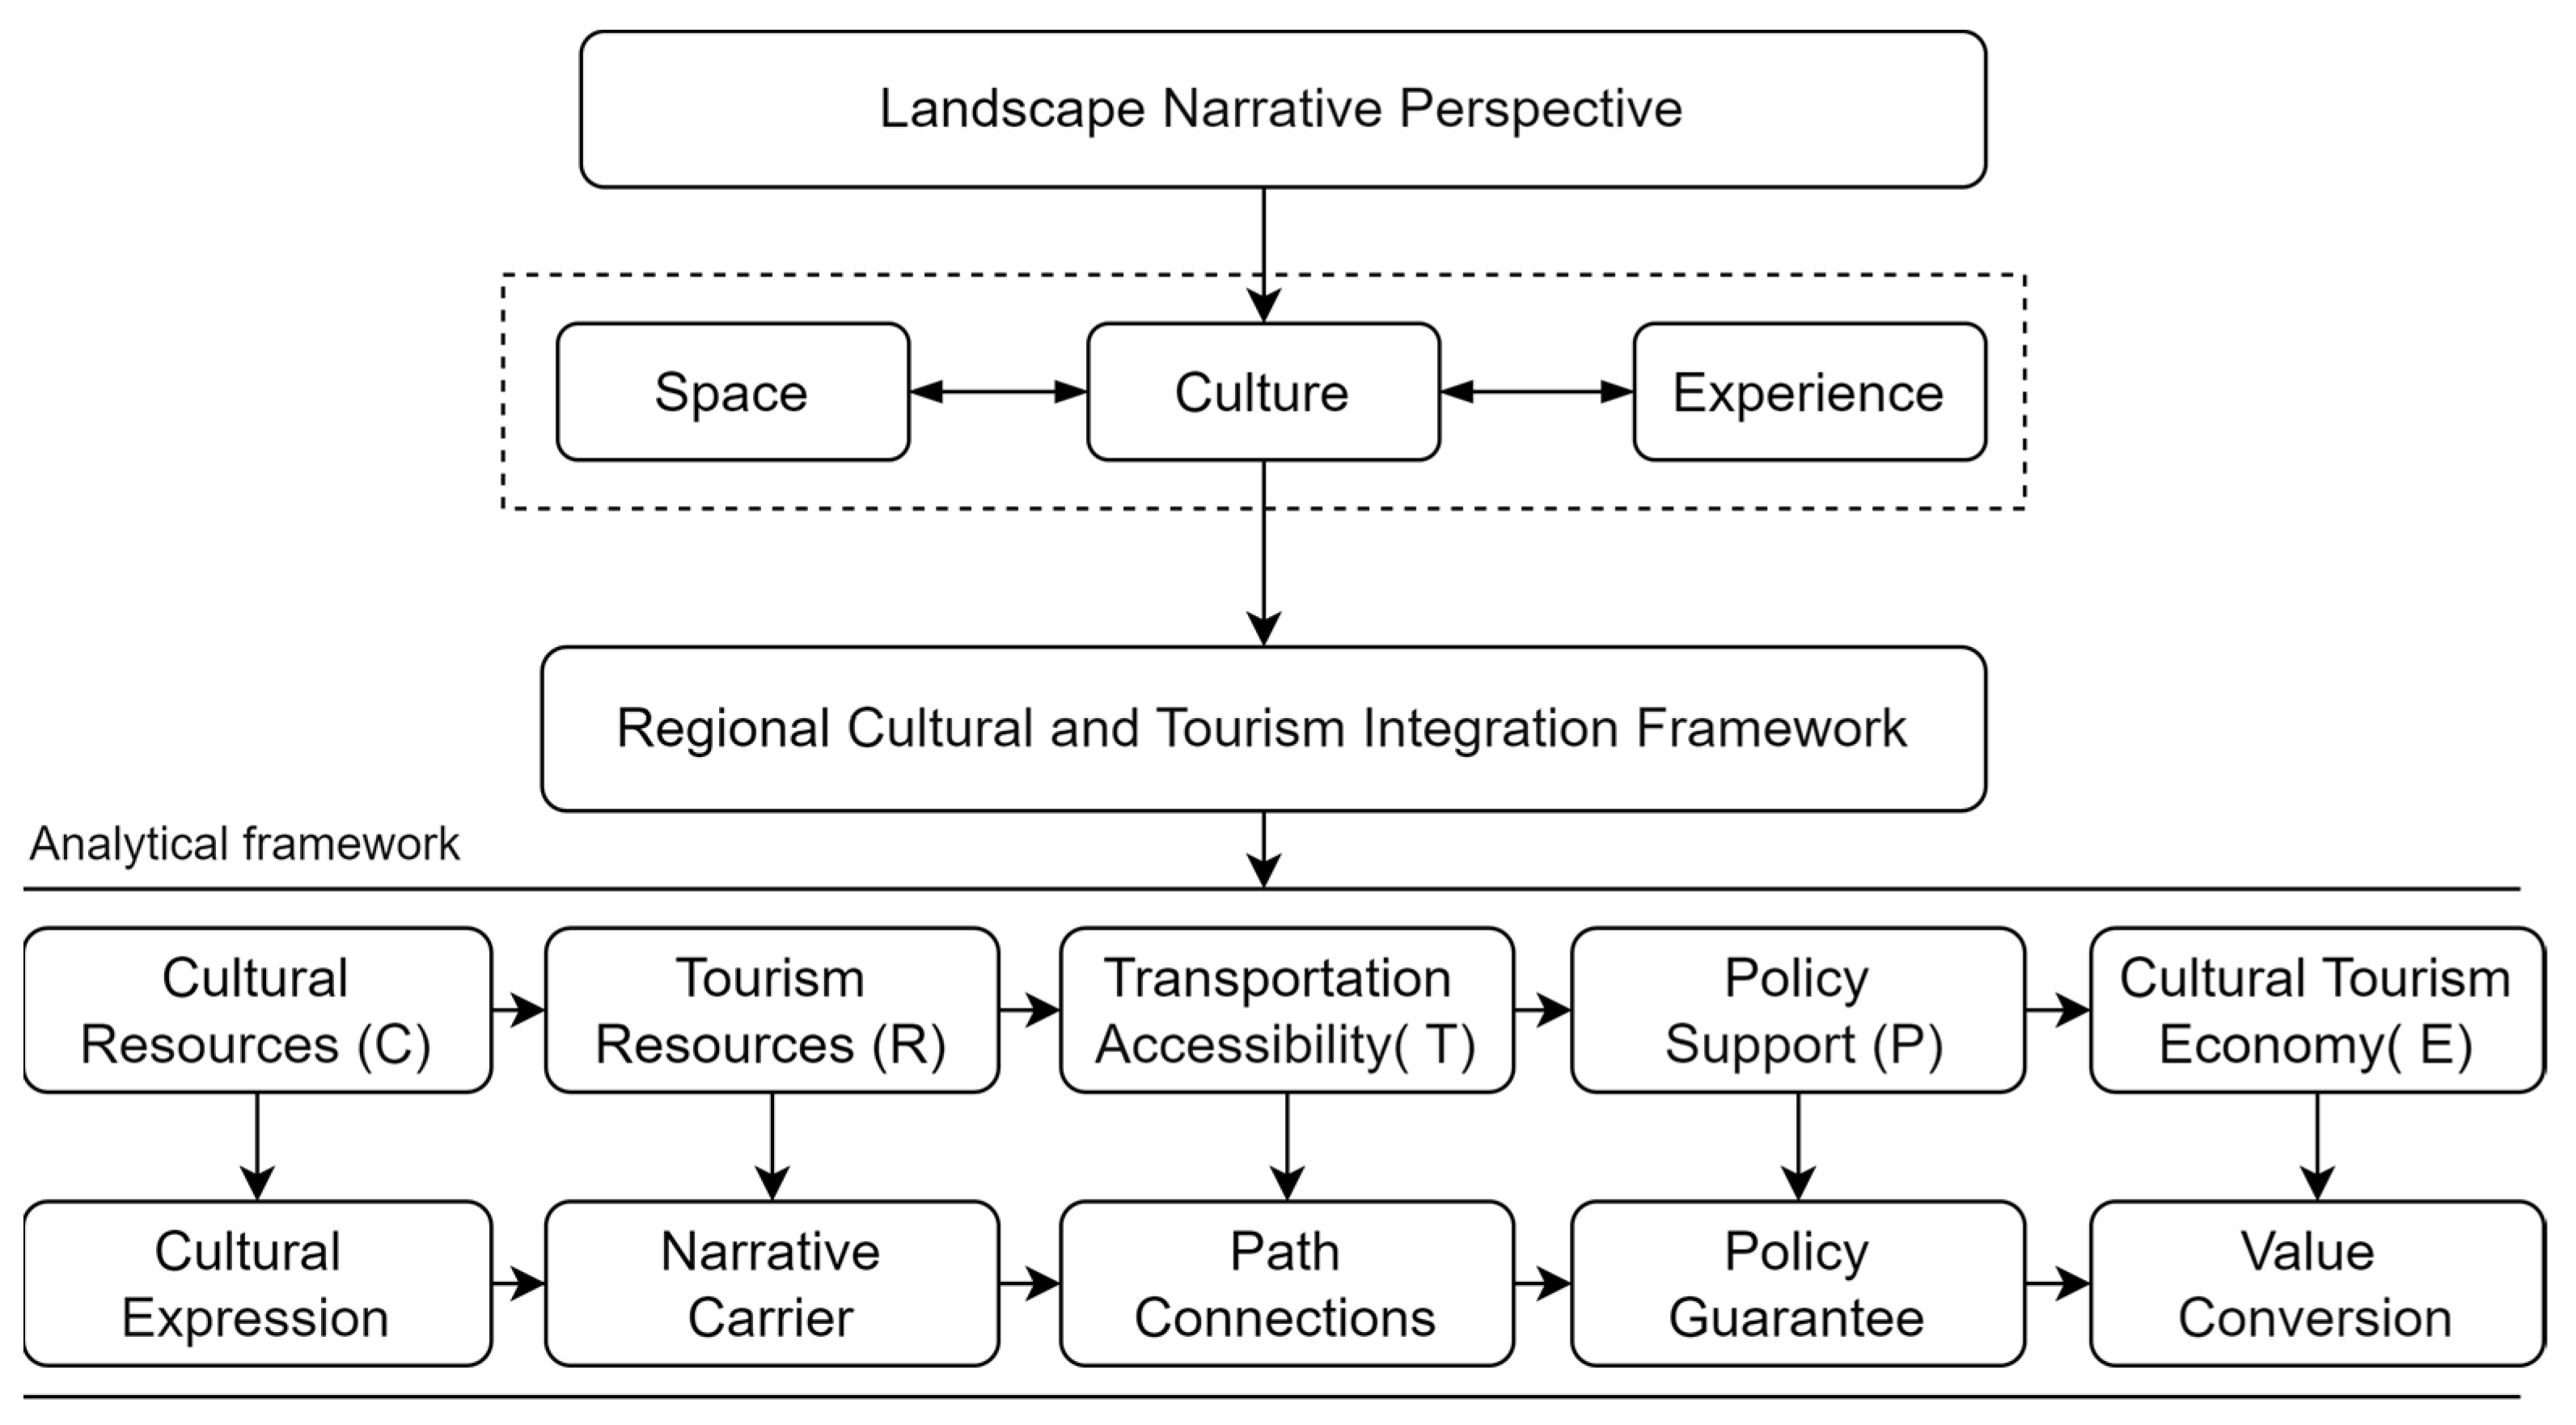
2.1. Theoretical Framework and Evaluation System Construction
- Cultural Resources (C)—narrative origin;
- Tourism Resources (R)—narrative carrier;
- Transportation Accessibility (T)—narrative conduit;
- Policy Support (P)—narrative assurance;
- Culture Tourism Economy (E)—narrative valuation.
2.2. Data Sources and Preprocessing
2.3. Spatial Analysis Methods
2.3.1. Construction of the Spatial Weight Matrix
2.3.2. Moran’s I Analysis
2.3.3. Spatial Econometric Modeling
3. Results
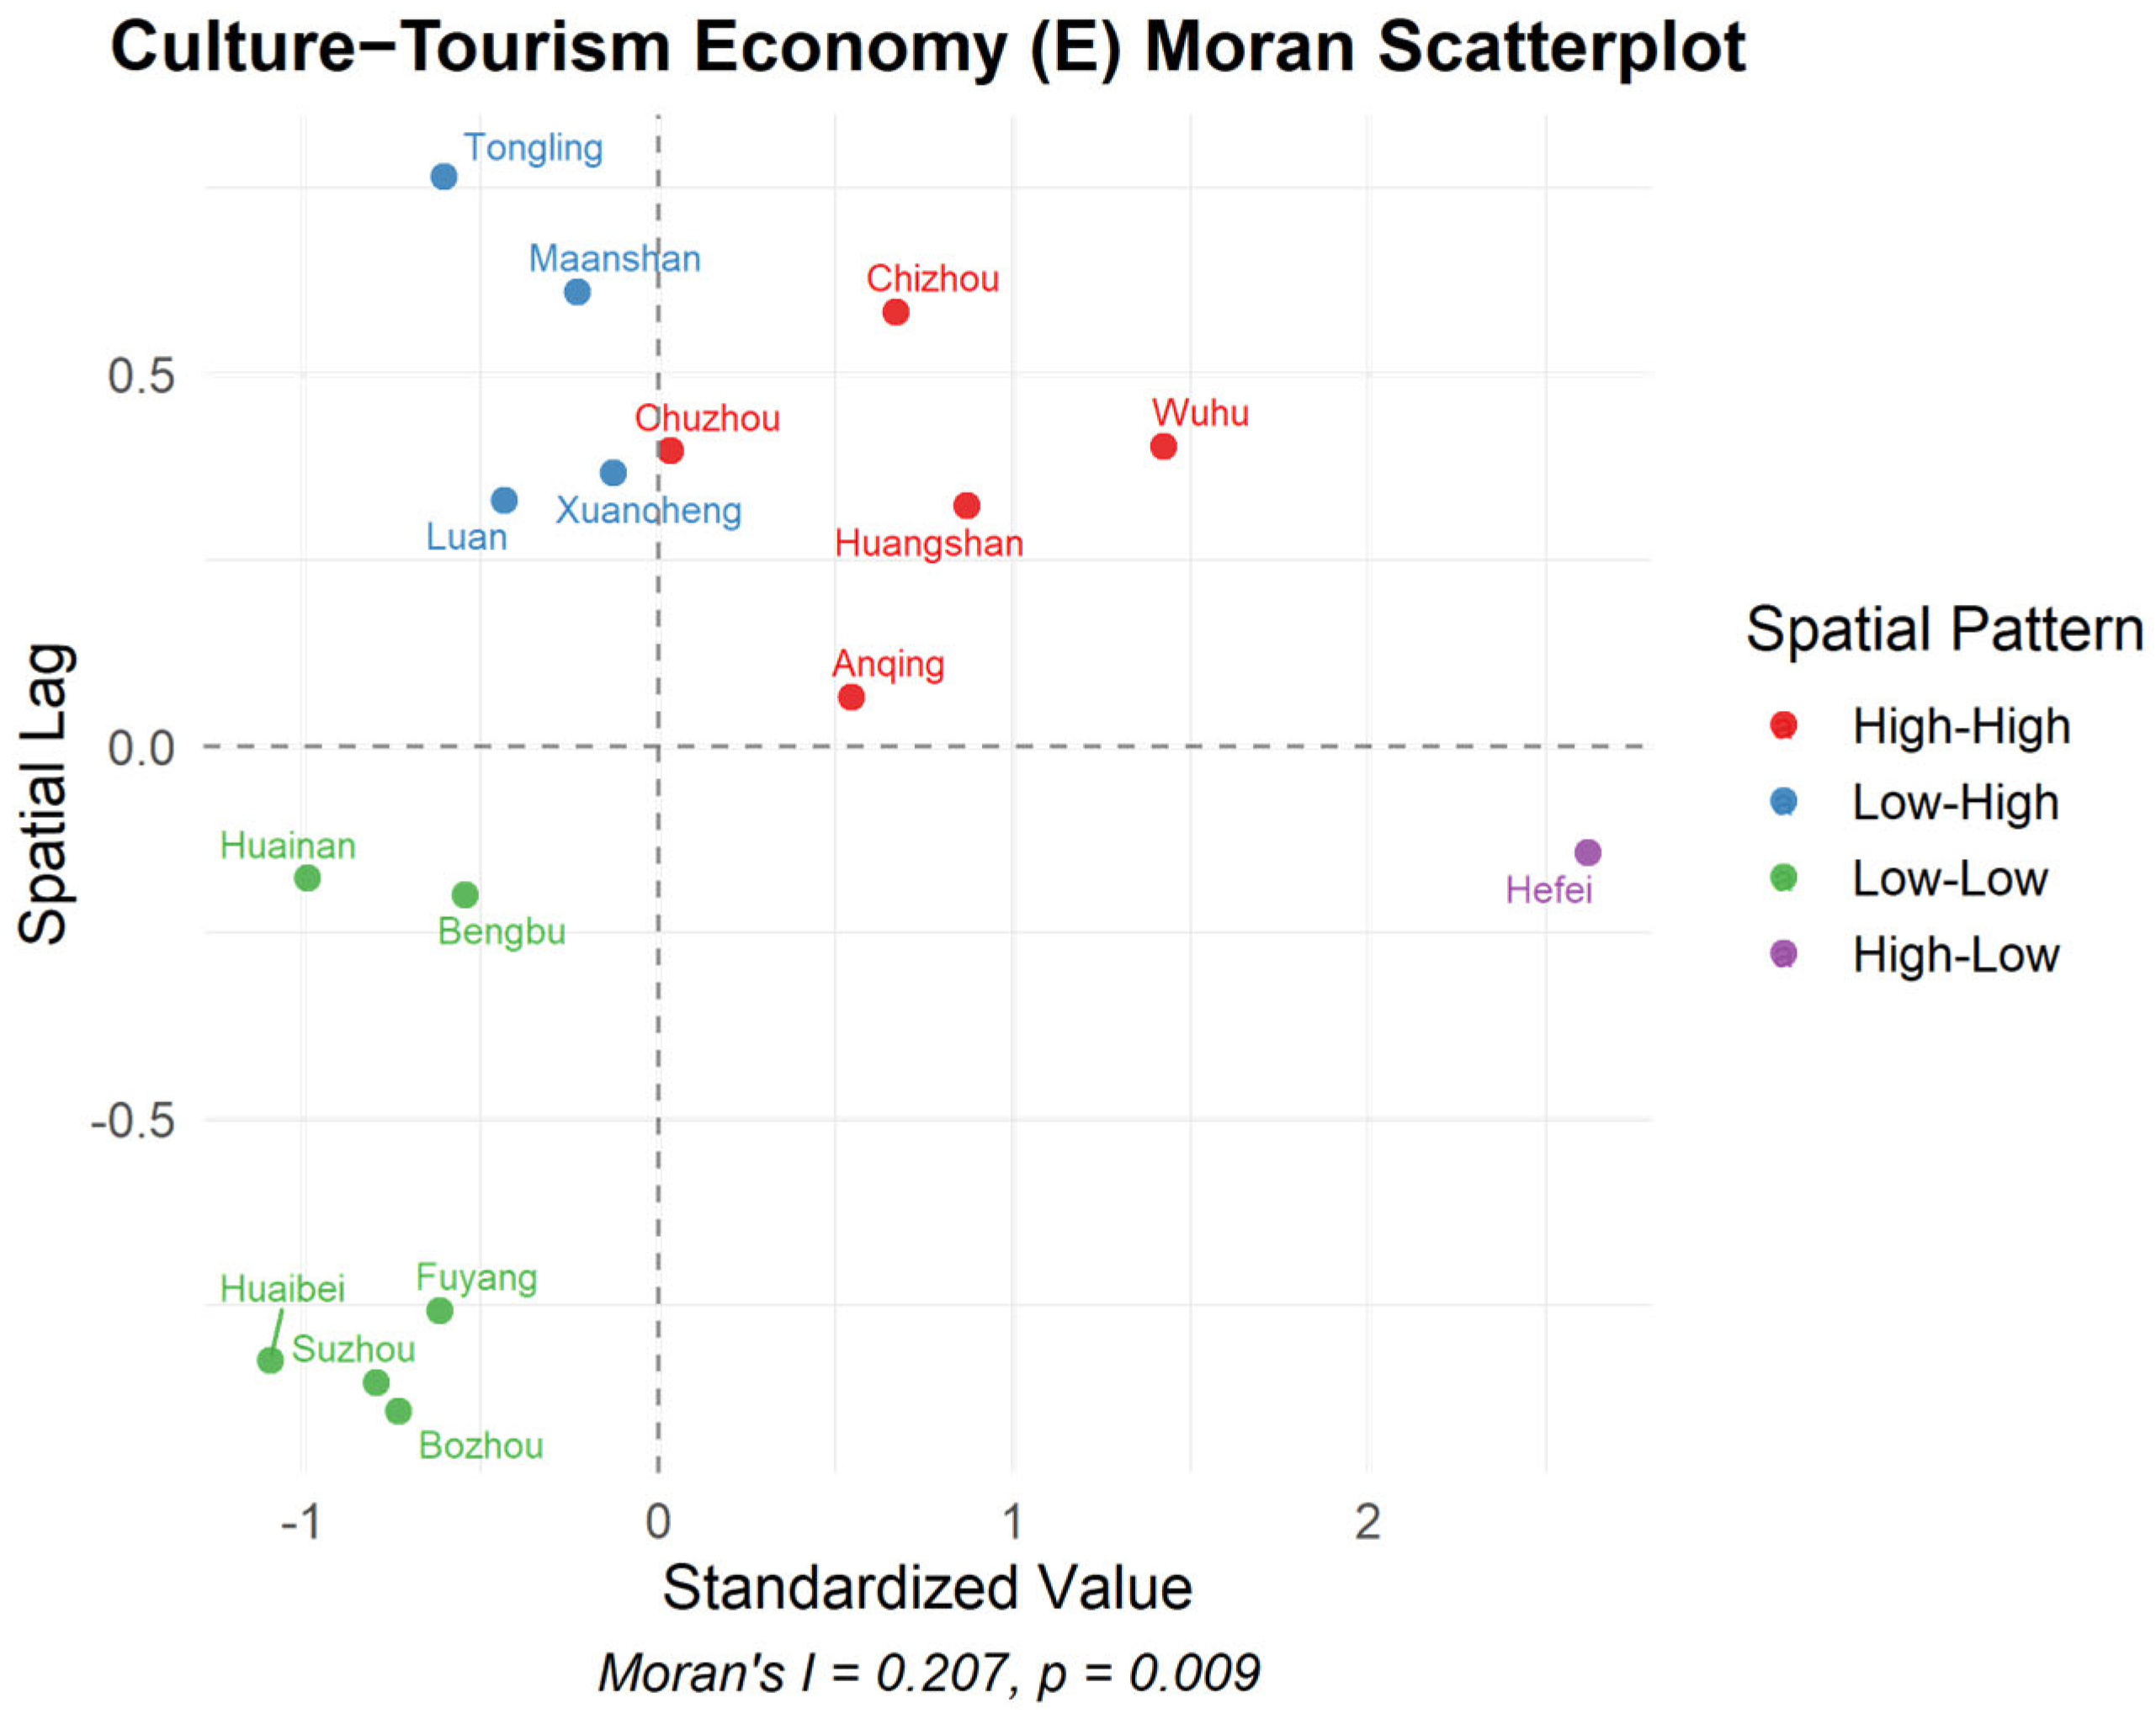
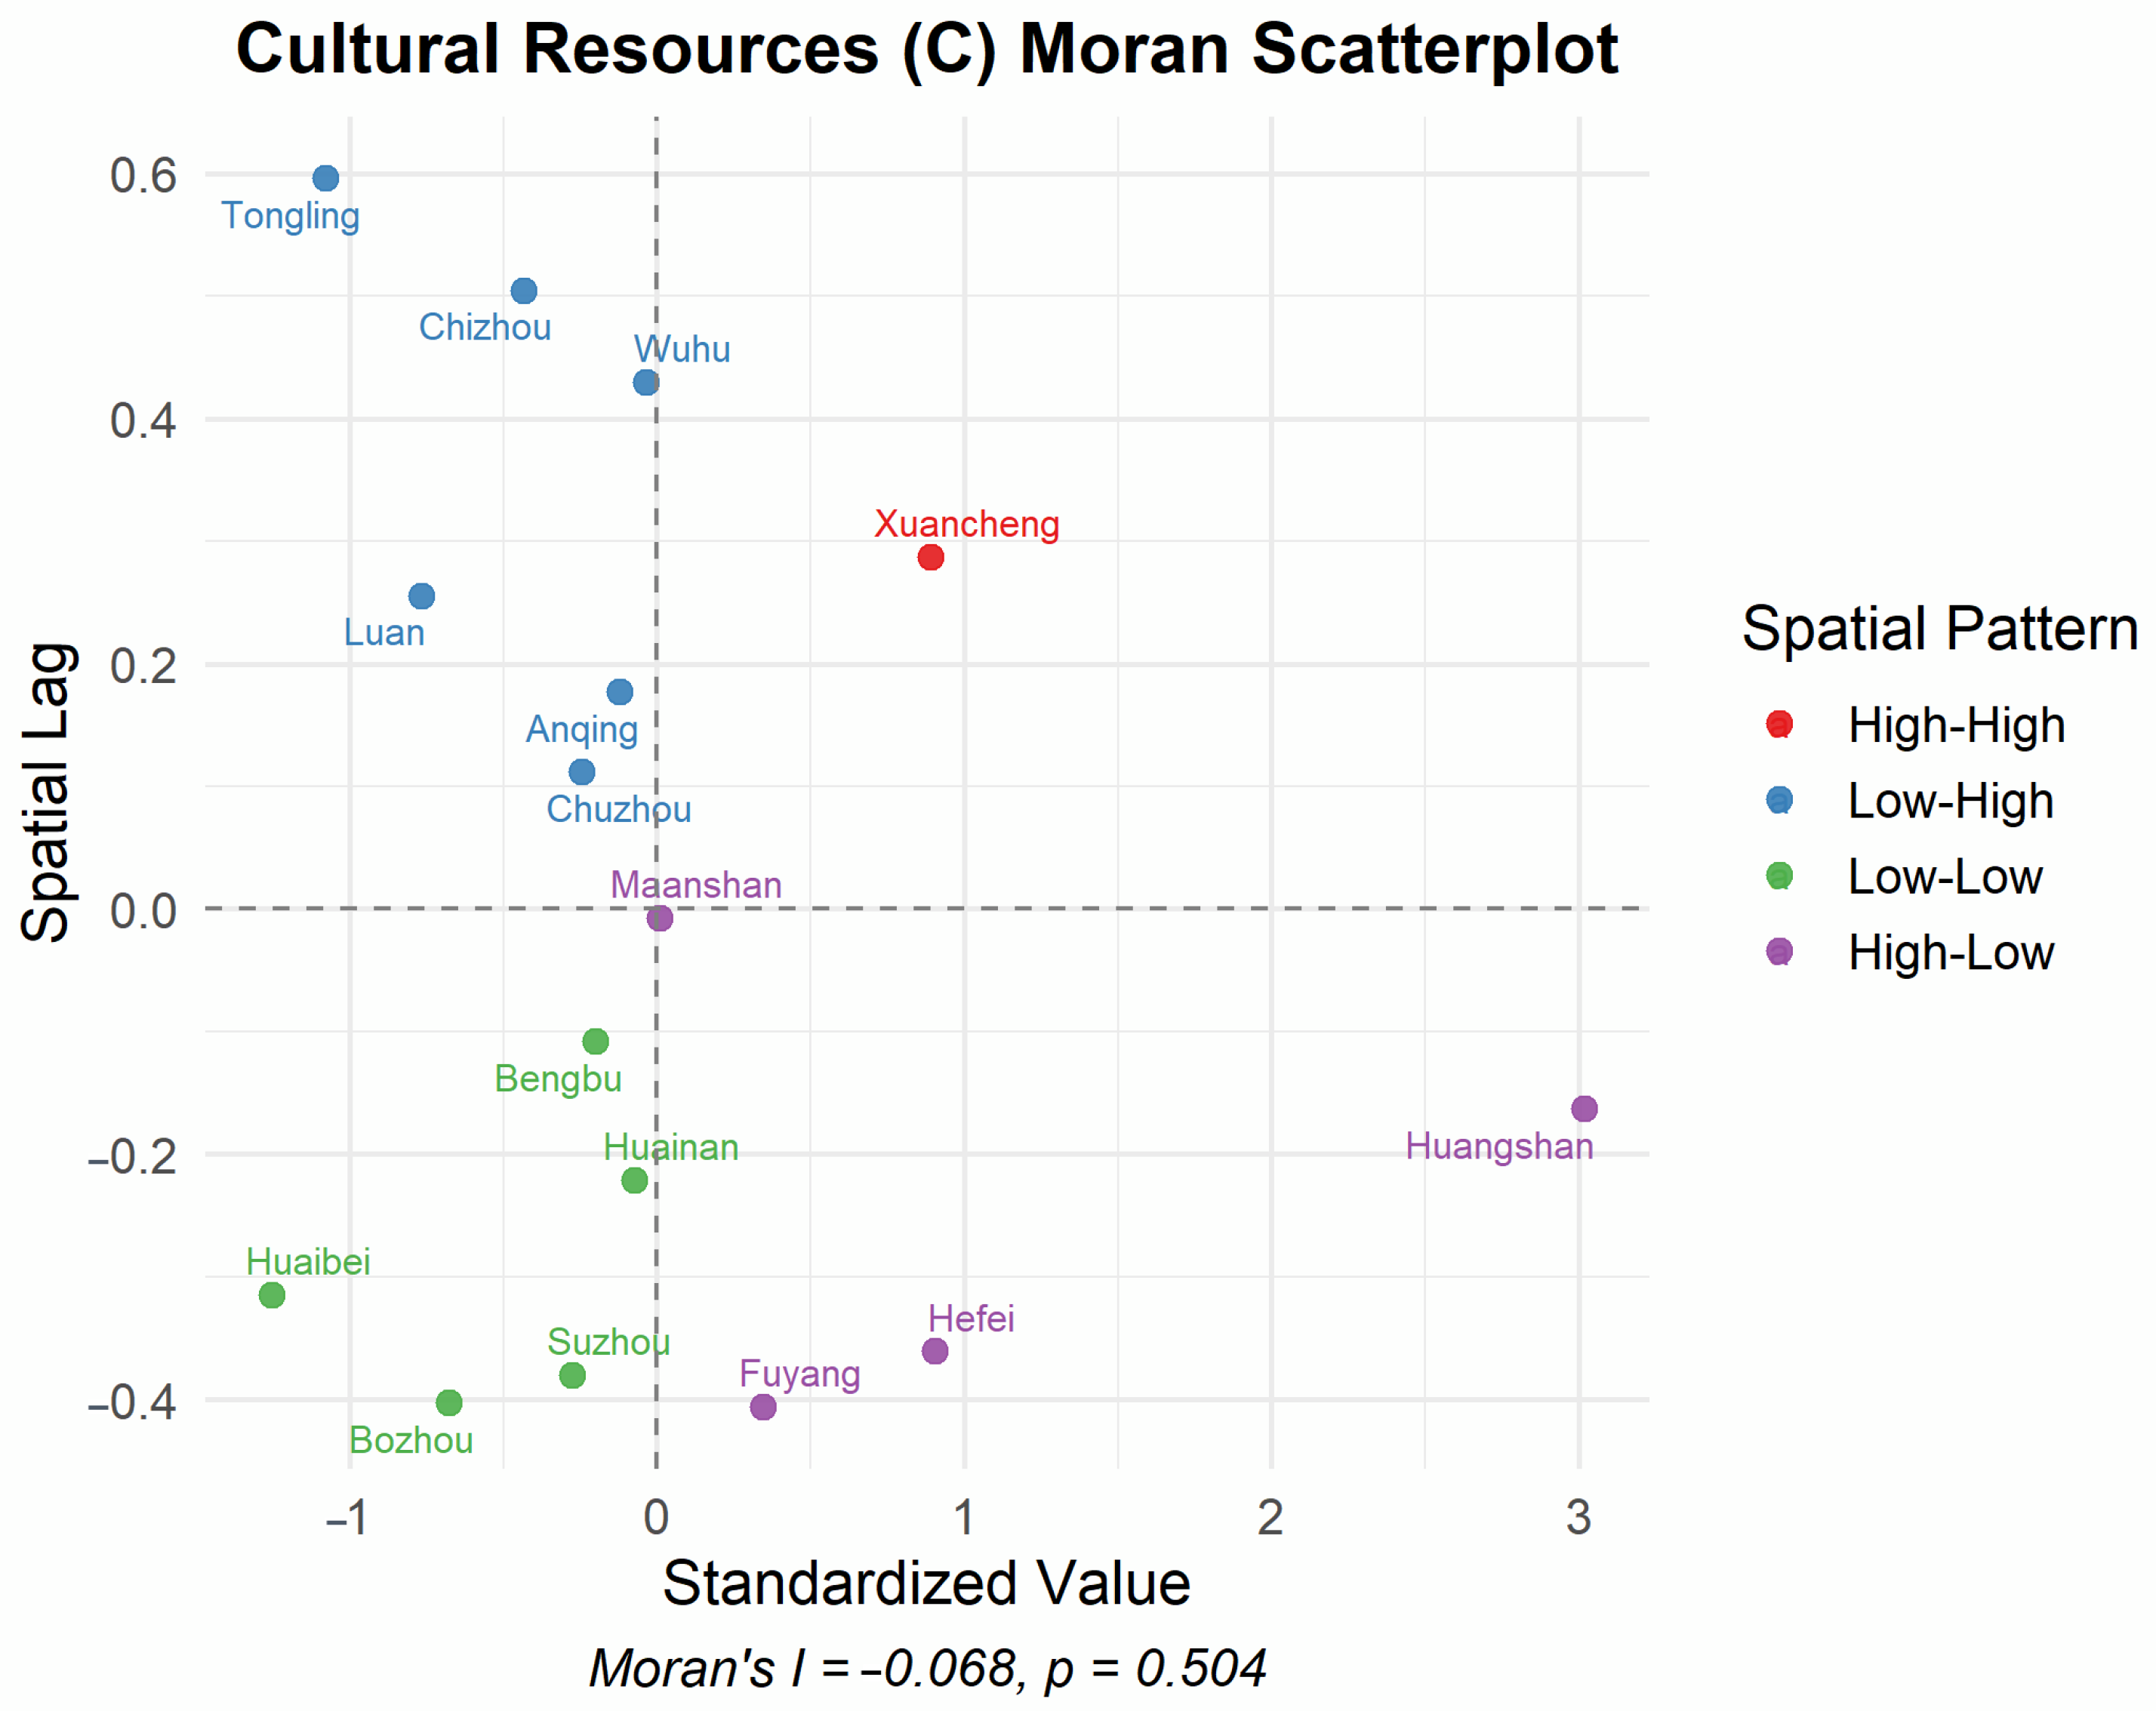
3.1. Spatial Autocorrelation Analysis
3.2. SAR Model Results and Interpretation
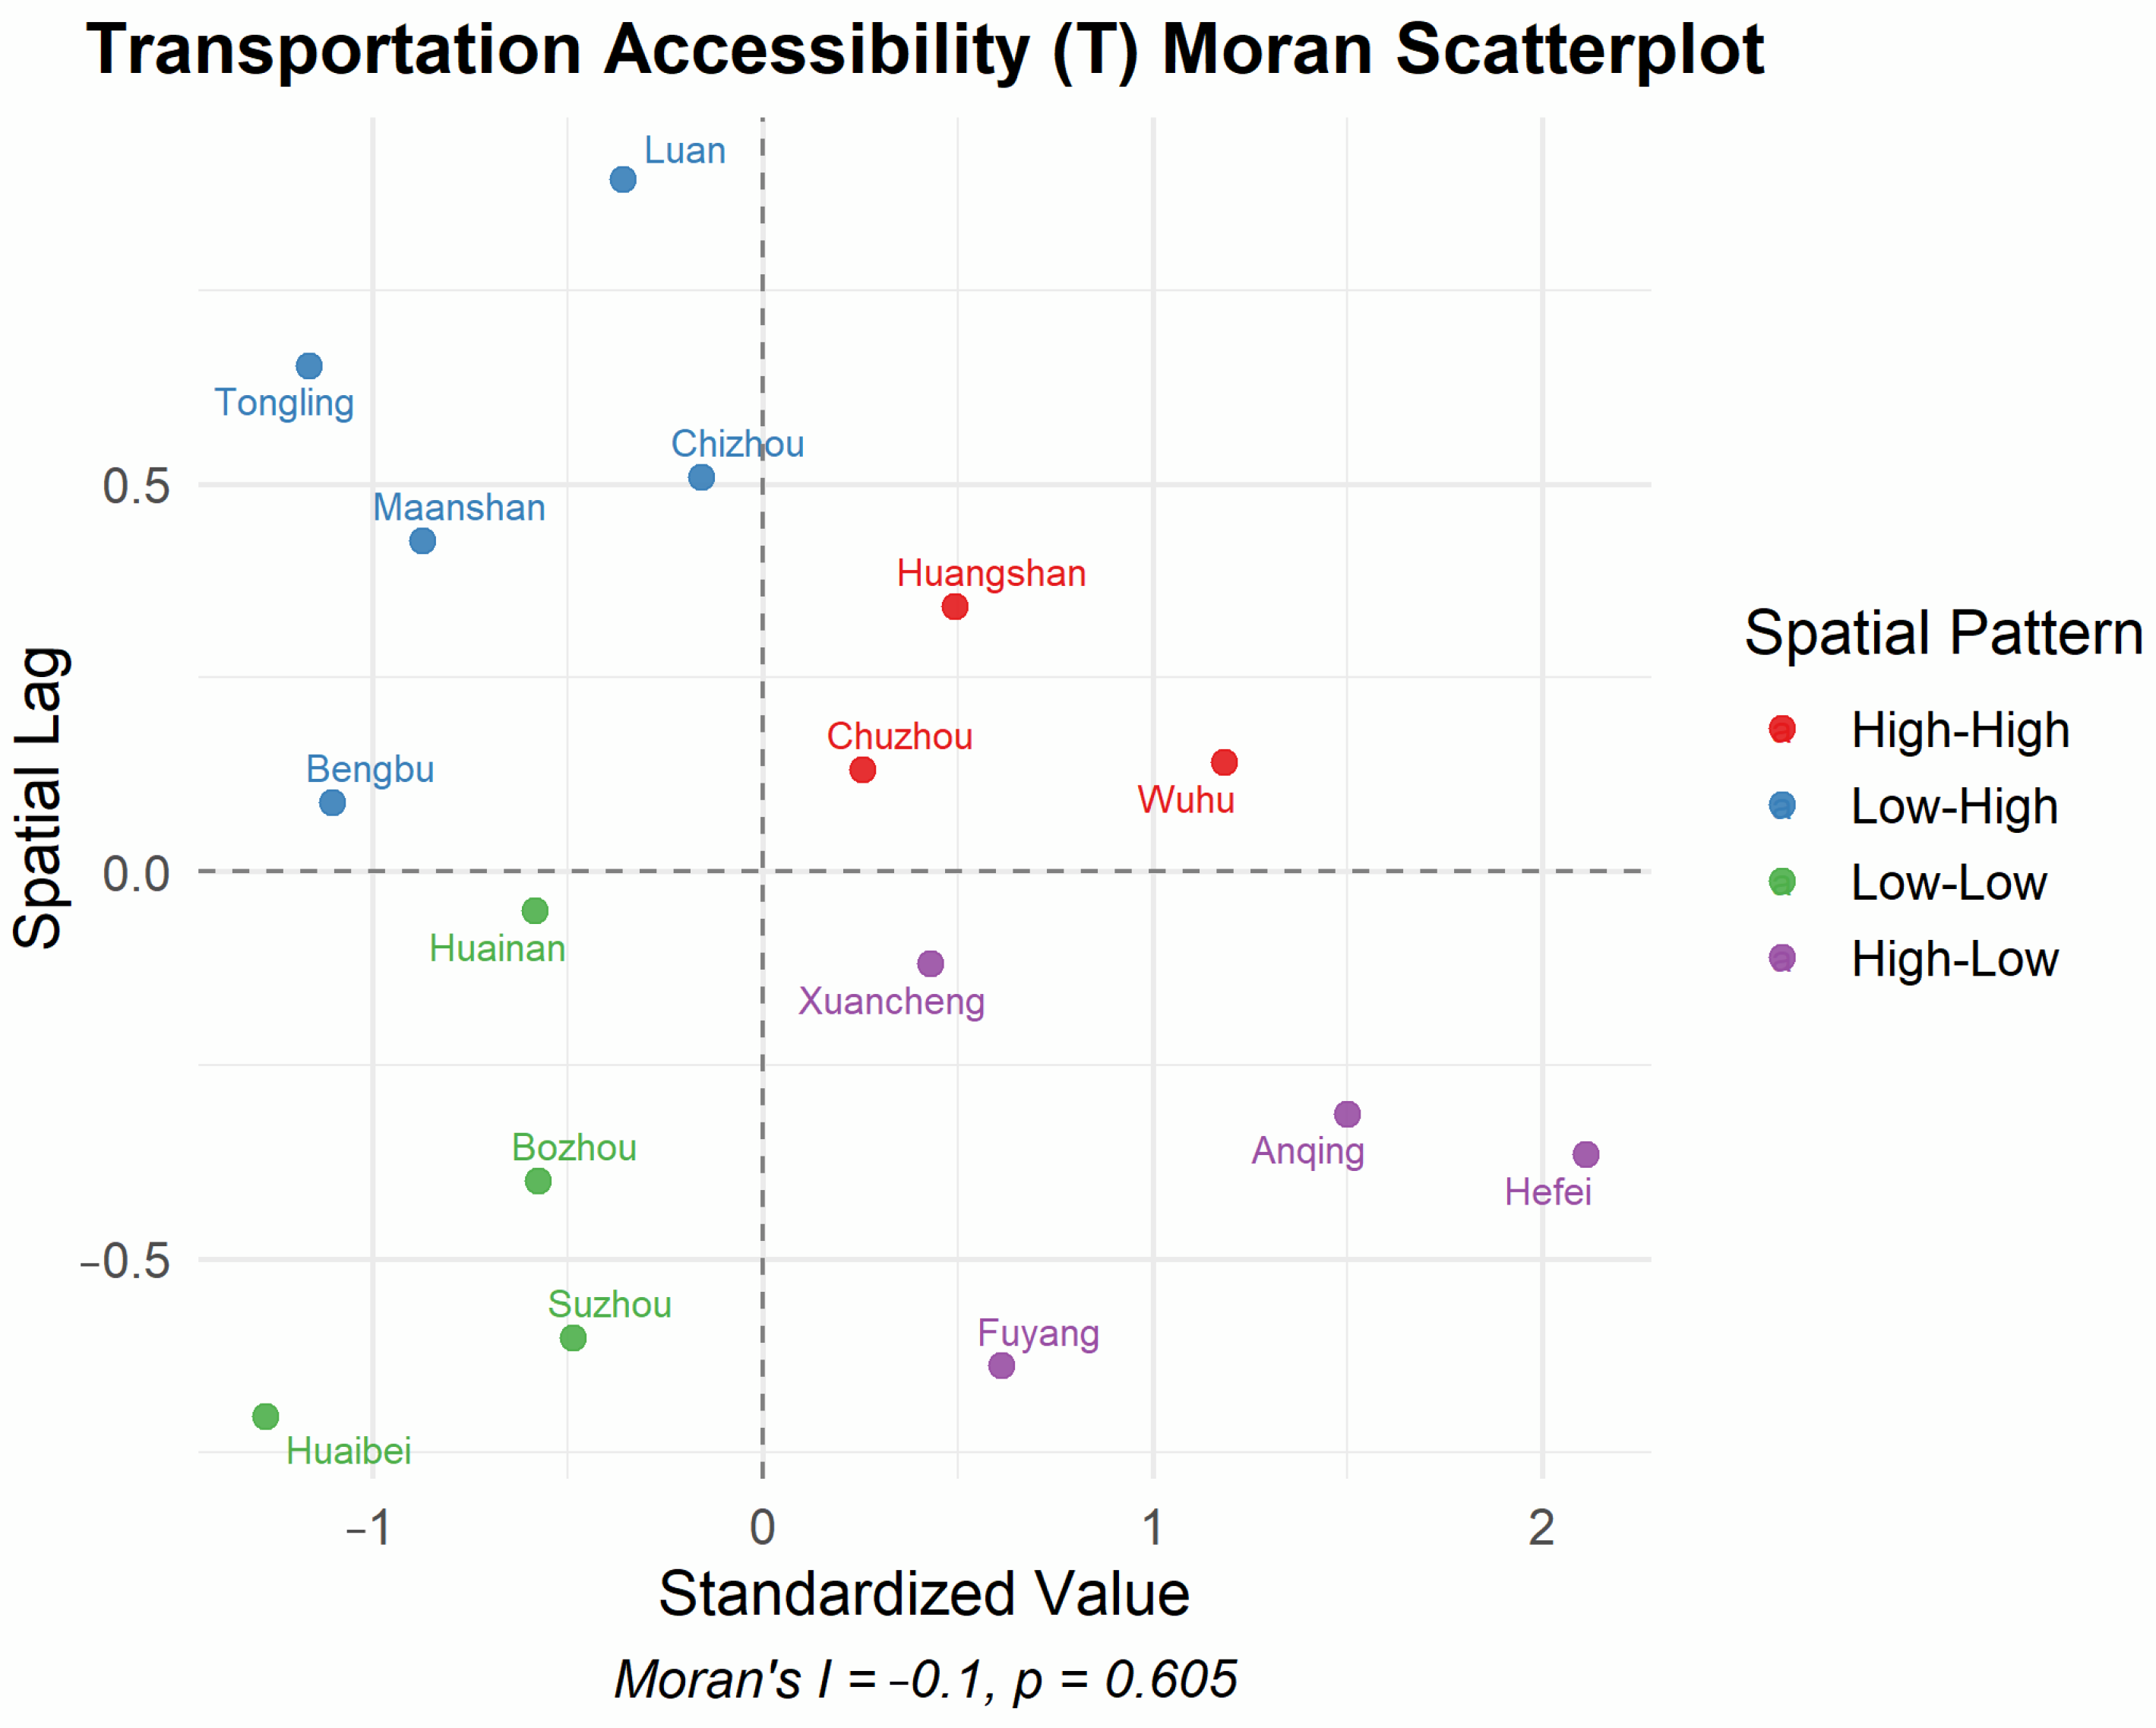
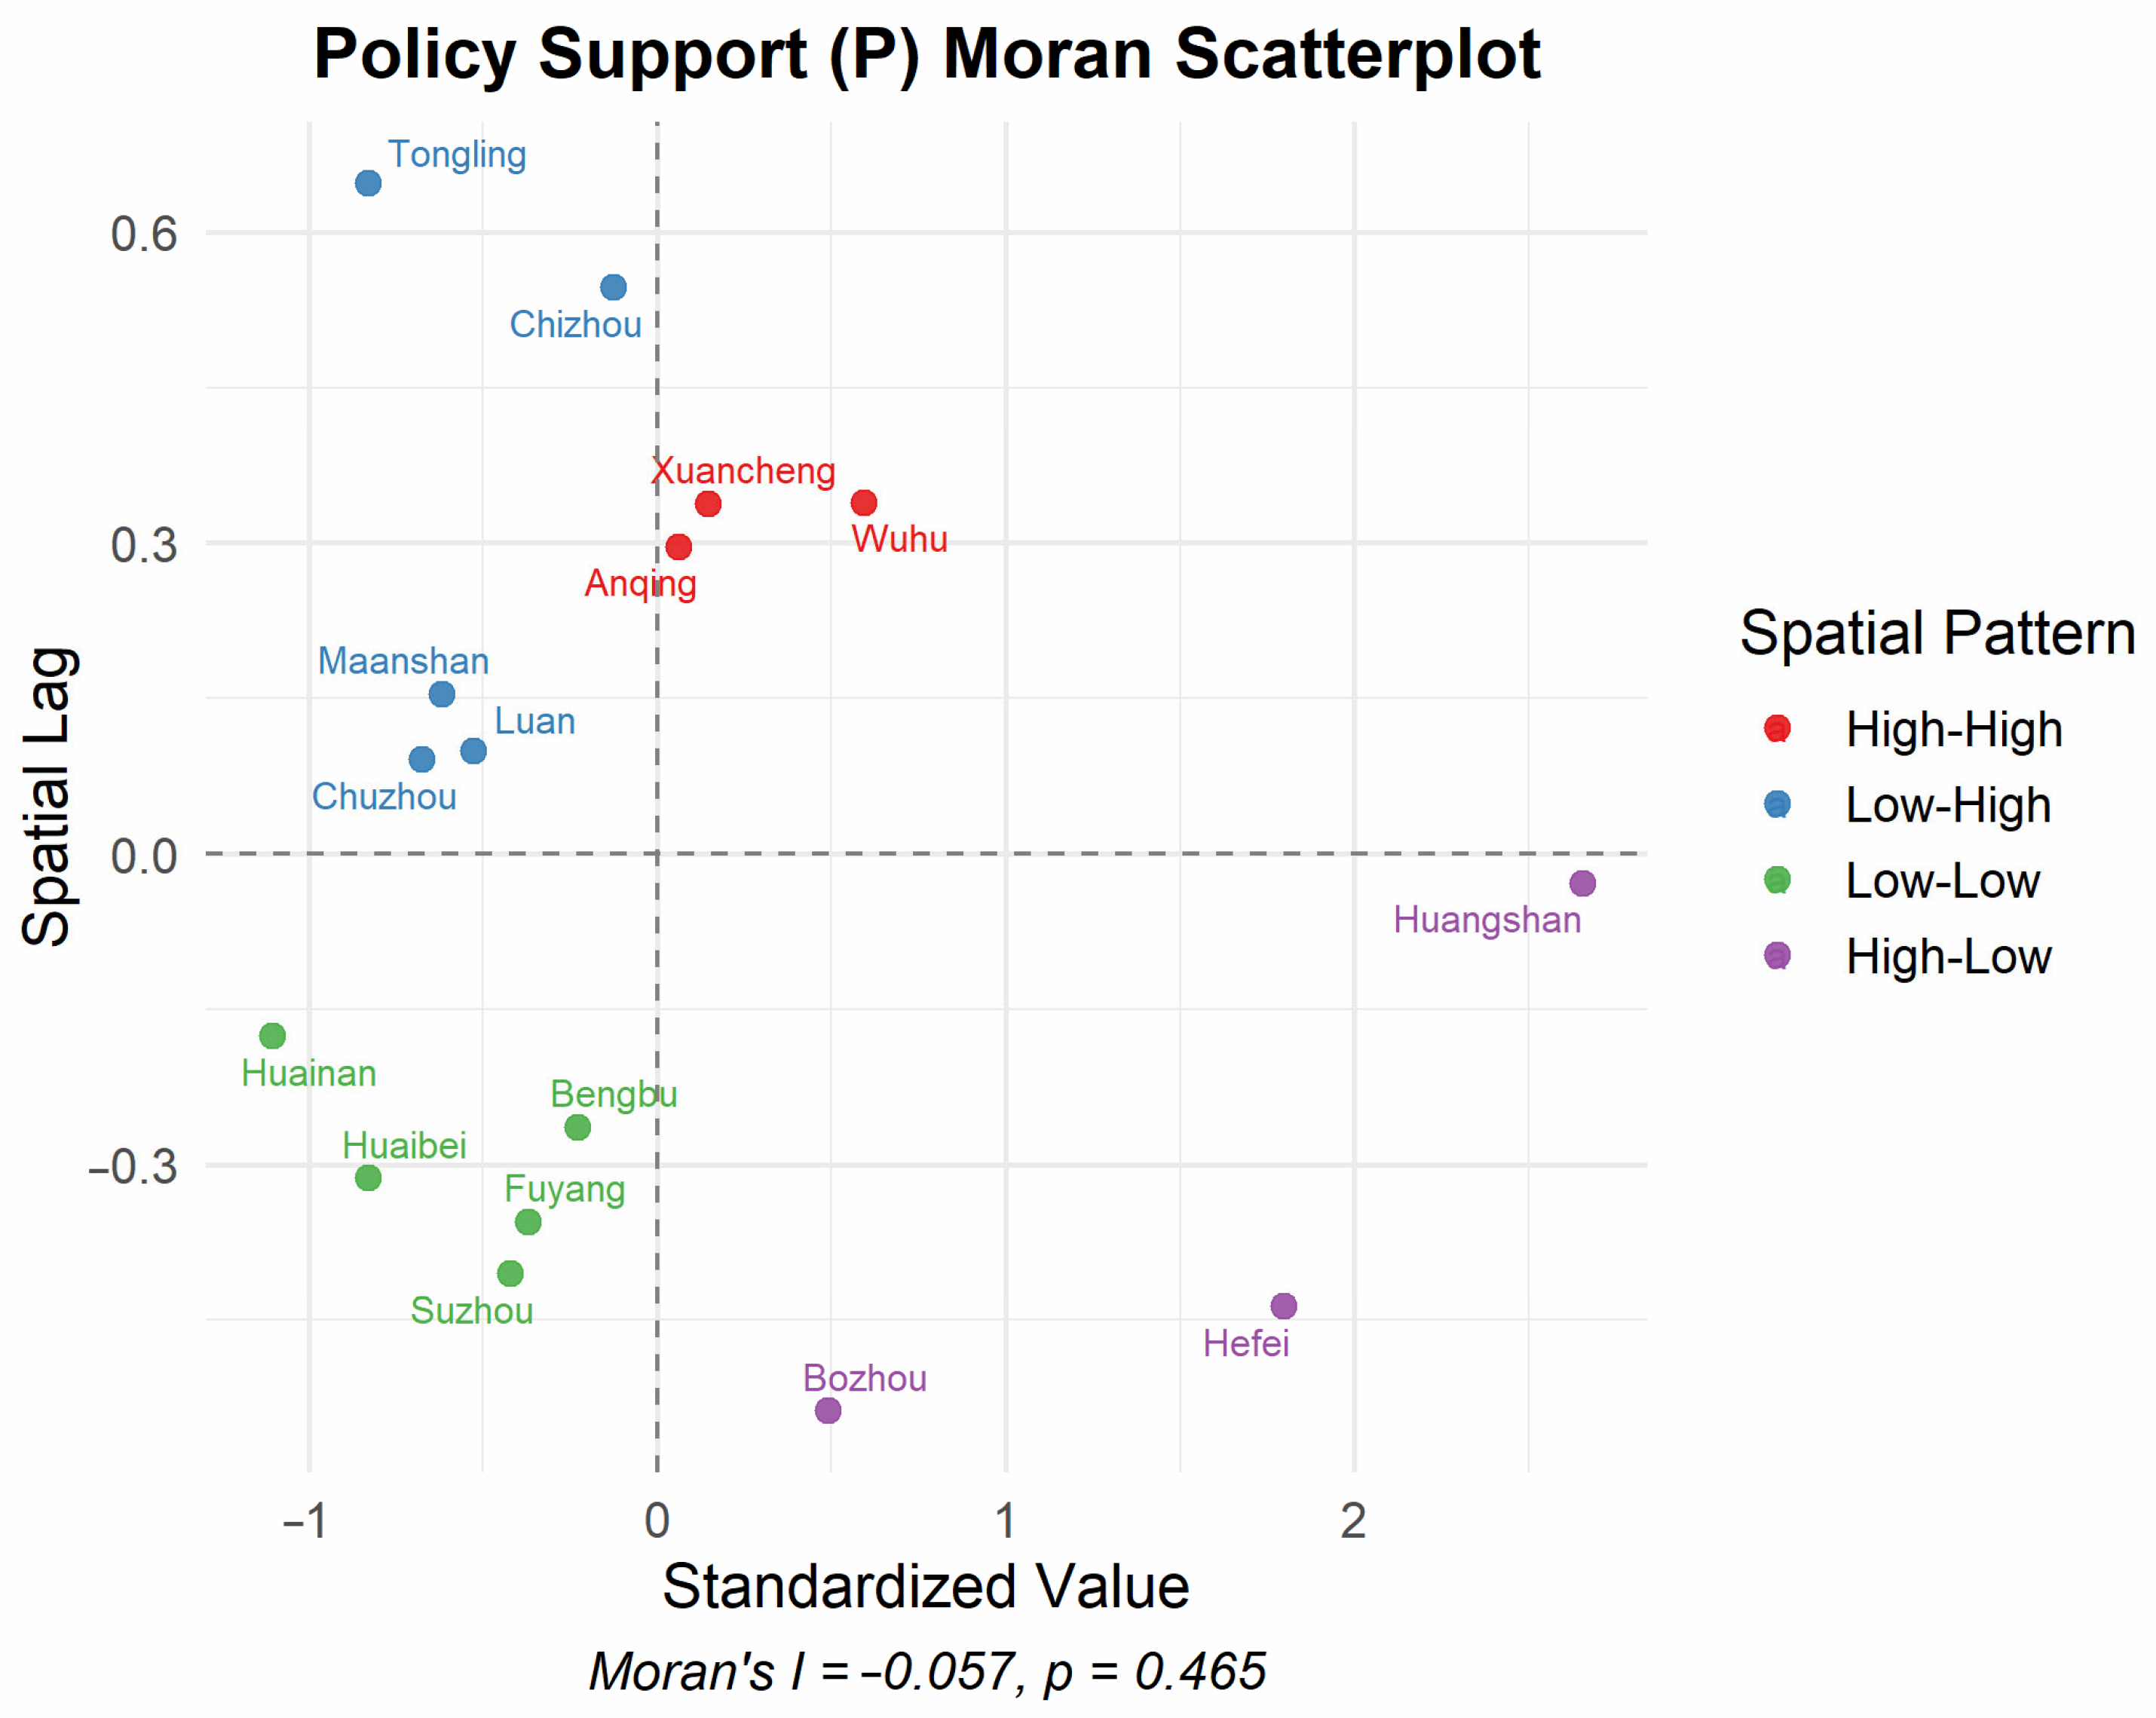
- Transportation Accessibility (T) and Policy Support (P) show significant positive effects, with regression coefficients of 0.685 and 0.736, respectively (p < 0.01). These results affirm their critical role as drivers of high-quality integration. Improved transport infrastructure and coordinated policy incentives directly support mobility, investment, and the clustering of tourism functions, thereby enhancing overall integration outcomes.
- Cultural Resources (C) exhibit a significant negative correlation (coefficient = –0.352, p < 0.01), suggesting that while the region is rich in cultural heritage and institutions, many assets remain “locked” in static formats and are not effectively transformed into economically productive experiences. This phenomenon, often described as “resource sedimentation”, indicates a structural deficiency in creative activation, industrial integration, and the development of narrative-based or digital products.This result is consistent with studies in other inland regions like Henan and Gansu, where a similar paradox of cultural richness coexisting with weak performance is observed, highlighting the lack of enabling mechanisms to convert symbolic capital into marketable value.
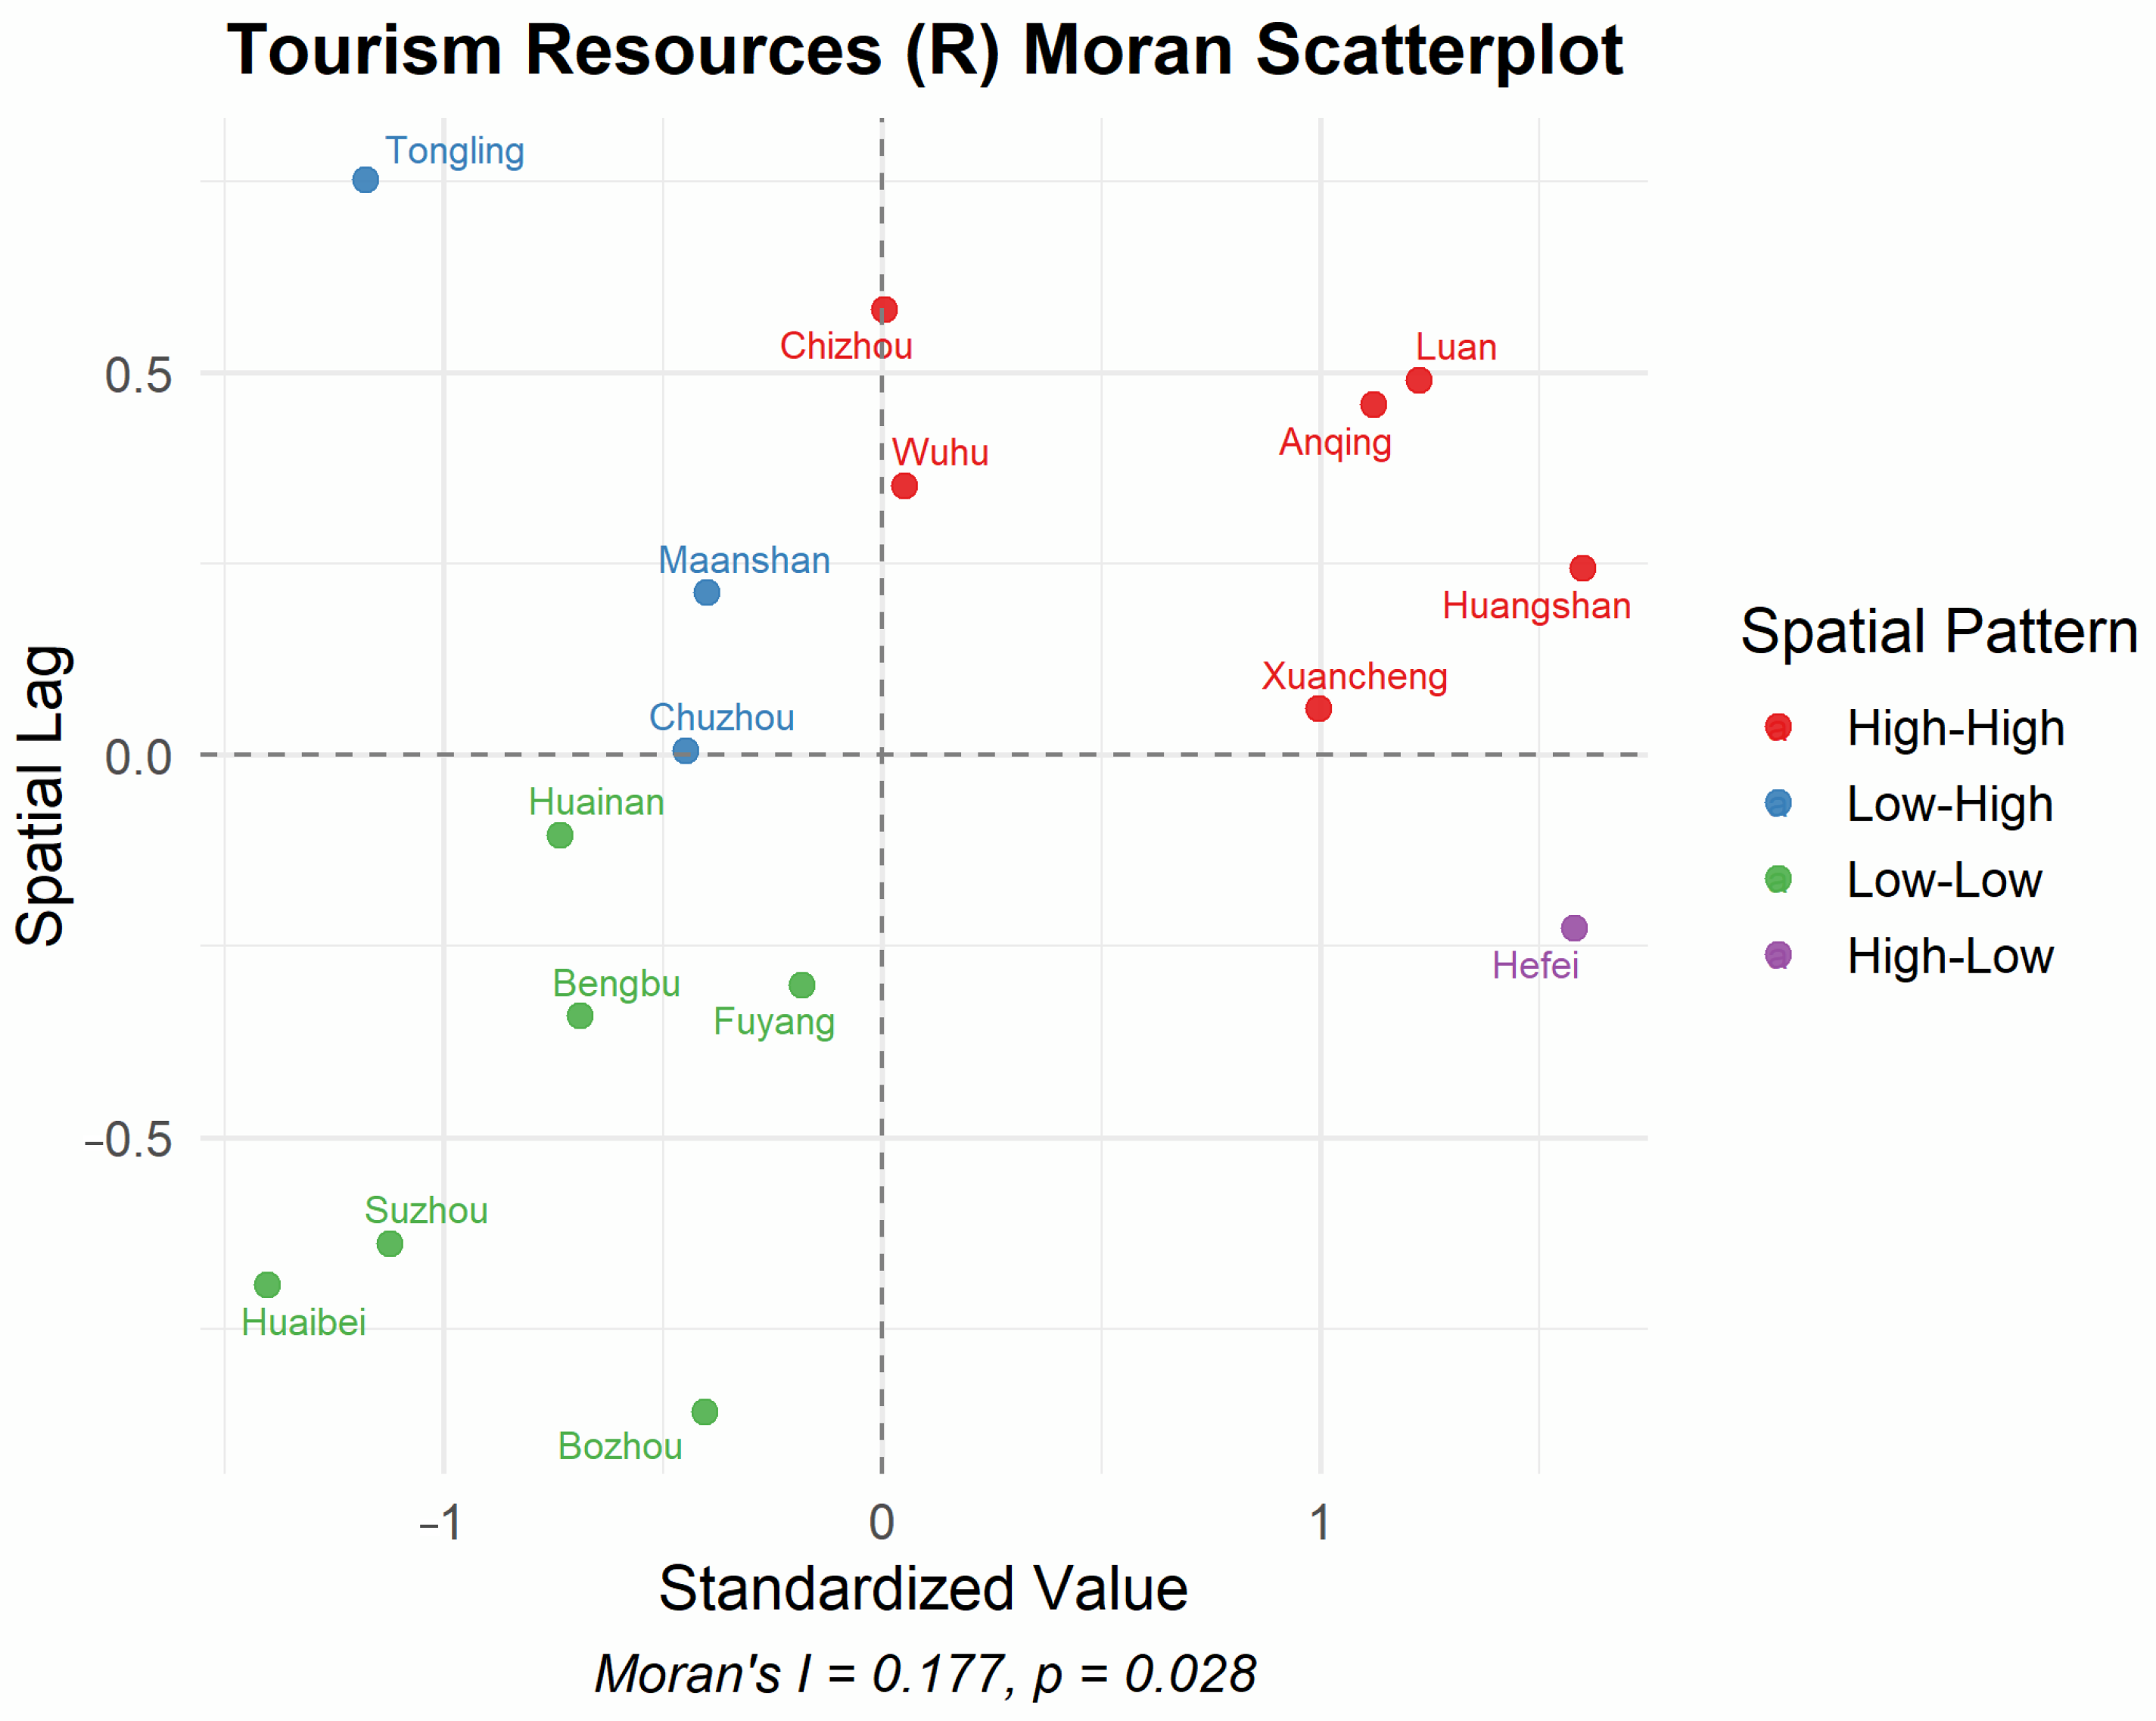
- Tourism Resources (R), although conventionally seen as core elements, are not statistically significant in the model (p ≈ 0.11). This may be attributed to oversupply and the homogeneity of scenic attractions, reducing their marginal contribution to integrated outcomes. Many sites remain spatially fragmented and thematically disconnected, which limits their ability to deliver compelling and immersive tourism experiences.This finding underscores the need to move from a model of quantity accumulation toward one of qualitative transformation through narrative integration, interactive content, and collaborative service design.
- These results suggest that the success of culture–tourism integration in Anhui Province depends not solely on the presence of resources, but more importantly on their narrative potential, spatial connectivity, and alignment with supportive infrastructure and institutional frameworks. The SAR model reveals the spatial logic behind uneven integration outcomes and offers insight into how latent value can be unlocked through systemic design and coordination.
3.3. Existing Issues
- Uneven Regional Development and Significant Spatial DisparitiesSpatial clustering results indicate that cities such as Huangshan form “High-High” clusters, while cities like Huaibei, Suzhou, fall into “Low-Low” zones. Taking Huaibei as an example, it has fewer than 20 A-level scenic spots—only one third of Hefei’s total—and has launched only four provincial-level culture–tourism projects since 2020. This reflects insufficient investment in culture–tourism infrastructure and underutilized development potential. Tongling and Suzhou also lack immersive tourism products and narrative-driven integration models, with both cities recording low per capita tourist spending and short visitor durations. Overall, the absence of inter-regional coordination mechanisms has hindered the radiative impact of core cities.
- Transportation and Policy as Core Drivers; Limited Resource Transformation CapacityWhile transportation accessibility and policy support play a significant role in promoting culture–tourism integration, regions rich in cultural and tourism resources often lack effective mechanisms for content activation and experiential chain development, resulting in low resource transformation efficiency. This pattern is not unique to Anhui Province but is also widely observed in transitional regions such as Henan and Gansu. Relevant studies highlight the persistent disconnect between “resources–scenes–experiences” as a key obstacle to improving the spatial effectiveness of integration. For instance, research on traditional village spatial structures in Henan Province reveals that, although cultural resources are abundant, the absence of narrative logic and thematic expression mechanisms leads to short tourist stays and low consumption willingness, creating a contradiction between resource richness and underwhelming performance [40]. Similarly, an empirical analysis from Gansu Province demonstrates that due to homogeneous tourism offerings and insufficient service infrastructure, the cultural–tourism integration has not translated into regional economic momentum. Although spatial clustering exists, radiative influence remains weak [41]. These findings suggest that the absence of resource transformation mechanisms is a structural challenge not only in Anhui but also in other regions. Therefore, embedding narrative-driven product planning and immersive design strategies is essential to bridge the gap between cultural resources and economic value creation.
- Lack of Resource Expression and Narrative-Driven Integration PathwaysDespite having rich cultural and tourism resources, many regions in Anhui lack systematic expression mechanisms and spatial narrative frameworks. This results in symbolic fragmentation, disconnected branding efforts, and the underutilization of existing assets. In comparison, European regions such as Tuscany, Italy, have effectively adopted place-based narrative strategies to repackage scattered cultural heritage into cohesive tourism corridors and experiential routes. For instance, the “Seeing Stories” project in Florence illustrates how narrative planning can integrate tangible and intangible heritage into immersive storytelling experiences, enhancing both spatial coherence and tourist engagement [42]. Such international practices suggest that Anhui could significantly improve its integration effectiveness by embedding landscape storytelling principles into spatial planning, product design, and regional promotion.
4. Discussion: Optimization Strategy for Regional Culture–Tourism Integration Development Based on Landscape Narrative
4.1. Constructing a Province-Wide Narrative Community: Reshaping the Overall Structure of Regional Cultural Expression
4.2. Activating the Narrative Potential of Cultural Resources: Advancing the Chain Transfor-Mation from Resource to Scene to Experience
4.3. Leveraging Transportation and Policy as Foundational Carriers to Support Cross-Regional, Narrative-Driven Culture–Tourism Development
4.4. Enhancing Digital Expression and Intelligent Feedback Mechanisms to Improve the Per-Ceptual Efficiency of Narrative Environments
4.5. Establishing a Triadic Co-Creation Mechanism Among Residents, Tourists, and Platforms to Foster Place-Based Identity and Cultural Co-Creation
5. Conclusions
Author Contributions
Funding
Data Availability Statement
Conflicts of Interest
References
- Lv, J.L. Road map for and suggestions on the integration of Anhui cultural industry and tourism. J. Wuhan Bus. Univ. 2022, 36, 11–14. [Google Scholar]
- Potteiger, M.; Purinton, J. Landscape Narratives: Design Practices for Telling Stories; John Wiley & Sons: Hoboken, NJ, USA, 1998. [Google Scholar]
- Wang, C. A Review of Narrative Theory and Practice of Landscape Design. Master’s Thesis, Xi’an University of Architecture and Technology, Xi’an, China, 2023. [Google Scholar] [CrossRef]
- Chen, L. Research on Traditional Village Landscape Renewal Based on Narrative Space Theory: A Case Study of Jiajia Ancient Village in Gao’an. Master’s Thesis, Jiangxi University of Finance & Economics, Nanchang, China, 2024. [Google Scholar]
- Sun, Y.; Li, S.; Feng, Y.L.; Su, Y. Observation and narrative: A study of design methods for tourist highway observation decks. Chin. Landsc. Archit. 2022, 38, 130–134. [Google Scholar]
- Song, J.M. Traditional Color Resources and New Narratives of Contemporary Urban Landscape Colors. Art Obs. 2023, 9, 18–20. [Google Scholar]
- Wang, Z.Y.; Liu, Y.R. Cultural narration and image reconstruction of urban landscape: Discussion centered on the “Eight Scenes of Jinling”. Mod. Urban Res. 2022, 12, 107–110. [Google Scholar]
- Ren, Z. The multidimensional narrative and contemporary expression of Dongpo Cultural Landscape. J. Southwest Minzu Univ. (Humanit. Soc. Sci. Ed.) 2024, 45, 36–43. [Google Scholar]
- Strauser, J.; Stewart, W.P.; Evans, N.M.; Stamberger , L.; van Riper, C.J. Heritage narratives for landscapes on the rural–urban fringe in the Midwestern United States. J. Environ. Plan. Manag. 2019, 62, 1269–1286. [Google Scholar] [CrossRef]
- Erbaş Gürler, E.; Yetişkin, E.; Özer, B. Narrative Landscape: The Transformation of Memory (scape) making in Gallipoli Peninsula. Space Cult. 2018, 21, 274–290. [Google Scholar] [CrossRef]
- Lund, K. Landscapes and narratives: Compositions and the walking body. Landsc. Res. 2012, 37, 225–237. [Google Scholar] [CrossRef]
- Soliva, R. Landscape stories: Using ideal type narratives as a heuristic device in rural studies. J. Rural. Stud. 2007, 23, 62–74. [Google Scholar] [CrossRef]
- Meier, L.; Aytekin, E.A. Transformed landscapes and a transnational identity of class: Narratives on (post-) industrial landscapes in Europe. Int. Sociol. 2019, 34, 99–116. [Google Scholar] [CrossRef]
- Alkhateeb, G.; Storie, J.; Külvik, M. Post-Conflict Urban Landscape Storytelling: Two Approaches to Contemporary Virtual Visualisation of Oral Narratives. Land 2024, 13, 406. [Google Scholar] [CrossRef]
- Xu, Y.T.; Ye, S.Q.; Wang, Y.; Song, Y. Preliminary exploration of literary mapping visualization of xu xiake’s travel notes under spatial narrative: A case study based on landscape resources in central Yunnan region. South Archit. 2024, 6, 21–31. [Google Scholar]
- He, L.; Li, W. Research on Anhui culture and tourism brand construction from the perspective of industrial integration. J. Luoyang Norm. Univ. 2024, 43, 20–25. [Google Scholar]
- Li, W.; Albattat, A.R.S.; Tham, J. Empirical Study of Cultural Industry Competitiveness in Anhui Province Based on the Diamond Model. Int. J. Prof. Bus. Rev. 2023, 8, 2. [Google Scholar]
- Feng, X.G. Exploring innovative paths for high-quality integration and development of local culture and tourism. People’s Trib. 2024, 7, 99–103. [Google Scholar]
- Zhang, L.X. Four Dimensions of Anhui Culture and Tourism. Anhui Daily, 20 December 2024. [Google Scholar]
- Li, W. Research on the Measurement and Influencing Factors of High-quality Integration Level of Cultural Tourism. Tour. Manag. Technol. Econ. 2023, 6, 47–57. [Google Scholar]
- Lv, J.; Yang, Y. Research on the integrated development of cultural and tourism industries in Anhui Province based on the C-R model. Tour. Overv. 2023, 87–89. [Google Scholar]
- Liu, B. Research on the countermeasures for the coordinated development of cultural industry and tourism industry in Anhui province from the perspective of integration. J. West Anhui Univ. 2021, 37, 129–134. [Google Scholar]
- Cummings, J.J.; Tsay-Vogel, M.; Cahill, T.J.; Zhang, L. Effects of immersive storytelling on affective, cognitive, and associative empathy: The mediating role of presence. New Media Soc. 2022, 24, 2003–2026. [Google Scholar] [CrossRef]
- Vasilevski, N. Using Gamification and Augmented Reality Micro-Location to Increase Sense of Place Through Service-Dominant Logic. Ph.D. Thesis, Bond University, Gold Coast, Australia, 2021. [Google Scholar]
- Hirsch, L.; Welsch, R.; Rossmy, B.; Butz, A. Embedded AR storytelling supports active indexing at historical places. In Proceedings of the Sixteenth International Conference on Tangible, Embedded, and Embodied Interaction, Daejeon, Republic of Korea, 13–16 February 2022; pp. 1–12. [Google Scholar]
- Tsou, T.H.; Rodgers, S. Augmented Narrative Advertising: Consumer Responses to AR Story Filters and Product Placement Primes. J. Interact. Advert. 2024, 24, 303–323. [Google Scholar] [CrossRef]
- Qiu, B.; Song, P.; Tao, X.; Zhou, Q.; Zhang, F. Construction of urban collective memory maps based on social media data: A case study of Nanjing, China. npj Herit. Sci. 2025, 13, 1–15. [Google Scholar] [CrossRef]
- Wu, R.; Chen, K.; Li, X. Development of Regional Cultural IP for Rural Tourism: A Case Study of Zesui Village. Tour. Manag. Technol. Econ. 2023, 6, 20–27. [Google Scholar]
- Gill, A.M. Storytelling as Design Methodology: Reclaiming Little Manila’s Urban Landscape Identity. Master’s Thesis, Louisiana State University and Agricultural & Mechanical College, Baton Rouge, LA, USA, 2022. [Google Scholar]
- Kim, S.; Whitford, M.; Arcodia, C. Development of intangible cultural heritage as a sustainable tourism resource: The intangible cultural heritage practitioners’ perspectives. In Authenticity and Authentication of Heritage; Routledge: London, UK, 2021; pp. 34–47. [Google Scholar]
- Liu, S.; Wu, L.; Xiang, C.; Dai, W. Revitalizing Rural Landscapes: Applying Cultural Landscape Gene Theory for Sustainable Spatial Planning in Linpu Village. Buildings 2024, 14, 2396. [Google Scholar] [CrossRef]
- Privitera, A.G.; Fontana, F.; Geronazzo, M. The Role of Audio in Immersive Storytelling: A Systematic Review in Cultural Heritage. Multimed. Tools Appl. 2005, 84, 16105–16143. [Google Scholar] [CrossRef]
- Alatrash, S.; Arnab, S.; Antlej, K. Communicating engineering heritage through immersive technology: A VR framework for enhancing users’ interpretation process in virtual immersive environments. Comput. Educ. X Real. 2023, 3, 100040. [Google Scholar] [CrossRef]
- Gu, D.Z.; Zhang, Y.; Wu, X.Y. Research on the Planning of “Characteristic Blocks” in Characteristic Towns Based on Place Narrative: A Case Study of Qihong Town in Huizhou. In Vitality and Beautiful Living in Urban and Rural Areas—Proceedings of the 2019 China Urban Planning Annual Conference (19 Small Town Planning), Chongqing, China, 19–20 October 2019; China Architecture & Building Press: Beijing, China, 2019. [Google Scholar]
- Liu, Q.Q. Research on Multi-Dimensional Sensing Methods for Narrative Landscapes: A Case Study of the Landscape Design of West Lake Park in Wangcheng County. Master’s Thesis, Central South University, Changsha, China, 2011. [Google Scholar]
- Li, W.Y.; Li, J.G. Empirical Analysis on China’s GDP Growth Based on Linear Regression Model. Stat. Appl. 2022, 11, 1492–1499. [Google Scholar]
- Dogan, E.; Kan, M.H. Bringing heritage sites to life for visitors: Towards a conceptual framework for immersive experience. Adv. Hosp. Tour. Res. (AHTR) 2020, 8, 76–99. [Google Scholar] [CrossRef]
- Li, Z.Y.; Sun, H.; Li, L.B. Analysis of intercity travel in the Yangtze River Delta based on mobile signaling data. J. Tsinghua Univ. (Sci. Technol.) 2022, 62, 1203–1211. [Google Scholar]
- Zang, Z.; Xu, X.; Qu, K.; Chen, R.; Chen, A. Travel time reliability in transportation networks: A review of methodological developments. Transp. Res. Part C Emerg. Technol. 2022, 143, 103866. [Google Scholar] [CrossRef]
- Li, Z.Y.; Yang, M.Y.; Zhou, X.L.; Li, Z.; Li, H.; Zhai, F.; Zhang, Y.; Zhang, Y. Research on the spatial correlation and formation mechanism between traditional villages and rural tourism. Sci. Rep. 2023, 13, 8210. [Google Scholar] [CrossRef]
- Peng, R.; Gao, W. Spatial distribution pattern and driving mechanism of tourist attractions in Gansu Province based on POI data. PLoS ONE 2023, 18, e0292165. [Google Scholar] [CrossRef] [PubMed]
- Seeing Stories Project. Florence Landscape Narratives [Internet]. 2019. Available online: https://seeingstories.eu/index.php/firenze-landscape-narratives (accessed on 25 June 2025).
- Zhang, X.C.; Gao, N.; Wang, L.Y. A review of cultural and tourism industry integration development effectiveness evaluation: Relation identification, theory development and system reconstruction. Tour. Sci. 2023, 37, 19–36. [Google Scholar]

| First Level Indicators | Second Level Indicators | Unit |
|---|---|---|
| Culture–Tourism Economy (E) | Domestic tourism per capita spending E1 | CNY/person |
| Total income of tourism economyE2 | billion CNY | |
| Gross overnight tourism revenue E3 | billion CNY | |
| Number of legal entities of culture and related industries under regulation E4 | count | |
| Operating income of legal entities of culture and related industries on a regular basis E5 | million CNY | |
| GDP per capita E6 | CNY/person | |
| Cultural Resources (C) | Number of cultural centers, museums and libraries C1 | count |
| Number of exhibitions held C2 | count | |
| National Key cultural relics protection unit C3 | count | |
| Number of State-level intangible cultural heritage C4 | count | |
| Tourism Resources (R) | Number of A-level scenic spots R1 | count |
| Number of 5A-level scenic spots R2 | count | |
| Number of 4A-level scenic spots R3 | count | |
| Number of 5-star hotels R4 | count | |
| Number of 4-star hotels R5 | count | |
| Number of travel agencies R6 | count | |
| Transportation Accessibility (T) | Number of high-speed rail stations T1 | count |
| Number of airports T2 | count | |
| Number of highway lines T3 | count | |
| Policy Support (P) | Provincial business, culture–tourism integration development cluster P1 | count |
| Number of key cultural and tourism projects at municipal level P2 | count |
| First Level Indicators | Culture–Tourism Economy (E) | Cultural Resources (C) | Tourism Resources (R) | Transportation Accessibility (T) | Policy Support (P) |
|---|---|---|---|---|---|
| Hefei | 84.864 | 73.867 | 60.240 | 93.523 | 77.132 |
| Huaibei | 27.365 | 36.294 | 31.587 | 29.529 | 24.178 |
| Bozhou | 39.232 | 55.177 | 39.268 | 35.760 | 41.930 |
| Suzhou | 40.766 | 42.129 | 44.587 | 34.682 | 29.168 |
| Bengbu | 30.302 | 44.889 | 45.582 | 38.992 | 36.857 |
| Fuyang | 59.438 | 42.877 | 52.833 | 37.793 | 45.840 |
| Huainan | 39.110 | 32.358 | 47.258 | 31.342 | 36.055 |
| Chuzhou | 53.391 | 38.522 | 45.014 | 48.991 | 41.129 |
| Lu’an | 42.953 | 40.635 | 38.093 | 40.924 | 70.870 |
| Ma’anshan | 34.219 | 39.319 | 48.362 | 44.462 | 42.020 |
| Wuhu | 69.140 | 56.634 | 47.773 | 72.941 | 49.989 |
| Xuancheng | 56.325 | 50.236 | 60.090 | 46.212 | 66.798 |
| Tongling | 29.282 | 36.294 | 33.933 | 37.982 | 28.183 |
| Chizhou | 46.346 | 46.365 | 42.475 | 59.932 | 49.214 |
| Anqing | 74.473 | 49.038 | 46.654 | 57.787 | 69.003 |
| Huangshan | 57.375 | 86.122 | 88.311 | 63.362 | 77.480 |
| First-Level Indicators | Culture–Tourism Economy (E) | |||||
|---|---|---|---|---|---|---|
| Secondary Indicators | Per capita Spending on Domestic Tourism E1 | Total Income from Tourism Economy E2 | Gross Income from Overnight Tourism E3 | Number of Legalized Units of Cultural and Related Industries on a Regular Basis E4 | Operating Income of Legal entities in Culture and Related Industries on a Regular Basis E5 | GDP per Capita E6 |
| Hefei | 89.62 | 95.53 | 95.60 | 95.36 | 96.96 | 85.89 |
| Huaibei | 23.35 | 28.12 | 28.72 | 26.17 | 36.88 | 43.74 |
| Bozhou | 39.16 | 36.62 | 36.54 | 33.40 | 38.29 | 24.67 |
| Suzhou | 30.12 | 33.87 | 34.20 | 49.84 | 43.03 | 23.69 |
| Bengbu | 28.47 | 42.57 | 41.15 | 44.62 | 39.37 | 38.97 |
| Fuyang | 31.83 | 36.22 | 36.50 | 66.53 | 43.87 | 22.22 |
| Huainan | 25.74 | 32.47 | 32.78 | 31.79 | 37.02 | 30.16 |
| Chuzhou | 50.75 | 38.98 | 40.23 | 75.66 | 52.06 | 63.29 |
| Lu’an | 43.45 | 43.14 | 43.56 | 38.64 | 40.17 | 26.98 |
| Ma’anshan | 37.82 | 40.91 | 40.00 | 42.60 | 43.36 | 80.29 |
| Wuhu | 84.47 | 69.93 | 67.43 | 58.87 | 72.55 | 84.41 |
| Xuancheng | 50.63 | 43.27 | 43.53 | 50.30 | 42.94 | 50.77 |
| Tongling | 40.43 | 32.41 | 32.46 | 34.21 | 38.33 | 64.24 |
| Chizhou | 74.71 | 65.21 | 65.03 | 31.60 | 37.12 | 55.51 |
| Anqing | 63.54 | 62.30 | 59.84 | 57.54 | 43.39 | 43.28 |
| Huangshan | 69.39 | 69.32 | 72.56 | 35.04 | 55.14 | 51.57 |
| First-Level Indicators | Cultural Resources(C) | |||
|---|---|---|---|---|
| Secondary Indicators | Number of Cultural Centers, Museums and Libraries C1 | Number of Exhibitions Organized C2 | State-Level Key Cultural Relics Protection Units C3 | Number of State-level Intangible Cultural Heritage C4 |
| Hefei | 59.01 | 83.22 | 47.47 | 46.44 |
| Huaibei | 36.53 | 20.24 | 38.65 | 30.05 |
| Bozhou | 35.95 | 38.66 | 43.00 | 42.11 |
| Suzhou | 37.13 | 46.23 | 36.54 | 63.64 |
| Bengbu | 39.53 | 60.48 | 45.23 | 37.90 |
| Fuyang | 40.76 | 77.28 | 28.64 | 67.60 |
| Huainan | 45.75 | 53.43 | 43.00 | 46.44 |
| Chuzhou | 50.20 | 51.77 | 38.65 | 33.86 |
| Lu’an | 45.75 | 20.24 | 38.65 | 46.44 |
| Ma’anshan | 44.49 | 73.15 | 38.65 | 33.86 |
| Wuhu | 50.84 | 46.23 | 54.22 | 37.90 |
| Xuancheng | 47.02 | 80.24 | 67.04 | 50.82 |
| Tongling | 47.65 | 20.24 | 34.47 | 26.49 |
| Chizhou | 36.53 | 43.49 | 51.97 | 42.11 |
| Anqing | 43.86 | 22.48 | 60.81 | 67.60 |
| Huangshan | 97.40 | 62.58 | 96.82 | 96.06 |
| First-Level Indicators | Tourism Resources (R) | |||||
|---|---|---|---|---|---|---|
| Secondary Indicators | Number of A-Class Scenic Spots R1 | Number of 5A-Level Scenic Spots R2 | Number of 4A-Grade Scenic Spots R3 | Number of 5-Star Hotels R4 | Number of 4-Star Hotels R5 | Number of Travel Agencies R6 |
| Hefei | 77.22 | 57.25 | 84.55 | 95.72 | 89.34 | 96.88 |
| Huaibei | 16.17 | 29.40 | 21.51 | 41.06 | 21.11 | 34.08 |
| Bozhou | 55.50 | 29.40 | 36.68 | 41.06 | 38.76 | 35.46 |
| Suzhou | 23.52 | 29.40 | 31.10 | 41.06 | 29.15 | 35.99 |
| Bengbu | 37.46 | 29.40 | 28.49 | 68.89 | 33.79 | 42.33 |
| Fuyang | 48.85 | 57.25 | 33.84 | 41.06 | 29.15 | 41.96 |
| Huainan | 40.63 | 29.40 | 33.84 | 32.15 | 49.33 | 40.66 |
| Chuzhou | 55.50 | 29.40 | 33.84 | 32.15 | 43.98 | 43.45 |
| Lu’an | 72.19 | 81.15 | 82.85 | 41.06 | 49.33 | 43.45 |
| Ma’anshan | 34.39 | 57.25 | 33.84 | 50.60 | 33.79 | 43.07 |
| Wuhu | 40.63 | 57.25 | 42.65 | 68.89 | 69.72 | 51.02 |
| Xuancheng | 76.03 | 57.25 | 76.87 | 50.60 | 59.96 | 48.93 |
| Tongling | 20.12 | 29.40 | 36.68 | 32.15 | 29.15 | 35.64 |
| Chizhou | 42.25 | 57.25 | 61.12 | 32.15 | 49.33 | 44.20 |
| Anqing | 86.07 | 57.25 | 76.87 | 32.15 | 69.72 | 49.88 |
| Huangshan | 70.84 | 93.26 | 72.14 | 68.89 | 87.11 | 74.00 |
| First-Level Indicators | Transportation Accessibility (T) | Policy Support (P) | |||
|---|---|---|---|---|---|
| Secondary Indicators | Number of High-Speed Rail Stations T1 | Number of Airports T2 | Number of High-Speed Lines Access T3 | Provincial Business, Culture and Tourism Integration Development Cluster P1 | Number of Key Cultural and Tourism Projects at Municipal Level P2 |
| Hefei | 92.15 | 77.73 | 82.29 | 95.13 | 41.97 |
| Huaibei | 31.28 | 32.08 | 17.42 | 34.88 | 38.42 |
| Bozhou | 40.59 | 32.08 | 44.57 | 63.98 | 41.97 |
| Suzhou | 40.59 | 32.08 | 49.68 | 34.88 | 53.00 |
| Bengbu | 23.27 | 32.08 | 37.90 | 44.40 | 45.62 |
| Fuyang | 60.62 | 77.73 | 39.57 | 54.36 | 25.65 |
| Huainan | 50.63 | 32.08 | 30.77 | 34.88 | 28.58 |
| Chuzhou | 40.59 | 32.08 | 91.76 | 26.43 | 56.67 |
| Lu’an | 40.59 | 32.08 | 56.97 | 44.40 | 34.98 |
| Ma’anshan | 40.59 | 32.08 | 27.86 | 44.40 | 31.69 |
| Wuhu | 77.62 | 77.73 | 49.24 | 63.98 | 45.62 |
| Xuancheng | 69.80 | 32.08 | 62.60 | 34.88 | 73.27 |
| Tongling | 31.28 | 32.08 | 23.81 | 34.88 | 38.42 |
| Chizhou | 23.27 | 77.73 | 45.73 | 44.40 | 49.31 |
| Anqing | 77.62 | 77.73 | 67.02 | 34.88 | 70.28 |
| Huangshan | 40.59 | 77.73 | 59.39 | 79.80 | 95.61 |
| First-Level Index | Z | P | Global Moran’s I |
|---|---|---|---|
| Culture–Tourism Economy (E) | 2.359 | 0.009 | 0.207 |
| Cultural Resources (C) | 0.009 | 0.504 | 0.068 |
| Tourism Resources (R) | 1.913 | 0.028 | 0.177 |
| Transportation Accessibility (T) | 0.266 | 0.605 | 0.100 |
| Policy Support (P) | 0.087 | 0.465 | 0.057 |
| Variables | Regression Coefficient Estimate | Significance Level | Effect of Variable | Variables |
|---|---|---|---|---|
| Spatial lag Rho | 0.61226 | p < 0.001 | Positive (+) | Neighboring regions’ cultural and tourism economic development has a significant positive spillover effect on the region, with strong spatial dependence. |
| Tourism Resources (R) | −0.224856 | p ≈ 0.11 | Negative (−) | Local tourism resources are abundant but the utilization efficiency may not be sufficient, and have not been effectively transformed into economic advantages. |
| Transportation Accessibility (T) | 0.685010 | p < 0.001 | Positive (+) | Improved transportation conditions can effectively promote the development of cultural and tourism integration, which is one of the main driving factors. |
| Policy Support (P) | 0.735999 | p < 0.001 | Positive (+) | Policy support has a significant positive effect on the economic development of culture and tourism. |
| Cultural Resources (C) | −0.352146 | p < 0.01 | Negative (−) | Although there are many cultural resources, there is the problem of precipitation or low conversion rate, which inhibits the development of culture–tourism economy in the short term. |
Disclaimer/Publisher’s Note: The statements, opinions and data contained in all publications are solely those of the individual author(s) and contributor(s) and not of MDPI and/or the editor(s). MDPI and/or the editor(s) disclaim responsibility for any injury to people or property resulting from any ideas, methods, instructions or products referred to in the content. |
© 2025 by the authors. Licensee MDPI, Basel, Switzerland. This article is an open access article distributed under the terms and conditions of the Creative Commons Attribution (CC BY) license (https://creativecommons.org/licenses/by/4.0/).
Share and Cite
Hong, Y.; Tu, L.; Wan, M. Evaluation and Optimization Strategies for Provincial Culture and Tourism Integration from the Perspective of Landscape Narrative: A Case Study of Anhui Province, China. Land 2025, 14, 1398. https://doi.org/10.3390/land14071398
Hong Y, Tu L, Wan M. Evaluation and Optimization Strategies for Provincial Culture and Tourism Integration from the Perspective of Landscape Narrative: A Case Study of Anhui Province, China. Land. 2025; 14(7):1398. https://doi.org/10.3390/land14071398
Chicago/Turabian StyleHong, Yunxi, Li Tu, and Minghe Wan. 2025. "Evaluation and Optimization Strategies for Provincial Culture and Tourism Integration from the Perspective of Landscape Narrative: A Case Study of Anhui Province, China" Land 14, no. 7: 1398. https://doi.org/10.3390/land14071398
APA StyleHong, Y., Tu, L., & Wan, M. (2025). Evaluation and Optimization Strategies for Provincial Culture and Tourism Integration from the Perspective of Landscape Narrative: A Case Study of Anhui Province, China. Land, 14(7), 1398. https://doi.org/10.3390/land14071398