Article

Unveiling the Synergies and Conflicts Between Vegetation Dynamic and Water Resources in China’s Yellow River Basin

1
Key Laboratory of Western China’s Environmental Systems (Ministry of Education), College of Earth and Environmental Sciences, Lanzhou University, Lanzhou 730000, China
2
College of Civil Engineering, Shandong Jiaotong University, Jinan 250357, China
*
Author to whom correspondence should be addressed.
Land 2025, 14(7), 1396; https://doi.org/10.3390/land14071396
Submission received: 12 May 2025 / Revised: 13 June 2025 / Accepted: 1 July 2025 / Published: 3 July 2025
(This article belongs to the Special Issue Integrating Climate, Land, and Water Systems)

Abstract

Understanding the relationship between regional vegetation dynamics and water resources is essential for improving integrated vegetation–water management, enhancing ecosystem services, and advancing the sustainable development of ecological–economic–social systems. As China’s second largest river basin, the Yellow River Basin (YRB) is ecologically fragile and experiences severe water scarcity. Vegetation changes further intensify conflicts between water supply and demand. To investigate the evolution and interaction mechanisms between vegetation and water resources in the YRB, this study uses the InVEST model to simulate annual water yield (Wyield) from 1982 to 2020 and applies the Dimidiate Pixel Model (DPM) to estimate fractional vegetation cover (FVC). The Theil–Sen method is applied to quantify the spatiotemporal trends of Wyield and FVC. A pixel-based second-order partial correlation analysis is performed to clarify the intrinsic relationship between FVC and Wyield at the grid scale. The main conclusions are as follows: (1) During the statistical period (1982–2020), the multi-year average annual Wyield in the YRB was 73.15 mm. Interannual Wyield showed a clear fluctuating trend, with an initial decline followed by a subsequent increase. Wyield showed marked spatial heterogeneity, with high values in the southern upper reaches and low values in the Longzhong Loess Plateau and Hetao Plain. During the same period, about 68.74% of the basin experienced increasing Wyield, while declines were concentrated in the upper reaches. (2) The average FVC across the basin was 0.51, showing a significant increasing trend during the statistical period. The long-term average FVC showed significant spatial heterogeneity, with high values in the Fenwei Plain, Shanxi Basin, and Taihang Mountains, and low values in the Loess Plateau and Hetao Plain. Spatially, 68.74% of the basin exhibited significant increases in FVC, mainly in the middle and lower reaches, while decreases were mostly in the upper reaches. (3) Areas with significant FVC–Wyield correlations covered a small portion of the basin: trade-off regions made up 10.35% (mainly in the southern upper reaches), and synergistic areas accounted for 5.26% (mostly in the Hetao Plain and central Loess Plateau), both dominated by grasslands and croplands. Mechanistic analysis revealed spatiotemporal heterogeneity in FVC–Wyield relationships across the basin, influenced by both natural drivers and anthropogenic activities. This study systematically explores the patterns and interaction mechanisms of FVC and Wyield in the YRB, offering a theoretical basis for regional water management, ecological protection, and sustainable development.

1. Introduction

Vegetation ecosystems provide diverse ecosystem service functions, playing critical roles in soil–water conservation, carbon sequestration, windbreak and sand fixation, water quality improvement, biodiversity enhancement, and climate regulation [1]. To mitigate the extreme consequences of climate change and ecosystem degradation, vegetation restoration initiatives have emerged as primary global strategies for addressing global warming, reducing natural disasters, and improving ecological conditions [2]. Notable examples include large-scale prairie restoration programs in the United States [3] and Amazon rainforest rehabilitation initiatives in Brazil [4]. China has allocated over US$378.5 billion to ecological restoration programs, including the Three-North Shelterbelt Program (1979), Yangtze River Shelterbelt Project (1989), Grain-for-Green Program (1999), and Natural Forest Protection Program (1999). These ecological projects have substantially enhanced forest coverage [5], with China’s forest cover increasing from 13.0% in 1988 to 24.02% in 2022 [6]. They have effectively restored ecosystem services and improved terrestrial ecosystems, particularly demonstrating positive impacts on arid land rehabilitation, soil erosion reduction, and sandstorm mitigation in China [7].
Vegetation serves as a crucial link in terrestrial water cycles, connecting the hydrosphere, biosphere, and atmosphere [8]. Large-scale restoration programs significantly alter surface properties and land–atmosphere interactions, thereby modifying regional water cycles and resource availability [9]. Water yield (Wyield), a robust metric for assessing water resource provision capacity and availability [10], demonstrates strong correlations with regional vegetation dynamics [11]. However, the hydrological impacts of vegetation changes remain contentious due to complex vegetation dynamics and multidimensional interactions among vegetation, atmosphere, and hydrological processes [12,13,14]. Studies indicate that vegetation expansion enhances canopy interception and transpiration, potentially reducing Wyield and run-off [15,16]. Large-scale restoration programs like China’s Three-North Shelterbelt Program and Grain-for-Green Program have demonstrated increased water consumption but decreased Wyield following vegetation recovery [17,18]. Zhou’s analysis of global climate–land cover interactions revealed that afforestation generally reduces watershed Wyield, with more pronounced effects in non-humid regions [19]. Conversely, other research suggests vegetation growth facilitates large-scale moisture transport and enhances regional precipitation [20,21]. While vegetation-induced hydrological effects remain debated, the intrinsic connection between vegetation dynamics and ecosystem water balance crucially impacts ecological security [22]. Understanding vegetation–Wyield interactions holds vital significance for sustainable water management.
The vegetation–Wyield relationship constitutes both a critical theoretical focus in hydroecology and a vital applied subject for ecological restoration and conservation [23], though current research remains insufficient globally. While international research has extensively documented local-scale vegetation–hydrology interactions, basin-scale analyses remain scarce [24]. Domestic research emphasizes vegetation effects on soil moisture and run-off, yet systematic long-term observational datasets and findings remain scarce. Divergent conclusions across spatiotemporal scales further undermine scientific foundations for integrated vegetation–water resource management [25]. Emerging methodologies integrate vegetation indices with InVEST’s advanced modeling framework, enabling mechanistic analysis of vegetation–Wyield feedbacks [26,27]. The fractional vegetation cover (FVC) index serves as a spatially explicit metric for quantifying vegetation coverage dynamics, with applications spanning land degradation monitoring, ecological security assessment, and soil conservation practices [28,29]. The InVEST water yield module employs water balance principles, calculating Wyields through precipitation, evapotranspiration, root depth, and soil parameters. Its superior dynamic assessment capabilities and scalability establish it as an essential tool for regional planning and resource governance [30,31].
The Yellow River Basin (YRB) is the traditional agricultural heartland, a major energy base, and a critical ecological security barrier in China. It also serves as a vital connector linking the eastern, central, and western regions of the country and forms a key part of the terrestrial “Belt and Road” initiative [32]. Consequently, the YRB plays an essential role in balancing the river’s water–sediment regime, mitigating water supply–demand conflicts, safeguarding flood security, fostering high-quality socioeconomic development within the basin, and maintaining national ecological security [33]. However, the YRB is simultaneously recognized as China’s most extensive and acutely ecologically fragile region in the north, characterized by the largest area, widest distribution, most diverse vulnerability types, and severest degradation levels [34]. It experiences frequent natural disasters, such as soil erosion, desertification, and flooding. The ecosystem exhibits high susceptibility to degradation, with recovery proving difficult and slow [35]. Furthermore, acute water scarcity persists, where the current level of water resources development and utilization exceeds ecological safety thresholds by more than twofold [36]. To promote ecological conservation and high-quality development within the basin and address the challenges of unbalanced and inadequate development, the Chinese government has implemented a series of national policies since the 1970s. Key initiatives include the “Three-North Shelterbelt Program”, “Comprehensive Management of the Loess Plateau”, the “Grain for Green Program (GGP)”, and the “Western Region Development Strategy” [37,38,39]. In 2019, ecological protection and high-quality development in the YRB were elevated to a major national strategy [40]. Following the State Council’s issuance of the “Outline of the Plan for Ecological Protection and High-quality Development in the Yellow River Basin” in 2021, significant changes in land use/cover and notable improvements in ecological quality have been observed within the basin. Nevertheless, research indicates that vegetation restoration in much of the YRB is approaching the sustainability limits imposed by available water resources [41], with water acting as the critical limiting environmental factor for ecosystem functioning in the basin [42]. Although an association between vegetation change and water resource dynamics exists, the spatiotemporal patterns of their co-variation, underlying interactions, and precise mechanisms remain inadequately understood. There is, therefore, an urgent need for further scientific investigation to enhance our systematic understanding of these complex dynamics.
Ecological engineering projects and development policies exert significant yet complex hydrological and ecological impacts on the YRB, though existing studies offer limited theoretical frameworks and mechanistic explanations, particularly lacking large-scale systematic investigations. Therefore, this study adopts vegetation dynamics and water resources as entry points, investigating the spatiotemporal characteristics and relationships between vegetation changes and Wyield in the YRB through temporal and spatial dimensions, based on the research perspective of vegetation–Wyield interactions. By analyzing hydrological components, we elucidate the ecohydrological characteristics of vegetation and associated processes, exploring the relationship and underlying mechanisms between vegetation and Wyield. This research provides critical scientific foundations for vegetation restoration and water resource management in the YRB and extensive arid/semi-arid regions, facilitating the conservation and sustainable utilization of land–water resources. Based on this framework, the study will proceed through three principal aspects: (1) Simulate annual Wyield and calculate vegetation coverage in the YRB from 1982 to 2020, followed by spatiotemporal variation analysis of these parameters. (2) Investigate the trade-off/synergy relationships between vegetation coverage and Wyield. (3) Conduct a comprehensive analysis of the impact mechanisms of vegetation dynamics on Wyield.

2. Materials and Methods

2.1. Study Area

The YRB (95°53′–119°20′ E, 32°09′–41°49′ N) is situated in north-central China, extending from the Bayan Har Mountains in Qinghai Province in the west to Dongying City in Shandong Province, where it discharges into the Bohai Sea (Figure 1). It spans four major geomorphological units (Qinghai-Tibet Plateau, Inner Mongolia Plateau, Loess Plateau, and North China Plain) and three topographic steps [37]. The basin encompasses nine provincial-level administrative regions: Qinghai, Sichuan, Gansu, Ningxia, Inner Mongolia, Shaanxi, Shanxi, Henan, and Shandong, with a total area of 79.58 × 10⁴ km2, accounting for 8.30% of China’s terrestrial territory. The YRB exhibits a west-to-east topographic gradient, with elevations ranging from 0 to 6254 m and significant relief. Spanning arid, semi-arid, semi-humid, and humid climatic zones, the region has an annual mean temperature of −4–14 °C, multi-year average precipitation of 446 mm, and annual sunshine duration of 2000–3300 h. It features arid conditions in the west, humid conditions in the east, dry winters, frequent spring droughts, and rainy summers/autumns. Vegetation types include croplands, coniferous–broadleaf forests, and sparse shrub–steppe grasslands, with land use dominated by grassland (57.94%), cropland (36.7%), and forest (12.04%). The Yellow River is divided into upper, middle, and lower reaches based on its natural environment and hydrological conditions. The upper reach extends from the river source to Hekou Town in Tuoketuo County, Inner Mongolia, with a channel length of 3472 km and a basin area of 42.8 × 10⁴ km2. The middle reach spans from Hekou Town to Taohuayu in Xingyang City, Henan Province, featuring a channel length of 1206 km and a basin area of 34.4 × 10⁴ km2. The lower reach stretches from Taohuayu to the estuary, covering a channel length of 786 km and a basin area of 2.3 × 10⁴ km2 [43].

2.2. Data

The study utilized meteorological data (air temperature (Tem), precipitation (Pre), potential evapotranspiration (PET)), subsurface data (bedrock depth, soil texture, Digital Elevation Model (DEM), land use/cover (LUC), watershed boundaries, Normalized Difference Vegetation Index (NDVI)), and hydrological data (vegetation transpiration (Tr), canopy interception (CI), soil evaporation (Ev), actual evapotranspiration (AET), water resources), as detailed in Table 1. Pre, PET, bedrock depth, soil texture, LUC, watershed boundaries, and water resources data were employed for the Wyield simulation using the InVEST model. NDVI was applied to calculate FVC, while Pre, Tem, Tr, CI, Ev, and AET datasets were analyzed to investigate the correlations and mechanisms between Wyield and FVC. All datasets were standardized to the same spatial reference system and spatial resolution using both reprojection and bilinear interpolation methods.

2.3. Methods

2.3.1. InVEST Model

The InVEST model was developed by Stanford University in 2007. It enables the comprehensive and dynamic assessment of ecosystem services across multiple scales [44]. The Wyield module of the InVEST model is based on the principle of water balance. It estimates Wyield as the difference between precipitation and evapotranspiration. This represents the total water volume, including both surface and subsurface run-offs. The formula is as follows:
Y x = 1 A E T x P x × P x
where Y(x) represents the annual Wyield; AET(x) refers to terrestrial evapotranspiration of pixel x; and P(x) is the annual precipitation of pixel x.
AET(x) is calculated based on the Budyko curve equation proposed by Fuh and Zhang [45,46], and the formula is as follows:
A E T x P x = 1 + P E T x P x 1 + P E T x P x ω x 1 ω x
where PET(x) is the potential evapotranspiration; and ω(x) is a dimensionless parameter characterizing natural climate–soil conditions, calculated using the formula proposed by Donohue [47], as follows:
ω x = Z A W C x P x + 1.25
where Z is a constant representing multi-year average precipitation and other hydrogeological conditions, with a range of [1, 30]; and AWC(x) represents plant-available water content, determined by effective soil depth and soil properties.

2.3.2. Dimidiate Pixel Model

The Dimidiate Pixel Model (DPM) employs the Normalized Difference Vegetation Index (NDVI), a remote sensing-derived vegetation indicator, to estimate fractional vegetation cover (FVC) through inversion modeling. Due to its minimal input requirements and reliable results, the DPM is widely adopted in vegetation monitoring studies [48,49]. The mathematical formulation is
F V C = N D V I N D V I s o i l N D V I v e g N D V I s o i l
where FVC denotes fractional vegetation cover (range: [0, 1]). NDVIsoil represents the minimum value of pure soil pixels (theoretically approaching 0), and NDVIveg indicates the maximum value of pure vegetation pixels (theoretically approaching 1). To reduce image noise effects, we used a 0.05 confidence level, statistically assigning the 5% and 95% NDVI cumulative percentiles as NDVIsoil and NDVIveg, respectively.

2.3.3. Theil–Sen Median Trend Analysis

The Theil–Sen median method is a robust, non-parametric linear technique. It quantifies trends in time-series data. This technique has two key advantages: it makes no assumption about data distribution and resists outlier effects. These properties allow it to effectively capture the spatiotemporal variations of geophysical features [50,51]. The formula is as follows:
S e n i j = m e d i a n x j x i j i 1 < i < j < n
where Senij represents the interannual trend; xi and xj are the values of the sequence data for different years; and i and j are the indices of the time-series data. A positive Senij indicates an upward trend, while a negative Senij indicates a downward trend.

2.3.4. Pixel-Wise Second-Order Partial Correlation Analysis

In natural ecosystems, individual ecological elements are subjected to combined influences from multiple interacting environmental factors. The pixel-wise second-order partial correlation analysis quantifies pairwise relationships between ecological elements after accounting for confounding factors. This approach produces spatially explicit maps of variable interactions. It also captures temporal responses and time-lag effects during extended exposure to external perturbations [52]. The mathematical formulation is expressed as follows:
Step 1: Compute the simple correlation coefficient:
r x y = i = 1 n ( x i x ¯ ) y i y ¯ i = 1 n x i x ¯ 2 n = 1 n y i y ¯ 2
Step 2: Compute the first-order partial correlation coefficient:
r x y 1 = r x y r x 1 r y 1 1 r 2 x 1 1 r 2 y 1
Step 3: Compute the second-order partial correlation coefficient:
r x y 12 = r x y 1 r x 2 1 r y 2 1 1 r x 2 1 2 1 r y 2 1 2
In the formula, x and y denote the interacting elements, where r represents their correlation coefficient, with 1 and 2 as control variables. The terms rxy·1, rx2·1, and ry2·1 correspond to first-order partial correlation coefficients, whereas rxy·12 signifies the second-order partial correlation coefficient. A positive coefficient value indicates synergistic interaction, negative values denote trade-off relationships, and zero values demonstrate statistical independence. Significant synergism occurs when p < 0.05 with r > 0, while significant trade-offs emerge when p < 0.05 with r < 0, as validated by Student’s t-test.

3. Results

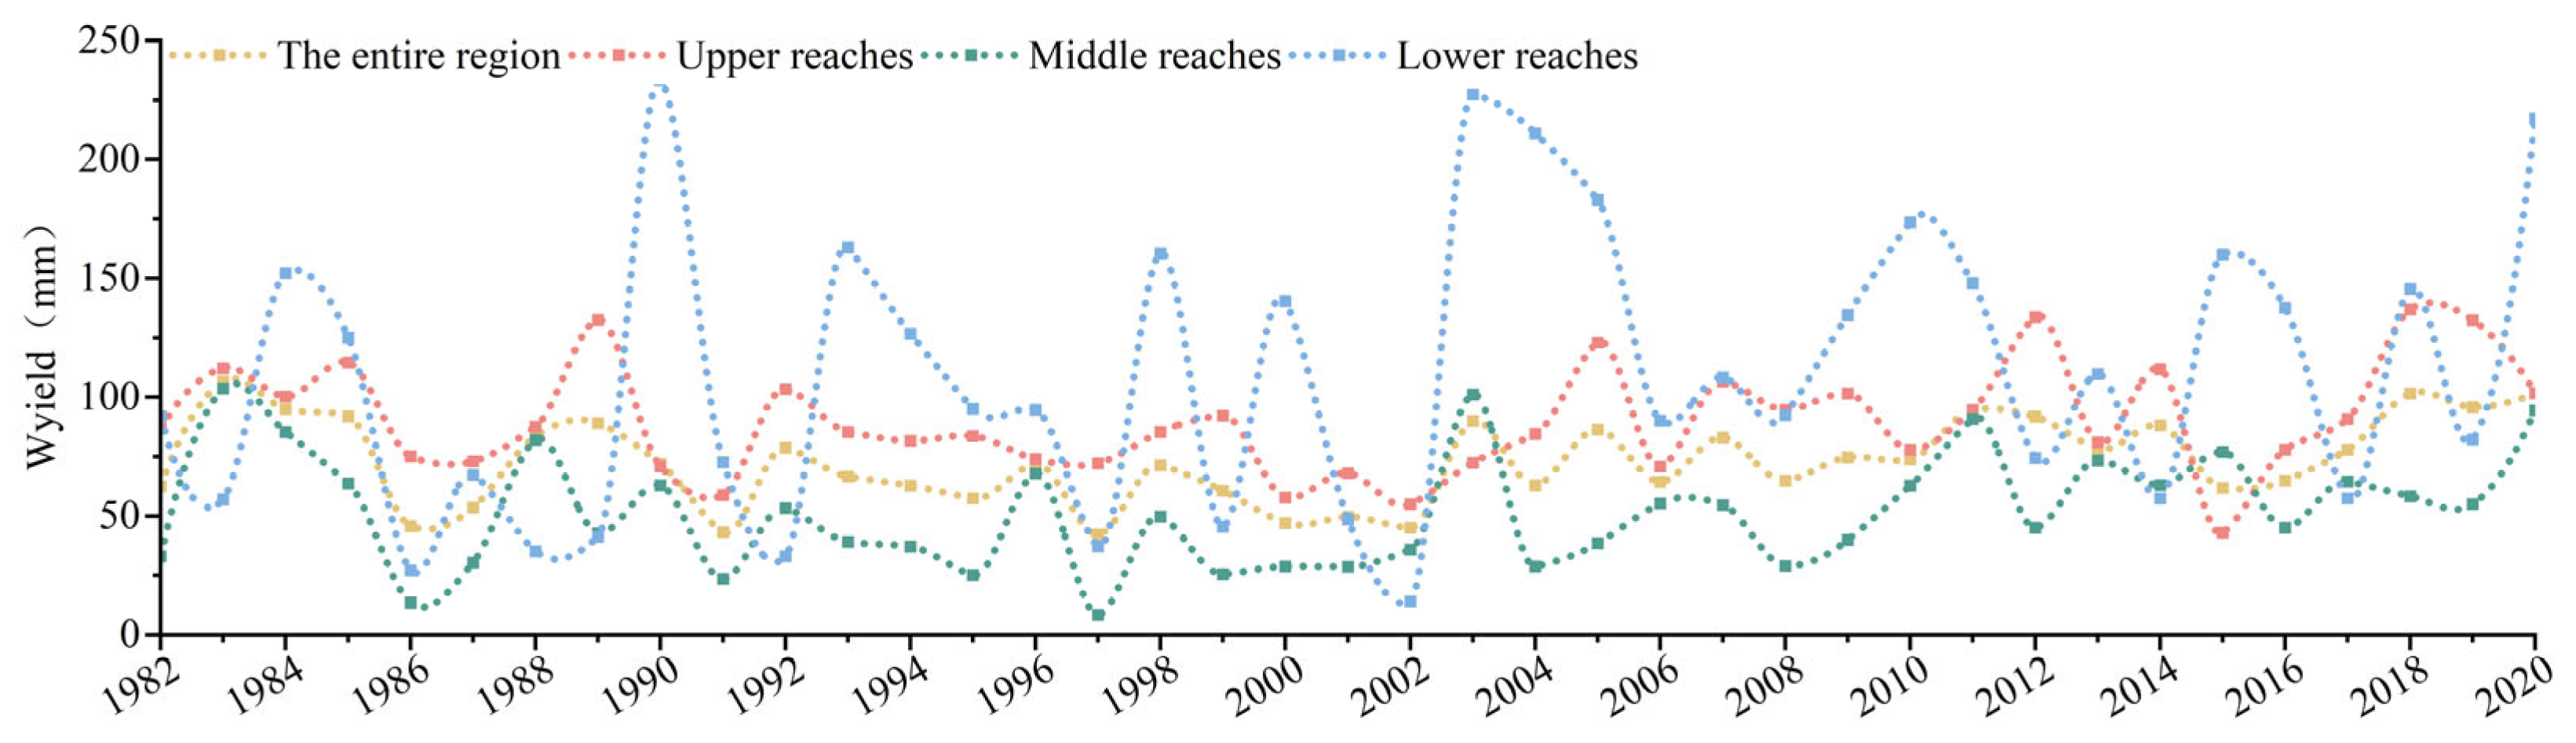
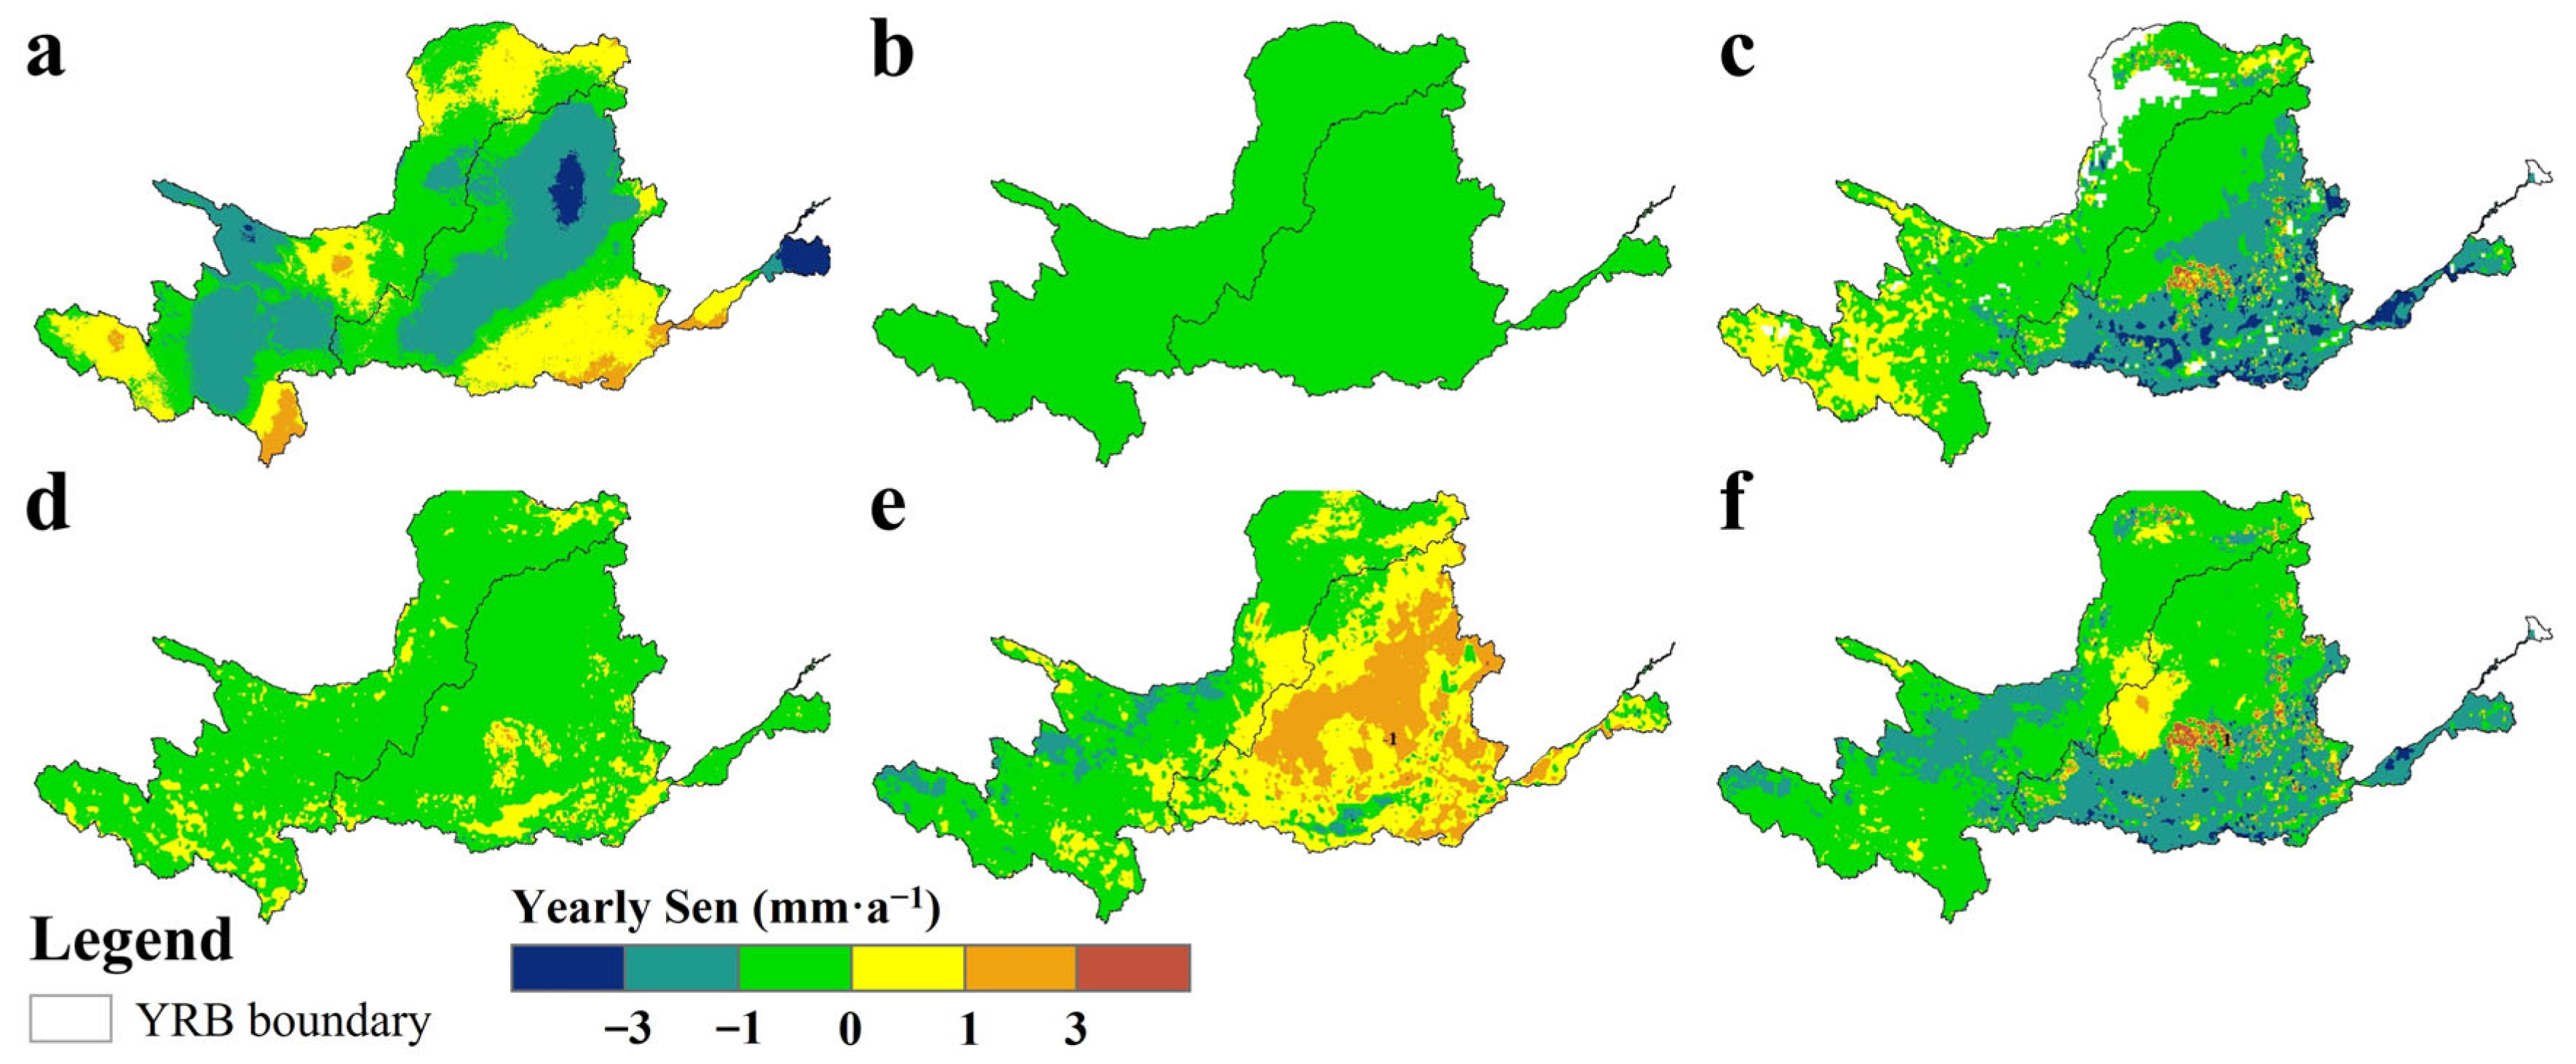
3.1. Spatiotemporal Dynamics of Wyield

The simulated Wyield for the YRB shows a mean error of less than 3.6% when validated against observed data [53]. A comparison with previous studies [54] further confirms that the simulation results satisfy the requirements of this research. As illustrated in Figure 2, the basin-wide annual Wyield during 1982–2020 ranged from 42.27 to 106.65 mm, with a multi-year average of 73.15 mm. The highest value occurred in 1983 and the lowest in 1997, showing a pronounced interannual variation characterized by an initial decline, followed by a gradual recovery. Decadal trends exhibited distinct patterns: the 1980s and 1990s followed an “M-shaped” trajectory, with a marked decrease in the 1980s and a slight increase in the 1990s. In the 2000s, Wyield demonstrated stable but gradually increasing fluctuations, while in the 2010s, an “N-shaped” increasing trend was observed. Subregional analysis further revealed spatial heterogeneity. In the upper reaches, the annual Wyield ranged from 42.99 to 136.94 mm (mean: 89.87 mm), with a peak in 2018 and a trough in 2015. The middle reaches showed greater variability (8.36–103.61 mm; mean: 51.72 mm), with the highest value in 1983 and the lowest in 1997. The lower reaches had the widest range (14.11–233.31 mm; mean: 109.53 mm), reaching a maximum in 1990 and a minimum in 2002. All three subregions exhibited an overall increasing trend in annual Wyield. The long-term mean Wyield followed the order lower > upper > middle, indicating higher Wyield efficiency in the downstream areas. In summary, both temporal and spatial dimensions exhibited pronounced heterogeneity in Wyield dynamics across the YRB.
Spatial analysis revealed pronounced heterogeneity in Wyield distribution across the YRB (Figure 3a). High-Wyield zones were concentrated in the southern upper reaches, while low-Wyield areas dominated the Loess Plateau of Longzhong and Hetao Plain. Subregional analysis showed that high-Wyield areas were confined to the southern upper reaches. Conversely, low-Wyield regions extensively covered the Loess Plateau of Longzhong and Hetao Plain. In the middle reaches, limited high-Wyield areas clustered in southern margins, contrasting with dominant low-Wyield zones across the Ordos Plateau and northern Shaanxi Loess Plateau. Lower reaches exhibited concentrated high-Wyield clusters in the Central Shandong Plain, with minimal low-Wyield coverage. Furthermore, spatial variations in Wyield changes demonstrated marked regional characteristics (Figure 3b): basin-wide increases averaged 0.36 mm·a−1, with extreme rates reaching +14.69 mm·a−1 and −14.95 mm·a−1, and 66.45% of the basin exhibited increasing trends, predominantly distributed across central-eastern regions. Areas with significant growth rates covered limited spatial extents, predominantly clustered in the East Kunlun Mountains, Huangnan Basin, Qilian Mountains, Loess Plateau of Longzhong, and Central Shandong Plain, whereas other regions displayed comparatively lower growth rates. The remaining 33.55% showed decreasing trends, primarily in source regions, Ruoergai Plateau, Liupan Mountains, and Hetao Plain, with the most rapid declines occurring in the Ruoergai and Ordos Plateaus.

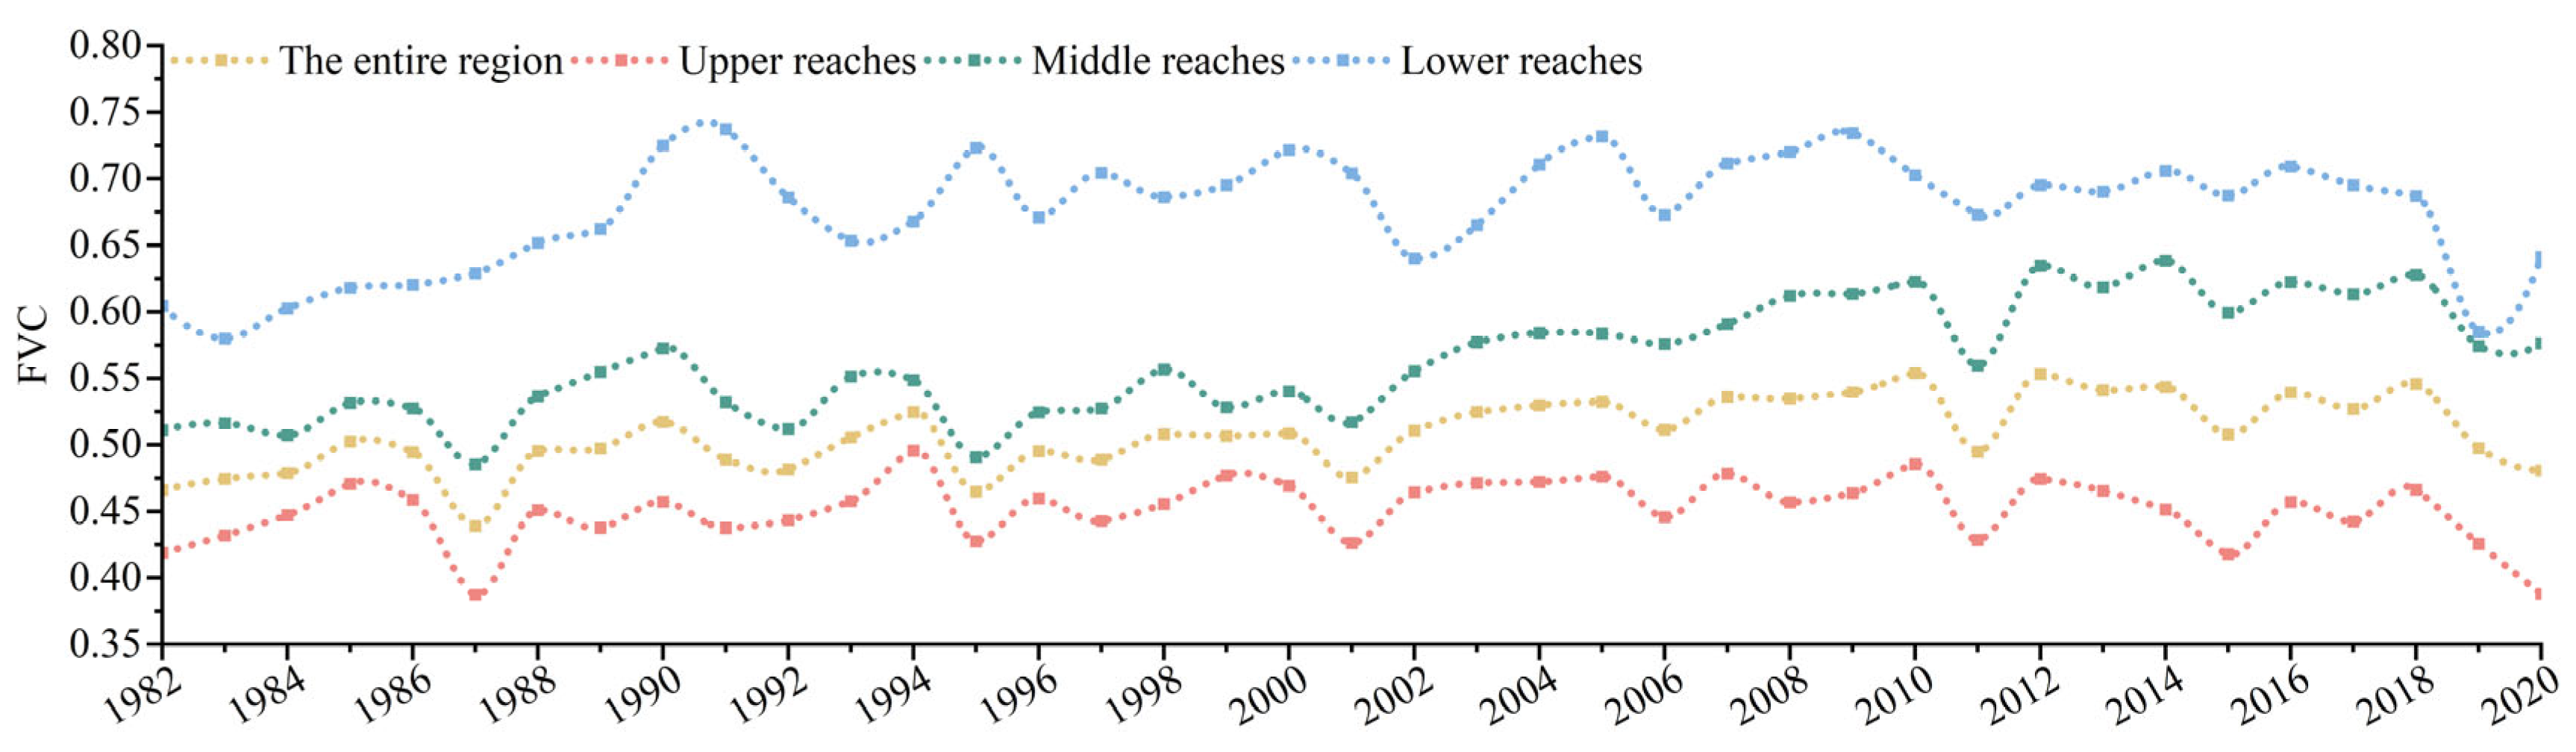
3.2. Spatiotemporal Dynamics of FVC

Fractional vegetation cover (FVC) in the YRB was quantified using the DPM. Temporal analysis (Figure 4) showed the multi-year mean FVC ranging from 0.44 to 0.55. The minimum values occurred in 1987, and the maximum values in 2010. The overall mean FVC was 0.51. Decadal means were 0.48 (1980s), 0.50 (1990s), 0.52 (2000s), and 0.53 (2010s). This reflects a sustained upward trend with 10.4% cumulative growth over 40 years. Phase-specific trends showed a fluctuating increase in the 1980s despite a significant decline in 1987, relative stability during the 1990s, sustained growth in the 2000s, and marginal decline with fluctuations in the 2010s. Partition statistics revealed that in the upper reaches, FVC ranged from 0.39 to 0.50—with the lowest value in 1987 and the highest in 1994—resulting in a multi-year mean of 0.45. In the middle reaches, FVC varied between 0.49 and 0.64 (mean: 0.56). The minimum values occurred in 1995, and the maximum values in 2014. In the lower reaches, FVC ranged from 0.58 to 0.74 (mean: 0.68). The lowest value was recorded in 1983, and the highest in 1991. Overall, the entire YRB showed an increasing trend. Although period-specific trends varied, all subregions exhibited similar upward trajectories.
Spatially, FVC in the YRB exhibited distinct regional patterns (Figure 5a). High-FVC zones dominated the Fenwei Plain and Shanxi Basin (middle reaches). Low-FVC areas were concentrated in the Loess Plateau and Hetao Plain (upper-middle reaches). The upper reaches show relatively low multi-year average FVC values. High-FVC areas occur predominantly in the southern High Mountain Areas of the Rivers, East Kunlun Mountains, and Ruoergai Plateau, whereas low-FVC areas dominate the Yellow River source region and Hetao Plain. In the middle reaches, FVC averages moderate levels. The Qinling Mountains and Fen-Wei Plain contain extensive high-FVC areas, contrasting with scattered low-FVC zones in the Ordos and northern Shaanxi Loess Plateaus. The lower reaches have a higher average FVC, with extensive high-FVC areas predominantly in the North China Plain, while limited low-FVC regions are concentrated in the central Shandong Plain. Spatial variation analysis (Figure 5b) reveals significant FVC changes across the basin: during the statistical period, the overall FVC showed an increasing trend at an average rate of 0.17 × 10⁻²·a−1, with maximum increase and decrease rates of 1.14 × 10⁻²·a−1 and −1.31 × 10⁻²·a−1, respectively. Trend analysis reveals that 68.7% of the basin experienced FVC increases, particularly in the upper reaches (Loess Plateau of Longzhong and Hetao Plain) and mid-lower reaches, with the fastest growth in northern Shaanxi’s Loess Plateau. Conversely, 31.26% of the area displayed a declining trend, mainly in the upper reaches, with rapid reductions observed in the Hetao Plain, Yellow River source region, East Kunlun Mountains, and Ruoergai Plateau.

3.3. Wyield–FVC Relationship Analysis

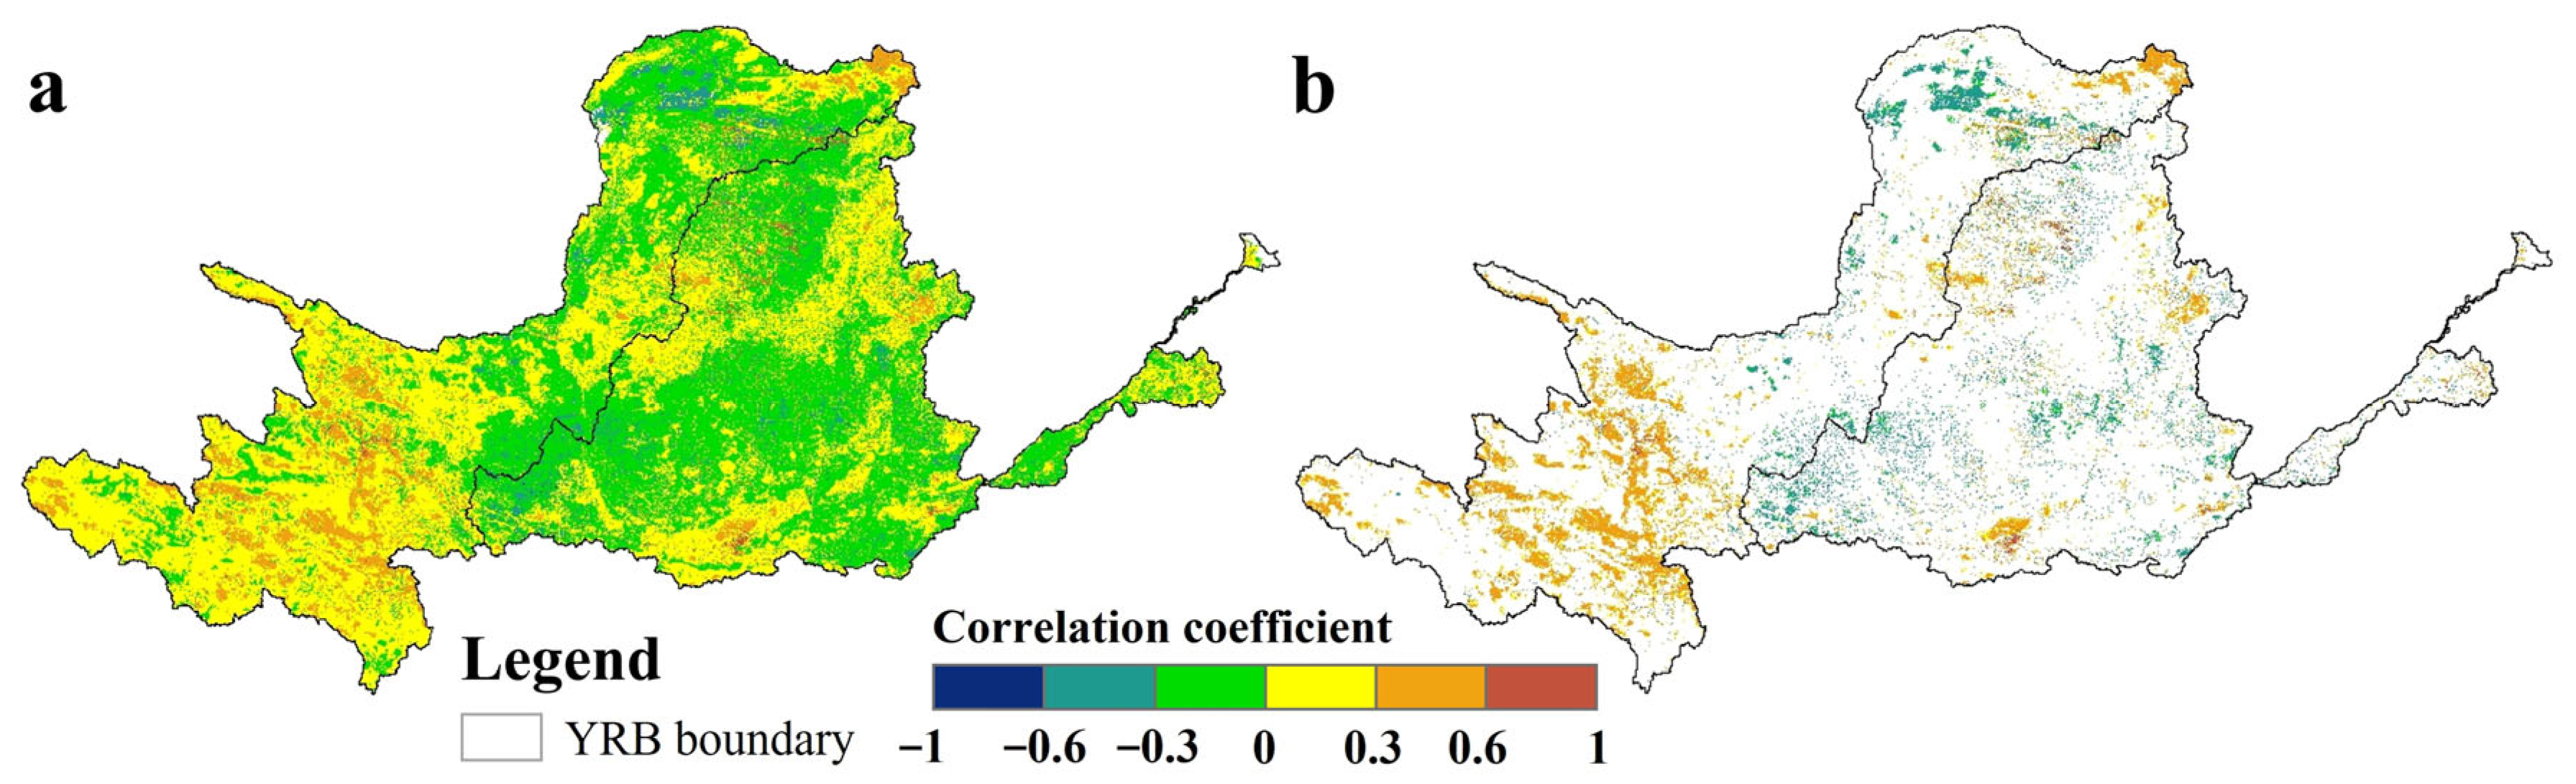
3.3.1. Partial Correlation Analysis

Vegetation dynamics and Wyield are co-regulated by climatic factors. Precipitation provides the primary water source for vegetation and directly contributes to Wyield. Temperature further modulates these processes through its effects on precipitation distribution and evapotranspiration. We used second-order partial correlation analysis to isolate the impacts of vegetation change on Wyield from climatic effects. Statistical significance was assessed using Student’s t-test. Figure 6 reveals predominantly non-significant relationships between FVC and Wyield, with only 15.6% of the basin showing statistically significant correlations (p < 0.05). Significant trade-off areas cover 10.35% of the basin. These areas are mainly located in the upper reaches (Hehuang Valley, East Kunlun Mountains, Huangnan Basin), middle reaches (Shanxi Basin, Fenwei Plain), and lower reaches (Central Shandong Plain). They include grassland, cropland, forestland, and unused land. Significant synergistic regions (5.26% coverage) are distributed in Hetao Plain and the Loess Plateau of Longzhong, dominated by grassland, cropland, and forestland.

3.3.2. Interaction Mechanism Analysis

Vegetation and Wyield exhibit bidirectional interactions. For example, forest ecosystems regulate Wyield via canopy interception, enhanced infiltration, and run-off attenuation, thereby altering spatiotemporal precipitation patterns. Conversely, Wyield reciprocally impacts vegetation dynamics by controlling plant-available water resources or inducing soil–vegetation system degradation through external perturbations. As shown in Figure 7, we analyzed environmental variables (precipitation (Pre) and temperature (Tem)) and hydrological processes—including vegetation transpiration (Tr), canopy interception (CI), soil evaporation (Ev), and actual evapotranspiration (AET)—during the statistical period. This systematic approach revealed ecohydrological mechanisms driving FVC–Wyield relationships in the YRB.
Trade-off areas are predominantly distributed in the southern upper reaches of the YRB, Shanxi Basin, Fenwei Plain, and Central Shandong Plain. The southern upper reaches feature high elevation, steep terrain, low mean annual Tem, elevated Pre, and high FVC, dominated by alpine meadow ecosystems. During the statistical period, this region exhibited increased Pre and warming alongside FVC decline. Reduced FVC decreased Tr while enhancing Ev, intensified Pre frequency and magnitude, and elevated CI and AET. However, low Tem and high humidity limited AET growth compared to Pre increases. Combined with grassland loss and weaker vertical precipitation regulation, reduced rainfall interception and water retention enhanced Wyield. These hydrological dynamics demonstrate a significant trade-off relationship between FVC and Wyield. The Shanxi Basin, characterized by low elevation, has relatively high Tem and annual Pre. The hydrothermal conditions are favorable, and the main vegetation coverage type is cropland. During the statistical period, the region experienced increased Pre and warming. Urban expansion reduced FVC, while irrigation improved water availability. Consequently, CI and Tr increased, Ev decreased, and AET rose. Excluding the influence of external water supply, the AET shows a relatively small increase, which is less than the Pre increment. As a result, the Wyield shows an increasing trend, forming a trade-off relationship between the decrease in FVC and the increase in Wyield. The Fenwei Plain and Central Shandong Plain have low elevation (<500 m), high Pre, warm climate, and intensive agriculture. Accelerated urbanization during the statistical period reduced FVC through cropland encroachment. Regional warming coupled with decreased annual Pre diminished CI capacity. Impervious surface expansion and FVC reduction collectively decreased Tr and Ev under natural hydrological regimes. This dynamic reduced AET while enhancing Wyield. Consequently, a trade-off relationship emerged between FVC decline and Wyield increase. However, external water supply to residual croplands elevated observed Tr, Ev, and AET beyond natural levels.
Synergistic regions are primarily distributed in the Hetao Plain of the upper reaches and the Loess Plateau in the middle reaches. The Hetao Plain, situated in mid-low elevation regions with low annual Pre, exhibits moderate Tem and FVC, dominated by cropland. During the statistical period, most regions experienced increases in Pre, Tem, and FVC, accompanied by enhanced Tr, CI, Ev, and AET. However, in arid zones, the limited Pre contributed less to AET increments than Pre gains, theoretically enhancing Wyield and establishing a synergistic relationship with FVC increases. Nevertheless, as a major irrigation district, cropland exhibited greater hydrological regulation effects, with irrigation contributing substantially to Tr and Ev, leading to observed increases in these parameters but reduced Wyield. The Loess Plateau demonstrates extensive synergistic areas with significant topographic relief and complex spatial heterogeneity in Pre and Tem patterns. This region features relatively low FVC, primarily comprising cropland, grassland, and forest ecosystems. Statistical analysis revealed concurrent increases in mean Tem, annual Pre, and FVC, which elevated CI and Tr while reducing Ev proportionally, thereby improving soil moisture retention. Consequently, despite increased AET, its increment remained smaller than Pre gains, resulting in enhanced Wyield and establishing a synergistic coupling between FVC augmentation and water production.

4. Discussion

4.1. Hydrological Spatiotemporal Characteristics of Trade-Off/Synergy Mechanisms

Based on the previously discussed correlation mechanisms, environmental and ecohydrological processes significantly influence the relationship between vegetation change and Wyield. Therefore, this study analyzes the meteorological and hydrological characteristics of trade-offs and synergies between vegetation change and Wyield. We include vegetation metrics, environmental attributes, and ecohydrological variables—FVC, aridity index (AI), Pre, Tr, CI, Ev, AET, and Wyield—as well as quantitative indices: the vegetation transpiration index (Tr/Pre), canopy interception index (CI/Pre), soil evaporation index (Ev/Pre), evaporation index (AET/Pre), and Wyield coefficient (Wyield/Pre).
Multi-year mean statistics (Figure 8, Table 2) indicate that the trade-off region has higher FVC and Pre than the synergistic region, while the AI is lower. The synergistic region exhibits higher Tr, Ev, and AET, along with their respective indices—vegetation transpiration index, soil evaporation index, and evapotranspiration index—compared to the trade-off region. In contrast, the trade-off region has greater CI, Wyield, and their corresponding indices—canopy interception index and Wyield coefficient—than the synergistic region. In summary, compared to the synergistic region, the trade-off region is relatively more humid, with higher Pre and FVC. It exhibits lower levels of Tr, Ev, and AET. In contrast, CI and Wyield are relatively higher. The efficiency of vegetation water use is lower.
Statistical results indicate that trade-off relationships between FVC and Wyield in the YRB are more prevalent in humid regions, while synergistic relationships are more common in drier areas. This finding contrasts with previous understanding and can be primarily explained by the following factors: Trade-off regions are typically located at higher elevations, with lower Tems, greater Pre, and more humid climates. These regions are dominated by grasslands with low biomass per unit area, leading to lower Tr. However, due to the dense and extensive grassland cover with strong CI, combined with frequent and seasonally uniform Pre—particularly in summer—CI and water storage are enhanced, leading to higher CI amounts. The CI index reflects the vegetation’s stronger regulatory capacity over precipitation in these regions, especially during drought years when vegetation more significantly reduces Wyield. The combined effects of low Tems and a humid climate suppress Ev, its index, and total AET, keeping them at relatively low levels. Furthermore, the combination of high elevation, low Tem, and low AET facilitates greater conversion of Pre into run-off. In addition, dominant soil types, such as alpine turf soil and black turf soil, have strong water retention, high moisture content, and are typically located on steep slopes—all of which promote surface run-off and contribute to higher Wyield and Wyield coefficients. In synergistic regions, land use mainly includes grasslands, croplands, and forests. These regions typically experience higher Tems and drier climates. Vegetation survival in these regions strongly depends on water availability—for example, croplands often rely on irrigation. Due to multiple influencing factors, Ev is high, which further reduces soil and groundwater recharge. After Pre, soil moisture in these regions evaporates rapidly, with limited plant uptake, resulting in higher Ev rates and a larger soil evaporation index. Furthermore, these areas receive low annual Pre, but it is highly seasonal, with over 60% falling during the summer months. Limited vegetation cover and frequent short-duration intense rainfall events often exceed the canopy’s interception capacity. As a result, CI is relatively low, leading to a lower interception index, with more Pre infiltrating the soil or directly becoming run-off.
In summary, the trade-off relationships between vegetation cover and Wyield in the YRB vary considerably across regions, primarily due to differences in natural background conditions. In regions with trade-off relationships, environmental conditions tend to be more humid and colder, leading to lower Tr, Ev, and AET. However, these regions show higher CI, enhanced Pre regulation by vegetation, and increased Wyield efficiency. In contrast, synergistic regions are generally drier, with lower levels of Pre and vegetation cover. These areas exhibit higher Tr, Ev, and total AET, along with greater relative contributions of each component. Consequently, the CI is lower.

4.2. Research Limitations and Prospects

This study integrates FVC and Wyield to examine interactions within the water–vegetation system of the YRB. Through analysis of environmental characteristics and ecohydrological processes, the study identifies environmental, hydrological, and vegetation traits in regions where FVC and Wyield are significantly correlated and further investigates the underlying mechanisms. However, limited data availability and mismatches in temporal and spatial scales hinder more detailed analysis at local levels. For example, although vegetation cover, Wyield, and soil moisture are closely linked, their integration is restricted by the spatial and temporal resolution of available data. CI is influenced by various vegetation characteristics—such as type, structure, density, stratification, coverage, and seasonal growth height—as well as by the intensity, frequency, and duration of precipitation. It is also affected by meteorological conditions, including wind speed, temperature, and humidity. However, the large spatial extent of the study area restricts the precise monitoring of long-term vegetation and climate dynamics. Moreover, empirical analysis of precipitation sub-processes is constrained by practical challenges. Consequently, accurately assessing ecohydrological processes at local scales remains difficult.
Moreover, the results indicate that 84.4% of the YRB shows no significant trade-off or synergy between FVC and Wyield, while only a small fraction exhibits significant correlations. This suggests a generally weak relationship between the two variables, largely due to two interrelated and complex factors. First, the study area covers a vast region with substantial heterogeneity in climate, hydrology, and surface conditions, including topography, elevation, soil, and vegetation. Various vegetation types, ages, structures, and densities demonstrate distinct vertical ecohydrological regulatory capacities and functions [55]. Moreover, differences in vegetation responses to greenhouse gas concentrations [56,57], combined with human activities and land-use changes—such as urbanization, agriculture expansion, ecological restoration, and water development—add further complexity. The heterogeneity and complex interactions among these factors hinder the formation of a significant linear relationship between FVC and Wyield across the basin. In addition, studies have shown that the relationship between forest cover and Wyield weakens with increasing watershed size due to scale effects [58]. Meanwhile, limited access to long-term data leads to accuracy differences and objective errors during the integration and resolution harmonization of heterogeneous datasets. These issues further complicate the assessment of trade-offs and synergies between FVC and Wyield in the YRB.
In summary, future research will emphasize improved field surveys, validation efforts, and experimental simulations to enhance data accessibility and applicability. In parallel, more refined analyses of ecohydrological processes will be conducted, such as examining the ecological impacts of precipitation event characteristics, including frequency, intensity, and duration. Vegetation growth models will be employed to simulate the development of different vegetation types under varying climatic conditions and to quantify the hydrological effects of processes like canopy interception and transpiration. Based on this, regional hydrological characteristics and ecological demands should be fully considered to identify critical thresholds for trade-offs and synergies. This aims to balance vegetation restoration with the sustainable use of water resources and to provide scientific guidance for water-adapted vegetation restoration and the sustainable development of water and ecosystems in arid regions.

5. Conclusions

This study used the InVEST model to simulate the annual Wyield in the YRB from 1982 to 2020. FVC was estimated using the pixel dichotomy model. Spatiotemporal trends of both variables were analyzed using the Theil–Sen slope estimator and the Mann–Kendall test. A second-order partial correlation analysis was performed to investigate the relationship between vegetation cover and Wyield. The main findings are summarized as follows: (1) During the statistical period, the multi-year average annual Wyield in the YRB ranged from 42.27 to 106.65 mm. The overall average was 73.15 mm. The annual Wyield showed a clear fluctuation trend, with an initial decline followed by an increase. The downstream region had the highest multi-year average Wyield, while the middle reaches had the lowest. Distinct interannual variation patterns were observed across the upper, middle, and lower sub-basins. Wyield distribution exhibited significant spatial heterogeneity and temporal variation across the basin. High Wyield values were mainly concentrated in the southern upper reaches. Low Wyield values were broadly distributed in the Loess Plateau of Longzhong and Hetao Plain of the upper basin. Overall, Wyield in the basin showed an increasing trend, with an average growth rate of 0.36 mm·a−1. (2) During the statistical period, the multi-year average annual FVC in the YRB ranged from 0.44 to 0.55. The overall multi-year average FVC was 0.51. The annual FVC across the basin showed a significant upward trend. The downstream region had the highest multi-year average FVC, while the upper reaches had the lowest. All three sub-basins exhibited similar increasing trends in annual FVC. The FVC distribution across the basin showed distinct spatial heterogeneity and temporal variability. High FVC values were primarily concentrated in the Fenwei Plain and Shanxi Basin. Low FVC values were mainly found in the Loess Plateau, Ordos Plateau, and Hetao Plain. Overall, basin-wide FVC increased at an average rate of 0.17 × 10⁻² a−1. (3) Correlation analysis showed that 15.61% of the basin had significant correlations between vegetation cover and Wyield after accounting for temperature and precipitation. Trade-off relationships represented 10.35% of the correlated areas, mainly in the southern upper reaches of the basin. Synergistic areas made up 5.26% of the correlated regions, primarily found in the Hetao Plain and the Loess Plateau of Longzhong, where land-use types are predominantly grassland and cropland. Mechanistic analysis revealed marked spatiotemporal heterogeneity in the relationships between vegetation cover and Wyield across the basin. These relationships were influenced by multiple factors, including natural drivers and human activities.
The analysis of hydrological and environmental conditions in significant trade-off/synergy regions enhances the mechanistic understanding of their formation processes. This approach holds critical importance for advancing water resource management, maintaining ecosystem functional integrity, improving regional eco-environmental quality, and ensuring ecological security. It further demonstrates multidimensional significance in reconciling economic development with ecological conservation, facilitating regional smart growth, and promoting sustainable socioeconomic development.

Author Contributions

Conceptualization, Z.G. and X.J.; Methodology, Z.G.; Software, Z.G.; Validation, Z.G.; Formal Analysis, Z.G.; Investigation, Z.G. and X.J.; Resources, Z.G.; Data Curation, Z.G.; Writing—Original Draft Preparation, Z.G.; Writing—Review and Editing, Z.G.; Visualization, Z.G.; Supervision, X.J.; Project Administration, X.J.; Funding Acquisition, X.J. All authors have read and agreed to the published version of the manuscript.

Funding

This research was funded by the National Natural Science Foundation of China grant number [42404102].

Data Availability Statement

The data presented in this study are available on request from the corresponding author.

Conflicts of Interest

The authors declare no conflicts of interest.

Abbreviations

Wyieldwater yield
FVCfractional vegetation cover
YRBYellow River Basin
GGPGrain-for-Green Program
Temtemperature
Preprecipitation
PETpotential evapotranspiration
DEMDigital Elevation Model
LUCland use/cover
NDVINormalized Difference Vegetation Index
Trvegetation transpiration
CIcanopy interception
Evsoil evaporation
AETactual evapotranspiration
DPMDimidiate Pixel Model
AIaridity index

References

  1. Ma, S.; Qiao, Y.P.; Wang, L.J.; Zhang, J.C. Terrain gradient variations in ecosystem services of different vegetation types in mountainous regions: Vegetation resource conservation and sustainable development. For. Ecol. Manag. 2021, 482, 118856. [Google Scholar] [CrossRef]
  2. Benayas, J.M.R.; Newton, A.C.; Diaz, A.; Bullock, J.M. Enhancement of biodiversity and ecosystem services by ecological restoration: A meta-analysis. Science 2009, 325, 1121–1124. [Google Scholar] [CrossRef]
  3. Baer, S.G.; Bach, E.M.; Meyer, C.K.; Preez, C.C.D.; Six, J. Belowground ecosystem recovery during grassland restoration: South African Highveld compared to US tallgrass prairie. Ecosystems 2015, 18, 390–403. [Google Scholar] [CrossRef]
  4. Brasil, I.D.S.; Corte, A.P.D.; Moura, M.M.; Nakajima, N.Y.; Sanquetta, C.R.; Rex, F.E.; Mallmann, A.A. Contributions of forest regeneration after intense fragmentation in the Amazon through morphological spatial pattern analysis. For. Sci. 2022, 68, 508–520. [Google Scholar] [CrossRef]
  5. Wen, X.; Théau, J. Spatiotemporal analysis of water-related ecosystem services under ecological restoration scenarios: A case study in northern Shaanxi, China. Sci. Total Environ. 2020, 720, 137477. [Google Scholar] [CrossRef] [PubMed]
  6. National Forestry and Grassland Administration. 2022 China National Afforestation and Greening Bulletin. Land Greening; National Forestry and Grassland Administration: Beijing, China, 2023; Volume 3, pp. 6–11. [Google Scholar]
  7. Wu, X.T.; Wang, S.; Fu, B.J.; Feng, X.M.; Chen, Y.Z. Socio-ecological changes on the Loess Plateau of China after Grain to Green Program. Sci. Total Environ. 2019, 678, 565–573. [Google Scholar] [CrossRef]
  8. Li, X.; Zulkar, H.; Wang, D.; Zhao, T.; Xu, W. Changes in Vegetation Coverage and Migration Characteristics of Center of Gravity in the Arid Desert Region of Northwest China in 30 Recent Years. Land 2022, 11, 1688. [Google Scholar] [CrossRef]
  9. Yan, Y.F.; Bai, Q.; Sun, H.; Wang, N.; Lao, X.R. Spatiotemporal characteristics of vegetation change and water yield services in the Yellow River Basin. J. Soil Water Conserv. 2024, 38, 130–139. [Google Scholar] [CrossRef]
  10. Costanza, R.; D’Arge, R.; Groot, R.; Farber, S.; Grasso, M.; Hannon, B.; Limburg, K.; Naeem, S.; O’Neill, R.; Paruelo, J.; et al. The value of the world’s ecosystem services and natural capital. Nature 1997, 387, 253–260. [Google Scholar] [CrossRef]
  11. Sharma, A.; Goyal, M.K. Assessment of ecosystem resilience to hydroclimatic disturbances in India. Glob. Change Biol. 2018, 24, e432–e441. [Google Scholar] [CrossRef]
  12. Sun, S.L.; Liu, Y.B.; Chen, H.S.; Ju, W.M.; Xu, C.Y.; Liu, Y.; Zhou, B.T.; Zhou, Y.; Zhou, Y.L.; Yu, M. Causes for the increases in both evapotranspiration and water yield over vegetated mainland China during the last two decades. Agric. For. Meteorol. 2022, 324, 109118. [Google Scholar] [CrossRef]
  13. Ellison, D.; Futter, M.N.; Bishop, K. On the forest cover–water yield debate: From demand- to supply-side thinking. Glob. Change Biol. 2012, 18, 806–820. [Google Scholar] [CrossRef]
  14. Zhang, B.Q.; Tian, L.; Zhao, X.N.; Wu, P.T. Feedback effects of vegetation restoration on local precipitation in the Loess Plateau. Sci. China Earth Sci. 2021, 51, 1080–1091. [Google Scholar]
  15. Canadell, J.G.; Pataki, D.E.; Pitelka, L.F. Terrestrial Ecosystems in a Changing World; Springer: Berlin/Heidelberg, Germany, 2007. [Google Scholar]
  16. Salemi, L.F.; Groppo, J.; Trevisan, R.; de Moraes, J.; Lima, W.; Martinelli, L. Riparian vegetation and water yield: A synthesis. J. Hydrol. 2012, 454–455, 195–202. [Google Scholar] [CrossRef]
  17. Zhang, Y.; Hao, L. Direct and Indirect Effects of Large-Scale Forest Restoration on Water Yield in China’s Large River Basins. Remote Sens. 2025, 17, 1581. [Google Scholar] [CrossRef]
  18. Feng, X.M.; Fu, B.J.; Piao, S.L.; Wang, S.; Ciais, P.; Zeng, Z.Z.; Lü, Y.H.; Zeng, Y.; Li, Y.; Jiang, X.H.; et al. Revegetation in China’s Loess Plateau is approaching sustainable water resource limits. Nat. Clim. Change 2016, 6, 1019–1022. [Google Scholar] [CrossRef]
  19. Zhou, G.Y.; Wei, X.H.; Chen, X.Z.; Zhou, P.; Liu, X.D.; Xiao, Y.; Sun, G.; Scott, D.F.; Zhou, S.D.; Han, L.S.; et al. Global pattern for the effect of climate and land cover on water yield. Sci. Found. China 2015, 23, 40. [Google Scholar] [CrossRef]
  20. Yosef, G.; Walko, R.; Avisar, R.; Tatarinov, F.; Rotenberg, E.; Yakir, D. Large-scale semi-arid afforestation can enhance precipitation and carbon sequestration potential. Sci. Rep. 2018, 8, 996. [Google Scholar] [CrossRef]
  21. Jackson, R.B.; Jobbágy, E.G.; Avissar, R.; Roy, S.B.; Barrett, D.J.; Cook, C.W.; Farley, K.A.; Lemaitre, D.C.; McCarl, B.A.; Murray, B.C. Trading water for carbon with biological carbon sequestration. Science 2005, 310, 1944–1947. [Google Scholar] [CrossRef]
  22. Ugbaje, S.U.; Bishop, T.F.A. Hydrological Control of Vegetation Greenness Dynamics in Africa: A Multi-variate Analysis Using Satellite Observed Soil Moisture, Terrestrial Water Storage and Precipitation. Land 2020, 9, 15. [Google Scholar] [CrossRef]
  23. Li, Z.K.; Li, X.Y.; Zhou, S.; Yang, X.F.; Fu, Y.S.; Miao, C.Y.; Wang, S.; Zhang, G.H.; Wu, X.C.; Yang, C.; et al. Research progress on soil-vegetation-hydrology coupling processes and mechanisms. Sci. China Earth Sci. 2022, 52, 2105–2138. [Google Scholar] [CrossRef]
  24. Weligamage, H.G.; Fowler, K.; Ryu, D.; Saft, M.; Peterson, T.; Peel, M.C. Vegetation as a driver of shifts in rainfall-runoff relationship: Synthesising hydrological evidence with remote sensing. J. Hydrol. 2025, 648, 132389. [Google Scholar] [CrossRef]
  25. Deng, Z.; Lan, H.; Li, L.; Sun, W. Vegetation-induced modifications in hydrological processes and the consequential dynamic effects of slope stability. CATENA 2025, 251, 108793. [Google Scholar] [CrossRef]
  26. Zhang, Y.W.; Zhang, B.; Yao, R.P.; Wang, L.B. Spatiotemporal changes of fractional vegetation cover and water yield in the Wei River Basin from 2000 to 2020. J. Desert Res. 2022, 42, 223–233. [Google Scholar]
  27. Gong, J.Y.; Ma, Z.Y.; Hu, C.; He, L.X.; Lei, J.P. Study on the constraint effect of vegetation on ecosystem services in the Yellow River Basin. Forests 2024, 15, 1771. [Google Scholar] [CrossRef]
  28. Gao, F.; Pan, J.Y.; Gong, Z.J. Detection of spatial and temporal variation characteristics of vegetation cover in the Lower Mekong Region and the influencing factors. Sci. Rep. 2024, 14, 78306. [Google Scholar] [CrossRef]
  29. Li, X.H.; Liu, Y.T.; Wang, L. Change in fractional vegetation cover and its prediction during the growing season based on machine learning in Southwest China. Remote Sens. 2024, 16, 3623. [Google Scholar] [CrossRef]
  30. Hou, X.L.; Shi, M.W.; Zhao, J.G.; Meng, L.Y.; Zhang, Y.; Zhang, R.Z.; Yang, H.; Cao, J.S. The impact of major ecological projects on the water yield of mountain basins, northern China. Water 2024, 16, 2900. [Google Scholar] [CrossRef]
  31. Liu, W.; Tian, H.; Xu, X.G.; Yang, G. Evaluation of water supply function in the Economic Belt of the Northern Slope of the Tianshan Mountains based on the InVEST model. Clim. Serv. 2024, 36, 100519. [Google Scholar] [CrossRef]
  32. Xu, C.L.; Chen, X.; Yu, Q.; Avirmed, B.; Zhao, J.K.; Liu, W.; Sun, W.J. Relationship between ecological spatial network and vegetation carbon use efficiency in the Yellow River Basin, China. GISci. Remote Sens. 2024, 61, 2318070. [Google Scholar] [CrossRef]
  33. Zhao, G.L.; Tian, S.M.; Liang, S.; Jing, Y.C.; Chen, R.X.; Wang, W.W.; Han, B. Dynamic evolution trend and driving mechanisms of water conservation in the Yellow River Basin. China. Sci. Rep. 2024, 14, 78241. [Google Scholar] [CrossRef] [PubMed]
  34. Li, J.X.; Liu, X.P.; Wei, L.; Li, X.Y.; Gao, H.Y.; Chen, R.; Cui, Y.F. Investigation of the interactions and influencing factors of the Water-Land-Energy-Carbon system in the Yellow River Basin. Sci. Total Environ. 2024, 954, 176654. [Google Scholar] [CrossRef]
  35. Yang, H.M.; Wang, Y.; Peng, B.B.; Zhang, X.P.; Zou, H.Y. Re-examining virtual water transfer in the Yellow River Basin, China. J. Hydrol. Reg. Stud. 2024, 56, 101971. [Google Scholar] [CrossRef]
  36. Yang, R.; Xu, H. Does agricultural water-saving policy improve food security? Evidence from the Yellow River Basin in China. Water Policy 2023, 25, 253–268. [Google Scholar] [CrossRef]
  37. Han, Z.Y.; Wu, Q.; Lai, R.X.; Soomro, S.S.E.; Hou, D.R.; Hu, C.H. Spatio-temporal variations of vegetation cover and its influence on surface air temperature change over the Yellow River Basin, China. J. Water Clim. Change 2022, 13, 3239–3252. [Google Scholar] [CrossRef]
  38. Wang, L.L.; Wei, H.K. Progress and effectiveness evaluation of China’s western development strategy. Financ. Trade Econ. 2003, 10, 5–12. [Google Scholar] [CrossRef]
  39. Pang, J.Z.; Xu, H.; Zhang, Q.; Zhang, Y.F.; Zhang, Z.Q. Stand characteristics regulate forest water use efficiency in the Three-North Shelterbelt Forest Program region of China. Environ. Res. Lett. 2024, 19, 114028. [Google Scholar] [CrossRef]
  40. Wang, R.N.; Xiao, Y.; Huang, H.; Chang, M. Exploring the complex relationship between industrial upgrading and energy eco-efficiency in river basin cities: A case study of the Yellow River Basin in China. Energy 2024, 312, 133498. [Google Scholar] [CrossRef]
  41. Peng, D.L.; Zhang, B.; Wu, C.Y.; Huete, A.; Gonsamo, A.; Lei, L.P.; Ponce-Campos, G.; Liu, X.J.; Wu, Y.H. Country-level net primary production distribution and response to drought and land cover change. Sci. Total Environ. 2017, 574, 65–77. [Google Scholar] [CrossRef]
  42. Yu, J.R.; Xiao, R.; Liang, M.Z.; Wang, Y.P.; Wang, S. Hydrological drought assessment of the Yellow River Basin based on non-stationary model. J. Hydrol. Reg. Stud. 2024, 56, 101974. [Google Scholar] [CrossRef]
  43. Yan, J.X.; Yao, X.D.; Li, Q.; Song, M.; Li, J.; Li, G.; Qi, G.P.; Qiao, H.; Gao, P.C.; Zhang, M.H. Ecological risk assessment and influencing factor analysis of the Yellow River basin based on LUCC and boosted regression tree. Front. Environ. Sci. 2024, 12, 1465475. [Google Scholar] [CrossRef]
  44. Nelson, E.; Mendoza, G.; Regetz, J.; Polasky, S.; Tallis, H.; Cameron, D.R.; Chan, K.M.; Daily, G.C.; Goldstein, J.; Kareiva, P.M. Modeling multiple ecosystem services, biodiversity conservation, commodity production, and tradeoffs at landscape scales. Front. Ecol. Environ. 2009, 7, 4–11. [Google Scholar] [CrossRef]
  45. Fuh, B.P. On the calculation of the evaporation from land surface. Chin. J. Atmos. Sci. 1981, 5, 23–31. [Google Scholar]
  46. Zhang, L. A rational function approach for estimating mean annual evapotranspiration. Water Resour. Res. 2004, 40, W02502. [Google Scholar] [CrossRef]
  47. Donohue, R.J.; Roderick, M.L.; McVicar, T.R. Roots, storms, and soil pores: Incorporating key ecohydrological processes into Budyko’s hydrological model. J. Hydrol. 2012, 436–437, 35–50. [Google Scholar] [CrossRef]
  48. Gutman, G.; Ignatov, A. The derivation of the green vegetation fraction from NOAA/AVHRR data for use in numerical weather prediction models. Int. J. Remote Sens. 1998, 19, 1533–1543. [Google Scholar] [CrossRef]
  49. Mu, X.H.; Yang, Y.; Xu, H.; Guo, Y.H.; Lai, Y.K.; McVicar, T.R.; Xie, D.H.; Yan, G.J. Improvement of NDVI mixture model for fractional vegetation cover estimation with consideration of shaded vegetation and soil components. Remote Sens. Environ. 2024, 314, 114409. [Google Scholar] [CrossRef]
  50. Theil, H. A Rank-Invariant Method of Linear and Polynomial Regression Analysis. In Henri Theil’s Contributions to Economics and Econometrics; Raj, B., Koerts, J., Eds.; Springer: Dordrecht, The Netherlands, 1992; Volume 53, pp. 345–381. [Google Scholar] [CrossRef]
  51. Sen, P. Estimates of the regression coefficient based on Kendall’s tau. J. Am. Stat. Assoc. 1968, 63, 1379–1389. [Google Scholar] [CrossRef]
  52. Zhang, L.W.; Fu, B.J.; Lü, Y.H.; Dong, Z.B.; Li, Y.J.; Zeng, Y.; Wu, B.F. Evaluation of ecosystem service protection effectiveness in China based on a comprehensive index method. Acta Geogr. Sin. 2016, 71, 768–780. [Google Scholar]
  53. Yellow River Conservancy Commission. Yellow River Basin Water Resources Bulletin; Yellow River Conservancy Commission of the Ministry of Water Resources: Zhengzhou, China, 1998–2020.
  54. Yang, J.; Xie, B.P.; Zhang, D.G.; Tao, W.Q. Climate and land use change impacts on water yield ecosystem service in the Yellow River Basin, China. Environ. Earth Sci. 2021, 80, 72. [Google Scholar] [CrossRef]
  55. Quetin, G.R.; Swann, A.L.S. Empirically derived sensitivity of vegetation to climate across global gradients of temperature and precipitation. J. Clim. 2017, 30, 5835–5849. [Google Scholar] [CrossRef]
  56. Yang, H.; Xu, H.; Huntingford, C.; Ciais, P.; Piao, S.L. Strong direct and indirect influences of climate change on water yield confirmed by the Budyko framework. Geogr. Sustain. 2021, 2, 281–287. [Google Scholar] [CrossRef]
  57. Doherty, R.; Sitch, S.; Smith, B.; Lewis, S.; Thornton, P. Implications of future climate and atmospheric CO2 content for regional biogeochemistry, biogeography and ecosystem services across East Africa. Glob. Change Biol. 2010, 16, 617–640. [Google Scholar] [CrossRef]
  58. Liu, Y.H.; Leng, X.; Deng, Z.F.; Wang, L.X.; Zhang, L.; Liu, S.R.; An, S.Q. Effects of watershed vegetation on tributary water yields during the wet season in the Heishui Valley, China. Water Resour. Manag. 2010, 25, 1449–1465. [Google Scholar] [CrossRef]
Figure 1. Location (a), topography (b), and land use distribution map (c) of the YRB.
Land 14 01396 g001
Figure 2. Interannual variations of Wyield across basin-wide and subregional scales in the YRB during 1982–2020.
Land 14 01396 g002
Figure 3. Spatial distribution of multi-year mean annual Wyield (a) and its variation trend (b) in the YRB.
Land 14 01396 g003
Figure 4. Interannual variations of FVC across basin-wide and subregional scales in the YRB during 1982–2020.
Land 14 01396 g004
Figure 5. Spatial distribution of multi-year mean annual FVC (a) and its variation trend (b) in the YRB.
Land 14 01396 g005
Figure 6. Spatial distribution of multi-year partial correlation coefficients between FVC and Wyield in the YRB (a): correlation coefficients; (b): statistically significant regions with p < 0.05).
Land 14 01396 g006
Figure 7. Trend of key factors in the YRB over the years (a) Pre; (b) Tem; (c) Tr; (d) CI; (e) Ev (f) AET.
Land 14 01396 g007
Figure 8. Hydrological partitioning indices (a) synergistic regions; (b) trade-off regions.
Land 14 01396 g008
Table 1. List of the data used in the present study.
NameSpatial ResolutionPeriodFormatData Resource
Tem1000 m1982–2020NetCDFNational Plateau Scientific Data Center (https://data.tpdc.ac.cn/ (accessed on 10 December 2022))
Pre
PET
Bedrock Depth250 m2017RasterISRIC Data Centre (https://data.isric.org/ (accessed on 16 December 2022))
Soil Texture1000 m2022FAO Data Center (https://www.fao.org/ (accessed on 13 December 2022))
DEM30 m2020Geospatial Data Cloud (http://www.gscloud.cn (accessed on 1 December 2022))
LUC1000 m1982–2020Chinese Acadeny of Scenoe Discipline Data Center for Ecosystem (https://www.nesdc.org.cn/ (accessed on 19 November 2022))
YRB Boundary--VectorNational Cryosphere Desert Data Center (https://www.ncdc.ac.cn/ (accessed on 17 November 2022))
NDVI5000 m1982–2020RasterNational Earth Science Data Center (https://www.geodata.cn/ (accessed on 21 December 2022))
Tr1000 mNetCDFNational Plateau Scientific Data Center (https://data.tpdc.ac.cn/ (accessed on 13 January 2023))
CI
Ev
AET
Water Resource Volume--Statistical DataYellow River Conservancy Commission of the Ministry of Water Resources (http://www.yrcc.gov.cn/ (accessed on 9 December 2022))
Table 2. Mean values of environmental variables and ecohydrological parameters.
FVCAIPre (mm)Tr (mm)CI (mm)Ev (mm)AET (mm)Wyield (mm)
Synergistic regions0.47 3.04 453.07 159.59 23.93 228.09 411.60 41.47
Trade-off regions0.56 1.92 489.17 135.81 34.42 195.19 365.42 123.75
Disclaimer/Publisher’s Note: The statements, opinions and data contained in all publications are solely those of the individual author(s) and contributor(s) and not of MDPI and/or the editor(s). MDPI and/or the editor(s) disclaim responsibility for any injury to people or property resulting from any ideas, methods, instructions or products referred to in the content.

