Article

Heterogeneous Changes and Evolutionary Characteristics of Cultivated Land Fragmentation in Mountainous Counties and Townships in Southwest China: A Case Study of Beichuan Qiang Autonomous County

1
School of Environment and Resource, Southwest University of Science and Technology, Mianyang 621010, China
2
College of Chemistry and Environmental Engineering, Xinjiang Institute of Engineering, Urumqi 830023, China
3
College of Earth and Environmental Sciences, Lanzhou University, Lanzhou 730000, China
*
Author to whom correspondence should be addressed.
Land 2025, 14(7), 1395; https://doi.org/10.3390/land14071395
Submission received: 29 May 2025 / Revised: 27 June 2025 / Accepted: 30 June 2025 / Published: 3 July 2025
(This article belongs to the Special Issue Coupled Man-Land Relationship for Regional Sustainability)

Abstract

As a core element of comprehensive land consolidation, cultivated land serves as both a fundamental resource and strategic platform for driving rural revitalization and advancing ecological civilization development. Based on the five periods of remote sensing monitoring data of land use from the 1980 to 2020 in Beichuan Qiang Autonomous County, this study systematically examines cultivated land transfer dynamics and quantitatively assesses fragmentation levels through landscape metrics analysis, with the ultimate objective of informing strategic land consolidation planning at the county scale. The results indicate that (1) the cultivated land transformation in Beichuan Qiang Autonomous County exhibited distinct temporal patterns demarcated by 2010. During the initial phase, limited land transfers predominantly involved woodland transfers, characterized by cross-regional occupation–compensation dynamics and a northwest-oriented spatial shift. The subsequent phase witnessed substantial transfer intensification, incorporating grassland and construction land transfers alongside woodland. This period demonstrated balanced intra-township occupation–compensation mechanisms and a marked southeastward migration of transfer concentration; (2) cultivated land transfer dynamics demonstrated greater intensity in topographically moderate townships, whereas northwestern mountainous townships characterized by elevated altitudes and pronounced gradients maintained comparative spatial stability in transfer patterns; (3) cultivated land fragmentation exhibited topographic modulation, with reduced spatial disaggregation in low-lying plains contrasting elevated indices across northwestern highland terrains; and (4) the cultivated land area showed a predominant reduction in low-elevation and gentle-slope regions, accompanied by a decrease in landscape fragmentation. Conversely, in areas with higher elevations and steeper slopes, expansions in both cultivated land area and fragmentation were observed.

1. Introduction

As the largest carbon pool on earth, terrestrial ecosystems play a crucial role in global carbon cycling and climate change, and cultivated land, as one of the key land-use types, influences production quality through changes in carbon storage, thereby affecting the carbon sources and sinks of ecosystems [1,2,3]. Effective protection and utilization of cultivated land will significantly enhance carbon sequestration, contributing to the global goals of “carbon peak” and “carbon neutrality [4]. The accelerated urbanization has channeled diverse resources and the workforce toward cities, creating significant obstacles for rural land resource development and utilization. Widespread cultivated land desertion substantially undermines its productive use, obstructing both rural revitalization efforts and ecological civilization advancement [5].
In December 2024, the General Office of the Ministry of Natural Resources of the People’s Republic of China (MNR) promulgated the Technical Guidelines for Comprehensive Land Consolidation (Trial) (herein referred to as the “Guidelines”), establishing a standardized framework for the systematic implementation of national land consolidation initiatives. Central to these guidelines is a territorial spatial planning-based approach, employing county-level coordination and township-level implementation to conduct cultivated land consolidation, construction land remediation, ecological protection and restoration, and specialized improvements, thereby advancing rural revitalization. Since 2019, the Ministry of Natural Resources has implemented nationwide pilot projects for comprehensive land consolidation. As of late 2023, these 1304 pilot initiatives had achieved a cumulative consolidation area of 3.78 million mu, resulting in an additional 470,000 mu of cultivated land. As the fundamental basis for grain production, cultivated land faces critical challenges including fragmentation, disorganized spatial patterns, inefficient utilization, and deteriorating ecological conditions in rural areas, all significantly compromising both the quantity and quality of cultivated land resources, and significant regional disparities exist in cultivated land quantity changes [6], with potential land-use transfers posing risks to grain production [7]. Moreover, significant spatial heterogeneity exists in land fragmentation levels, with the Sichuan Basin emerging as a high-value cluster zone for intensifying fragmentation trends [8]. The increasing fragmentation of farmland parcels poses substantial constraints on achieving intensive agricultural production [9], thereby impeding the progress of agricultural modernization. Therefore, monitoring changes in both the quantity and fragmentation of cultivated land and scientifically revealing their dynamics will facilitate comprehensive land consolidation and promote rural revitalization.
Current analyses of cultivated land quantity primarily concentrate on the spatiotemporal evolution characteristics. In addition to conventional analyses of land-use transfer between cultivated land and other types, spatial heterogeneity exists in the compensation of cultivated land occupation. Li et al. conducted a systematic analysis of the topographic features of compensated cultivated land across China, utilizing nationwide geomorphological data and land-use transition datasets spanning 2008–2010 [10]. Yuan et al. performed a comprehensive examination of the correlations between farmland transfer in and out and other land use, along with their effects on net primary productivity (NPP) of cultivated land throughout China during the 1980–2020 period [11]. Moreover, extensive research has been undertaken from the perspective of cultivated land fragmentation, encompassing its evaluation [12,13], spatiotemporal evolution of landscape fragmentation [14], influencing mechanisms and governance [15,16], and trend prediction [8], as well as fragmentation-induced consequences [17,18].
Regarding the evaluation of cultivated land fragmentation, Cao et al. conceptualized this phenomenon through three dimensions: parcel fragmentation, tenure fragmentation, and scale operation fragmentation, while establishing a comprehensive evaluation framework that integrates parcel-level, household-level, and village-level indicators [12]. Ntihinyurwa delineated various manifestations of land fragmentation, classifying them into two principal categories: physical fragmentation and tenure fragmentation [19]. Many scholars have integrated land-use raster data with landscape pattern indices. For example, Lin et al. analyzed the landscape pattern of cultivated land in Haikou using the following five landscape indices: number of patches (NP), patch density (PD), aggregation index (AI), mean patch fractal dimension (MPFD), and landscape shape index (LSI) [20]. Wang et al. used the PD and LSI to analyze the land fragmentation index at the county level in China based on a coupling degree model [21]. Liu et al. selected eight indicators from three dimensions—resource scale, spatial aggregation, and usability—to analyze the fragmentation characteristics of cultivated land in Jiangsu Province [22]. In the characterization of cultivated land fragmentation using multiple landscape metrics, the relative importance of these indices differs. Wang et al. utilized the entropy weighting approach to determine indicator weights, thereby optimally retaining information variability [23]. Liu et al. combined the entropy weight method with the analytic hierarchy process (AHP) to establish indicator weights for assessing nationwide cultivated land fragmentation [8]. Moreover, existing research primarily concentrates on national [8,14] or provincial [13] scales, while investigations at finer regional scales remain comparatively limited, typically utilizing territorial change data [23] and similar sources.
Consequently, after evaluating the research scale, data accessibility, and integrated land rehabilitation requirements, Beichuan Qiang Autonomous County (hereafter “Beichuan County”) was designated as the study region. Employing a multi-scale township approach and integrating open-access multi-temporal remote sensing land-use data with DEM data, this study systematically examined the spatiotemporal dynamics of cultivated land area variations and fragmentation patterns across different elevation gradients and slope categories during 1980–2020. The aim is to reveal the long-term evolution characteristics of cultivated land quantity and quality in Beichuan County, providing a scientific basis for subsequent comprehensive land consolidation and cultivated land management. It also serves as a reference for land remediation in other mountainous counties.

2. Materials and Methods

2.1. Study Area

The selected study area in this paper is Beichuan County (Figure 1), the only Qiang Autonomous County in China. Located between 103°44′~104°22′ E and 31°14′~32°14′ N, the county lies in northern Sichuan Province, southwestern China, at the transitional zone between the Tibetan Plateau and the Sichuan Basin. The terrain slopes from high in the northwest to low in the southeast, descending in a step-like manner. The county exhibits a maximum elevation of 4734 m and a minimum of 474 m, yielding a substantial vertical relief of 4260 m, making it a typical mountainous county. Beichuan County’s demographic composition consists of 140,296 Han Chinese (61% of total population) and 89,666 ethnic minority individuals (39%), representing 33 ethnic minorities. Notably, the Qiang ethnic population dominates the minority demographic with 86,194 people, constituting 96.1% of all minority residents. In 2023, the primary industries in Beichuan County were agriculture and the tertiary sector, with relatively underdeveloped industrial development, contributing only 22.6% to the total output value.
Beichuan County exhibits pronounced topographic heterogeneity across its townships (Figure 2). Yongchang, Yong’an, Leigu, and Tongquan in the south are characterized by relatively low-lying terrain with moderate gradients. The eastern sector, covering Qushan, Xuanping, Chenjiaba, and Guixi, maintains comparable base elevations but demonstrates markedly steeper inclines. Central townships such as Yuli, Baini, and Duguan have higher elevations but gentler slopes. The northwestern periphery, exemplified by Kaiping and Xiaoba, combines substantial elevation with pronounced slope angles. The spatial distribution of cultivated land resources in 19 townships of Beichuan County demonstrates marked heterogeneity in both quantity and quality, attributable to variations in elevation gradients, topographic features, and infrastructure development. Townships like Qushan and Leigu are located on the Yingxiu–Beichuan Fault Zone. Affected by the 2008 Wenchuan Earthquake and subsequent secondary disasters, post-earthquake land-use changes were drastic [24,25]. After the earthquake, the county seat was relocated and rebuilt, with a wasteland in Yongchang being developed into the new Beichuan. Recent urban expansion and economic growth in Beichuan County, coupled with cultivated land transfer across townships, have contributed to increased fragmentation of local cultivated land. This study conducts a township-scale analysis of Beichuan County, examining cultivated land transfer dynamics and evaluating fragmentation levels through landscape pattern indices. The results reveal distinct patterns of cultivated land change between mountainous and plain areas, offering valuable insights for comprehensive land consolidation and the development of region-specific cultivated land enhancement strategies in Beichuan County.

2.2. Land-Cover Data

This study employs multi-temporal land-use remote sensing data from the Resource and Environmental Science Data Platform of the Chinese Academy of Sciencesto delineate long-term variations in cultivated land within Beichuan County. And we accessed its URL (https://www.resdc.cn/) on 10 November 2024.Considering data availability, five periods of data (1980, 1990, 2000, 2010, and 2020) were selected. The dataset primarily utilizes Landsat satellite imagery to establish a nationwide multi-temporal land-use/land-cover database via manual visual interpretation. For the 1980 data, it was artificially vectorized based on the “1:1 million land use map of China” from the 1980. With a spatial resolution of 30 m, the dataset comprises 6 primary categories of cultivated land, woodland, grassland, water, construction land, and unused land, plus 23 secondary classifications derived from land resource characteristics and utilization patterns. To meet the study needs, Beichuan County’s land-use data were extracted and recategorized according to the six primary classification types.

2.3. Method

2.3.1. Mean Center

The mean center is applicable to spatial datasets and is used in this study to measure the centroid of cultivated land transfer. The spatial variation in cultivated land transfer dynamics among townships causes corresponding shifts in the transfer gravity center, and the trajectory of this shift can be used to analyze the direction of cultivated land transfer [11]. This method involves calculating the coordinates of the center of each cultivated land parcel and then averaging all the x , y values. The equation is as follows.
X ¯ = 1 n i = 1 n x i
Y ¯ = 1 n i = 1 n y i
where X ¯ , Y ¯ represents the arithmetic mean center of cultivated land transfer-in or transfer-out in Beichuan County, n denotes the number of transfer-in or transfer-out cultivated land patches, and x i and y i represent the spatial coordinates of each patch.

2.3.2. Standard Deviation Ellipse

The standard deviation ellipse serves as an analytical tool for characterizing spatial data’s directional patterns, dispersion characteristics, and central tendencies. This method effectively captures regional-scale variations in geographic elements and has extensive applications in long-term spatiotemporal evolution studies [26]. In this study, it is employed to analyze the direction and scope of cultivated land transfer-in and transfer-out, with its core parameters including the ellipse center, orientation angle, major axis, and minor axis.
(1)
Ellipse center
S D E x = i = 1 n x i X ¯ 2 n
S D E y = i = 1 n y i Y ¯ 2 n
where S D E x and S D E y represent the center coordinates of the ellipse, X ¯ , Y ¯ denotes the mean center coordinates of cultivated land transfer-in or transfer-out, n indicates the number of patches, and x i and y i are the spatial coordinates of each patch.
(2)
Orientation angle ( θ )
The orientation angle denotes the ellipse’s directional alignment, measured clockwise from the X-axis, where 0° corresponds to true north.
tan θ = A + B C
where A = i = 1 n x ˜ i 2 i = 1 n y ˜ i 2 , B = i = 1 n x ˜ i 2 i = 1 n y ˜ i 2 2 + 4 i n x ˜ i y ˜ i 2 , C = 2 i n x ˜ i y ˜ i . In addition, θ is the orientation angle, x ˜ i and y ˜ i are the differences between the mean center and the xy coordinates.
(3)
Standard Deviation Calculation (Ellipse Axis Length)
In this study, the ellipse’s major axis indicates the spatial orientation of cultivated land transfer (transfer-in/out), while the minor axis represents its concentration level—a shorter axis denotes stronger agglomeration, and a longer axis suggests higher dispersion. Major axis σ x and minor axis σ y are calculated as follows.
σ x = 2 · i = 1 n x i cos θ y i sin θ 2 n
σ y = 2 · i = 1 n x i sin θ + y i cos θ 2 n
where σ x and σ y represent the major and minor axes of the ellipse, respectively.

2.3.3. Measurement of Cultivated Land Fragmentation Index (CLFI)

Existing research indicates that landscape pattern indices effectively characterize fine-scale patch fragmentation. Therefore, building upon prior research [8,13,27], this study employs 10 landscape metrics (Table 1) spanning three dimensions—spatial scale, aggregation patterns, and shape regularity—to assess cultivated land fragmentation in Beichuan County. All indices shown in the table were calculated using Fragstats 4.2.
The paper employs a fuzzy logic algorithm to compute RSI, SAI, and SRI. Fuzzy logic provides a mathematical approach to process uncertainty and vagueness, substituting binary logic’s absolute “true/false” paradigm with membership degree functions. It enables intelligent decision-making by processing uncertain information, thereby precisely managing imprecision and uncertainty. Fuzzy logic permits reasoning with ambiguous objects while maintaining strict precision in its governing rules [28]. The algorithm has been used in mature applications [29]. Assessing cultivated land fragmentation inherently involves fuzzy multi-indicator characteristics, which renders fuzzy inference methods particularly appropriate for such evaluations. This study constructed a Mamdani system using fuzzy control toolbox of MATLAB 2021. Triangular membership functions were adopted to normalize all indicators by eliminating dimensional effects. The rule base was established through “IF-THEN” rules, with fuzzy inference executed following Mamdani’s methodology. The defuzzification process was ultimately completed via the Centroid approach. The paper references [29] the relevant experimental procedures, as detailed below.
(1)
Indicator fuzzification
Input the evaluation indicators of cultivated land fragmentation X1, X2, X3, …, Xn, and determine the range of indicator values; set the output indicator as cultivated land fragmentation Y, with both input and output using the trimf function.
(2)
Identification of positive and negative indicators
Determine the positive or negative polarity of each indicator based on its impact.
(3)
Rule base construction
The rule base employs IF-THEN rules, with the i -th rule structured as:
IF   R i : i f   x i   i s   F 1 i ,   x 2   i s   F 2 i , . . . ,   x n   i s   F n i ,   THEN   y   is   F 0 i
where x i X i , y Y , F n i represents the triangular fuzzy number of each indicator, corresponding to the qualitative description of the input, and F 0 i represents the qualitative description of the output indicator. According to the trigonometric functions, the number of indicator rules is n3.
(4)
Calculation of each rule’s strength
The strength of each rule β i is calculated using fuzzy intersection operations, based on the equation:
β i =   max min μ F 1 i x , μ G 1 x : x X 1   max min μ F 2 i x , μ G 2 x : x X 2   max min μ F n i x , μ G n x : x X n .
where μ F j i x j = 1 , 2 , , n represents the membership function of the qualitative description R i in rule F j i j = 1 , 2 , , n corresponding to the fuzzy set, and μ G j j = 1 , 2 , , n represents the membership function of the fuzzy input given in the form of triangular fuzzy numbers.
(5)
Calculation of the fuzzy output for each rule
The fuzzy output of the i -th rule is calculated using the fuzzy intersection operation as:
v F j i y = min { β i , μ F 0 i y
where β i is the strength of the i -th rule, μ F 0 i y is the membership function of the qualitative description of the output indicator F 0 i , y Y .
(6)
Aggregation of fuzzy outputs
The output of the i -th rule is aggregated using the fuzzy union operation as:
v F 0 y = max v F 0 1 y , v F 0 2 y , , v F 0 m y
where v F 0 1 y is the membership function of the fuzzy output derived from the i -th rule, and m is the total number of rules, y Y .
(7)
Defuzzifying
The aggregated output undergoes centroid defuzzification to derive the final result.
O P = l = 1 k y l · μ F 0 i l = 1 k μ F 0 i
where y l Y , is the k-quantization of Y.
Based on prior results, the RSI, SAI, and SRI are combined to compute the cultivated land fragmentation index (CLFI). Following the approach of Liu Jing et al. [22], the weights of the three indices are set uniformly as 1/3 each. The calculation method for CLFI is as follows:
C L F I = 1 R S I × ω + S R I × ω + S R I × ω
where ω represents the weights of the three indices, each assigned a value of 1/3.

3. Result

3.1. Changes in Cultivated Land Area in Beichuan County

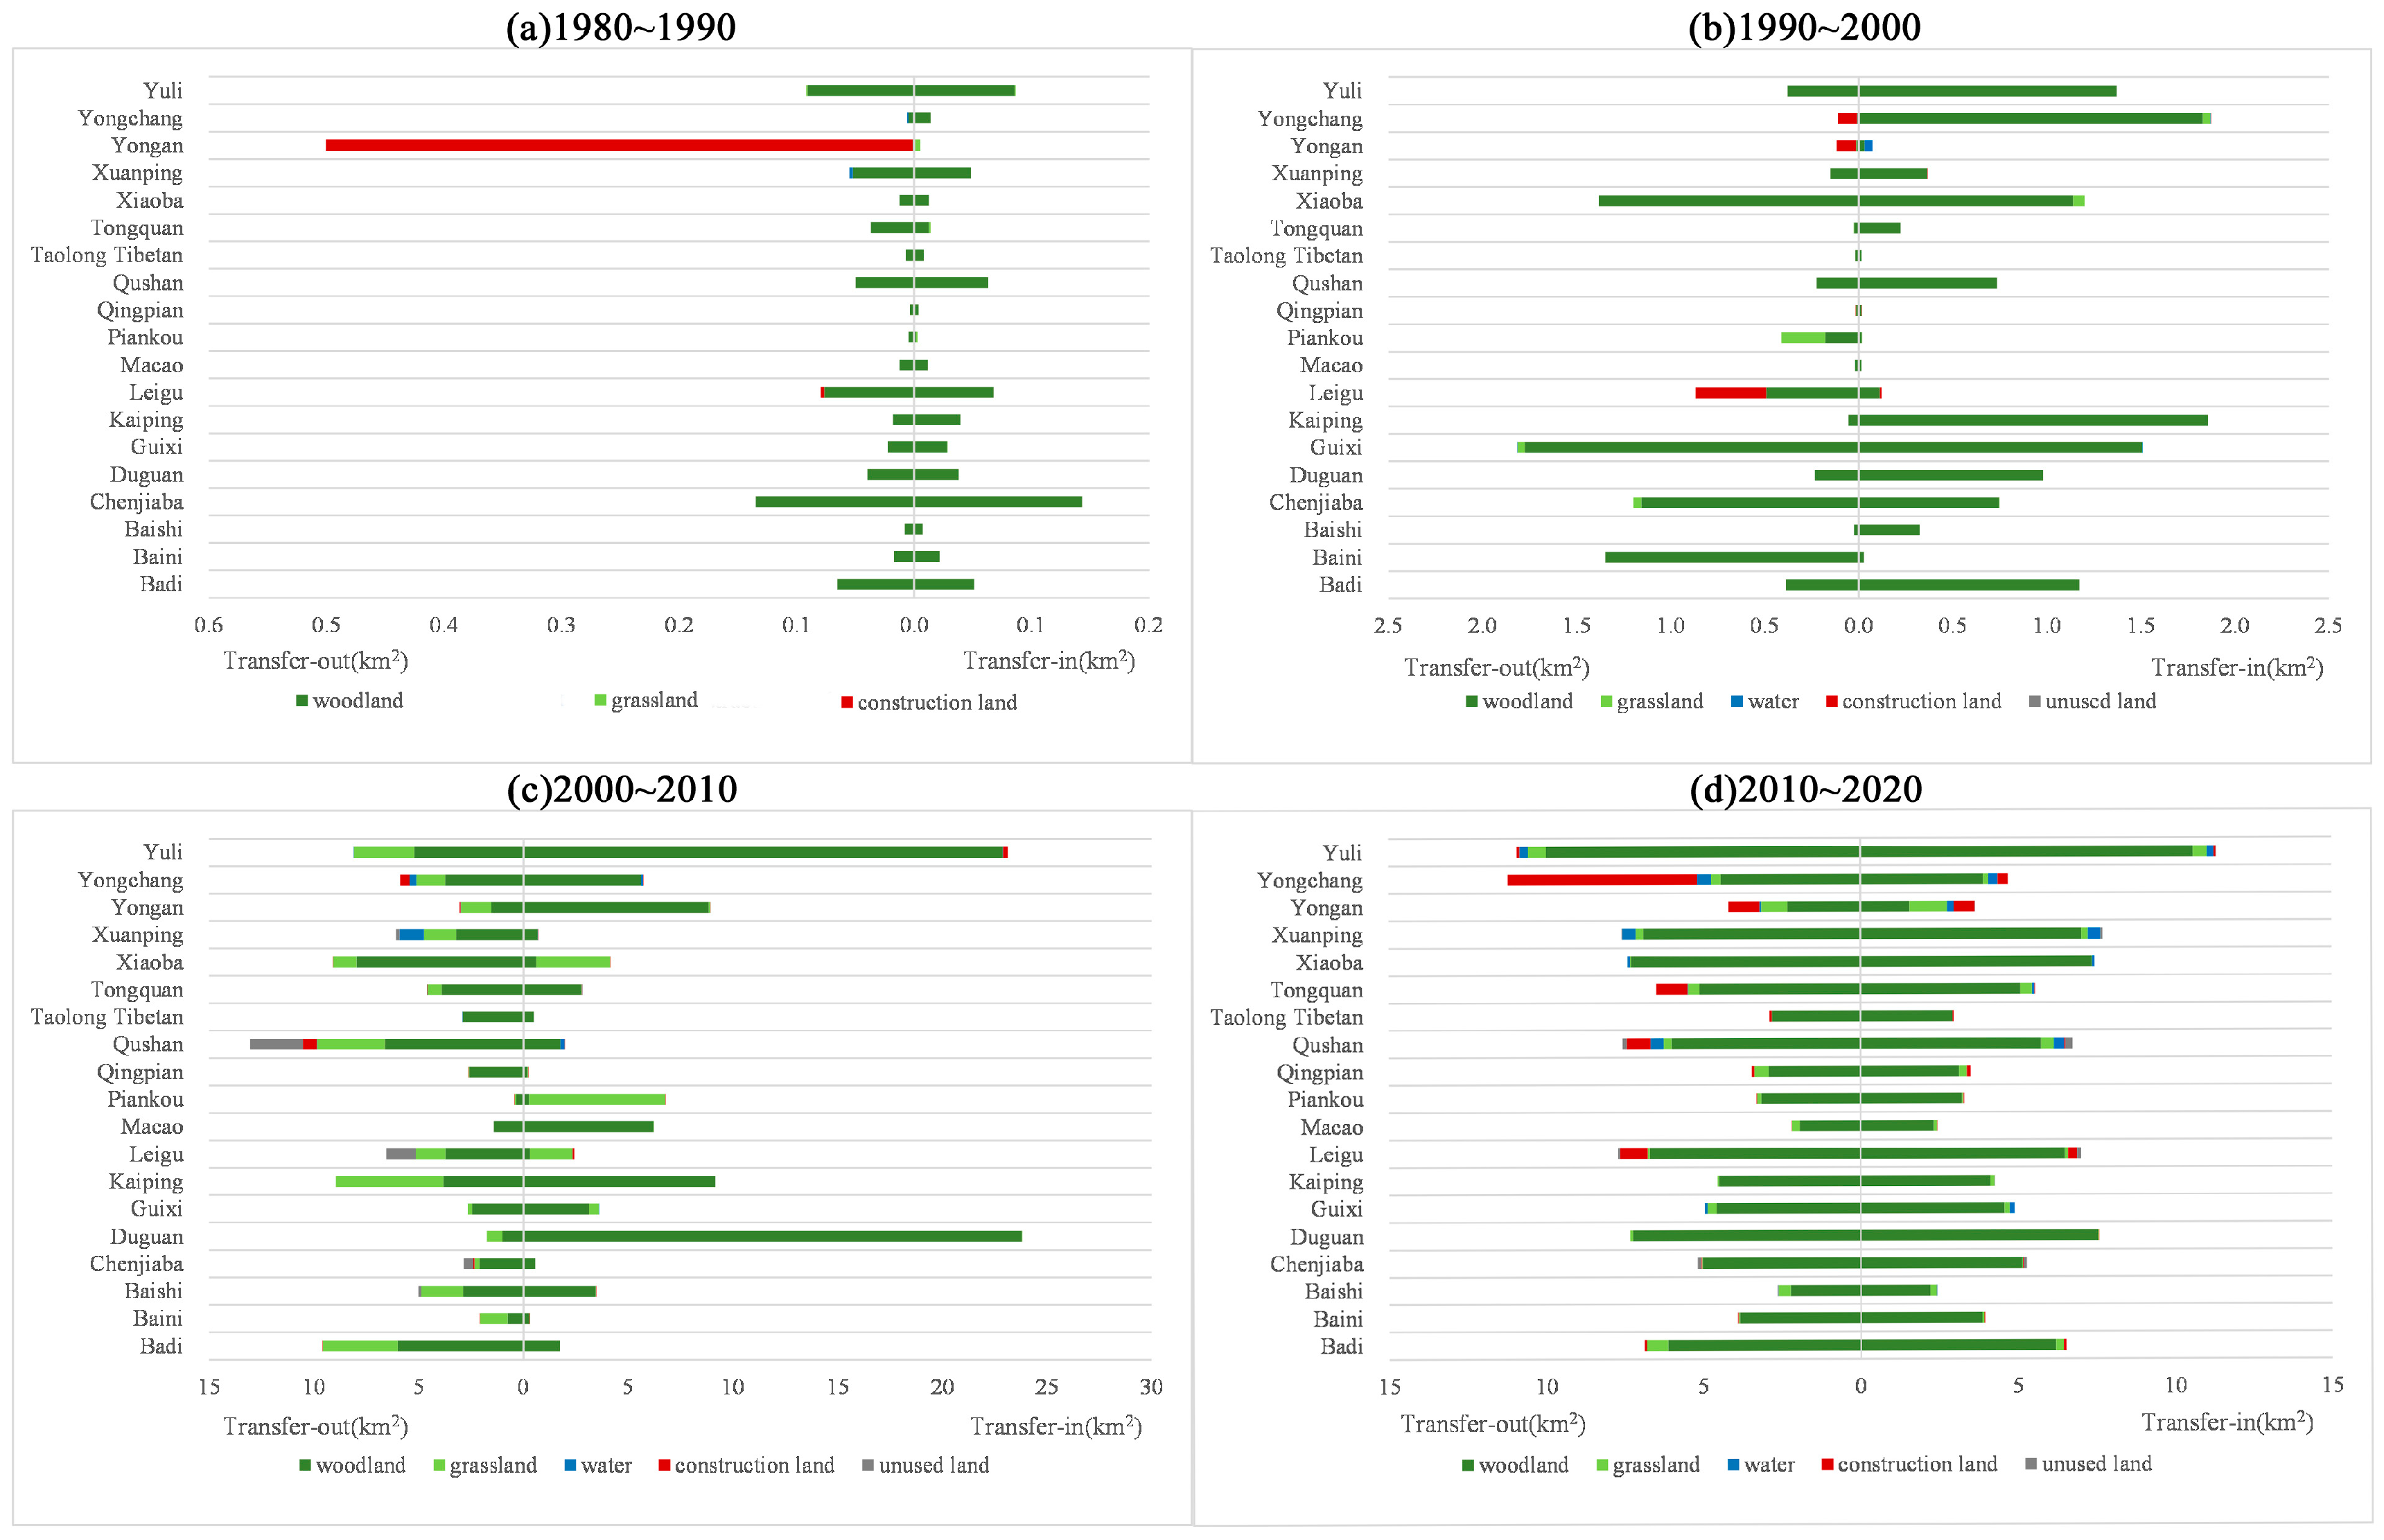
3.1.1. Changes in the Transfer of Cultivated Land in Beichuan County

Based on remote sensing monitoring data of land use in Beichuan County, the cultivated land areas measured 609.44 km2 (1980), 608.94 km2 (1990), 612.83 km2 (2000), 621.10 km2 (2010), and 612.86 km2 (2020). From the 1980 to 2000, the cultivated land area exhibited fluctuating changes, initially decreasing, then increasing, and subsequently decreasing again. From 1980 to 2020, 180.23 km2 of cultivated land transitioned to other land types, whereas 183.74 km2 of other land types were converted to cultivated land.
Specifically (Table 2), (1) across the periods 1980–1990, 1990–2000, 2000–2010, and 2010–2020, areas transferred out measured 1.16 km2, 8.79 km2, 96.49 km2, and 110.40 km2, respectively, demonstrating consistent growth; the areas transferred in were 0.67 km2, 12.65 km2, 106.27 km2, and 101.36 km2, revealing an upward trajectory from the 1980 to 2010, followed by a decrease from 2010 to 2020. (2) Woodland constituted the predominant transfer target from cultivated land, with its proportion rising from 0.11% to 14.98% of total transferred area. The proportion of the cultivated land transferred to grassland increased after 1990, with 4.40% of cultivated land converted to grassland during 2000–2010. Post-2000 witnessed emerging transfer to water and construction land (1.63% during 2010–2020). Notably, 0.59% of cultivated land transitioned to unused land during 2000–2010, potentially linked to seismic activity. (3) Woodland represented the principal source of cultivated land transfer, contributing over 15% of total converted-in area during 2000–2020. Post-1990 witnessed minor transfer from grassland and water. Post-2000 saw emerging reverse transfer from construction land and water, with construction land transfer demonstrating progressive growth. (4) Cross-period comparisons revealed pronounced land-use shifts during 2000–2010 and 2010–2020, with cultivated woodland/grassland exhibiting particularly dynamic changes.
At the township level (Figure 3), cultivated land transfers during the 1980–2020 predominantly involved bidirectional transfers between cultivated land and woodland. (1) Regarding cultivated land transfer-out, woodland constituted the primary transfer target across most townships, with grassland being secondary. Elevated townships with steep slopes such as Kaiping, Baishi, Badi, and Baini demonstrated pronounced grassland transfer rates; conversely, low-elevation townships in eastern/southern areas such as Yongchang, Yong’an, Tongquan, Leigu, and Qushan exhibited dominant construction land transfer, where Yong’an and Yongchang exceeded 20% transfer rates, and Yongchang surpassed 40%. These regions concurrently experienced substantial seismic impacts. (2) For cultivated land transfer-in, woodland-to-cultivated land transfer dominated (>80% total) in most townships except Piankou and Xiaoba. These two northwestern townships exhibited distinct grassland transfer rates (Piankou: 67.24%; Xiaoba: 34.96%). Meanwhile, Yongchang, Yong’an, and Leigu in the east and south, as well as Qingpian and Taolong Tibetan townships in the northwest recorded construction-to-cultivated land transfers exceeding 1%.
Specifically, as shown in Figure 4, (1) from the 1980 to 1990, Yong’an predominantly underwent cultivated-to-construction land transfer. Other townships primarily displayed cultivated–woodland transfer with limited areal changes, compared to extensive transfers in central-eastern townships such as Yuli, Xuanping, Qushan, Leigu, Chenjiaba, and Badi. While most townships exhibited marginal net changes with prevailing reduction trends, northern counterparts such as Chenjiaba, Guixi, Baini, and Kaiping registered cultivated land expansion. (2) From 1990 to 2000, cultivated land changes predominantly involved woodland–cultivated land transfers across all townships except Piankou and Yong’an, showing marked transfer-in/out disparities. Central townships such as Badi, Yuli, Qushan, Kaiping, and Duguan demonstrated pronounced transfer-in dominance with extensive converted areas, while Leigu and Baini exhibited clear transfer-out predominance. Xiaoba, Guixi, and Chenjiaba townships displayed balanced yet substantial bidirectional transfers with narrower net differences. Taolong Tibetan, Qingpian, and Macao townships in the northwest maintained minimal land-use alterations throughout the decade. (3) From 2000 to 2010, cultivated land transformations intensified across all townships, with grassland–cultivated land transfers emerging as a significant pattern alongside woodland transition. Townships in the southeast such as Yuli, Yong’an, and Duguan primarily absorbed woodland transfers, while northwestern Piankou showed grassland transfer dominance and Macao exhibited woodland absorption. The majority of remaining townships demonstrated net transfer-out patterns. This spatial differentiation resulted in widespread cultivated land reduction, with only five townships (Yuli, Yong’an, Duguan, Piankou, Macao) registering net increases, thereby intensifying intra-regional occupation–compensation disparities. (4) During 2010–2020, most townships exhibited marginal net land changes, none exceeding 1 km2, predominantly through woodland transfers, with Yongchang being the notable exception. Southeastern townships such as Yongchang, Yong’an, Tongquan, Qushan, and Leigu witnessed cultivated-to-construction land transitions, potentially attributable to post-seismic reconstruction activities.
The elevation-slope analysis reveals that (1) during 1980–1990, cultivated land changes were most pronounced in low-elevation, gently sloped townships, while remaining areas showed minimal variations. However, the cultivated land area in the eastern and northern regions with relatively high altitude increased. (2) During 1990–2000, central townships characterized by steep slopes and low elevations predominantly exhibited land transfer-in patterns, contrasting with peripheral townships such as Leigu and Baini that showed transfer-out dominance, suggesting inter-regional occupation–compensation equilibrium. Meanwhile, northwestern high-altitude townships with rugged terrain displayed negligible land-use changes. (3) During 2000–2010, both low-lying gentle-slope areas and northwestern high-altitude steep-slope regions predominantly showed land transfer-in patterns, consequently expanding cultivated land. Conversely, central townships witnessed cultivated land transfer-out, creating intra-regional occupation–compensation imbalances that necessitated significant off-site compensation measures. (4) During 2010–2020, intra-township land occupation and compensation achieved relative equilibrium. Notably, low-elevation gentle-slope areas demonstrated heightened land transfer, driving substantial cultivated land fluctuations. Conversely, high-altitude steep-slope regions such as Qingpian, Piankou, and Macao townships remained stable due to extensive agriculturally constrained terrain, exhibiting minimal land-use modifications throughout the decade.

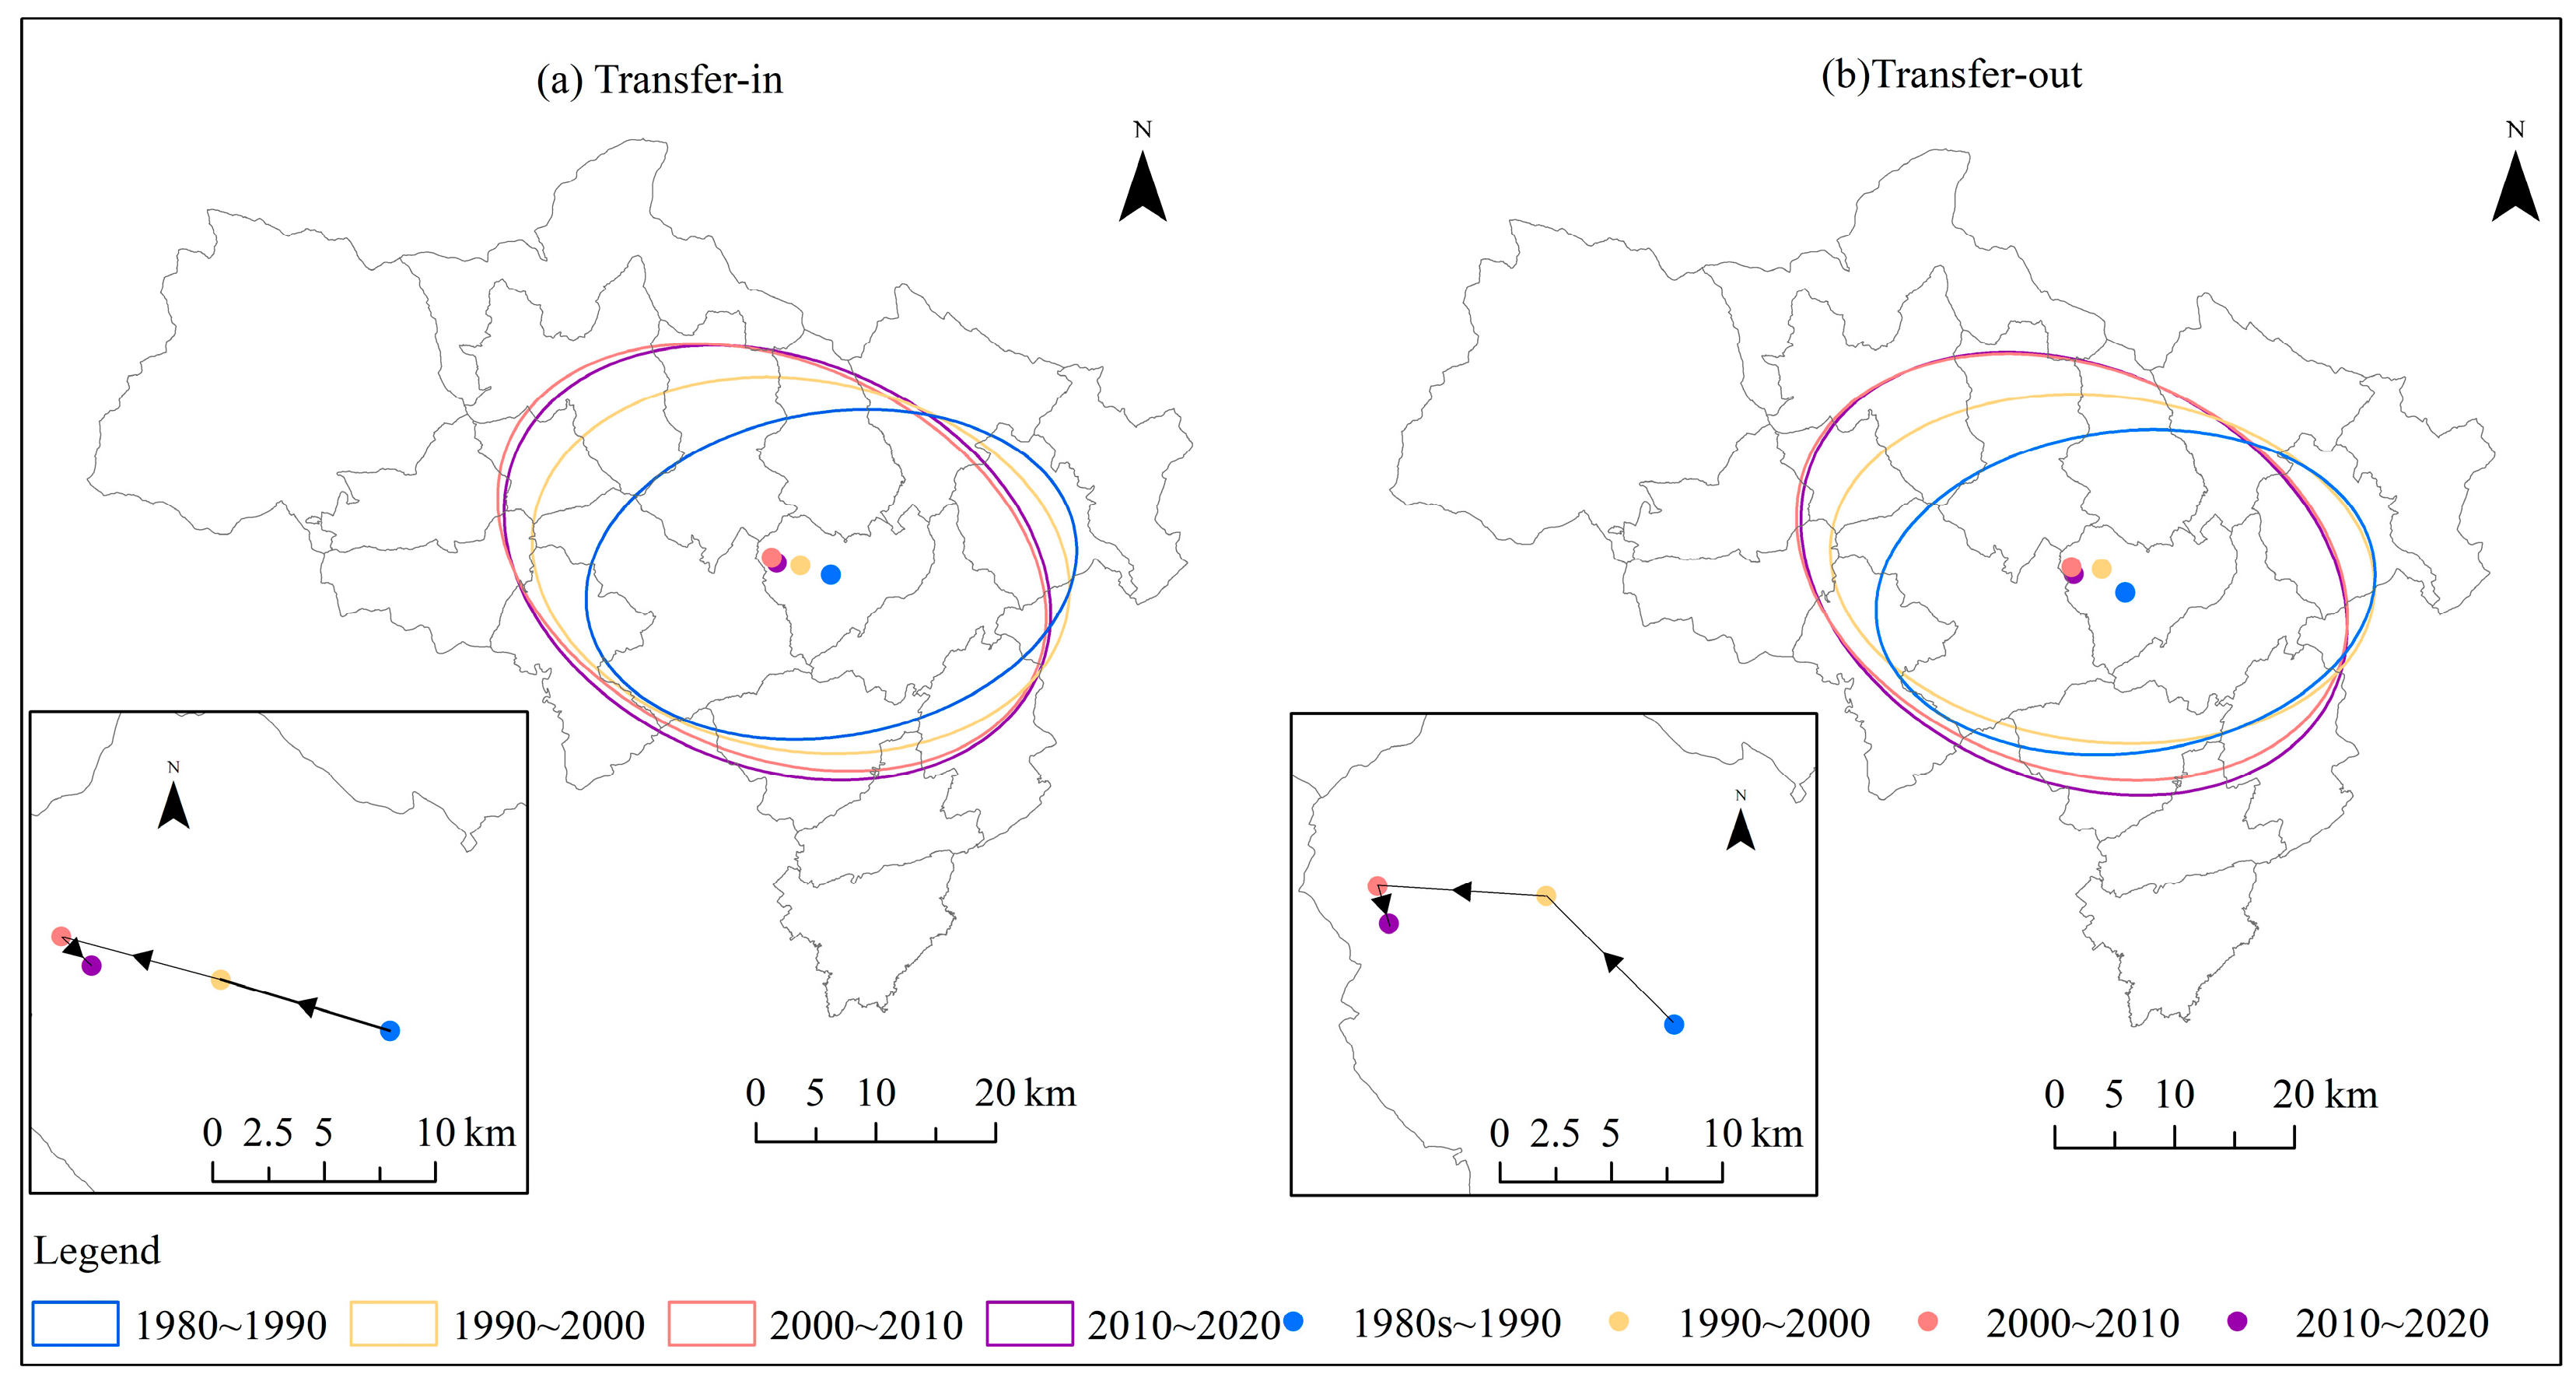
3.1.2. Shifts in the Gravity Center of Cultivated Land Transfer in Beichuan County

Analysis of distribution gravity centers (Figure 5) reveals distinct spatiotemporal patterns in Beichuan County’s cultivated land transfer. During the 1980–2010, the gravity center exhibited northwestward migration, though displacement magnitude declined from 2671.63 m to 2518.73 m. During 2010–2020, the trajectory reversed to southwestward movement, covering 628.72 m. These findings demonstrate a northwestward shift in land transfer distribution from the 1980 to 2010, transitioning to southwestward movement post-2010, accompanied by intensified transfer activities in southwestern regions. Combining elevation and slope, it can be seen that the distribution of the transfer-in shows that the transfer-in is moving to the direction of high altitude and high slope first, and then to the direction of low altitude and low slope after 2010. The spatial displacement patterns of land transfer-out closely resemble transfer-in characteristics, with parallel trajectories and analogous temporal evolution trends.
The standard deviation ellipse analysis reveals consistent spatial patterns between cultivated land transfer-in and transfer-out trends in Beichuan County. For cultivated land transfer-in, the rotation angles during the 1980–1990, 1990–2000, 2000–2010, and 2010–2020 measured 79.25°, 100.52°, 115.95°, and 114.74°, respectively, consistently oriented along the southeast–northwest axis. Corresponding short-axis lengths were 13,708.22 m, 22,284.65 m, 23,753.46 m, and 23,435.14 m, exhibiting an initial increase followed by decrease. This spatial pattern indicates a cyclical transition in land-use intensity: the transferred parcels first clustered, then dispersed, before re-concentrating over the study period. The major axis predominantly extended in the southeast–northwest direction, indicating that the cultivated land transferred in expanded along this orientation. The transfer-out rotation angles (82.33°→96.84°→113.00°→116.75°) demonstrate progressive alignment with the southeast–northwest orientation. Corresponding short-axis measurements (13,631.78 m→22,468.70 m→23,540.59 m→23,575.35 m) reveal spatial dispersion of transferred-out cultivated land parcels.

3.2. Spatiotemporal Evolution Characteristics of Cultivated Land Fragmentation

Employing fuzzy logic algorithms with five temporal datasets, this study calculated Beichuan County’s spatial metrics including scale, agglomeration, and shape regularity indices. These indices were subsequently classified into five tiers (low, lower, medium, higher, high) by the natural breaks method, with detailed classification thresholds documented in Table 3.
The calculated fragmentation characteristic indices of Beichuan County are illustrated in Figure 6. The cultivated land fragmentation index in Beichuan County exhibited temporal variations, with mean values of 0.5072 (1980), 0.5078 (1990), 0.5065 (2000), 0.5016 (2010), and 0.5022 (2020). Inter-decadal changes manifested as +0.12% (1980–1990), −0.26% (1990–2000), −0.97% (2000–2010), and +0.12% (2010–2020), demonstrating an initial increase followed by decline and subsequent rebound. Cumulatively, a net reduction of 0.99% occurred during the study period, with 73.68% of townships experiencing decreased fragmentation levels.
(1)
Beichuan County exhibited varying township-level trends in cultivated land fragmentation reduction: 63.16% (1980–1990), 47.37% (1990–2000), 63.16% (2000–2010), and 52.63% (2010–2020). Despite periodic fluctuations in these proportions, a consistent downward trajectory emerged, demonstrating progressive mitigation of landscape fragmentation throughout the study period.
(2)
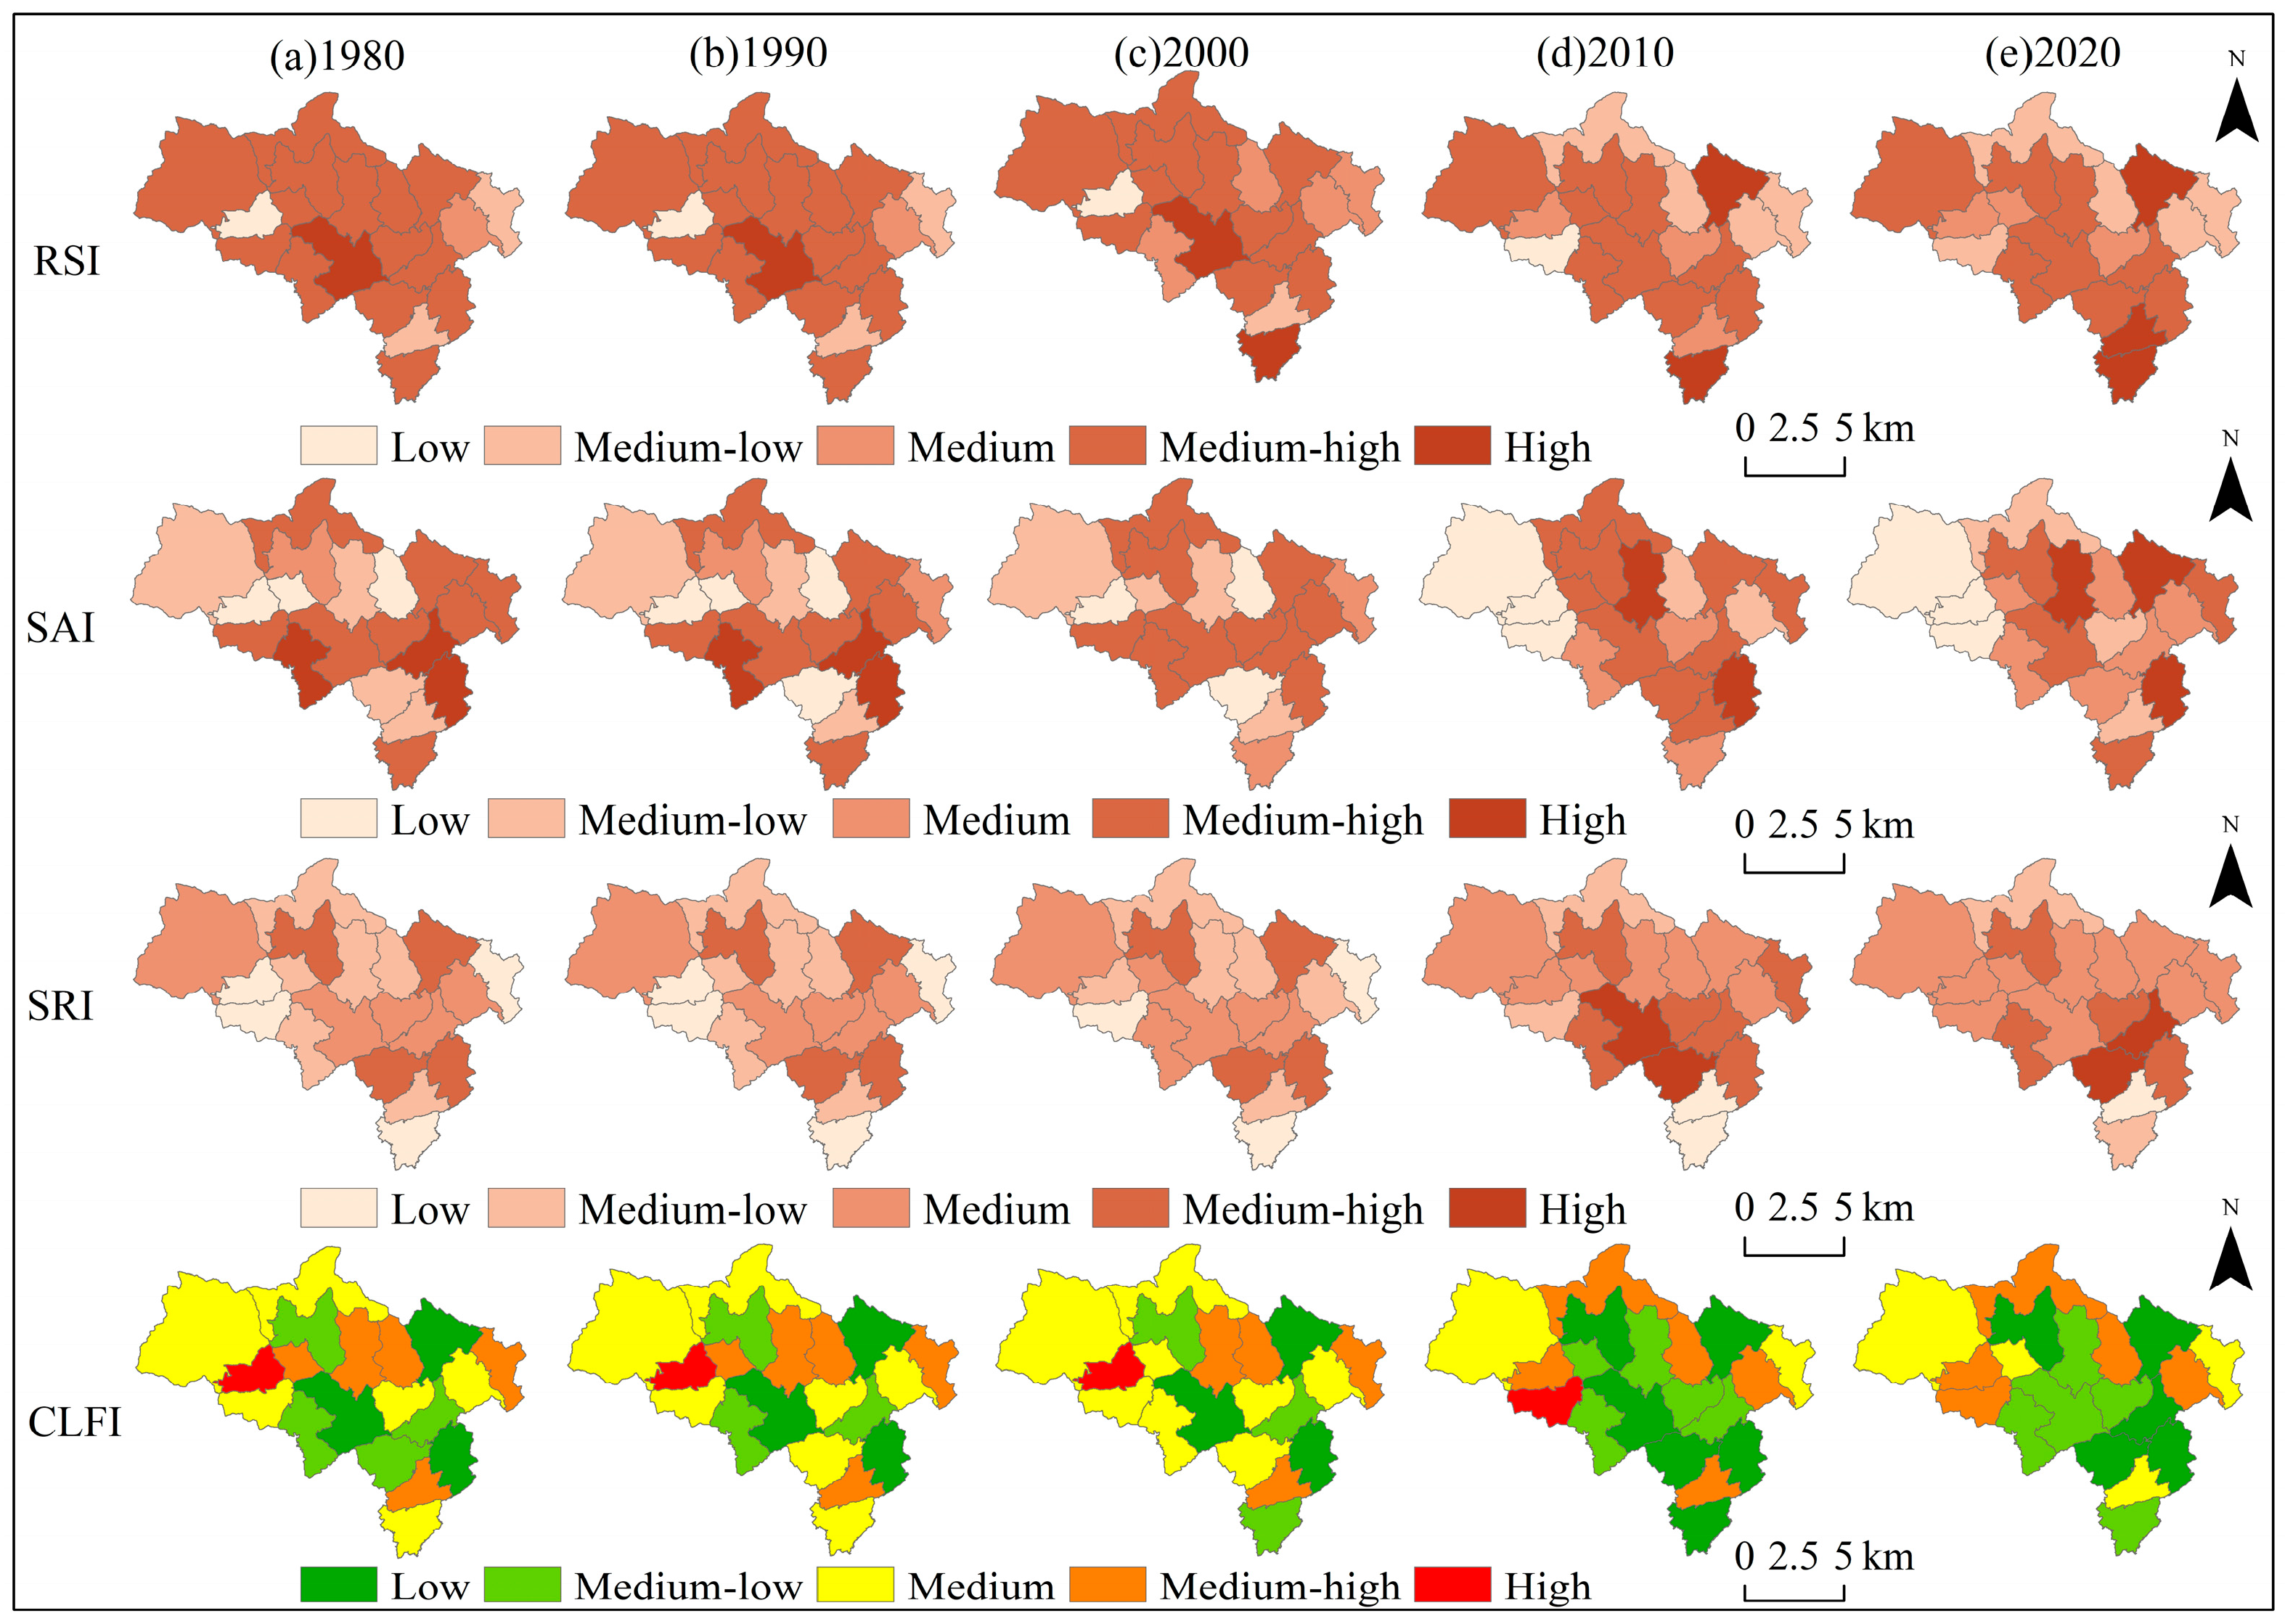
Temporal analysis indicates cultivated land fragmentation primarily exhibited moderate levels during the 1980 (31.58%), 1990 (36.84%), and 2000 (42.11%). The subsequent decades (2010–2020) showed a marked shift toward reduced fragmentation, with lower fragmentation levels dominating at 57.89% and 52.63%, respectively.
(3)
The spatial scale, agglomeration, and shape regularity indices collectively demonstrate that cultivated land exhibits small-scale characteristics, dispersed distribution patterns, and irregular geometries, resulting in high fragmentation levels—as typified by Baishi’s landscape configuration—due to the combined effects of spatial scale constraints, weak spatial clustering, and low shape regularity. Furthermore, although scattered distribution patterns and irregular boundaries remain prevalent, expanded spatial dimensions demonstrate fragmentation reduction potential, evidenced in Qingpian and Kaiping townships’ landscapes. In contrast, integrated landscapes combining extensive spatial dimensions, clustered distribution patterns, and geometric regularity collectively reduce fragmentation, as observed in Tongquan, Yuli, and Leigu townships.
(4)
Topographic analysis reveals distinct spatial patterns: RSI demonstrates minimal elevation and slope dependence; SAI shows positive correlations with lower elevation and gentler slopes; SRI exhibits strong topographic sensitivity, peaking in low-lying flat areas; and CLFI displays an inverse relationship, with low values clustering in plains and high values predominating in mountainous townships.
In summary, high-elevation, steep-slope cultivated lands in Beichuan County predominantly feature expanded spatial dimensions, reduced aggregation intensity, and diminished shape regularity, collectively exacerbating landscape fragmentation. Conversely, central low-elevation townships with gentle slopes demonstrate optimal spatial configurations-expansive scale, clustered distribution, and geometric regularity, yielding minimized fragmentation. Townships in the eastern and southern regions with low elevation and gentle slopes mostly show uniformly low values, with low cultivated land fragmentation indices.
Given the marginal variations in CLFI absolute values across most townships, the analysis of classification changes was conducted using an equivalence-based classification approach (Figure 7). Between 1980 and 2020, 73.68% of townships exhibited landscape changes, with 71.43% demonstrating reduced cultivated land fragmentation—predominantly transitioning from the “Medium-low” to “Low” category. Conversely, 28.57% displayed intensified fragmentation, primarily shifting from “Medium” to “Medium-high”. That is, cultivated land in lower-elevation or gentle-slope areas suitable for agriculture showed reduced fine-scale fragmentation following land preparation, whereas townships characterized by higher elevations and steeper slopes possessed limited cultivated land availability, with the majority of areas being unsuitable for agricultural expansion, consequently exhibiting heightened fine-grained fragmentation.
Specifically, from the 1980 to 1990, only Leigu shifted from "Low" to "Medium-low." From 1990 to 2000, Taolong Tibetan and Yongchang saw a reduction in fragmentation, while Badi experienced an increase. From 2000 to 2010, 63.16% of townships underwent significant changes, still predominantly reductions, with only Piankou, Baishi, and Chenjiaba showing increased fragmentation. The rest exhibited reductions, with Leigu decreasing by two levels.

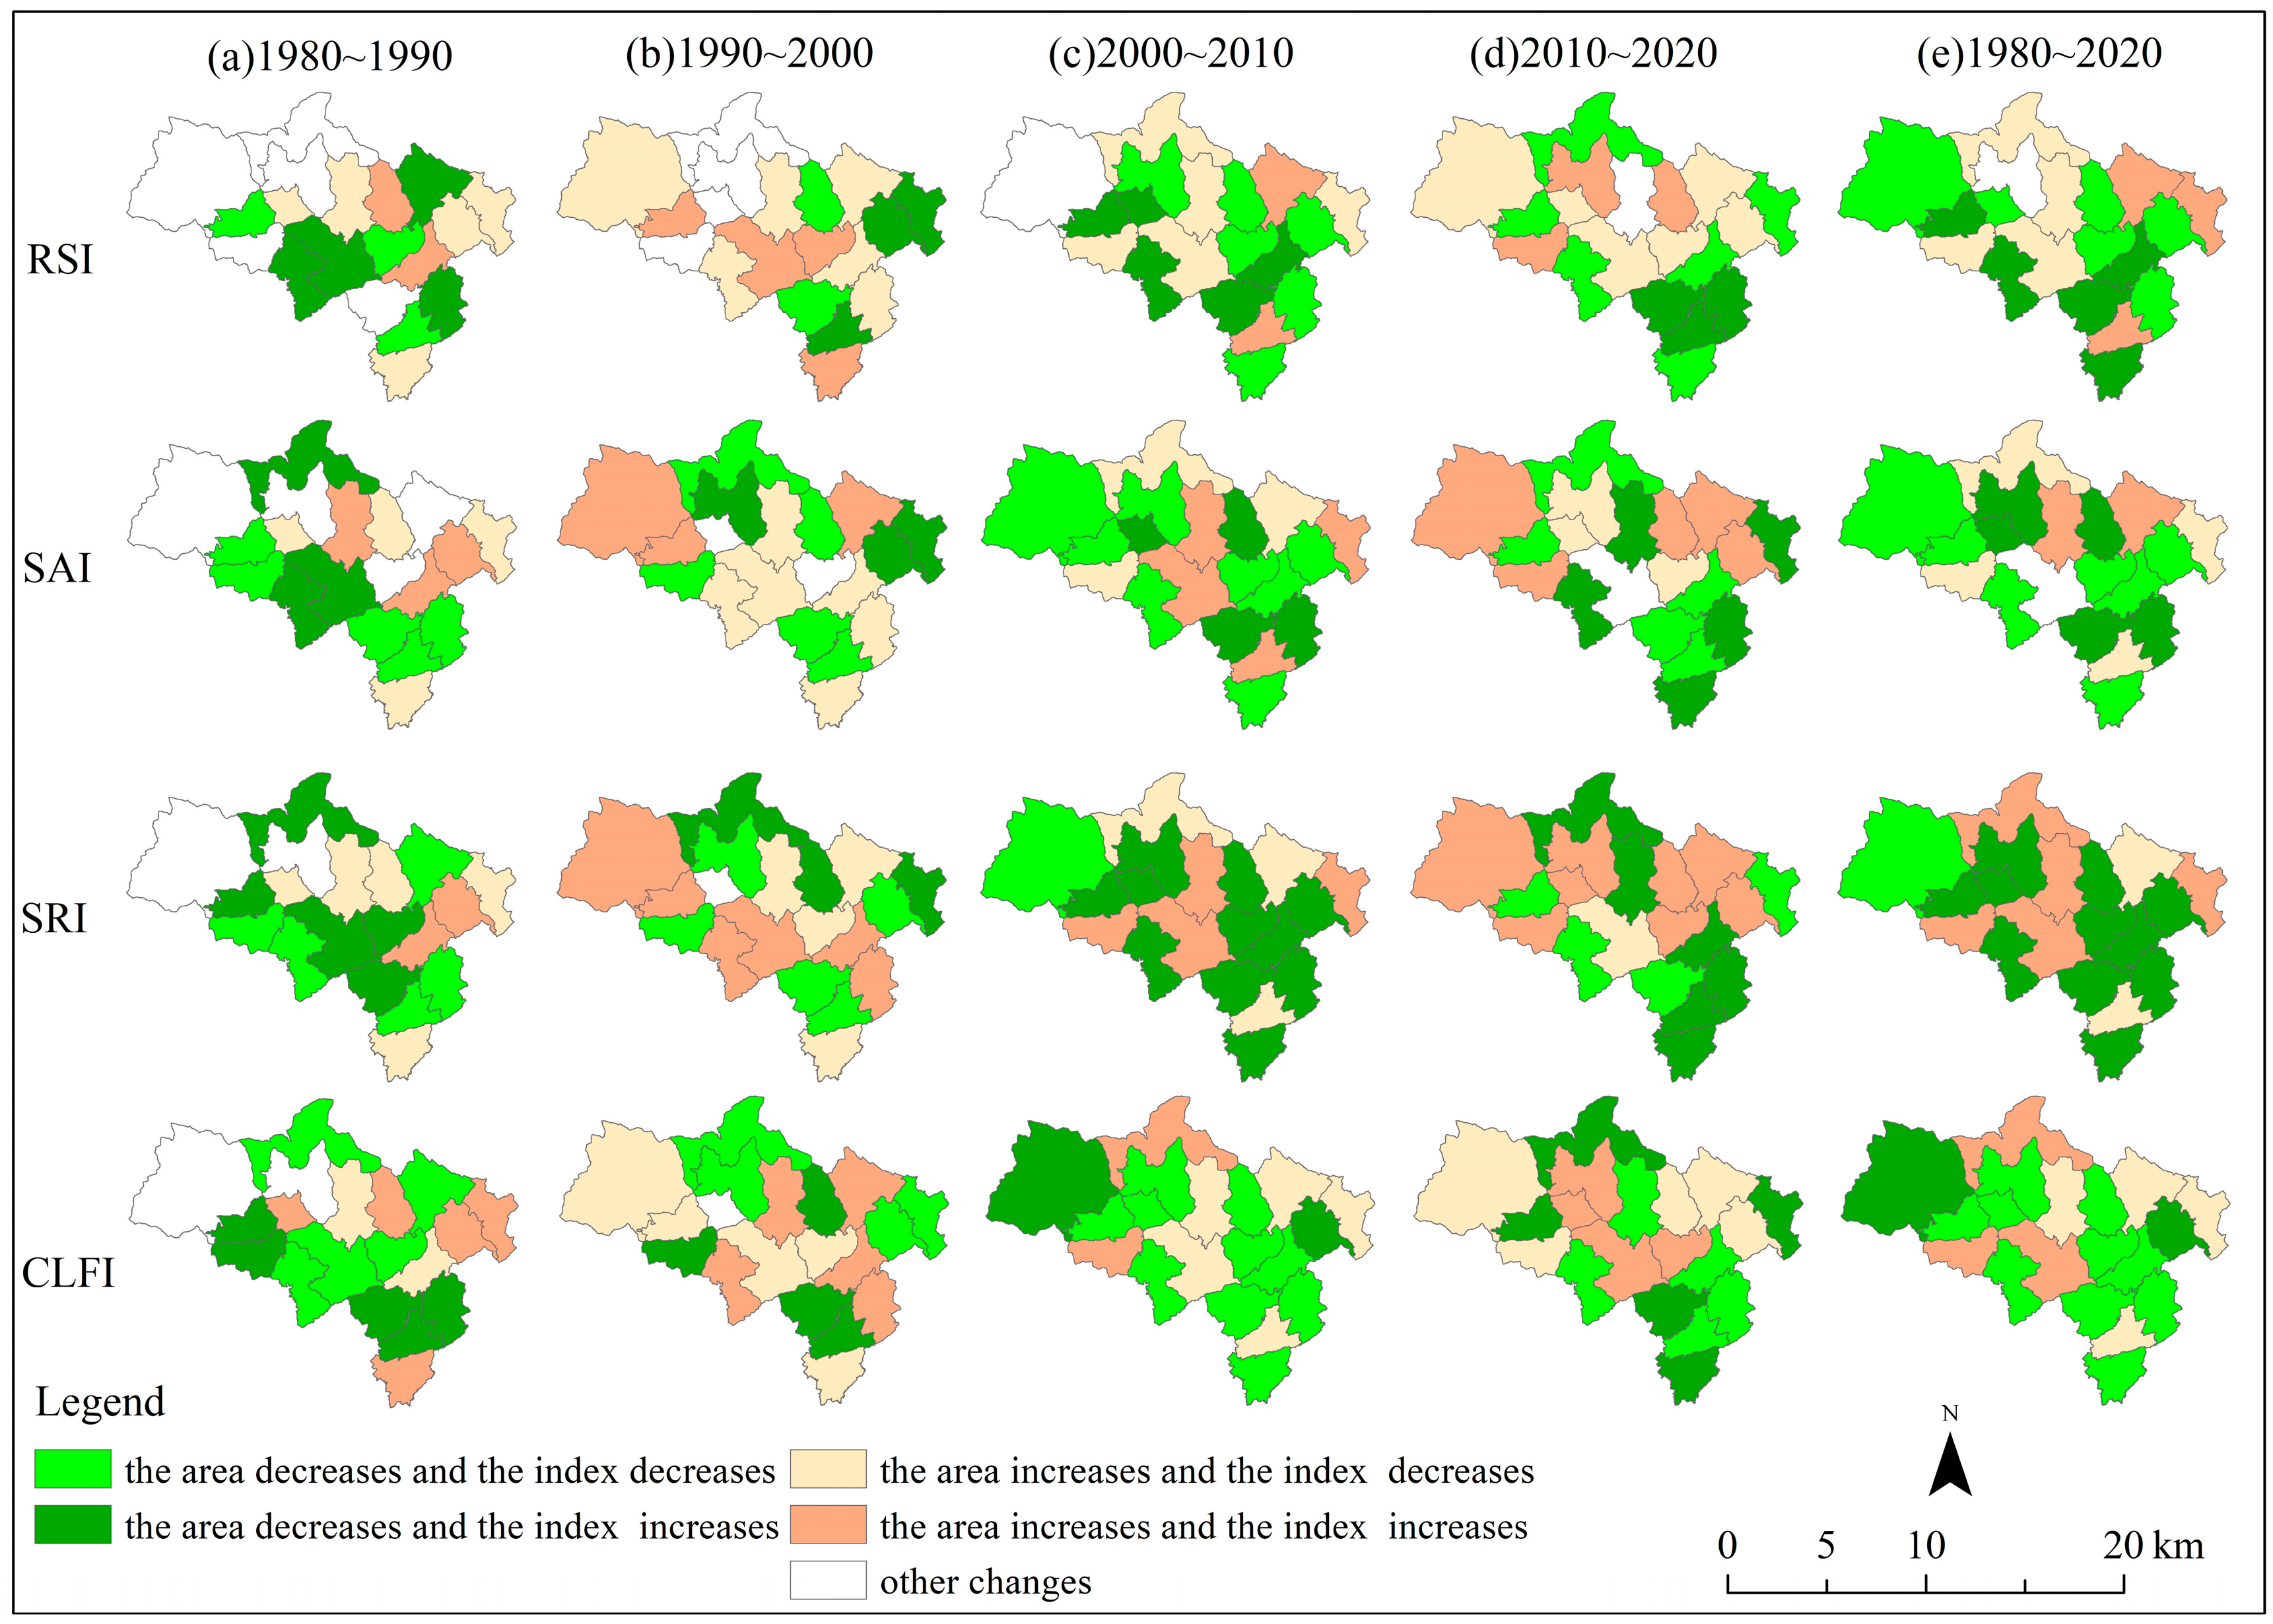
3.3. Relationship Between Cultivated Land Area Changes and Landscape Fragmentation

As illustrated in Figure 8, the analysis reveals that during the period from 1980 to 2020, alongside the decline in cultivated land area, 31.58% of townships demonstrated decreased RSI values, while 36.84% showed reduced SAI. Notably, merely 5.26% of townships experienced an increase in SRI. The CLFI exhibited a predominant downward trend, constituting approximately 52.63% of the observed cases. With a reduction in cultivated land area, 26.32% of townships displayed rising RSI values, while 36.84% showed elevated SAI. Notably, SRI exhibited a dominant increasing trend (57.89%), contrasting with CLFI seeing a rise in significantly fewer townships (10.52%). The data indicate that with the expansion of cultivated land area, RSI and SAI showed predominant decreasing trends, while SRI exhibited a mainly increasing pattern. Conversely, CLFI demonstrated a primarily decreasing tendency.
Temporal analysis indicates that during 1980–2000, minimal cultivated land transfers occurred, resulting in net area reduction. This phase witnessed predominant RSI increases alongside decreases in SAI, SRI, and CLFI. Conversely, during cultivated land expansion periods, RSI and SAI increases were limited to few townships, with most showing decreases, while SRI and CLFI predominantly increased. The period 2000–2020 witnessed substantial cultivated land transfers, driving marked landscape changes. Under cultivated land reduction scenarios, townships exhibiting RSI and SAI decreases outnumbered those with increases, contrasting with predominantly rising SRI and declining CLFI. Notably, during balanced land occupation–compensation phases (2010–2020), CLFI variation between increasing and decreasing townships became marginal. Expansion periods conversely showed RSI principally decreasing against rising SAI/SRI trends, with CLFI maintaining a dominant downward trajectory.

3.4. Spatiotemporal Heterogeneity of Cultivated Land Evolution Across Different Elevations

According to the analysis of the average elevation and slope of the townships in Beichuan County, dynamics in the period of the 1980~2020, where significant changes occurred, revealed that in the eastern and southern townships of the region with lower altitudes and gentle slopes, the cultivated land was dominated by a decrease in RSI and SRI, an increase in RSI and SRI, a decrease in SAI, and a decrease in CLFI, i.e., a decrease in the degree of fine-grained fragmentation of the cultivated land landscape. In central regions such as Yuli, Kaiping, Badi, Xiaoba, and Piankou, characterized by relatively high elevation and slope, the area of cultivated land was dominated by an increase, the RSI was dominated by a decrease, the SRI exhibited a clear trend of increasing, and the CLFI was dominated by a decrease. In Qingpian, characterized by high elevation and steep slopes, cultivated land area decreased, with RSI, SAI, and SRI all declining, while the degree of cultivated land fragmentation increased.
In summary, (1) townships with gentle topography at lower elevations typically feature flat terrain conducive to agricultural activities, resulting in spatially aggregated farmland patterns. Such areas generally support denser human settlements and more robust economic conditions. The observed reduction in cultivated land area accompanied by diminished landscape fragmentation can be attributed to the preferential transfer of fragmented parcels through land transaction mechanisms. (2) In mountainous areas with significant elevation and pronounced slopes, cultivable land becomes limited, exhibiting dispersed distribution patterns and generally smaller plot dimensions. This geographical context leads to farmland reductions primarily affecting isolated parcels, resulting in diminished spatial extent, reduced clustering, and less regular shapes, while simultaneously elevating landscape fragmentation levels.

4. Conclusions and Discussion

4.1. Conclusions

The transfer of cultivated land affects both its area and fragmentation degree. This study selects Beichuan County as the case study area to examine the spatiotemporal dynamics of cultivated land patterns from the 1980 to 2020 using five-period remote sensing data (1980, 1990, 2000, 2010, and 2020). The investigation specifically addresses farmland transfer processes and landscape fragmentation trends. Key findings include the following:
(1)
From the 1980 to 2020, Beichuan County witnessed that the area of cultivated land transferred in was greater than that transferred out, the area of cultivated land increased; the cultivated land in the low-altitude and gentler slopes of the townships changed significantly, while the cultivated land in the high-altitude and steeper-slope areas changed less. The balance of cultivated land occupation and compensation shifted from the balance of occupation and compensation in other places to that within the towns. During this period, the area of cultivated land transferred out increased in Beichuan County. The area transferred in peaked around 2010, increasing in the earlier period and decreasing afterward. Both transfers in and out exhibited significant changes between 2000 and 2020.
(2)
Land-use transitions predominantly occurred between cultivated land and woodland, with post-2000 periods witnessing marked increases in conversions to grassland and construction land. These transitions exhibited a distinct southeast–northwest spatial orientation, with their distribution centroid demonstrating a pivotal shift around 2010—progressing northwestward during 1980–2010 before reversing southeastward from 2010 to 2020.
(3)
Between 1980 and 2020, Beichuan County experienced an overall reduction in cultivated land fragmentation. Low-lying townships maintained relatively intact landscape patterns, contrasting with more fragmented configurations in high-altitude mountainous zones. The fragmentation pattern transitioned from predominantly medium levels during 1980–2000 to predominantly medium low and low levels in the 2010–2020 period.
(4)
In areas with lower elevations and gentler slopes, the cultivated land area primarily decreased, accompanied by reduced fragmentation. In contrast, higher-elevation regions experienced both a decrease in cultivated land area and an increase in fragmentation.

4.2. Discussion

This study systematically examines the spatiotemporal dynamics of cultivated land in Beichuan County through temporal, spatial, and inter-land-type relationship analyses, including transfer direction patterns. The findings demonstrate a cyclical compensation pattern shifting from equilibrium to disequilibrium and returning to equilibrium between 1980 and 2020, with cultivated land transfers occurring among woodland, grassland, and urban construction areas. Employing landscape pattern indices, this study evaluates cultivated land fragmentation through spatial scale, spatial agglomeration, and shape regularity analyses. The findings reveal a distinct northwest-southeast fragmentation gradient in Beichuan County, with more severe fragmentation in northwestern regions. Moreover, cultivated land area fluctuations exhibit significant correlations with fragmentation intensity, demonstrating elevation- and slope-dependent variations among townships. This study provides a comprehensive understanding of cultivated land changes in townships of Beichuan County. Based on the integration of comprehensive land consolidation principles and field investigation data, this study puts forward specific policy suggestions for optimizing cultivated land management practices in Beichuan County.
(1)
In areas with lower elevations and relatively flat terrain, cultivated land patches are larger and more conducive to farming. However, during economic development, some cultivated land has been converted to construction land. To resolve this issue, rigorous enforcement of the cultivated land protection policy should be implemented, while simultaneously advancing high-standard farmland development and upgrading agricultural infrastructure in the area. A comprehensive water conservancy system should be established, including agricultural irrigation water sources, irrigation distribution, and drainage. Field roads should be improved to enhance accessibility and meet the requirements for agricultural machinery passage.
(2)
In high-altitude regions, cultivated land exhibits dispersed spatial patterns with severe fragmentation and inadequate supporting facilities, resulting in significantly diminished agricultural productivity. Therefore, restructuring farmland configurations to establish consolidated and fully equipped core agricultural zones becomes imperative.
(3)
To mitigate cultivated land loss, systematic and evidence-based land supplementation strategies must be implemented, encompassing expansion of productive farmland, transfer of underutilized woodland/grassland, maximization of new cultivated land potential, and sustainable utilization of reserved land resources.
(4)
The northwestern region of Beichuan County is characterized by elevated terrain and pronounced slope gradients. Development initiatives in these areas should be tailored to local conditions to ensure rational utilization while preventing soil erosion, protecting wildlife, establishing robust ecological corridors and networks, and enhancing resilience to natural disasters.
In addition, this paper analyzes the cultivated land area and cultivated land fragmentation in Beichuan County by combining topographic factors such as altitude and slope, but the influencing mechanism is rarely mentioned. The influencing mechanism of cultivated land fragmentation is affected by a variety of factors, which is a very complex process. Therefore, in order to provide scientific suggestions for promoting cultivated land consolidation in Beichuan County and mountainous counties, future paper will use a newer method to explore the influencing factors and mechanisms of cultivated land fragmentation in Beichuan County more deeply, which will also be the next research direction of future papers.

Author Contributions

Writing—review & editing, M.L., F.W., C.M., R.X., H.Y. and M.W. All authors have read and agreed to the published version of the manuscript.

Funding

This research was funded by the National Natural Science Foundation of China (42201198) and Gansu Province Youth Doctoral Support Project (2024QB-001).

Data Availability Statement

The raw data supporting the conclusions of this article will be made available by the authors on request.

Conflicts of Interest

The authors declare no conflict of interest.

References

  1. Smith, P.; Martino, D.; Cai, Z.; Gwary, D.; Janzen, H.; Kumar, P.; McCarl, B.; Ogle, S.; O’Mara, F.; Rice, C.; et al. Greenhouse gas mitigation in agriculture. Ser. B Biol. Sci. 2008, 363, 789–813. [Google Scholar] [CrossRef] [PubMed]
  2. Smith, K.R.; Waring, B.G. Broad-scale patterns of soil Carbon (C) pools and fluxes across semiarid ecosystems are linked to climate and soil texture. Ecosystems 2018, 22, 742–753. [Google Scholar] [CrossRef]
  3. Lu, L.; Han, X.; Zhu, J.; Lv, L.; Sui, X. Assessing Spatiotemporal Dynamics and Future Projections of Land Use Conflicts in Metropolitan Areas under Climate Change. Appl. Spat. Anal. Policy 2025, 18, 1–35. [Google Scholar] [CrossRef]
  4. Yan, Y.; Yang, W.; Mo, J.; Rao, Y.; Huang, Y.; Zhang, J. Spatio-temporal evolution of cultivated land carbon storage and Identification of carbon sink areas in the Karst Region of Yunnan, Guangxi and Guizhou. J. Wuhan. Univ.(Nat. Sci. Ed.) 2025, 71, 53–61. [Google Scholar]
  5. Zhou, B.; Aggarwal, R.; Wu, J.; Lv, L. Urbanization-associated farmland loss:A macro-micro comparative study in China. Land Use Policy 2021, 101, 105228. [Google Scholar] [CrossRef]
  6. Yuan, C.; Zhang, D.; Liu, L.; Ye, J. Regional characteristics and spatial-temporal distribution of cultivated land change in China during 2009–2018. Trans. Chin. Soc. Agric. Eng. 2021, 37, 267–278. [Google Scholar]
  7. Zhao, A.; Peng, C.; Xu, S.; Zeng, W.; Ma, X. Impact of farmland conversion grain output under the ecological constraint:based in the Northeast of China. China Popul. Resour. Environ. 2017, 27, 124–131. [Google Scholar]
  8. Liu, J.; Jin, X.; Xu, W.; Wang, S.; Zhou, Y. Characteristic evolution and trend prediction of cultivated land landscape fragmentation in China from 1990 to 2020. Acta Geogr. Sin. 2023, 78, 2163–2185. [Google Scholar]
  9. Ge, Y.; Zhao, Y.; Ren, H. The effect of farmland fragmentation on the intensity of farmland in different utilization ways. Adv. Earth Sci. 2020, 35, 180–188. [Google Scholar]
  10. Li, Y.; Yang, X.; Cheng, C.; Wang, J. Spatial features of occupation and supplement cropland based on topographic factors in China from 2008–2010. Resour. Sci. 2012, 34, 1671–1680. [Google Scholar]
  11. Yuan, J.; Chen, W.; Zeng, J. Spatio-temporal differentiation of cropland use change and its impact on cropland NPP in China. J. Nat. Resour. 2023, 38, 3135–3149. [Google Scholar] [CrossRef]
  12. Cao, S.; Jin, X.; Yang, X.; Xiang, X.; Xu, C.; Sui, X.; Liu, M.; Zhou, Y. Multidimensional evaluation of the influence of agricultural land consolidation on the fragmentation of cultivated land:Method and demonstration. J. China Agric. Universtiy 2019, 24, 157–167. [Google Scholar]
  13. Liu, J.; Jin, X.; Xu, W.; Yang, X.; Cao, S.; Xu, C.; Sui, X.; Liu, M.; Zhou, Y. Evaluation of Cultivated Land Fragmentation and Guidance of Land Consolidation at Provincial Level. Sci. Geogr. Sin. 2019, 39, 817–826. [Google Scholar]
  14. Chen, W.; Duan, B.; Zeng, J. Spatial differentiation and influencing factors of cultivated landscape fragmentation in China from 1980 to 2020. Trans. Chin. Soc. Agric. Eng. 2024, 40, 221–231. [Google Scholar]
  15. Liu, J.; Jin, X.; Xu, W.; Zhou, Y. Influence mechanism of cultivated land fragmentation on sustainable intensification and its governance framework. Acta Geogr. Sin. 2022, 77, 2703–2720. [Google Scholar]
  16. Wei, P.; Yu, D.; Hu, Y.; Hu, H.; Sun, K. Evaluating cultivated land fragmentation and remediation zoning under planning management. Trans. Chin. Soc. Agric. Eng. 2024, 40, 283–293. [Google Scholar]
  17. Wang, Z.; Lv, Q.; Wu, Y.; Wang, Y. The impact of cultivated land fragmentation on part-time behavior of farmers in China. China Land Sci. 2024, 38, 73–83. [Google Scholar]
  18. Zheng, L.; Chen, Z. Impacts of land fragmentation on farmers’ farmland abandonment and its governance optimization. Geogr. Res. 2024, 43, 200–213. [Google Scholar]
  19. Ntihinyurwa, P.D.; de Vries, W.T. Farmland fragmentation concourse: Analysis of scenarios and research gaps. Land Use Policy 2021, 100, 104936. [Google Scholar] [CrossRef]
  20. Lin, X.; Fu, H. Spatial-temporal evolution and driving forces of cultivated land based on the PLUS Model: A case study of Haikou City, 1980–2020. Sustainability 2022, 14, 14284. [Google Scholar] [CrossRef]
  21. Wang, X. Changes in cultivated land loss and landscape fragmentation in China from 2000 to 2020. Land 2022, 11, 684. [Google Scholar] [CrossRef]
  22. Liu, J.; Jin, X.; Xu, W.; Zhou, Y. Evolution of cultivated land fragmentation and its driving mechanism in rural development: A case study of Jiangsu Province. J. Rural. Stud. 2022, 91, 58–72. [Google Scholar] [CrossRef]
  23. Wang, Z.; Wu, J.; Bai, S.; Wang, H.; Chen, Y. Evaluation of cultivated land fragmentation and land consolidation engineering zoning in the loess hilly and gully region—A case study in Wuqi County. Res. Soil Water Conserv. 2022, 29, 300–307. [Google Scholar]
  24. He, Y.; Lin, X.; Cai, X.; Du, Z. Spatial pattern evolution of ecological land use before and after the earthquake in Beichuan County. J. China West Norm. Univ. (Nat. Sci.) 2024, 45, 381–387. [Google Scholar]
  25. Liang, X.; Wang, M.; Liu, K. Impact evaluation of Wenchuan earthquake on land use and land cover change in typical striken areas. Saf. Environ. Eng. 2020, 27, 104–111. [Google Scholar]
  26. Lv, N.; Guo, Y.; Peng, Q.; Yin, F.; Zhang, J.; Liu, X.; Zeng, M.; Xu, Z. Spatiotemporal evolution characteristics and contributing factors of the carbon effect in cultivated land use in Xinjiang. Arid. Zone Res. 2025, 42, 179–190. [Google Scholar]
  27. Liu, J.; Ning, J.; Kuang, W.; Xu, X.; Zhang, S.; Yan, C.; Li, R.; Wu, S.; Hu, Y.; Du, G.; et al. Spatio-temporal patterns and characteristics of land-use change in China during 2010–2015. Acta Geogr. Sin. 2018, 73, 789–802. [Google Scholar]
  28. Zadeh, L.A. Fuzzy logic. In Granular, Fuzzy, and Soft Computing; Springer: Berlin/Heidelberg, Germany, 2009; pp. 19–49. [Google Scholar]
  29. Wang, M.; Wang, Y.; Liu, A.; Dong, Y.; Mao, J. Risk analysis and heterogeneity of negative population growth in China’s urban agglomerations under the effect of endogenous and exogenous Growth. Trop. Geogr. 2024, 44, 583–595. [Google Scholar]
Figure 1. Study area.
Land 14 01395 g001
Figure 2. Average elevation and slope of townships.
Land 14 01395 g002
Figure 3. Proportion of transfer of cultivated land to other land types from the 1980 to 2020.
Land 14 01395 g003
Figure 4. Land transfer between cultivated land and other land types across different periods.
Land 14 01395 g004
Figure 5. Standard deviation ellipses and gravity center shifts of cultivated land transfer-in and transfer-out. Note: The arrows indicate the direction in which the center of gravity is moving.
Land 14 01395 g005
Figure 6. Fragmentation characteristics of cultivated land landscape.
Land 14 01395 g006
Figure 7. Changes in classification transfers. Note: 1 indicates “Low”, 2 indicates “Medium-low”, 3 indicates “Medium”, 4 indicates “Medium-high”, and 5 indicates “High”.
Land 14 01395 g007
Figure 8. Relationship between changes in cultivated land area and fragmentation.
Land 14 01395 g008
Table 1. The 10 landscape pattern metrics selected.
Multi-AttributesIndex NameIndex Description
Resource size index (RSI)Mean patch size (MPS)Average area of all cultivated land patches in the landscape
Total area (TA)Sum of the areas of all cultivated land patches in the landscape
Patch density (PD)Number of cultivated land patches per unit area
Splitting index (SPLIT)Used to measure the extent to which cultivated land is fragmented into separate patches, with higher values indicating a greater number of patches or more dispersed areas
Spatial agglomeration index (SAI)Mean proximity index (MPI)Spatial proximity between cultivated land patches, used to evaluate the clustering or dispersion of patch distribution
Mean Euclidean nearest-neighbor distance (MENN)Used to quantify the average geometric distance between neighbors of cultivated land, reflecting the clustering or dispersion of distribution
Number of patches (NP)Used to measure the number of cultivated land patches in the region
Landscape division index (LDI)Used to reflect the extent to which cultivated land is fragmented into patches, with a range of (0,1), where a value closer to 1 indicates a more fragmented landscape
Shape regularity index (SRI)Mean shape index (MSI)A measure of the complexity of the shape of cultivated land patches, usually by calculating the ratio of patch perimeter to area, with larger values indicating more complex patch shapes and smaller values indicating more regular shapes
Landscape shape index (LSI)A measure of the complexity of the shape of cultivated land, with larger values indicating more irregular patch shapes and higher boundary complexity, and smaller values indicating more regular shapes
Table 2. Transfers in and out of cultivated land and other land (%).
WoodlandGrasslandWaterConstruction LandUnused Land
Transfer-out 1980~19900.110.000.000.080.00
1990~20001.300.050.000.100.00
2000~201010.134.400.260.430.59
2010~202014.980.810.291.630.06
Transfer-in1980~19900.110.000.000.000.00
1990~20002.040.020.010.000.00
2000~201015.221.710.050.060.00
2010~202015.200.690.270.300.08
Note: The transfer-out ratio represents the percentage relative to cultivated land area in the year, while the transfer-in ratio denotes the percentage relative to cultivated land area.
Table 3. Classification criteria for RSI, SAI, SRI, and CLFI.
RSISAISRICLFI
Low<0.440<0.465<0.479<0.490
Medium–low[0.440,0.475)[0.465,0.480)[0.479,0.493)[0.490,0.501)
Medium[0.475,0.494)[0.480,0.492)[0.493,0.512)[0.501,0.514)
Medium–high[0.494,0.520)[0.492,0.507)[0.512,0.541)[0.514,0.531)
High≥0.520≥0.507≥0.541≥0.531
Disclaimer/Publisher’s Note: The statements, opinions and data contained in all publications are solely those of the individual author(s) and contributor(s) and not of MDPI and/or the editor(s). MDPI and/or the editor(s) disclaim responsibility for any injury to people or property resulting from any ideas, methods, instructions or products referred to in the content.

