Article

Spatiotemporal Evolution and Proximity Dynamics of “Three-Zone Spaces” in Yangtze River Basin Counties from 2000 to 2020

1
School of Urban Design, Wuhan University, Wuhan 430072, China
2
Hubei Provincial Engineering Research Center of Waterfront Space Planning and Design, Wuhan 430062, China
3
Changjiang Survey, Planning, Design and Research Co., Ltd., Wuhan 430062, China
4
School of Resource and Environmental Sciences, Wuhan University, 129 Luoyu Road, Wuhan 430079, China
*
Author to whom correspondence should be addressed.
Land 2025, 14(7), 1380; https://doi.org/10.3390/land14071380
Submission received: 29 April 2025 / Revised: 1 June 2025 / Accepted: 16 June 2025 / Published: 30 June 2025

Abstract

As the world’s third-longest river supporting 40% of China’s population, the Yangtze River Basin exemplifies the critical challenges of balancing riparian development and ecological resilience for major fluvial systems globally. This study analyzed the spatiotemporal evolution, proximity dynamics to the Yangtze River, and driving mechanisms of the “three types of spaces” (urban, agricultural, and ecological) in 130 counties along the Yangtze River mainstem from 2000 to 2020, utilizing an integrated approach incorporating land use transfer matrices, centroid-based distance metrics and GeoDetector models. Key findings reveal: (1) Urban space exhibited significant irreversible expansion while agricultural space continued to shrink, with ecological space maintaining overall stability but showing high-frequency bidirectional conversion with agricultural areas in localized zones. (2) Spatial proximity analysis demonstrated contrasting patterns—eastern riparian counties showed urban spatial agglomeration towards the river, whereas most mid-western regions experienced urban expansion away from the watercourse, with marked regional disparities in agricultural and ecological spatial changes. (3) Driving mechanism analysis identified topography as the dominant natural factor influencing ecological space evolution, while socioeconomic factors exerted stronger impacts on proximity variations of agricultural and urban spaces, with natural–socioeconomic interactive effects showing the most significant explanatory power. These spatial dynamics reflect universal trade-offs between economic development and ecosystem conservation in large river basins worldwide. We advocate differentiated spatial governance strategies, including rigorous riparian ecological redlines, eco-agricultural models in agricultural retreat zones, and proximity-based real-time monitoring for ecological early warning. The integrated methodology and spatial governance framework offer transferable solutions for sustainable management of major fluvial systems under rapid urbanization pressure. These findings provide scientific evidence and implementable pathways for coordinating socioeconomic development with ecosystem resilience in the Yangtze River Economic Belt.

1. Introduction

River basins are not isolated natural entities but dynamic symbiotic systems composed of both aquatic environments and the surrounding terrestrial land use [1]. The relationship between rivers and adjacent land is fundamentally intertwined, forming a coupled socioecological system where changes on land directly and indirectly shape riverine processes. Conversely, rivers also influence adjacent terrestrial ecosystems and human land use patterns through natural processes such as flooding, sediment transport, and nutrient cycling [2,3]. This reciprocity underscores the fact that river systems and land use patterns should be viewed not as separate analytical domains but as co-evolving systems with complex feedback loops.
The interdependence between terrestrial and riverine systems can be rigorously framed through the socioecological systems (SES) theory [4]. This perspective emphasizes the co-evolutionary dynamics between land use practices and river processes, particularly through three constitutive attributes: spatial gradients of interaction intensity [5], temporal legacy effects of historical interventions [6], and nonlinear feedback mechanisms [7]. Spatial gradients manifest as diminishing terrestrial influence on rivers with increasing distance from channels, yet paradoxically amplify systemic risks through hydrological connectivity—riparian zone modifications may locally alter sediment loads, while upstream deforestation can cascade into downstream flood regime shifts [8]. Temporally, human modifications to landscapes create persistent path dependencies that constrain contemporary river morphology and floodplain ecology [9]. Crucially, these interactions operate through thresholds rather than linear responses; agricultural intensification may temporarily enhance floodplain fertility through nutrient subsidies but, beyond critical phosphorus concentrations, abrupt shifts to hypereutrophic states destabilize aquatic ecosystems [10]. Such thresholds underscore the necessity of conceptualizing land–river systems as adaptive entities with emergent properties irreducible to their individual components.
In this symbiotic framework, land-based human activities such as urban development, agricultural expansion, and industrialization exert profound effects on river ecosystems. These activities alter hydrological regimes [11], degrade water quality [12], fragment aquatic habitats [13], and modify river morphology. For example, urban construction near riverbanks increases impervious surfaces, accelerates stormwater runoff, and reduces infiltration, thereby exacerbating flooding and pollutant transport into river channels [14]. Agricultural practices near rivers often involve the use of fertilizers and pesticides, which, when carried by surface runoff, contribute to eutrophication and disrupt aquatic biodiversity [15]. These processes not only harm the ecological integrity of rivers but also pose serious risks to human well-being through water insecurity, reduced ecosystem services, and increased vulnerability to extreme events [16,17].
While SES theory emphasizes integrated land–river dynamics, prevailing methodologies remain fragmented. Much of the current literature focuses narrowly on the “riparian effect”—assessing land use changes within a fixed buffer zone near rivers [18,19]—and employs tools such as land use transfer matrices [20] and landscape pattern [21] indices to describe land cover transitions and spatial arrangements. While these methods have enhanced our understanding of land use dynamics and their ecological implications, they frequently overlook the gradient nature of land–river interactions and the importance of spatial proximity as a dynamic variable. By treating river systems as static boundaries and ignoring the varying degrees of influence that distance exerts on ecological processes, such studies risk underestimating or misrepresenting the actual environmental impact of land use [22,23]. Moreover, the ecological consequences of land use are not only determined by the extent or type of land conversion but, more importantly, by the spatial configuration and proximity to river channels. The multiplier effect of land use intensity and distance from rivers means that even small-scale developments can exert disproportionately large impacts when located closer to riverbanks [24]. This effect is particularly pronounced in urban [25] and agricultural [26] contexts, where land use intensity tends to be high. Therefore, focusing solely on land use scale without accounting for distance neglects a key dimension of ecological impact and limits our capacity to design effective management strategies.
To address these conceptual and methodological gaps, this study turns to the Yangtze River Economic Belt (YREB), one of China’s most ecologically and economically significant regions. The YREB has experienced rapid urbanization, agricultural restructuring, and industrial development over the past two decades [27,28], placing immense pressure on its riverine ecosystems. Under China’s “ecological civilization” policy and the strategic mandate of “putting ecological conservation first” [29], the sustainable management of land–river interactions in the YREB has become a national priority. However, the spatial relationship between land use types—particularly urban, agricultural, and ecological land—and their proximity to the Yangtze River has not been systematically analyzed. Furthermore, little is known about the socioeconomic drivers behind these spatial dynamics, such as GDP growth, population density, infrastructure expansion, and policy interventions.
This research thus aims to fill a crucial knowledge gap by examining how the distance between various land use types and the Yangtze River has changed over time and how these changes are driven by underlying socioeconomic factors. By integrating spatial analysis techniques, such as land use transfer matrices and the geographical detector model, this study not only provides new insights into the spatial patterns and interactions between land systems and river ecosystems but also contributes to a broader theoretical framework that bridges landscape ecology, land use science, and river basin management. The Yangtze River, as China’s longest and most iconic river, serves as a vital testbed for exploring new paradigms in integrated land–river governance.
To this end, we use detailed land use data from 2000 to 2020 across the YREB to answer three core questions: (1) What are the interaction mechanisms between land use changes—specifically in urban, agricultural, and ecological spaces—and their spatial distribution relative to the Yangtze River? (2) What are the main driving forces influencing the changing distance of these land use types from the river, and how do socioeconomic factors mediate these changes? (3) What strategic policy measures and planning tools can be employed to optimize land use distribution and enhance ecological resilience in the river basin? By addressing these questions, this study aims to contribute to both theoretical advancement and practical policy-making in the realm of sustainable land and water resource management.

2. Materials and Methods
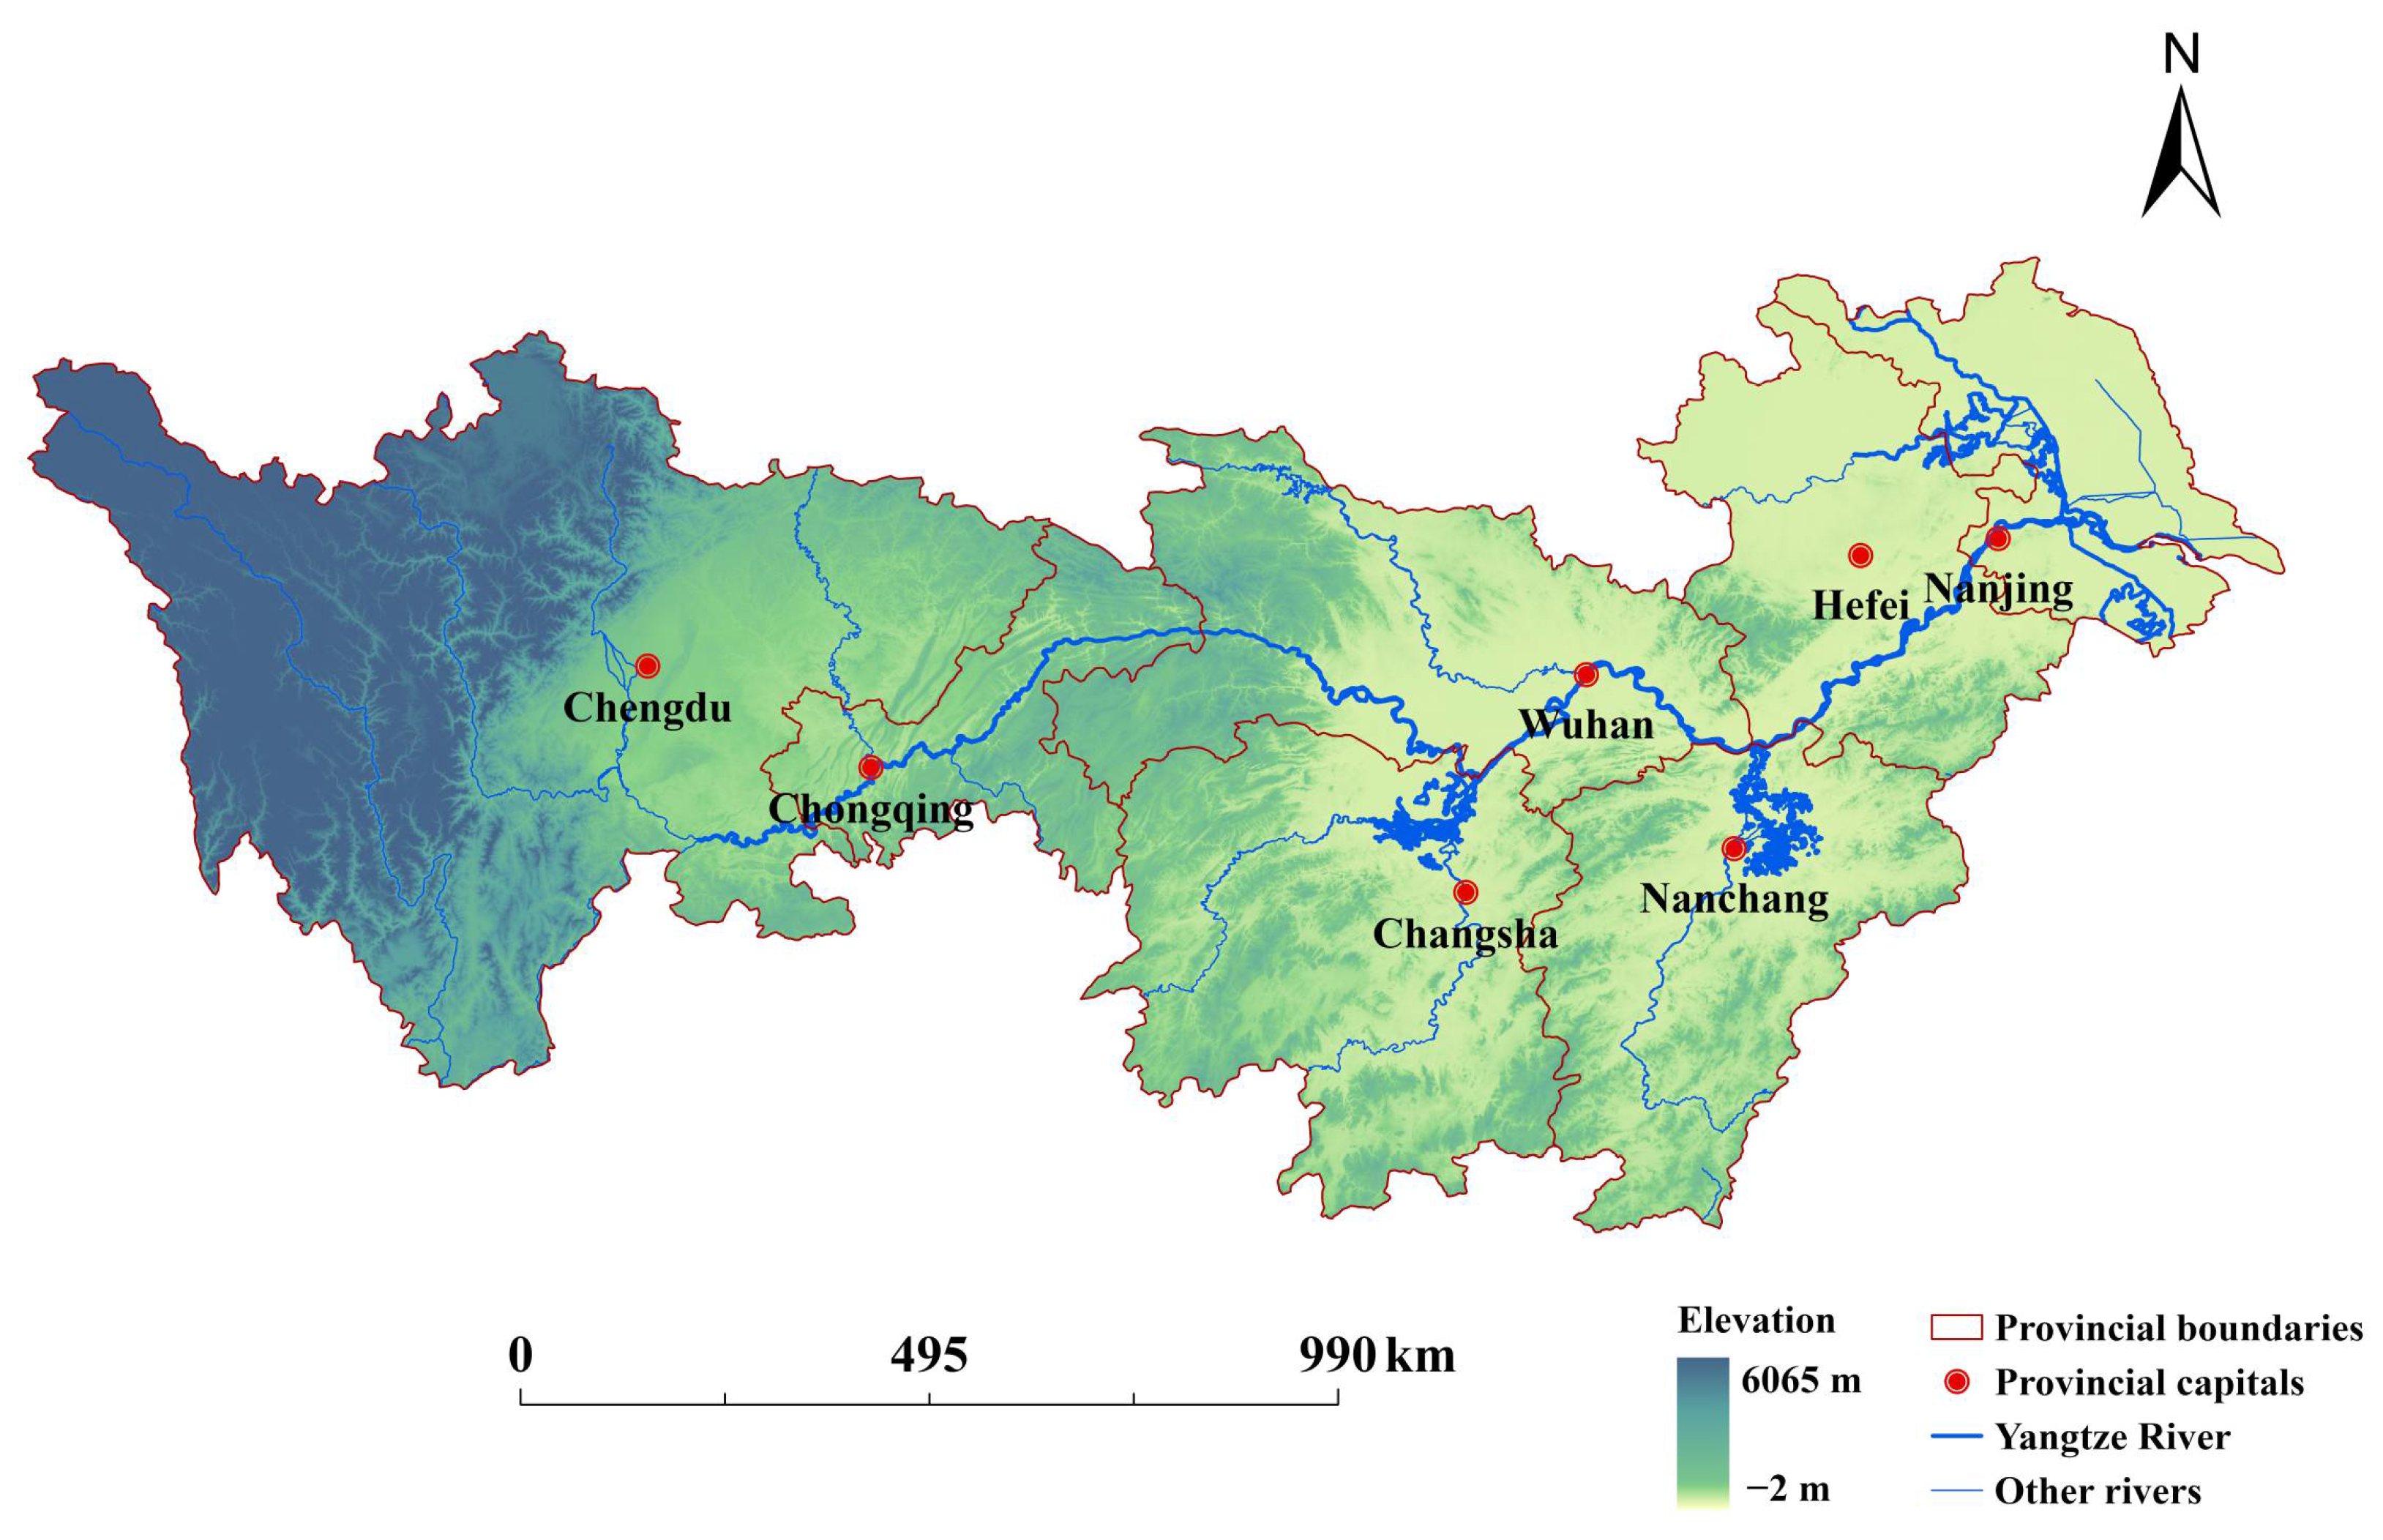
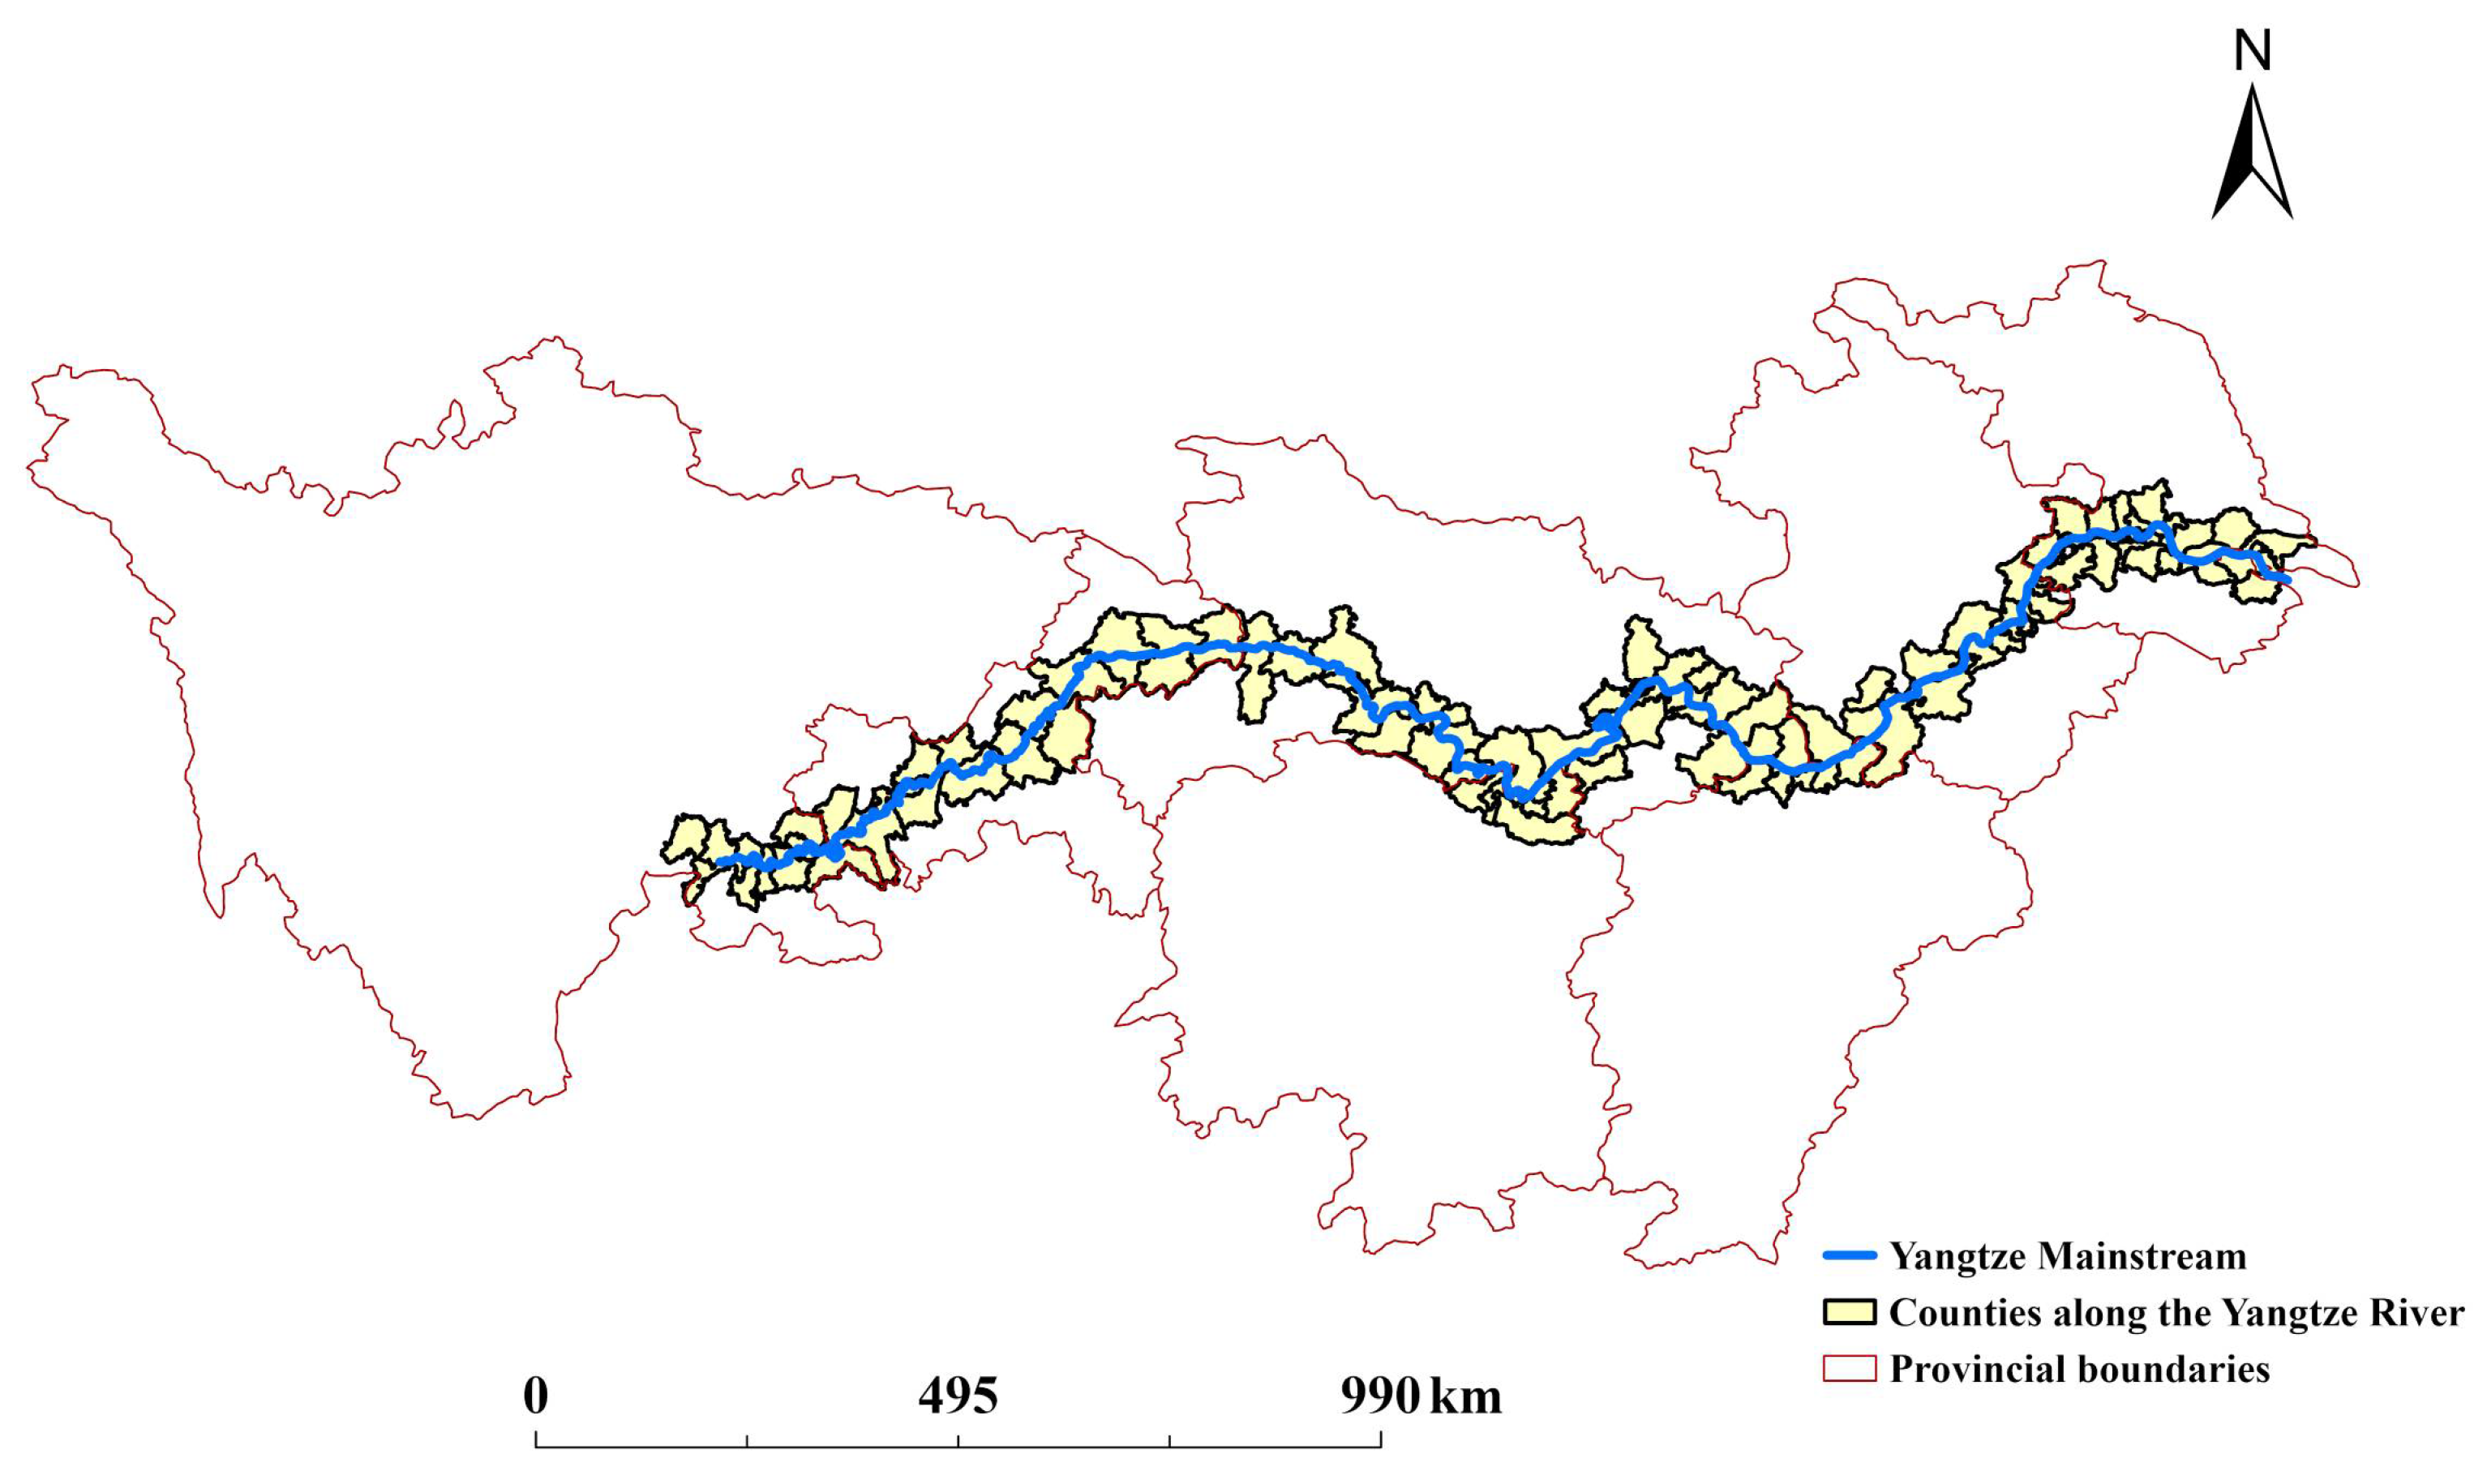
2.1. Study Area

The study area includes 130 county-level administrative units directly adjacent to the main stream of the Yangtze River, covering approximately 130,000 square kilometers with diverse landscapes such as plains, hills, and riverine ecosystems. According to the geographical pattern of the river basin (Figure 1), it is divided into three typical sections. The lower reach includes counties such as Gulou (Nanjing, Jiangsu) and Wuhu (Anhui), featuring coastal lowlands over 70% urbanization rate, functioning as global manufacturing hubs and shipping gateways. The middle reach encompasses counties like Jiang’an (Wuhan, Hubei) and Jiujiang (Jiangxi), dominated by Jianghan and Poyang Lake plains that produce around 10% of China’s grain. The upper reach is represented by Yuzhong (Chongqing) and Luzhou (Sichuan), situated in Sichuan Basin and the Three Gorges region’s mountainous terrain, serving as national ecological barriers with topography-constrained urbanization. This region was selected for its strong representativeness of land–river interactions, where proximity to the Yangtze allows clear observation of how urban expansion, agricultural development, and ecological conservation affect the river system. As a core area of the Yangtze River Economic Belt (YREB), it also faces intensified land use conflicts driven by rapid economic growth and population increase. The selected counties exhibit significant variation in land use patterns and ecological conditions, making them ideal for analyzing spatial heterogeneity and drivers of land use change (Figure 2). This study focuses on the period from 2000 to 2020, which encompasses rapid urbanization and the implementation of key ecological policies such as the “Yangtze River Great Protection” strategy. This 20-year span provides sufficient temporal depth to analyze long-term land use trends and their cumulative ecological impacts, while enabling the use of reliable remote sensing and statistical data.

2.2. Data Sources

The primary data used in this study is the GLC_FCS30D dataset, the first global 30 m land-cover dynamics monitoring product with a fine classification system for the period from 1985 to 2022, generated using dense-time-series Landsat imagery and the continuous change-detection method [30]. This dataset provides high-precision land cover information, serving as the basis for identifying urban, agricultural, and ecological spaces and enabling detailed analysis of land use changes and their spatial distribution. For the study of spatial distance change mechanisms, data describing socioeconomic development were obtained from statistical yearbooks at the prefecture and county levels. These yearbooks provide detailed information on socioeconomic indicators such as population, GDP, and industrial output, offering critical insights into the driving factors behind land use changes. Additionally, digital elevation model (DEM) data for the Yangtze River Economic Belt (YREB) were utilized to extract information on average elevation, slope, and terrain relief. These topographic data provide essential support for analyzing the spatial configuration of land use and its ecological impacts. Finally, administrative boundaries, government locations, roads, and river networks were obtained from the 1:1 million Chinese-based geographic database (www.webmap.cn, accessed on 25 December 2024). This database provides accurate and up-to-date spatial data, laying a solid foundation for mapping and spatial analysis in this study.

2.3. Methods

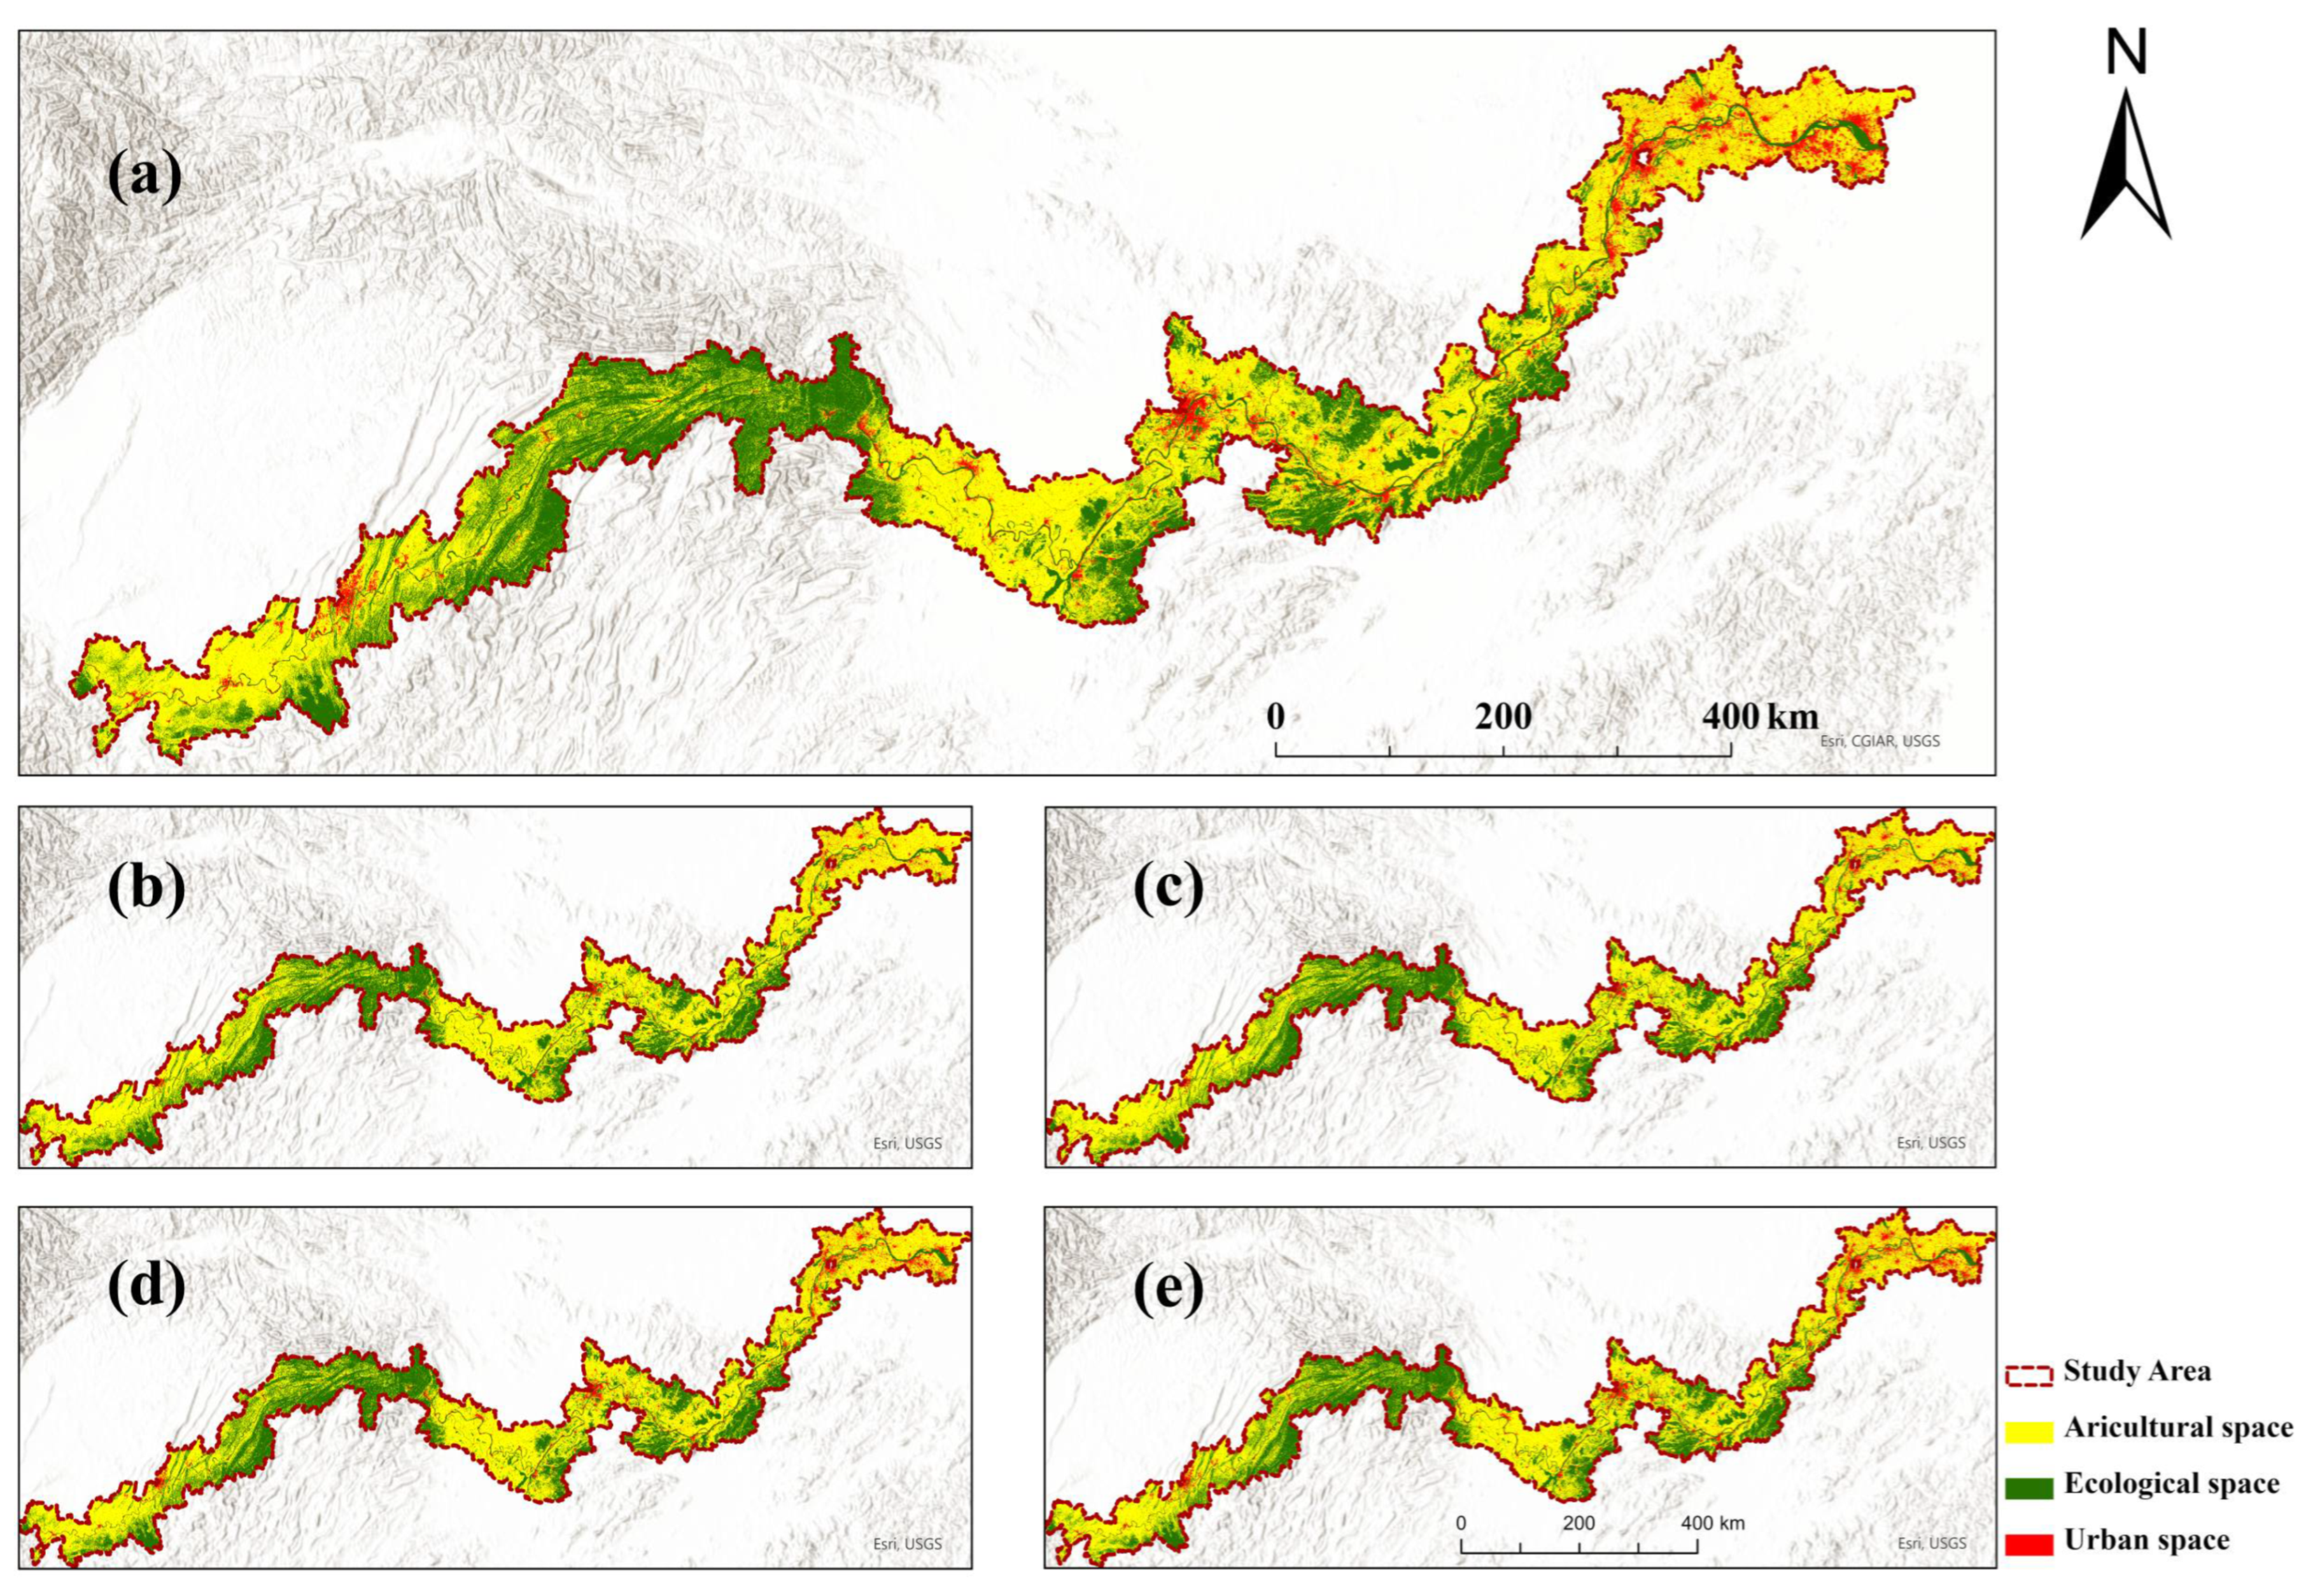
2.3.1. Identification of Urban–Agricultural–Ecological Spaces

Most studies on Urban–Agricultural–Ecological spaces use land use reclassification as the foundational map. Generally, urban spaces primarily include artificial surfaces, while agricultural spaces mainly refer to croplands capable of producing significant amounts of food. Other types, such as forests and grasslands, are classified as ecological spaces. Based on the GLC_FCS30D data for the study area, this research establishes a transition path to construct the “three-zone space” (Table 1). Specifically, agricultural spaces are dominated by croplands and include some planted grasslands; ecological spaces are primarily composed of forests and water bodies; and urban spaces are characterized by impervious surfaces [31,32].
To generate the essential spatial dataset to investigate spatiotemporal patterns and support subsequent driver analysis, ArcGIS Pro software (version 3.1.5) was used to clip the GLC_FCS30D data according to the study area and perform reclassification operations based on the classification rules in Table 1 to derive the functional space types for each county-level unit within the region. This process not only ensures accurate spatial representation of land system transitions but also directly supports quantification of land use dynamics and distance-based proximity analysis.

2.3.2. The Transfer Matrix of Space Change

The land use transfer matrix was selected for its unparalleled capacity to quantify bidirectional transitions between discrete land categories, overcoming limitations of net-change analysis that masks gross flows [33,34]. Compared to Markov chain models, which emphasize probabilistic transitions, this deterministic approach provides explicit spatial accounting of gains/losses—critical for identifying dominant pathways in Urban–Agricultural–Ecological transformations [35]. Its application is well-established in land system studies [36].
The land use transfer matrix is a relationship matrix constructed based on the land use status of the same area at different times and is one of the most fundamental methods in land use research [37]. Based on the identification of Urban–Agricultural–Ecological spaces (denoted as U, A, and E, respectively), this study focuses on the mutual transformations among the three types of spaces, including the conversion from urban space to agricultural space (U → A), from urban space to ecological space (U → E), from agricultural space to urban space (A → U), from agricultural space to ecological space (A → E), from ecological space to urban space (E → U), and from ecological space to agricultural space (E → A).
P = S u u S u a S u e S a u S a a S a e S e u S e a S e e
where S i j denotes the transformed land use area ( i , j = u , a , e ) and u , a , e represent the urban, agricultural, and ecological spaces, respectively.

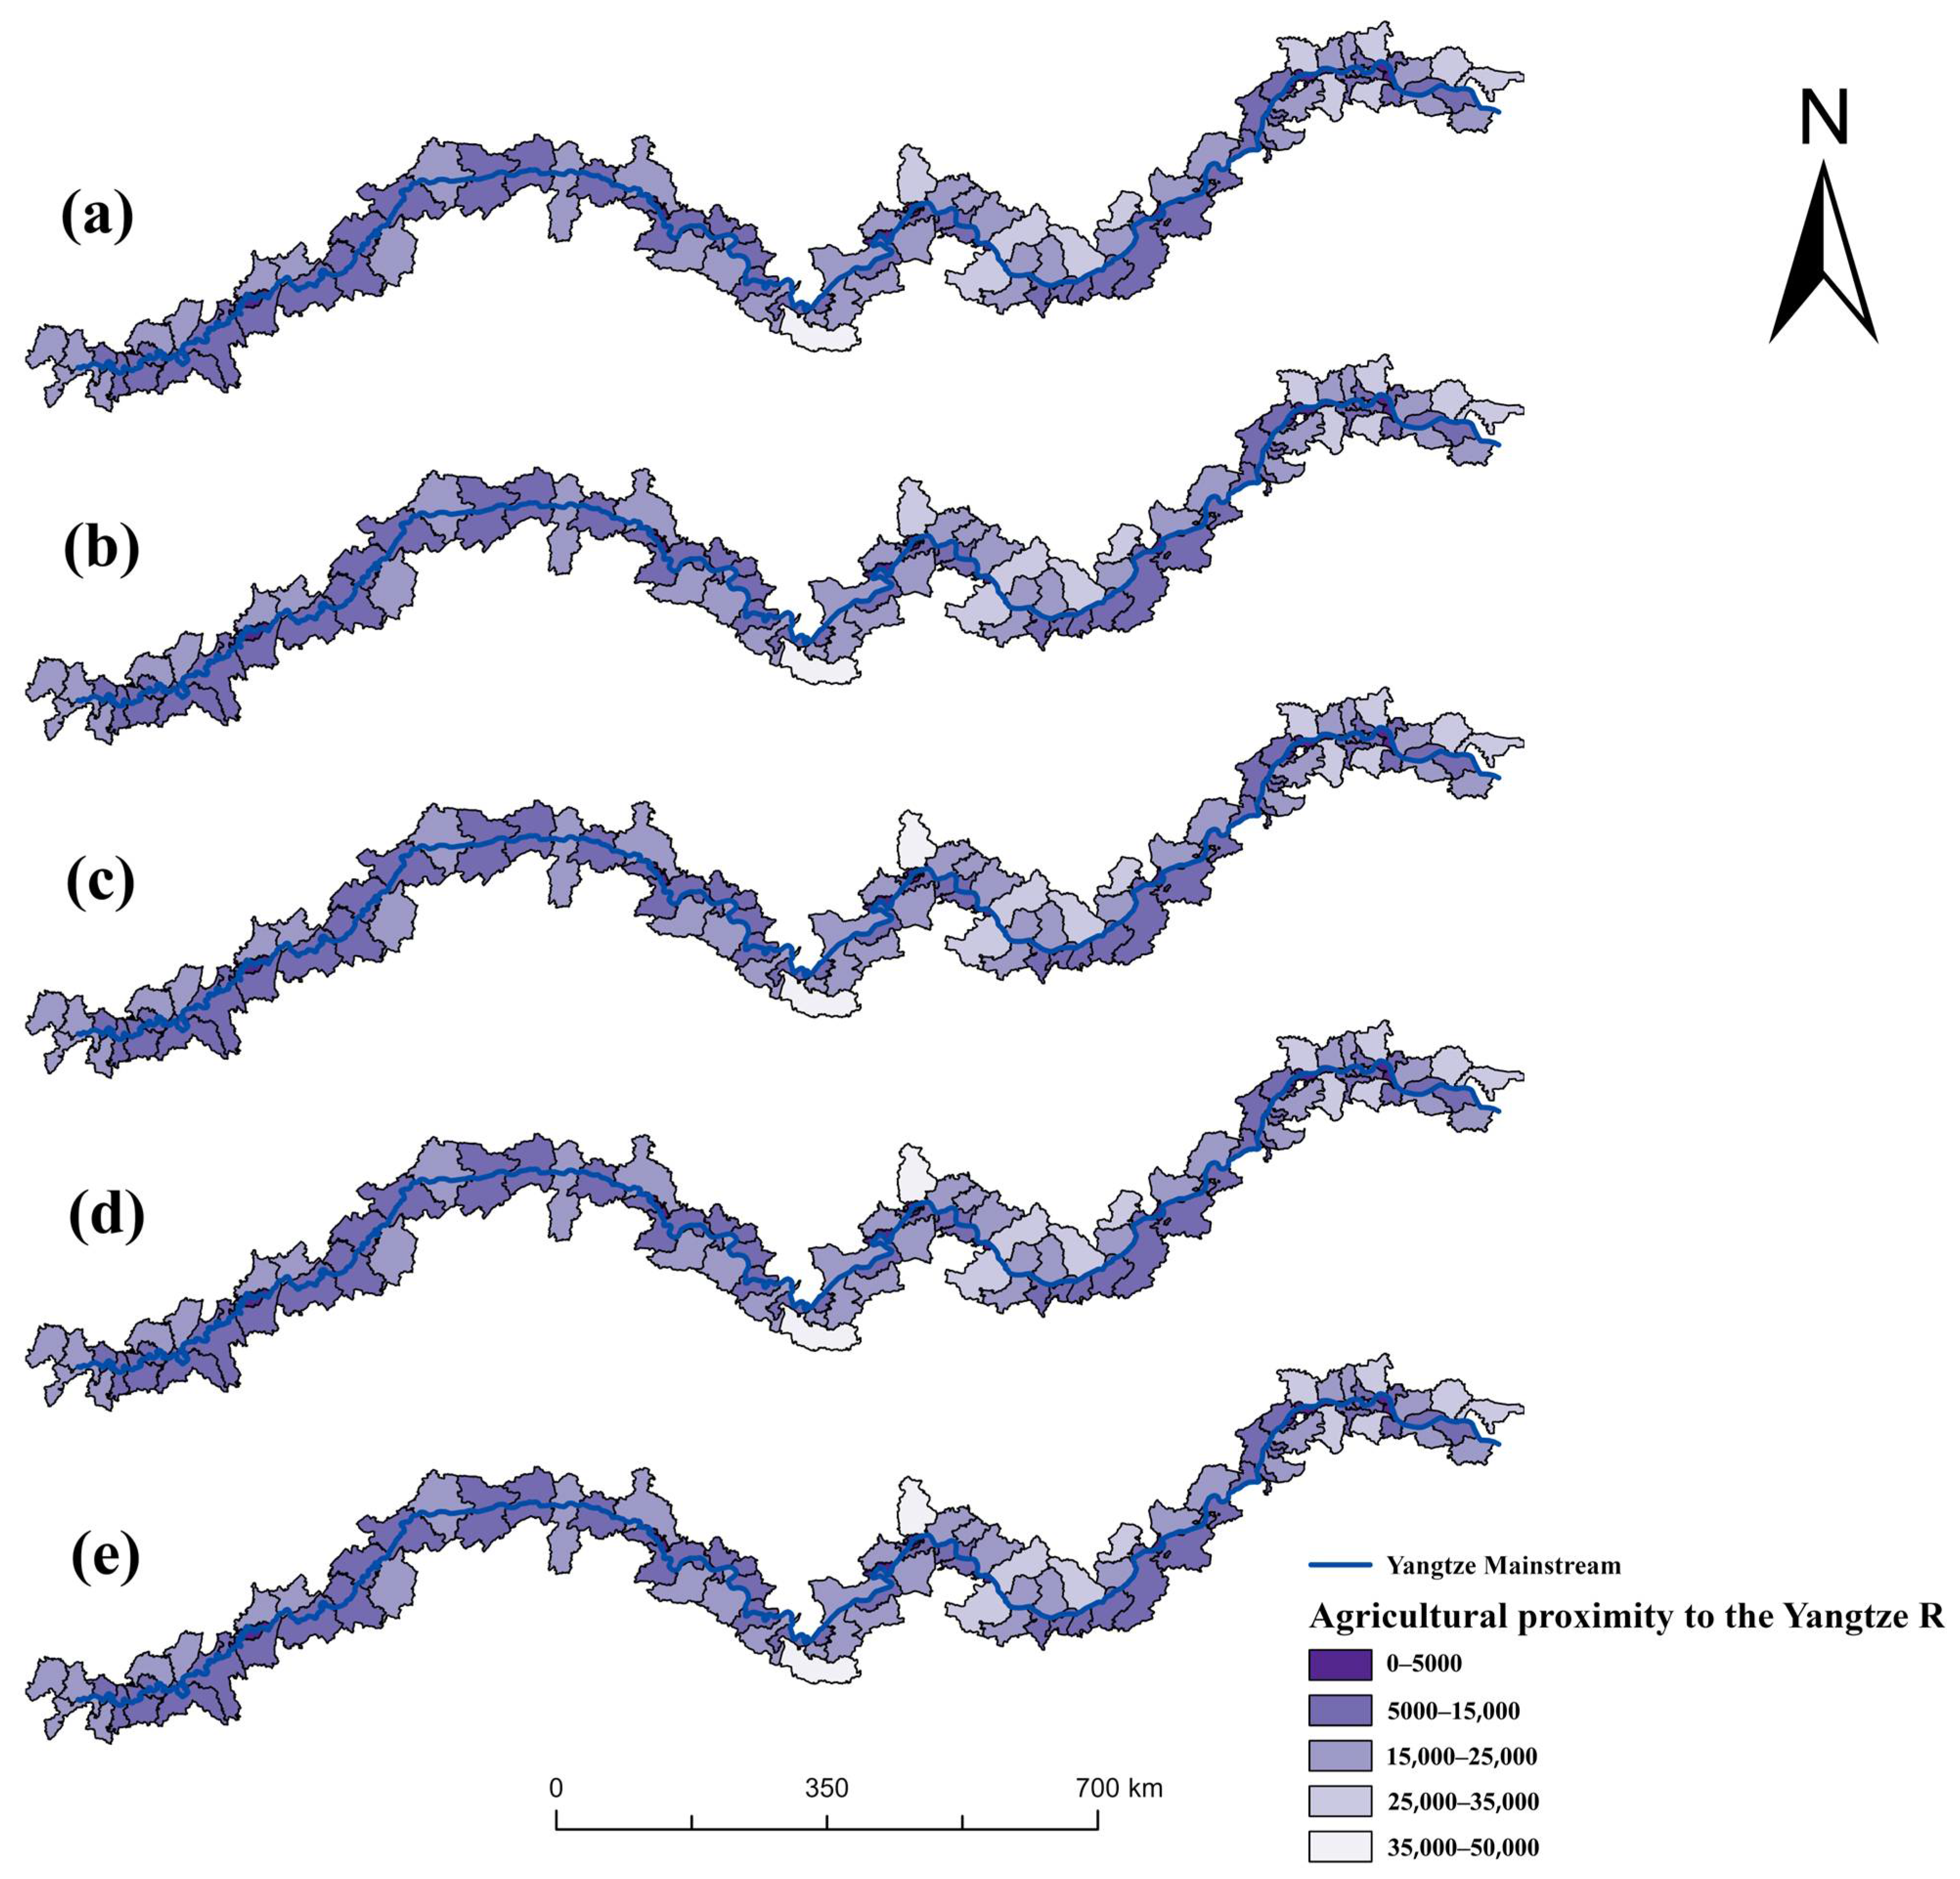
2.3.3. Calculation of the Distance Between the Three-Zone Space and the Yangtze River

To accurately assess the spatial relationship between different functional land spaces—urban, agricultural, and ecological—and the main stream of the Yangtze River, this study employed a centroid-based distance calculation method. Centroid-based distance metrics were prioritized over alternatives (e.g., buffer analysis or nearest-edge distance) to capture fine-grained spatial proximity [38,39]. While simpler methods like administrative-center-to-river distance introduce aggregation errors, our approach resolves microscale spatial heterogeneity through 100 m resolution raster processing, avoids geometric oversimplification by computing Euclidean distances from every cell [40], and enables temporally consistent comparisons via standardized averaging. This technique has proven effective in riparian land-change studies, balancing precision with computational feasibility [41]. Using urban space as an example, the land use data were first segmented based on the administrative boundaries of the 130 county-level units. The urban space raster data were then resampled to a 100 m spatial resolution to ensure consistency and precision in spatial analysis.
With the aid of Python (version 3.12) and its geospatial analysis libraries (such as rasterio, geopandas, shapely, and numpy), the centroid coordinates of each urban raster cell were extracted and represented as two-dimensional points x i , y i . The main stream of the Yangtze River was represented by its central polyline, denoted as a set of line points L = x j , y j . For each raster point P i = ( x i , y i ) , the shortest Euclidean distance to the river centerline was calculated as:
d i = m i n ( x j , y j ) L ( x i x j ) 2 + ( y i y j ) 2
These minimum distances were then averaged across all raster points within each county for each space type, yielding the mean distance to the Yangtze River at the county level:
D ¯ t y p e = 1 N i = 1 N d i
where N represents the number of raster cells in the given space type (urban, agricultural, or ecological) and D ¯ t y p e denotes the average distance from that space to the main stream of the Yangtze River.
This method was applied consistently across all three space types for the years 2000 to 2020, enabling a comprehensive temporal and spatial analysis of the land–river relationships. The advantages of this approach include high spatial resolution based on individual raster cells ensuring fine-grained measurement. The shortest-distance calculation avoids generalization errors from using simplified geometries. Averaging the distances provides a robust, comparable metric to analyze spatial proximity patterns over time and across space types, supporting deeper exploration of land use dynamics and their influence on the river system.

2.3.4. Optimal-Parameters-Based Geographical Detector (OPGD) Model

The Optimal Parameters Geographical Detector (OPGD) was chosen for its ability to handle categorical drivers and detect nonlinear interactions—a limitation of traditional regression models [42]. Unlike spatial econometrics requiring normality assumptions [43], OPGD’s q statistic nonparametrically quantifies factor influences through spatial heterogeneity matching [42]. Its interaction detector module uniquely reveals synergistic/antagonistic effects between drivers, essential for complex systems like the Yangtze Economic Belt. Extensive applications in land use driving force analysis validate its robustness [44,45].
The OPGD model operates on the principle that, if an independent variable significantly influences a dependent variable, their spatial distributions should exhibit similar patterns. In this study, the factor detector and interaction detector modules of the OPGD model were utilized to analyze the individual and combined effects of various factors on land use changes. The computational process was implemented using the “gdm()” function within the “GD” package in R (Version 4.2.3).
The factor detector module quantifies the extent to which an independent variable explains the spatial variation of a dependent variable. This is measured using the   q statistic, defined as:
q = 1 h = 1 L N h σ h 2 N σ 2
In this equation q ranges from 0 to 1, with higher values indicating a stronger influence of the independent variable on the dependent variable. Here, h represents the number of classifications or partitions of the independent variable, N h and N denote the number of units in layer h and the entire study area, respectively, and σ h 2   and σ 2 represent the variance in the dependent variable in layer h and the entire study area, respectively. The interaction detector module evaluates the combined effect of two independent variables on the dependent variable. This involves calculating the q values for individual factors and comparing them with the q values obtained after their interaction. The interaction can result in enhanced, independent, or weakened effects on the dependent variable, providing insights into the complex relationships between factors.
Regarding the selection of driving factors, previous studies have shown that the evolution of Urban–Agricultural–Ecological spaces is typically influenced by a combination of natural conditions and socioeconomic factors [46,47]. Natural geographical conditions (X1–X4)—particularly topographic controls like elevation (X1), slope (X2), and relief (X3)—fundamentally constrain land use suitability through hydrological regulation and erosion risks, as demonstrated in basin-scale studies [48]. Geographical location factors (X5–X6) capture core-periphery dynamics, where proximity to administrative centers drives policy implementation intensity and market accessibility, evidenced in Yangtze Economic Belt research [44]. Socioeconomic factors (X7–X18) were prioritized to reflect China’s development context, emphasizing industrial restructuring (X18), fiscal interventions (X13–X14), and agricultural transitions (X8, X10) as policy-mediated drivers unique to rapid urbanization regions [49]. Prior to conducting the geographical detector analysis, first-order differencing was applied to time-trended independent variables to remove linear trends, ensuring that the remaining variations more accurately reflect the true characteristics of spatial distribution. The names and data sources of the selected factors are presented in the table below (Table 2).

3. Results

3.1. Distribution Characteristics of Urban–Agricultural–Ecological Space

From 2000 to 2020, the distribution of urban, agricultural, and ecological spaces in the study area exhibited a stable pattern with distinct regional differentiation. Urban spaces were primarily concentrated in major cities and their surrounding regions, particularly in the lower reaches of the Yangtze River, as well as in core cities along the river such as Chongqing, Wuhan, and Nanjing, and along major transportation corridors. Agricultural spaces were mainly distributed in areas with favorable natural conditions, such as the Sichuan Basin, the Jianghan Plain, and the southern part of the North China Plain. Ecological spaces were predominantly located in mountainous and hilly regions, including the western high-altitude areas of Hubei Province and ecologically sensitive zones along the Yangtze River (Figure 3).
In terms of area changes, urban space increased significantly by 33,358 square kilometers from 2000 to 2020. Agricultural space decreased by 28,882 square kilometers, while ecological space remained relatively stable. Regarding proportional changes, the proportion of urban space increased from 3% in 2000 to 7% in 2020, reflecting a growth of 4 percentage points. The proportion of agricultural space declined from 61% in 2000 to 56% in 2020, a decrease of 5 percentage points. The proportion of ecological space remained consistently stable at approximately 37% throughout the period. This significant urban expansion primarily consumed agricultural land, driven by China’s rapid urbanization process, particularly in core cities and their radiating areas. The relative stability of ecological space proportion masks internal fluidity between agricultural and ecological zones, reflecting localized land competition (Table 3).
The land transition matrix analysis from 2000 to 2020 reveals distinct dynamics in Urban–Agricultural–Ecological space transformations (Table 4). Agricultural space served as the primary source of urban expansion, with the peak A → U conversion occurring during 2010–2015, aligning with accelerated urbanization. Cumulatively, A → U conversions accounted for 94.7% of the total urban space increment. Significant bidirectional transitions were observed between agricultural and ecological spaces; A → E conversions generally exceeded E → A reversions across intervals, resulting in a net A → E gain of 1304.7 km2. However, the surge in E → A conversions to 4147.7 km2 during 2010–2015 indicated localized encroachment on ecological zones. Urban spaces exhibited strong irreversibility, with cumulative U → A and U → E transitions totaling only 322.2 km2. Temporally, A → U conversions increased by 24.3% from 2005–2010 to 2010–2015 but declined after 2015. Despite stable ecological space proportions, internal transitions between E → A and A → E revealed high spatial fluidity, approaching a dynamic equilibrium. The dominance of A → U conversion underscores agricultural land as the main reservoir for urban growth during peak urbanization. The bidirectional A–E flow highlights the sensitivity of these spaces to land use policy and competition, while the irreversibility of urban space reflects the path dependence of built-up land development. The post-2015 decline in A → U rate may relate to policy interventions like ecological conservation emphasis.

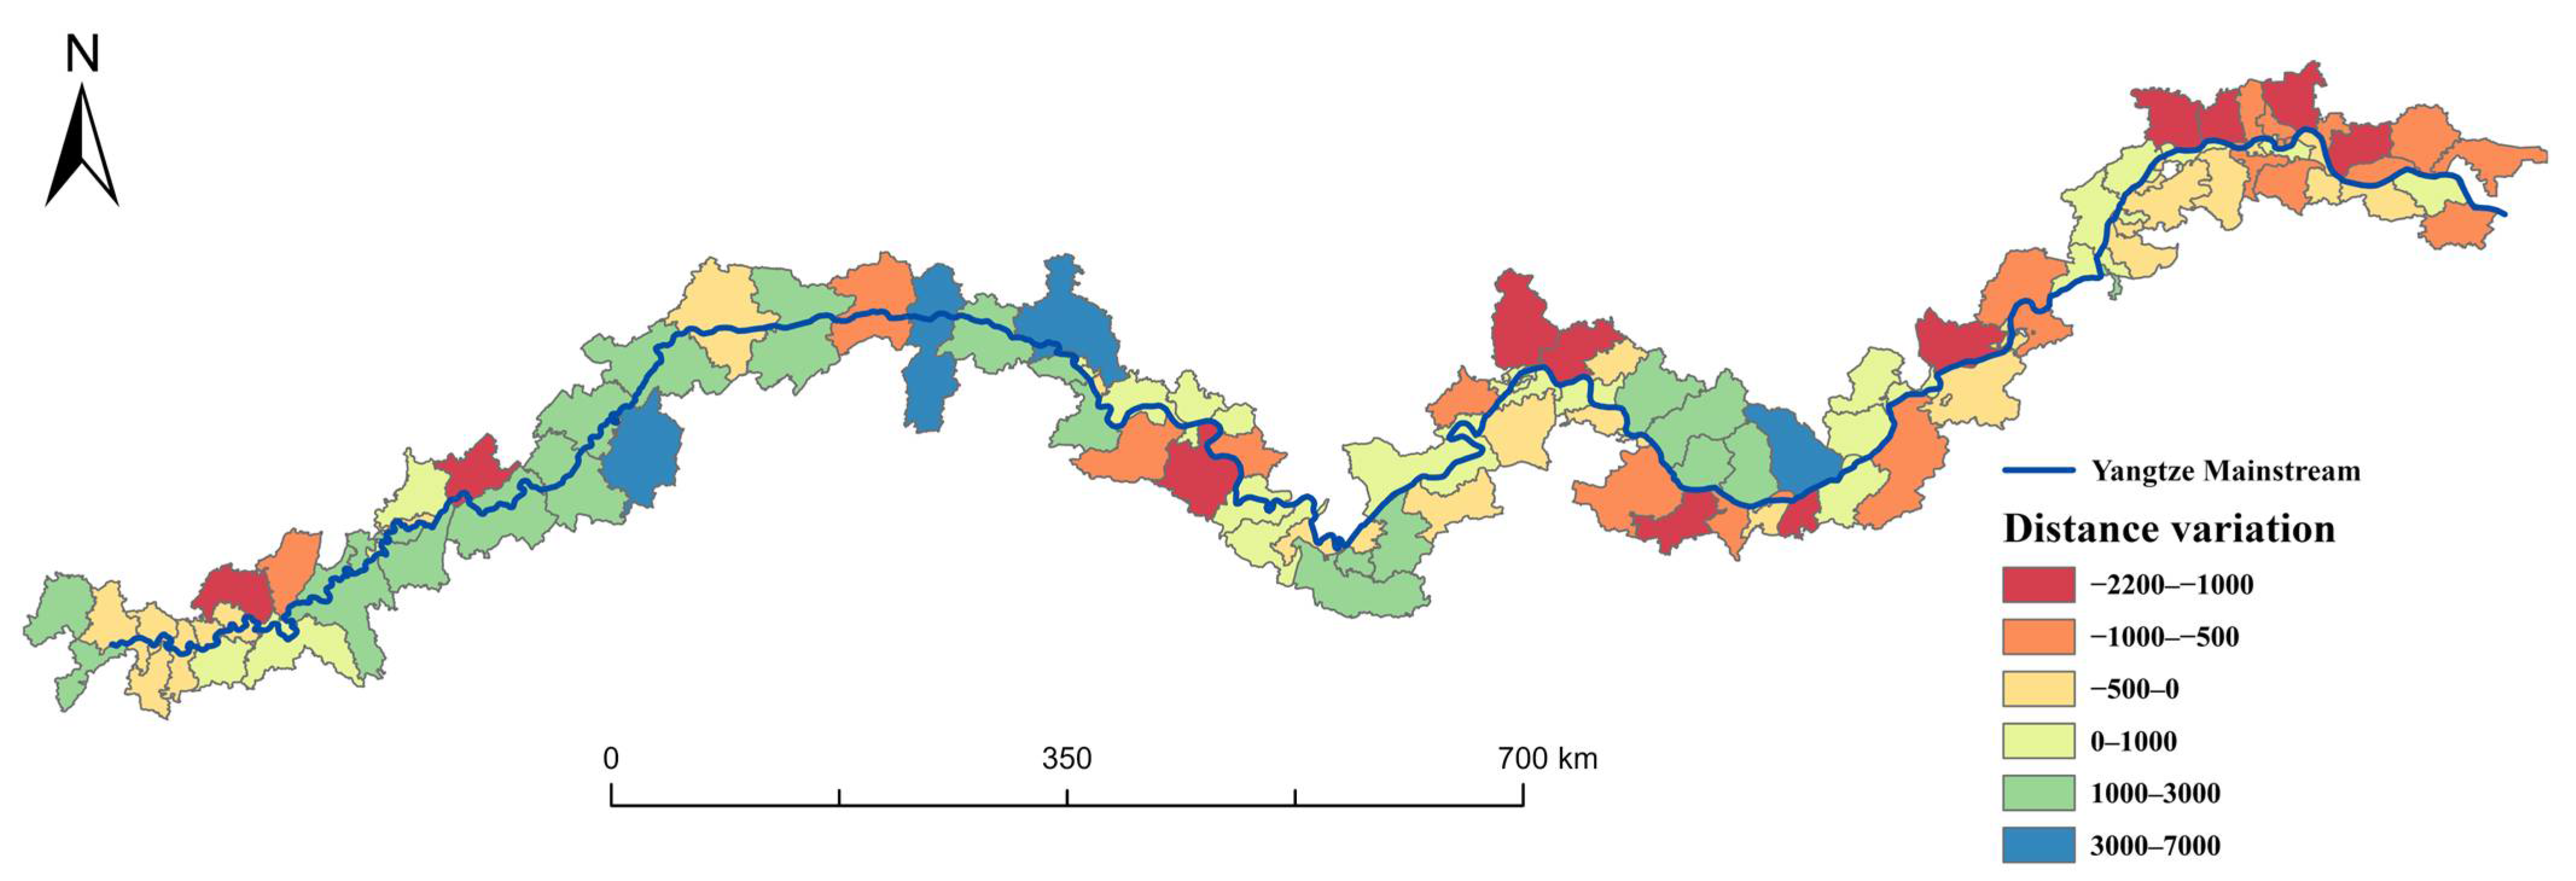
3.2. Spatial–Temporal Variations in the Distance Between the Three-Zone Space and the Yangtze River

As shown in the figures below (Figure 4, Figure 5, Figure 6, Figure 7, Figure 8 and Figure 9), from a macro perspective, the distances of agricultural, ecological, and urban spaces from the Yangtze River exhibit significant regional disparities.
In eastern provinces such as Jiangsu and Jiangxi, urban spaces in riverside counties demonstrate a distinct clustering trend toward the Yangtze River. Conversely, riverside counties in Anhui Province exhibit urban spatial patterns that have diverged from the Yangtze since 2000. Agricultural and ecological spaces display inverse trajectories; while Jiangsu and Jiangxi’s riverside agricultural–ecological zones progressively retreat from the river, Anhui’s ecological spaces show gradual convergence toward the Yangtze, forming a marked contrast with its eastern counterparts and highlighting significant intra-regional spatial dynamics. The urban clustering toward the river in Jiangsu/Jiangxi reflects the high strategic value of riverside locations for industrial and logistics development. The retreat of agricultural/ecological spaces in these areas likely results from spatial redistribution under intense land competition and policy guidance. Anhui’s contrasting patterns suggest differing regional development priorities or policy implementations.
In central China, urban expansions in riverside counties of Hubei and Hunan provinces generally exhibit centrifugal movement relative to the Yangtze. Hubei’s agricultural and ecological zones demonstrate moderate withdrawal from the river, though ecological changes remain relatively muted. Hunan maintains greater spatial stability, with its ecological spaces maintaining closer proximity to the Yangtze compared to agricultural areas. The centrifugal urban expansion in Central China may be driven by land availability constraints near the river or deliberate policies to preserve riparian corridors. Hunan’s stability could indicate stronger enforcement of ecological protection measures or less intense development pressure compared to Hubei.
Western regions present more complex spatial transformations. Chongqing’s riverside counties manifest the most pronounced urban retreat from the Yangtze across the entire study area, while paradoxically demonstrating steady ecological space convergence toward the river. In contrast, Sichuan Province exhibits divergent patterns; urban spaces show Yangtze-oriented clustering, whereas agricultural and ecological zones display moderate withdrawal. Chongqing’s urban retreat coupled with ecological convergence suggests active ecological restoration or strict protection policies along its riverbanks, possibly linked to its megacity status and upstream ecological sensitivity. Sichuan’s urban clustering may reflect development focusing on accessible riverine areas, while agricultural/ecological withdrawal could be due to topographic constraints or upstream conservation efforts. These heterogeneous patterns underscore the necessity for region-specific spatial governance strategies along the Yangtze River Economic Belt.
These heterogeneous patterns are further quantified through county-level extremes (Table 5). For agricultural space, the most pronounced divergence from the Yangtze occurs in western mountainous counties (e.g., 422823), while the strongest convergence appears in mid-eastern metropolitan cores (e.g., 340521 and 420103). Ecological space shows maximal retreat in Jiangsu’s developed counties (321283), contrasted by sharp advances toward the river in Anhui’s riparian zones (320612). Urban space manifests the most extreme displacements, with western counties exhibiting radical separation from the Yangtze (422823), while downstream industrial hubs demonstrate intensive waterfront clustering (360481).

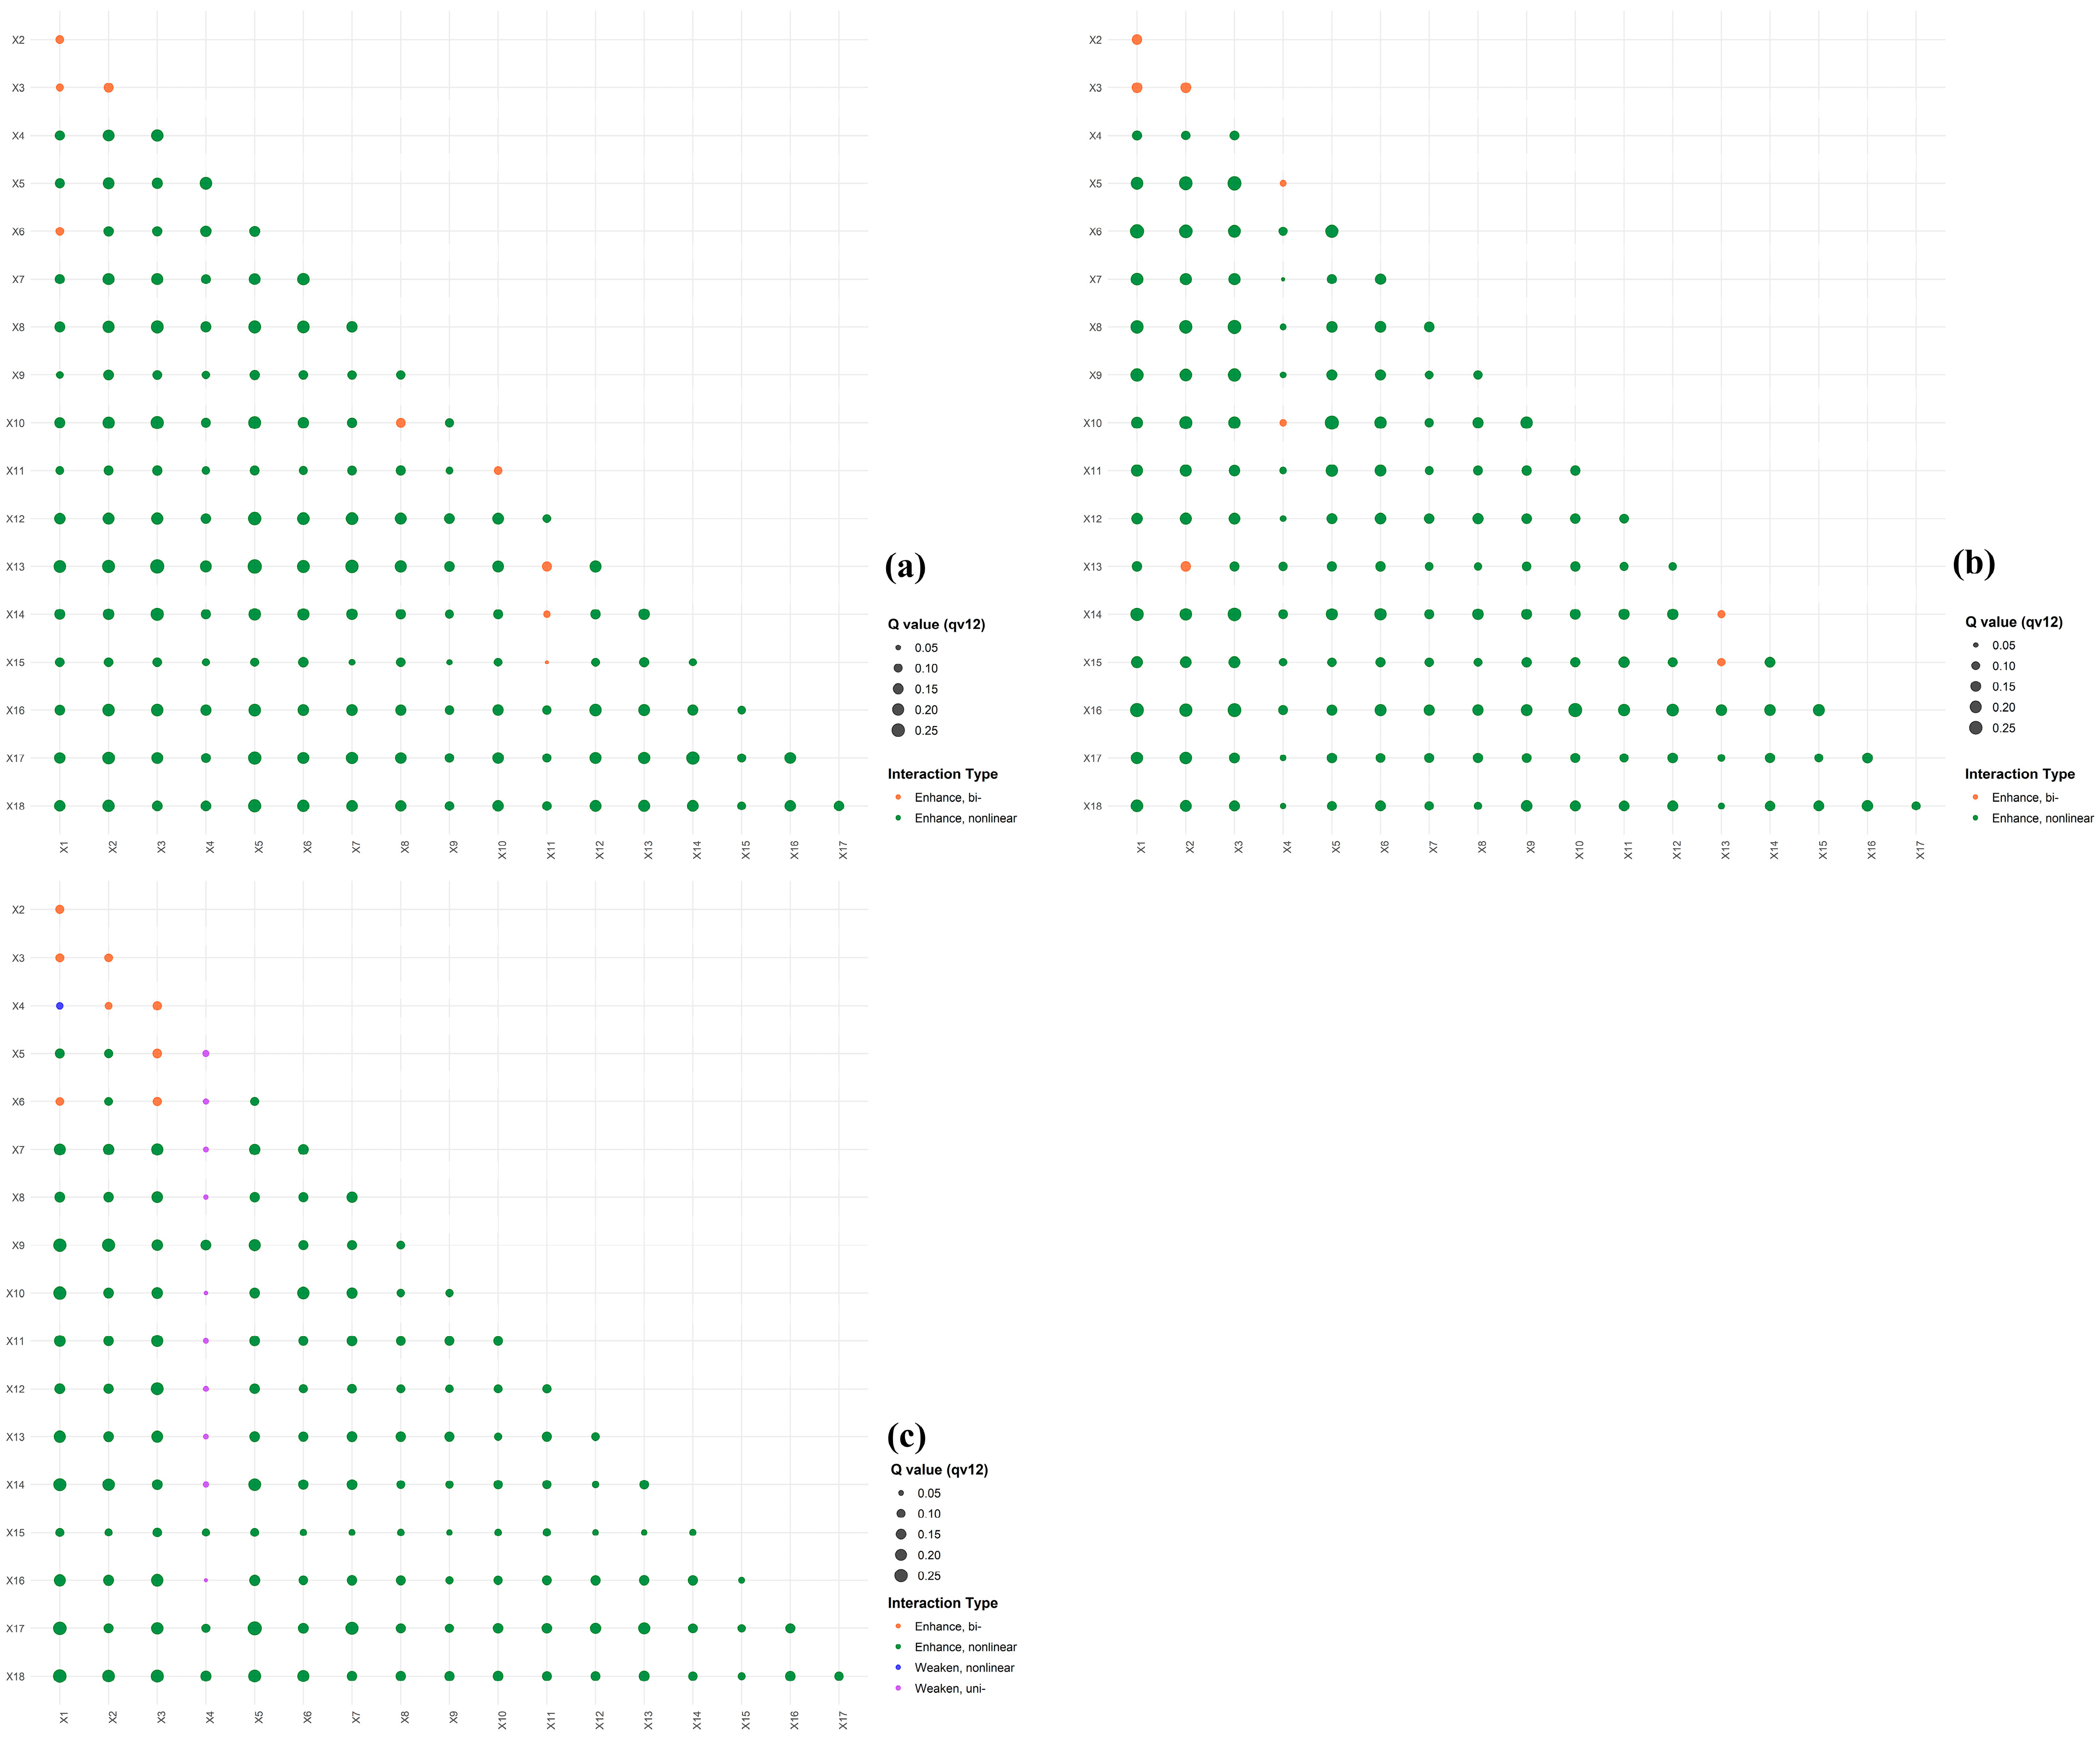
3.3. Driving Factors of Changes in Distance Between Three Types of Spaces and the Yangtze River

3.3.1. Single Factor Analysis

Table 6 lists the Q-values for each driving factor. The analysis reveals significant differences in the influence intensity of various factors on the changes in distance between agricultural, ecological, and urban spaces and the Yangtze River. Factors in the natural condition dimensions (X1, X2, X3, and X4) and location dimensions (X5 and X6) exhibit relatively consistent and widespread significant effects on the distance of the three spatial types, whereas factors in the socioeconomic dimensions (X7–X18) demonstrate stronger type-specific influences.
In the change in agricultural space distance to the Yangtze River, factors related to primary industry development (e.g., X8, X10, and X17) and government fiscal indicators (e.g., X13 and X14) play the most prominent driving roles. In the change in urban space distance, factors such as urban location (X5 and X6) and secondary industry-related variables (X11 and X18) exert more significant influences. In the change in ecological space distance, factors representing natural geographical features (e.g., X2 and X3) show the most sensitive responses, with relatively weak effects from socioeconomic factors.
Comparisons within factor dimensions indicate that topographic factors (e.g., X2 and X3) within natural conditions consistently exert a stronger influence than area-related indicators (e.g., X4). In socioeconomic dimensions, economic indicators (e.g., X10, X13, and X18) generally have a greater impact than population-related variables (e.g., X7 and X17), except for X8, which significantly affects the distance of agricultural spaces. Location factors (X5 and X6), measured by distance to regional central cities, show similar influence intensities across the three spatial distances, with slightly stronger effects on agricultural and ecological spaces than on urban spaces.
Overall, natural and location factors (X1–X6) provide a foundational basis for the spatial distance patterns, while socioeconomic factors (X7–X18) exhibit more nuanced type-specific impacts.

3.3.2. Factor Interaction

An interaction analysis of geographical detectors can evaluate whether the explanatory power of two factors is enhanced, weakened, or independent. In Figure 10, the dots represent the magnitude of the interaction between factors on the horizontal and vertical axes. The size of the dots indicates the strength of the interaction, with larger dots representing stronger interactions, while the color of the dots indicates different types of interactions. This analysis helps identify how different factors jointly influence the changes in the distance of urban, agricultural, and ecological spaces from the Yangtze River. Through the interaction analysis of geographical detectors, it is evident that driving factors influencing the changes in distance between agricultural, ecological, and urban spaces and the Yangtze River exhibit predominantly synergistic enhancement effects, with only local factor pairs showing interactive weakening. The interaction patterns of factors across different spatial types demonstrate distinct dimensional differences.
In the interaction of driving factors for agricultural spaces, the interactions between natural condition factors, location factors, and socioeconomic factors are primarily characterized by nonlinear enhancement, reflecting a synergistic mechanism between the natural geographical background and human activity elements. For ecological spaces, factor interactions are marked by more prominent bidirectional enhancement effects within natural condition factors, forming systematic reinforcing effects of topographic elements. Meanwhile, nonlinear interactions between natural factors and socioeconomic factors are widespread, indicating that changes in ecological space distance are driven by both natural substrates and industrial economic factors. In urban spaces, factor interactions show significant location dependence, with strong synergistic enhancement effects between location factors and socioeconomic factors. However, nonlinear weakening occurs in interactions between certain natural condition factors and socioeconomic factors, suggesting that the driving mechanism for changes in urban space distance relies more on economic agglomeration effects associated with urban locations
Enhancement-type interactions predominate across the three spatial types, with nonlinear enhancement being the primary form. Interactive weakening is limited to combinations of natural factors and socioeconomic factors with low explanatory power. Agricultural space interactions emphasize cross-dimensional coupling between natural conditions and socioeconomic dimensions; ecological spaces highlight bidirectional reinforcement within natural factors and between natural and economic factors; urban spaces exhibit deep coupling between location factors and industrial economic elements, with differentiated influences of natural factors in urban spatial interactions.

4. Discussion

4.1. Land-Scale Transitions and Spatiotemporal Evolution of Distance to the Yangtze River

This study reveals the spatial interaction mechanism between the terrestrial system and the river ecosystem by analyzing the spatial patterns of land use changes in the “three-zone spaces” (urban, agricultural, and ecological spaces) of counties along the Yangtze River main stream, their distance transformations from the Yangtze River, and the driving factors. The centroid-based distance calculation method used in this study ensures fine-grained measurement, effectively avoiding the generalization errors of simplified geometric models, and provides a critical indicator for studying spatial proximity patterns that change over time and space. This has significant theoretical and practical implications for further exploring land use dynamics and their impacts on river systems.
Over the past two decades, the Yangtze River Economic Belt has become one of the regions with the most rapid urbanization in China. As administrative units directly adjacent to the river ecosystem, counties along the Yangtze main stream exhibit significant spatiotemporal heterogeneity and ecological interaction characteristics in the spatial correlation between land use changes and the Yangtze River during the process of rapid socioeconomic development and drastic land use transformations. The results show that urban spaces in this region have expanded significantly, agricultural spaces have continued to shrink, while the pattern of ecological spaces has remained generally stable. Analysis of the land transfer matrix indicates that agricultural spaces are the primary source of urban expansion, and the bidirectional transformation between ecological and agricultural spaces highlights the local intensification of land use conflicts. This evolution trend is highly consistent with China’s rapid urbanization process and existing research [44], particularly evident in core cities such as Chongqing, Wuhan, Nanjing, and their radiating areas [50,51]. This study further shows that the transformation of urban spaces has significant irreversibility [52], while the mutual conversion between agricultural and ecological spaces demonstrates high fluidity [53], approaching dynamic equilibrium. These results not only reveal the path dependence characteristics of land use transformation but also provide a key background for analyzing the distance changes between different spatial types and the Yangtze River.
In eastern regions (e.g., Jiangsu and Jiangxi), riverside urban spaces show a trend of agglomeration toward the Yangtze River, reflecting the strategic value of riverside locations for industrial and logistics development [54]. However, the gradual retreat of agricultural and ecological spaces from the river channel may be related to spatial redistribution under land competition and policy guidance [55]. By contrast, in central and western regions (e.g., Hubei and Sichuan), urban expansion mostly occurs in areas far from the Yangtze River, while agricultural and ecological spaces show bidirectional changes. Historically, agricultural spaces concentrated along the river due to convenient irrigation [56], but the gradual retreat of agricultural land in central and western regions may reduce the direct impact of non-point-source pollution, yet it may force agricultural activities to transfer to areas with poor topographic conditions, increasing the risks of chemical fertilizer use and soil erosion [57]. The intensive expansion of eastern cities toward the Yangtze River strengthens economic connectivity but also leads to increased impermeable surfaces, rising flood risks [58], and habitat fragmentation. The stable proximity of eastern ecological spaces to the Yangtze River may benefit from the effective implementation of policies such as the “Yangtze River Great Protection,” while the retreat of ecological spaces in central and western regions may weaken riparian buffer functions [59] and threaten the connectivity of ecological corridors [60].

4.2. Driving Mechanisms of Distance Transitions

The geographical detector model reveals the multi-dimensional driving mechanisms of distance transformations from the Yangtze River main stream for the “three-zone spaces” along the river. Natural conditions play a dominant role in ecological spaces. The topographic factor has the highest explanatory power for the distance of ecological spaces, confirming the sensitivity of ecological land to topographic gradients—ecological spaces in low-elevation plains are more prone to reconstruction due to human activities, while high-elevation areas remain relatively stable due to topographic constraints [61]. Meanwhile, the distance fluctuations of urban spaces are more strongly constrained by natural conditions compared to agricultural spaces, confirming that agricultural spaces have significantly higher adaptability to natural conditions than urban spaces [62]. The distance to node cities strongly explains agricultural space changes, reflecting that urban radiation influences agricultural layouts through market demand and policy guidance [63]. The impact of the distance to prefecture-level city centers on ecological spaces may stem from the spatial spillover effects of local government ecological protection policies, such as the delineation of ecological red lines and construction of environmental protection facilities [64,65]. Socioeconomic factors exhibit functional specificity, with more significant driving forces for agricultural space distance transformations, indicating their sensitivity to production conditions such as agricultural population size, government taxes, and related policies. Additionally, strong nonlinear enhancement effects exist between different factors, with the coupling effect of socioeconomic and natural conditions being the most significant. Furthermore, the interaction effects on ecological space distance transformations show a distinct “natural-location” dual-drive characteristic, providing a differentiated basis for formulating ecological protection strategies.

4.3. Policy Recommendations

Based on the spatial heterogeneity of land use transitions and their escalating threats to the Yangtze River ecosystem, where proximity changes directly intensify pollution pathways, habitat fragmentation, and hydrological risks, we propose integrated governance strategies.
Strategic priorities for basin-scale resilience. First, enforce basin-wide ecological redlines with differentiated standards, prioritizing critical riparian habitat restoration in eastern provinces (Jiangsu/Jiangxi) where urban convergence (e.g., Jingjiang’s petrochemical clusters) heightens flood vulnerability and heavy metal contamination risks. Second, implement agroecological buffers in central/western agricultural retreat zones (e.g., Badong’s displaced farmlands), combining terracing subsidies with sediment capture infrastructure to counter sedimentation threats to the Three Gorges Reservoir. Third, deploy the proposed centroid-based monitoring system to track real-time proximity changes, with early-warning triggers for high-risk transitions like Tongzhou’s wetland encroachment that degrades waterbird habitats.
Adaptive interventions for regional challenges. Complementing these measures, in industrial convergence hotspots (Jingjiang and Ruichang), mandate 1 km pollution control zones with closed-loop wastewater systems, relocating high-risk industries (e.g., electroplating) from riverbanks; for agricultural displacement frontiers (Badong and Zigui), establish 500 m vegetative buffers and satellite towns to absorb slope farming pressure; leverage irreversible urban transitions in megacities (Chongqing/Wuhan) for brownfield redevelopment, particularly in counties exhibiting ecological recovery signals like Fuling’s riparian restoration. Ecological threat mitigation focuses: industrial agglomeration leads to heavy metal accumulation (addressed by 1 km control zones); agricultural displacement triggers sediment and nutrient surges (countered by terracing and buffers); ecological fragmentation causes migratory corridor collapse (prevented by habitat compensation). These layered strategies collectively counteract the spatial pressures revealed in distance transformations, balancing development needs with the ecological integrity of China’s lifeline river.

4.4. Limitations

The current classification of urban, agricultural, and ecological spaces relies on the GLC_FCS30D dataset and simplified reclassification rules. While this approach provides a foundational framework, it may oversimplify complex land use interactions. Recent advancements in deep learning-based land cover classification [66] and high-resolution Sentinel-2 imagery [67] could enhance spatial and thematic precision. In addition, the centroid-based Euclidean distance metric, while computationally efficient, neglects terrain complexity and hydrological connectivity. Incorporating cost–distance algorithms that account for elevation, slope, and river flow dynamics [68] or network analysis for accessibility [69] could yield more ecologically meaningful proximity metrics. Furthermore, while the study incorporates natural, locational, and socioeconomic factors, critical drivers such as climate change, policy intensity, and cultural practices remain underexplored. Integrating multi-dimensional datasets, such as policy implementation indices [70] or climate resilience indicators [71], could provide a holistic understanding of spatiotemporal dynamics.

5. Conclusions

This study employed land use transfer matrices, centroid-based distance measurements, and the Optimal Parameters-Based Geographical Detector model to analyze the spatiotemporal evolution of Urban–Agricultural–Ecological spaces and their proximity dynamics to the Yangtze River in the 130 county-level administrative units along the Yangtze River from 2000 to 2020. Key findings reveal that urban spaces expanded by 33,358 km2, primarily sourced from agricultural land, while agricultural areas contracted by 28,882 km2, and ecological spaces remained relatively stable despite localized bidirectional conversions with agricultural zones. Spatial proximity analysis demonstrated distinct regional patterns; eastern provinces exhibited urban clustering toward the river, intensifying flood risks and habitat fragmentation, whereas central and western regions saw urban expansion away from the Yangtze, coupled with agricultural retreat that risks soil erosion in marginal lands. The geographical detector model identified natural factors as dominant drivers of ecological space dynamics, while socioeconomic factors strongly influenced agricultural and urban proximity changes, with significant nonlinear interactions between natural and socioeconomic dimensions. Notably, urban transitions displayed irreversibility, whereas agricultural–ecological conversions approached dynamic equilibrium. To optimize land–river interactions, this study recommends enforcing strict ecological redlines in eastern riparian zones to restore critical habitats, promoting agroecological practices and eco-compensation mechanisms in central/western retreating agricultural areas, establishing real-time monitoring systems integrating centroid-based metrics for early risk detection, and prioritizing brownfield redevelopment in core cities to mitigate irreversible urban encroachment. These measures, coupled with cross-sectoral policy coordination and regional ecological compensation frameworks, aim to harmonize economic growth with ecosystem resilience, ensuring the sustainable governance of the Yangtze River Basin.

Author Contributions

Conceptualization, J.A. and J.X.; Methodology, J.A. and J.X.; Software, J.A. and J.X.; Validation, F.Q. and Y.J.; Formal Analysis, J.A. and J.X.; Investigation, J.A. and F.Q.; Resources, K.L. and J.X.; Data Curation, J.A., J.X. and F.Q.; Writing—Original Draft Preparation, J.A.; Writing—Review and Editing, J.A. and X.L.; Visualization, J.A.; Supervision, J.X. and X.L.; project administration, X.L.; funding acquisition, X.L. and K.L. All authors have read and agreed to the published version of the manuscript.

Funding

This research was funded by the Independent Innovative Project of Changjiang Survey Planning Design and Research Co., Ltd. (Grant Number: CX2023Z10-1), supported by the China Postdoctoral Science Foundation (Grant Number: 2024M752473), and supported by the Open Fund of the Technology Innovation Center for 3D Real Scene Construction and Urban Refined Governance, Ministry of Natural Resources (Grant Number: 2024PF-4).

Data Availability Statement

Publicly available datasets were analyzed in this study. Digital elevation model data can be found here: [https://www.gscloud.cn/], accessed on 25 December 2024. Land use data can be found here: [http://www.zenodo.org/], accessed on 25 December 2024. The basic geographic information base map can be found here: [http://www.webmap.cn/], accessed on 25 December 2024.

Conflicts of Interest

Author Xiaofen Li, Fan Qiu, Yichen Jia and Kai Li was employed by the company the Changjiang Survey Planning Design and Research Co., Ltd. The remaining authors declare that the research was conducted in the absence of any commercial or financial relationships that could be construed as a potential conflict of interest.

References

  1. Wei, Y.; Wu, S. The gulf of cross-disciplinary research collaborations on global river basins is not narrowed. Ambio 2022, 51, 1994–2006. [Google Scholar] [CrossRef]
  2. Ou, H.; Cai, S.; Fan, W.; Qiu, J.; Mu, X.; Zhou, T.; Yang, X.; Picco, L. Sustaining the Pearl River: A Critical Review of Changes in Fluvial Geomorphological Processes and the Driving Forces in the Pearl River Basin. Water 2024, 16, 1001. [Google Scholar] [CrossRef]
  3. Wang, J.; Kumar Shrestha, N.; Aghajani Delavar, M.; Worku Meshesha, T.; Bhanja, S.N. Modelling Watershed and River Basin Processes in Cold Climate Regions: A Review. Water 2021, 13, 518. [Google Scholar] [CrossRef]
  4. Grabowski, R.C.; Vercruysse, K.; Holman, I.; Azhoni, A.; Bala, B.; Shankar, V.; Beale, J.; Mukate, S.; Poddar, A.; Peng, J.; et al. The land–river interface: A conceptual framework of environmental process interactions to support sustainable development. Sustain. Sci. 2022, 17, 1677–1693. [Google Scholar] [CrossRef]
  5. Zhang, D.; Song, W.; Chen, N.; Zhang, F. The role of spatial scale in organism–environment positive feedback. Nonlinear Dyn. 2019, 95, 2019–2029. [Google Scholar] [CrossRef]
  6. Lafuite, A.S.; Loreau, M. Time-delayed biodiversity feedbacks and the sustainability of social-ecological systems. Ecol. Model. 2017, 351, 96–108. [Google Scholar] [CrossRef]
  7. Mathias, J.-D.; Anderies, J.M.; Baggio, J.; Hodbod, J.; Huet, S.; Janssen, M.A.; Milkoreit, M.; Schoon, M. Exploring non-linear transition pathways in social-ecological systems. Sci. Rep. 2020, 10, 4136. [Google Scholar] [CrossRef]
  8. Dangerfield, S. The Effects of Sediment Loading on Morphology and Flood Risk in a Lowland River System. Ph.D. Thesis, University of Nottingham, Nottingham, UK, 2013. [Google Scholar]
  9. Maaß, A.-L.; Schüttrumpf, H.; Lehmkuhl, F. Human impact on fluvial systems in Europe with special regard to today’s river restorations. Environ. Sci. Eur. 2021, 33, 119. [Google Scholar] [CrossRef]
  10. Garvey, J.E.; Whiles, M.R. Incorporating the riverscape into models of river–floodplain function. Front. Freshw. Sci. 2023, 1, 2023. [Google Scholar] [CrossRef]
  11. Ciupa, T.; Suligowski, R. Impact of the City on the Rapid Increase in the Runoff and Transport of Suspended and Dissolved Solids During Rainfall—The Example of the Silnica River (Kielce, Poland). Water 2020, 12, 2693. [Google Scholar] [CrossRef]
  12. Strokal, M.; Bai, Z.; Franssen, W.; Hofstra, N.; Koelmans, A.A.; Ludwig, F.; Ma, L.; van Puijenbroek, P.; Spanier, J.E.; Vermeulen, L.C.; et al. Urbanization: An increasing source of multiple pollutants to rivers in the 21st century. Npj Urban Sustain. 2021, 1, 24. [Google Scholar] [CrossRef]
  13. Camacho-Valdez, V.; Rodiles-Hernández, R.; Navarrete-Gutiérrez, D.A.; Valencia-Barrera, E. Tropical wetlands and land use changes: The case of oil palm in neotropical riverine floodplains. PLoS ONE 2022, 17, e0266677. [Google Scholar] [CrossRef] [PubMed]
  14. Zúñiga-Sarango, W.; Gaona, F.P.; Reyes-Castillo, V.; Iñiguez-Armijos, C. Disrupting the Biodiversity–Ecosystem Function Relationship: Response of Shredders and Leaf Breakdown to Urbanization in Andean Streams. Front. Ecol. Evol. 2020, 8, 2020. [Google Scholar] [CrossRef]
  15. Echeverría-Sáenz, S.; Ugalde-Salazar, R.; Guevara-Mora, M.; Quesada-Alvarado, F.; Ruepert, C. Ecological Integrity Impairment and Habitat Fragmentation for Neotropical Macroinvertebrate Communities in an Agricultural Stream. Toxics 2022, 10, 346. [Google Scholar] [CrossRef]
  16. Liu, R.; Dong, X.; Zhang, P.; Zhang, Y.; Wang, X.; Gao, Y. Study on the Sustainable Development of an Arid Basin Based on the Coupling Process of Ecosystem Health and Human Wellbeing Under Land Use Change—A Case Study in the Manas River Basin, Xinjiang, China. Sustainability 2020, 12, 1201. [Google Scholar] [CrossRef]
  17. Chen, R.; Huang, C. Landscape Evolution and It’s Impact of Ecosystem Service Value of the Wuhan City, China. Int. J. Environ. Res. Public Health 2021, 18, 13015. [Google Scholar] [CrossRef]
  18. Park, S.-R.; Kim, S.; Lee, S.-W. Evaluating the Relationships between Riparian Land Cover Characteristics and Biological Integrity of Streams Using Random Forest Algorithms. Int. J. Environ. Res. Public Health 2021, 18, 3182. [Google Scholar] [CrossRef]
  19. Liu, C.; Qu, L.; Clausen, J.; Lei, T.; Yang, X. Impact of Riparian Buffer Zone Design on Surface Water Quality at the Watershed Scale, a Case Study in the Jinghe Watershed in China. Water 2023, 15, 2696. [Google Scholar] [CrossRef]
  20. Jayasuriya, M.T.; Germain, R.H.; Stella, J.C. Applying the “Goldilocks Rule” to Riparian Buffer Widths for Forested Headwater Streams across the Contiguous U.S.—How Much Is “Just Right”? Forests 2022, 13, 1509. [Google Scholar] [CrossRef]
  21. Ding, H. The Influence of Landforms and Sampling Approaches on Riparian Buffer Area and Complexity. Ph.D. Thesis, Michigan Technological University, Houghton, MI, USA, 2020. [Google Scholar]
  22. Graziano, M.P.; Deguire, A.K.; Surasinghe, T.D. Riparian Buffers as a Critical Landscape Feature: Insights for Riverscape Conservation and Policy Renovations. Diversity 2022, 14, 172. [Google Scholar] [CrossRef]
  23. Meng, R.; Cai, J.; Xin, H.; Meng, Z.; Dang, X.; Han, Y. Spatio-Temporal Changes in Land Use and Habitat Quality of Hobq Desert along the Yellow River Section. Int. J. Environ. Res. Public Health 2023, 20, 3599. [Google Scholar] [CrossRef]
  24. Vera Mercado, J.A.; Engel, B. Multi-Scale Analysis of the Dependence of Water Quality on Land Use Using Linear and Mixed Models. Water 2021, 13, 2618. [Google Scholar] [CrossRef]
  25. Zhang, M.; Du, H.; Mao, F.; Zhou, G.; Li, X.; Dong, L.; Zheng, J.; Zhu, D.e.; Liu, H.; Huang, Z.; et al. Spatiotemporal Evolution of Urban Expansion Using Landsat Time Series Data and Assessment of Its Influences on Forests. ISPRS Int. J. Geo-Inf. 2020, 9, 64. [Google Scholar] [CrossRef]
  26. Song, Y.; Zhang, Z.; Li, Y.; Zou, R.; Wang, L.; Yang, H.; Hu, Y. The Role of High Nature Value Farmland for Landscape and Soil Pollution Assessment in a Coastal Delta in China Based on High-Resolution Indicators. Sustainability 2023, 15, 6728. [Google Scholar] [CrossRef]
  27. Zhong, Y.; Lin, A.; He, L.; Zhou, Z.; Yuan, M. Spatiotemporal Dynamics and Driving Forces of Urban Land-Use Expansion: A Case Study of the Yangtze River Economic Belt, China. Remote Sens. 2020, 12, 287. [Google Scholar] [CrossRef]
  28. Cui, X.; Cai, T.; Deng, W.; Zheng, R.; Jiang, Y.; Bao, H. Indicators for Evaluating High-Quality Agricultural Development: Empirical Study from Yangtze River Economic Belt, China. Soc. Indic. Res. 2022, 164, 1101–1127. [Google Scholar] [CrossRef] [PubMed]
  29. Hao, J.; Wang, J.; Zhang, S.; Wu, F.; Jiang, H.; Wu, W.; Liu, N. Several Strategic Issues for the Construction of Ecological Civilization in Yangtze River Economic Belt. Strateg. Study CAE 2022, 24, 141–147. [Google Scholar] [CrossRef]
  30. Zhang, X.; Zhao, T.; Xu, H.; Liu, W.; Wang, J.; Chen, X.; Liu, L. GLC_FCS30D: The first global 30 m land-cover dynamics monitoring product with a fine classification system for the period from 1985 to 2022 generated using dense-time-series Landsat imagery and the continuous change-detection method. Earth Syst. Sci. Data 2024, 16, 1353–1381. [Google Scholar] [CrossRef]
  31. Wei, W.; Li, Y.; Bo, X.; Liming, B. Spatial-temporal Evolution Characteristics and Mechanism of “Three-function Space” in the Yellow River Basin Under the Background of Territorial Spatial Planning. Econ. Geogr. 2022, 42, 44–55. [Google Scholar] [CrossRef]
  32. Zhang, K.; Wei, W.; Zhou, J.; Yin, L.; Xia, J.N. Spatial-temporal Evolution Characteristics and Mechanism of “Three-Function Space” in the Three-Rivers Headwaters’ Region from 1992 to 2020. J. Geo-Inf. Sci. 2022, 24, 1755–1770. [Google Scholar]
  33. Tomlinson, S.J.; Dragosits, U.; Levy, P.E.; Thomson, A.M.; Moxley, J. Quantifying gross vs. net agricultural land use change in Great Britain using the Integrated Administration and Control System. Sci. Total Environ. 2018, 628-629, 1234–1248. [Google Scholar] [CrossRef] [PubMed]
  34. Zhang, S.; Shao, H.; Li, X.; Xian, W.; Shao, Q.; Yin, Z.; Lai, F.; Qi, J. Spatiotemporal Dynamics of Ecological Security Pattern of Urban Agglomerations in Yangtze River Delta Based on LUCC Simulation. Remote Sens. 2022, 14, 296. [Google Scholar] [CrossRef]
  35. Safabakhshpachehkenari, M.; Tonooka, H. Modeling Land Use Transformations and Flood Hazard on Ibaraki’s Coastal in 2030: A Scenario-Based Approach Amid Population Fluctuations. Remote Sens. 2024, 16, 898. [Google Scholar] [CrossRef]
  36. Chakma, M.; Hayat, U.; Meng, J.; Hassan, M.A. An Assessment of Landscape and Land Use/Cover Change and Its Implications for Sustainable Landscape Management in the Chittagong Hill Tracts, Bangladesh. Land 2023, 12, 1610. [Google Scholar] [CrossRef]
  37. Li, C.; Wu, J. Land use transformation and eco-environmental effects based on production-living-ecological spatial synergy: Evidence from Shaanxi Province, China. Environ. Sci. Pollut. Res. 2022, 29, 41492–41504. [Google Scholar] [CrossRef] [PubMed]
  38. Staponites, L.R.; Barták, V.; Bílý, M.; Simon, O.P. Performance of landscape composition metrics for predicting water quality in headwater catchments. Sci. Rep. 2019, 9, 14405. [Google Scholar] [CrossRef]
  39. Mohd Ali, N.F.; Yunus, R.; Mohamed, I.; Othman, F. Improved Spatial Outlier Detection Method within a River Network. Sains Malays. 2022, 51, 911–927. [Google Scholar] [CrossRef]
  40. Scherelis, V.; Doering, M.; Laube, P. HydroWidth: A small-scale approach to calculate river width and its variability. Trans. GIS 2023, 27, 1503–1525. [Google Scholar] [CrossRef]
  41. Arnaud-Fassetta, G.; Melun, G.; Passy, P.; Brousse, G.; Theureaux, O. How to Quantify the Dynamics of Single (Straight or Sinuous) and Multiple (Anabranching) Channels from Imagery for River Restoration. Appl. Sci. 2021, 11, 8075. [Google Scholar] [CrossRef]
  42. Song, Y.; Wang, J.; Xu, C. An optimal parameters-based geographical detector model enhances geographic characteristics of explanatory variables for spatial heterogeneity analysis: Cases with different types of spatial data. GIScience Remote Sens. 2020, 57, 1–17. [Google Scholar] [CrossRef]
  43. Lesage, J.; Pace, R.K. Introduction to Spatial Econometrics; Chapman and Hall/CRC: New York, NY, USA, 2008; pp. 19–44. [Google Scholar]
  44. Xia, J.; Hong, M.; Wei, W. Changes and Driving Forces of Urban–Agricultural–Ecological Space in the Yangtze River Economic Belt from 2000 to 2020. Land 2023, 12, 1014. [Google Scholar] [CrossRef]
  45. Li, Y.; Wang, S. Exploration of Eco-Environment and Urbanization Changes Based on Multi-Source Remote Sensing Data—A Case Study of Yangtze River Delta Urban Agglomeration. Sustainability 2024, 16, 5903. [Google Scholar] [CrossRef]
  46. Zhao, J.; Zhao, Y.; Yang, X. Evolution Characteristics and Driving Mechanism of the Territorial Space Pattern in the Yangtze River Economic Belt, China. Land 2022, 11, 1447. [Google Scholar] [CrossRef]
  47. Hu, Y.; Zhang, Y. Spatial-temporal dynamics and driving factor analysis of urban ecological land in Zhuhai city, China. Sci. Rep. 2020, 10, 16174. [Google Scholar] [CrossRef] [PubMed]
  48. Tufekcioglu, M.; Schultz, R.C.; Isenhart, T.M.; Kovar, J.L.; Russell, J.R. Riparian Land-Use, Stream Morphology and Streambank Erosion within Grazed Pastures in Southern Iowa, USA: A Catchment-Wide Perspective. Sustainability 2020, 12, 6461. [Google Scholar] [CrossRef]
  49. Ge, X.J.; Liu, X. Urban Land Use Efficiency under Resource-Based Economic Transformation—A Case Study of Shanxi Province. Land 2021, 10, 850. [Google Scholar] [CrossRef]
  50. Zheng, D.; Zhang, G.; Shan, H.; Tu, Q.; Wu, H.; Li, S. Spatio-Temporal Evolution of Urban Morphology in the Yangtze River Middle Reaches Megalopolis, China. Sustainability 2020, 12, 1738. [Google Scholar] [CrossRef]
  51. Cai, W.; Fangyuan, T. Spatiotemporal characteristics and driving forces of construction land expansion in Yangtze River economic belt, China. PLoS ONE 2020, 15, e0227299. [Google Scholar] [CrossRef]
  52. Slavko, B.; Prokopenko, M.; Glavatskiy, K.S. Diffusive Resettlement: Irreversible Urban Transitions in Closed Systems. Entropy 2021, 23, 66. [Google Scholar] [CrossRef]
  53. Wei, W.; Jiangbo, M.; Junnan, X.; Jing, W. Spatial-Temporal Evolution Characteristics and Mechanism of “Three-Zone Space” along the Yangtze River Economic Belt in Hubei Province from 2010 to 2017. Econ. Geogr. 2020, 40, 132–142. [Google Scholar] [CrossRef]
  54. Fanghu, L.; Yinnan, H.; Biao, W. Analysis of logistics capacity, influencing factors and spatial spillover effect in Yangtze River Economic Belt. PLoS ONE 2024, 19, e0303200. [Google Scholar] [CrossRef] [PubMed]
  55. Xiong, G.; Cao, X.; Hamm, N.A.S.; Lin, T.; Zhang, G.; Chen, B. Unbalanced Development Characteristics and Driving Mechanisms of Regional Urban Spatial Form: A Case Study of Jiangsu Province, China. Sustainability 2021, 13, 3121. [Google Scholar] [CrossRef]
  56. Furtak, K.; Gawryjołek, K.; Marzec-Grządziel, A.; Niedźwiecki, J. The Influence of Human Agricultural Activities on the Quality of Selected Fluvisols from the Vistula River Valley, Poland—Preliminary Research. Agronomy 2024, 14, 480. [Google Scholar] [CrossRef]
  57. Naylor, L.A.; Dungait, J.A.J.; Zheng, Y.; Buckerfield, S.; Green, S.M.; Oliver, D.M.; Liu, H.; Peng, J.; Tu, C.; Zhang, G.-l.; et al. Achieving Sustainable Earth Futures in the Anthropocene by Including Local Communities in Critical Zone Science. Earth’s Future 2023, 11, e2022EF003448. [Google Scholar] [CrossRef]
  58. Wang, Y.; Li, H.; Shi, Y.; Yao, Q. A Study on Spatial Accessibility of the Urban Stadium Emergency Response under the Flood Disaster Scenario. Sustainability 2022, 14, 17041. [Google Scholar] [CrossRef]
  59. Zhao, Q.; Wang, A.; Jing, Y.; Zhang, G.; Yu, Z.; Yu, J.; Liu, Y.; Ding, S. Optimizing Management Practices to Reduce Sediment Connectivity between Forest Roads and Streams in a Mountainous Watershed. Remote Sens. 2022, 14, 4897. [Google Scholar] [CrossRef]
  60. Shi, H.; Shi, T.; Yang, Z.; Wang, Z.; Han, F.; Wang, C. Effect of Roads on Ecological Corridors Used for Wildlife Movement in a Natural Heritage Site. Sustainability 2018, 10, 2725. [Google Scholar] [CrossRef]
  61. Wang, X.; Wang, X.; Jin, X.; Kou, L.; Hou, Y. Evaluation and driving force analysis of ecological environment in low mountain and hilly regions based on optimized ecological index. Sci. Rep. 2024, 14, 24570. [Google Scholar] [CrossRef]
  62. Zhang, R.; Zhang, X. Distribution Characteristics and Influencing Factors of Rural Settlements in Metropolitan Fringe Area: A Case Study of Nanjing, China. Land 2022, 11, 1989. [Google Scholar] [CrossRef]
  63. Qiu, B.; Li, H.; Tang, Z.; Chen, C.; Berry, J. How cropland losses shaped by unbalanced urbanization process? Land Use Policy 2020, 96, 104715. [Google Scholar] [CrossRef]
  64. Liu, T.; Ren, C.; Zhang, S.; Yin, A.; Yue, W. Coupling Coordination Analysis of Urban Development and Ecological Environment in Urban Area of Guilin Based on Multi-Source Data. Int. J. Environ. Res. Public Health 2022, 19, 12583. [Google Scholar] [CrossRef] [PubMed]
  65. Zhu, Y.; Ling, G.H.T. A Systematic Review of Morphological Transformation of Urban Open Spaces: Drivers, Trends, and Methods. Sustainability 2022, 14, 10856. [Google Scholar] [CrossRef]
  66. Zhang, Z.; Jing, W.; Li, H.; Tao, C.; Zhang, Y. GFCNet: Contrastive Learning Network with Geography Feature Space Joint Negative Sample Correction for Land Cover Classification. Remote Sens. 2023, 15, 5056. [Google Scholar] [CrossRef]
  67. Cerbelaud, A.; Blanchet, G.; Roupioz, L.; Breil, P.; Briottet, X. Mapping Pluvial Flood-Induced Damages with Multi-Sensor Optical Remote Sensing: A Transferable Approach. Remote Sens. 2023, 15, 2361. [Google Scholar] [CrossRef]
  68. Shukla, T.; Tang, W.; Trettin, C.C.; Chen, G.; Chen, S.; Allan, C. Quantification of Microtopography in Natural Ecosystems Using Close-Range Remote Sensing. Remote Sens. 2023, 15, 2387. [Google Scholar] [CrossRef]
  69. Torgersen, C.E.; Le Pichon, C.; Fullerton, A.H.; Dugdale, S.J.; Duda, J.J.; Giovannini, F.; Tales, É.; Belliard, J.; Branco, P.; Bergeron, N.E.; et al. Riverscape approaches in practice: Perspectives and applications. Biol. Rev. Camb. Philos. Soc. 2022, 97, 481–504. [Google Scholar] [CrossRef]
  70. van den Bergh, J.; Castro, J.; Drews, S.; Exadaktylos, F.; Foramitti, J.; Klein, F.; Savin, I. Designing an effective climate-policy mix: Accounting for instrument synergy. Clim. Policy 2021, 21, 745–764. [Google Scholar] [CrossRef]
  71. Summers, J.K.; Sanderson, R.; Trahan, R.; Hendricks, K.; Ruffin, M.; Williams, A.; Lamper, A.; Lowery, M.; Harwell, L.C. Development of Community-Level Capacity of Resilience to Natural Hazards for Environmental- and Social-Justice-Challenged Communities: 1. Approach, Concepts, and Assessment of Existing Information. Sustainability 2024, 16, 963. [Google Scholar] [CrossRef]
Figure 1. Adjacent provinces along the main line of the Yangtze River.
Land 14 01380 g001
Figure 2. Counties directly adjacent to the main stem of the Yangtze River.
Land 14 01380 g002
Figure 3. The Urban–Agricultural–Ecological space spatial pattern: (a) the year 2020, (b) the year 2000, (c) the year 2005, (d) the year 2010, (e) the year 2015.
Land 14 01380 g003
Figure 4. The agricultural proximity to the Yangtze River: (a) the year 2000, (b) the year 2005, (c) the year 2010, (d) the year 2015, (e) the year 2020.
Land 14 01380 g004
Figure 5. Temporal variations in agricultural space proximity to the Yangtze River (2000–2020).
Land 14 01380 g005
Figure 6. The Ecological proximity to the Yangtze River: (a) the year 2000, (b) the year 2005, (c) the year 2010, (d) the year 2015, (e) the year 2020.
Land 14 01380 g006
Figure 7. Temporal variations in ecological space proximity to the Yangtze River (2000–2020).
Land 14 01380 g007
Figure 8. The urban proximity to the Yangtze River: (a) the year 2000, (b) the year 2005, (c) the year 2010, (d) the year 2015, (e) the year 2020.
Land 14 01380 g008
Figure 9. Temporal variations in urban space proximity to the Yangtze River (2000–2020).
Land 14 01380 g009
Figure 10. The explanatory power of factor interactions. (a) Proximity of agricultural spaces to the Yangtze River, (b) Proximity of ecological space to the Yangtze River, and (c) proximity of urban space to the Yangtze River.
Land 14 01380 g010
Table 1. The connection between the land cover data of the study area and the “three-zone space” classification system.
Three-Zone SpaceGLC_FCS30D Land Use Classification System
Primary Land Use CategorySecondary Land Use Category
Agricultural SpaceCroplandIncludes dryland farming, turf-covered land, and irrigated farmland
Ecological SpaceForestIncludes open evergreen broadleaf forest, closed evergreen broadleaf forest, open deciduous broadleaf forest, closed deciduous broadleaf forest, open evergreen needleleaf forest, and closed evergreen needleleaf forest
ShrublandIncludes deciduous shrubland and evergreen shrubland
GrasslandGrassland
Water BodyWater Body
WetlandsWetlands
Snow and Ice Permanent snow or ice
Urban Space Bare Land Includes sparse vegetation and bare land
Impervious Surfaces Impervious surfaces
Table 2. The natural conditions, location, and socioeconomic factors.
Factor Dimension Driving FactorsData Source
Natural
conditions
X1Average Elevation (m)Calculate the mean of DEM data within the statistical area
X2Average Slope (°)Convert the DEM data into SLOPE data and calculate the average slope of the statistical area
X3Elevation Range (°)Calculate the range of DEM data within the statistical area
X4Area (m2)Obtained from statistical yearbooks spanning the period from 2000 to 2020
LocationX5Distance to provincial capital city (m)Calculate the average distance from the statistical area to the provincial capitals
X6Distance to prefecture-level city center (m)Calculate the average distance from the statistical area to prefecture-level urban centers
Socioeconomic
factors
X7Change in population size (people)Calculate the interpolation of the statistical yearbook data for the period of 2000–2020 in the statistical area.
X8Change in agricultural population size
X9Change in total power of
agricultural machinery (104 kWh)
X10Change in value added of primary
industry (CNY)
X11Change in value added of secondary
industry (CNY)
X12Change in per capita GDP (CNY)
X13Change in government
tax revenue (CNY)
X14Change in local government general budget expenditure (CNY)
X15Change in total crop sown area (m2)
X16Change in total grain production (t)
X17Change in the share of value added by the primary industry (%)
X18Change in the share of value added by the secondary industry (%)
Table 3. Urban–agricultural–ecological space in the study area.
YearUrban SpaceAgricultural SpaceEcological SpaceProportion
20004791 92,719 55,628 0.03:0.61:0.36
20055876 91,193 56,069 0.04:0.60:0.37
20107503 88,000 57,636 0.05:0.57:0.38
20159439 86,799 56,900 0.06:0.57:0.37
202010,722 85,801 56,615 0.07:0.56:0.37
Table 4. Inter-transformation of Urban–Agricultural–Ecological space data.
Time IntervalTransformation Type
A → EA → UE → AE → UU → AU → E
2000–20053558.0 1018.6 3049.0 155.9 1.2 87.7
2005–20104312.2 1515.5 2634.3 188.6 0.6 77.1
2010–20153466.2 1883.7 4147.7 164.8 0.7 111.2
2015–20203322.4 1199.9 3524.1 126.4 1.0 42.7
Note: U, urban space; A, agricultural space; E, ecological space.
Table 5. Distance changes of three spatial categories relative to the main stem of the Yangtze River.
Away from YangtzeCloser to Yangtze
AdcodeChange(m)AdcodeChange(m)
Agricultural space4228231305.85 340521−679.24
340504615.39 420103−496.27
321003607.26 320105−489.94
340503590.55 340503−479.39
420222495.97 420106−471.65
500112492.21 340826−412.75
320612456.36 430602−376.07
500116452.66 420102−333.86
421126450.77 500103−329.31
420106392.76 420105−326.18
Ecological space3212832032.08 320612−2181.66
4210241457.55 340281−862.70
3206821294.92 421024−556.87
321183996.74 321012−544.47
321181977.12 320411−527.05
320411961.50 420103−516.90
320612887.84 321003−510.41
421002695.01 340826−460.21
321203689.57 420105−422.26
321012628.30 421127−381.56
Urban space4228238263.21 360481−1895.73
5002402710.11 511523−1524.54
3408261823.64 511524−1522.50
4205811700.51 510521−1437.95
4205061589.46 422823−1424.78
5115231560.23 341721−1422.06
5105211501.52 500115−1381.85
4211261390.06 320612−1310.18
5115041310.43 340722−1295.48
5115241191.42 421022−1282.92
Note: adcode refers to the administrative division code.
Table 6. The Q value of factors varied during spatial changes from 2000 to 2020.
Agricultural DistanceEcological DistanceUrban Distance
X10.04 *0.08 ***0.07 ***
X20.06 ***0.09 ***0.06 **
X30.06 **0.07 ***0.09 ***
X40.05 **0.02 0.07 ***
Avg.0.060.06 0.07
X50.07 ***0.04 **0.05 **
X60.06 ***0.06 ***0.04 **
Avg.0.07 0.05 0.05
X70.04 *0.01 0.02
X80.06 ***0.02 0.03
X90.03 0.01 0.01
X100.06 ***0.05 **0.02
X110.03 0.02 0.04 *
X120.05 **0.03 0.01
X130.10 ***0.05 **0.02
X140.04 **0.04 **0.03 *
X150.01 0.05 **0.01
X160.04 *0.08 **0.03 *
X170.06 ***0.02 0.04 *
X180.05 **0.01 0.04 **
Avg.0.05 0.03 0.03
* represents significance at the 95% confidence level, ** represents significance at the 99% confidence level, *** represents significance at the 99.9% confidence level.
Disclaimer/Publisher’s Note: The statements, opinions and data contained in all publications are solely those of the individual author(s) and contributor(s) and not of MDPI and/or the editor(s). MDPI and/or the editor(s) disclaim responsibility for any injury to people or property resulting from any ideas, methods, instructions or products referred to in the content.

