Article

Spatiotemporal Differentiation of Fertilizer and Pesticide Use and Its Driving Factors in the Yangtze River Delta of China: An Analysis at the County Scale

1
State Key Laboratory of Lake and Watershed Science for Water Security, Nanjing Institute of Geography and Limnology, Chinese Academy of Sciences, Nanjing 211135, China
2
University of Chinese Academy of Sciences, Beijing 100049, China
*
Author to whom correspondence should be addressed.
Land 2025, 14(6), 1180; https://doi.org/10.3390/land14061180
Submission received: 26 April 2025 / Revised: 20 May 2025 / Accepted: 27 May 2025 / Published: 29 May 2025

Abstract

:
Reducing fertilizer and pesticide use is a crucial path for the green transformation of agricultural production, which has garnered sustained attention in research on sustainable agricultural development. Based on the theoretical analysis, this article analyzes the spatiotemporal evolution characteristics of fertilizer and pesticide usage intensity (FUI and PUI) in the Yangtze River Delta (YRD) over the past 20 years and uses a Two-Way Fixed Effects Model to test their impacts and mechanisms. Findings show that agricultural development in the YRD shows a pattern of specialization and intensification with a significant north–south divide, with zero growth and reduction in fertilizer and pesticide use across the region from 2010 to 2015, but the current FUI and PUI are still nearly three and five times higher than the global average. Over the past 20 years, the FUI is high in the north and low in the south, high in the plains and low in mountainous-hilly areas, and high in suburban areas and low in remote counties. Adversely, the PUI is high in the south and low in the north, high in mountainous-hilly areas and low in plains, and high in suburban areas and low in remote counties. The FUI and PUI of characteristic agricultural areas of fruit, tea, and forestry in southern Anhui and southwestern Zhejiang, as well as the agroecological and facility agriculture clusters in southern Jiangsu and the suburbs of Shanghai, have approached the peak and successfully moved into the new green development stage earlier compared to other areas. In contrast, the grain and oil production plains areas along the Yangtze River, the coast, in northern Anhui, and in northern Jiangsu are relatively lagging behind. The combination of soil, water, light, and heat resource conditions and modes of agriculture production shape the absolute figures of FUI and PUI, and factors such as the level of local economic development and public fiscal expenditure significantly influence the trajectories of spatiotemporal differentiation in the progress of reducing fertilizer and pesticide in the YRD.

1. Introduction

The invention and adoption of synthetic agricultural inputs (e.g., chemical fertilizers and pesticides) have substantially boosted agricultural productivity, facilitated the process of agricultural scale-up and intensification, and contributed to alleviating the global food crisis since World War II [1]. However, the high-intensity use of fertilizers and pesticides has led to severe soil contamination and biodiversity loss, challenging sustainable agricultural development [2]. Currently, over half of the global agricultural land is at risk of pesticide pollution by more than one active ingredient, and nearly one-third is at high risk [3]. About two-thirds of the world’s nitrogen pollution is caused by agriculture, and the excessive use of chemical fertilizers is one of the main reasons [4]. Although China feeds 21% of the world’s population with only 9% of the world’s arable land and 6% of its water resources, it “consumes” nearly 30% of the world’s fertilizers and pesticides [5], and the ecological and environmental risks to agriculture sustainable development are prominent.
Since the reform and opening up, massive numbers of rural labors have migrated to cities and towns affected by the rising opportunity cost of agriculture [6]. China’s urbanization rate has risen from 17.9% in 1978 to 63.9% in 2020, profoundly influencing China’s economy and society. On the one hand, China’s agricultural production has rapidly developed in terms of scale, mechanization, and intensification, leading to a continuous increase in agricultural output, which has significantly contributed to ensuring national food security. However, this growth has been heavily reliant on high-intensity use of artificial inputs, resulting in noticeable degradation of agricultural resources and ecosystems [7]. In the long term, this not only threatens the sustainability of food security but also poses risks to the quality and safety of agricultural products, as well as to public health. On the other hand, there has been a dramatic shift in Chinese consumers’ dietary preferences and patterns [8], with an increasingly strong demand for healthy, green, and organic agricultural products [9,10]. In 2016, the Central Committee’s “No. 1 Document” first introduced the concept of “Agricultural Green Development” [11]. Subsequently, policy documents such as the “Opinions on Innovating the System and Mechanism to Promote Green Agricultural Development”, the “National Agricultural Sustainable Development Plan (2015–2030)”, and the “14th Five-Year Plan for National Agricultural Green Development” were successively issued, outlining systematic guidelines for the agriculture green transformation [11]. The “Action Plan for Zero Growth of Fertilizer Usage by 2020”, the “Action Plan for Zero Growth of Pesticide Usage by 2020”, the “Action Plan for Fertilizer Reduction by 2025”, and the “Action Plan for Pesticide Reduction by 2025” focus on key aspects such as reducing and improving the efficiency of inputs and propose strategic objectives and pathways for the reduction of major agricultural chemicals [11].
Meanwhile, scholars have carried out in-depth research and discussion on the agricultural green transformation by reducing fertilizers and pesticides and increasing their efficiency in China. Regional studies show that the use and intensity of chemical inputs, such as fertilizers and pesticides, in the eastern regions initially increased and then decreased, exhibiting a clear inverted “U-shaped” trend. In contrast, other regions only began to experience a slight decline after 2015 [12,13]. Nevertheless, FUI still exceeds national reference standards, with the highest intensity in the central and eastern regions [14]. In addition, compared to less developed regions, the transition toward more efficient agriculture and reduced reliance on agricultural inputs is more pronounced in developed regions [15]. At the level of crop structure, the focus of agricultural chemical consumption has gradually shifted from food crops to cash crops [16]. Research on the driving mechanisms indicates that macro-level socioeconomic development and related agricultural greening policies are key factors in decoupling agricultural chemical inputs from agricultural outputs [5,17,18]. Studies at the individual and household levels suggest that factors such as farmers’ characteristics (age, education level, and off-farm work) [6,19], land use conditions (farm size, fragmentation, and land ownership) [20], external government regulation (subsidies and technical training) [19,21], market factors (production inputs and agricultural product prices) [22,23], and cultural and social attributes [24] collectively influence agricultural chemical usage. Among these, farmers with higher levels of education, greater agricultural income share, larger operation scale, and more access to subsidies are more likely to adopt green production technologies, thereby promoting the reduction of agricultural inputs [19,20,21]. Nonetheless, the existing studies have predominantly focused on the change trend of the use of agricultural chemical inputs and the impact mechanism of green technology adoption. On the one hand, there has been less attention to the spatiotemporal differentiation of the use of inputs, especially in the urbanized areas with dense population and economic activities, developed urban agriculture, and high degree of intensive production. On the other hand, there has been less focus on the impact of regional differences in natural and resource conditions, agricultural types, economic and social development level, and other factors regarding reducing fertilizer and pesticide use, which is not conducive to the transition to greener agriculture in accordance with local conditions. In view of this, this paper intends to explore the spatiotemporal differentiation characteristics of fertilizer and pesticide use and its driving factors in the YRD based on the theoretical analysis.
The YRD benefits from superior soil and water resources, encompassing two of China’s primary grain-producing provinces. It is also one of the country’s most economically developed, densely populated, and highly urbanized areas. As a key agricultural production and consumption region, the YRD has a leading level of agricultural modernization and a high degree of commercialization of agricultural production, but high-intensity resource utilization and the use of agricultural chemical inputs have exerted tremendous pressure on the protection of agricultural soil and water resources. Under the dual pressures of resource constraints and policy support, the YRD has actively pursued the agricultural green transformation. Its innovative practices have provided a crucial model for the nation and have made the region a typical case for studying agricultural green development. Therefore, this study focuses on the YRD, using district and county as the units of analysis, to investigate the spatiotemporal differentiation and mechanisms of FUI and PUI from 2001 to 2020. The remainder of the paper is organized as follows: Section 2 outlines the key concepts and provides a brief theoretical analysis framework; Section 3 presents materials and methods; Section 4 provides the econometric results on the spatiotemporal evolution and driving mechanisms of FUI and PUI; and Section 5 and Section 6 present the discussion and conclusions.

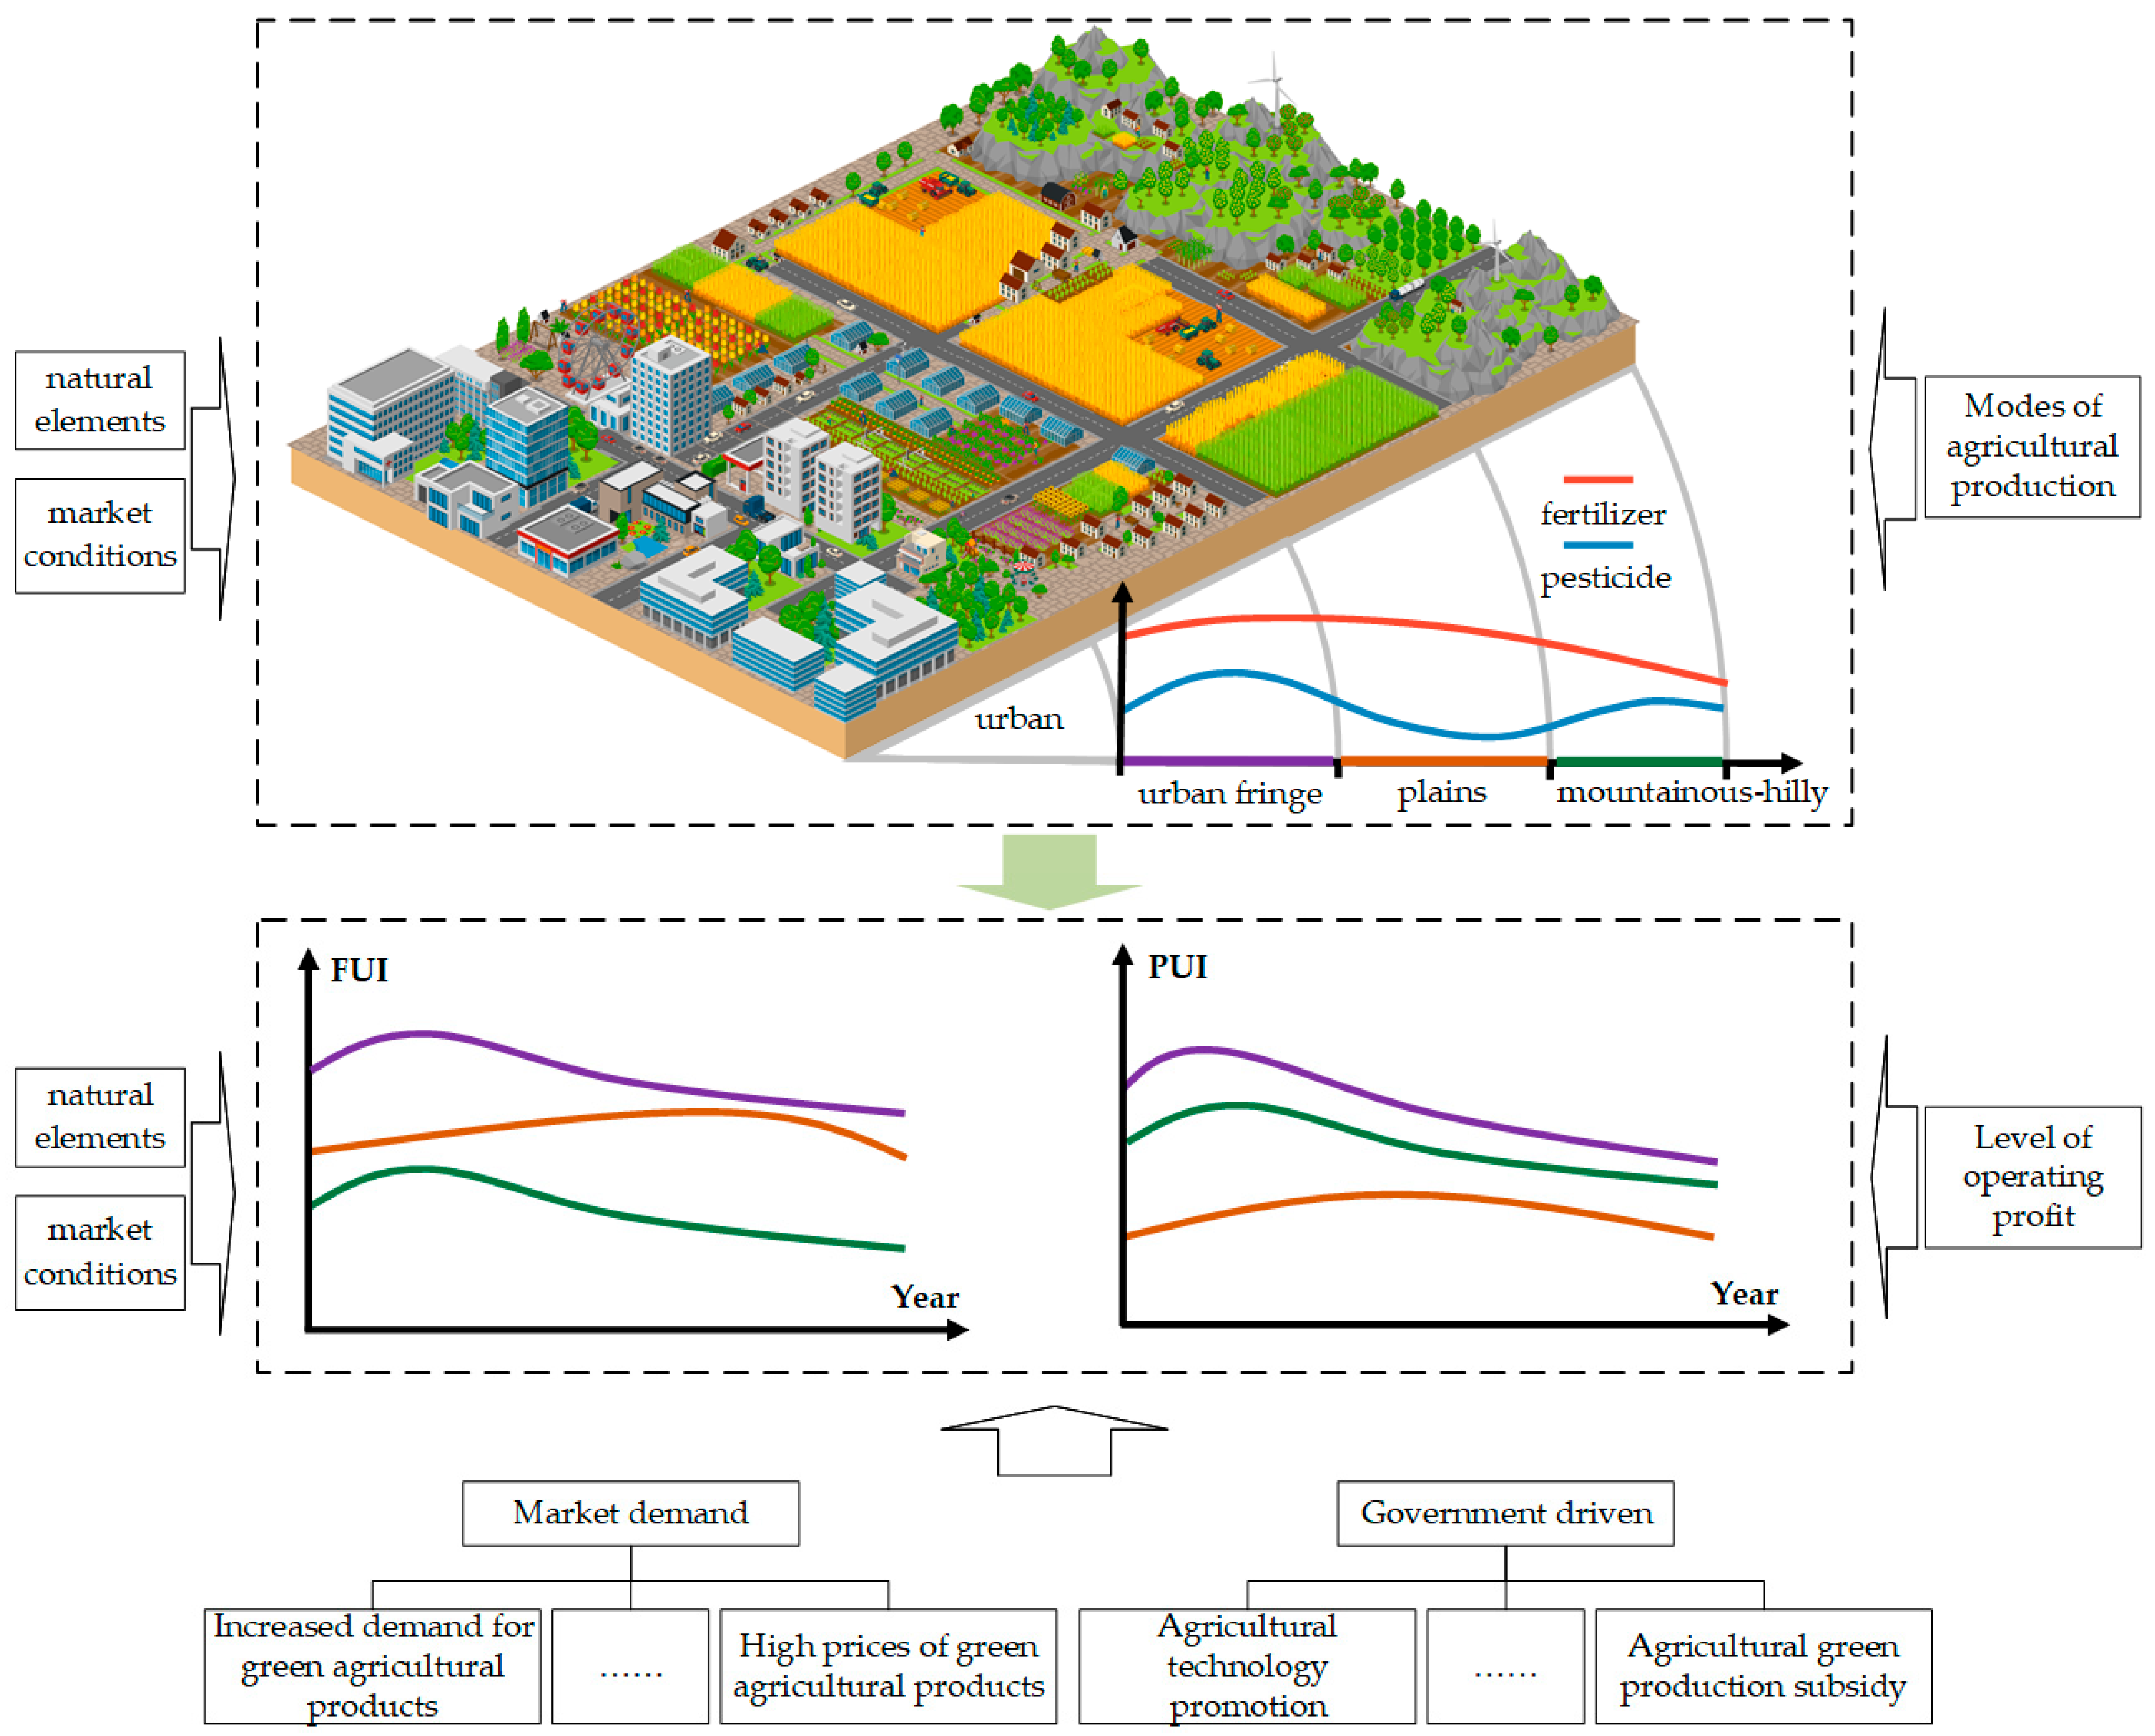
2. Theoretical Framework

As essential inputs in modern agriculture, fertilizers and pesticides play a critical role in enhancing crop yields; controlling pests, weeds, and diseases; and improving the quality of agricultural products. However, their long-term excessive application has resulted in severe issues such as soil degradation, non-point source agricultural pollution, and the loss of farmland biodiversity, posing significant threats to the sustainability of agricultural development. In response to these challenges, the reduction of and improvement in efficiency of fertilizer and pesticide use has become a key practical pathway for the green agriculture transformation. Although innovative measures and feasible pathways for agricultural green transformation may vary, the reduction of and efficiency improvement of fertilizer and pesticide use is widely regarded as a crucial practice and is often used as a key indicator of progress in agricultural green transformation [25].
From the perspective of agroecology, natural elements such as water, soil, sunlight, and temperature together constitute the environmental foundation of agricultural production systems, and their spatial heterogeneity fundamentally shapes the initial differentiation of cropping structures at the macro scale [26,27]. According to agricultural location theory, agricultural spatial organization under market conditions is closely tied to the distance from urban markets [28]. Due to their proximity to markets, suburban farmlands are often allocated to high-return crop production, which results in the dominance of high-value agricultural activities such as vegetable and fruit cultivation, facility-based farming, and recreational agriculture in urban fringe areas [29,30]. In contrast, cultivated land in the remote plains is rich in resources, subject to the constraints of arable land protection and food security policies [31] and coupled with the exodus of a large number of young and middle-aged laborers from the countryside, and large-scale grain and oil cultivation has become the dominant form in the remote plains [6]. Meanwhile, remote mountainous-hilly areas are often dominated by marginal arable land, which is limited by the lack of adequate irrigation, agricultural infrastructure, and other conditions, making it difficult to carry out large-scale production of food, horticultural crops, and other crops, and farmers then turn to the cultivation of specialty cash crops [32]. Given the differing input requirements and production modes across crop types, plains regions dominated by grain and oil crops are typically characterized by multiple cropping and large-scale operations, while suburban agriculture exhibits more intensive and multifunctional features [28], and mountainous-hilly areas generally follow extensive and specialized production patterns. Furthermore, the high cropping frequency of grain crops leads to increased annual biomass output and correspondingly higher annual fertilizer input compared to economic crops [33,34], whereas the latter generally demand higher pesticide inputs due to greater pest pressure and stricter quality requirements [16,35,36]. As a result, this may lead to a characteristic spatial gradient in FUI “high-high-low” from urban suburbs to remote plains and then to mountainous areas, and a “high-low-high” pattern for PUI (Figure 1).
In theory, with the onset of green transformation in agricultural production, the scale and intensity of dependence on agricultural chemicals may first increase, then slow down, and eventually decline after reaching a peak, presenting an overall inverted “U-shaped” trajectory [25]. However, due to regional differences in natural resource conditions such as water, soil, sunlight, temperature, market accessibility, agricultural types and scales, levels of economic development, and local fiscal capacity, the pace of agricultural green transformation varies significantly across regions [25]. As urbanization progresses, income disparities between urban and rural areas lead to the outmigration of rural labor. To compensate for labor shortages and maintain productivity, farmers tend to increase inputs such as fertilizers and pesticides, which results in continuously rising FUI and PUI [37]. Over time, the economic and population growth of cities contributes to increasing consumer demand for green agricultural products. Yet, the adoption of green technologies is often constrained by high upfront investment, technical complexity, and long payback periods [38]. Farmers’ decisions to adopt such technologies therefore heavily rely on marginal improvements in profit and external support from government institutions. Empirical studies show that the net returns per unit area of cash crops such as vegetables and fruits are significantly higher than those of staple grains [39,40], and this economic incentive makes growers of high-value crops more likely to adopt green production technologies. Furthermore, only when local governments possess sufficient fiscal capacity can they support the innovation and diffusion of agricultural green technologies [41]. In mountainous-hilly areas, land is often constrained by topographical complexity, poor soil fertility, and small fragmented plots, which together lead to low input-output efficiency and a higher likelihood of farmland marginalization and abandonment [42]. Consequently, areas dominated by cash crops and located near urban markets, as well as some mountainous-hilly regions, tend to reach the “inflection point” of FUI and PUI earlier. As labor continues to outflow, the scale effects generated by land transfer and large-scale farming in plains areas have successively contributed to the emergence of the “inflection point” in FUI and PUI (Figure 1) [6].

3. Materials and Methods
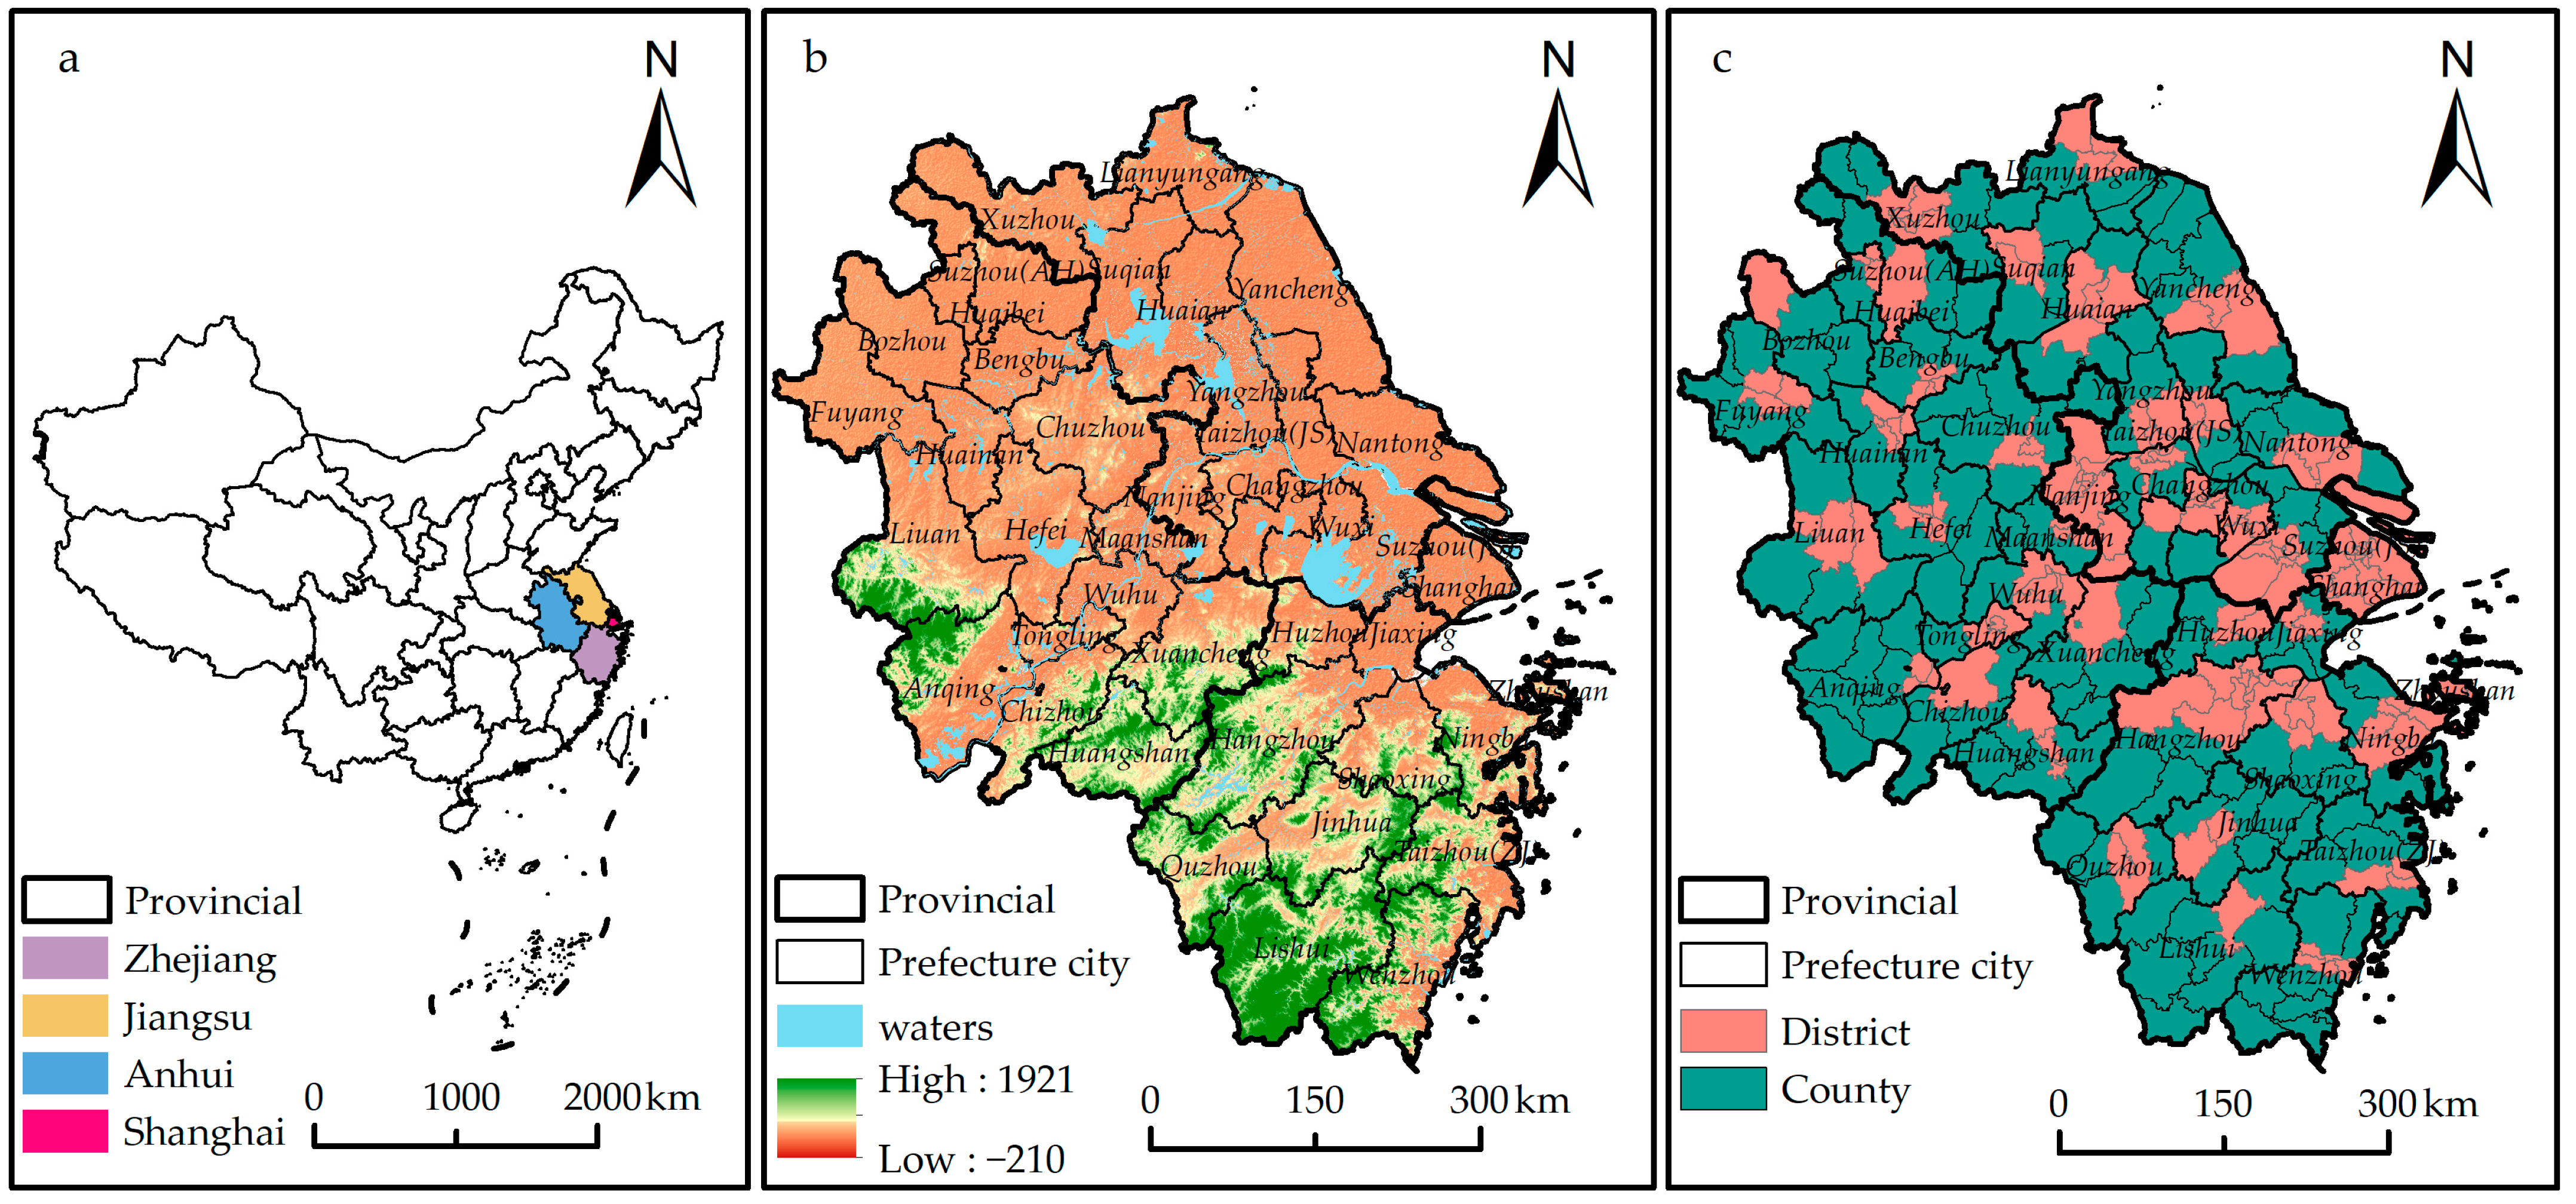
3.1. Study Area

The YRD includes the provinces of Jiangsu, Zhejiang, and Anhui, and the municipality of Shanghai, and it covers an area of 358,000 square kilometers (Figure 2). The YRD belongs to the subtropical monsoon climate zone, with four distinct seasons, moderate water and heat conditions, and high terrain in the south and low terrain in the north, with plains dominating in the north and mountainous-hilly areas dominating in the southwestern and southern parts of the region, which makes the conditions for agricultural cultivation superior and is suitable for a wide range of crops (Figure 2b). As of 2022, the urbanization rate of the resident population in the YRD was 72.0%, 6.8 percentage points higher than the national average, and the per capita disposable income of rural residents was 28,050 yuan, which was 1.4 times that of the national per capita disposable income in the countryside (20,133 yuan). As of 2021, the region’s primary industry employed about 16.4 million people, which accounted for about 9.6% of the country. The total sown area of agriculture is about 18,680 thousand hectares, accounting for about 11.1% of the country. However, the use of chemical fertilizers, agricultural films, diesel fuel, and pesticides is 6352 kilotons, 290 kilotons, 3587 kilotons, and 176 kilotons, accounting for 12.2%, 12.3%, 19.9%, and 14.2% of the country’s total, respectively. Although the use intensity of agricultural chemicals in the YRD is higher than the national average level, the transformation action of green production has been accelerated in recent years, and the reduction of agricultural chemicals has progressed rapidly.

3.2. Variable Selection

Combining previous research and theoretical analysis, and considering data availability, this study selected two dependent variables and eight independent variables (Table 1).
Elevation (DEM) and precipitation (PRE) represent the condition of soil and water resources for agricultural cultivation to a certain extent. In areas with flat terrain and fertile soil, the degree of contiguous farmland is high, and irrigation and mechanized operations are convenient, which is conducive to the large-scale and intensive cultivation of food crops. On the contrary, areas with large undulating terrain and infertile soils, with fragmented and smaller plots of arable land, are suitable for local characteristic crops such as forest, fruits, and tea.
Crop type (CT) and multiple cropping index (MCI) are used to characterize modes of agriculture production. There is a significant crop type gradient in the intensity of agrochemical inputs, with higher inputs per unit area for cash crops than for food crops, and the input demand in facility agriculture is even greater. MCI is an important indicator of land use intensity. A higher MCI means a higher land use intensity, which usually requires more fertilizers and pesticides.
Regarding the economy development level (EDL), with the continuous development of the economy, the dietary patterns of residents have been upgraded, and environmental awareness has awakened. The demand for agricultural products is gradually transforming toward green and organic agricultural products, resulting in a significant reduction in the reliance of agricultural production activities on chemical fertilizers and pesticides.
Regarding fiscal expenditure level (FEL), the adoption of new agricultural technologies faces significant cost constraints and risk premiums in the context of the current pilot demonstration phase of green production practices. Since the transition to greener agriculture has not yet formed a rigid constraint in the performance appraisal system for most local governments, policy advancement mainly relies on the autonomous institutional innovation of local governments, which makes FEL an important proxy variable for measuring the affordability of adopting green production technologies.
Agricultural mechanization level (AML) and population density (PD) are used as control variables. AML represents the process of agricultural modernization, and PD reflects the magnitude of agricultural product demand. Both are related to the use of chemical fertilizers and pesticides to a certain extent.

3.3. Methods

3.3.1. Mathematical Descriptive Statistical Analysis

FUI is represented by the amount of fertilizer (in pure equivalents) per unit of cultivated land area, while PUI is represented by the amount of pesticide used per unit of cultivated land area. The relevant formulas are as follows:
I F e r t = F e r t S
I P e s t = P e s t S
where I F e r t and I P e s t represent FUI and PUI. F e r t represents the fertilizer usage (in pure equivalents), P e s t represents the pesticide usage, and S represents the cultivated land area (including area under cultivation of grain, oilseeds, cotton, hemp, sugar, tobacco, vegetables, tea, mulberry, and fruits).

3.3.2. Two-Way Fixed Effects Model

Considering capturing the unobservable heterogeneity among analysis units as well as the temporal heterogeneity of analysis units, and at the same time effectively expanding the sample size, this paper adopts the Two-Way Fixed Effects panel econometric model (Two-Way Fixed Effects Model) to measure the influencing factors and the role of the characteristics of the FUI and PUI. The relevant formulas are as follows:
F i t = α 1 D E M i t + α 2 P R E i t + α 3 C T i t + α 4 M C I i t + α 5 E D L i t + α 6 E D L 2 i t + α 7 F E L i t + β 1 A M L i t + β 2 P D i t + μ i + γ t + ε i t
where F i t denotes the FUI and PUI in i county (district/city) in t year; α 1 , α 2 , α 3 , α 4 , α 5 , α 6 , and α 7 are the parameters to be estimated for the explanatory variables; β 1 and β 2 are the parameters to be estimated for the control variables. D E M i t , P R E i t , C T i t , M C I i t , E D L i t , F E L i t ,   A M L i t , and P D i t are the independent variables of i county (district/city) in t year. μ i , γ t , and ε i t denote the individual-fixed effect, time-fixed effect, and the disturbance term over time, respectively. The Two-Way Fixed Effects Model assumes that μ i is correlated with either explanatory variable, and this hypothesis is tested in this paper using a robust Hausman test.

3.4. Data Sources

The data used in this paper mainly include agricultural production data, socio-economic statistics, population data, cultivated land data, elevation data, precipitation data and administrative divisions (Table 2). The time-series data span the period 2001–2020. Considering the availability of economic, demographic, and input use data, this paper uses county (district/city) as the study units (district-level administrative units of prefecture-level cities are merged and collectively referred to as municipal districts; Longgang City and Cangnan County are merged), with 189 FUI units and 171 PUI units (Figure 2c). Because the data were affected by changes in administrative jurisdiction and incomplete data collection, some data and missing data were adjusted and supplemented using the trend extrapolation method or the mean value method.

4. Results

4.1. Spatiotemporal Differentiation Characteristics of Fertilizer and Pesticide Use in the YRD

Over the past 20 years, the total consumption of agrochemicals in the YRD has shown an inverted “U-shaped” process of change, first increasing and then decreasing (Figure 3). Among them, fertilizer usage (FU) reached a maximum value of 7722 kilotons in 2011, followed by a slight, then significant and continuous, decrease to 6456 kilotons in 2020, with an average annual decrease of 2.0%; pesticide usage (PU) reached a peak value of 249 kilotons in 2010, and then fell to 173 kilotons in 2020, with an average annual decrease of 3.6%. Similar to the trend of total volume change, the intensity of agrochemical use in the YRD from 2001 to 2020 also shows an inverted “U-shaped” change (Figure 3). Among them, the FUI continued to increase before 2011, hovered around 560 kg/ha from 2011 to 2015, and then declined to 478 kg/ha in 2020, but even so, the FUI in the YRD in 2020 was still 2.1 times the upper limit of the international safety standard for fertilizer usage (225 kg/ha) [44]. Since 2001, the PUI in the YRD has continued to increase from 16 kg/ha to a maximum of 19 kg/ha in 2010 and then gradually decreased to 13 kg/ha in 2020, with an average annual decline of 3.5%.

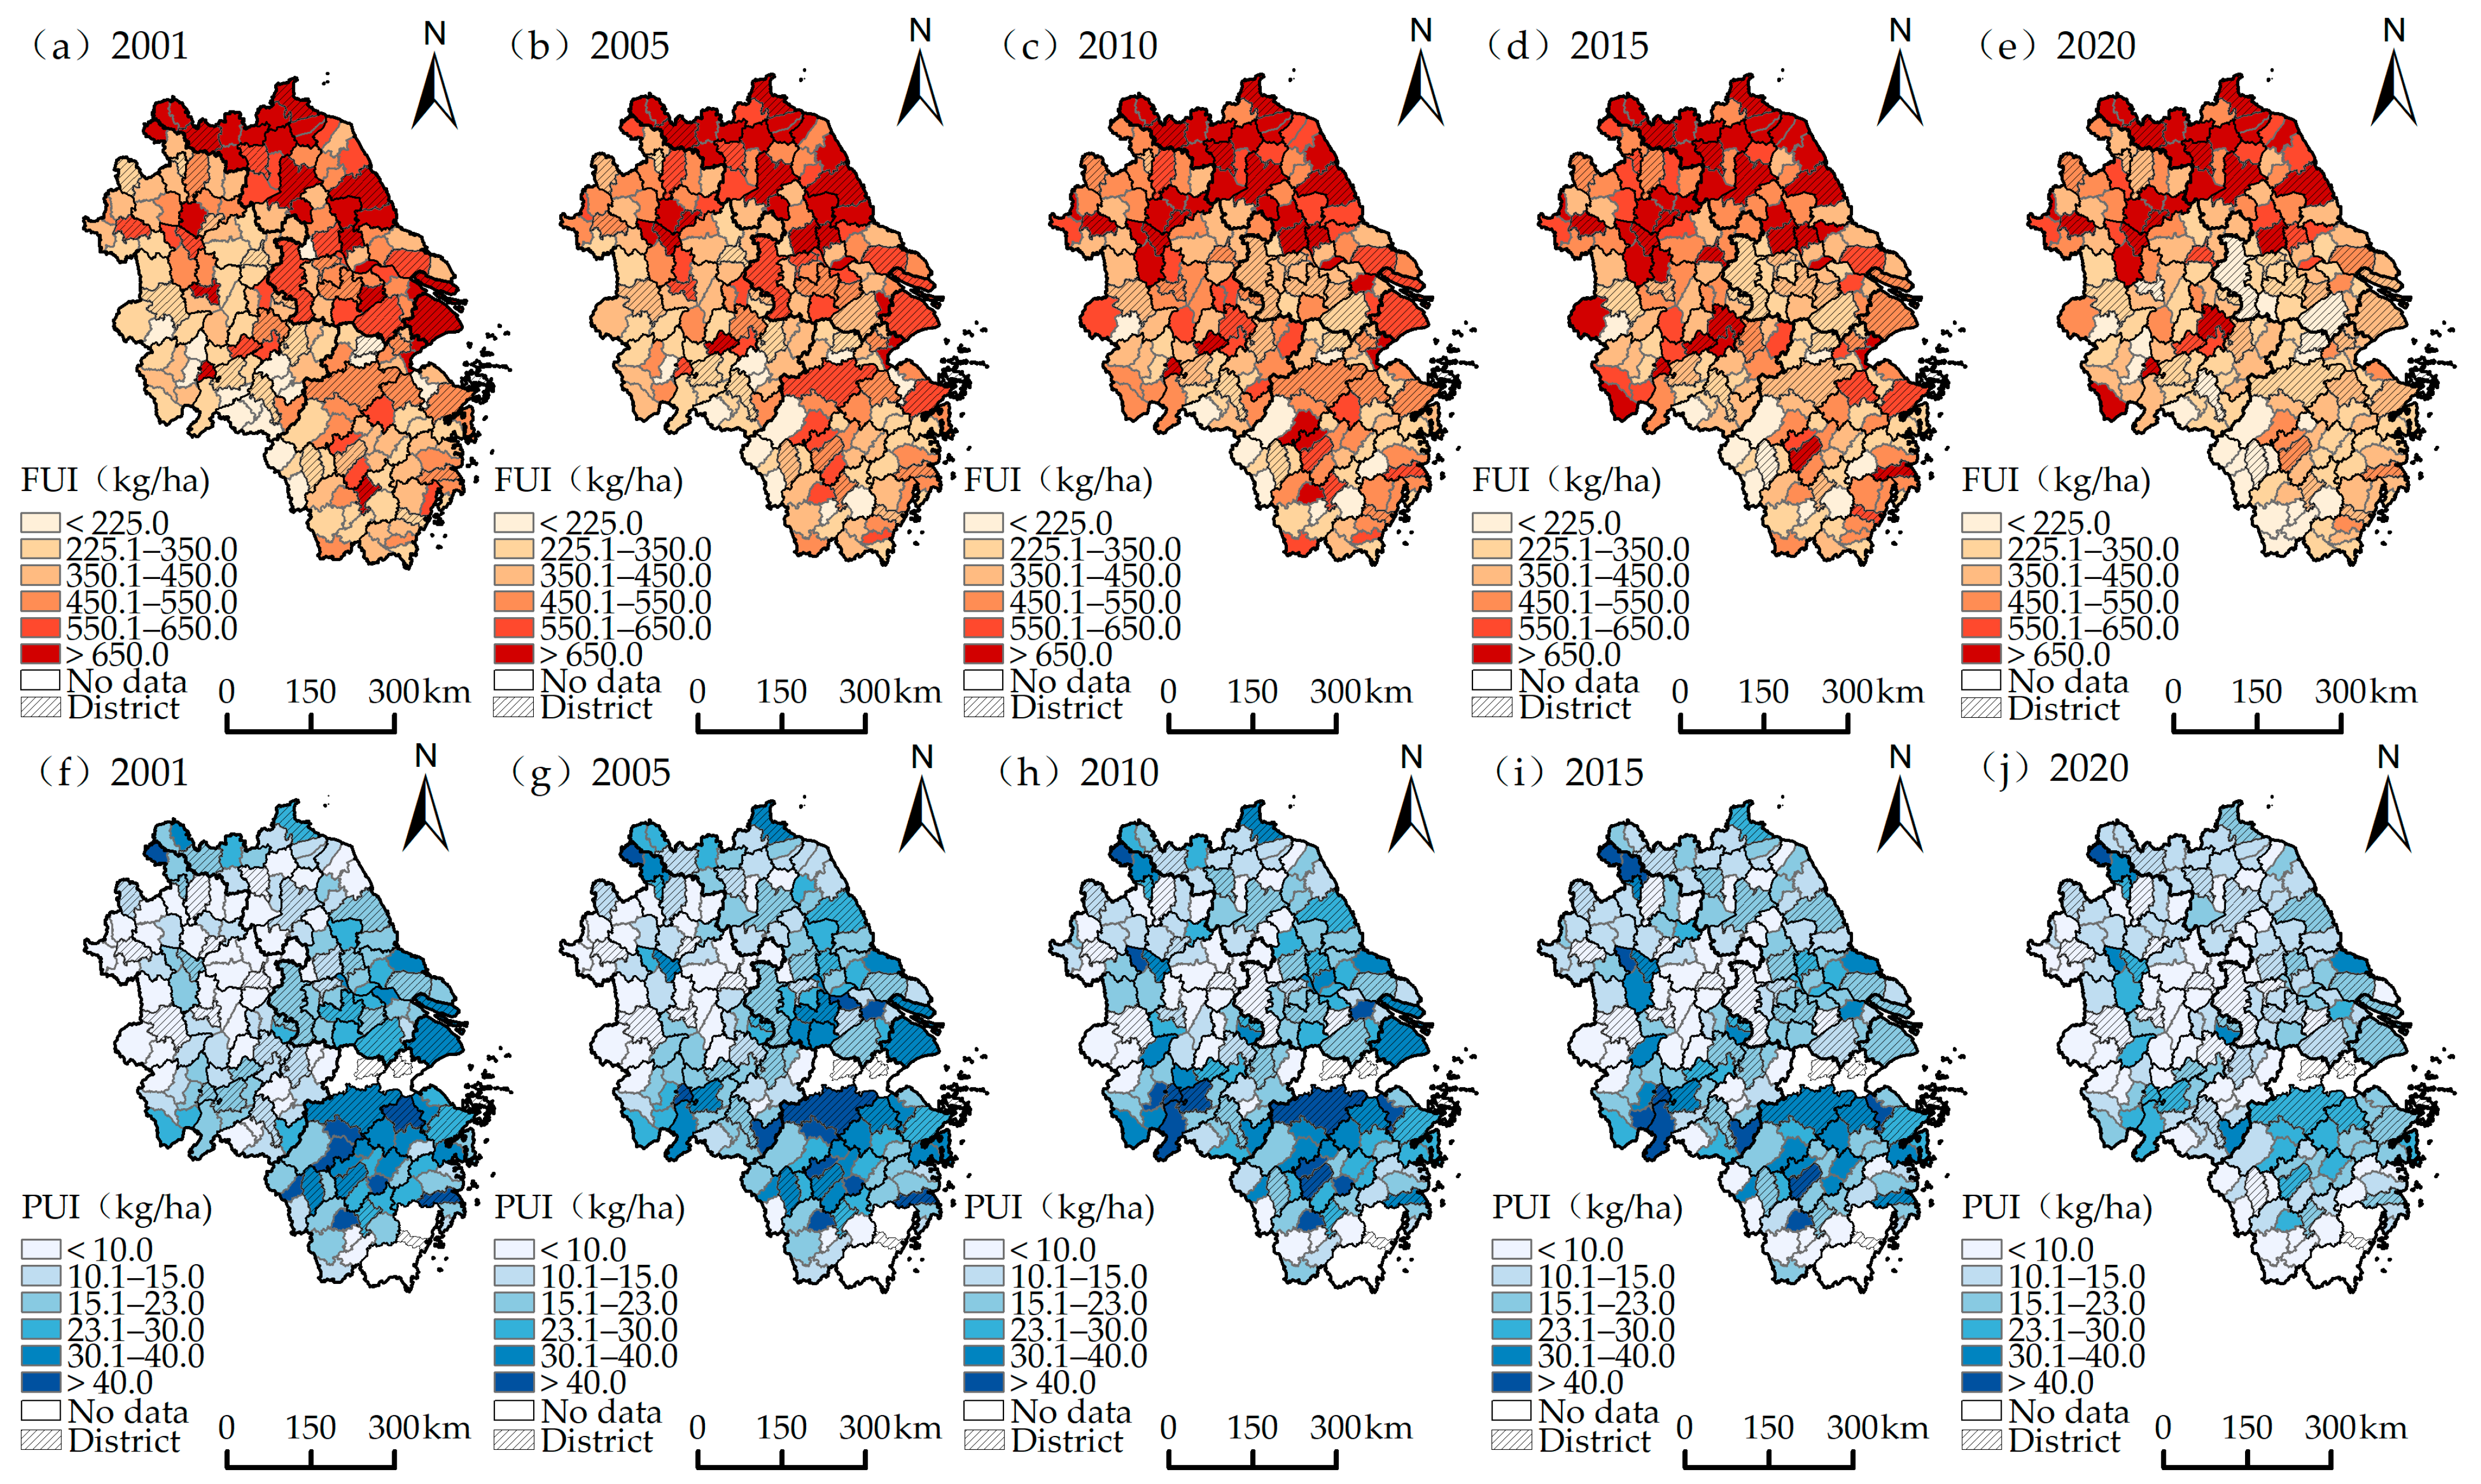
4.1.1. Characteristics of FUI and PUI in Spatial Cross Sections

To better visualize the spatial pattern characteristics of FUI and PUI, we selected spatial distribution cross sections for five representative years (2001, 2005, 2010, 2015, and 2020) (Figure 4). With the implementation of the National Fertilizer Reduction and Efficiency Increase Action (2015), the FUI in the counties (districts/cities) of the YRD gradually decreased. The number of counties (districts/cities) with FUI higher than 550 kg/ha declined from 63 to 40, decreasing from 33.3% to 21.2%. Meanwhile, the number of counties (districts/cities) with FUI less than 350 kg/ha increased from 47 to 71, rising from 24.9% to 37.6%. However, the overall spatial pattern of “high in the north and low in the south, low in plains and high in mountains-hilly areas” has remained unchanged. Notably, the reduction in high FUI areas has been concentrated in some plains regions of northeastern Anhui, northern Jiangsu, and along the Yangtze River in Anhui. Due to the intensive development of agriculture in these plains, FUI in these areas remains mostly above 650 kg/ha. In contrast, in mountainous-hilly areas such as southern Anhui and southwestern Anhui, southwestern Zhejiang, and southern Zhejiang, where agriculture is characterized by small scale and a low level of intensification, and regions along the Yangtze River, the southern Jiangsu Plain, and Shanghai, where the transformation toward agricultural green production has been relatively rapid, they generally exhibit FUI mostly below 350 kg/ha.
Similar to the changes in FUI, the number of counties (districts/cities) with PUI higher than 30 kg/ha declined from 29 to 6, decreasing from 17.0% to 3.5%. Geographically, these high-usage areas gradually contracted to central Zhejiang and southern Anhui. Meanwhile, the number of counties (districts/cities) with PUI less than 15 kg/ha increased from 74 to 115, rising from 43.3% to 67.3%. Although the overall spatial pattern of “high in the south and low in the north, high in mountainous-hilly areas and low in plains” still persists, it has been somewhat weakened. Notably, counties (districts/cities) such as Dongzhi and She in southern Anhui and Jiande in southwestern Zhejiang, likely due to the extensive management practices associated with characteristic agricultural activities such as forestry, fruit, and tea production, as well as municipal districts under the jurisdiction of cities like Hangzhou and Jinhua, largely influenced by multiple cropping systems in urban and facility-based agriculture, generally exhibit PUI above 20 kg/ha. In contrast, major grain and oil crop production areas in the plains along the Yangtze River, coastal regions, and northern Anhui have experienced a relatively rapid transition toward agricultural green practices, and they generally exhibit PUI below 15 kg/ha.

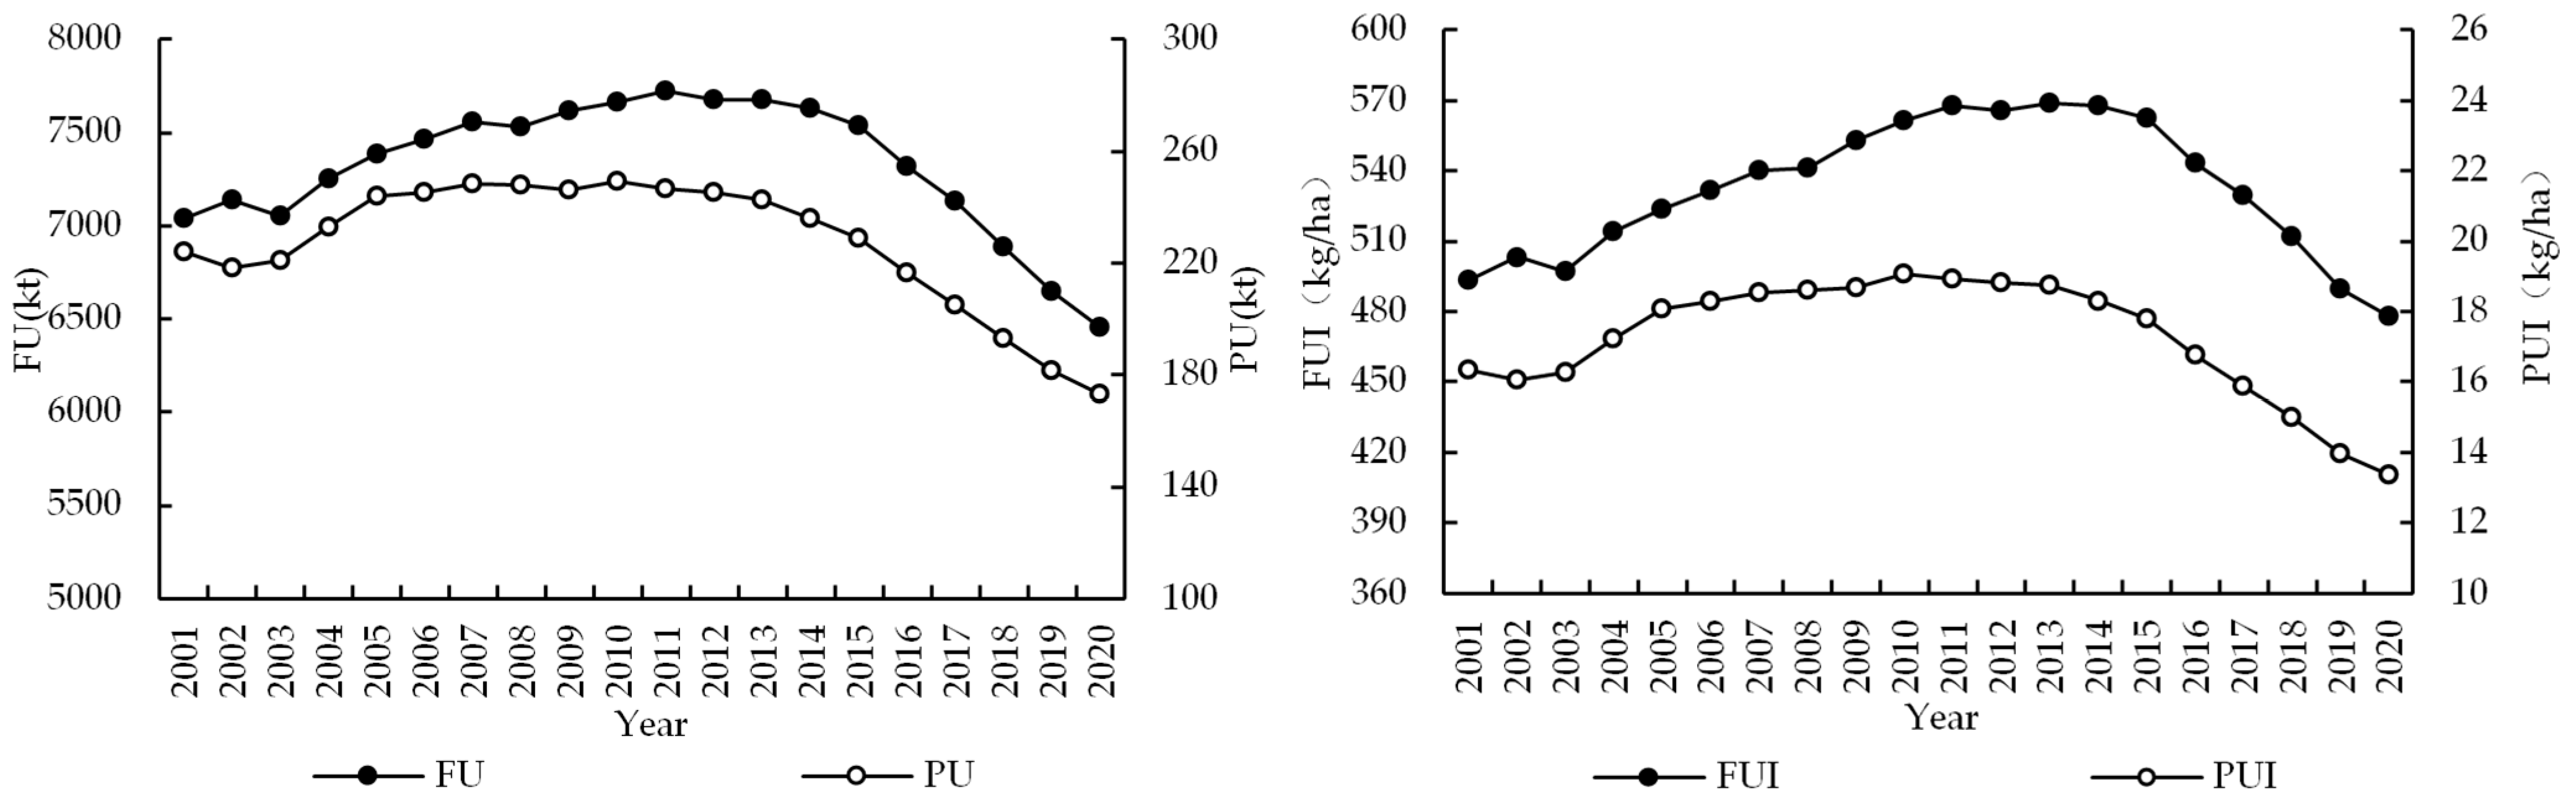
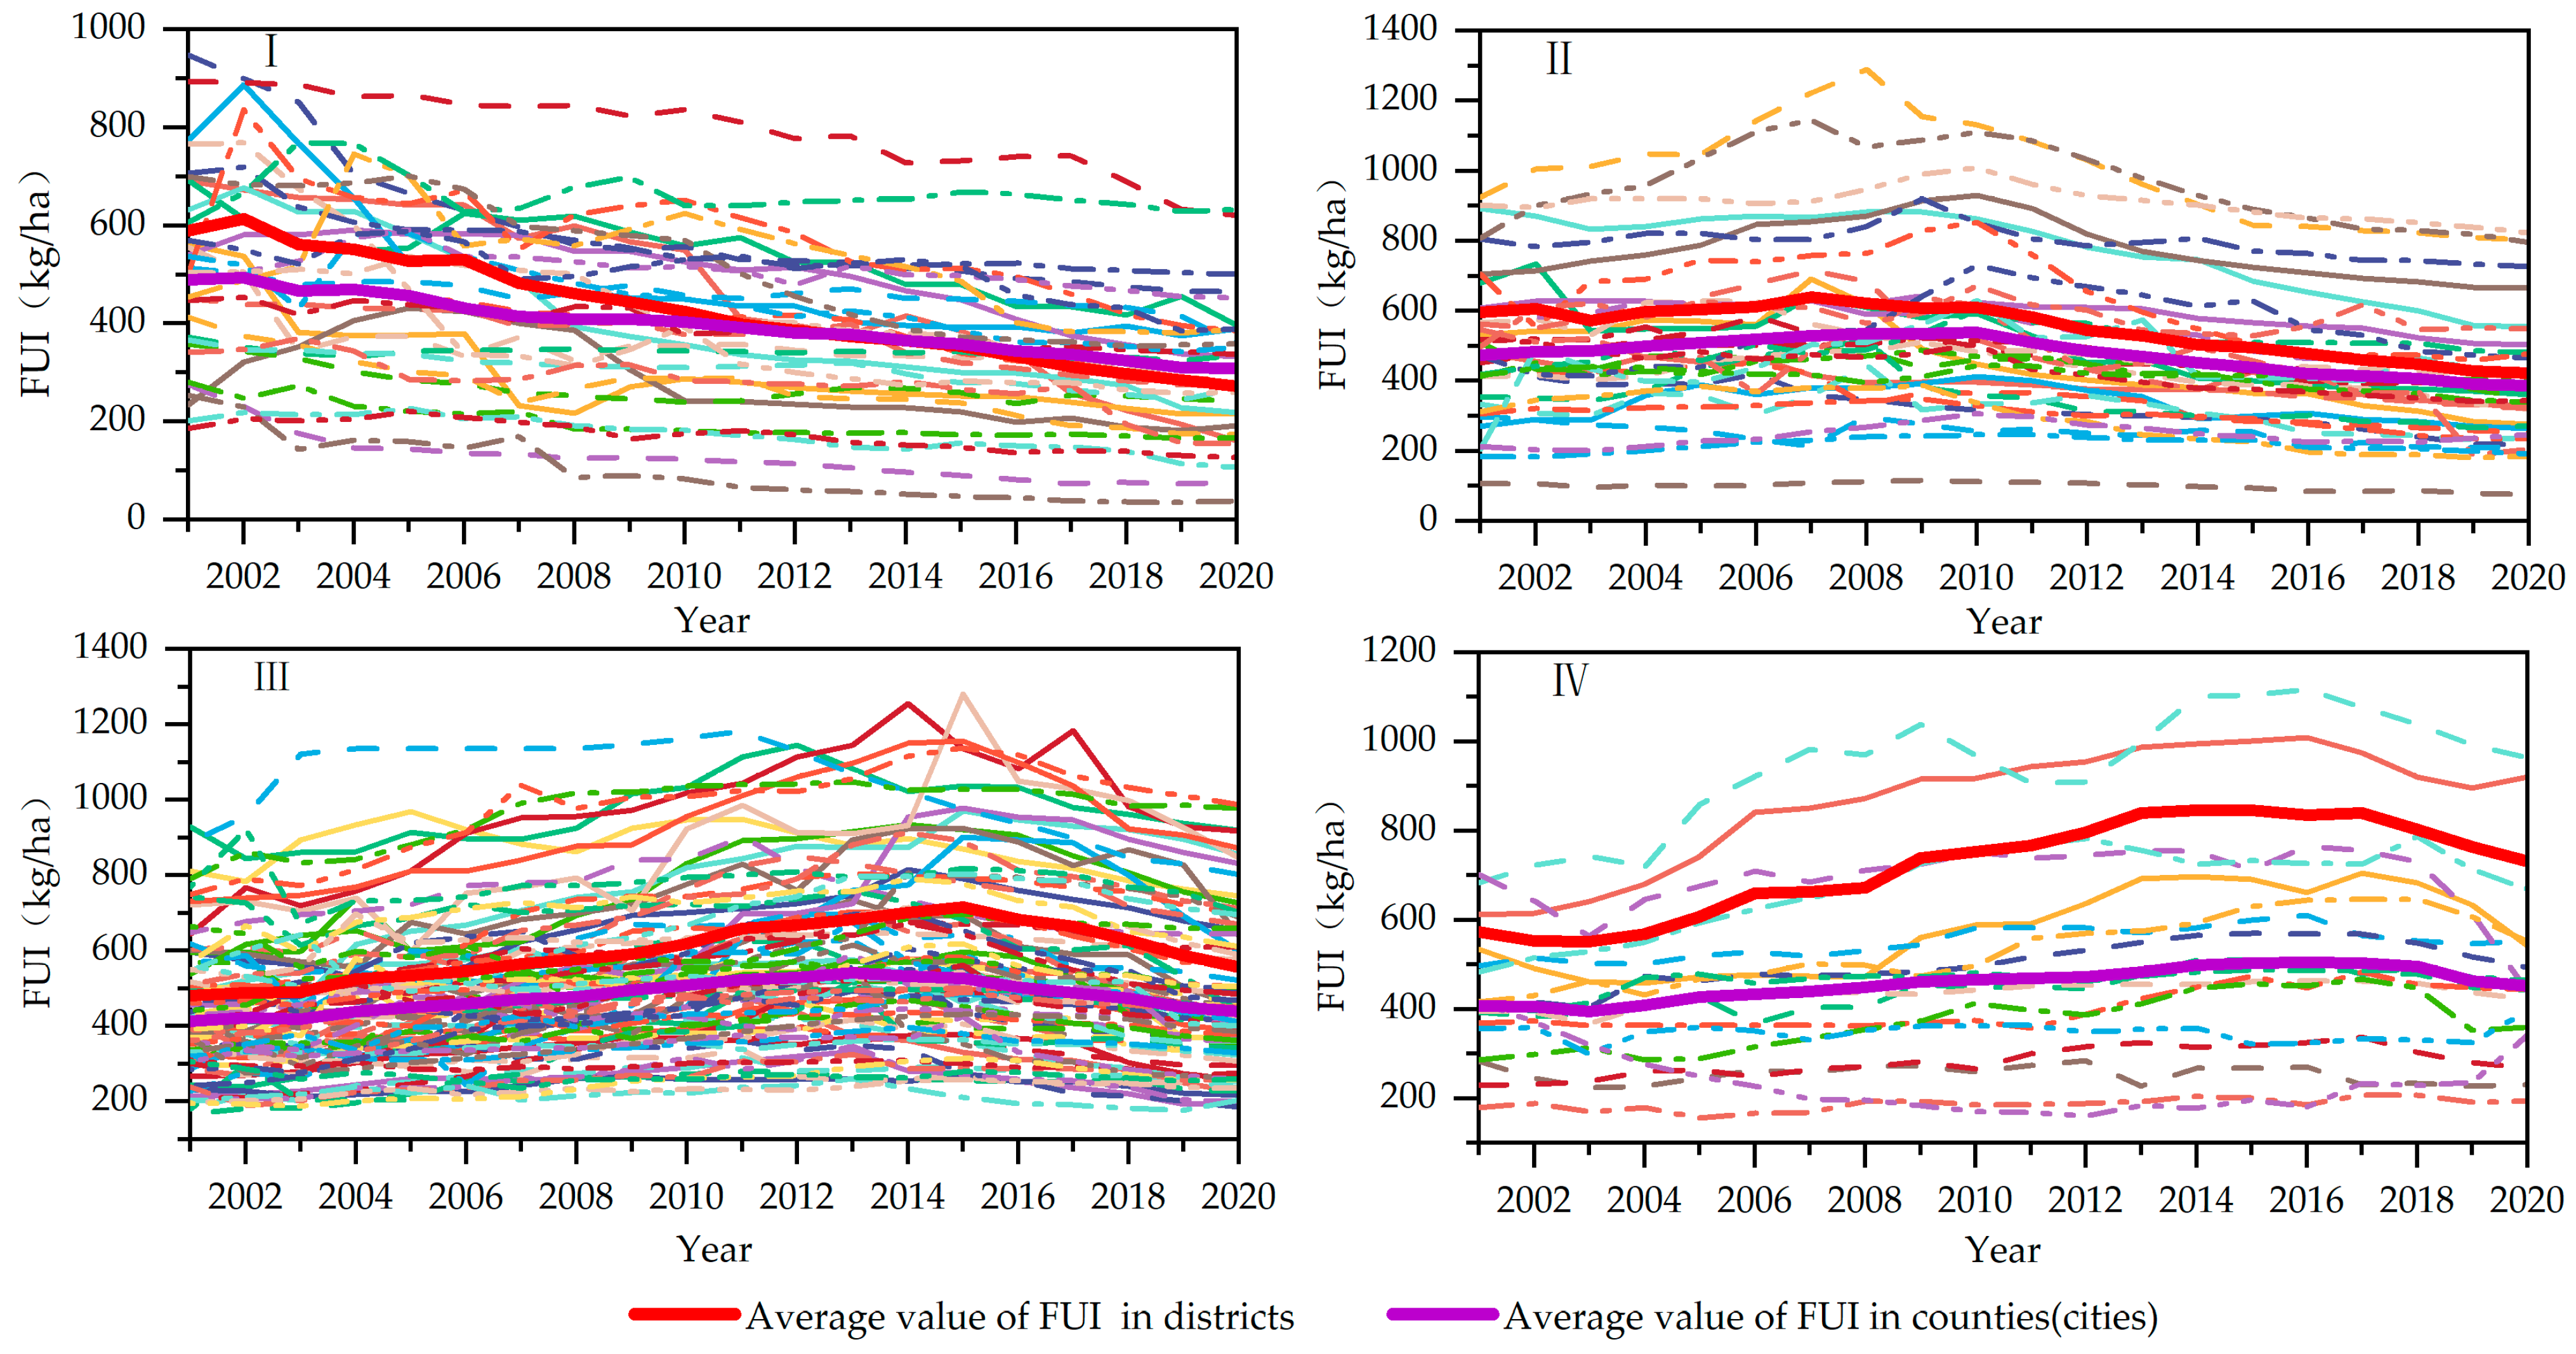
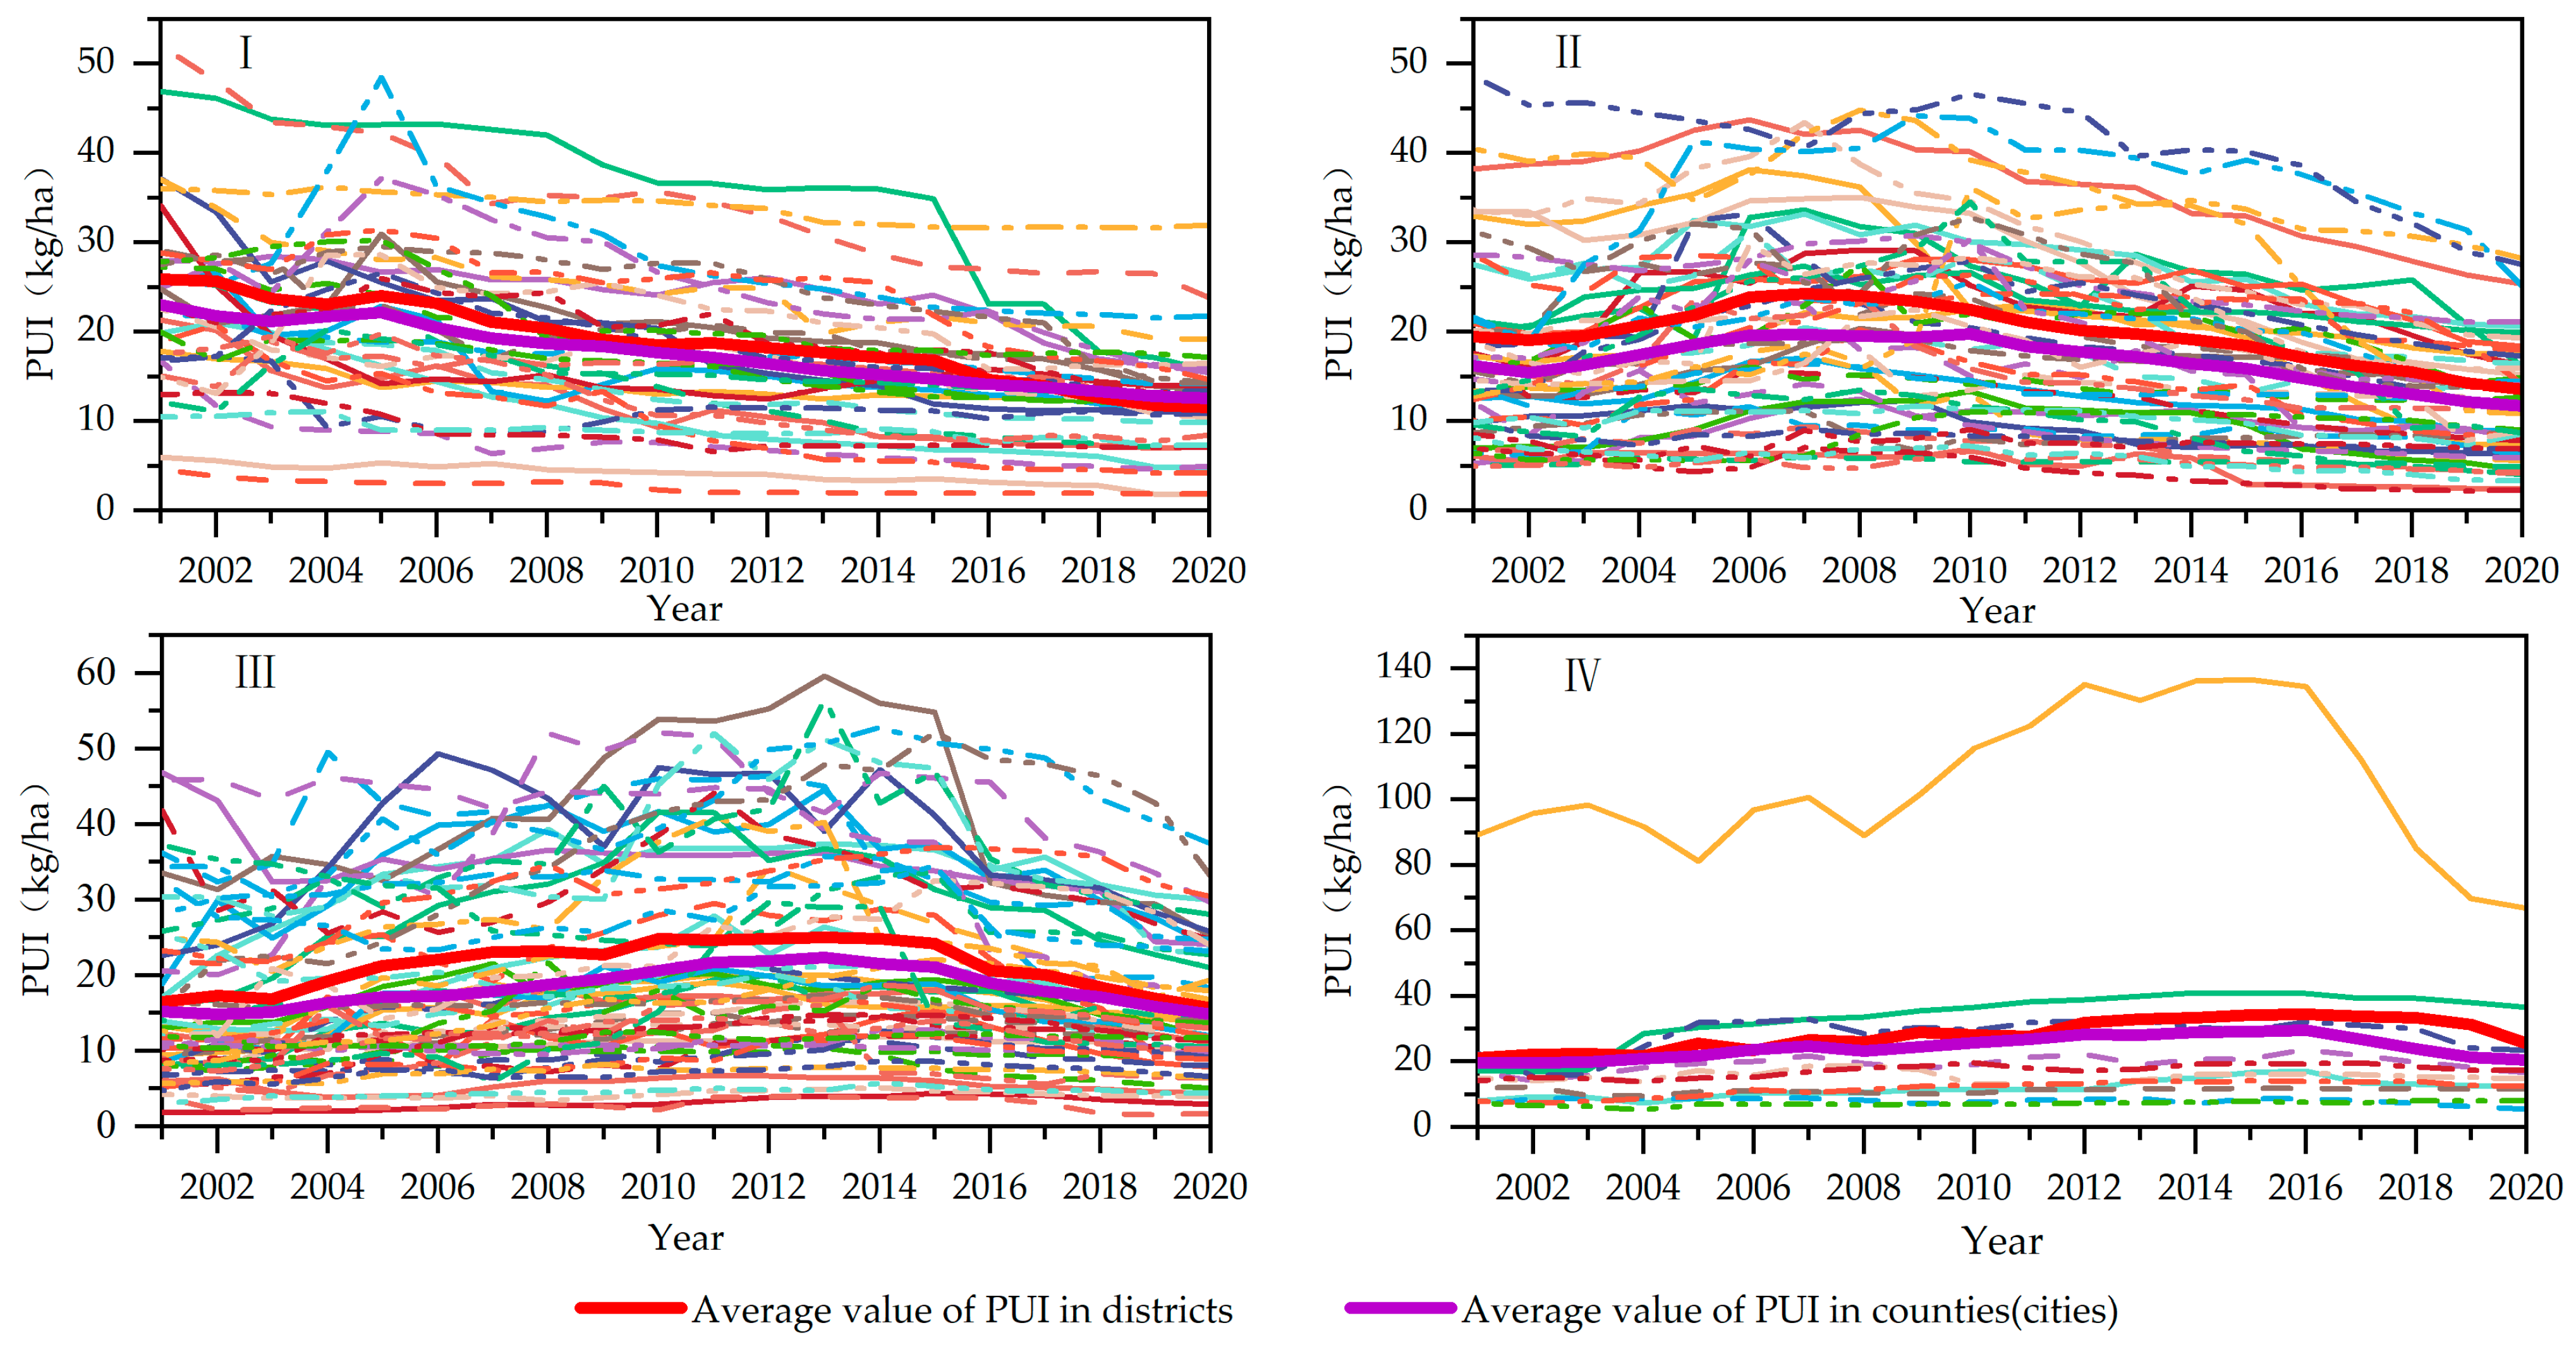
4.1.2. Characteristics of FUI and PUI in Time Series

According to the time sequence of the occurrence of the inflection point of the “rising and then falling” FUI and PUI in each county (district/city), they are classified into four categories: I, II, III, and IV. In terms of FUI, the “inflection point” of Type I counties (districts/cities) occurred in 2005 or earlier, with a total of 34 counties (districts/cities) (approximately 18.0% of the YRD), and was mainly distributed in the Yangtze River City Cluster, Shanghai, and southwestern Zhejiang; the “inflection point” of Type II counties (districts/cities) occurred in 2006–2010, with a total of 37 counties (districts/cities) (approximately 19.6% of the YRD), and was mainly distributed in counties (districts/cities) on the periphery of Type I; the “inflection point” of Type III counties (districts/cities) occurred in 2011–2015, with a total of 100 counties (districts/cities) (approximately 52.0% of the YRD), and was mainly distributed in the whole area of Anhui, northern Jiangsu, and eastern Zhejiang; the “inflection point” of Type IV counties (districts/cities) occurred in 2016 or later, with a total of 18 counties (districts/cities) (approximately 9.5% of the YRD), scattered in the northern plains of the YRD and eastern Zhejiang (Figure 5).
In terms of FUI, the “inflection point” of Type I counties (districts/cities) occurred in 2005 or earlier, with a total of 37 counties (districts/cities) (approximately 21.6% of the YRD), and was mainly distributed in the Yangtze River City Cluster, the coastal areas of Jiangsu, and the southwest and central part of Zhejiang; the “inflection point” of Type II counties (districts/cities) occurred in 2006–2010, with a total of 57 counties (districts/cities) (approximately 33.3% of the YRD), and was mainly distributed in the central part of Jiangsu, the central part of Anhui, Shanghai, and Hangzhou; the “inflection point” of Type III counties (districts/cities) occurred in 2011–2015, with a total of 65 counties (districts/cities) (approximately 38.0% of the YRD), and was mainly distributed in northern Anhui, southern Anhui, northern Jiangsu, and northeast Zhejiang; the “inflection point” of Type IV counties (districts/cities) occurred in 2016 or later, with a total of 12 counties (districts/cities) (approximately 7.0% of the YRD), scattered in the northern plains of the YRD (Figure 6).
From the change range of FUI (Figure 7), the decreasing areas of FUI from 2001 to 2020 were mainly distributed in the counties (districts/cities) in southern Jiangsu and most of Zhejiang, while the rising areas of FUI were mainly distributed in the counties (districts/cities) in northern Jiangsu and most of Anhui; among them, the decline of FUI in the Yangtze River City Cluster, southern Zhejiang, and other counties (districts/cities) was the earliest and the largest, mostly more than 10%; the decreasing areas of FUI in northern Anhui, northern Jiangsu, and other counties (districts/cities) started relatively late and by a small margin, basically after 2015. Different from FUI, the decreasing areas of PUI were relatively more. From 2001 to 2020, the decreasing areas of PUI were mainly distributed in counties (districts/cities) in southern Jiangsu, the central part of Jiangsu, most of Zhejiang, and southern Anhui, while the rising areas of PUI were mainly distributed in the counties (districts/cities) in northern Jiangsu and northern Anhui; among them, the decreasing areas of PUI in counties (districts/cities) in the Yangtze River City Cluster and southern Zhejiang were the earliest and the largest, mostly more than 10%; the decreasing trend of PUI has begun to spread to most counties (districts/cities) in the YRD except northern Anhui after 2010, and the whole region of the YRD basically showed a downward trend after 2015. Notably, regions such as Wuxi and Suzhou that had demonstrated significant reductions in FUI and PUI before 2015 began to slow down after 2015 relative to other areas.
This indicates that the core areas of the YRD, including the Yangtze River City Cluster, Shanghai, and the southwestern part of Zhejiang, were the first to initiate the green transition in agricultural production through early efforts to reduce the use of fertilizer and pesticides. In contrast, the process of reducing fertilizer and pesticide use progressed relatively slowly in the northern part of Jiangsu, most parts of Anhui, and the southeastern part of Zhejiang. Notably, an analysis of the trends in FUI and PUI reveals that, among the four categories, the average usage intensity in municipal districts was consistently higher than in surrounding counties (cities) (Figure 5 and Figure 6). It indicates that agricultural production in the suburban areas dominated by facility agriculture is more intensive, and cultivated soils are subjected to greater environmental pressure.

4.2. Influence Mechanism of Fertilizer and Pesticide Use Evolution in YRD

Influenced by multiple factors, changes of FUI and PUI show obvious regional differences between urban fringe and remote areas as well as between plains and mountainous-hilly areas in the YRD. Building upon the theoretical analysis, a Two-Way Fixed Effects Model is used to test the impacts and underlying mechanisms of spatiotemporal differentiation of FUI and PUI.
The results of the multicollinearity test (Table 3) show that the VIF values are less than 5, indicating that there is no multicollinearity between the variables. The F-tests for individual and time effects reveal that the coefficients of individual and time dummy variables are significant across different regional samples, suggesting the presence of notable individual and time effects, which need to be controlled. Furthermore, the Hausman test shows that the hypothesis that both individual- and time-fixed effects are uncorrelated with the dependent variable is significantly rejected for the different regional panel data; thus, the Two-Way Fixed Effects Model controls for both individual and time effects.
Benchmark Regression. In the benchmark regression, the addition of control variables significantly improved the model’s goodness of fit (Table 4). As shown in Table 4, DEM exhibits a significantly negative association with both FUI and PUI at the 1% level, suggesting that higher altitude leads reduction in the use of fertilizers and pesticides. PRE also demonstrates significant impacts on both FUI and PUI at the 1% level, where it suppresses FUI but promotes PUI. This indicates that increased precipitation may dilute pesticide effectiveness, thereby increasing application rates. CT is another critical factor significantly affecting both FUI and PUI at the 1% level. Specifically, a higher proportion of grain crop cultivation significantly increases FUI but suppresses PUI, reflecting that grain production relies more heavily on fertilizers, whereas economic crop production is more dependent on pesticides. These differences may stem from varying agronomic characteristics, pest and disease dynamics, and farmers’ input-decision-making behaviors. Grain crops typically require greater nutrient input to sustain yields, while economic crops, due to their higher market value, drive farmers to intensify pesticide use to protect economic returns. MCI significantly increases both FUI and PUI at the 1% level, aligning with theoretical expectations. Thus, the above variables explain to some extent the “high-high-low” pattern of FUI in the YRD from urban suburbs to remote plains to mountainous-hilly areas, as well as the “high-low-high” pattern of PUI.
EDL and the quadratic term of EDL(EDL2) are both significant at the 10% level, where EDL is significantly positive and EDL2 is evidently negative, proving that the use of chemical fertilizers and pesticides in the theoretical analysis shows an inverted “U-shaped” change characteristic with the development of the economy. Although FEL shows no significant direct effect on FUI, it significantly suppresses PUI at the 1% level. This may indicate that counties (districts/cities) with stronger fiscal capacity are more capable of implementing food-safety supervision, promoting green technologies, and providing subsidies to support the replacement of chemical fertilizers with organic alternatives and the adoption of green pest-control methods, thereby enhancing the efficiency of agrochemical use. It is noteworthy that local governments appear to exert stronger regulatory influence over pesticide use compared to fertilizer use, which may help explain why the transition in PUI has occurred earlier and more prominently than that of FUI across the YRD.
Lastly, AML is significantly and positively associated with both FUI and PUI at the 1% level, implying that increased mechanization may intensify the use of agrochemicals. Therefore, future efforts should focus on developing, promoting, and diffusing agrochemical-saving agricultural machinery to foster deeper integration between mechanization and green production technologies. Additionally, PD at 1% level of significance on promoting fertilizer use suggests that densely populated areas may have higher pressure on agricultural production.
Robustness Check. To further validate the effects of the explanatory variables on FUI and PUI, this paper removes the most recent 4 years of data for robustness tests. The results of the robustness check (Table 5) show that the estimated effects of the variables on FUI and PUI remain largely consistent, indicating the stability of the findings.
Heterogeneity analysis. Considering the significant regional differences in the evolution of FUI and PUI in economically developed regions, plains, and mountainous-hilly regions, this study is divided into municipal districts, plains counties (cities) with an average altitude of less than 100 m, and mountainous and hilly counties (cities) with an average altitude of more than 100 m. On this basis, heterogeneity analysis was conducted, and the results are shown in Table 6 and Table 7. It is clear that EDL and EDL2 are significant for both FUI and PUI in the municipal areas, where EDL is significantly positive and EDL2 is significantly negative, indicating that there is an inverted “U-shaped” relationship between EDL and agrochemical input use. Then, we further exclude EDL2 and find that EDL is significantly positive, except for FUI in plain counties. It may suggest to some extent that fertilizer and pesticide use in municipal districts turns the corner earlier than in other areas based on the ongoing economic growth.

5. Discussion

The application of fertilizers and pesticides has broken through the bottleneck of traditional agriculture, which relied on the natural restoration of soil fertility, by reducing crop losses and increasing yields [45], which has supported the specialization and intensification of agricultural production. Meanwhile, growing environmental pressure has been driving a shift toward greener and more sustainable agricultural practices [7]. However, the replacement of traditional chemical fertilizers with organic and controlled-release alternatives, alongside the adoption of biophysical and other green pest-control technologies, has increased agricultural production costs to some extent. As these approaches not only require additional financial investment but also face challenges in aligning with existing production systems, it thereby introduces uncertainty and risk to the maintenance of short-term agricultural output [25]. This suggests that the transition toward greener agricultural production requires a strong local economic foundation. Regions with higher levels of economic development and stronger fiscal capacity are more likely to implement large-scale subsidy programs to rapidly promote the adoption of new fertilizers and green control measures, thereby achieving a rapid reduction in fertilizer and pesticide use intensity [5,18]. In contrast, agricultural transformation may lag behind in less developed regions and is more likely to occur only after agricultural green technologies become more mature and affordable, enabling the eventual upgrading and replacement of conventional production practices.
Since the study mainly relies on macro-level indicator variables (e.g., EDL, FEL, etc.), the coverage of the factors that directly affect fertilizer and pesticide use is relatively limited, such as the lack of a comprehensive way to capture the specific impacts of farmers’ production behaviors, technology adoption, and policy implementation on the transition, which may lead to a certain bias in empirical interpretations. Meanwhile, macro factors such as market demand, government subsidies, and residents’ dietary structure are difficult present in the model due to difficulty in collecting complete sequence data. In the future, it is necessary to systematically carry out field surveys in different agricultural regions of the YRD and elaborate the detailed process of fertilizer and pesticide reduction and the underlying driving mechanism, which might be significant for optimizing supportive policies in terms of transition to sustainable agriculture.

6. Conclusions

Based on the theoretical deduction, this article analyzes the spatiotemporal evolution characteristics of FUI and PUI in the YRD over the past 20 years, and it uses a Two-Way Fixed Effects Model to test their impacts. The main findings are summarized as follows:
Since 2000, the transformation of agricultural production specialization, intensification, and greening in the YRD has gradually deepened, during which the FUI and PUI followed an inverted “U-shaped” trajectory, increasing initially and then declining continuously after reaching “inflection point” around 2010 to 2015. Counties (districts/cities) such as the Yangtze River city cluster, Shanghai, and southwestern Zhejiang were the first to reach “inflection point”, marking a shift from increasing to decreasing trends in FUI and PUI, while other areas experienced this transition at a relatively later stage. Nevertheless, the overall levels of FUI and PUI remained high across the region, reaching 478 kg/ha and 13 kg/ha, respectively, in 2020, nearly three and five times higher than the global averages. Although FUI and PUI alone cannot fully capture the green efficiency of agricultural production, they are still an indication of the high environmental and ecological risks of agricultural production in the YRD. Influenced by the development of multi-crop and highly intensive facility-based agriculture in peri-urban areas, municipal districts exhibit higher average FUI and PUI compared to surrounding counties (county-level cities), thereby facing greater challenges in advancing the transition toward agricultural green production.
In the past 10 years, the YRD has actively promoted the use of organic fertilizers, controlled-release fertilizers, and soil testing-based formula fertilization. As a result, FUI has gradually declined, and the number of counties (districts/cities) with high FUI levels exceeding 650 kg/ha has continuously decreased. However, the spatial pattern of “high in the north and low in the south, high in the plains and low in mountainous-hilly areas, and high in suburban areas and low in remote counties” has remained largely unchanged. FUI remains relatively high in the intensive grain and oil crop production areas of northeastern Anhui and northern Jiangsu plains; in contrast, the mountainous-hilly areas of southern Anhui and southwestern Zhejiang are small in scale in terms of grain and oil crops, and the consumption of chemical fertilizers is also relatively low. The agricultural transformation has been relatively rapid in regions such as southern Jiangsu along the Yangtze River and Shanghai, where fertilizer use has declined significantly and current FUI levels are relatively low. Similarly, although the adoption of green pest-control technologies in fruit, tea, and vegetable production has accelerated and PUI has generally declined, the PUI pattern has also remained stable, with “high in the south and low in the north, high in mountainous-hilly areas and low in the plains, and high in suburban areas and low in remote counties”. PUI remains relatively high in the characteristic agricultural zones for fruit, tea, and forestry in the mountainous-hilly areas of southern Anhui and southwestern Zhejiang, as well as in urban and facility-based agriculture clusters in peri-urban areas of southern Jiangsu and Shanghai. In contrast, PUI is relatively low in the major grain- and oil-production areas across the plains along the Yangtze River and the coastal regions of northern Anhui and northern Jiangsu.
The regionally adaptive development and utilization of land, water, and biological resources in agriculture, combined with the “spatial disturbance” introduced by proximity to urban markets, have shaped a specialized spatial division of labor in the YRD: grain and oil crop production predominates in the northern plains, urban and facility-based agriculture is concentrated in the central metropolitan areas, and characteristic agricultural such as fruit, tea, and forestry are concentrated in the southern mountainous-hilly regions. Meanwhile, the multiple cropping systems in facility-based agriculture; the intensive pest, weed, and disease control required for fruit, tea, and similar crops; and the concentrated application of synthetic fertilizers in grain and oil crop production have jointly produced the general spatial patterns of FUI being higher in the north and lower in the south, and PUI being lower in the north and higher in the south across the YRD. Although the dense urban agglomerations along the Yangtze River have taken the lead in greening agricultural production by virtue of their good economic foundation and capital investment capacity and by catering to the market demand for green and healthy agricultural products. The promotion of new technologies and the use of green production methods in these places have effectively reduced the intensity of the use of traditional chemical inputs and to a certain extent pushed the northward shift of the demarcation line of “high in the north and low in the south” in the application of fertilizers and the southward shift of “high in the south and low in the north” in the use of pesticides, but have not fundamentally changed the overall pattern of FUI and PUI in the YRD.
Fertilizers and pesticides are key inputs for the specialization and intensification in agriculture production. However, their relatively low utilization efficiency and high residue levels are among the primary causes of agricultural water and soil pollution as well as ecological degradation [46]. Upgrading fertilizer and pesticide application technologies, raising utilization efficiency, and reducing input losses are essential approaches to enhancing the efficiency of agricultural green production. Nevertheless, under certain levels of technology and specific soil and climatic conditions (excluding the potential effects of breakthroughs in crop breeding), the continued reduction in the intensity of fertilizer and pesticide application may compromise the long-term maintenance of soil nutrients and the effective control of pests, diseases, and weeds. This could subsequently limit the productive capacity of arable land and the ability to reduce crop losses, thereby affecting farmers’ incomes and production incentives ultimately posing a potential threat to local food security. Most counties (districts/cities) have already passed the “inflection point” on the inverted “U-shaped” curve of FUI and PUI and have been in a sustained decline phase for nearly a decade in the YRD, although whether this trend will continue or level off at a certain threshold remains to be further examined.

Author Contributions

Conceptualization, K.W. and C.C.; methodology, K.W. and C.C.; software, K.W. and C.C.; validation, C.C.; formal analysis, K.W. and C.C.; investigation, K.W. and C.C.; resources, K.W. and C.C.; data curation, K.W.; writing—original draft preparation, K.W.; writing—review and editing, K.W. and C.C.; visualization, K.W. and C.C.; supervision, C.C.; project administration, C.C.; funding acquisition, C.C. All authors have read and agreed to the published version of the manuscript.

Funding

This research was funded by the National Natural Science Foundation of China (Grant No. 42171211 & No. 42471247).

Data Availability Statement

The data supporting the findings of this study are available from the corresponding author upon request.

Acknowledgments

We are grateful to Jianglong Chen, Jinlong Gao, and Hui Cao for their valuable recommendations regarding the conceptualization, methodology, and discussions. We also extend our gratitude to the editor and anonymous referees for their constructive and inspiring comments being important for improving the manuscript.

Conflicts of Interest

The authors declare no conflicts of interest.

References

  1. Pingali, P.L. Green Revolution: Impacts, limits, and the path ahead. Proc. Natl. Acad. Sci. USA 2012, 109, 12302–12308. [Google Scholar] [CrossRef] [PubMed]
  2. Maaz, T.M.; Sapkota, T.B.; Eagle, A.J.; Kantar, M.B.; Bruulsema, T.W.; Majumdar, K. Meta-analysis of yield and nitrous oxide outcomes for nitrogen management in agriculture. Glob. Change Biol. 2021, 27, 2343–2360. [Google Scholar] [CrossRef]
  3. Tang, F.H.M.; Lenzen, M.; McBratney, A.; Maggi, F. Risk of pesticide pollution at the global scale. Nat. Geosci. 2021, 14, 206–210. [Google Scholar] [CrossRef]
  4. Liu, L.; Xu, W.; Lu, X.; Zhong, B.; Guo, Y.; Lu, X.; Zhao, Y.; He, W.; Wang, S.; Zhang, X.; et al. Exploring global changes in agricultural ammonia emissions and their contribution to nitrogen deposition since 1980. Proc. Natl. Acad. Sci. USA 2022, 119, e2121998119. [Google Scholar] [CrossRef]
  5. Wu, Y.; Xi, X.; Tang, X.; Luo, D.; Gu, B.; Lam, S.K.; Vitousek, P.M.; Chen, D. Policy distortions, farm size, and the overuse of agricultural chemicals in China. Proc. Natl. Acad. Sci. USA 2018, 115, 7010–7015. [Google Scholar] [CrossRef]
  6. Zhang, Y.; Long, H.; Li, Y.; Ge, D.; Tu, S. How does off-farm work affect chemical fertilizer application? Evidence from China’s mountainous and plain areas. Land Use Policy 2020, 99, 104848. [Google Scholar] [CrossRef]
  7. Cheng, P.; Tang, H.; Lin, F.; Kong, X. Bibliometrics of the nexus between food security and carbon emissions: Hotspots and trends. Environ. Sci. Pollut. Res. 2023, 30, 25981–25998. [Google Scholar] [CrossRef] [PubMed]
  8. Zhu, X.; Zhang, Y.; Zhu, Y.; Li, Y. The shift to plant-based dietary patterns in China would have significant effects on cultivated land resources. Sci. Bull. 2024, 69, 737–740. [Google Scholar] [CrossRef] [PubMed]
  9. Hu, S.; Wang, Y.; Liu, Y. Understanding organic agriculture based on coupled human-earth systems for sustainable land use and rural development in China. Land Use Policy 2025, 152, 107506. [Google Scholar] [CrossRef]
  10. Campos, B.C.; Qi, X. A literature review on the drivers and barriers of organic food consumption in China. Agric. Food Econ. 2024, 12, 18. [Google Scholar] [CrossRef]
  11. Jin, S.; Zhang, Z.; Hu, Y.; Du, Z. Historical logic, theoretical interpretation, and practical exploration of China’s agricultural green transformation. Issues Agric. Econ. 2024, 45, 4–19. (In Chinese) [Google Scholar] [CrossRef]
  12. Gao, J.; Peng, C.; Shi, Q. Study on the high chemical fertilizers consumption and fertilization behavior of small rural household in China: Discovery from 1995–2016 national fixed point survey data. J. Manag. World 2019, 35, 120–132. (In Chinese) [Google Scholar] [CrossRef]
  13. Zhao, X.; Liu, J.; Wang, R.; Wang, X. Spatial-temporal coupling relationship between chemical fertilizer application and grain yield in China at city scale. J. Nat. Resour. 2019, 34, 1471–1482. (In Chinese) [Google Scholar]
  14. Pan, X.; Li, P.; Feng, Z.; Duan, C. Spatial and temporal variations in fertilizer use across prefecture-level cities in China from 2000 to 2015. Environ. Sci. 2019, 40, 4733–4742. (In Chinese) [Google Scholar] [CrossRef]
  15. Zang, Y.; Hu, S.; Liu, Y. Rural transformation and its links to farmland use transition: Theoretical insights and empirical evidence from Jiangsu, China. Habitat Int. 2024, 149, 103094. [Google Scholar] [CrossRef]
  16. Xin, L.; Li, X.; Tan, M. Temporal and regional variations of China’s fertilizer consumption by crops during 1998–2008. J. Geogr. Sci. 2012, 22, 643–652. [Google Scholar] [CrossRef]
  17. Snapp, S.; Sapkota, T.B.; Chamberlin, J.; Cox, C.M.; Gameda, S.; Jat, M.L.; Marenya, P.; Mottaleb, K.A.; Negra, C.; Senthilkumar, K.; et al. Spatially differentiated nitrogen supply is key in a global food-fertilizer price crisis. Nat. Sustain. 2023, 6, 1268–1278. [Google Scholar] [CrossRef]
  18. Zhang, Z.; Yang, Z.; Zhou, J. Agricultural green development pilot zones: With a discussion on the relationship between chemical fertilizer reduction and food security. Chin. J. Agric. Resour. Reg. Plan. 2025, 1–17. Available online: http://kns.cnki.net/kcms/detail/11.3513.S.20250110.1341.022.html (accessed on 26 May 2025). (In Chinese).
  19. Pan, D.; Kong, F.; Zhang, N.; Ying, R. Knowledge training and the change of fertilizer use intensity: Evidence from wheat farmers in China. J. Environ. Manag. 2017, 197, 130–139. [Google Scholar] [CrossRef]
  20. Cao, A.; Guo, L.; Li, H. How does land renting-in affect chemical fertilizer use? The mediating role of land scale and land fragmentation. J. Clean. Prod. 2022, 379, 134791. [Google Scholar] [CrossRef]
  21. Fan, P.; Mishra, A.K.; Feng, S.; Su, M. The effect of agricultural subsidies on chemical fertilizer use: Evidence from a new policy in China. J. Environ. Manag. 2023, 344, 118423. [Google Scholar] [CrossRef] [PubMed]
  22. Bayramoglu, B.; Chakir, R. The impact of high crop prices on the use of agro-chemical inputs in France: A structural econometric analysis. Land Use Policy 2016, 55, 204–211. [Google Scholar] [CrossRef]
  23. Xin, L. Chemical fertilizer rate, use efficiency and reduction of cereal crops in China, 1998–2018. J. Geogr. Sci. 2022, 32, 65–78. [Google Scholar] [CrossRef]
  24. Zhang, Y.; Long, H.; Wang, M.Y.; Li, Y.; Ma, L.; Chen, K.; Zheng, Y.; Jiang, T. The hidden mechanism of chemical fertiliser overuse in rural China. Habitat Int. 2020, 102, 102210. [Google Scholar] [CrossRef]
  25. Chen, C.; Wu, K.; Chen, J. Evolution of agricultural green development in the Yangtze River Economic Belt based on the perspective of reducing chemical products input and increasing output. J. Nat. Resour. 2024, 39, 2399–2417. (In Chinese) [Google Scholar] [CrossRef]
  26. Tu, S.; Jian, D.; Long, H.; Li, T.; Zhang, Y. Evolution characteristics and mechanism of major crops production patterns in Guangxi. Acta Geogr. Sin. 2022, 77, 2322–2337. (In Chinese) [Google Scholar]
  27. Jin, T. The adjustment of China’s grain cropping structure and its effect on the consumption of water and land resources. J. Nat. Resour. 2019, 34, 14–25. (In Chinese) [Google Scholar] [CrossRef]
  28. Zhang, Y.; Long, H.; Li, Y.; Ma, L. Classification of the coupling patterns between agricultural production system transition and their environmental effects in the plain farming regions. Geogr. Res. 2022, 41, 1623–1636. [Google Scholar]
  29. Song, X.; Wang, X.; Li, X.; Zhang, W.; Scheffran, J. Policy-oriented versus market-induced: Factors influencing crop diversity across China. Ecol. Econ. 2021, 190, 107184. [Google Scholar] [CrossRef]
  30. Hu, X.; Li, H.; Zhang, X.; Yuan, Y.; Jia, K. How rent facilitates capital accumulation: A case study of rural land capitalization in Suzhou, China. Land Use Policy 2024, 139, 107063. [Google Scholar] [CrossRef]
  31. Yuan, Y.; Wang, Y.; Xu, P. Cultivated land use control from the perspective of “non-grain” governance: Response logic and framework construction. J. Nat. Resour. 2024, 39, 942–959. [Google Scholar] [CrossRef]
  32. Wang, X.; Song, X.; Wang, Y.; Xu, H.; Ma, Z. Understanding the distribution patterns and underlying mechanisms of non-grain use of cultivated land in rural China. J. Rural. Stud. 2024, 106, 103223. [Google Scholar] [CrossRef]
  33. Zhang, F.; Cui, Z.; Chen, X.; Ju, X.; Shen, J.; Chen, Q.; Liu, X.; Zhang, W.; Mi, G.; Fan, M.; et al. Integrated nutrient management for food security and environmental quality in China. Adv. Agron. 2012, 116, 1–40. [Google Scholar]
  34. Chen, X.-p.; Cui, Z.; Fan, M.; Vitousek, P.M.; Zhao, M.; Ma, W.; Wang, Z.-l.; Zhang, W.; Yan, X.; Yang, J.; et al. Producing more grain with lower environmental costs. Nature 2014, 514, 486–489. [Google Scholar] [CrossRef]
  35. Yi, J.; Gerbens-Leenes, P.W.; Aldaya, M.M. Spatial and temporal grey water footprints of agricultural pesticide use: Improved pesticide use options to decrease water pollution in China. Energy Nexus 2024, 16, 100349. [Google Scholar] [CrossRef]
  36. Zhang, C.; Hu, R.; Shi, G.; Jin, Y.; Robson, M.G.; Huang, X. Overuse or underuse? An observation of pesticide use in China. Sci. Total Environ. 2015, 538, 1–6. [Google Scholar] [CrossRef]
  37. Caulfield, M.; Bouniol, J.; Fonte, S.J.; Kessler, A. How rural out-migrations drive changes to farm and land management: A case study from the rural Andes. Land Use Policy 2019, 81, 594–603. [Google Scholar] [CrossRef]
  38. Seufert, V.; Ramankutty, N.; Foley, J.A. Comparing the yields of organic and conventional agriculture. Nature 2012, 485, 229–232. [Google Scholar] [CrossRef]
  39. Qiu, T.; Choy, S.T.B.; Li, S.; He, Q.; Luo, B. Does land renting-in reduce grain production? Evidence from rural China. Land Use Policy 2020, 90, 104311. [Google Scholar] [CrossRef]
  40. Zhang, J.; Mishra, A.K.; Hirsch, S. Market-oriented agriculture and farm performance: Evidence from rural China. Food Policy 2021, 100, 102023. [Google Scholar] [CrossRef]
  41. Chen, C.; Gao, J.; Cao, H.; Chen, W. Unpacking the agricultural innovation and diffusion for modernizing the smallholders in rural China: From the perspective of agricultural innovation system and its governance. J. Rural. Stud. 2024, 110, 103385. [Google Scholar] [CrossRef]
  42. Xu, D.; Deng, X.; Huang, K.; Liu, Y.; Yong, Z.; Liu, S. Relationships between labor migration and cropland abandonment in rural China from the perspective of village types. Land Use Policy 2019, 88, 104164. [Google Scholar] [CrossRef]
  43. Tu, Y.; Wu, S.; Chen, B.; Weng, Q.; Bai, Y.; Yang, J.; Yu, L.; Xu, B. A 30 m annual cropland dataset of China from 1986 to 2021. Earth Syst. Sci. Data 2024, 16, 2297–2316. [Google Scholar] [CrossRef]
  44. Zhang, Y.; Long, H.; Ma, L.; Ge, D.; Tu, S.; Qu, Y. Farmland function evolution in the Huang-Huai-Hai Plain: Processes, patterns and mechanisms. J. Geogr. Sci. 2018, 28, 759–777. [Google Scholar] [CrossRef]
  45. Zhang, F. Scientific understanding of the role of fertilizers. China Agric. Technol. Ext. 2017, 33, 16–19. (In Chinese) [Google Scholar]
  46. Yang, J.; Lin, Y. Driving factors of total-factor substitution efficiency of chemical fertilizer input and related environmental regulation policy: A case study of Zhejiang Province. Environ. Pollut. 2020, 263, 114541. [Google Scholar] [CrossRef]
Figure 1. Theoretical framework for the spatiotemporal differentiation and mechanisms of fertilizer and pesticide use.
Land 14 01180 g001
Figure 2. Schematic diagram of study area. (a) Location of the YRD in China. (b) Elevation map of the YRD. (c) Administrative zoning map of the YRD.
Land 14 01180 g002
Figure 3. Schematic diagram of changes in agrochemical usage and usage intensity from 2001 to 2020.
Land 14 01180 g003
Figure 4. Spatial patterns of FUI and PUI in each year in the YRD. ((ae) represents FUI, (fj) represents PUI).
Land 14 01180 g004
Figure 5. Schematic diagram of changes in FUI from 2001 to 2020 (Solid lines represent district and dashed lines represent county; legend omitted due to the large number of units).
Land 14 01180 g005
Figure 6. Schematic diagram of changes in PUI from 2001 to 2020. (Solid lines represent district and dashed lines represent county; legend omitted due to the large number of units).
Land 14 01180 g006
Figure 7. The spatial distribution of the changing rates in FUI and PUI in each year in the YRD ((ae) represents FUI, (fj) represents PUI).
Land 14 01180 g007
Table 1. Descriptive statistics and summary of the variables.
VariableCodeCalculation MethodUnitsNMeanSDMinMax
Fertilizer usage intensityFUIEquation (1)kg/ha3780482.80205.6834.991289.96
Pesticide usage intensityPUIEquation (2)kg/ha342018.6012.381.60136.69
ElevationDEMAverage annual elevation by regionm3780135.28179.401.43871.03
PrecipitationPREAverage annual precipitation by regionmm37801205.86355.72515.772469.43
Crop typeCTGrain sowing area/total crop sowing area%378058.0817.9215.6197.73
Multiple cropping indexMCICrop sown area/total
farmland area
-37801.490.290.232.71
Economy development levelEDLGross regional product/
total population at the end
of a year
10,000 yuan/person37802.792.220.1915.09
Fiscal expenditure levelFELFiscal expenditure/total population at the end
of a year
10,000 yuan/person37800.360.310.022.69
Agricultural mechanization levelAMLTotal power of agricultural machinery/total farmland areakw/ha37808.454.181.5434.93
Population densityPDTotal population at the end
of a year/administrative area
10,000 persons/ha37805.984.500.5538.23
Table 2. Data sources.
DataSources
Fertilizer use, pesticide use, crop sown area, crop yield and socio-economic statistics dataThe FAO database (https://www.fao.org/faostat/en/#data, accessed on 6 September 2024), statistical yearbooks of provinces (municipality), and their subordinate prefecture-level cities
Population dataThe fifth to seventh China Population Census data, statistical yearbooks of provinces (municipality)
Cultivated land dataStatistical yearbooks, land change survey data, and published papers (CACD) [43]
Digital elevation model (DEM) dataNASA DEM global 30 m resolution DEM data (https://www.earthdata.nasa.gov, accessed on 1 May 2024)
Precipitation dataNational Earth System Science Data Center (http://www.geodata.cn, accessed on 28 October 2024)
Administrative divisions dataStandard Map Service System of the Ministry of Natural Resources (http://bzdt.ch.mnr.gov.cn/, accessed on 1 September 2024)
Table 3. Results of the multicollinearity test.
VariablesDEMPRECTMCIEDLFELAMLPD
VIF2.772.291.711.133.052.551.171.82
1/VIF0.3610.4370.5830.8860.3280.3920.8540.549
Table 4. Benchmark regression results.
FUI (1–3)PUI (4–6)
M1M2M3M4M5M6
DEM−0.135 ***−0.119 ***−0.058 **−0.011 ***−0.011 ***−0.009 ***
(−5.2967)(−4.6424)(−2.1749)(−6.3143)(−6.0780)(−5.0073)
PRE−0.188 ***−0.193 ***−0.192 ***0.006 ***0.006 ***0.006 ***
(−14.1022)(−14.5142)(−14.4847)(6.1201)(5.9634)(5.8905)
CT0.550 ***0.839 ***0.986 ***−0.179 ***−0.170 ***−0.171 ***
(2.6178)(3.9126)(4.5945)(−12.3858)(−11.5348)(−11.5738)
MCI192.959 ***187.806 ***172.822 ***12.694 ***12.523 ***11.398 ***
(19.1571)(18.6661)(16.9533)(18.3784)(18.0967)(16.2687)
EDL−5.405 ***18.846 ***9.938 **0.615 ***1.469 ***0.989 ***
(−2.7084)(4.2085)(2.1642)(4.5631)(4.8042)(3.1418)
EDL2 −2.334 ***−2.062 *** −0.082 ***−0.048 *
(−6.0427)(−5.3158) (−3.1113)(−1.8142)
FEL−1.684−1.8824.331−5.776 ***−5.804 ***−4.637 ***
(−0.0946)(−0.1062)(0.2433)(−4.7363)(−4.7650)(−3.8013)
AML 2.817 *** 0.421 ***
(3.7268) (7.9636)
PD 4.901 *** 0.034
(5.7409) (0.5232)
_cons423.889 ***380.648 ***350.940 ***5.301 **3.839 *2.163
(14.1307)(12.3980)(11.4262)(2.5387)(1.7961)(1.0024)
N378037803780342034203420
Year controlYesYesYesYesYesYes
Reg controlYesYesYesYesYesYes
R20.3110.3180.3280.1570.1590.175
Note: t statistics in parentheses, * p < 0.1, ** p < 0.05, *** p < 0.01.
Table 5. Robustness test results.
FUI (7–9)PUI (10–12)
M7M8M9M10M11M12
DEM−0.151 ***−0.131 ***−0.056 *−0.012 ***−0.012 ***−0.011 ***
(−5.2960)(−4.5876)(−1.8614)(−6.2195)(−5.8880)(−5.0222)
PRE−0.189 ***−0.195 ***−0.195 ***0.006 ***0.006 ***0.005 ***
(−12.8071)(−13.2610)(−13.3361)(5.5479)(5.3483)(5.0177)
CT0.559 **0.921 ***1.035 ***−0.198 ***−0.183 ***−0.185 ***
(2.2596)(3.6298)(4.0974)(−11.4366)(−10.3308)(−10.5391)
MCI183.116 ***178.339 ***162.391 ***13.754 ***13.570 ***12.471 ***
(15.8975)(15.5275)(13.9719)(17.0920)(16.8690)(15.3268)
EDL−6.663 **22.595 ***10.346 *0.914 ***2.209 ***1.595 ***
(−2.4578)(3.9612)(1.7504)(4.8829)(5.5338)(3.8404)
EDL2 −3.291 ***−2.860 *** −0.144 ***−0.090 **
(−5.8205)(−5.0268) (−3.6698)(−2.2908)
FEL17.02817.63715.137−7.416 ***−7.490 ***−5.816 ***
(0.6212)(0.6469)(0.5531)(−3.8722)(−3.9194)(−3.0380)
AML 1.840 ** 0.472 ***
(2.1599) (7.8479)
PD 6.391 *** −0.025
(6.2253) (−0.3160)
_cons439.095 ***391.183 ***371.366 ***4.936 **2.8631.733
(13.1070)(11.3979)(10.8746)(2.0844)(1.1787)(0.7128)
N302430243024273627362736
Year controlYesYesYesYesYesYes
Reg controlYesYesYesYesYesYes
R2_a0.2870.2950.3060.1720.1760.194
Note: t statistics in parentheses, * p < 0.1, ** p < 0.05, *** p < 0.01.
Table 6. The test results of heterogeneity in FUI.
Municipal DistrictsPlains CountiesMountainous-Hilly Counties
M13M14M15M16M17M18
DEM−0.365 ***−0.379 ***−2.487 ***−2.459 ***0.114 ***0.118 ***
(−3.4791)(−3.5747)(−8.7952)(−8.8073)(3.6114)(3.7223)
PRE−0.071 **−0.066 *−0.301 ***−0.303 ***−0.043 *−0.046 *
(−2.1112)(−1.9401)(−14.6070)(−14.8118)(−1.7233)(−1.8348)
CT2.902 ***2.392 ***−2.138 ***−2.099 ***2.152 ***2.237 ***
(4.8733)(4.0402)(−6.6316)(−6.6332)(5.5542)(5.8244)
MCI274.204 ***293.361 ***113.722 ***112.779 ***68.626 ***66.252 ***
(11.5945)(12.4498)(6.7179)(6.6892)(4.4266)(4.2903)
EDL49.639 ***−1.227−38.865 ***−35.716 ***−6.36113.108 ***
(3.9687)(−0.2179)(−5.6273)(−7.4584)(−0.4858)(2.7254)
EDL2−5.268 *** 0.289 2.787
(−4.5397) (0.6329) (1.5986)
FEL41.38717.629245.710 ***243.695 ***−105.720 ***−113.101 ***
(1.2880)(0.5491)(3.9176)(3.8912)(−4.6195)(−5.0422)
AML7.245 ***8.140 ***5.019 ***4.882 ***1.1490.829
(3.6344)(4.0519)(4.7544)(4.7259)(0.8174)(0.5957)
PD−3.394 **−3.503 ***1.9472.1618.235 ***7.853 ***
(−2.5419)(−2.5908)(0.9530)(1.0733)(4.1677)(4.0010)
_cons−20.33264.068832.644 ***828.366 ***189.344 ***173.736 ***
(−0.2776)(0.8931)(15.7079)(15.7584)(3.8395)(3.5917)
N8008001820182011601160
Year controlYesYesYesYesYesYes
Reg controlYesYesYesYesYesYes
R2_a0.3830.3670.2900.2900.1350.134
Note: t statistics in parentheses, * p < 0.1, ** p < 0.05, *** p < 0.01.
Table 7. The test results of heterogeneity in PUI.
Municipal DistrictsPlains CountiesMountainous-Hilly Counties
M19M20M21M22M23M24
DEM0.017 ***0.017 ***0.073 ***0.075 ***−0.017 ***−0.018 ***
(3.5763)(3.5838)(2.9571)(3.0906)(−6.7402)(−6.8362)
PRE0.015 ***0.015 ***−0.002−0.0020.009 ***0.010 ***
(9.9537)(9.9801)(−1.4508)(−1.5412)(4.3022)(4.4810)
CT0.045 *0.029−0.172 ***−0.169 ***−0.113 ***−0.120 ***
(1.7109)(1.1099)(−6.7718)(−6.7441)(−3.6095)(−3.8500)
MCI9.585 ***10.210 ***14.323 ***14.232 ***8.016 ***8.233 ***
(9.2560)(9.9027)(10.3562)(10.3404)(6.3585)(6.5667)
EDL2.121 ***0.3070.6590.927 **2.628 **1.069 **
(3.8689)(1.2109)(1.1755)(2.3286)(2.4081)(2.5461)
EDL2−0.188 *** 0.025 −0.221
(−3.7227) (0.6790) (−1.5473)
FEL2.661 *1.741−10.311 **−10.486 **−2.312−1.694
(1.9088)(1.2579)(−1.9808)(−2.0173)(−1.2168)(−0.9110)
AML1.340 ***1.389 ***0.1150.1010.341 ***0.367 ***
(13.3520)(13.8385)(1.3604)(1.2329)(2.9424)(3.1992)
PD0.283 ***0.289 ***0.0590.0820.986 ***1.027 ***
(4.3287)(4.3747)(0.3463)(0.4940)(4.2295)(4.4284)
_cons−34.254 ***−31.572 ***7.321 *7.027 *−3.316−2.340
(−10.5389)(−9.8728)(1.7324)(1.6719)(−0.7889)(−0.5627)
N7407401680168010001000
Year controlYesYesYesYesYesYes
Reg controlYesYesYesYesYesYes
R2_a0.5030.4940.1290.1290.2500.249
Note: t statistics in parentheses, * p < 0.1, ** p < 0.05, *** p < 0.01.
Disclaimer/Publisher’s Note: The statements, opinions and data contained in all publications are solely those of the individual author(s) and contributor(s) and not of MDPI and/or the editor(s). MDPI and/or the editor(s) disclaim responsibility for any injury to people or property resulting from any ideas, methods, instructions or products referred to in the content.

